the sustainability and outreach performance of …
TRANSCRIPT

49
THE SUSTAINABILITY AND OUTREACH PERFORMANCE OF ETHIOPIAN MICROFINANCE INSTITUTIONS: DOES
SCALE OF OUTREACH MATTER?
Letenah Ejigu1
Abstract
This study analyzes sustainability and outreach performance of Ethiopian MFIs using scale of outreach as a classification variable. Performance is compared against local and international benchmarks and across time. Secondary data of 13 MFIs collected for 6 years (2003-2008) is used for analysis. The result reveals scale of outreach matters when performance is compared against local benchmarks. It further indicates the presence of commercial and social oriented MFI clusters. Comparison with international benchmarks shows mixed evidence across scale of outreach, but the whole industry is weak in terms of depth of outreach. The trend analysis indicates the industry suffers from lack of clear women targeting policy and erratic profitability as measured by ROA.
Key terms: Microfinance, Sustainability, Outreach JEL Code: G21
1 PhD, Postgraduate Research and Community Service Coordinator, College of Business & Economics, Bahir Dar University; P.O. Box 79, Bahir Dar Ethiopia E-mail:[email protected], Cell-phone: +251 918 761517

Letenah Ejigu: The sustainability and outreach performance of Ethiopian…
50
1. Introduction Microfinance is defined as financial services targeted to low income clients (Ledgerwood, 1999). It includes saving, credit, micro insurance, payment service & money transfer. Although the industry has a long history, the practice of formal microfinance can be traced back prior to the works of the Grameen Bank in Bangladesh (Christen, 1997). Over the years, microfinance has registered impressive growth on product offerings, repayment rate, financial sustainability and loan portfolio (Ledgerwood, 1999; Woller and Schreiner, 2006). MFIs are developed in response to big market failures in the financial systems of many countries. Such market failures are created due to the reluctance of traditional banks to lend to the poor for various reasons (Aghion & Morduch, 2005). First, disbursing small loans to a large number of borrowers is a costly business proposition. Second, lending to the poor is risky due to information asymmetry. Poor people have no physical collateral in the event of default and getting information on their credit history is difficult. Third, the poor lack skills to use borrowed money productively. MFIs have circumvented all these assumptions and attained a huge success (e.g. they secured high repayment rates). They did so by using innovative group lending methods, accessing subsidy from donors and providing to the poor non-financial services like training and assistance in marketing. With respect to its setup, microfinance is a hybrid organization that combines traditional banking with the social goal of poverty reduction at the grass roots level. Like banks, it aspires to live using its own means by following a commercial approach of doing business. Such a goal is associated with the concept of sustainability2. On the other hand the social goal of poverty reduction calls for making services available to many poor clients at affordable rates, despite high transaction costs of doing such business. This issue is associated with the concept of outreach3. The hybrid nature of
2Sustainability is conceived as “full cost recovery or profit making and the building of microfinance institutions that can last into the future without continued reliance on government subsidies or donor funds.” (Conning, 1999, p.52) 3Outreach refers to “the efforts by microfinance organizations to extend loans and financial services to an ever wider audience (breadth of outreach) and especially toward the poorest of the poor (depth of outreach).” (Conning, 1999, p.52). There are other broader conceptualization of outreach. For example Schreiner (1999) classified outreach in to six dimensions: worth to clients, cost to clients, depth, breadth, length and scope. But such broad approaches are not pursued due to data limitations and unclear operationalizations.
Ethiopian Journal of Economics, Volume XXI, No 1, April 2012
51
such organizations urges them to use innovative methods of fighting poverty. This attracts the attention of many stakeholders like academicians, policy makers and practitioners. Despite the huge success of the industry as a whole4, the twin goals of sustainability and outreach are not yet met. For instance, many MFIs are not financially sustainable, with 41% seeking donor support to keep afloat (Mersland & Storm, 2010). MFIs reach only 3% of the world’s 500 million poor lacking access to financial services, indicating less breadth of outreach (Marzys, 2006). On the depth of outreach, studies indicate that MFIs fail to reach the poorest of the poor (Hashemi & Rosenberg, 2006) and do not have clear targeting rules (Hishigsuren, 2004). The microfinance model itself is increasingly questioned. Some authorities on the subject say reaching the poorest clients and being financially self-sufficient are competing objectives (Mersland & Storm, 2007; Okumu, 2007) whereas others like Schreiner, (1999), Christen, (1997) and Cull, DemigÄuc-Kunt, & Morduch (2007) are of the view that such contradictions do not exist. Various studies have explored sustainability and outreach of MFIs in Ethiopia and documented weak performance of the sector (Pfister et al, 2008; Kereta, 2007; Kidane, 2007, Amha, 2007, Ejigu, 2009). They reach around 6% of the poor, only 38.4% of targeted women and depend on subsidies. Most of these studies, with the exception of Ejigu (2009), did not apply rigorous statistical analysis. Ejigu’s study, however, uses one year (2007) data to classify MFIs across different scales of outreach5, which could not capture the dynamics within the sector. This study, using data from 13 MFIs collected over 6 years (2003-2008), tries to address such gaps in a more rigorous way. The sustainability and outreach performance of MFIs is compared with global benchmarks of Microfinance Information eXchange (MIX)6 and local benchmarks (i.e. across the different scales of outreach). Using graphs, the trend of such performance is also depicted for the industry as a whole.
4Muhammad Yunus and the Grameen Bank are awarded the Nobel Peace Prize in 2006 “for their efforts to create economic and social development from below.” (Sengupta & Aubuchon, 2008). 5Scale of outreach is measured by Gross Loan Portfolio (GLP) of MFIs. GLP itself is a product of the two measures of outreach, number of borrowers (measuring breadth of outreach) and average loan size (measuring depth of outreach). 6MIX is a non-profit initiative dedicated to the dissemination of quality MFIs data globally. See www.mixmarket.org
Letenah Ejigu: The sustainability and outreach performance of Ethiopian…
52
The findings of this paper are important to MFIs management and regulatory bodies such as the National Bank of Ethiopia. Comparison with MIX averages enables to know lessons to be learned from abroad. Comparing MFIs locally helps benchmarking among the MFIs themselves, instituting policy changes on entry barriers and facilitators, and changing the regulatory frameworks for MFIs with different missions. The trend analysis helps to check up whether MFIs are moving in line with their missions. The paper also informs future researchers on a scientific way of conducting studies of performance analyses. The rest of the paper is organized as follows. Section two reviews the existing literature on performance measurement in the context of microfinance and some empirical studies conducted in this area. Data and methodology issues are discussed in section three. Section four discusses results of the study and section five presents concluding remarks.
2. Review of Literature 2.1 The Development of Performance Measures in Microfinance
Institutions When MFIs were initially constituted, they were having a mission of reaching many poor households offering them low interest rates (Bateman, 2010). Low interest rates were favored because it was presumed that the cost of credit is a significant bottleneck for the poor to access credit and cheap credit, by liberating the poor from exorbitant money lenders interest rates, helps them overcome poverty. To make credit cheap, MFIs were heavily subsidized by governments & donors. This lending approach is called ‘welfarist’ since microcredit is designed as part of an integrated program of poverty alleviation and welfare improvement. Starting in the 1990s, rural finance experts from Ohio State University began criticizing the ‘welfarist’ approach claiming that subsidized credit based on faulty conceptions leads to worst practices of high unpaid rates and transaction costs resulting in the failure of many microcredit programs (Congo, 2002). This leads to another paradigm in the development of microfinance. Considered as the ‘institutionalist’ approach, it seeks to establish institutions which can offer saving and credit services on sustainable and commercial basis and free from subsidy. To achieve this, the MFIs charge high interest rates due to high costs of doing business (Gurgand, Pederson, & Yaron, 1996).

Ethiopian Journal of Economics, Volume XXI, No 1, April 2012
53
The debate between ‘welfarists’ and ‘institutionalists’ is termed as the ‘microfinance schism’ and there seems little agreement between the two schools of thought regarding the goal of MFIs and how to achieve it. The disagreement between the two schools also leads to the use of various metrics to measure the performance of MFIs. ‘Welfarists’ are interested on demand or client side outcome and focus on the impact of MFIs on the lives of the poor and outreach to the poor. ‘Institutionalists’, on the other hand, focus on the supply side issue of building sustainable institutions which are free from subsidy. They are interested in tracking repayment rate, transaction cost and financial self reliance (Congo, 2002). Nevertheless, there is no unanimous agreement among stakeholders until now on the metrics used to gauge the performance of MFIs. Many authorities use sustainability and outreach (Gurgand et al.1996) and this paper follows the same approach.
2.2 Empirical Evidence on the Sustainability and Outreach Performance of MFIs
Several studies on sustainability and outreach performance of MFIs have been conducted at global, regional as well as country levels. At global level, Cull et al (2007) found that the microfinance industry is financially and operationally sustainable with FSS, 1.03 and OSS, 1.16, but ROA7 still negative, -0.027. Depth of outreach seems somewhat good with average loan size per GNI per capita of 67.6% and percentage of targeted women borrowers served accounting for 64.9%. Mersland and Storm (2007) also confirm the sustainable but low ROA of the global microfinance industry. This indicates that due to the social goal of poverty reduction, MFIs are not very much profitable like banking or any other commercial businesses. They also found average number of borrowers served as 12,805. The figure is low and indicates a huge financial exclusion of the poor. The regional studies show mixed results. Lafourcade et al., (2005) found that African MFIs are lagging behind other parts of the world in terms of both sustainability and outreach. Hartarska’s (2005)study in Central and Eastern European (CEE) region showed MFIs to be profitable with ROA, 3.04% but serve few borrowers,7268.
7FSS, OSS and ROA are commonly used measures of sustainability and see the methodology section later to know what they stand for.

Letenah Ejigu: The sustainability and outreach performance of Ethiopian…
54
On country-level studies, Okumu (2007) based on Ugandan MFIs showed that MFIs are operationally self sustainable with OSS, 1.21; the breadth of outreach is small, 6729 borrowers being served; their depth of outreach is small with average loan size per GNI per capita being 1.43. Congo (2002) examines Burkina Faso MFIs and obtained lower sustainability and outreach performance. Studies on sustainability and outreach performances of MFIs in Ethiopia also revealed mixed results. For instance, Kereta (2007) shows that the industry has registered a high growth rate of 22.9% in terms of borrowers over the period 2003-2007; depth of outreach is small with the percentage of women borrowers reached standing at 38.4%; financial sustainability is improving although still donor dependent. The author also documented no clear tradeoff between sustainability and depth of outreach. Kidane (2007), examined Amhara Credit & Saving Institution (ACSI), one of the largest MFIs in Ethiopia, and found that it has served more than half a million clients; it is operationally and financially self sufficient with 119.9% and 115.3%, respectively. Pfister et al (2008) documented that Ethiopian MFIs have limited outreach, reaching almost two million clients only in a country of 77 million people although dependent on government and mother NGOs, indicating weak financial sustainability. Ejigu (2009) showed that Ethiopian MFIs have less depth of outreach, extend large loan sizes and the number of women clients reached is low. They have good breadth of outreach as a large number of borrowers are reached. Their profitability seems to depend on their scale of outreach, i.e. the larger MFIs being more sustainable than the small ones. There is also a tradeoff between serving the poorest borrowers and being financially sustainable. Almost no studies have conducted performance analysis by comparing with benchmarks like MIX or local averages using proper statistical tools. This paper building on the work of Ejigu (2009), tries to address the empirical research gaps.
3. Data and Methodology 3.1 Data As of 2010, there are 30 MFIs in Ethiopia registered and licensed by the National Bank of Ethiopia (NBE). For sustainability and outreach performance indicators, however, adequate time series data is not available from many of the MFIs. Only from 13 MFIs which have a six year data (from 2003-2008), 78 MFI-year observations are used as a sample for the study. All the data is taken from the MIX database. For conformity with the study period of 2003-2008, benchmark figures from the MIX are taken for the years 2004-2008 as data available for 2003.
Ethiopian Journal of Economics, Volume XXI, No 1, April 2012
55
The data collected is rather unbalanced because while many mature MFIs reported the full six year data, a few new MFIs have only a two year data. But the average number of years for the whole sample is around 5.3, making it a reasonably balanced data with less missing observations. The final data used for analysis, after ignoring missing values, is 53 MFI-year observations with the average number of years per MFI being 5.3 while the number of MFIs is 10.
3.2 Methodology At the outset, MFIs are classified based on scale of outreach as the sample shows a huge variation on such variable as opposed to other metrics. According to MIX (2008) MFIs outside the Latin American and Caribbean region, to which Ethiopia is a part, are classified as follows. Small MFIs are those below $2 million Gross Loan Portfolio (GLP), medium MFIs are those having a GLP between$2 and $8 million and large MFIs are those with a GLP of above $8 million. The average GLP figure over the sample period of 2003-2008 is used for classification purpose and this is different from Ejigu (2009) who used only a single year (2007). Using average rather than single year GLP helps to capture the dynamics in the industry. Three different approaches are used to fulfill the objective of the study. One sample tests are used to check the presence of any significant difference between the performances of MFIs with the MIX benchmark. For local comparison, ANOVA (simple or robust)8 and Kruskal Wallistest9, as appropriate, with post hoc tests (Scheffe or Games-Howell)10 are used. Lastly, graphs in level and growth forms are used for trend analysis. Measures There are many measures of sustainability. These include Subsidy Dependence Index (SDI), self sufficiency measures, adjusted profitability ratios, arrears rate and efficiency and productivity. But from these the paper used self sufficiency measures of OSS and
8One sample t test and ANOVA are parametric test of difference used when the critical assumptions of normality and homogeneity of variance are fulfilled. If such assumptions don’t hold, it is better to transform the data, use tests that are robust to the violation of such assumptions (e.g. robust ANOVA) or resort to non-parametric tests that don’t require the fulfillment of these assumptions (Field, 2005). 9Kruskal-Wallis test is a non-parametric test used when the ANOVA can’t be implemented. 10Scheffe post-hoc test is used if the homogeneity of variance assumption is fulfilled whereas the Games-Howell procedure is used in cased whereas such assumption is violated.

Letenah Ejigu: The sustainability and outreach performance of Ethiopian…
56
adjusted profitability measure of ROA as they are heavily used in prior literature (Barres, 2006). Financial Self Sufficiency (FSS) is another widely used measure, but such data is not available from MIX database.11 For breadth of outreach, the number of borrowers is used as a measure. For depth of outreach two measures are used: average loan size (measured as the ratio of GLP to number of borrowers) and the percentage of women borrowers (measured as the ratio of women borrowers to total borrowers). Less average loan size and more percentage of women borrowers served as an indicator of good depth of outreach. Disbursing small loans is perceived as reaching the poorest as this group of people, due to their small business activity, are interested in small loans. For international comparison, average loan size adjusted for Gross National Income (GNI) per capita is used. The measure of average loan size is subject to criticism. For instance, Christen (1997) argues that due to the heterogeneity of loan products in terms of maturity and purpose, its uses can be misleading. Thus, it may not reflect the target market and the clients’ poverty level. Brau & Woller (2004) argue that women are preferred in the business of microfinance due to three reasons. Firstly, women invest the loans in productive activities or in improving family welfare more often than men, who are assumed to consume rather than invest loan funds. Secondly, access to financial services empowers women, both financially and socially. Thirdly, women are considered poorer than men. The often expressed fear in lending to women is that they bring about less economic growth than men. However, a study by Kevane and Wydick (2001), cited in Brau & Woller, (2004) reveals that there is no significant difference between men and women in generating business sales. Finally, it has to be underscored that all the measures used are consistent with prior literature such as Cull et al, (2007), Mersland & Storm, (2007), Okumu, (2007).
11OSS is calculated as [(financial revenue)/ (financial expense + net loan loss provision + operating expense)]. ROA is measured as the ratio of adjusted net operating income net of taxes divided by adjusted average total assets. OSS is not adjusted for subsidy whereas FSS and ROA are adjusted for subsidy. (Ledgerwood, 1999).
Ethiopian Journal of Economics, Volume XXI, No 1, April 2012
57
3.3 Descriptive Statistics Table 1 presents descriptive statistics and mean growth rate of sustainability and outreach indicators for the industry as a whole. The industry served an average of 123,034 borrowers which is considered as a fairly good outreach. The coefficient of variation figure is very high indicating a huge difference between the MFIs in terms of number of borrowers reached. The industry also registered the highest growth rate of 22.24% in number of borrowers which is expected from a young industry. The average loan size is $128 (equivalent to Br. 2048 assuming an average exchange rate of Br 16 to the dollar over the six year period of 2003-2008). Half of the MFIs clients are women. This is poor performance as MFIs are presumed to target mostly women. The coefficient of variation of the percentage of women borrowers is low indicating similar women targeting policy between MFIs. The industry is operationally self-sustainable (OSS, 1.3) whereas ROA is low (1%) indicating that it is not profitable like mainstream banks and other commercial businesses. The high coefficient of variation of ROA also indicates a huge difference between the various MFIs profitability rates. The descriptive statistics results indicate at a glance that the MFIs are better in sustainability than in outreach. This is consistent with the empirical findings reported earlier and the overall commercialization trend observed in the global microfinance industry.
4. Results 4.1 Correlation Results The correlation coefficients between sustainability and outreach indicators are depicted in Table 2. The results show that as MFIs serve a large number of borrowers, they ignore the poorest of the poor. As average loan size increases the percentage of women borrowers served decreases. As expected, serving more borrowers leads to achieve sustainability due to economies of scale. Sustainability and depth of outreach are found to be negatively related, i.e. the former has positive relationships with average loan size and negative relationships with the percentage of women borrowers served. All these results indicate there is a tradeoff between serving the poorest and being financially self-sufficient. Consistent with Ejigu (2009), Mersland and Storm (2007) and Okumu (2007), reaffirm the fear of ‘welfarist’ approach that the commercialization of microfinance will bring death to the industry’s original mission of serving the poorest of the poor.

Letenah Ejigu: The sustainability and outreach performance of Ethiopian…
58
Surprisingly the two measures of depth of outreach, average loan size and the percentage of women borrowers are not significantly negatively correlated. This partially reaffirms Christen’s (1997) fears that the use of average loan size as depth of outreach measure may be misleading due to the heterogeneity of loan products in terms of maturity and purpose. Hence more studies are called for using clear theoretical frameworks. As expected, the two measures of sustainability (OSS and ROA) are positively related implying they are measures of the same construct. In sum, scale of outreach seems to matter as the large MFIs are better in breadth of outreach and sustainability and the small MFIs in depth of outreach indicators. Two big clusters are observed from the analysis. Small MFIs have a social mission of reaching the poorest of the poor, but they are unsustainable whereas the large MFIs have a commercial mission of reaching large number of possibly marginally poor borrowers in a sustainable way. A natural question to ask is which MFI should be chosen? This depends on the ethical school of thought one subscribes to and an assessment of the country’s economic conditions and poverty level. Using utilitarian theory of benefits to the mass, the large MFIs are preferred whereas if one believes in moral relativism, the small MFIs may be chosen12. Scanning the Ethiopian economy roughly indicates that it is a country of a large number of marginally poor people and the poorest are judged to be small. Using such line of reasoning, opting for the large MFIs makes more sense. a. Comparison with MIX Benchmarks Table 3 presents the one sample test results that compare the sustainability and outreach13 performance of each category of MFIs with their respective MIX benchmarks. The result indicates that small MFIs are not good in either sustainability or depth of outreach compared to MIX. They are only good in breadth of outreach. Medium MFIs are at par in terms of sustainability and depth of outreach and below MIX in breadth of outreach. The large MFIs are better in sustainability and breadth of outreach and below MIX in depth of outreach. The overall MFIs industry is at par in sustainability, better in breadth of outreach and below MIX in terms of depth of outreach.
12For the various ethical theories, see a book by Jennings (2009). 13At some places the two measures of depth of outreach (average loan size and the percentage of women borrowers) show contradictory result due to the no correlation between them. The result based on the percentage of women borrowers is heavily relied upon in many cases due to criticism in using average loan size as poverty measure.
Ethiopian Journal of Economics, Volume XXI, No 1, April 2012
59
In general the international comparison shows mixed results. Scale of outreach seems to matter in sustainability as the large MFIs have better sustainability as compared to their MIX benchmark than small MFIs. But in outreach, it does not seem to matter. Both the large and small MFIs beat their MIX benchmarks in breadth of outreach while they are beaten in depth of outreach. In the earlier section, the correlation result shows that the large MFIs are preferred in the local context for sustainability and breadth of outreach and the small MFIs for depth of outreach. There was a clear demarcation between the two. In the international comparison, the large MFIs are preferred again for sustainability and breadth of outreach. But the small MFIs failed to be chosen for excellence in depth of outreach which weakens the tradeoff result found earlier. Thus, the overall result shows that large MFIs are deemed better and hence using utilitarian theory, preference should be given to them. The fact that Ethiopian MFIs surpass the global average in breadth of outreach should not give a wrong signal. If breadth of outreach performance was compared with the potential demand for microfinance service (poverty level) in each respective region, possibly, Ethiopian MFIs could lose as the poverty level is high. So, more research using a variant of relative benchmark is called for in the future. The low performance in depth of outreach is consistent with the findings of Kereta (2007), Ejigu (2009) and Lafourcade et al (2005) who showed that African MFIs fall behind in terms of women borrowers as compared to other regions of the world.
4.3 Local Comparison across the Scale of Outreach Table 4 presents the results of the local comparison of MFIs (classified by scale of outreach).The results show natural ordering of MFIs in terms of number of borrowers, average loan size and sustainability indicators but reverse ordering in the percentage of women borrowers. This means that the larger MFIs have a large number of borrowers, average loan size and OSS while they serve a small percentage of women borrowers as compared to small MFIs. Such a result is the same as the correlation result which shows that the small MFIs are better in depth of outreach indicators and the large MFIs in sustainability and breadth of outreach. This again supports the tradeoff literature that documented serving the poorest and being financially self-sufficient are contradictory goals.

Letenah Ejigu: The sustainability and outreach performance of Ethiopian…
60
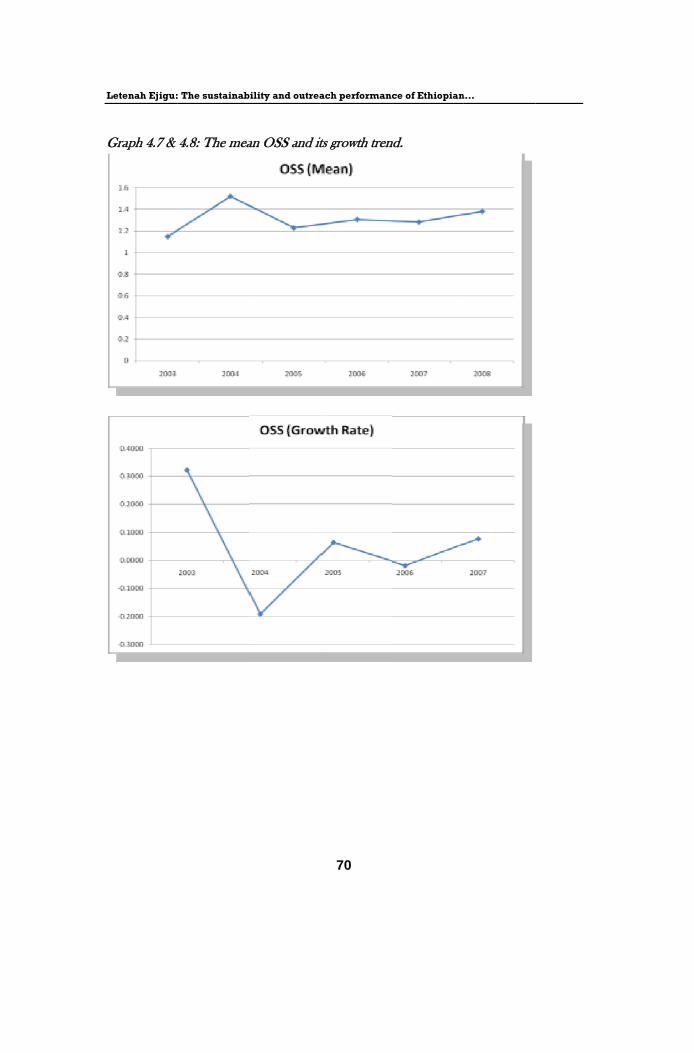
4.4 Trend Analysis for the Microfinance Industry The trend in sustainability and outreach performance are shown in level and growth forms in Graphs 4.1 up to 4.10. Beginning with the borrowers’ graph, the linear trend shows an increasing pattern indicating a large number of borrowers are served over the years. This indicates heavy growth emphasis given to such variable which is expected in a young industry. Looking at the growth rate, it shows a declining trend in recent periods. The major constraint to push for large number of borrowers may be lack of finance. This might have been created by, among others factors, the global financial crises that hit many industries recently which reduced donor support to humanitarian causes. Secondly, the demand for microfinance credit may decrease if the estimated poverty impact is low. Bateman (2010) cites some recent global studies that reveal such hard facts. On average loan size, both the linear and growth rate graph show increasing trend. Increase in average loan size may or may not be a worrisome signal. It will be a mission drift only if loan size to new clients has grown over the years whereas increase in loan size to old clients is considered as progressive, lending after successful repayment (Cull et al, 2007). No detailed data is available to confirm which proposition is at work in Ethiopia and hence further inquiry is needed. The other complicated issue is that the real mission14 of different MFIs may not be the same. Some may follow a purely commercial strategy, others purely social goals and still others (perhaps the majority of MFIs) a mix of these two. Increase in average loan size may be a mission drift for the purely social oriented MFIs, an optimal strategy for MFIs pursuing both social and commercial goals and a best strategy for the purely commercial oriented MFIs. Hence more detailed and micro level analysis should be done on this issue by future researchers. For the percentage of women borrowers, both the linear and growth rate graphs show erratic patterns. This implies there is no clear woman targeting policy and targeting seems to be done haphazardly. The OSS graph shows it is stable and erratic in a few periods which may not be worrisome. ROA shows erratic trends which are worrisome.
14Real mission is conceived as the one at the heart of owners and managers. Nominal missions may be those that are posted in brochures, banners and found at public relation offices. Sometimes, these two missions may be divergent for some MFIs.
Ethiopian Journal of Economics, Volume XXI, No 1, April 2012
61
This may be due to erratic income of clients (agricultural income) and unplanned investment decisions in assets.
5. Concluding Remarks This study attempted to assess the sustainability and outreach performance of Ethiopian MFIs by comparing them with benchmarks like MIX averages, local benchmarks and through time. The study extended the earlier studies by Kereta (2007) and Ejigu (2009) in a more advanced way. From the correlation analysis and local comparison, the small MFIs are better in depth of outreach indicators and the large MFIs in sustainability and breadth of outreach. The result indicates many things. First, it shows that scale of outreach matters for performance of MFIs. Second, the market shows a cluster of social and commercial oriented MFIs which calls for different strategies and modes of operation. Third, due to such clustering, the MFIs can not attain the double objective of reaching the poorest and being sustainable simultaneously. It seems they have to make a choice. Using utilitarian ethical school of thought, the large MFIs that serve the larger marginally poor people have to be promoted as opposed to small MFIs that strive to reach the poorest of the poor. The promotion of large MFIs includes inter alia increasing the minimum capital required to establish microfinance business, mobilization of saving and commercial debt source of finance, merger with small MFIs and other measures. If the small MFIs can not be scrapped altogether, separate regulatory frameworks should be introduced for such MFIs. Surprisingly, the two measures of depth of outreach, average loans size and the percentage of women borrowers, are not significantly correlated which needs further inquiry. As expected the two measures of sustainability, OSS and ROA, are significantly and positively correlated. With the international MIX comparison, the result is somewhat mixed and contradicts with the correlation and local comparison results. Scale of outreach seems to matter for sustainability only and not for outreach. This also further invalidates the tradeoff that is expected between serving the poorest and being financially self-sufficient. More research is also required to clear such contradiction. Ethiopian MFIs surpass the global average in breadth of outreach and slack in depth of outreach. Surpassing in the absolute number of borrowers, however, should not give a wrong signal. If performance in breadth of outreach is measured against the potential demand for MFIs, they fall behind. The weakness in depth of outreach indicates the commercial
Letenah Ejigu: The sustainability and outreach performance of Ethiopian…
62
oriented nature of the sector which constantly challenges the viability and continuity of small social oriented MFIs. The trend analysis indicates the industry has shown impressive growth in number of borrowers. Average loan size increased over the years, women targeting and ROA are erratic while, OSS is stable. From this result, more micro-level studies are called for to explain the following:
• The growth in average loan size, specifying whether the increase refers to new or old clients,
• The mission of MFIs as some have pure social mission, others pure commercial and the majority a mix of the two,
• The erratic nature of women targeting at least by the social oriented MFIs. The commercial MFIs have also to tackle the erratic ROA by diversifying income sources and making planned investment decisions.
Ethiopian Journal of Economics, Volume XXI, No 1, April 2012
63
References Aghion, A. B. and Morduch, J. (2005). The Economics of Microfinance. Cambridge,
MA: MIT Press. Amha Wolday. (2007). Managing growth of microfinance institutions: Balancing
Sustainability and reaching large number of clients in Ethiopia. AEMFI Occasional paper No 18, Addis Ababa, Ethiopia.
Barres, I. (2006). Financial Self Sufficiency (FSS).The Micro banking Bulletin.13:21-22, Microfinance Information Exchange Market Inc: Washington DC
Bateman M. (2010).Why Doesn’t Microfinance Work? The destructive rise of local neoliberalism. Zed Books Ltd, London.
Brau J. C., Woller G. (2004). Microfinance a comprehensive review of existing literature. Journal of Entrepreneurial Finance and Business Ventures 9(1):1-26.
Christen, R. P. (1997). Banking Services for the poor: Managing for financial success. ACCION International, Washington DC.
Congo, Y. (2002). Performance of Microfinance Institutions in Burkina Faso. Discussion Paper No. 2002/01, United Nations University, WIDER
Conning, J. (1999). Outreach, Sustainability and Leverage in monitored and peer-monitored lending. Journal of Development Economics, 60, 51-77
Cull, R.; DemigÄuc-Kunt, A., and Morduch, J. (2007). Financial performance and outreach: A global analysis of leading microbanks. Economic Journal. 117(517): 107-133.
Ejigu, L. (2009). Performance analysis of sample microfinance institutions of Ethiopia. International NGO Journal, 4 (5): 287-298.
Field, A. (2005). Discovering Statistics using SPSS. second edition, Sage Publication Gurgand, M.; G. Pederson, and Yaron, J. (1996). Rural finance institutions in Sub-
Saharan Africa: Their outreach and sustainability. Savings and Development, 20 (2): 135–69.
Hartarska, V. (2005). Governance and performance of microfinance institutions in Central and Eastern Europe and the newly independent states. World Development. 33: 1627-1648.
Hashemi, S. and Rosenberg, R. (2006). Graduating the poorest in to microfinance: Linking safety nets and financial services. CGAP Focus Note 34.
Hishigsuren, G. (2004). Scaling up and mission drift: Can microfinance institutions maintain a poverty alleviation mission while scaling up? (Unpublished PhD thesis) Southern New Hampshire University.

Letenah Ejigu: The sustainability and outreach performance of Ethiopian…
64
Jennings, M. M. (2009). Business Ethics Case Studies and Selected Readings. 6th edition, South Western Cengage Learning.
Kereta, B. (2007). Outreach and financial performance analysis of microfinance institutions in Ethiopia. African Economic Conference, Addis Ababa.
Kevane, M. & Wydick B. (2001). Microenterprise Lending to Female Entrepreneurs: Sacrificing Economic Growth for Poverty Alleviation? World Development 29, 1225-1236.
Kidane, A. (2007). Outreach and Sustainability of the Amhara Credit and Saving Institutions (ACSI) Ethiopia. (Unpublished MA thesis), Norwegian University of Life Sciences.
Lafourcade, A. L.; Isern J.; Mwangi P., and Brown, M. (2005). Overview of the outreach and Financial Sustainability and outreach of Microfinance Institutions in Africa. The MIX Market Inc.
Ledgerwood, J. (1999). Sustainable Banking with the Poor Microfinance Handbook: An Institutional and Financial Perspective. The World Bank, Washington, DC.
Marzys, O. R. (2006). Microfinance Institutions: Profitability at the Service of Outreach? A Study of the Microfinance Industry in the ECA Region. (Unpublished MA thesis).
Mersland, R. and Strom, O. (2010). Microfinance Mission Drift. World Development, 38 (1), 617-629
_______. (2007). Sustainability and outreach and corporate governance in Microfinance Institutions. Agder University, Norway
Microfinance Information eXchange (MIX). (2008). Benchmark reports. Washington DC.
Okumu, L. J. (2007).The Microfinance industry in Uganda: Sustainability, Outreach and Regulation. (Unpublished PhD Dissertation) University of Stellenbosch, South Africa
Pfister, M. W., Gesesse D., Amha Wolday, Mommartz, R., Duflos W., Steel E. (2008). Access to finance in Ethiopia: Sector Assessment study.2, GTZ.
Sengupta, R. and Aubuchon, C. P. (2008). The Microfinance Revolution: An overview. Federal Reserve Bank of St. Louis Review, 90(1), 9-30
Schreiner, M. (1999). Aspects of outreach: a framework for the discussion of the social benefit of Microfinance. Microfinance Risk Management, St. Louis
Woller, G. M. and Schreiner M. (2006).Poverty lending, financial self sufficiency and the six aspects of outreach. SEEP Network Publication, New York

Ethiopian Journal of Economics, Volume XXI, No 1, April 2012
65
Appendix Table 1: Descriptive Statistics
Variables N Mean SD Min Max Coefficient of Variation
Mean growth rates (2003-2008) (%)
Borrowers 60 123034 18374 434 710576 14.9 22.24
AvLnSz 60 128 64.46 32 314 0.5 16.79
Women 57 0.53 0.2 0.14 0.93 0.37 3.35
OSS 58 1.3 0.54 0.15 2.3 0.41 5.07
ROA 54 0.01 0.08 -0.4 0.1 8.8 -15.1
Table 2: Correlations among sustainability and outreach indicators
Variables Borrowers Women AvLnSz ROA OSS
Borrowers 1 Women -0.48* 1 AvLnSz 0.5* -0.17 1 ROA 0.34* -0.29* 0.11 1 OSS 0.66* -0.38* 0.36* 0.8* 1
*values significant at 5%

Letenah Ejigu: The sustainability and outreach performance of Ethiopian…
66
Table 3: Comparison with MIX benchmark: One sample t test
Scale of outreach Variable N Mean SE
MIX Benchmark (2004-2008
average)
T P
Small LnBorrower 26 11904 0.22 5332 2.5 0.01* Women 25 0.6 0.03 0.69 -2.01 0.05* LnAvLnSzGNI 26 0.47 0.07 0.47 0.203 0.84 OSS 26 0.95 0.08 1.11 -2.14 0.04* ROA Left
Medium Borrower 12 16734 1934 18132 -1.1 0.29 Women 11 0.66 0.03 0.67 0.14 0.88 AvLnSzGNI 12 0.72 0.03 0.72 0.3 0.76 OSS 12 1.27 0.1 1.18 1.09 0.29 ROA Left
Large Borrower 22 311068 39639 185503 3.2 0.004* Women 21 0.37 0.03 0.58 -5.9 0.000* LnAvLnSzGNI 22 0.93 0.05 1.11 -2.6 0.01* OSS 20 1.8 0.07 1.25 7.07 0.000* ROA 18 0.05 0.005 0.01 7.31 0.000*
Whole MFIs
LnBorrower 60 123,034 183,746 67,908 15 0.000* LnWomen 57 0.53 0.2 0.65 -4.9 0.000* LnAvLnSzGNI 60 0.7 0.3 0.76 -2.97 0.004* OSS 58 1.3 0.54 1.18 1.77 0.08 ROA Left
*values significant at 5%
Table 4: Comparison across each category of the MFIs: ANOVA
Variable Scale of outreach Mean SD F/ P
Post Hoc tests Games-Howell/Scheffe/
P
LnBorrower Small 11904 1.13
94.01 0.000* Small vs. medium 0.057*
Medium 15987 0.48 Small vs. large 0.000* Large 313644 0.83 Medium vs. large 0.000*
LnAvLnSz Small 91 0.49
19.87 0.000* Small vs. medium 0.006*
Medium 131 0.23 Small vs. large 0.000* Large 173 0.35 Medium vs. large 0.219*
LnWomen Small 0.6 0.4
14.78 0.000* Small vs. medium 0.604
Medium 0.66 0.16 Small vs. large 0.000* Large 0.37 0.44 Medium vs. large 0.000*
OSS Small 0.95 0.42
28.14 0.000* Small vs. medium 0.03*
Medium 1.27 0.36 Small vs. large 0.000* Large 1.8 0.34 Medium vs. large 0.003*
ROA Small -0.032
5.918 0.005* Small vs. medium 0.04*
Medium 0.034 Small vs. large 0.002* Large 0.05 Medium vs. large 0.15
*values significant at 5%

Graph 4.1 &
& 4.2: The mea
Ethiopian
an number of
n Journal of Eco
67
f borrowers an
onomics, Volum
nd the growth
me XXI, No 1, A
h trend.
April 2012

Letenah Ejigu:
Graph 4.3 &
: The sustainab
& 4.4: The mea
bility and outrea
an average loa
ach performanc
68
an size and its
ce of Ethiopian
s growth trend
n…
d.

Graph 4.5 &
& 4.6: The mea
Ethiopian
an percentage
n Journal of Eco
69
e of women bo
onomics, Volum
borrowers and
me XXI, No 1, A
d its growth tren
April 2012
end.
Letenah Ejigu:
Graph 4.7 &
: The sustainab
& 4.8: The mea
bility and outrea
an OSS and it
ach performanc
70
its growth tren
ce of Ethiopian
nd.
n…

Graph 4.9 &
& 4.10: The me
Ethiopian
ean ROA and
n Journal of Eco
71
d its growth tre
onomics, Volum
end.
me XXI, No 1, A
April 2012

Letenah Ejigu: The sustainability and outreach performance of Ethiopian…
72