the survey of spatial disparity in india with the ... · the survey of spatial disparity in india...
TRANSCRIPT
45
Hungarian Geographical Bulletin 60 (1) (2011) pp. 45–65.
The survey of spatial disparity in India with the application of the SENTIENT Index
Zoltán WILHELM1
Abstract
Most of the articles writt en on India treat spatial disparity within the country at the level of the member states and union territories which is an imperfect approach. Reality is hid-den behind the averages of the extremes. In this study the data of 593 districts of India were elaborated, based on the district level information of the census held in 2001. As a result the districts of India were classifi ed by the relative level of development, using the so-called SENTIENT Index. The index of complex development that I created on the basis of the tetrahedron model sensitively “reacts” to the changes occurring in the geographi-cal environment. It is modifi ed as an eff ect of the events taking place in the individual spheres, so it can be a tool producing spectacular results of comparative spatial studies. The present paper explores the coherences of the spatial disparity within India and the internal correlations of the state of development or backwardness also become clear.
Keywords: India, districts, spatial disparity, SENTIENT Index
Introduction: issues to be discussed
It can be stated with an absolute certainty that India is one of the most diverse countries in the world from human geography aspect. The ethnic, language, religious and caste division of its population all result in heterogeneity practi-cally unmatched in any other country. This is accompanied by the diff erences of the physical geographical endowments of this huge state: within India one can descend from peaks of the highest mountain of the planet to seaside plains, get from tropical deserts to rain forests. This extreme diversity naturally has led to considerable regional disparity.
Most of the Hungarian language literature writt en on India look at spa-tial disparity within India at the level of the states and union territories (Cseke, L. 2009; Surányi, S. 1978; Szegedi, N. and Wilhelm, Z. 2008; Trócsányi, A. and
1 University of Pécs, Institute of Geography, H-7624 Pécs, Ifj úság útja 6. E-mail: [email protected] k.pte.hu
46
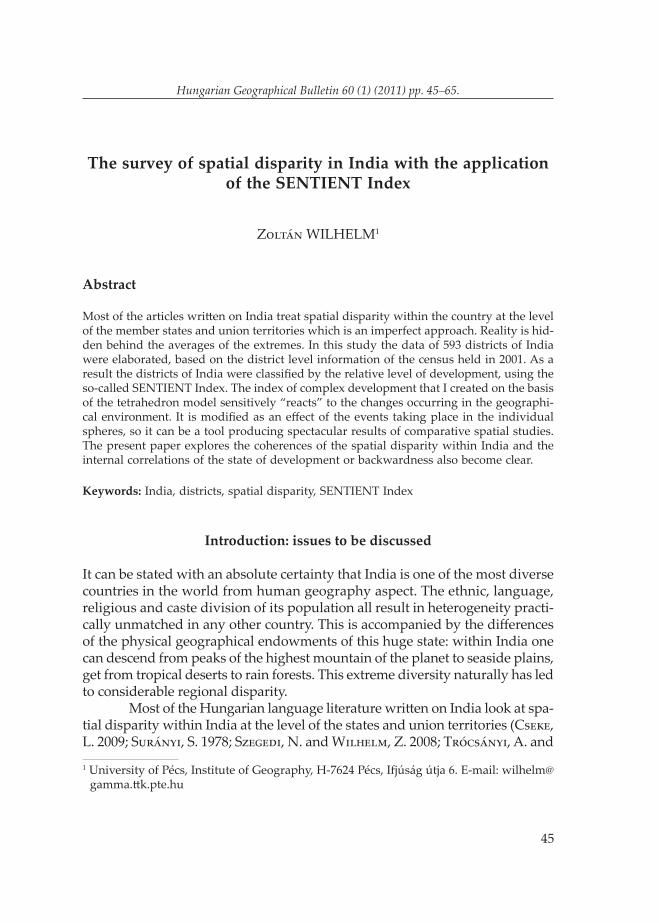
Wilhelm, Z. 1996), which – although the very analysis itself is a brave deed – is an imperfect approach. As an example we can look at the characteristics of urban residents recorded by the census of 2001. If we do not take the union territories actually consisting of almost purely urban spatial types (e.g. Delhi, Chandigarh, Pondicherry) into consideration, none of the spatial formations making the second tier of Indian administration (Figure 1) (i.e. the member
Fig. 1.Fig. 1. Administrative divisions of India: member states and district. – 1 = Sikkim; Administrative divisions of India: member states and district. – 1 = Sikkim; 2 = Nagaland; 3 = Manipur; 4 = Mizoram; 5 = Tripura; 6 = Daman & Diu; 7 = Dadra & Nagar 2 = Nagaland; 3 = Manipur; 4 = Mizoram; 5 = Tripura; 6 = Daman & Diu; 7 = Dadra & Nagar
Haveli; 8 = Goa; 9 = PondicherryHaveli; 8 = Goa; 9 = Pondicherry
47
states) reach a 50% urbanisation level. In addition, the giant administrative units (among the EU 27 states, it is Spain or Poland that is comparable in size with an average state in India), and the administrative belonging to the megalopolises of the Indian subcontinent can basically modify the statistical and accordingly the cartographic data. If Delhi were not considered a union territory, the proportion of urban inhabitants in Utt ar Pradesh, one of the states would be almost 6% higher (26.44%) than it is calculated now (20.78%), but if it were annexed to Haryana state, also neighbour to the capital city, we would get the most urbanised province of India, as the state would suddenly have a 55.71% rate of urban population. The calculation also works the other way round, as Mumbai (Bombay) and Kolkata (Calcutt a), with populations larger than that of Delhi, are not union territories, therefore they are featured among the statistical data of Maharashtra and West Bengal states. If Mumbai were seceded from Maharashtra, the proportion of the urban residents would dimin-ish from 42.42% to 30.72%. The change would be even more drastic if Kolkata were given a union territory status, as in this case the urbanisation level of West Bengal state, 27.97% – at the national average – would drop to 13.75% (Wilhelm, Z. 2008a). It all suggests that the survey of the present urbanisation features of India should not be conducted at the level of the member states, not to mention other human geographical examinations. The averages of the high/low extremes hide the real proportions.
Objectives
It seems to be more reasonable to analyse the data of the districts, the tier be-low the administrative hierarchy level of member states/provinces and union territories and producing manageable statistical databases, in order to feature the spatial disparity within India. Of course, not even the districts are entities comparable from all aspects, stemming from the administrative diff erences within the country2, nevertheless a much more accurate picture can be obtained than that provided by the surveys at member state level.
The analysis of the spatial disparity in India was carried out on the basis of the data of the census of 2001. These data seem to be rather old to calculate with, but in view of the enormous size of the country the statistical offi ces of India are still publishing new data sets which are primary products from this last census. The essay is also designed to create a database that shall
2 The proportion between the districts with the largest and the smallest number of population is like comparing the number of inhabitants in Hungary (just over 10 million) to that of Esztergom (a town with approximately 29 thousand inhabitants).
48
be comparable with the data of the next census probably to take place in 2011 so that we can clearly demonstrate the trends of and the reasons for the changes.
The author also tries to explore a new method of analysis built upon the data of the last census in India, which reveals fi rst to the public in this paper.
Method
The districts of India have been classifi ed by the relative level of develop-ment, using the so-called SENTIENT Index. The basis of this method was the tetrahedron model created by Tóth, J. in 1981. The essence of this model is as follows: a sett lement is to be comprehended as a system of economic, social and technical structures in a given geographical environment, and in intensive interaction with the elements of this environment.
This concept can be best visualised, assuming the balanced develop-ment levels of the respective structure in the optimal case, by a tetrahedron, the foundation of which is the geographical environment, the other three sides are the economic, the social and the technical (infrastructural) spheres. Along the edges, between the respective spheres there are interactions of diff erent in-tensities, depending on the development level of the structures; a sett lement is the complete system of these spheres (and their interactions), which as a single organism is in close interaction with the natural environment.
Depending on how complicated these systems are (taking the char-acteristics of the complete sett lement network and the relative diff erences of the individual elements into consideration), diff erent sett lement types can be identifi ed (Tóth, J. 1981).
I am convinced that the tetrahedron model is not only suitable for the defi nition of the sett lement types; both as theoretical and practical bases it is also an excellent tool for the measurement of the development level of larger units3. For the defi nition of the qualitative feature of the respective spheres I used statistical data taken from the results of the last census con-ducted in India.
Giving to the temptation of using acronyms so popular in the West, which refer in a simple way to the research method and the results with meaningful words, an acronym was created pointing to both the method that we used and the monitoring of the changes in the research area. This acronym is:3 The method of spatial analysis based on the tetrahedron model is not a new phenomenon.
It was initiated by the research team led by Tóth, J. in 1995 (the so-called TÁGINTER-analysis), when submitt ing a proposal for the tender announced for the making of the development concept of Baranya county in Hungary.

49
SENTIENT Index = Society, Economy, iNfrasTructure, physIcal environmENT.
Synonyms for the word “sentient” are feeling; att entive; aware. The complex development index that I created on the basis of the tetrahedron model sensi-tively “reacts” to the changes taking place in the geographical environment; it is modifi ed as an eff ect of the events taking place in the individual spheres, so it can be a tool producing spectacular results of comparative spatial studies.
In the study, data of 593 districts of India were involved, based on the district level data of the census held in 2001. The data were not freely avail-able in electronic version, so we had to read all data, district by district from the Java based GIS maps that were generated on the website of the census of India – with several months’ work – from which I was able to create our own digital database. The same website contains other information as well that is not directly related to the districts (data of the member state and the union territories); these pieces of information can also be used in the future as the basis of further calculations. This time they were neglected and, with the em-phasis put on the mathematical-statistical data instead, data series serving as the basis of the complex index were analysed. In order to defi ne the rank by the level of development, with simple relative ranks were involved, using the averages of the positions.
For the description of the social sphere the following data were used:
D1 = proportion of urban population;D2 = literacy rate;D3 = diff erences in the literacy rates by gender;D4 = proportion of diploma holders;D5 = proportion of people with disabilities.In the case of D1, D2 and D4 no explanation is necessary. Data of D3
were used because in India it is extremely important to recognize the disparity of literacy rates between men and women older than seven years within the same districts. It is easy to understand that in this mainly male-centred society, if the respective fi gure of women is close to that of men, we are in a district relatively more developed, at least as regards its human endowments. The index of D5 was selected because the more closed a given social circle (castes, sub-castes, isolated rural communities etc.), and the worse the living condi-tions (malnutrition, environmental damages etc.), the higher the chances that babies with disabilities are born. At the same time, it is very sad that in India there is frequent mutilation of children carried out by parents or so-called “beggar masters”, in some cases even self-mutilation occurs in order to secure the stable living from begging (Nieuwenhuizen, P. 2006). On the basis of the above-said, in my opinion the less the proportion of the disabled is, the more

50
developed a district is in India. In addition, the institutions that receive the disabled do not distort these fi gures, given the usually very high population of the administrative units in question.
The development levels of the economic sphere in the districts were measured by the following indices:
D6 = proportion of full-time employment;D7 = proportion of non-agricultural workers;D8 = proportion of inactive population;D9 = use of banking services;D10 = proportion of households possessing a car.Data on infrastructure – in relation to the characteristics of the data
collection – is concentrated on the public utilities supply of the households and the comfort level of the homes (Photo 1.). The search, acquisition and calculation of the data describing the economic, entrepreneurial environment can be realized in a later phase of this work. Presently we are using the fol-lowing data:
D11 = bathroom in the house;D12 = no toilet belongs to the house;D13 = lighting with electricity;D14 = number of telephones.
Photo 1. Households without any conveniences in the centre of Surat District ranked 94Households without any conveniences in the centre of Surat District ranked 94th th
by SENTIENT Index and once home to the fi rst British colony in Indiaby SENTIENT Index and once home to the fi rst British colony in India

51
The application of parameters describing the natural environment is a most pressing task, as no data are available on the state of the environment by components. I made att empts to generate an index focusing on the hu-man comfort sense due to the climate, but this index is not usable yet in the framework of this study.
Therefore only upon population density (D15) data were used in this analysis. The lower the number of inhabitants per square kilometre, the less degraded environment is expected, i.e. districts with lower population density are ranked higher in the order. Of course this parameter does not describe the quality of human life adequately, because life is rather harsh e.g. in the Himalaya of Ladakh, in an almost intact natural environment (Kiss-Csapó, G. 2009).
In addition to the data mentioned above a number of other data were also recorded and used in this essay, such as the population of scheduled castes and tribes, religious breakdown, and the number of inhabitants residing in the most populated sett lements of the district. These become interesting when doing the mathematical-statistical calculations, e.g. correlation analyses.
Results
The towns and cities of India were home to almost 28% of the population of the country in 2001. There is a signifi cant disparity at the level of member states and union territories in this respect, but this diff erence is even more extreme at the level of the districts: in nine districts the whole population is urban, in ten districts all inhabitants are rural dwellers. All of the districts in the fi rst group are incorporated into metropolises or into union territories (Pondicherry). The districts remaining below 10% urbanisation level make an almost contiguous belt in Northeast India, from East Utt ar Pradesh via Bihar, Orissa and the northern territories of West Bengal to the Himalaya region and the small northeast states. In addition, there are extended territories with urban void in the Western Himalaya region (Himachal Pradesh, Utt aranchal, Jammu & Kashmir).
When looking at the map featuring the districts concentrating urban population above the national average, we can see that “urbanisation axes” are being born in India, mostly linking the metropolises (Figure 2). It is interesting to note that no such axis has emerged so far between Kolkata and Delhi – de-spite the communication role of the Great Trunk Road –, but such an axis does trend towards the city of Lahore in Pakistan. The urban junction being born on the boundary of Tamil Nadu and Karnataka is also remarkable (Figure 2), which, according to my hypothesis, projects the favourable development of a number of further indices.

52
If one wishes to use the analogy of generalised graphics solutions ap-plied to visualise some spatial characteristics in the technical literature (e.g. Golden Triangle, Pentagon, Blue Banana etc.), the picture that most precisely depicts the urbanised areas of India (both in quantitative and qualitative as-pect) is that of a drawn bow (Figure 2). Let us introduce this discovery of ours to the professional circles under the name ‘Indian Drawn Bow’.
The proportion of literate persons within the population over seven years is 65.38% in India, according to the latest census. If we draw an isop-leth map with the district averages, we can see again the axes known from
Fig. 2. Districts with over 30% share of urban population and “urbanisation axes” in India in 2001 – 1 = urban population over 30%; 2 = urban population 30% or below

53
Figure 2, but the districts of the Himalaya and of the small northeast states are also on the map in large number. In the case of the latt er the explanation may be the high proportion of Christians, but the districts in the former cat-egory have a religious component in the index as well: the Buddhists and the concomitant numerous educated monks may be the reason. At the same time other socio-cultural elements characteristic of the population in the mountain regions also contribute to this parameter considerably.
All over India there are signifi cant diff erences between the number of literate men and women, because of the social traditions, for the advantage of men. There is only one district in India where the literacy rate of women exceeds that of men: this is Jaintia Hills in Meghalaya state. The literacy rates of the genders are almost the same in two other districts of this state, two districts of Kerala and four districts in Mizoram, and also in Mahe located in Pondicherry. There are 2.5 times more men than women who can read and write in the district Supaul in Bihar and in Shrawasti district in Utt ar Pradesh. The frontier region to Nepal is one of the most backwards regions of India. The worst fi gures of the respective index can be found in the districts mak-ing an almost contiguous block. South Indian districts can only be seen at a multiplier of 1.8, this is the Mahbubnagar district in Andhra Pradesh, with a considerable Muslim population. No district in Kerala, on the other hand, has an index worse than 1.1.
The proportion of diploma holders within the adult population is the highest in big cities with considerable administrative functions. Accordingly, there is a signifi cant deviation on the map featuring this index. Within the age group older than 18 years old the largest number of diploma holders can be found in the district of New Delhi (22.9%), the least diploma holders can be found in the South Garo Hills district of Meghalaya: 0.9% of the population. It is interesting though that this district performs bett er than 117 other districts when it comes to literacy rate.
When looking at the proportion of those with disabilities within the districts, we fi nd strikingly high fi gures in some areas with overwhelming of secondary sector. The “most” in this respect is the district of Valsad in Gujarat, with the – hardly believable – fi gure of 58.77%. Nevertheless this is one of the most polluted areas of the world, around the city of Vapi, a centre of chemical industry, where e.g. in 2007 the mercury concentration of subsoil waters was 96 times higher than the WHO standard4.
Among the selected indicators of the economic sector, the rate of full-time employees (with employment for more than six months a year) is high in 4 The World’s Worst Polluted Places. The Top Ten of the Dirty Thirty. Blacksmith Institute
2007. htt p://www.blacksmithinstitute.org/wwpp2007/fi nalReport2007.pdf (Last download: 9 December 2009)
54
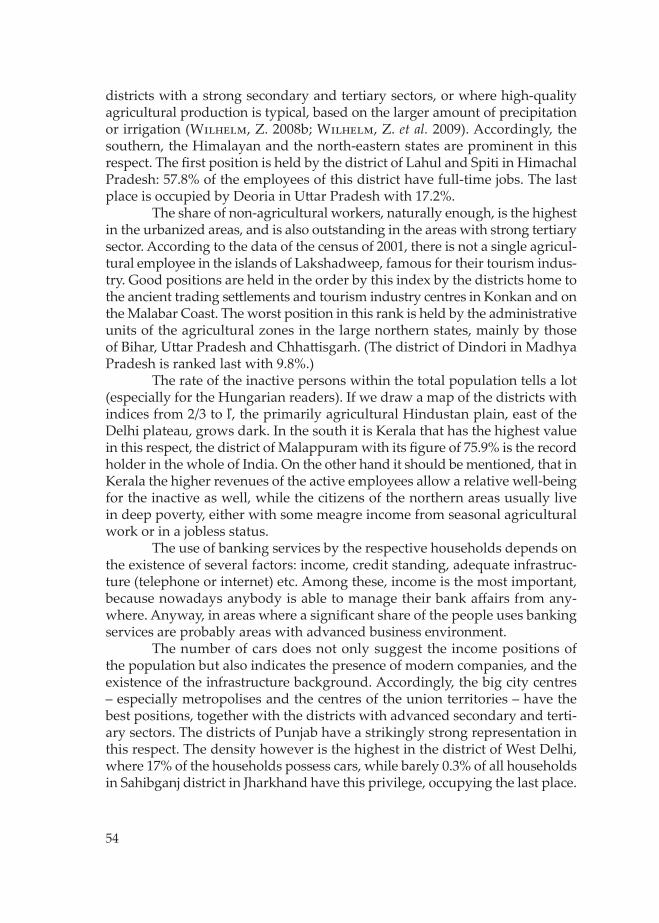
districts with a strong secondary and tertiary sectors, or where high-quality agricultural production is typical, based on the larger amount of precipitation or irrigation (Wilhelm, Z. 2008b; Wilhelm, Z. et al. 2009). Accordingly, the southern, the Himalayan and the north-eastern states are prominent in this respect. The fi rst position is held by the district of Lahul and Spiti in Himachal Pradesh: 57.8% of the employees of this district have full-time jobs. The last place is occupied by Deoria in Utt ar Pradesh with 17.2%.
The share of non-agricultural workers, naturally enough, is the highest in the urbanized areas, and is also outstanding in the areas with strong tertiary sector. According to the data of the census of 2001, there is not a single agricul-tural employee in the islands of Lakshadweep, famous for their tourism indus-try. Good positions are held in the order by this index by the districts home to the ancient trading sett lements and tourism industry centres in Konkan and on the Malabar Coast. The worst position in this rank is held by the administrative units of the agricultural zones in the large northern states, mainly by those of Bihar, Utt ar Pradesh and Chhatt isgarh. (The district of Dindori in Madhya Pradesh is ranked last with 9.8%.)
The rate of the inactive persons within the total population tells a lot (especially for the Hungarian readers). If we draw a map of the districts with indices from 2/3 to ľ, the primarily agricultural Hindustan plain, east of the Delhi plateau, grows dark. In the south it is Kerala that has the highest value in this respect, the district of Malappuram with its fi gure of 75.9% is the record holder in the whole of India. On the other hand it should be mentioned, that in Kerala the higher revenues of the active employees allow a relative well-being for the inactive as well, while the citizens of the northern areas usually live in deep poverty, either with some meagre income from seasonal agricultural work or in a jobless status.
The use of banking services by the respective households depends on the existence of several factors: income, credit standing, adequate infrastruc-ture (telephone or internet) etc. Among these, income is the most important, because nowadays anybody is able to manage their bank aff airs from any-where. Anyway, in areas where a signifi cant share of the people uses banking services are probably areas with advanced business environment.
The number of cars does not only suggest the income positions of the population but also indicates the presence of modern companies, and the existence of the infrastructure background. Accordingly, the big city centres – especially metropolises and the centres of the union territories – have the best positions, together with the districts with advanced secondary and terti-ary sectors. The districts of Punjab have a strikingly strong representation in this respect. The density however is the highest in the district of West Delhi, where 17% of the households possess cars, while barely 0.3% of all households in Sahibganj district in Jharkhand have this privilege, occupying the last place.
55
The worst positions are almost exclusively held by districts in Bihar, Orissa, Jharkhand and Chhatt isgarh. It should be noted that the cars registered in the statistics are not included among the heavy-duty vehicles usually strongly polluting the environment or in the category of two-stroke, two- or three-wheel vehicles that run in large numbers in the big cities of India and have a detrimental eff ect on air quality in the cities.
Looking at infrastructure (bathroom in the house; no toilet belongs to the home; lighting with electricity; number of telephones), we can only rely on the census data in this case again, given the limits of this essay. Naturally, in further analyses, the infrastructure of communication geography typical of the districts will have to be scrutinized as well.
Even without correlation analysis it is evident that the urbanised areas have the best positions as regards to the infrastructure endowments. The best positions are held by the southern states and Punjab. It is contrasting that while people in 94% of the households in Hyderabad live in fl ats equipped with a bathroom, in 100 peripheral districts of the country this proportion remains below 10%. The situation is even worse when it comes to the occur-rence of toilet in the houses: in the Aizawl district in Mizoram it is only 2.7% of the homes that do not have toilet in the fl at, in 172 districts of India this proportion is above 80%. The district in the worst position in this respect is that of Jashpur in Chhatt isgarh with 4.7% of the households. It shows that the hygiene trap coming from the lack of communal infrastructure is still a serious problem in India.
It might be sound conspicuous that the use of and the very access to electricity still has to be taken into consideration as one of the measures of the development level in India in the 21st century. It is especially curious if we know that only 3.1% of the homes in the district of Sheohar in Bihar use electricity for lighting. In Lakshadweep, 99.7% of homes are lit with electricity. The low share of the homes using electricity is even more surprising if we consider that the Indian government subsidises that provision considerably (Wilhelm, Z. et al. 2009).
India is the second largest mobile telephone user in the world (by the number of telephone sets sold), where cheap and good quality service is provided by a dozen of companies. India has full coverage in this respect. On the other hand, the number of landline phones is still an important develop-ment index, because the traditional lines are necessary for several social and economic activities. The number of telephones shows a strong correlation to the proportion of the urban population.
The index of population density is only used as a measure of man induced impacts. It should be acknowledged that low population density in a country otherwise densely populated indicates areas least suitable for the sett lement of humans, i.e. it denotes the peripheries. It also has to be added that

56
quasi natural conditions, as components of the sphere giving the foundations of the tetrahedron model, can be found in these areas. However, a sparsely populated area is not necessarily a rural one.
The two extremes can be found in the district of Lahul and Spiti in Himachal Pradesh: 2 persons/km2, and the index of Northeast Delhi: 29,467.5 persons/km2. Low population density is usually a characteristic feature of the Himalayan, the Northeast Indian and the desert districts. The counter-pole is made by the sectors of the megapolises, with their hardly habitable environment.
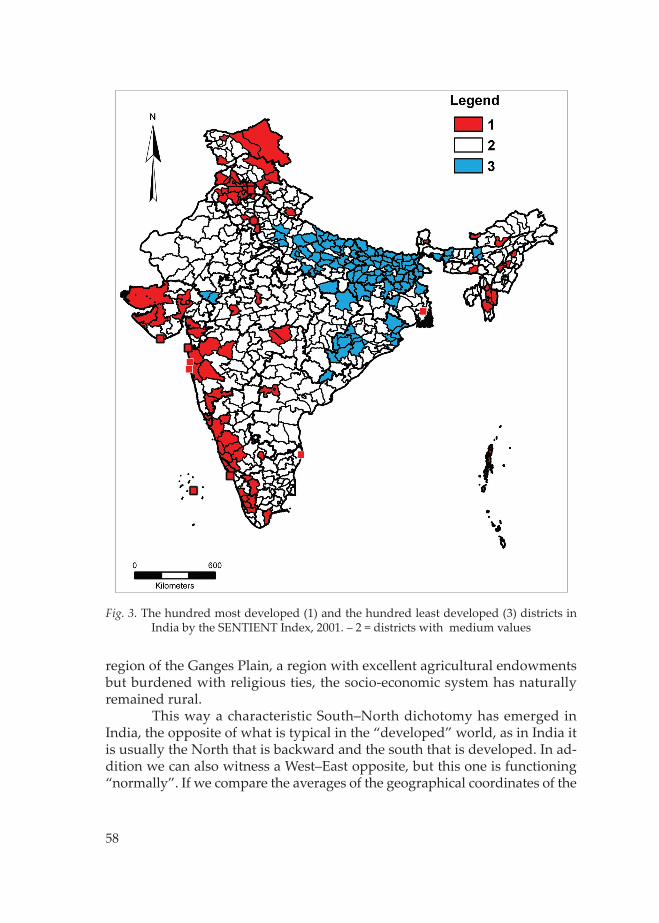
Making an average of the positions occupied on the scale of 593 items, there was an order by the relative development level based on the 15 selected indices. Figure 3 features the fi rst 100 districts marked with red. A red circle, framed black, designates all nine districts of Delhi, as they are in the set con-centrating the most advanced one hundred districts. Red quadrangles framed are used to show the union territories while quadrangles without a frame feature the small sized districts mostly belonging to megapolis.
It is clear from the map that the most developed, relatively large and almost contiguous area of India can be found in the southwest, along the Ahmedabad–Mumbai–Goa–Kanniyakumari axis. This means that the indus-trial regions and traditional ports of the central and southeast territories of Gujarat state, the western edge of Maharashtra, with the fi nancial and com-mercial centre of India, Mumbai, and its agglomeration, belong to this area. Extending southwards this axis is continued by Goa state, with the high-est GDP per capita in India and a “super power” of the tourism industry (Photo 2.); several districts of Karnataka, a state famous for its computer soft -ware industry, also joins the group of the most advanced districts. It is interest-ing that Kerala renowned for its human resources (where the literacy rate of males is higher than in Portugal or Malta) is only represented by six districts in this zone. If only the indices of human resources are taken into account, a con-tiguous zone in the central and southern parts of Tamil Nadu stretches across developed administrative units. The complex index, however, reaches maxi-mum at the district Aizawl, in the centre of Mizoram state. The average value of its positions is 43.6. Its leading position is surprising among other things because this district is home, according to the statistics, to a large proportion of people with disabilities: scheduled castes and, what is more, scheduled tribes. Megapolises are represented by Kolkata, in the second place. Outstanding po-sitions are held by the districts of Delhi and Goa, and by the district with the fourth position in the rank, a new city: Chandigarh. It is absolutely evident that this region of India can be called the Indian Blue Banana, its shape resembles the fruit much more than that of its European counterpart does. In addition, one has to remark, although it has nothing to do with the present analysis, that India is the number one banana producer in the world…

57
Photo 2. The Bom Jesus Basilica, built by the Portuguese conquistadors in India’s most developed state Goa, also famous for its tourism industry
The fi rst 100 districts outside the above-mentioned axis are usually big cities, megapolises and their agglomerations: Delhi, Kolkata, Chennai, and Hyderabad. A diff erent development path is represented by the majority of the rich districts of Punjab (Delhi–Lahore axis), and the developed districts of the smaller northeast states with a substantial Christian population.
The inferior performance of the states in the northern Hindi zone that hold the leading role in political life, is striking. There cannot be found among the fi rst 100 districts one single from the states of Rajasthan, Bihar, Chhatt isgarh, Jharkhand, Orissa, Utt ar Pradesh or Assam. Kolkata from West Bengal, and another unit from Madhya Pradesh are the two districts among the most developed such entities of India (Figure 3).
It comes from this analysis that the least developed districts are situ-ated in the territory of the Ganges plain, in the fi rst place. Drawing – with blue – the last one hundred districts on a map (Figure 3), we actually get a con-tiguous block of backward districts. This region of India is the Aryan/Hindu core, which is also the cradle of the Hindu civilisation. This religion led by the (Brahman) caste of the priests is the stronghold of rural life, and anti-ur-ban feelings. Religious reform movements have been organised against this, the ones now known and Buddhism and Jainism (Wilhelm, Z. 2008a). These movements, however, could become successful in urban environment. In the
58
region of the Ganges Plain, a region with excellent agricultural endowments but burdened with religious ties, the socio-economic system has naturally remained rural.
This way a characteristic South–North dichotomy has emerged in India, the opposite of what is typical in the “developed” world, as in India it is usually the North that is backward and the south that is developed. In ad-dition we can also witness a West–East opposite, but this one is functioning “normally”. If we compare the averages of the geographical coordinates of the
Fig. 3. The hundred most developed (1) and the hundred least developed (3) districts in India by the SENTIENT Index, 2001. – 2 = districts with medium values
59
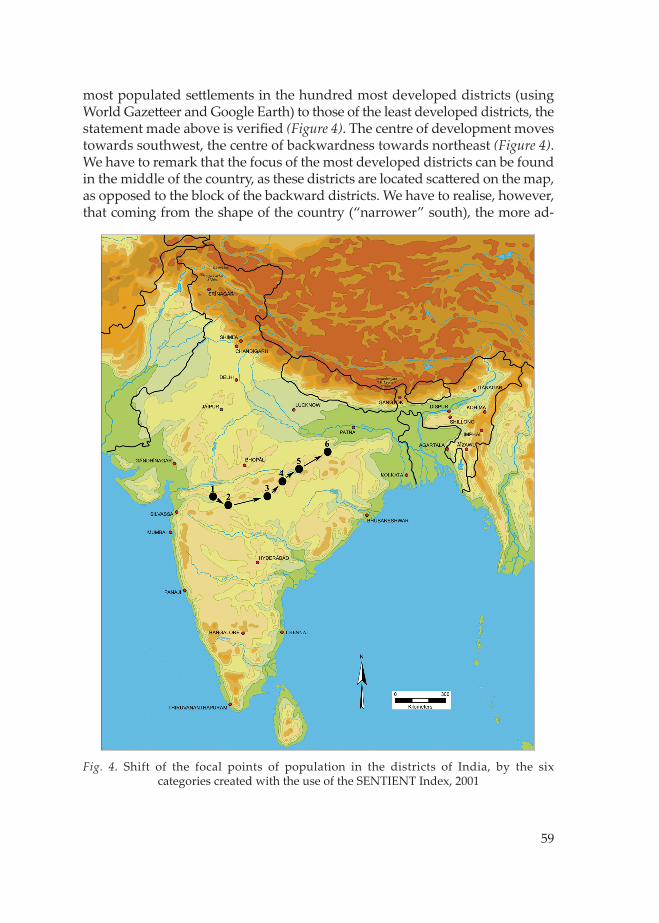
Fig. 4. Shift of the focal points of population in the districts of India, by the six categories created with the use of the SENTIENT Index, 2001
most populated sett lements in the hundred most developed districts (using World Gazett eer and Google Earth) to those of the least developed districts, the statement made above is verifi ed (Figure 4). The centre of development moves towards southwest, the centre of backwardness towards northeast (Figure 4). We have to remark that the focus of the most developed districts can be found in the middle of the country, as these districts are located scatt ered on the map, as opposed to the block of the backward districts. We have to realise, however, that coming from the shape of the country (“narrower” south), the more ad-

60
vanced districts closer to the Equator have to have an overweight so that the development pole of India can be found in the central part of the country.
It is worth looking at the “movement” of the focal points of the catego-ries made from the 593 districts on the basis of their development level, where the fi rst group consists of 98 elements, all others have 99 elements (Figure 4.). The fi rst two groups are relatively close to each other. The reason for this is that the bulk of the districts making group 2 can be linked to the southern regions. The elements of the next group are also more connected to the South, but the focal point is moving towards the eastern territories. The focal points of the remaining groups are evidently moving towards northeast.
Without giving lengthy details of our statistical analyses, it is worth taking a look at the correlations of religion and development level, extremely important in India. We surveyed the correlations among the proportions of the diff erent religious communities in the districts and the development level shown by the SENTIENT Index. In India, the majority of the inhabitants are believers of two large religions: they are Hindus or Muslim (Table 1.). The political division of South Asia in 1947 and way of the accession of the ducal states also took place on the basis of religious considerations. This was fol-lowed by the largest involuntary migration process of the world so far, with massacres (Wilhelm, Z., Pete, J. and Kisgyörgy, P. 2006). The situation has considerably changed since then.
The averages of the diff erent indices – note: the lower the fi gure, the more developed the district – are correlated to the number of the believers of the respective religions present in the district.
The value calculated for the Hindus is r=0.183786, i.e. a very weak but existing correlation can be demonstrated between the high proportion of Hindus and backwardness. The value for the Muslims is r=0.1369. There is an even weaker but still demonstrable correlation between the larger share of Muslims and backwardness.
Table 1. Breakdown of the population of India by religious affi liation, 2001
Religion Number of believers Proportion (%)HinduMuslimChristianSikhBuddhistJainOther (Animist, Parsi, Israelite etc.)Non-religious
827,578,868138,188,24024,080,01619,215,7307,955,2074,225,0536,639,626
727,588
80.513.42.31.90.80.40.60.1
Total 1,028,610,328 100.0Source: Census India 2001
61
Analysing the smaller religious communities, one must consider the following: Christians (r=-0.16069), Sikhs (r=-0.24259), Buddhists (r=-0.15207), Jains (r=-0.26089), believers of other religions (r= 0.018413) and non-religious (r= -0.048). No correlation was found in the case of those belonging to the latt er two groups, but the presence of the believers of other religions in larger number in a district induces development. Of course it is not to say that there are “back-ward” and “developed” religions. The explanation for this phenomenon is heterogeneity. In areas where Hindus or Muslims have a dominant proportion, the presence of other religions minorities is much less typical. However, districts that are heterogeneous from a religious aspect are more developed.
It is just this heterogeneity, diversity and tolerance – the tolerance of the majority society – is where the power of India and the key to the de-velopment of the country lies. Paul Johnson, British historian writes in the Forbes magazine, 21 June 2004: “India is another example. It is the nature of the Hindu religion to be tolerant and, in its own curious way, permissive. Under the socialist regime of Jawaharlal Nehru and his family successors the state was intolerant, restrictive and grotesquely bureaucratic. That has largely changed and economy is soaring… When left to themselves, Indians (like the Chinese) always prosper as a community. Take the case of Uganda’s Indian population, which was expelled by the horrifi c dictator Idi Amin and received into the tolerant society of Britain. There are now more millionaires in this group than in any other recent immigrant community in Britain. They are a striking example of “how far hard work, strong family bonds and a devotion to education can carry a people who have been stripped of all their worldly assets” (Johnson, P. 2004).
Summary
The creation of the SENTIENT Index requires the processing and analysis of a considerable amount of data. As an achievement of this work, the internal correlations of the index have also become clear (Appendix 1), which allows the later “fi ne-tuning” of the index.
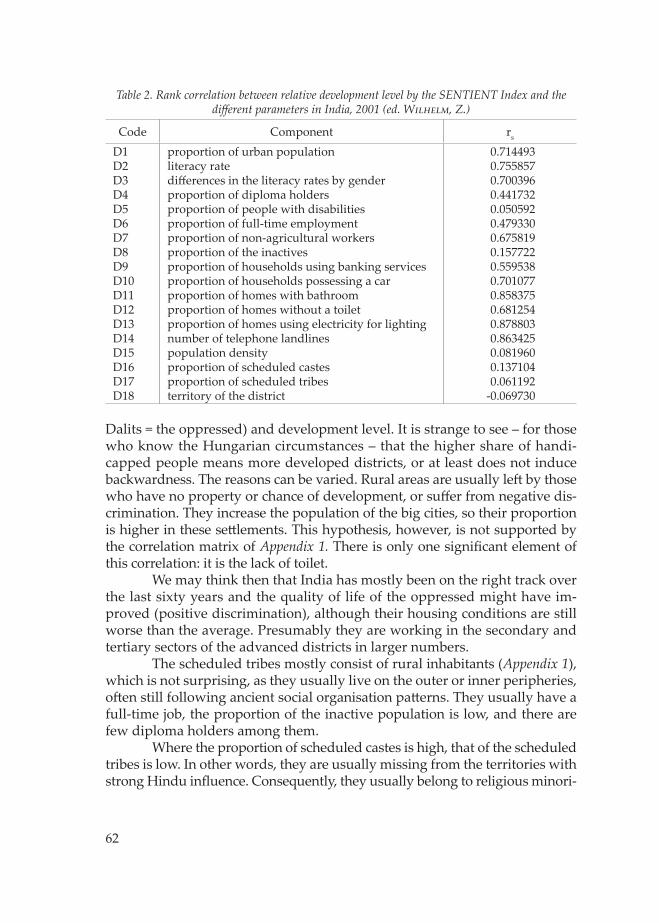
Using rank correlation analyses it was possible to analyse the cor-relations between development level and relative positions (Table 2). Despite the fact that the most accurate measure of development level is the access to those services and comfort amenities in India that are everyday services and amenities in Hungary (use of electricity, bathroom in the fl at, telephone), the proportion of diploma holders is still ranking lower than the acquisition of the very basic skills as a way of climbing up the social hierarchy (Table 2).
We have to pay special att ention to the correlation between the propor-tion of the scheduled castes (handicapped castes = untouchables = Harij ans =
62
Table 2. Rank correlation between relative development level by the SENTIENT Index and the diff erent parameters in India, 2001 (ed. Wilhelm, Z.)
Code Component rs
D1D2D3D4D5D6D7D8D9D10D11D12D13D14D15D16D17D18
proportion of urban populationliteracy ratediff erences in the literacy rates by genderproportion of diploma holdersproportion of people with disabilitiesproportion of full-time employmentproportion of non-agricultural workersproportion of the inactivesproportion of households using banking servicesproportion of households possessing a carproportion of homes with bathroomproportion of homes without a toiletproportion of homes using electricity for lighting number of telephone landlinespopulation densityproportion of scheduled castesproportion of scheduled tribesterritory of the district
0.7144930.7558570.7003960.4417320.0505920.4793300.6758190.1577220.5595380.7010770.8583750.6812540.8788030.8634250.0819600.1371040.061192
-0.069730
Dalits = the oppressed) and development level. It is strange to see – for those who know the Hungarian circumstances – that the higher share of handi-capped people means more developed districts, or at least does not induce backwardness. The reasons can be varied. Rural areas are usually left by those who have no property or chance of development, or suff er from negative dis-crimination. They increase the population of the big cities, so their proportion is higher in these sett lements. This hypothesis, however, is not supported by the correlation matrix of Appendix 1. There is only one signifi cant element of this correlation: it is the lack of toilet.
We may think then that India has mostly been on the right track over the last sixty years and the quality of life of the oppressed might have im-proved (positive discrimination), although their housing conditions are still worse than the average. Presumably they are working in the secondary and tertiary sectors of the advanced districts in larger numbers.
The scheduled tribes mostly consist of rural inhabitants (Appendix 1), which is not surprising, as they usually live on the outer or inner peripheries, oft en still following ancient social organisation patt erns. They usually have a full-time job, the proportion of the inactive population is low, and there are few diploma holders among them.
Where the proportion of scheduled castes is high, that of the scheduled tribes is low. In other words, they are usually missing from the territories with strong Hindu infl uence. Consequently, they usually belong to religious minori-
63
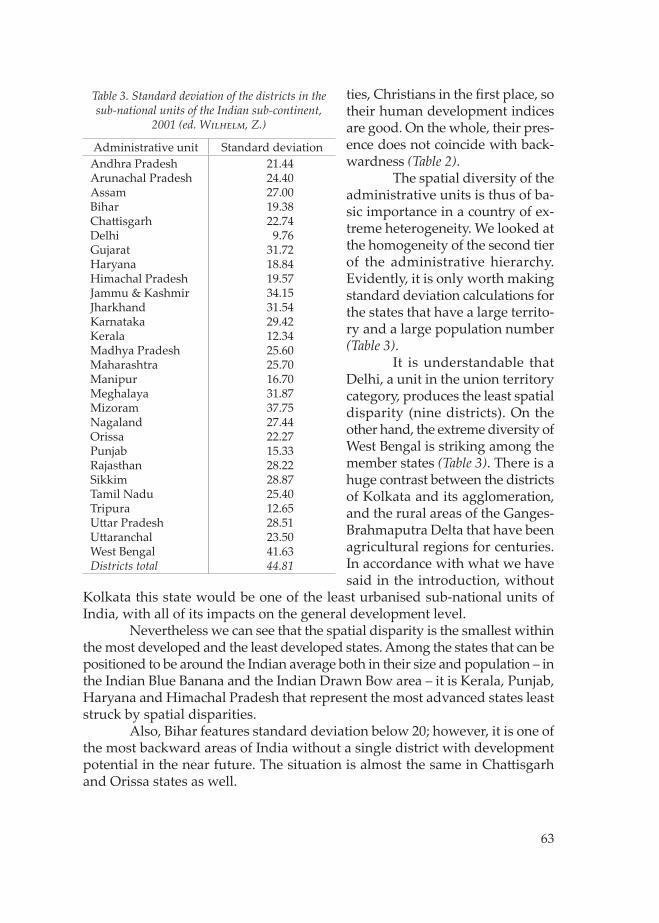
ties, Christians in the fi rst place, so their human development indices are good. On the whole, their pres-ence does not coincide with back-wardness (Table 2).
The spatial diversity of the administrative units is thus of ba-sic importance in a country of ex-treme heterogeneity. We looked at the homogeneity of the second tier of the administrative hierarchy. Evidently, it is only worth making standard deviation calculations for the states that have a large territo-ry and a large population number (Table 3).
It is understandable that Delhi, a unit in the union territory category, produces the least spatial disparity (nine districts). On the other hand, the extreme diversity of West Bengal is striking among the member states (Table 3). There is a huge contrast between the districts of Kolkata and its agglomeration, and the rural areas of the Ganges-Brahmaputra Delta that have been agricultural regions for centuries. In accordance with what we have said in the introduction, without
Kolkata this state would be one of the least urbanised sub-national units of India, with all of its impacts on the general development level.
Nevertheless we can see that the spatial disparity is the smallest within the most developed and the least developed states. Among the states that can be positioned to be around the Indian average both in their size and population – in the Indian Blue Banana and the Indian Drawn Bow area – it is Kerala, Punjab, Haryana and Himachal Pradesh that represent the most advanced states least struck by spatial disparities.
Also, Bihar features standard deviation below 20; however, it is one of the most backward areas of India without a single district with development potential in the near future. The situation is almost the same in Chatt isgarh and Orissa states as well.
Table 3. Standard deviation of the districts in the sub-national units of the Indian sub-continent,
2001 (ed. Wilhelm, Z.)
Administrative unit Standard deviationAndhra PradeshArunachal PradeshAssamBiharChatt isgarhDelhiGujaratHaryanaHimachal PradeshJammu & KashmirJharkhandKarnatakaKeralaMadhya PradeshMaharashtraManipurMeghalayaMizoramNagalandOrissaPunjabRajasthanSikkimTamil NaduTripuraUtt ar PradeshUtt aranchalWest BengalDistricts total
21.4424.4027.0019.3822.749.76
31.7218.8419.5734.1531.5429.4212.3425.6025.7016.7031.8737.7527.4422.2715.3328.2228.8725.4012.6528.5123.5041.6344.81
64
Although the present database created with a painstaking eff ort even in its present form off ers good opportunities for analysis, its continuous up-grade will be endeavoured, since enlarged with data further calculated from other sources it might give us an increasingly accurate picture of the spatial disparity in India.
References
Cseke, L. 2009. Regionális fejlett ségbeli különbségek és urbanizáció Indiában (Regional devel-opment disparities and urbanisation in India). Paper for the National Students Conference. Budapest, Eötvös Loránd University, Faculty of Sciences, Department of Regional Studies, 62 p.
Johnson, P. 2004. Want to Prosper? Then Be Tolerant. Forbes 21. June 2004. htt p://www.forbes.com/forbes/2004/0621/041.html (Last download: 26 February 2009)
Kiss-Csapó, G. 2009. Hogyan vélekednek Ladakhban a modernizációról? Egy interjú-vizs-gálat tanulságai (How do people feel about modernisation in Ladakh? Lessons learnt from an interview survey). Modern Geográfi a 3. pp. 1–26.
Nieuwenhuizen, P. 2006. Street Children in Bangalore. Antwerpen, Het Spinhuis Publishers, 152 p.
Surányi, S. 1978. India gazdasága (The economy of India). Budapest, Közgazdasági és Jogi Könyvkiadó, p. 432 p.
Szegedi, N. and Wilhelm, Z. 2008. Dél-Ázsia társadalomföldrajza (Social geography of South Asia). In Ázsia regionális földrajza Eds. Horváth, G., Probáld, F. and Szabó, P. Budapest, Eötvös Kiadó, 403–562.
Tóth, J. 1981. A településhálózat és a környezet kölcsönhatásának néhány elméleti és gyakorlati kérdése (A few theoretical and practical issues of the correlation of the sett lement network and the environment). Földrajzi Értesítő/Hungarian Geographical Bulletin 30. (2–3): 267–292.
Trócsányi, A. and Wilhelm, Z. 1996. Fejezetek India földrajzából és a fejlődő világ urban-izációs problémái (Chapters from the geography of India and urbanisation problems in the third world). Pécs, Janus Pannonius University, 70 p.
Wilhelm, Z. 2008a. Adatok az indiai urbanizáció folyamatának vizsgálatához (Data for studying the process of urbanisation in India). Modern Geográfi a 2. 49 p.
Wilhelm, Z. 2008b. Sustainable Water Management Methods in India and their Hungarian Expedience. In Global Changes – Vulnerability, Mitigation and Adaptation, Fifth International Conference. Sofi a, Sofi a University, 431–435.
Wilhelm, Z., Pete, and J. Kisgyörgy, P. 2006. Adatok a kasmíri konfl iktus politikai földrajzi elemzéséhez (Data for the political geographical study of the Kashmir confl ict). Földrajzi Értesítő/Hungarian Geographical Bulletin 55. (1–2): 213–237.
Wilhelm, Z., Déri, I., Kisgyörgy, P., Orbán, Zs. and Szilágyi, S. 2009. Hagyományos víz-menedzsment Indiában (Traditional water management in India). In Vízkonfl iktusok – küzdelem egy pohár vízért. Ed. Glied, V. Pécs, Publikon Kiadó, 171–190.
The World’s Worst Polluted Places. The Top Ten of the Dirty Thirty. Blacksmith Institute 2007. htt p://www.blacksmithinstitute.org/wwpp2007/fi nalReport2007.pdf (Last download: 9 December 2009)
www.world-gazett eer.com

65
D1
D2
D3
D4
D5
D6
D7
D8
D9
D10
D11
D12
D13
D14
D15
D16
D1
-0.
5337
95-0
.458
880.
7242
050.
1204
910.
1271
560.
7485
170.
2188
030.
3631
10.
6990
260.
6523
82-0
.508
20.
5718
570.
7588
20.
5697
-0.0
2227
D2
0.53
3795
--0
.833
040.
3263
020.
1019
330.
2362
830.
6288
82-0
.004
540.
4624
570.
4756
710.
5981
45-0
.537
030.
6627
530.
6386
410.
2227
49-0
.027
28D
3-0
.458
88-0
.833
04-
-0.2
5714
-0.0
7638
-0.2
8229
-0.5
6062
-0.0
0925
-0.2
9468
-0.4
2175
-0.5
6349
0.62
6494
-0.5
8805
-0.5
4256
-0.1
7908
0.12
36D
40.
7242
050.
3263
02-0
.257
14-
0.07
1182
-0.0
9087
0.63
3583
0.33
529
0.37
4596
0.76
3307
0.45
5686
-0.4
2172
0.35
571
0.63
0038
0.53
5543
-0.0
0343
D5
0.12
0491
0.10
1933
-0.0
7638
0.07
1182
-0.
0442
80.
1292
71-0
.008
140.
0248
750.
0299
650.
0502
44-0
.018
590.
0937
010.
0800
01-0
.008
14-0
.047
37D
60.
1271
560.
2362
83-0
.282
29-0
.090
870.
0442
8-
-0.0
2855
-0.7
9777
-0.0
3707
0.06
0126
0.25
4392
-0.0
6191
0.46
4146
0.16
9259
-0.0
3019
-0.1
7402
D7
0.74
8517
0.62
8882
-0.5
6062
0.63
3583
0.12
9271
-0.0
2855
-0.
3624
160.
4701
210.
7242
860.
6415
1-0
.679
760.
5289
690.
7978
070.
4574
65-0
.069
87D
80.
2188
03-0
.004
54-0
.009
250.
3352
9-0
.008
14-0
.797
770.
3624
16-
0.18
6809
0.21
7026
0.08
655
-0.2
087
-0.2
2309
0.14
9359
0.21
5175
0.19
3498
D9
0.36
311
0.46
2457
-0.2
9468
0.37
4596
0.02
4875
-0.0
3707
0.47
0121
0.18
6809
-0.
5012
480.
5657
79-0
.264
620.
4529
020.
5940
920.
2069
990.
1520
62D
100.
6990
260.
4756
71-0
.421
750.
7633
070.
0299
650.
0601
260.
7242
860.
2170
260.
5012
48-
0.63
755
-0.5
5311
0.51
808
0.81
015
0.50
0048
-0.0
0652
D11
0.65
2382
0.59
8145
-0.5
6349
0.45
5686
0.05
0244
0.25
4392
0.64
151
0.08
655
0.56
5779
0.63
755
--0
.561
870.
7514
520.
7644
920.
3009
580.
0106
97D
12-0
.508
2-0
.537
030.
6264
94-0
.421
72-0
.018
59-0
.061
91-0
.679
76-0
.208
7-0
.264
62-0
.553
11-0
.561
87-
-0.4
1724
-0.5
773
-0.2
7123
0.29
1546
D13
0.57
1857
0.66
2753
-0.5
8805
0.35
571
0.09
3701
0.46
4146
0.52
8969
-0.2
2309
0.45
2902
0.51
808
0.75
1452
-0.4
1724
-0.
6831
960.
1903
87-0
.034
94D
140.
7588
20.
6386
41-0
.542
560.
6300
380.
0800
010.
1692
590.
7978
070.
1493
590.
5940
920.
8101
50.
7644
92-0
.577
30.
6831
96-
0.50
7047
–0.0
0369
D15
0.56
970.
2227
49-0
.179
080.
5355
43-0
.008
14-0
.030
190.
4574
650.
2151
750.
2069
990.
5000
480.
3009
58-0
.271
230.
1903
870.
5070
47-
0.00
1339
D16
-0.0
2227
-0.0
2728
0.12
36-0
.003
43-0
.047
37-0
.174
02-0
.069
870.
1934
980.
1520
62-0
.006
520.
0106
970.
2915
46-0
.034
94-0
.003
690.
0013
39-
D17
-0.1
9071
-0.1
1766
-0.0
7294
-0.2
5096
-0.0
0574
0.29
0978
-0.2
2593
-0.4
2342
-0.3
0694
-0.1
5659
-0.2
1981
-0.1
2112
-0.0
9608
-0.1
7886
-0.1
4208
-0.6
0886
App
endi
x 1.
Aut
ogen
ous c
orre
latio
n m
atrix
of t
he S
ENTI
ENT
Inde
x, co
mpl
emen
ted
with
two
mor
e ind
ices
(ed.
Wilhelm
, Z.)
D1
= prop
ortio
n of
urb
an pop
ulat
ion
D2
= lit
erac
y rate
D3
= diff e
renc
es in
the lit
erac
y rate
s by
gen
der
D4
= prop
ortio
n of
diplo
ma
hold
ers
D5
= prop
ortio
n of
peo
ple
with
dis
abilitie
sD
6 =
prop
ortio
n of
full-tim
e em
ploy
ment
D7
= prop
ortio
n of
non
-agr
icultu
ral w
orke
rsD
8 =
prop
ortio
n of
the
inactiv
esD
9 =
use of
ban
king
ser
vice
s
D10
= p
ropo
rtion of
hou
seho
lds
pos-
sess
ing
a ca
rD
11 =
bat
hroo
m in
the
hom
eD
12 =
no to
ilet b
elon
gs to
the
hom
eD
13 =
ligh
ting
with
el e
ctri
city
D14
= n
umbe
r of
tele
phon
esD
15=
popu
latio
n de
nsity
D16
= sc
hedu
led
cast
esD
17=
sche
dule
d tr
ibes
66
AVAILABLE!
Ádám Kertész–Zoltán Kovács (eds.):Dimensions and trends in Hungarian geography: Dedicated to the 31st International Geographical Congress,
Tunis, 12–15 August 2008.
Budapest, Geographical Research Institute HAS, 2008. 240 p.
(Studies in Geography in Hungary 33)
Since its fi rst publication in 1964 the series Studies in Geography in Hungary has been the mouthpiece of Hungarian geography towards the inter-national academic world. The 32 volumes that have been published since then reported regulary about the most important results of Hungarian researchers both in the fi eld of physical and human geography. The present 33rd volume of Studies, dedicated to the 31st International Geographical Congress, would like
to follow this long tradition, con-taining sixteen papers writt en by physical and human geographers, covering very diverse scopes. This abundance of topics and geograph-ical scales is meant to demonstrate a wide variety of dimensions and trends that Hungarian geographers have been engaged in over the last few years. The editors and authors hope that readers of this book will fi nd the diff erent chapters relevant and the contributions will stimu-late scientifi c debate.
------------------------------------------Price: HUF 5000 (EUR 18,5)Order: Geographical Research Institute HAS Library H-1554 Budapest, POB. 130. E-mail: [email protected]