the survey of spatial disparity in india with...
TRANSCRIPT

56
Tudományos szakmai, kutatási és ismeretterjesztő közlemények / Scientific Professional, Researcher and Educational Publications
THE SURVEY OF SPATIAL DISPARITY IN INDIA WITH THE APPLICATION OF THE SENTIENT INDEX WITH
SPECIAL FOCUS ON RELIGIOUS COMPOSITION
Zoltán WILHELM1 - József PETE2 – Viktória NEMES3 – Nándor ZAGYI4
Abstract
Most of the articles written on India treat spatial disparity within the country at the level of the member states and union territories which is an imperfect approach. Reality is hidden behind the averages of the extremes. In this study the data of 593 districts of India were elaborated, based on the district level information of the census held in 2001. As a result the districts of India were classified by the relative level of development, using the so-called SENTIENT Index. The index of complex development that we created on the basis of the tetrahedron model sensitively „reacts” to the changes occurring in the geographical environment. It is modified as an effect of the events taking place in the individual spheres, so it can be a tool producing spectacular results of comparative spatial studies. The present paper explores the coherences of the spatial disparity within India and the internal correlations of the state of development or backwardness also become clear. In addition we surveyed the correlations among the proportions of the different religious communities in the districts and the development level shown by the SENTIENT Index.
Keywords: India, districts, spatial disparity, SENTIENT Index, religions in India
Introduction: issues to be discussed
It can be stated with an absolute certainty that India is one of the most diverse countries in the world from human geography aspect. The ethnic, language, religious and caste division of its population all result in heterogeneity practically unmatched in any other country. This is accompanied by the differences of the physical geographical endowments of this huge state: within India one can descend from peaks of the highest mountain of the planet to seaside plains, get from tropical deserts to rain forests. This extreme diversity naturally has led to considerable regional disparity.
Most of the Hungarian language literature written on India look at spatial disparity within India at the level of the states and union territories (CSEKE, L. 2009, SURÁNYI, S. 1978,
1 PhD, Dr. habil.,Head of Dept., Director of the Asia Centre, University of Pécs, Institute of Geography, Hungary;2 Dr.,Geographer, University of Pécs, Institute of Geography, Hungary;3Demonstrator, University of Pécs, Institute of Geography, Hungary;4Geographer, University of Pécs, Institute of Geography, Hungary;
57
SZEGEDI, N.–WILHELM, Z. 2008, TRÓCSÁNYI, A.–WILHELM, Z. 1996), which – although the very analysis itself is a brave deed – is an imperfect approach.
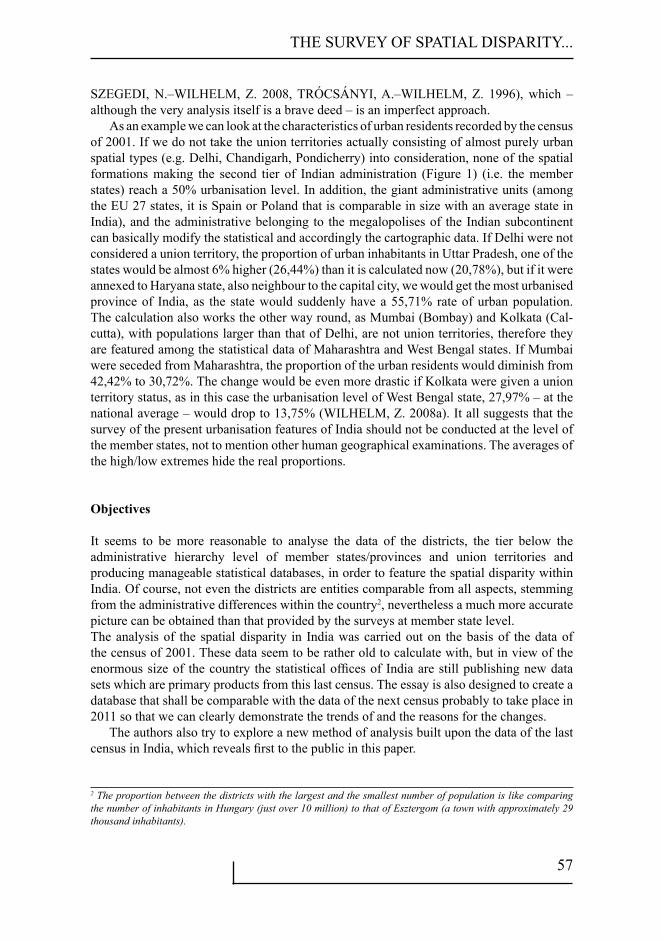
As an example we can look at the characteristics of urban residents recorded by the census of 2001. If we do not take the union territories actually consisting of almost purely urban spatial types (e.g. Delhi, Chandigarh, Pondicherry) into consideration, none of the spatial formations making the second tier of Indian administration (Figure 1) (i.e. the member states) reach a 50% urbanisation level. In addition, the giant administrative units (among the EU 27 states, it is Spain or Poland that is comparable in size with an average state in India), and the administrative belonging to the megalopolises of the Indian subcontinent can basically modify the statistical and accordingly the cartographic data. If Delhi were not considered a union territory, the proportion of urban inhabitants in Uttar Pradesh, one of the states would be almost 6% higher (26,44%) than it is calculated now (20,78%), but if it were annexed to Haryana state, also neighbour to the capital city, we would get the most urbanised province of India, as the state would suddenly have a 55,71% rate of urban population. The calculation also works the other way round, as Mumbai (Bombay) and Kolkata (Cal-cutta), with populations larger than that of Delhi, are not union territories, therefore they are featured among the statistical data of Maharashtra and West Bengal states. If Mumbai were seceded from Maharashtra, the proportion of the urban residents would diminish from 42,42% to 30,72%. The change would be even more drastic if Kolkata were given a union territory status, as in this case the urbanisation level of West Bengal state, 27,97% – at the national average – would drop to 13,75% (WILHELM, Z. 2008a). It all suggests that the survey of the present urbanisation features of India should not be conducted at the level of the member states, not to mention other human geographical examinations. The averages of the high/low extremes hide the real proportions.
Objectives
It seems to be more reasonable to analyse the data of the districts, the tier below the administrative hierarchy level of member states/provinces and union territories and producing manageable statistical databases, in order to feature the spatial disparity within India. Of course, not even the districts are entities comparable from all aspects, stemming from the administrative differences within the country2, nevertheless a much more accurate picture can be obtained than that provided by the surveys at member state level.The analysis of the spatial disparity in India was carried out on the basis of the data of the census of 2001. These data seem to be rather old to calculate with, but in view of the enormous size of the country the statistical offices of India are still publishing new data sets which are primary products from this last census. The essay is also designed to create a database that shall be comparable with the data of the next census probably to take place in 2011 so that we can clearly demonstrate the trends of and the reasons for the changes.
The authors also try to explore a new method of analysis built upon the data of the last census in India, which reveals first to the public in this paper.
2 The proportion between the districts with the largest and the smallest number of population is like comparing the number of inhabitants in Hungary (just over 10 million) to that of Esztergom (a town with approximately 29 thousand inhabitants).
THE SURVEY OF SPATIAL DISPARITY...

58
HUMÁN INNOVÁCIÓS SZEMLE 2011. 1. SZÁM
Fig. 1. Administrative map of India – 1 = Sikkim; 2 = Nagaland; 3 = Manipur; 4 = Mizoram; 5 = Tripura; 6 = Daman & Diu; 7 = Dadra & Nagar Haveli; 8 = Goa; 9 =
Pondicherry

59
Method
The districts of India have been classified by the relative level of development, using the so-called SENTIENT Index. The basis of this method was the tetrahedron model created by TÓTH, J. in 1981. The essence of this model is as follows: a settlement is to be comprehended as a system of economic, social and technical structures in a given geographical environment, and in intensive interaction with the elements of this environment. This concept can be best visualised, assuming the balanced development levels of the respective structure in the optimal case, by a tetrahedron, the foundation of which is the geographical environment, the other three sides are the economic, the social and the technical (infrastructural) spheres. Along the edges, between the respective spheres there are interactions of different intensities, depending on the development level of the structures; a settlement is the complete system of these spheres (and their interactions), which as a single organism is in close interaction with the natural environment. Depending on how complicated these systems are (taking the characteristics of the complete settlement network and the relative differences of the individual elements into consideration), different settlement types can be identified (TÓTH, J. 1981).
We are convinced that the tetrahedron model is not only suitable for the definition of the settlement types; both as theoretical and practical bases it is also an excellent tool for the measurement of the development level of larger units3. For the definition of the qualitative feature of the respective spheres we used statistical data taken from the results of the last census conducted in India. Giving to the temptation of using acronyms so popular in the West, which refer in a simple way to the research method and the results with meaningful words, an acronym was created pointing to both the method that we used and the monitor-ing of the changes in the research area. This acronym is:
SENTIENT Index = Society, Economy, iNfrasTructure, physIcal environmENT.
Synonyms for the word „sentient” are feeling; attentive; aware. The complex development index that we created on the basis of the tetrahedron model sensitively „reacts” to the changes taking place in the geographical environment; it is modified as an effect of the events taking place in the individual spheres, so it can be a tool producing spectacular results of comparative spatial studies.
In the study, data of 593 districts of India were involved, based on the district level data of the census held in 2001. The data were not freely available in electronic version, so we had to read all data, district by district from the Java based GIS maps that were generated on the website of the census of India – with several months’ work – from which we were able to create our own digital database. The same website contains other information as well that is not directly related to the districts (data of the member state and the union territories); these pieces of information can also be used in the future as the basis of further calculations. This time they were neglected and, with the emphasis put on the mathematical-statistical data instead, data series serving as the basis of the complex index were analysed. In order to define the rank by the level of development, with simple relative ranks were involved, using the averages of the positions.
3 The method of spatial analysis based on the tetrahedron model is not a new phenomenon. It was initiated by the research team led by TÓTH, J. in 1995 (the so-called TÁGINTER-analysis), when submitting a proposal for the tender announced for the making of the development concept of Baranya county in Hungary.
THE SURVEY OF SPATIAL DISPARITY...
60
HUMÁN INNOVÁCIÓS SZEMLE 2011. 1. SZÁM
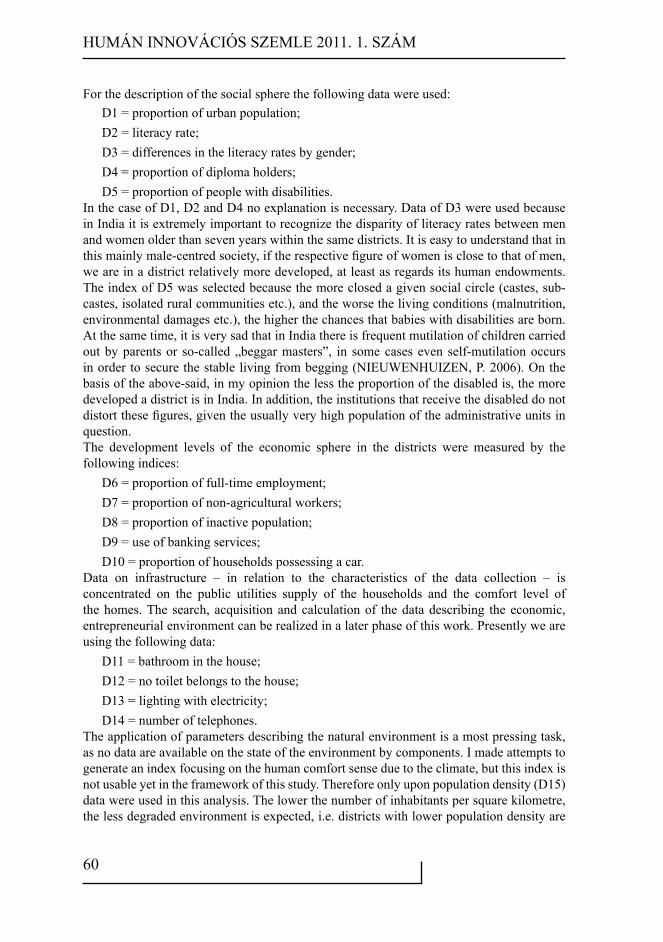
For the description of the social sphere the following data were used:D1 = proportion of urban population;D2 = literacy rate;D3 = differences in the literacy rates by gender;D4 = proportion of diploma holders;D5 = proportion of people with disabilities.
In the case of D1, D2 and D4 no explanation is necessary. Data of D3 were used because in India it is extremely important to recognize the disparity of literacy rates between men and women older than seven years within the same districts. It is easy to understand that in this mainly male-centred society, if the respective figure of women is close to that of men, we are in a district relatively more developed, at least as regards its human endowments. The index of D5 was selected because the more closed a given social circle (castes, sub-castes, isolated rural communities etc.), and the worse the living conditions (malnutrition, environmental damages etc.), the higher the chances that babies with disabilities are born. At the same time, it is very sad that in India there is frequent mutilation of children carried out by parents or so-called „beggar masters”, in some cases even self-mutilation occurs in order to secure the stable living from begging (NIEUWENHUIZEN, P. 2006). On the basis of the above-said, in my opinion the less the proportion of the disabled is, the more developed a district is in India. In addition, the institutions that receive the disabled do not distort these figures, given the usually very high population of the administrative units in question.The development levels of the economic sphere in the districts were measured by the following indices:
D6 = proportion of full-time employment;D7 = proportion of non-agricultural workers;D8 = proportion of inactive population;D9 = use of banking services;D10 = proportion of households possessing a car.
Data on infrastructure – in relation to the characteristics of the data collection – is concentrated on the public utilities supply of the households and the comfort level of the homes. The search, acquisition and calculation of the data describing the economic, entrepreneurial environment can be realized in a later phase of this work. Presently we are using the following data:
D11 = bathroom in the house;D12 = no toilet belongs to the house;D13 = lighting with electricity;D14 = number of telephones.
The application of parameters describing the natural environment is a most pressing task, as no data are available on the state of the environment by components. I made attempts to generate an index focusing on the human comfort sense due to the climate, but this index is not usable yet in the framework of this study. Therefore only upon population density (D15) data were used in this analysis. The lower the number of inhabitants per square kilometre, the less degraded environment is expected, i.e. districts with lower population density are
61
ranked higher in the order. Of course this parameter does not describe the quality of human life adequately, because life is rather harsh e.g. in the Himalaya of Ladakh, in an almost intact natural environment (KISS-CSAPÓ G. 2009).
In addition to the data mentioned above a number of other data were also recorded and used in this essay, such as the population of scheduled castes and tribes, religious breakdown, and the number of inhabitants residing in the most populated settlements of the district. These become interesting when doing the mathematical-statistical calculations, e.g. correlation analyses.
Results
The towns and cities of India were home to almost 28% of the population of the country in 2001. There is a significant disparity at the level of member states and union territories in this respect, but this difference is even more extreme at the level of the districts: in nine districts the whole population is urban, in ten districts all inhabitants are rural dwellers. All of the districts in the first group are incorporated into metropolises or into union territories (Pondicherry). The districts remaining below 10% urbanisation level make an almost contiguous belt in Northeast India, from East Uttar Pradesh via Bihar, Orissa and the northern territories of West Bengal to the Himalaya region and the small northeast states. In addition, there are extended territories with urban void in the Western Himalaya region (Himachal Pradesh, Uttaranchal Jammu & Kashmir).
When looking at the map featuring the districts concentrating urban population above the national average, we can see that „urbanisation axes” are being born in India, mostly linking the metropolises (Figure 2). It is interesting to note that no such axis has emerged so far between Kolkata and Delhi – despite the communication role of the Great Trunk Road –, but such an axis does trend towards the city of Lahore in Pakistan. The urban junction being born on the boundary of Tamil Nadu and Karnataka is also remarkable (Figure 2), which, according to my hypothesis, projects the favourable development of a number of further indices.
If one wishes to use the analogy of generalised graphics solutions applied to visualise some spatial characteristics in the technical literature (e.g. Golden Triangle, Pentagon, Blue Banana etc.), the picture that most precisely depicts the urbanised areas of India (both in quantitative and qualitative aspect) is that of a drawn bow (Figure 2). Let us introduce this discovery of ours to the professional circles under the name ‘Indian Drawn Bow’.
The proportion of literate persons within the population over seven years is 65,38% in India, according to the latest census. If we draw an isopleth map with the district averages, we can see again the axes known from Figure 2, but the districts of the Himalaya and of the small northeast states are also on the map in large number. In the case of the latter the explanation may be the high proportion of Christians, but the districts in the former category have a religious component in the index as well: the Buddhists and the concomitant numerous educated monks may be the reason. At the same time other socio-cultural elements characteristic of the population in the mountain regions also contribute to this parameter considerably.
All over India there are significant differences between the number of literate men and women, because of the social traditions, for the advantage of men. There is only one
THE SURVEY OF SPATIAL DISPARITY...

62
HUMÁN INNOVÁCIÓS SZEMLE 2011. 1. SZÁM
district in India where the literacy rate of women exceeds that of men: this is Jaintia Hills in Meghalaya state. The literacy rates of the genders are almost the same in two other districts of this state, two districts of Kerala and four districts in Mizoram, and also in Mahe located in Pondicherry. There are 2.5 times more men than women who can read and write in the district Supaul in Bihar and in Shrawasti district in Uttar Pradesh. The frontier region to Nepal is one of the most backwards regions of India. The worst figures of the respective in-dex can be found in the districts making an almost contiguous block. South Indian districts can only be seen at a multiplier of 1.8, this is the Mahbubnagar district in Andhra Pradesh, with a considerable Muslim population. No district in Kerala, on the other hand, has an index worse than 1.1.
Fig. 2. Districts with over 30% share of urban population and „urbanisation axes”in India in 2001 – 1 = urban population over 30%; 2 = urban population 30% or below

63
The proportion of diploma holders within the adult population is the highest in big cities with considerable administrative functions. Accordingly, there is a significant deviation on the map featuring this index. Within the age group older than 18 years old the largest number of diploma holders can be found in the district of New Delhi (22,9%), the least diploma holders can be found in the South Garo Hills district of Meghalaya: 0,9% of the population. It is interesting though that this district performs better than 117 other districts when it comes to literacy rate.
When looking at the proportion of those with disabilities within the districts, we find strikingly high figures in some areas with overwhelming of secondary sector. The „most” in this respect is the district of Valsad in Gujarat, with the – hardly believable – figure of 58,77%. Nevertheless this is one of the most polluted areas of the world, around the city of Vapi, a centre of chemical industry, where e.g. in 2007 the mercury concentration of subsoil waters was 96 times higher than the WHO standard .
Among the selected indicators of the economic sector, the rate of full-time employees (with employment for more than six months a year) is high in districts with a strong secondary and tertiary sectors, or where high-quality agricultural production is typical, based on the larger amount of precipitation or irrigation (WILHELM, Z. 2008b). Accordingly, the southern, the Himalayan and the north-eastern states are prominent in this respect. The first position is held by the district of Lahul and Spiti in Himachal Pradesh: 57,8% of the employees of this district have full-time jobs. The last place is occupied by Deoria in Uttar Pradesh with 17,2%.
The share of non-agricultural workers, naturally enough, is the highest in the urbanized areas, and is also outstanding in the areas with strong tertiary sector. According to the data of the census of 2001, there is not a single agricultural employee in the islands of Lakshadweep, famous for their tourism industry. Good positions are held in the order by this index by the districts home to the ancient trading settlements and tourism industry centres in Konkan and on the Malabar Coast. The worst position in this rank is held by the administrative units of the agricultural zones in the large northern states, mainly by those of Bihar, Uttar Pradesh and Chhattisgarh. (The district of Dindori in Madhya Pradesh is ranked last with 9,8%.)
The rate of the inactive persons within the total population tells a lot (especially for the Hungarian readers). If we draw a map of the districts with indices from ⅔ to ¾, the primarily agricultural Hindustan plain, east of the Delhi plateau, grows dark. In the south it is Kerala that has the highest value in this respect, the district of Malappuram with its figure of 75,9% is the record holder in the whole of India. On the other hand it should be mentioned, that in Kerala the higher revenues of the active employees allow a relative well-being for the inactive as well, while the citizens of the northern areas usually live in deep poverty, either with some meagre income from seasonal agricultural work or in a jobless status.
The use of banking services by the respective households depends on the existence of several factors: income, credit standing, adequate infrastructure (telephone or internet) etc. Among these, income is the most important, because nowadays anybody is able to manage their bank affairs from anywhere. Anyway, in areas where a significant share of the people uses banking services are probably areas with advanced business environment.
The number of cars does not only suggest the income positions of the population but also indicates the presence of modern companies, and the existence of the infrastructure background. Accordingly, the big city centres – especially metropolises and the centres of the union territories – have the best positions, together with the districts with advanced
THE SURVEY OF SPATIAL DISPARITY...

64
HUMÁN INNOVÁCIÓS SZEMLE 2011. 1. SZÁM
secondary and tertiary sectors. The districts of Punjab have a strikingly strong representation in this respect. The density however is the highest in the district of West Delhi, where 17% of the households possess cars, while barely 0,3% of all households in Sahibganj district in Jharkhand have this privilege, occupying the last place. The worst positions are almost exclusively held by districts in Bihar, Orissa, Jharkhand and Chhattisgarh. It should be noted that the cars registered in the statistics are not included among the heavy-duty vehicles usually strongly polluting the environment or in the category of two-stroke, two- or three-wheel vehicles that run in large numbers in the big cities of India and have a detrimental effect on air quality in the cities.
Looking at infrastructure (bathroom in the house; no toilet belongs to the home; lighting with electricity; number of telephones), we can only rely on the census data in this case again, given the limits of this essay. Naturally, in further analyses, the infrastructure of communication geography typical of the districts will have to be scrutinized as well.
Even without correlation analysis it is evident that the urbanised areas have the best positions as regards to the infrastructure endowments. The best positions are held by the southern states and Punjab. It is contrasting that while people in 94% of the households in Hyderabad live in flats equipped with a bathroom, in 100 peripheral districts of the country this proportion remains below 10%. The situation is even worse when it comes to the occurrence of toilet in the houses: in the Aizawl district in Mizoram it is only 2,7% of the homes that do not have toilet in the flat, in 172 districts of India this proportion is above 80%. The district in the worst position in this respect is that of Jashpur in Chhattisgarh with 4,7% of the households. It shows that the hygiene trap coming from the lack of communal infrastructure is still a serious problem in India.
It might be sound conspicuous that the use of and the very access to electricity still has to be taken into consideration as one of the measures of the development level in India in the 21st century. It is especially curious if we know that only 3,1% of the homes in the district of Sheohar in Bihar use electricity for lighting. In Lakshadweep, 99,7% of homes are lit with electricity. The low share of the homes using electricity is even more surprising if we consider that the Indian government subsidises that provision considerably (WILHELM, Z. et al. 2009).
India is the second largest mobile telephone user in the world (by the number of telephone sets sold), where cheap and good quality service is provided by a dozen of companies. India has full coverage in this respect. On the other hand, the number of landline phones is still an important development index, because the traditional lines are necessary for several social and economic activities. The number of telephones shows a strong correlation to the proportion of the urban population.
The index of population density is only used as a measure of man induced impacts. It should be acknowledged that low population density in a country otherwise densely populated indicates areas least suitable for the settlement of humans, i.e. it denotes the peripheries. It also has to be added that quasi natural conditions, as components of the sphere giving the foundations of the tetrahedron model, can be found in these areas. However, a sparsely populated area is not necessarily a rural one.
The two extremes can be found in the district of Lahul and Spiti in Himachal Pradesh: 2 persons/km2, and the index of Northeast Delhi: 29.467,5 persons/km2. Low population density is usually a characteristic feature of the Himalayan, the Northeast Indian and the desert districts. The counter-pole is made by the sectors of the megapolises, with their hardly habitable environment.

65
Making an average of the positions occupied on the scale of 593 items, there was an order by the relative development level based on the 15 selected indices. Figure 3 features the first 100 districts marked with red. A red circle, framed black, designates all nine districts of Delhi, as they are in the set concentrating the most advanced one hundred districts. Red quadrangles framed are used to show the union territories while quadrangles without a frame feature the small sized districts mostly belonging to megapolis.
It is clear from the map that the most developed, relatively large and almost contiguous area of India can be found in the southwest, along the Ahmedabad–Mumbai–Goa–Kanniyakumari axis. This means that the industrial regions and traditional ports of the central and southeast territories of Gujarat state, the western edge of Maharashtra, with the financial and commercial centre of India, Mumbai, and its agglomeration, belong to this area. Extending southwards this axis is continued by Goa state, with the highest GDP per capita in India and a “super power” of the tourism industry; several districts of Karnataka, a state famous for its computer software industry, also joins the group of the most advanced districts. It is interesting that Kerala renowned for its human resources (where the literacy rate of males is higher than in Portugal or Malta) is only represented by six districts in this zone. If only the indices of human resources are taken into account, a contiguous zone in the central and southern parts of Tamil Nadu stretches across developed administrative units. The complex index, however, reaches maximum at the district Aizawl, in the centre of Mizoram state. The average value of its positions is 43.6. Its leading position is surprising among other things because this district is home, according to the statistics, to a large proportion of people with disabilities: scheduled castes and, what is more, scheduled tribes. Megapolises are represented by Kolkata, in the second place. Outstanding positions are held by the districts of Delhi and Goa, and by the district with the fourth position in the rank, a new city: Chandigarh. It is absolutely evident that this region of India can be called the Indian Blue Banana, its shape resembles the fruit much more than that of its European counterpart does. In addition, one has to remark, although it has nothing to do with the present analysis, that India is the number one banana producer in the world …
The first 100 districts outside the above-mentioned axis are usually big cities, megapolises and their agglomerations: Delhi, Kolkata, Chennai, and Hyderabad. A different development path is represented by the majority of the rich districts of Punjab (Delhi–Lahore axis), and the developed districts of the smaller northeast states with a substantial Christian population. The inferior performance of the states in the northern Hindi zone that hold the leading role in political life, is striking. There cannot be found among the first 100 districts one single from the states of Rajasthan, Bihar, Chhattisgarh, Jharkhand, Orissa, Uttar Pradesh or Assam. Kolkata from West Bengal, and another unit from Madhya Pradesh are the two districts among the most developed such entities of India (Figure 3).
It comes from this analysis that the least developed districts are situated in the territory of the Ganges plain, in the first place. Drawing – with blue – the last one hundred districts on a map (Figure 3), we actually get a contiguous block of backward districts. This region of India is the Aryan/Hindu core, which is also the cradle of the Hindu civilisation. This religion led by the (Brahman) caste of the priests is the stronghold of rural life, and anti-urban feelings. Religious reform movements have been organised against this, the ones now known and Buddhism and Jainism (WILHELM, Z. 2008a). These movements, however, could become successful in urban environment. In the region of the Ganges Plain, a region with excellent agricultural endowments but burdened with religious ties, the socio-economic system has naturally remained rural.
THE SURVEY OF SPATIAL DISPARITY...

66
HUMÁN INNOVÁCIÓS SZEMLE 2011. 1. SZÁM
Fig. 3. The hundred most developed and the hundred least developed districts in India by the SENTIENT Index, 2001 – legend in the text
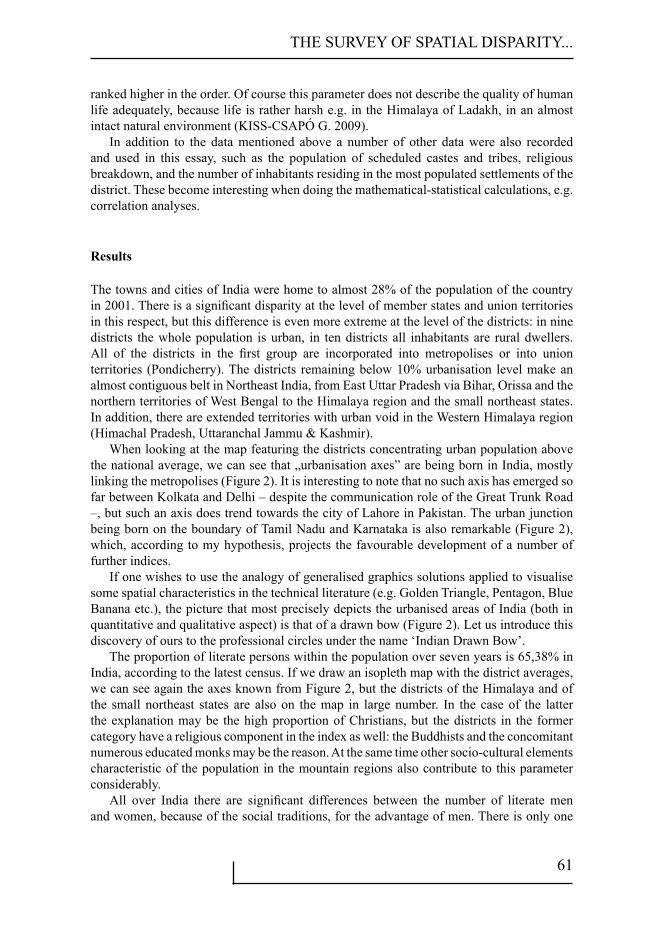
This way a characteristic South-North dichotomy has emerged in India, the opposite of what is typical in the „developed” world, as in India it is usually the North that is backward and the south that is developed. In addition we can also witness a West-East opposite, but this one is functioning „normally”. If we compare the averages of the geographical coordinates of the most populated settlements in the hundred most developed districts (using World Gazetteer and Google Earth) to those of the least developed districts, the statement made above is verified (Figure 4). The centre of development moves towards southwest, the cent-re of backwardness towards northeast (Figure 4). We have to remark that the focus of the most developed districts can be found in the middle of the country, as these districts are located scattered on the map, as opposed to the block of the backward districts. We have to realise, however, that coming from the shape of the country („narrower” south), the more

67
advanced districts closer to the Equator have to have an overweight so that the development pole of India can be found in the central part of the country.
It is worth looking at the „movement” of the focal points of the categories made from the 593 districts on the basis of their development level, where the first group consists of 98 elements, all others have 99 elements (Figure 4.). The first two groups are relatively close to each other. The reason for this is that the bulk of the districts making group 2 can be lin-ked to the southern regions. The elements of the next group are also more connected to the South, but the focal point is moving towards the eastern territories. The focal points of the remaining groups are evidently moving towards northeast.
Without giving lengthy details of our statistical analyses, it is worth taking a look at the correlations of religion and development level, extremely important in India. We surveyed the correlations among the proportions of the different religious communities in the districts and the development level shown by the SENTIENT Index.
Religions and the socio-economic system
The religious action – regarding its origin – worldly designated, and economically significant (WEBER, M. 2005). According to the – probably astonishing – statement mentioned above, the connections between them can be the following:
(1) The endowments and challenges of the socio-economic situation may play a decisive, crucial role on religious behaviour, act and form, and especially on its organizational differentiation. In economic sense, for instance crisis periods favour for the emerge of religious sects and movements, as these states and situations highly devaluate „entrance frees” (HÁMORI B. 1998). It can also be settled, that the division of labour, the economic growth and the distribution of excess goods made it possible for ’religious specialists’ to separate (TOMKA M. n.d.). Contrarily with economic growth the offerings for religious purposes decrease.
(2) Religious culture represents norms, aims, values and prohibitions, thus regulating/controlling the way of social and with it the economic acting, the mood of work, the usage of work results and social division. It follows that religions have a great influence on the rate of economic growth. Mainly in the aspect of the personal attitude to savings, use of technologies, the scope of duties in labour market, but also in the education of children and in many other relations (RINSCHEDE, G. 1999).
In other sense the different relief organizations of religions tries to help deflate/reduce poverty, rather than to spread faith, so this way they contribute to the growth of economy (RINSCHEDE, G. 1999). Max Weber (1905) noticed a relation between protestant/evangelical ethics and capitalism. There are some counter-example as well because Weber highlighted the negative aspect of eastern/oriental religions on economic development. In some parts of Myanmar, 30% of the income is used for the provisioning of monks and churches and to cover the expenses of feasts. For numerous catholic and Muslim communities the building of a church or mosque means a great financial strain, while in a Theravada-Buddhist or Lamaist communities most of the man decide to join monasticism for months or even for a lifetime. Their labour force falls out and their supply places a great burden on society (RINSCHEDE, G. 1999). The costs of certain religious and burying rituals are also judged negatively (GARDNER, G. 2010).
But the economic importance of the different denominations/sects can alter depending on the territory/region where they are revealing. In Italy Catholicism deputizes conservative
THE SURVEY OF SPATIAL DISPARITY...

68
HUMÁN INNOVÁCIÓS SZEMLE 2011. 1. SZÁM
policy, while in Brazil a revolutionary point of view. Buddhism in Japan plays a major role in economic decision-making, while in Sri Lanka there is a tight connection between underdevelopment and Buddhism (RINSCHEDE, G. 1999).
(3) The religious organization itself is the active participant of the economy too (TOMKA M. n.d.). These two, latter mentioned aspects are going to be explained in detail hereinafter. Arisen from the different cultic beliefs, culinary regulations and prohibitions of religions, various agricultural methods were evolved (Hin-du, Muslim, Hebrew culinary regulations, prohibitions). Malaysia can be a good example of these. At the beginning Malay people mainly produced and raised rice and coconuts, and employed contractual Indian and Chinese people on rubber tree plantations. Chinese brought with themselves the practice of pig husbandry and vegetable culture whereas, Indians involved milk production through cattle and goat husbandry (BAJMÓCY P. 2004b).
Algeria – once being one of the biggest wine producer and exporter in the world- faced serious economical and financial problems after achieving independence. In 1962 the country-inasmuch as Islamic state religion had conflicts with it- pursuant to religious formulas/regulations prohibited alcohol consumption, thus ruining Algerian wine production (RINSCHEDE, G. 1999).
The most conspicuous coherency of religion/al-geography is the impact on the different branches of industry. Churches- as procurers – come into contact with economy through building-, printing-, devotional article and gift industry. However, the religious connections of metalworking, silk-and rug/carpet weaving should not be neglected. In the market of devotional articles, jewels and clothes the need for luxury works should be taken into account.
We can find several examples for the affection of some economical activities to religions, nationalities in the tertiary sector. The typical trading nations of Asia were the Hebrews, Armenians and Chinese. They often become the source of tensions because of their special place, position within the host nations. At the same time, in mixed-religious areas e.g.: in parts of Mumbai with different religions, the shops are closed on differing days (STODDARD, R. H. et al 1986). In the multiethnic and religious Singapore the tourist agencies popularize all churches/monuments of the different religions (RINSCHEDE, G. 1999).
Ethnic and religious relations also played a role in the improvement of transport networks. In the construction of the Russian broad-gauge railway – besides isolationist and strategic considerations- the ideology of the Eastern Church state-religion played a great part. Church interests also led to the construction of connections and passes across the Alps (ERDŐSI F. 2004).
Maybe the most prevalent and general (economically considerable) feature in connection with sects – belonging to the tertiary sector- is its institute maintaining role. In the United States the second largest institute to offer social aids, after the federal administration, is the Catholic Church (GARDNER, G. 2003). In addition to these, its sanitary, educational, cultural (museums) services are also considerable, as well as its role in mass media, which should not be neglected.
Religious pattern and the state of development in India
In India, the majority of the inhabitants are believers of two large religions: they are Hindus or Muslim (Table 1.). The political division of South Asia in 1947 and way of the accession of the ducal states also took place on the basis of religious considerations. This was
69
Fig. 4. “Migration” of the focal points of population in the districts of India, by the six categories created with the use of the SENTIENT Index, 2001
followed by the largest involuntary migration process of the world so far, with massacres (WILHELM, Z. – PETE, J. – KISGYÖRGY, P. 2006). The situation has considerably changed since then.
THE SURVEY OF SPATIAL DISPARITY...
70
HUMÁN INNOVÁCIÓS SZEMLE 2011. 1. SZÁM
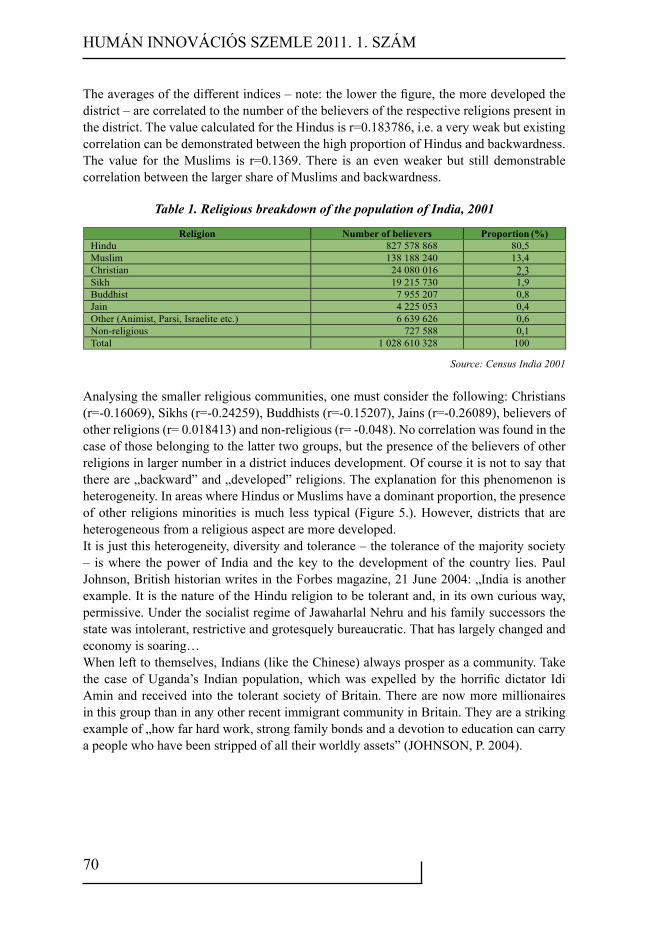
The averages of the different indices – note: the lower the figure, the more developed the district – are correlated to the number of the believers of the respective religions present in the district. The value calculated for the Hindus is r=0.183786, i.e. a very weak but existing correlation can be demonstrated between the high proportion of Hindus and backwardness. The value for the Muslims is r=0.1369. There is an even weaker but still demonstrable correlation between the larger share of Muslims and backwardness.
Table 1. Religious breakdown of the population of India, 2001
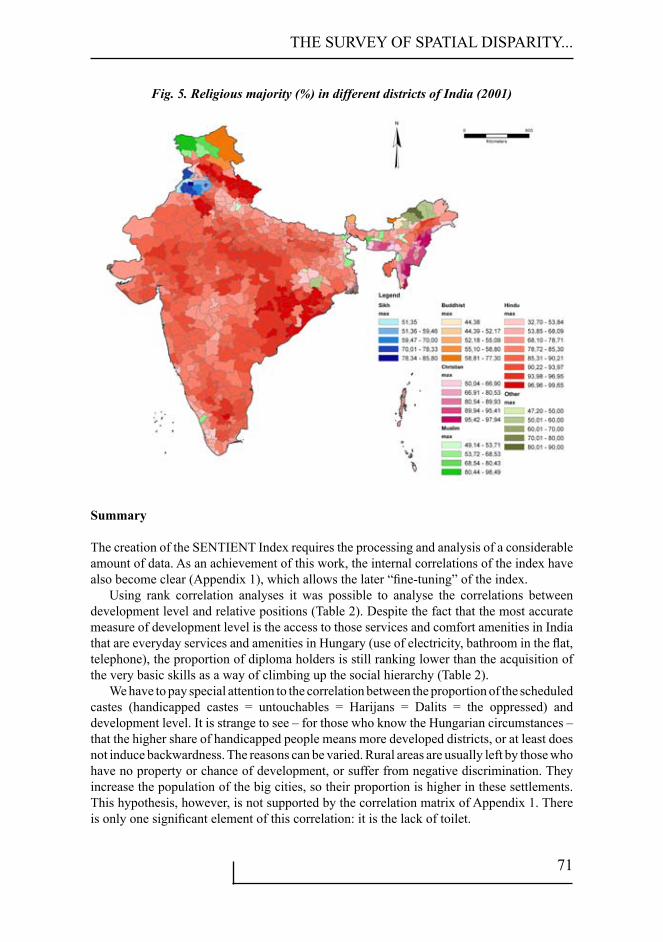
Source: Census India 2001 Analysing the smaller religious communities, one must consider the following: Christians (r=-0.16069), Sikhs (r=-0.24259), Buddhists (r=-0.15207), Jains (r=-0.26089), believers of other religions (r= 0.018413) and non-religious (r= -0.048). No correlation was found in the case of those belonging to the latter two groups, but the presence of the believers of other religions in larger number in a district induces development. Of course it is not to say that there are „backward” and „developed” religions. The explanation for this phenomenon is heterogeneity. In areas where Hindus or Muslims have a dominant proportion, the presence of other religions minorities is much less typical (Figure 5.). However, districts that are heterogeneous from a religious aspect are more developed.It is just this heterogeneity, diversity and tolerance – the tolerance of the majority society – is where the power of India and the key to the development of the country lies. Paul Johnson, British historian writes in the Forbes magazine, 21 June 2004: „India is another example. It is the nature of the Hindu religion to be tolerant and, in its own curious way, permissive. Under the socialist regime of Jawaharlal Nehru and his family successors the state was intolerant, restrictive and grotesquely bureaucratic. That has largely changed and economy is soaring… When left to themselves, Indians (like the Chinese) always prosper as a community. Take the case of Uganda’s Indian population, which was expelled by the horrific dictator Idi Amin and received into the tolerant society of Britain. There are now more millionaires in this group than in any other recent immigrant community in Britain. They are a striking example of „how far hard work, strong family bonds and a devotion to education can carry a people who have been stripped of all their worldly assets” (JOHNSON, P. 2004).
71
Fig. 5. Religious majority (%) in different districts of India (2001)
Summary
The creation of the SENTIENT Index requires the processing and analysis of a considerable amount of data. As an achievement of this work, the internal correlations of the index have also become clear (Appendix 1), which allows the later “fine-tuning” of the index.
Using rank correlation analyses it was possible to analyse the correlations between development level and relative positions (Table 2). Despite the fact that the most accurate measure of development level is the access to those services and comfort amenities in India that are everyday services and amenities in Hungary (use of electricity, bathroom in the flat, telephone), the proportion of diploma holders is still ranking lower than the acquisition of the very basic skills as a way of climbing up the social hierarchy (Table 2).
We have to pay special attention to the correlation between the proportion of the scheduled castes (handicapped castes = untouchables = Harijans = Dalits = the oppressed) and development level. It is strange to see – for those who know the Hungarian circumstances – that the higher share of handicapped people means more developed districts, or at least does not induce backwardness. The reasons can be varied. Rural areas are usually left by those who have no property or chance of development, or suffer from negative discrimination. They increase the population of the big cities, so their proportion is higher in these settlements. This hypothesis, however, is not supported by the correlation matrix of Appendix 1. There is only one significant element of this correlation: it is the lack of toilet.
THE SURVEY OF SPATIAL DISPARITY...

72
HUMÁN INNOVÁCIÓS SZEMLE 2011. 1. SZÁM
We may think then that India has mostly been on the right track over the last sixty years and the quality of life of the oppressed might have improved (positive discrimination), although their housing conditions are still worse than the average. Presumably they are working in the secondary and tertiary sectors of the advanced districts in larger numbers.
The scheduled tribes mostly consist of rural inhabitants (Appendix 1), which is not surprising, as they usually live on the outer or inner peripheries, often still following ancient social organisation patterns. They usually have a full-time job, the proportion of the inactive population is low, and there are few diploma holders among them. Where the proportion of scheduled castes is high, that of the scheduled tribes is low. In other words, they are usually missing from the territories with strong Hindu influence. Consequently, they usually belong to religious minorities, Christians in the first place, so their human development indices are good. On the whole, their presence does not coincide with backwardness (Table 2).
Table 2. Rank correlation between relative development level by the SENTIENT Index and the different parameters in India, 2001 (ed. WILHELM, Z.)
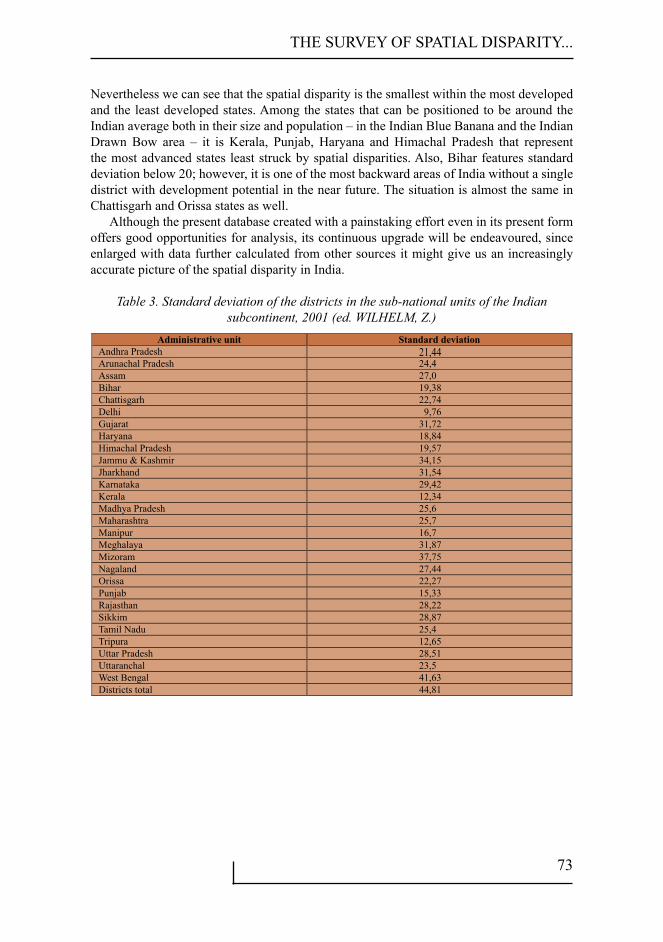
The spatial diversity of the administrative units is thus of basic importance in a country of extreme heterogeneity. We looked at the homogeneity of the second tier of the administrative hierarchy. Evidently, it is only worth making standard deviation calculations for the states that have a large territory and a large population number (Table 3).
It is understandable that Delhi, a unit in the union territory category, produces the least spatial disparity (nine districts). On the other hand, the extreme diversity of West Bengal is striking among the member states (Table 3). There is a huge contrast between the districts of Kolkata and its agglomeration, and the rural areas of the Ganges-Brahmaputra Delta that have been agricultural regions for centuries. In accordance with what we have said in the introduction, without Kolkata this state would be one of the least urbanised sub-national units of India, with all of its impacts on the general development level.
73
Nevertheless we can see that the spatial disparity is the smallest within the most developed and the least developed states. Among the states that can be positioned to be around the Indian average both in their size and population – in the Indian Blue Banana and the Indian Drawn Bow area – it is Kerala, Punjab, Haryana and Himachal Pradesh that represent the most advanced states least struck by spatial disparities. Also, Bihar features standard deviation below 20; however, it is one of the most backward areas of India without a single district with development potential in the near future. The situation is almost the same in Chattisgarh and Orissa states as well.
Although the present database created with a painstaking effort even in its present form offers good opportunities for analysis, its continuous upgrade will be endeavoured, since enlarged with data further calculated from other sources it might give us an increasingly accurate picture of the spatial disparity in India.
Table 3. Standard deviation of the districts in the sub-national units of the Indiansubcontinent, 2001 (ed. WILHELM, Z.)
THE SURVEY OF SPATIAL DISPARITY...
74
HUMÁN INNOVÁCIÓS SZEMLE 2011. 1. SZÁM
References
CSEKE, L. 2009: Regionális fejlettségbeli különbségek és urbanizáció Indiában (Regional development disparities and urbanisation in India). Paper for the National Students Conference, Eötvös Loránd University, Faculty of Sciences, Department of Regional Studies , Budapest, p. 62.ERDŐSI, F. 2004: Európa közlekedése és a regionális fejlődés. Dialóg Campus Kiadó, Budapest – Pécs, 640 p.GARDNER, G. 2003: A vallás szerepe a fenntartható világ építésében. In: A világ helyzete 2003. Föld Napja Alapítvány, pp. 203-231.GARDNER, G. 2010: Egyházak bevonása a világszemlélet alakításába. In: A világ helyzete 2010. Föld Napja Alapítvány, Budapest, pp. 45-53.HÁMORI B. 1998: Érzelemgazdaságtan. A közgazdasági elemzés kiterjesztése. Kossuth Kiadó, Budapest, 221 p.JOHNSON, P. 2004: Want to Prosper? Then Be Tolerant. Forbes, 21 June 2004. http://www.forbes.com/forbes/2004/0621/041.html (Last download: 26 February 2009)KISS-CSAPÓ, G. 2009: Hogyan vélekednek Ladakhban a modernizációról? Egy interjú-vizsgálat tanulságai (How do people feel about modernisation in Ladakh? Lessons learnt from an interview survey). – Modern Geográfia 2009/3., pp. 1-26.NIEUWENHUIZEN, P. 2006: Street Children in Bangalore. Het Spinhuis Publishers, Ant-werpen, p. 152.RINSCHEDE, G. 1999: Religionsgeographie. Das Geographische Seminar. Westermann Schulbuchverlag GmbH, Braunschweig, 272 p.SURÁNYI, S. 1978: India gazdasága (The economy of India). Közgazdasági és Jogi Könyvkiadó, Budapest, p. 432.STODDARD, R. H. – WISHART, D. J. – BLOUET, B. W. 1986: Human Geography: People, Places and Cultures. Prentice Hall, Englewood Cliffs, New Jersey, 200 p SZEGEDI, N. – WILHELM, Z. 2008: Dél-Ázsia társadalomföldrajza (Social geography of South Asia). In: Horváth, G. – Probáld, F. – Szabó, P. eds.: Ázsia regionális földrajza (Regional geography of Asia), Eötvös Kiadó, Budapest, pp. 403-562.TOMKA M. n.d.: Vallásszociológia. http://www.phil-inst.hu/uniworld/vt/szoc/tomka_1.htm#IV.1 (Last access: 17/07/2007)TÓTH, J. 1981: A településhálózat és a környezet kölcsönhatásának néhány elméleti és gyakorlati kérdése (A few theoretical and practical issues of the correlation of the settlement network and the environment). – Földrajzi Értesítő Vol. XXX. No. 2-3., pp. 267¬¬¬-292.TRÓCSÁNYI, A. – WILHELM, Z. 1996: Fejezetek India földrajzából és a fejlődő világ urbanizációs problémái (Chapters from the geography of India and urbanisation problems in the third world). JPTE, Pécs, p. 70.WEBER, M. 2005/1920-21: Vallásszociológia. A vallási közösségek típusai. Helikon, 367 p.WILHELM, Z. 2008a: Adatok az indiai urbanizáció folyamatának vizsgálatához (Data for studying the process of urbanisation in India). – Modern Geográfia 2008/2., p. 49.WILHELM, Z. 2008b: Sustainable Water Management Methods in India and their Hungarian Expedience. In: Global Changes – Vulnerability, Mitigation and Adaptation, Fifth International Conference. Sofia University, Sofia, pp. 431-435.
75
WILHELM, Z. – PETE J. – KISGYÖRGY, P. 2006: Adatok a kasmíri konfliktus politikai földrajzi elemzéséhez (Data for the political geographical study of the Kashmir conflict). – Földrajzi Értesítő Vol. LV. No. 1-2., pp. 213-237.WILHELM, Z. – DÉRI, I. – KISGYÖRGY, P. – ORBÁN, ZS. – SZILÁGYI, S. 2009: Hagyományos vízmenedzsment Indiában (Traditional water management in India). In: Víz-konfliktusok – küzdelem egy pohár vízért (Water conflicts – fight for a glass of water). Publikon Kiadó, Pécs, pp. 171-190.The World’s Worst Polluted Places. The Top Ten of the Dirty Thirty. Blacksmith Institute 2007. http://www.blacksmithinstitute.org/wwpp2007/finalReport2007.pdf (Last download: 9 December 2009)www.world-gazetteer.com
THE SURVEY OF SPATIAL DISPARITY...
76
HUMÁN INNOVÁCIÓS SZEMLE 2011. 1. SZÁM
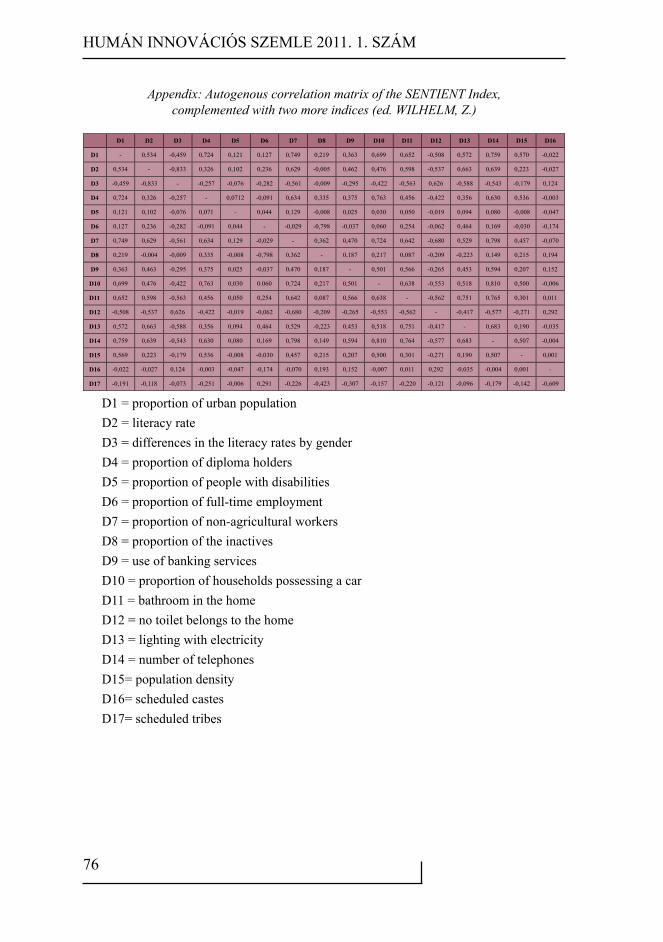
Appendix: Autogenous correlation matrix of the SENTIENT Index, complemented with two more indices (ed. WILHELM, Z.)
D1 = proportion of urban populationD2 = literacy rateD3 = differences in the literacy rates by genderD4 = proportion of diploma holdersD5 = proportion of people with disabilitiesD6 = proportion of full-time employmentD7 = proportion of non-agricultural workersD8 = proportion of the inactivesD9 = use of banking servicesD10 = proportion of households possessing a carD11 = bathroom in the homeD12 = no toilet belongs to the homeD13 = lighting with electricityD14 = number of telephonesD15= population densityD16= scheduled castesD17= scheduled tribes

77
Tudományos szakmai, kutatási és ismeretterjesztő közlemények / Scientific Professional, Researcher and Educational Publications
TERÜLETI KÜLÖNBSÉGEK VIZSGÁLATA INDIÁBAN, KÜLÖNÖS TEKINTETTEL A VALLÁSI ÖSSZETÉTELRE
WILHELM Zoltán1 –PETE József2 – NEMES Viktória3 – ZAGYI Nándor4
Összefoglaló
Az Indiáról közölt tudományos írások döntő többsége a tagállamok és szövetségi területek szintjén vizsgálja az ország területi különbségeit, mely sokszor nem ad megfelelő ered-ményt. Mivel India tagállamainak legnagyobbjai óriási népességgel rendelkeznek – Uttar Pradesh egymaga 200 millió ember lakhelye –, a hatalmas számok átlagértékei elfedik a lényeget.
Megfelelőbbnek tűnik, a még kezelhető statisztikai állományokat produkáló, a tagál-lamok/tartományok és szövetségi területek adminisztratív hierarchiaszintjét követő kör-zetek (districts) adatait elemezni, ezzel láttatni az indiai területi különbségeket. Az indi-ai területi különbségek elemzését a 2001-es népszámlálás adataira alapozva végeztük el. Ezekre támaszkodni meglehetősen idejétmúltnak tűnhet, de tekintettel az ország gigantikus méreteire, az indiai statisztikai hivatalok folyamatosan tesznek közzé új adathalmazokat, melyek a 2001-es cenzus primer produktumai. Munkánkkal szándékunkban áll egy olyan adatbázist létrehozni, mely összevethető a következő, 2011-es, népszámlálás mutatóival is, így világosan láttathatjuk majd a változások irányait, illetve okait.
Célunk volt továbbá feltárni egy új, a legutóbbi indiai népszámlálás adataira épülő elemzési módszert. Jelen munkánk eredményeként az ország körzeteit relatív fejlettségüket tükröző sorba rendeztük a SENTIENT Index segítségével. A módszer kiindulási alapját a TÓTH J. által alkotott tetraéder-modell nyújtotta. E szerint: a települést egy adott földrajzi környezetben, annak elemeivel intenzív kölcsönhatásban élő gazdasági, társadalmi és mű-szaki struktúrák rendszereként értelmezzük. Ez a felfogás az egyes struktúrák harmonikus fejlettségét feltételező optimális esetben leginkább egy tetraéderrel tehető szemléletessé, amelynek alapja a földrajzi környezet, három másik lapja pedig a gazdasági, a társadalmi és a műszaki (infrastrukturális) szféra. Az élek mentén, az egyes szférák között a struktúrák fejlettségétől függő erősségű kölcsönhatás van; a település e szférák (és kölcsönhatásaik) együttes rendszere, amely szféránként és egységes organizmusként szoros kölcsönhatásban van a természeti környezettel. E rendszerek bonyolultsági szintje szerint különíthetők el (az adott terület egész településállománya sajátosságainak és az egyes elemek viszonylagos különbségeinek figyelembevételével) a különböző településtípusok (TÓTH J. 1981).1PhD, Dr. habil., tanszékvezető egyetemi docens, az Ázsia Központ igazgatója: Pécsi Tudományegyetem Földraj-zi Intézet, Magyarország;2Dr., geográfus: Pécsi Tudományegyetem Földrajzi Intézet, Magyarország;3Demonstrátor: Pécsi Tudományegyetem Földrajzi Intézet, Magyarország;4Geográfus: Pécsi Tudományegyetem Földrajzi Intézet, Magyarország;
78
HUMÁN INNOVÁCIÓS SZEMLE 2011. 1. SZÁM
Meggyőződésünk szerint a tetraéder-modell nem kizárólag a településtípusok meghatáro-zására alkalmas, hanem mint elméleti-gyakorlati bázis, nagyobb területi egységek fejlett-ségének mérésére is kiválóan használható. Az egyes szférák kvalitatív jegyeinek megha-tározására statisztikai adatokat használtunk, a legutóbbi indiai népszámlálás eredményeit alapul véve. Engedve a Nyugaton oly’ divatos, a kutatási módszerre, illetve az eredmények-re egyszerűen utaló, de mégis értelmes mozaikszavak dömpingjének, mi is megalkottuk a metodikára és a vizsgálati terület változásainak követésére mutató mozaikszavunkat:
SENTIENT Index = Society, Economy, iNfrasTructure, physIcal environmENT
Az angol „sentient” szó jelentése: érző, érzékeny. Az általunk szerkesztett, tetraéder-model-len alapuló komplex fejlettségi mutató, a földrajzi környezetben végbemenő változásokra érzékenyen „reagál”, az egyes szférákban bekövetkező események hatására módosul, így a területi komparatív vizsgálatok szemléletes eredményeket produkáló eszköze lehet.A körzetek relatív fejlettségi sorrendjének számítását követően, több matematikai-statiszti-kai módszerrel, számos összefüggésre hívtuk fel a figyelmet. Jóval pontosabb képet rajzol-hattunk így a tagállamok közötti területi különbségek egyszerű vizsgálatánál. Munkánkkal mindemellett kimutattuk, hogy India azon körzetei, ahol vallási szempontból (is) heterogén a népesség, fejlettebbek.
Kulcsszavak: India, körzetek, területi különbségek, SENTIENT Index, indiai vallások
79
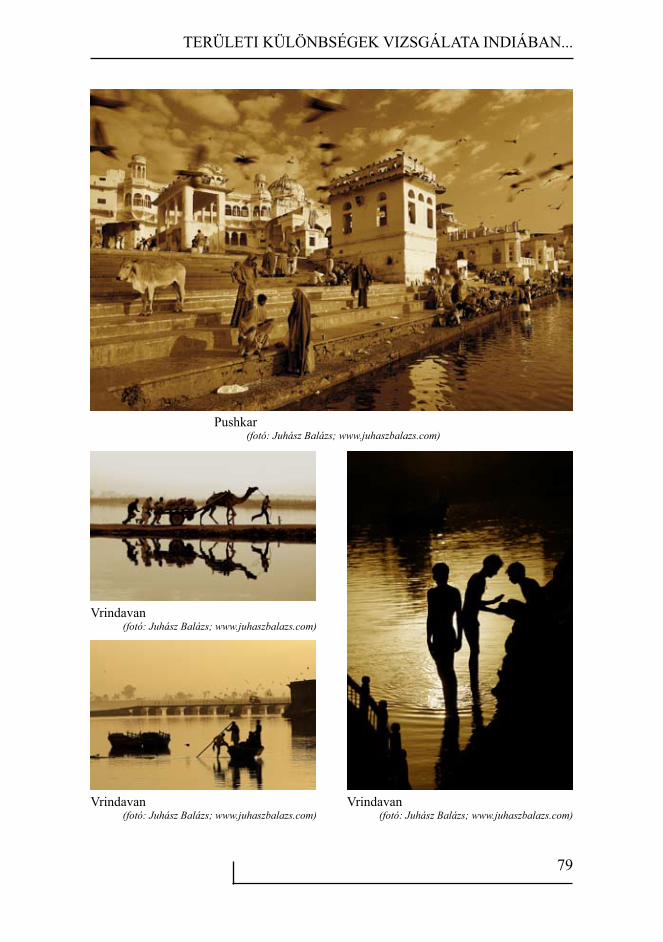
Pushkar(fotó: Juhász Balázs; www.juhaszbalazs.com)
Vrindavan(fotó: Juhász Balázs; www.juhaszbalazs.com)
Vrindavan(fotó: Juhász Balázs; www.juhaszbalazs.com)
Vrindavan(fotó: Juhász Balázs; www.juhaszbalazs.com)
TERÜLETI KÜLÖNBSÉGEK VIZSGÁLATA INDIÁBAN...