the survey of income and program participation … · 2015-12-08 · experience poverty from month...
TRANSCRIPT

THE SURVEY OF INCOME AND PROGRAM PARTICIPATION
Measuring Single-Year Poverty Transitions:
Opportunities and Limitations
No. 271 Ashley Edwards U.S. Census Bureau
U.S. Department of Commerce U.S. CENSUS BUREAU

Measuring Single-Year Poverty Transitions:
Opportunities and Limitations
Ashley Edwards
U.S. Census Bureau
1
SEHSD Working Paper Number FY2015-19
Prepared for the 2015 Federal Committee on Statistical Methodology Conference
December 2, 2015
Abstract
Over the period from 2009 to 2012, the median length of a poverty spell was 6.2 months. While longitudinal data
over multiple years has the benefit of capturing a greater number of poverty spells and reducing the proportion of
spells affected by left or right-censoring, researchers and policymakers must wait years for data to be released, and
the impact of sharp swings in the economy is masked over extended periods.
The biggest limitation in providing single-year estimates of poverty spell dynamics relates to issues of spell capture
and censoring. As researchers shorten the observation period, they capture fewer poverty spells and a greater
proportion of spells are unable to be assigned “true” start and end dates as spells begin prior to the start of the
observation period or continue beyond the end of the observation period.
Analysis within single calendar years from 2009 to 2012 captures approximately 20 to 35 percent fewer spells when
compared to the 4-year period, and left-censoring increases by approximately 240 to 265 percent. Further, the
traditional practice of dropping left-censored poverty spells from duration estimates introduces an unexplored
amount of bias, as approximately 55 to 60 percent of observed spells are excluded due to left-censoring.
This research presents estimates of single-year poverty dynamics across various demographic groups over the period
2009 to 2012. Findings suggest that small differences in medians across calendar years combined with relatively
high standard errors limit the conclusions that can be drawn by comparing year-to-year changes. Additionally, while
the characteristics of left-censored spells captured within a single calendar year are comparable with left-censored
spells observed over the 4-year period, the increased capture of left-censored spells within single calendar years
leads to greater bias when excluding left-censored spells, and often prohibits the assignment of median spell
durations.
Keywords: SIPP, Poverty, Spells, Measurement, Transitions, Left-Censoring, Calendar-Year
1 This report is released to inform interested parties of ongoing research and to encourage discussion of work in progress. The
views expressed on methodological or operational issues are those of the author and are not necessarily those of the U.S.
Census Bureau. Any error or omissions are the sole responsibility of the author. All data are subject to error arising from a
variety of sources, including sampling error, non-sampling error, model error, and any other sources of error. For further
information on SIPP statistical standards and accuracy, see http://www.census.gov/programs-surveys/sipp/tech-
documentation/source-accuracy-statements/source-accuracy-statements-2008.html.

1
Background
Measuring the incidence and severity of poverty is often presented and understood by the public through the use of
static measures based on cross-sectional survey data, whereby respondents are surveyed at a single point in time and
report their incomes for the previous 12 months or calendar year. Data from U.S. Census Bureau surveys such as the
Current Population Survey (CPS) and American Community Survey (ACS) provide authoritative measures on the
number of individuals experiencing poverty based on family income over a 12-month period, as well as the depth of
poverty as measured through families annual income-to-poverty ratio deficit. These cross-sectional surveys allow
policymakers to review year-to-year changes in poverty rates and severity for given geographies or demographic
groups.
These annual poverty measures from the CPS and ACS are supplemented by understanding how individuals
experience poverty from month to month over the course of a calendar year (CY) or longer. In some cases, families
may experience poverty briefly, for a few months of the CY, although their annual income places them above their
annual poverty threshold. Alternatively, some families experience chronic poverty, persisting in every month of the
CY. The repeated collection of data over an extended period, available as a monthly longitudinal series through the
U.S. Census Bureau’s Survey of Income and Program Participation (SIPP), supplements policymakers’
understanding of how different groups experience poverty, and their relative difficulty escaping poverty once they
have entered.
Official Census Bureau SIPP reports contain a wealth of information on the dynamics of poverty across years and by
detailed demographic groups. However, unlike estimates from the CPS or ACS, poverty estimates from the SIPP
have not historically been released at consistent annual intervals. This is due to a number of factors, primarily the
alternative data collection methodology used in the SIPP, as well as a preference among researchers to observe
poverty transitions across successive years, which necessitates biennial or triennial releases.
The most recent Census Bureau SIPP poverty report (P70-137) covers the 3-year period from 2009 to 2011, and was
released in January 2014 (Edwards 2014). This lag between data collection and release was up to 5 years for
estimates in CY 2009. Even if Census researchers preferred to release stand-alone annual estimates for CY 2009,
this would have required the collection, editing, review, and public release of 4 individual SIPP interviews, referred
to as “waves,” as well as the creation and release of the CY 2009 replicate weight file, which was not available until
June of 2011.
However, new changes in the 2014 SIPP Panel data collection methodology will alter the interview reference period,
changing the interview schedule from every 4 months to a single annual interview referencing the full CY. Since
each wave of the 2014 SIPP Panel will reference an entire CY, analysts will no longer need to combine multiple
waves to create CY estimates, and CY replicate weights will be released at the same time as the edited data. Initial
plans for public use data releases from the 2014 SIPP Panel call for publishing topical briefs to coincide with data
releases. These briefs would be less comprehensive than official P-70 series reports, but would summarize major
statistics of interest based on the wavely CY file releases.
This has prompted research into how estimates of poverty dynamics might be calculated at an annual level in order
to provide faster reporting and facilitate more timely policy interventions related to promoting poverty exits among
at-risk populations. While there are a number of statistics that are traditionally included in official SIPP reports, this
research focuses on the calculation of annual estimates of median poverty spell durations. Knowing how many
months individuals are likely to remain in poverty once they enter is a valuable metric for designing policy
interventions, and this measure reflects the unique value of the SIPP’s longitudinal design.
Estimates of median poverty spell length are regularly included in official Census Bureau releases, and similar
estimates are often calculated and cited by outside researchers using both the SIPP as well as alternate longitudinal
surveys such as the Panel Study of Income Dynamics (PSID). Estimates of median poverty spell durations have
been included in official SIPP poverty reports since 1990. However, these estimates have always been based on a
multi-year reference period, 2 years (P70-55, P70-63), 3 years (P70-42, P70-123, P70-137), or 4 years (P70-91).

2
Although estimates of median poverty spell length have never been produced annually, other estimates related to the
dynamics of poverty have been calculated for overlapping annual and multi-year periods, and illustrate that the
reference period (the time period examined) makes a difference both in the calculation and interpretation of the
estimate. For example, SIPP reports also estimate the number of individuals who experience poverty for at least 2
consecutive months over a reference period, i.e., have at least one poverty spell. Estimates of this “episodic” poverty
rate over the 4-year period from 2009 to 2012 are higher than annual episodic poverty rates for CYs within the same
period. The episodic poverty rate over the 4-year period from 2009 to 2012 is 34.5 percent, compared to annual rates
of 23.0 percent in 2009, 23.2 percent in 2010, 23.8 percent in 2011 and 23.1 percent in 2012.2,3
Alternatively,
measures of chronic poverty, those in poverty every month of a reference period, are lower when calculated over
multi-year periods than for a single CY within the same reference period. The 4-year chronic poverty rate from 2009
to 2012 is 2.7 percent, while the rate in 2009 is 7.2 percent, 8.1 percent in 2010, 8.3 percent in 2011, and 8.4 percent
in 2012.2,4
Similar considerations emerge when calculating single-year estimates of poverty spell length. By shortening the
reference period, the likelihood of observing poverty spells decreases, and those that are observed span a greater
proportion of the reference period, leading to increased concerns related to censored spell start and end months. This
research explores to what extent those issues emerge, and how estimates of median poverty spell length are
impacted by comparing annual estimates from CYs 2009, 2010, 2011, and 2012 to estimates spanning the entire 4-
year period.
It’s important to note that the estimates of median poverty spell length presented here are unrelated to the reporting
of the official poverty rate. The Office of Management and Budget (OMB) does not mandate the reporting of
median poverty spell durations, and no federal or state funding is allocated based on this measure. However, the
measure does serve as a valuable resource to members of the academic and policy community, and this research is
rooted in efforts to better serve those populations by providing routine and comparable year-to-year estimates that
allow for valid statistical comparisons of the changing economic environment. While this research makes
comparisons across 4-year and single-year estimates to evaluate differences across the two measures, annual
estimates of median poverty spell length are not intended to be comparable with historic estimates based on multi-
year periods. The expectation going into this research is that single-year spell duration estimates would constitute a
separate data series that would correspond with the release of the 2014 SIPP Panel data.
Literature
Previous research has highlighted the need to supplement cross-sectional surveys with longitudinal data in order to
understand the dynamic nature of poverty. As suggested by Bane and Ellwood (1986), measuring the “persistence”
of poverty via spell durations allows policymakers to understand the long-term nature of poverty as well as better
capture the incidence of short poverty spells, which are underrepresented in cross-sectional poverty estimates. In
their seminal paper, Bane and Ellwood (1986) find that while many people enter poverty for a brief period,
individuals who are in the midst of long poverty spells account for the majority of the individuals found to be in
poverty at a given point in time, causing cross-sectional poverty estimates to over-represent the chronically poor
while failing to capture the characteristics of the episodically poor.
By using longitudinal data, most commonly referenced through the Panel Study of Income Dynamics (PSID), the
Survey of Income and Program Participation (SIPP), and the National Longitudinal Survey of Youth (NLSY),
researchers are able to supplement cross-sectional estimates of poverty with analysis related to the dynamics of
poverty, often measured through spell entry and exit probabilities as well as durations (Cellini, McKernan, and
Ratcliffe 2008).
2 Note: Panel and yearly estimates are based on different samples. The 4-year panel estimates include only respondents in the
panel for 48 months whereas CY estimates include respondents in sample for 12 months. The numbers of respondents in each
sample are as follows: 41,858 in the 4-year panel, 73,695 in 2009, 67,452 in 2010, 64,691 in 2011, and 60,893 in 2012. 3 The only statistical difference in episodic poverty rates across CYs is for 2009 (23.0 percent) and 2011 (23.8 percent). 4 The chronic poverty rate in 2009 (7.3 percent) is lower than the rate in 2010 (8.1 percent), 2011 (8.3 percent), and 2012 (8.4
percent). There is no statistical difference in chronic poverty rates in 2010, 2011, or 2012.

3
Researchers have used a variety of methods to measure poverty entries, exits, and durations, with the method often
depending on the data source and whether data is published at an annual or monthly level (McKernan and Ratcliffe
2005). Interviews for the PSID are conducted biannually5 and poverty status is assigned based on annual family
income, while the NLSY is conducted annually with measures of poverty similarly based on annual family income.
Alternatively, SIPP interviews are conducted every 4 months, and poverty status is assigned at the monthly level.
Even as the 2014 SIPP Panel is redesigned to alter the interview schedule from every 4 months to an annual
interview, data will continue to be collected at the monthly level allowing for the assignment of monthly poverty
status.6
Both the choice of survey and level of reporting have significant implications for the measurement of poverty
dynamics. As summarized in “Measuring Poverty: A New Approach” (1995) research using annual data from the
PSID (Duncan, Smeeding and Rodgers 1992) produce longer spell durations than estimates based on monthly data
from the SIPP (Ruggles 1988) as the monthly reporting in the SIPP allows for the capture of intra-year poverty
spells. Additionally, estimates derived from SIPP data further vary based on the length of reference period used,
with shorter reference periods leading to higher poverty rates (David and Fitzgerald, 1987; Engel 1989; Lerman and
Yitzhaki, 1989) and a reduced capture of short spells of poverty (Ruggles 1988).
In their review of the academic literature on longitudinal measurement of poverty transitions and durations, Cellini,
McKernan, and Ratcliffe (2008) summarize the datasets and reference periods used in a number of research studies.
However, for each study included in their literature review, the reference period covered at least a 2-year period,
even when researchers used data from the SIPP which provided monthly poverty estimates. While a number of
studies have examined the dynamics of poverty over a multi-year period, and how those estimates vary from annual
poverty rates, this research contributes to the literature by utilizing SIPP monthly poverty data to evaluate the
feasibility of measuring poverty dynamics within a single CY, and evaluates how those estimates vary from multi-
year estimates of spell durations.
This research also contributes to the existing poverty dynamics literature by paying particular attention to the issue
and implications of censoring. As the reference period is shortened to a single CY, observed poverty spells extend
for a longer proportion of the reference period, and therefore a greater proportion of poverty spells are underway in
the first calendar month or continue through the last calendar month. If researchers are unable to observe a poverty
entry during the reference period, it is impossible to know how long a poverty spell was underway before the
individual is observed in the survey. These poverty spells that are underway at the beginning of the observation
period are referred to as “left-censored,” as the start date of the spell is truncated to an unknown degree by the
limited observation period of the survey. Alternatively, poverty spells that continue through the end of the
observation period, in this case December of the CY, are referred to as “right-censored” as the observed spell length
is similarly truncated to an unknown extent, as a true exit is not observed within the observation period.
The censoring of poverty spells is described by Iceland (1997) as one of the most serious and persistent
methodological challenges in measuring poverty dynamics. Because the correct identification of transitions into and
out of a poverty spell are critical to measuring spell durations, estimates of spell length are dependent on both the
degree to which the observed spells are censored, as well as how those censored cases are handled when calculating
durations.
There is general agreement among researchers that the consequences of right-censored cases may be more easily
dismissed. As discussed by Iceland (1997) the application of statistical techniques related to survival analysis and
lifetable methods provide generally accepted controls for right-censored cases and allow for the estimation of spell
length with reasonable and generally agreed upon assumptions. However, there remains a lack of consensus on how
to handle left-censored spells. As Iceland (1997) summarizes, the most common methods for dealing with left-
censored spells are often unsatisfying at best, and at worst can lead to known selection bias.
One approach has been to apply sophisticated models to estimate durations for left-censored spells based on
assumptions about transition probabilities applied outside the observation period. However, the probability of
5 Prior to 1999 the PSID conducted annual interviews. 6 For more information on the 2014 SIPP redesign, see http://www.census.gov/programs-surveys/sipp/about/re-engineered-
sipp.html

4
entering or exiting poverty is known to fluctuate based on the very variable attempting to be calculated, the length of
time an individual is in poverty. Previous research from Bane and Ellwood (1986), Stevens (1994), Duncan,
Smeeding and Rodgers (1988), and Iceland (1996) have shown that the hazard rate for transitioning out of poverty is
not constant, and that exit probabilities decline as spells progress.
Iceland (1997) illustrates that the most common method for handling left-censored cases, simply discarding them
from the sample, leads to estimates that underestimate spell duration, as left-censored spells are more likely to
include individuals in long-term poverty. More importantly, discarding left-censored poverty spells
disproportionately omits spells from more disadvantaged demographic groups, such as individuals who are Black,
younger, less educated, female, or in families headed by a single individual, leading to known selection bias. As
Iceland (1997) observes, the issue of underestimating spell duration is a concern even when including left-censored
poverty spells, as their true durations are known to be longer than observed within the survey.
Despite the implications of simply discarding left-censored spells, much of the most eminent research on poverty
spells has excluded left-censored spells. (Bane and Ellwood,1986, 1994; Stevens, 1994) Similarly, the Census
Bureau has historically excluded left-censored spells when producing reports of median poverty spell length.
However, analysts typically produce estimates both including and excluding left-censored spells in order to provide
some context on the impact that excluding left-censored spells has on the published estimates.
Although Iceland (1997) recognizes that ignoring left-censored cases is a common practice when producing
estimates of spell durations, and that this practice introduces known bias on estimates of spell duration, there has
been little discussion regarding the extent to which this methodology may be considered reasonable.
Conceivably, there is a finite limit to the practice of simply excluding left-censored cases to produce estimates of
spell durations. Obviously if all spells are left-censored, estimates can not be produced under this methodology.
However, there has been limited discussion as to where the threshold for using this methodology lies. Recent Census
Bureau reports have produced estimates of median spell length over the period from 2009 to 2012 where 28.4
percent of observed spells are excluded due to left-censoring, and estimates covering 2005 to 2007 where 29.5
percent of spells a excluded (Edwards 2014).
By shortening the reference period to a single year, this research will confront the issue of left-censoring to a greater
extent than estimates derived from a multi-year reference period. As such, this research hopes to initiate a discussion
as to where the boundary may exist for when the practice of simply excluding left-censored spells becomes
unfeasible, as opposed to simply ill-advised.
Data
The data for this research come from the 2008 Panel of the Survey of Income and Program Participation (SIPP). The
SIPP is a longitudinal nationally representative household survey conducted by the U.S. Census Bureau, and is
unique in providing data on household composition and income at a monthly level. Prior to the 2014 SIPP redesign,
SIPP interviews were conducted at 4-month intervals over the course of a panel, with panels typically lasting from 3
to 4 years.
The 2008 SIPP Panel reference period spans May 2008 to November 2013.7 The 2008 SIPP Panel is the most recent
panel for which data is currently available. The 2014 SIPP Panel, which will cover the reference period of January
2013 to December 2016, is currently in the field. The first 2 waves of data are in processing and not yet released to
the public. The 2014 SIPP Panel will be the first production SIPP Panel to reflect the redesigned SIPP survey
methodology, most notable for the change to an annual interview schedule.8 This research utilizes data collected in
the 2008 SIPP Panel to evaluate the feasibility of creating annual measures of median poverty spell length in the
2014 SIPP Panel. As such, this research is limited to CYs with complete coverage in the 2008 SIPP Panel, CYs
2009 to 2012.
7 There were 52,000 eligible household in sample in Wave 1 and 42,000 were interviewed. For more information on the SIPP, see
http://www.census.gov/programs-surveys/sipp/tech-documentation/source-accuracy-statements.html. 8 For more information on the 2014 SIPP redesign, see http://www.census.gov/programs-surveys/sipp/about/re-engineered-
sipp.html

5
Each SIPP Panel sample is initially based on a representative sample of households. All individuals usually residing
in the sampled household are interviewed in Wave 1, and become SIPP sample members. Subsequent SIPP
interviewers return to the sampled household and re-interview original sample members, as well as anyone who may
have joined their household, such as a new spouse or child. If original sample members move from the original
household, field interviewers obtain their new address and the original sample member as well as any new
household members are interviewed at the new address. If all original SIPP sample members relocate from the
original sample household, the new occupants of the address are not included in the sample. New household
members become part of the SIPP sample as long as they are residing in the same household as an original sample
member.9
Although the SIPP sample allows individuals to transition in and out of sample based on their residency, deriving
estimates of annual and multi-year poverty spell durations requires respondents to have a valid interview in each
month of the reference period. Therefore, the universe for estimates in CYs 2009, 2010, 2011, and 2012 is limited to
respondents with a valid interview in each of the 12 months of a given CY while estimates spanning 2009 to 2012
are limited to respondents with a valid interview in all 48 months of the period.10
Methods
The Census Bureau defines a poverty spell as a period of 2 or more consecutive months in poverty, with multiple
poverty spells separated by 2 or more months not in poverty, permitting individuals to record multiple poverty spells
over a reference period.11
Therefore, the minimum length of a poverty spell is 2 months, while annual estimates may
have a maximum spell length of 12 months and 4-year estimates may have a maximum spell length of 48 months.
As individuals may experience more than a single poverty spell over the reference period, this research will present
both person and spell level estimates, depending on the measure of interest.
This research uses the official OMB poverty definition. Monthly poverty thresholds are based on family
composition in the reference month, with the corresponding annual threshold divided by 12 and adjusted using the
Consumer Price Index (CPI) in the reference month. Therefore, monthly poverty status reflects monthly changes in
both family composition and income over the reference period.12
A poverty spell is defined as left-censored if it is
observed in month 1 of the reference period, and is considered right-censored if it continues through the last month
of the reference period.
To understand the implications of shortening the reference period on the capture of poverty spells, this research
compares the percent of individuals with an observed poverty spell, as well as the frequency of spells captured per
person across single and multi-year reference periods. Descriptive analysis is similarly used to evaluate observed
poverty spell durations as a proportion of the reference period as well as the percent of spells that are left or right-
censored within the reference period. This research also looks at correlation between censoring rates and spell
durations to investigate the differential impact of left-censoring across disadvantaged demographic groups.
When calculating median poverty spell durations, alternate measures exclude and include left- censored cases.
Differences when excluding versus including left-censored spells are compared across annual and 4-year estimates
to evaluate the extent that the increased presence of left-censored spells leads to greater underestimation of durations
when dropping those cases to calculate annual medians. Right-censored spells are included in all calculations. The
methodology used to calculate median spell length in this research is consistent with official Census Bureau reports.
Using SAS software, the nonparametric life-table method produces estimates of median spell length, by grouping
spell observations into single month intervals.
9 For more information on the SIPP sample or survey design, see http://www.census.gov/programs-
surveys/sipp/methodology.html. 10 The unweighted number of respondents in each sample are as follows: 41,858 in the 4-year panel, 73,695 in 2009, 67,452 in
2010, 64,691 in 2011, and 60,893 in 2012. 11 Periods of poverty separated by only one month are considered a single poverty spell, and the single month out of poverty is
included when measuring the spell duration. 12 For more information on how the Census Bureau measures poverty, see
http://www.census.gov/hhes/www/poverty/about/overview/measure.html.

6
By flagging right-censored spells, and applying the life-table method, right-censored spells are controlled for in the
calculation of effective interval sample sizes. As discussed by Allison (2010), right-censoring is presumed to be
“non-informative.” If all spell observations are at risk of being censored over a consistent period, which is satisfied
in this case, the fact that a spell is censored in a given month does not provide any insight as to the risk of exiting
poverty in that month. (Allison 2010)
The life-table method assumes that right-censored spells are censored at the midpoint of the interval 𝑖, in this case
defined as monthly, and therefore only one-half of right-censored cases contribute to calculating the number at risk
of exiting poverty in a given month. Therefore, the effective sample size in a given month (Equation 1) is equal to
the effective sample size of the previous month, minus 1) those spells with an observed exit from poverty in the
previous month, 2) half of the right-censored poverty spells from the previous month, and 3) half of the right-
censored poverty spells from the current month.
𝑛′𝑖 = 𝑛′𝑖−1 − 𝑑𝑖−1 − 1
2𝑤𝑖−1 −
1
2 𝑤𝑖 (1)
In Equation 1, 𝑑 is the number of observed exits from poverty and 𝑤 is the number of censored spell exits.
Alternatively, the unadjusted sample size can be expressed in Equation 2 as the number of individuals entering the
interval, unadjusted for those right-censored within the interval.
𝑛𝑖 = 𝑛′𝑖−1 − 𝑑𝑖−1 − 1
2𝑤𝑖−1 (2)
The conditional probability of exiting a poverty spell in interval 𝑖 is defined in Equation 3 as the number of exits in
the interval divided by the effective sample size.
�̂�𝑖 =𝑑𝑖
𝑛′𝑖
(3)
The survival rate in month 𝑡 (i.e., the probability a poverty spell will continue to month 𝑡 or beyond) is defined in
Equation 4 below as the dependent probability of surviving in all prior intervals before 𝑡.
�̂�(𝑡𝑖) = ∏(1 −
𝑖−1
𝑗=1
�̂�𝑗) (4)
The likelihood of a poverty exit occurring at some period within a month, conditional on the spell lasting to the
beginning of that month, is referred to as the hazard rate. The hazard rate is calculated at the midpoint of a given
interval denoted as 𝑡𝑚𝑖 and defined in Equation 5 below.
ℎ̂(𝑡𝑚𝑖) =𝑑𝑖
𝑏𝑖(𝑛𝑖 −𝑤𝑖2 −
𝑑𝑖2 )
(5)
As defined in Equation 5, 𝑏𝑖 is the length of the interval, in this case one month. Life-table estimates of median spell
length are interpreted as the median residual life at interval 0, providing the estimated median number of months an
individual is expected to remain in poverty at the time a spell begins (month 0). The calculation of median spell
length is defined in Equation 6.
�̂�𝑖 = 𝑡𝑖 +�̂�(𝑡𝑖) −
12
�̂�(𝑡𝑖) − �̂�(𝑡𝑖+1) (6)
The median �̂�𝑖 is assigned where �̂�(𝑡𝑖) is greater than or equal to 50 percent and �̂�(𝑡𝑖+1) is less than 50 percent. If
there is no interval with a survival rate (�̂�𝑡) less than 50 percent, the median survival time at interval 0 cannot be

7
determined. In these cases, fewer than half of poverty spells are predicted to end by the close of the observation
period. (Zhang 1993; Allison 2010)
To determine where the threshold might lie for producing annual estimates of median poverty spell length, this
research uses simple logit and ordinary least squares (OLS) regressions to model both the ability to produce an
estimate of annual median spell length, as well as the variation in estimates when including versus excluding left-
censored cases. Since median spell lengths are calculated across demographic groups, logit and OLS regressions are
not run at the individual or spell level, but are instead modeled across the 44 population groups for which estimates
are typically calculated in Census Bureau P70 report series (see Table 4). Therefore, the probability of producing an
estimate for a given population may be modeled on the censoring rate or 4-year median spell duration as measured
across all individuals included in that demographic group for a given estimate.
For all estimates in this research, standard errors are calculated with replicate weights. Estimates of median spell
length as well as differences across medians apply a grouping factor when calculating standard errors to account for
the fact that individuals may experience more than one poverty spell. Standard errors for these estimates are inflated
by an additional factor √𝑔, where 𝑔 is defined in Equation 7 below. In Equation 7, 𝑛 represents the number of
individuals with at least one spell, and 𝑚𝑖 is the number of spells experienced an individual (𝑖) during the reference
period.13
𝑔 =∑ 𝑚𝑖
2𝑛𝑖=1
∑ 𝑚𝑖𝑛𝑖=1
(7)
When reporting spell medians or differences across medians, estimates are suppressed if the standard error is greater
than 30 percent of the estimate. Statistical comparisons are based on t-tests using a 90 percent confidence threshold
unless otherwise stated. Using a 90 percent threshold for statistical confidence guarantees a relative standard error
(RSE) of less than 61 percent, therefore in some cases estimates may be statistically significant, but remain
suppressed due to a RSE between 30 and 61 percent.
Findings
Spell Capture
As previously discussed, researchers are more likely to observe poverty spells over longer reference periods.
(Ruggles 1988) Consistent with past Census Bureau releases, the episodic poverty rate, defined as the percent of
individuals who experience at least a single spell of poverty lasting 2 or more months, is approximately 11
percentage points higher when measured over the 4-year period from 2009 to 2012 than when measured in any of
the individual CYs over that period (see Table 1). However, because of differences in the universe criteria for CY
and 4-year estimates, the unweighted number of individuals experiencing at least a single poverty spell is higher in
the CY estimates.14
Year-to-year changes in the episodic poverty rate from 2009 to 2012 are not significant,
although the episodic poverty rate in 2009 (23.0 percent) is lower than the rate in 2011 (23.8 percent).
Additionally, the experiences of individuals observed experiencing poverty over the course of a single CY vary from
those observed experiencing poverty over the 4-year period, as observation over a single year provides less
opportunity for individuals to both exit as well as re-enter poverty. Although the unweighted number of individuals
experiencing poverty is higher in the CY estimates, the unweighted number of observed CY poverty spells is
approximately 20 to 35 percent lower due to the reduced capture of multiple poverty spells (see Table 1).
Previous research has shown that shorter reference periods lead to higher measures of chronic poverty, defined as
individuals who experience a single spell of poverty that spans the entire reference period (Edwards 2014). Of
13 For further information on SIPP statistical standards and accuracy, see http://www.census.gov/programs-surveys/sipp/tech-
documentation/source-accuracy-statements/source-accuracy-statements-2008.html. 14 The four-year panel estimates include respondents in the panel for 48 months whereas calendar year estimates include
respondents in sample for 12 months. The numbers of respondents in each sample are as follows: 41,858 in the four-year
panel, 73,695 in 2009, 67,452 in 2010, 64,691 in 2011, and 60,893 in 2012.
8
poverty spells observed over the 4-year period from 2009 to 2012, 5.3 percent lasted the entire 48-month reference
period, and 15.0 percent of poverty spells continued for over half the reference period (over 24 months).15
When
shortening the reference period to a single year, chronic poverty increases sharply, with approximately one-third of
poverty spells lasting the entire 12-month reference period and approximately half of observed spells lasting for the
majority of the reference period (over 6 months) (see Table 2).
Of individuals experiencing poverty over the 4-year period from 2009 to 2012, nearly half of those individuals (45.5
percent) experienced multiple poverty spells. Given that poverty spells are defined as a period of 2 consecutive
months in poverty separated by 2 consecutive months out of poverty, it is possible for an individual to record a
maximum of 12 distinct poverty spells over a 48-month period. From 2009 to 2012, a maximum of 8 spells are
observed, and only 5.0 percent of ever-poor individuals experience more than 3 distinct poverty spells. By
shortening the reference period to a single CY, it is possible for individuals to experience a maximum of 3 poverty
spells, and in each of the CYs from 2009 to 2012 the maximum is observed. However, approximately 90 percent of
individuals who experience poverty within a CY experience only a single spell within the year (see Table 1).
Given that poverty spells observed within a single CY are more likely to be an individuals only spell over the period,
the calculation and interpretation of median spell length varies from 4-year estimates. Previous research has shown
that spell durations for individuals with many repeated poverty spells, are by definition constrained to be shorter
than poverty spells for individuals experiencing fewer poverty exits and re-entries (Edwards 2015). Therefore, spells
measured within a single CY might be expected to be longer than those measured over an extended reference period
because the estimate may fail to capture the high frequency short spells that shorten median spell lengths when
doing calculations over a multi-year reference period. However, the interpretation of median spell length also
changes based on the reduced probability that an individual experiencing poverty will go on to experience a
secondary spell within the reference period. Given the expectation that that this measure is more fully capturing the
only poverty spell an individual will experience, the interpretation may shift to regard longer durations less severely
in this context.
Considerations related to poverty spell capture raise important conceptual questions when measuring poverty spells
within a single CY. Given that fewer spells are captured, and the majority of individuals experience only a single,
prolonged poverty spell, estimates based on a single-year reference period are not comparable with those based on
longer multi-year reference periods. Additionally, by shortening the reference period, the traditional benefits
associated with the longitudinal study of poverty begin to erode. By shortening the reference period to a single CY,
poverty estimates increasingly reflect the bias associated with cross-sectional surveys, whereby individuals
experiencing short poverty spells are underrepresented, and the majority of individuals observed in poverty are in
the midst of a chronic spell.
Spell Censoring
Obtaining accurate estimates of median poverty spell length necessitates the complete observation of poverty spells.
When the full duration of spells are unobserved due to censoring, spell durations are underestimated and, as shown
by Iceland (1997), the bias introduced by censoring is not uniform across populations.
The largest concerns when using the life-table methodology relate to the presence of left-censored spells, those
spells underway at the beginning of the observation period. Typically, the Census Bureau drops left-censored spells
when publishing median poverty spell durations. However, estimates including left-censored cases are also reported
in order to provide context for interpreting estimates, allowing data users to evaluate the degree to which durations
may be underestimated.
Of poverty spells observed over the 4-year period from 2009 to 2012, 22.5 percent are underway in the first
observed month, January 2009. These spells may have begun on or before January 2009, and I am unable to
determine the extent that spell durations are censored by the observation period. Of left-censored spells observed
over the 4-year period, 23.5 percent are both left and right-censored, meaning the poverty spell lasted the entire
reference period. However, only 5.3 percent of all spells captured over the 4-year period are both left and right-
15 Note: This discussion of observed spell length does not control for left or right-censoring, poverty spells may have begun
before they are first observed, or continued past the last reference month.

9
censored, and the majority of poverty spells (60.2 percent) have both an observed beginning and end month, i.e., are
uncensored, allowing for confidence in assessing spell durations (see Table 3) .
When observing poverty spells within a single CY, the percent of spells where a true beginning and end month are
observed declines dramatically. Approximately 20 percent or fewer of poverty spells captured within a single CY
from 2009 to 2012 have an observed start and end date within the reference period, compared to 60.2 percent of
spells observed over the 4-year reference period. Of spells observed within a single CY, approximately 55 to 60
percent of spells are left-censored, with the majority of left-censored spells spanning the entire reference period.
Approximately one-third of all poverty spells observed within a single CY are both left and right-censored,
compared to only 5.3 percent of spells measured over a 4-year reference period (see Table 3).
Rates of overall left-censoring as well as cases both left and right-censored are lower in CY 2009 than in subsequent
CYs. However, a greater percentage of poverty spells in CY 2009 are right-censored but not left-censored. Rates of
uncensored spells across CYs are not statistically different.
Consistent with Iceland (1997), I find that increased left-censoring within a CY is associated with populations that
are traditionally economically disadvantaged. There is a strong positive association (Pearson's r=0.83) between the
median length of poverty spells when measured over the 4-year period from 2009 to 2012, and the percent of
poverty spells that are left-censored within a single CY. Additionally, when measured over the 4-year period,
demographic groups with a higher percentage of left-censored spells have larger discrepancies in estimated medians
when including versus excluding left-censored spells (Pearson's r =0.84 for estimates with significant differences,
and r=0.69 when treating non-significant differences as 0). Correlation among these variables suggests that the
underestimation of median spell length increases as a greater percent of left-censored spells are excluded, and that
poverty spells experienced by traditionally disadvantaged populations are disproportionately underestimated when
left-censored spells are excluded from estimates.
Spell Durations
This research represents the first attempt to measure and publish single-year estimates of median poverty spell
durations based on monthly poverty status. Consistent with traditional Census Bureau methodology, the following
discussion will first report median spell durations with left-censored spells excluded, followed by a discussion of
how those estimates vary when left-censored spells are included in the calculations.
When left-censored spells are excluded, estimates of poverty spell durations are interpreted as the median length of
time an individual who enters poverty within the reference period is expected to remain in poverty. Using this
definition, the median length of a poverty spell in 2009 is 7.9 months, declining to 6.2 months in 2010. However,
although the decline in median poverty spell length from 2009 to 2010 is significant at the 90 percent confidence
level, the RSE of the difference is greater than 30 percent, making the estimated difference in spell lengths across
years unreliable. From 2010 to 2011 and from 2011 to 2012, the median length of a poverty spell is statistically
unchanged.
Estimates of median poverty spell duration (excluding left-censored spells) over the 4-year reference period are
correlated with measures of episodic and chronic poverty (Pearson’s r=0.61 and 0.78 respectively). However, year-
to-year trends across these measures vary over the period from 2009 to 2012. From 2009 to 2010 the chronic
poverty rate increased from 7.3 to 8.1 percent, and was statistically unchanged across later calendar years (see Table
1); this is inconsistent with trends in median poverty spell durations, which declined from 2009 to 2010. However,
rates of left-censoring are higher in 2010 than in 2009, which does support an increase in chronic poverty rates over
the period from 2009 to 2010, and further emphasizes the limitations of median spell length estimates when
excluding left-censored spells. Year-to-year changes in the episodic poverty rate are not statistically significant
across the entire reference period.
Unlike CY estimates of the episodic or chronic poverty rate, CY estimates of median spell length do not vary
dramatically from estimates over the 4-year reference period. CY estimates of overall median poverty spell length

10
are longer than 4-year estimates in CYs 2009 and 201216
, but are not statistically different from 4-year estimates in
CYs 2010 or 2011 (see Table 4 to Table 9). Given that these estimates exclude left-censored spells, and estimates of
spell duration are calculated based on month-to-month exit probabilities, the calculation from month 1 to 12 of a
poverty spell is independent of the full duration of the reference period. This differs from episodic and chronic
poverty estimates, where the estimate is relative to the duration of the reference period.
The relationship across CY and 4-year estimates also appears to vary across years. Simple regression models for CY
median spell length based on 4-year medians by demographic group generate a slope fairly close to 1 in CYs 2009,
2010, and 2011, indicating that the difference across 4-year and CY estimates is constant across advantaged and
disadvantaged demographic groups.17
However, in CY 2012, the slope is 0.5 and more advantaged demographic
groups with shorter median spell poverty durations when measured over the 4-year period appear to have larger
increases in spell lengths when measured in CY 2012. However, while the regression models are significant, they
are based on estimates for all demographic groups, even when differences across 4-year and CY estimates are not
significant. As shown in Table 9, there are very few significant differences across 4-year and CY estimates,
primarily limited to CY 2009, and the majority of differences are deemed unreliable due to high standard errors.
Trends in CY estimates across demographic groups are generally consistent with previous estimates based on a
multi-year reference period. However, conclusions are often less definitive due to large standard errors as well as the
inability to derive estimates for particularly disadvantaged groups where more than 50 percent of poverty spells are
predicted to continue through the end of the CY observation period.
While previous research (Edwards 2014) has shown that the median spell length for non-Hispanic Whites is shorter
than spell lengths for Blacks, I am unable to make statistical comparisons across these populations in CYs 2009 or
2010. In CY 2009 the relative standard error associated with the median spell length for Blacks is greater than 30
percent, indicating that the estimate is unreliable. Alternatively, in CY 2010, no median estimate for Blacks is
produced, as more than half of all poverty spells experienced by Blacks, even when excluding left-censored cases,
are predicted to continue beyond the end of the 12-month reference period. Estimates of median poverty spell
length for Blacks are calculated for CYs 2011 and 2012, but the standard errors associated with the estimates remain
relatively large (a RSE of 0.27 in CY 2011 and .13 in CY2012 compared to 0.08 across the 4-year period) and
differences across non-Hispanic Whites and Blacks are not statistically significant. There are no statistical
differences in estimates of median spell length across White, non-Hispanics, and Hispanics in CYs 2010 to 2012,
although, median spell durations for White, non-Hispanics are shorter than Hispanics in CY 2009 (6.8 and 8.3
months respectively). However, unlike comparisons across non-Hispanic Whites and Blacks, the lack of significant
differences across non-Hispanic Whites and Hispanics is generally consistent with previous research (Edwards
2014) as well as estimates over the 4-year period (see Table 4 to Table 8).
Individuals with one or more years of college experience shorter poverty spells than individuals with a high school
diploma in each CY from 2009 to 2012, while individuals with a high school diploma have shorter poverty spells
than those without a high school diploma in CY 2010. Comparisons to individuals with less than a high-school
diploma is limited to CYs 2010 and 2011 as estimates of median poverty spell length for this population are
determined to be unreliable in CYs 2009 and 2012. Median duration estimates for individuals without a high school
diploma in CY 2011 are associated with a RSE of 24 percent (compared to 7 percent in CY 2010) leading to non-
significant differences in median spell lengths between those with or without a high school diploma in CY 2011 (see
Table 4 to Table 8).
Unlike estimates based on the 4-year reference period from 2009 to 2012, there is no statistical difference in the
median length of poverty spells between individuals aged 65 and over and children under age 18 in CY 2011.
Comparisons in other CYs are limited by a failure to derive reliable median spell length estimates for individuals
aged 65 and over (see Table 4 to Table 8).
16 The standard error of the difference in medians across the 4-year reference period and CY 2012 is greater than 30 percent of
the estimate. 17 The coefficient in CY 2009 (0.81) is statistically different from 1, however, coefficients in CYs 2009, 2010, and 2011 are not
statistically different from one another.

11
Individuals in married-couple families generally have shorter CY poverty spells than individuals in female-
householder, no husband present families or unrelated individuals.18
However, there are some unusual findings in
CY 2012, whereby spell durations for individuals in married-couple families increase by 2.4 months over CY 2011,
making estimates of poverty spell durations for married-couple families in CY 2012 statistically similar to
individuals in female-householder families and unrelated individuals. Annual, episodic, and chronic poverty rates do
not show increases in poverty rates for married-couple families from CY 2011 to 2012, and the RSE of the increase
is greater than 30 percent, casting some concern over the strength of the conclusions that may be drawn based on
estimates of single-year spell durations (see Table 4 to Table 8).
Year-to-year trends across demographic groups are largely consistent with the overall population, characterized by a
lack of significant or reliable estimates of year-to-year change. Single-year changes in median poverty spell
durations are not significant or unreliable for the majority of demographic groups shown in Table 9. There is only
one demographic group where there is a reliably significant change across CYs; from 2009 to 2010 the median
length of poverty spells for those living in the South declines by 2.4 months (see Table 9). However, it is difficult to
reconcile this large decline in median poverty spell lengths with inconsistent trends in the annual, episodic, and
chronic poverty rates for Southerners over this period, none of which show a decline (Edwards 2014).
These findings generate obvious concerns in making comparisons across particularly disadvantaged groups where
more than half of CY poverty spells continue through the duration of the reference period, or where there is high
variability in estimates of the median. However, in cases where CY median spell estimates excluding left censored
spells are obtained, the average RSE across demographic groups in single CYs is not statistically different from the
average RSE across demographic groups over the 4-year period, indicating that when CY median spell length
estimates can be assigned, they aren’t universally more variable from estimates over the 4-year period.19
The Impact of Left-Censored Spells
When left-censored spells are excluded from estimates of median poverty spell durations, the resulting statistic can
be interpreted as the median duration of spells that begin in a given reference period. However, this definition may
not be suitable for all purposes, and interpreting changes in durations across years may be misleading if durations
decline while rates of left-censoring increase substantially. Estimates also create an overly optimistic representation
for demographic groups with high rates of chronic poverty. Therefore, it is the general practice of the Census Bureau
to produce alternate estimates including left-censored spells in order to gauge their impact on estimated medians.
Over the 4-year period from 2009 to 2012, 22.5 percent of all observed poverty spells are initially excluded from
duration estimates due to left-censoring. Treating those spells as beginning in January 2009, the first observed
month, is not a perfect solution, as the application of a blanket start date creates unequal truncation across spells.
However, while these spell lengths continue to be underestimated to an unknown extent, the resulting measure of
median spell length more appropriately captures the number of months poverty spells lasted over a given reference
period, and provides a general measure to evaluate the impact of censoring. Over the 4-year period from 2009 to
2012, the median length of all observed poverty spells was 7.9 months, 1.7 months longer than when excluding left-
censored spells (see Table 10).
As discussed, demographic groups with higher rates of left-censoring tend to be more economically disadvantaged,
as individuals experiencing long-term poverty are more likely to have their poverty spells censored by the
observation period. Demographic groups that have higher rates of left-censoring also have greater differences across
4-year median spell length estimates when including versus excluding left-censored cases. Given that left-censored
spells are more likely to represent periods of extended poverty, excluding these spells underestimates spell durations
for the most vulnerable populations. Approximately 34.3 percent of poverty spells experienced by individuals living
in families with a female-householder no husband present and related child under the age of 18 are left-censored
over the 4-year observation period from 2009 to 2012. When including left-censored spells for this demographic
group, the median length of their poverty spells increases by 3.8 months. Alternatively, only 14.3 percent of spells
experienced by individuals engaged in full-time employment at the start of the 4-year reference period are left-
18 Comparisons to individuals in female householder, no husband present families are limited to CYs 2009, 2011, and 2012, as
estimates of median poverty spell length in CY 2010 are suppressed due to a RSE greater than 30 percent. 19 This excludes estimates that are suppressed due to a RSE greater than 30 percent.
12
censored, and spell durations for this population increase only 0.1 months when including these left-censored spells.
There are no demographic groups over the 4-year period where median poverty spell durations are shorter when
including left-censored spells (see Table 10).
Evaluating the extent that median spell durations are underestimated when excluding left-censored spells within a
CY is more complicated. As shown in Figure 1, life-table survival curves based only on left-censored spells indicate
that survival curves are largely consistent for left-censored poverty spells whether they are observed within a single
CY (in yellow) or over the 4-year period (in blue). Figure 1 graphs the probability that a left-censored poverty spell
will continue (“survive”) to a given month or longer. For example, 100 percent of spells last to month 2 or longer, as
this is the defined minimum spell length. From months 3 to 48, the probability of a spell continuing from month to
month declines gradually over time, at a rate that is largely consistent across CY and 4-year estimates.20
A constant
line at the median highlights the point at which the survival curve crosses the 50 percent survival threshold, i.e., 50
percent of poverty spells last to this month or longer. As shown in Figure 1, the median poverty spell duration for
left-censored poverty spells observed over the 4-year period from 2009 to 2012 is approximately 16 months.
However, in each of the CYs from 2009 to 2012, over 50 percent of left-censored poverty spells survive past the last
calendar month, therefore no median is determined.
Survival curves based on life-table estimates where left-censored spells are excluded, as shown in Figure 2, are also
fairly consistent across CYs and 4-year estimates.21
As previously discussed, median poverty spell durations
excluding left-censored spells in CYs 2009 and 2012 (7.9 and 7.5 months respectively) 22
are longer than spells
measured over the 4-year period, while for CYs 2010 and 2011 there is no significant difference from the 4-year
median (6.2 months). More clearly shown in Figure 2 is the steep decline in survival rates across months 2 to 3, 4 to
5, and 8 to 9, which is pronounced in both the 4-year and CY survival curves. The survival curves shown in Figure 2
reinforce the fact that when the beginning of poverty spells are observed, many individuals (approximately 40 to 45
percent) will be observed exiting the spell before month 5. Comparisons across Figure 1 and Figure 2 highlight this
difference with left-censored spells; since the observation period fails to capture the start of left-censored poverty
spells, these spells have likely already progressed beyond the initial months where the majority of exits are
observed, capturing these most prolonged spells with the least likelihood of exit.
Alternate ways to visualize poverty exits are shown in plots of the hazard rate, i.e., the conditional probability of
exiting a poverty spell in a given month, over the course of the observation period. Plots of the hazard rate more
clearly illustrate the large increases in exit probabilities in months 2, 4, and 8 for non-left-censored spells, which
appear as pronounced spikes in both the 4-year and CY hazard functions.21,23
Of spells with an observed entry into
poverty, approximately 30 to 33 percent of spells continuing to month 4 will end before progressing to month 5.
When spells are left-censored (Figure 1) the probability of exiting a poverty spell in a given month never surpasses
10 percent in either the 4-year or CY estimates.
Figure 3 shows the final survival curves when estimating median spell length when including and excluding left-
censored cases. Survival curves where left-censored cases are excluded (shown in green and red) are consistent
across Figure 3 and Figure 2, and estimates where left-censored cases are included (shown in yellow and blue) vary
from Figure 1 as the estimates in Figure 3 are not based solely on left-censored spells, but all spells regardless of
left-censoring. As shown in Figure 3, when including left-censored spells in estimates of spell durations over the 4-
year period, the survival curve (in blue) moves outward, as a greater proportion of spells survive across each
monthly interval, and the median spell duration increases by 1.7 months.24
Differences in 4-year survival curves are
relatively small until after month 4, and as shown by the hazard rates in Figure 3, this may be attributed to less
20 Although the slope of the survival curves are appear similar across CY and 4-year estimates, there are statistical differences in
the survival curves for left-censored spells across all estimates. 21 Although the survival curves and hazard functions appear similar across CY and 4-year estimates, there are statistical
differences when excluding left-censored spells across all estimates except CYs 2010 and 2011. 22 There is no statistical difference in median poverty spell durations in 2009 (7.9 months) and 2012 (7.5 months). 23 The observance of these spikes are strongly linked to the interview methodology of the SIPP, whereby months across 4-month
interviews account for a disproportionate number of transitions into and out of poverty as opposed to months within the 4-
month reference period. 24 There are statistical differences in the survival curves across all estimates except comparisons across CY 2009 left-censored
included and CY 2011 left-censored included as well as CY 2010 left-censored excluded and CY 2011 left-censored excluded.

13
pronounced seam effects when left-censored spells are included, although the decline in survivorship from month 4
to 5 remains prominent.
CY survival curves and hazard functions (see Figure 3) including left-censored spells (shown in yellow) vary more
distinctly from estimates where left-censored spells are excluded (shown in green) and estimates including left-
censored spells do not show the same pronounced exit probabilities in months 4 or 8. While the survival curves and
hazard functions for left-censored spells shown in Figure 1 are fairly consistent across 4-year and single CY
estimates, the impact of including those spells in the overall estimates vary. This is due to the fact that only 22.5
percent of spells over the 4-year-period are left-censored, while approximately 55 to 60 percent of spells within the
single CYs are left-censored. For each of the single CYs from 2009 to 2012, I am unable to estimate median spell
durations when including left-censored spells due to unassigned or unreliable estimates of the median.25
Without producing CY estimates of median spell duration when including left-censored spells, it is difficult to
evaluate the direct impact of excluding those cases. Based on the survival curves, it is evident that including left-
censored spells in CY estimates leads to more prolonged poverty spell durations than in the 4-year estimates, not due
to unique characteristics of the left-censored spells captured within a single CY, but due to their increased
frequency.
Differences across medians when excluding and including left-censored spells are reported in Table 10 for select
demographic groups. However, for many demographic groups, estimates of median spell length when including left-
censored spells continue to be unassigned or suppressed due to high RSEs. For those demographic groups where CY
medians are assigned when including left-censored spells, there is no population shown in Table 10 where median
spell durations are shorter when left-censored spells are included. CY differences across medians are larger than 4-
year differences for all demographic groups except for individuals in two-person families in CY 2009. Demographic
groups with larger differences across estimates over the 4-year year reference period generally have larger
differences across medians when measured within a single CY (Pearson’s r=0.58)26
(see Table 10 ).
Given that CY median spell durations when including left-censored spells are frequently unassigned, this research
explores the probability of assigning a valid medians when including and excluding left-censored spells based on the
presence of left-censoring among demographic populations.
With the percent of left-censored spells the sole predictor in a logistic model, findings suggest that for every 10
percentage point increase in the rate of left-censoring, the probability of failing to assign a reliable estimate of
median spell length when excluding left-censored spells increases by a factor of 4.8. However, when left-censored
spells are included in calculations of the median, the probability of failing to assign a valid median increases by a
factor of 280.8 for every 10 percentage point increase in left-censoring. Even with CY left-censoring rates as high as
60 percent, when left-censored spells are excluded there is only a 12.0 percent predicted probability of failing to
assign a reliable median. Alternatively, when trying to produce estimates of spell length when 60 percent of spells
are left-censored there is a 93.0 percent predicted probability of failing to assign a median.
Conclusions
In cases where CY median spell length estimates are obtained, the average RSE of CY estimates across
demographic groups is not statistically different from the average RSE over the 4-year period, indicating that when
CY median spell length estimates can be assigned, they aren’t universally more variable from estimates over the 4-
year period.27
This is an encouraging finding given the reduced capture of non-left censored spells within a single
CY. However, there is also an increased likelihood that median spell durations will not be assigned within a CY due
25 In CYs 2009 and 2011 overall medians are assigned when using base weights, but not with select replicate weights, leading to
large standard errors and suppressed estimates. In CY 2010 and 2012 more than half of poverty spells are predicted to survive
past the reference period. 26 Note: The correlation coefficient of 0.58 is based on observations with significant differences across medians when including
versus excluding left-censored spells in both the 4-year and CY estimates (n=39). When treating non-significant differences as
0, there is no significant relationship among 4-year and CY differences. 27 This excludes estimates that are suppressed due to a RSE greater than 30 percent.

14
to survival rates greater than 50 percent through the entire reference period or a RSE greater than 30 percent,
conditions which are not observed in estimates over the 4-year period.
There are limited year-to-year changes in median poverty spell lengths over the 4-year period. There is a statistically
significant decline in spell lengths from 2009 to 2010, but a RSE greater than 30 percent limits the conclusiveness of
this finding. Year-to-year interpretations must also reflect the fact that estimates exclude left-censored spells. For
example, chronic poverty rates increased from 2009 to 2010, while median poverty spell lengths declined. However,
left-censored 2010 chronic poverty spells are excluded from estimates of spell durations, therefore the interpretation
of year-to-year comparisons are limited to individuals who enter poverty over the period.
The biggest concern with estimates of CY median spell lengths relate to the handling of left-censored spells.
Approximately 55 to 60 percent of poverty spells observed within CYs 2009 to 2012 began before January of the
CY. The impact of excluding these spells when producing estimates of median spell length varies across
demographic groups, with traditionally disadvantaged groups more likely to experience left censoring. The survival
characteristics of left-censored spells observed within a calendar year do not differ dramatically from left-censored
spells observed over the 4-year reference period.28
However, because of the increased frequency of left-censoring in
CY estimates, medians including left-censored spells are often unassigned given that more than 50 percent of all
poverty spells continue through the end of reference period. In each of the CYs from 2009 to 2012, overall estimates
of spell length when including left-censored spells are unassigned or unreliable.
The direct impact of including left-censored poverty spells can only be compared for the most advantaged
demographic groups, where medians are known to be least distorted by dropping left-censored spells. Demographic
groups with higher rates of left-censoring are found to have larger differences across medians when including versus
excluding left-censored spells, and those differences are generally larger in CY estimates than over the 4-year
period. Based on these findings, CY estimates of median poverty spell length appear a poor candidate for annual
publication, as even when excluding left-censored spells, select demographic groups continue to experience
prolonged poverty spells that cannot be assigned a median within the reference period.
Next Steps
The redesign of the 2014 SIPP Survey should motivate researchers to consider alternate ways of measuring and
publishing estimates given that changes in the interview reference period will lead to the release of calendar year
aligned wavely files. There are many potential opportunities to be realized by the more predicable and frequent
reporting of poverty dynamics at the annual level. Given the findings in this research, poverty briefs released to
coincide with the public use release of the 2014 SIPP files will not include measures of median poverty spell length,
but will include measures of monthly poverty, average monthly poverty, annual poverty, CY episodic poverty, and
CY chronic poverty. Official P-70 reports will continue to be released, and will provide multi-year estimates of
episodic poverty, chronic poverty, and poverty dynamics, including median spell lengths as well as entry and exit
rates.
This research indicates that estimates of the median may not be the most reasonable metric for measuring poverty
dynamics within a single CY. However, there may be other more informative measures on poverty dynamics that
could be reported in annual briefs. For example, survival rates could instead be used to report the percent of poverty
spells within the CY that lasted for more than 6 months. This would provide a measure of hardship that could be
produced including and excluding left-censored spells, as well as for all demographic groups. Further, the reporting
of poverty spell censoring rates within the CY is also an informative measure in itself; reporting the percent of
observed spells that are carried forward from the previous year, began within the calendar year, and ended within the
calendar year.
An issue that this research has not discussed at length is the issue of multiple spell capture. Over a multi-year
period, measures of median spell durations provide an estimate for how long individuals should expect to remain in
poverty once they enter. However, these measures do a poor job at capturing the dynamics of poverty at the person
level over the period, as individuals may experience multiple poverty spells, and comparisons of median spell length
28
While the slope of the survival curves are not dramatically different CY and 4-year estimates, there are statistical differences in
the survival curves for left-censored spells across all estimates.

15
across demographic groups are misleading if some demographic groups are more likely to experience repeated
poverty spells (Edwards 2015). Given that the majority of poverty spells observed within a CY represent
individual’s only poverty spell, it maybe more reasonable to transition from a spell based measure of poverty
dynamics to one calculated at the person level, similar to the episodic or chronic poverty rate.
It’s also important to conclude by noting that this research is based on data from the 2008 SIPP Panel, and that there
is strong evidence of seam bias in the timing of poverty exits. Hazard rates model the conditional probability of
exiting a poverty spell in a given month, and show pronounced spikes in exit probabilities on interview seams,
which are every 4 months in the 2008 SIPP Panel. This tendency for individuals to report transitions in poverty
status across interviews rather than within interviews raises concerns for future estimates based on the 2014 SIPP
Panel, where interviews are conducted every year. Evaluating the capture and timing of poverty transitions as
measured in the 2014 SIPP Panel remains an area of necessary research.
16
Tables and Figures
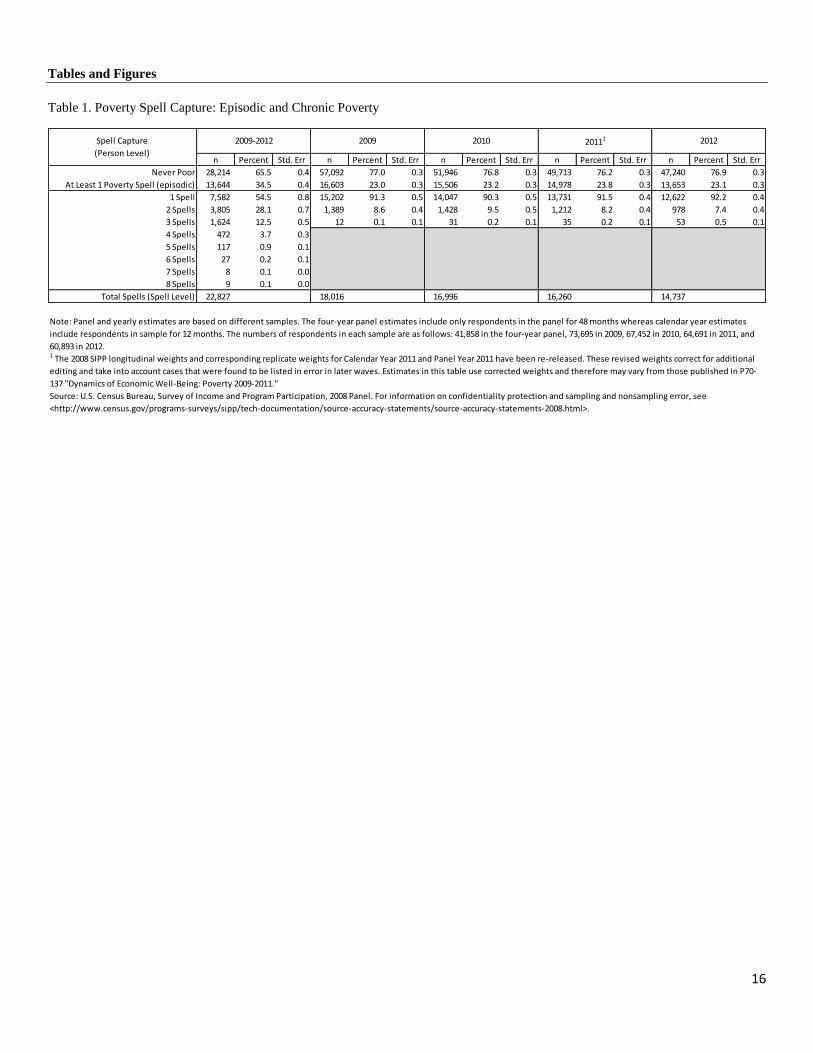
Table 1. Poverty Spell Capture: Episodic and Chronic Poverty
n Percent Std. Err n Percent Std. Err n Percent Std. Err n Percent Std. Err n Percent Std. Err
Never Poor 28,214 65.5 0.4 57,092 77.0 0.3 51,946 76.8 0.3 49,713 76.2 0.3 47,240 76.9 0.3
At Least 1 Poverty Spell (episodic) 13,644 34.5 0.4 16,603 23.0 0.3 15,506 23.2 0.3 14,978 23.8 0.3 13,653 23.1 0.3
1 Spell 7,582 54.5 0.8 15,202 91.3 0.5 14,047 90.3 0.5 13,731 91.5 0.4 12,622 92.2 0.4
2 Spells 3,805 28.1 0.7 1,389 8.6 0.4 1,428 9.5 0.5 1,212 8.2 0.4 978 7.4 0.4
3 Spells 1,624 12.5 0.5 12 0.1 0.1 31 0.2 0.1 35 0.2 0.1 53 0.5 0.1
4 Spells 472 3.7 0.3
5 Spells 117 0.9 0.1
6 Spells 27 0.2 0.1
7 Spells 8 0.1 0.0
8 Spells 9 0.1 0.0
Total Spells (Spell Level) 22,827 18,016 16,996 16,260 14,737
2012
Note: Panel and yearly estimates are based on different samples. The four-year panel estimates include only respondents in the panel for 48 months whereas calendar year estimates
include respondents in sample for 12 months. The numbers of respondents in each sample are as follows: 41,858 in the four-year panel, 73,695 in 2009, 67,452 in 2010, 64,691 in 2011, and
60,893 in 2012. 1 The 2008 SIPP longitudinal weights and corresponding replicate weights for Calendar Year 2011 and Panel Year 2011 have been re-released. These revised weights correct for additional
editing and take into account cases that were found to be listed in error in later waves. Estimates in this table use corrected weights and therefore may vary from those published in P70-
137 "Dynamics of Economic Well-Being: Poverty 2009-2011."
Spell Capture
(Person Level)
2009-2012 2009 2010 20111
Source: U.S. Census Bureau, Survey of Income and Program Participation, 2008 Panel. For information on confidentiality protection and sampling and nonsampling error, see
<http://www.census.gov/programs-surveys/sipp/tech-documentation/source-accuracy-statements/source-accuracy-statements-2008.html>.

17
Table 2. Observed Poverty Spell Durations
n Percent Std. Err n Percent Std. Err n Percent Std. Err n Percent Std. Err n Percent Std. Err
2 3,498 15.4 0.6 2,436 13.8 0.5 2,455 14.8 0.5 2,256 14.2 0.5 2,120 14.6 0.6
3 2,042 9.0 0.3 1,957 10.9 0.4 1,713 10.4 0.5 1,553 9.6 0.4 1,307 9.2 0.4
4 4,257 18.7 0.5 2,414 13.6 0.5 2,307 13.9 0.5 2,181 13.5 0.5 1,841 12.3 0.5
5 955 4.3 0.3 1,062 6.2 0.4 942 5.5 0.3 839 5.7 0.4 707 4.8 0.3
6 857 4.0 0.3 933 5.3 0.3 843 4.9 0.3 753 4.6 0.3 576 3.9 0.3
7 781 3.4 0.2 907 5.1 0.3 685 4.1 0.3 645 3.9 0.3 708 4.8 0.3
8 1,513 6.7 0.3 916 5.2 0.3 731 4.1 0.3 816 4.7 0.3 642 4.2 0.4
9 540 2.5 0.2 514 3.1 0.2 526 3.0 0.3 549 3.5 0.3 469 3.2 0.3
10 487 2.1 0.2 528 2.7 0.2 437 2.5 0.2 486 3.0 0.3 547 3.6 0.3
11 504 2.3 0.2 613 3.3 0.2 512 3.1 0.2 545 3.4 0.3 535 3.7 0.3
12 770 3.3 0.2 5,736 30.9 0.7 5,845 33.7 0.7 5,637 33.8 0.7 5,285 35.5 0.8
13 347 1.5 0.1
14 284 1.2 0.1
15 219 1.0 0.1
16 523 2.4 0.2
17 284 1.2 0.1
18 197 0.8 0.1
19 202 0.8 0.1
20 345 1.4 0.1
21 189 0.8 0.1
22 139 0.6 0.1
23 184 0.8 0.1
24 231 0.9 0.1
25 119 0.6 0.1
26 142 0.6 0.1
27 155 0.7 0.1
28 176 0.8 0.1
29 146 0.7 0.1
30 130 0.5 0.1
31 88 0.5 0.1
32 134 0.6 0.1
33 83 0.4 0.1
34 93 0.4 0.1
35 62 0.3 0.1
36 80 0.3 0.1
37 91 0.4 0.1
38 70 0.3 0.1
39 81 0.4 0.1
40 59 0.2 0.1
41 86 0.3 0.1
42 68 0.3 0.1
43 63 0.3 0.1
44 69 0.3 0.1
45 80 0.3 0.1
46 85 0.4 0.1
47 73 0.3 0.1
48 1,246 5.3 0.3
Total Spells 22,827 100.0 18,016 100.0 16,996 100.0 16,260 100.0 14,737 100.0
Note: Counts of spell frequency are unweighted, percents are weighted using replicate weights.
Note: Observed spell length does not control for left or right-censoring, poverty spells may have begun before they were first observed, or continued past the last reference month.
Source: U.S. Census Bureau, Survey of Income and Program Participation, 2008 Panel. For information on confidentiality protection and sampling and nonsampling error, see
<http://www.census.gov/programs-surveys/sipp/tech-documentation/source-accuracy-statements/source-accuracy-statements-2008.html>.
Note: Panel and yearly estimates are based on different samples. The four-year panel estimates include only respondents in the panel for 48 months whereas calendar year estimates
include respondents in sample for 12 months. The numbers of respondents in each sample are as follows: 41,858 in the four-year panel, 73,695 in 2009, 67,452 in 2010, 64,691 in 2011, and
2012"Observed" Spell Duration
(Spell Level)
2009-2012 2009 2010 2011

18
Table 3. Frequency of Spell Censoring
n Percent Std. Err n Percent Std. Err n Percent Std. Err n Percent Std. Err n Percent Std. Err
Left-Censored 5,150 22.5 0.5 10,001 54.7 0.7 9,996 58.4 0.7 9,728 59.6 0.7 8,679 58.9 0.7
Only Left Censored 3,904 17.2 0.4 4,265 23.8 0.5 4,151 24.8 0.6 4,091 25.8 0.7 3,394 23.4 0.7
Left & Right Censored 1,246 5.3 0.3 5,736 30.9 0.7 5,845 33.7 0.7 5,637 33.8 0.7 5,285 35.5 0.8
Only Right Censored 4,055 17.3 0.4 4,645 26.2 0.6 3,866 23.1 0.6 3,614 21.9 0.6 3,459 22.9 0.6
Not Censored 13,622 60.2 0.6 3,370 19.1 0.6 3,134 18.4 0.6 2,918 18.5 0.6 2,599 18.2 0.6
Note: Frequency counts are unweighted, percents are weighted using replicate weights.
Source: U.S. Census Bureau, Survey of Income and Program Participation, 2008 Panel. For information on confidentiality protection and sampling and nonsampling error, see
<http://www.census.gov/programs-surveys/sipp/tech-documentation/source-accuracy-statements/source-accuracy-statements-2008.html>.
Note: Panel and yearly estimates are based on different samples. The four-year panel estimates include only respondents in the panel for 48 months whereas calendar year estimates
include respondents in sample for 12 months. The numbers of respondents in each sample are as follows: 41,858 in the four-year panel, 73,695 in 2009, 67,452 in 2010, 64,691 in 2011,
and 60,893 in 2012.
2009-2012 2009 2010 20111 2012
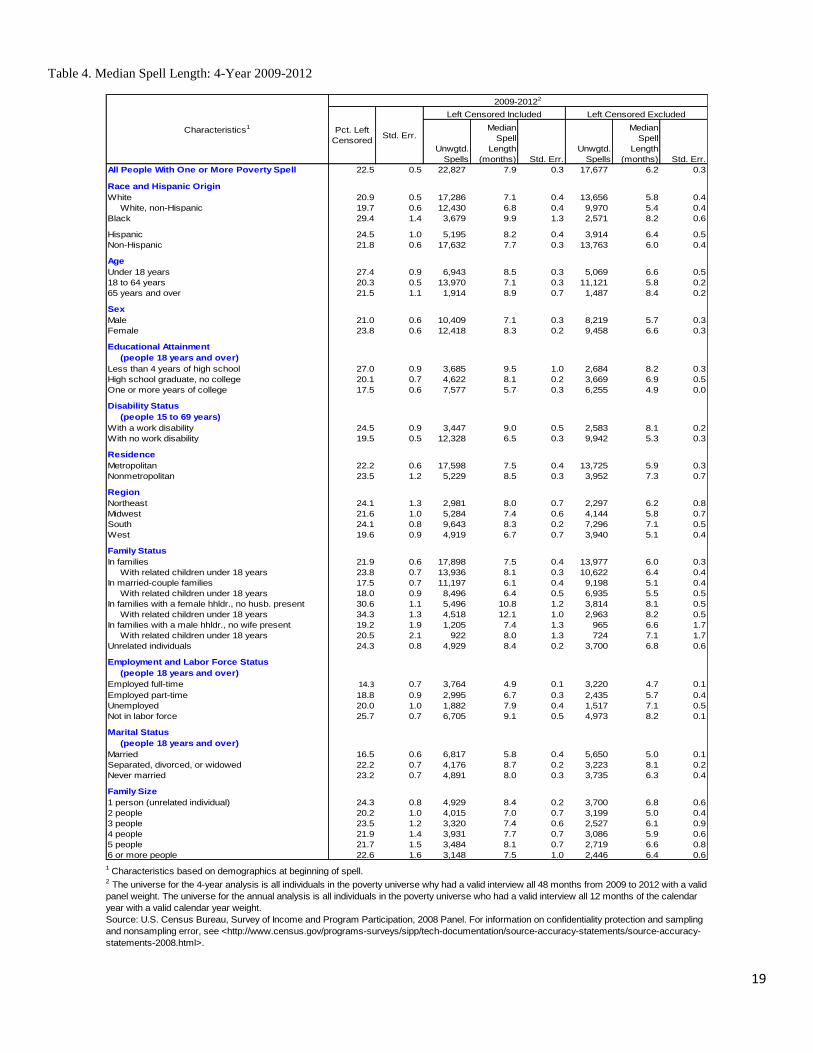
19
Table 4. Median Spell Length: 4-Year 2009-2012
All People With One or More Poverty Spell 22.5 0.5 22,827 7.9 0.3 17,677 6.2 0.3
Race and Hispanic Origin
White 20.9 0.5 17,286 7.1 0.4 13,656 5.8 0.4
.White, non-Hispanic 19.7 0.6 12,430 6.8 0.4 9,970 5.4 0.4
Black 29.4 1.4 3,679 9.9 1.3 2,571 8.2 0.6
Hispanic 24.5 1.0 5,195 8.2 0.4 3,914 6.4 0.5
Non-Hispanic 21.8 0.6 17,632 7.7 0.3 13,763 6.0 0.4
Age
Under 18 years 27.4 0.9 6,943 8.5 0.3 5,069 6.6 0.5
18 to 64 years 20.3 0.5 13,970 7.1 0.3 11,121 5.8 0.2
65 years and over 21.5 1.1 1,914 8.9 0.7 1,487 8.4 0.2
Sex
Male 21.0 0.6 10,409 7.1 0.3 8,219 5.7 0.3
Female 23.8 0.6 12,418 8.3 0.2 9,458 6.6 0.3
Educational Attainment
.(people 18 years and over)
Less than 4 years of high school 27.0 0.9 3,685 9.5 1.0 2,684 8.2 0.3
High school graduate, no college 20.1 0.7 4,622 8.1 0.2 3,669 6.9 0.5
One or more years of college 17.5 0.6 7,577 5.7 0.3 6,255 4.9 0.0
Disability Status
.(people 15 to 69 years)
With a work disability 24.5 0.9 3,447 9.0 0.5 2,583 8.1 0.2
With no work disability 19.5 0.5 12,328 6.5 0.3 9,942 5.3 0.3
Residence
Metropolitan 22.2 0.6 17,598 7.5 0.4 13,725 5.9 0.3
Nonmetropolitan 23.5 1.2 5,229 8.5 0.3 3,952 7.3 0.7
Region
Northeast 24.1 1.3 2,981 8.0 0.7 2,297 6.2 0.8
Midwest 21.6 1.0 5,284 7.4 0.6 4,144 5.8 0.7
South 24.1 0.8 9,643 8.3 0.2 7,296 7.1 0.5
West 19.6 0.9 4,919 6.7 0.7 3,940 5.1 0.4
Family Status
In families 21.9 0.6 17,898 7.5 0.4 13,977 6.0 0.3
.With related children under 18 years 23.8 0.7 13,936 8.1 0.3 10,622 6.4 0.4
In married-couple families 17.5 0.7 11,197 6.1 0.4 9,198 5.1 0.4
.With related children under 18 years 18.0 0.9 8,496 6.4 0.5 6,935 5.5 0.5
In families with a female hhldr., no husb. present 30.6 1.1 5,496 10.8 1.2 3,814 8.1 0.5
.With related children under 18 years 34.3 1.3 4,518 12.1 1.0 2,963 8.2 0.5
In families with a male hhldr., no wife present 19.2 1.9 1,205 7.4 1.3 965 6.6 1.7
.With related children under 18 years 20.5 2.1 922 8.0 1.3 724 7.1 1.7
Unrelated individuals 24.3 0.8 4,929 8.4 0.2 3,700 6.8 0.6
Employment and Labor Force Status
.(people 18 years and over)
Employed full-time 14.3 0.7 3,764 4.9 0.1 3,220 4.7 0.1
Employed part-time 18.8 0.9 2,995 6.7 0.3 2,435 5.7 0.4
Unemployed 20.0 1.0 1,882 7.9 0.4 1,517 7.1 0.5
Not in labor force 25.7 0.7 6,705 9.1 0.5 4,973 8.2 0.1
Marital Status
.(people 18 years and over)
Married 16.5 0.6 6,817 5.8 0.4 5,650 5.0 0.1
Separated, divorced, or widowed 22.2 0.7 4,176 8.7 0.2 3,223 8.1 0.2
Never married 23.2 0.7 4,891 8.0 0.3 3,735 6.3 0.4
Family Size
1 person (unrelated individual) 24.3 0.8 4,929 8.4 0.2 3,700 6.8 0.6
2 people 20.2 1.0 4,015 7.0 0.7 3,199 5.0 0.4
3 people 23.5 1.2 3,320 7.4 0.6 2,527 6.1 0.9
4 people 21.9 1.4 3,931 7.7 0.7 3,086 5.9 0.6
5 people 21.7 1.5 3,484 8.1 0.7 2,719 6.6 0.8
6 or more people 22.6 1.6 3,148 7.5 1.0 2,446 6.4 0.6
Pct. Left
CensoredStd. Err.
Left Censored Included Left Censored Excluded
Characteristics1
2009-20122
Unwgtd.
Spells
Median
Spell
Length
(months) Std. Err.
Unwgtd.
Spells
Median
Spell
Length
(months) Std. Err.
Source: U.S. Census Bureau, Survey of Income and Program Participation, 2008 Panel. For information on confidentiality protection and sampling
and nonsampling error, see <http://www.census.gov/programs-surveys/sipp/tech-documentation/source-accuracy-statements/source-accuracy-
statements-2008.html>.
2 The universe for the 4-year analysis is all individuals in the poverty universe why had a valid interview all 48 months from 2009 to 2012 with a valid
panel weight. The universe for the annual analysis is all individuals in the poverty universe who had a valid interview all 12 months of the calendar
year with a valid calendar year weight.
1 Characteristics based on demographics at beginning of spell.

20
Table 5. Median Spell Length: CY 2009
All People With One or More Poverty Spell 54.7 0.7 18,016 x x 8,015 7.9 0.3
Race and Hispanic Origin
White 53.0 0.8 13,066 11.1 0.5 6,040 7.2 0.5
.White, non-Hispanic 51.4 0.8 9,273 9.8 0.5 4,418 6.8 0.6
Black 62.2 1.5 3,345 Δ Δ 1,220 x x
Hispanic 56.9 1.6 4,206 Δ Δ 1,784 8.3 0.4
Non-Hispanic 53.9 0.7 13,810 11.2 0.4 6,231 7.7 0.4
Age
Under 18 years 59.3 1.2 6,274 Δ Δ 2,527 8.2 0.3
18 to 64 years 52.1 0.7 10,480 10.4 0.4 4,952 7.3 0.5
65 years and over 56.3 1.6 1,262 Δ Δ 536 x x
Sex
Male 52.7 0.8 8,153 10.6 0.5 3,796 7.5 0.5
Female 56.5 0.8 9,863 Δ Δ 4,219 8.1 0.2
Educational Attainment
.(people 18 years and over)
Less than 4 years of high school 60.2 1.2 2,954 Δ Δ 1,156 x x
High school graduate, no college 51.3 1.0 3,498 x x 1,661 8.1 0.4
One or more years of college 49.1 0.8 5,290 8.6 0.2 2,671 5.9 0.4
Disability Status
.(people 15 to 69 years)
With a work disability 58.5 1.0 2,612 Δ Δ 1,059 8.7 1.7
With no work disability 51.1 0.7 9,236 9.4 0.4 4,485 7.1 0.5
Residence
Metropolitan 54.4 0.8 13,938 11.3 0.4 6,288 7.6 0.5
Nonmetropolitan 56.2 1.5 4,078 Δ Δ 1,727 x x
Region
Northeast 57.3 1.5 2,639 10.6 1.3 1,133 6.0 1.3
Midwest 54.3 1.3 4,068 Δ Δ 1,806 7.6 0.7
South 55.8 1.1 7,127 Δ Δ 3,087 8.4 0.3
West 51.7 1.4 4,182 10.8 0.7 1,989 6.5 1.0
Family Status
In families 53.5 0.9 13,927 11.4 0.4 6,365 7.6 0.5
.With related children under 18 years 55.6 1.1 11,453 Δ Δ 5,000 8.1 0.4
In married-couple families 47.0 1.2 7,659 8.3 0.3 4,005 5.9 0.6
.With related children under 18 years 47.7 1.4 5,929 8.7 0.4 3,064 6.0 0.8
In families with a female hhldr., no husb. present 63.6 1.3 5,232 Δ Δ 1,851 8.6 0.4
.With related children under 18 years 65.9 1.4 4,688 Δ Δ 1,558 8.8 0.6
In families with a male hhldr., no wife present 48.3 2.9 1,036 9.7 1.1 509 x x
.With related children under 18 years 52.3 3.3 836 x x 378 Δ Δ
Unrelated individuals 58.5 0.8 4,089 Δ Δ 1,650 8.5 0.3
Employment and Labor Force Status
.(people 18 years and over)
Employed full-time 43.8 1.2 2,288 7.6 0.3 1,270 5.2 0.4
Employed part-time 49.5 1.2 2,201 9.0 0.5 1,108 7.6 0.7
Unemployed 48.0 1.5 1,581 9.0 0.5 830 7.0 0.5
Not in labor force 60.7 0.7 5,303 Δ Δ 2,046 8.8 0.3
Marital Status
.(people 18 years and over)
Married 45.9 1.1 4,524 8.0 0.3 2,416 5.8 0.4
Separated, divorced, or widowed 56.2 1.0 3,087 Δ Δ 1,307 8.6 0.3
Never married 56.0 0.8 4,131 Δ Δ 1,765 8.0 0.5
Family Size
1 person (unrelated individual) 58.5 0.8 4,089 Δ Δ 1,650 8.5 0.3
2 people 52.1 1.3 2,925 9.5 0.5 1,387 6.8 0.8
3 people 52.6 1.7 2,797 x x 1,289 8.1 0.8
4 people 51.6 1.8 3,199 Δ Δ 1,501 7.7 1.0
5 people 54.7 2.6 2,568 Δ Δ 1,147 7.8 1.4
6 or more people 57.7 2.6 2,438 x x 1,041 8.1 1.6
Characteristics1
20092
Median
Spell
Length
(months) Std. Err.
Unwgtd.
Spells
Median
Spell
Length
(months)
Pct. Left
CensoredStd. Err.
Left Censored Included Left Censored Excluded
Std. Err.
Unwgtd.
Spells
Source: U.S. Census Bureau, Survey of Income and Program Participation, 2008 Panel. For information on confidentiality protection and sampling
and nonsampling error, see <http://www.census.gov/programs-surveys/sipp/tech-documentation/source-accuracy-statements/source-accuracy-
statements-2008.html>.
x This estimate has been determined to be unreliable due to a relative standard error greater than 30 percent of the estimate.
Δ Median spell length undetermined given that more than half of spells "survive" past month 11.
2 The universe for the 4-year analysis is all individuals in the poverty universe why had a valid interview all 48 months from 2009 to 2012 with a valid
panel weight. The universe for the annual analysis is all individuals in the poverty universe who had a valid interview all 12 months of the calendar
year with a valid calendar year weight.
1 Characteristics based on demographics at beginning of spell.

21
Table 6. Median Spell Length: CY 2010
All People With One or More Poverty Spell 58.4 0.7 16,996 Δ Δ 7,000 6.2 0.5
Race and Hispanic Origin
White 56.5 0.8 12,226 10.8 0.6 5,256 5.8 0.4
.White, non-Hispanic 54.2 0.9 8,582 9.4 0.5 3,858 5.8 0.5
Black 66.0 1.5 3,181 Δ Δ 1,069 Δ Δ
Hispanic 61.7 1.3 4,012 Δ Δ 1,534 6.0 0.7
Non-Hispanic 57.3 0.8 12,984 11.7 3.5 5,466 6.4 0.6
Age
Under 18 years 63.0 1.0 5,945 Δ Δ 2,205 6.6 0.7
18 to 64 years 55.7 0.7 9,875 10.8 0.5 4,365 5.9 0.3
65 years and over 60.8 1.8 1,176 Δ Δ 430 x x
Sex
Male 57.2 0.8 7,745 11.3 0.4 3,316 6.0 0.4
Female 59.6 0.7 9,251 Δ Δ 3,684 6.5 0.7
Educational Attainment
.(people 18 years and over)
Less than 4 years of high school 64.7 1.1 2,772 Δ Δ 963 8.6 0.6
High school graduate, no college 56.7 1.0 3,311 x x 1,415 7.0 0.6
One or more years of college 51.4 0.8 4,968 8.6 0.2 2,417 5.0 0.3
Disability Status
.(people 15 to 69 years)
With a work disability 62.8 1.2 2,472 Δ Δ 903 8.3 0.4
With no work disability 54.4 0.8 8,656 9.6 0.4 3,971 5.5 0.3
Residence
Metropolitan 57.4 0.7 12,972 x x 5,538 6.0 0.5
Nonmetropolitan 62.5 1.5 4,024 Δ Δ 1,462 6.8 0.8
Region
Northeast 60.6 1.6 2,410 Δ Δ 968 8.3 0.6
Midwest 58.3 1.3 3,752 10.6 0.9 1,553 6.4 1.2
South 59.7 1.2 7,004 Δ Δ 2,776 6.0 0.6
West 55.2 1.2 3,830 x x 1,703 5.6 0.6
Family Status
In families 57.8 0.8 13,217 x x 5,568 6.0 0.5
.With related children under 18 years 59.8 0.9 10,927 Δ Δ 4,385 6.2 0.6
In married-couple families 51.7 1.2 7,380 8.2 0.4 3,552 5.0 0.4
.With related children under 18 years 52.9 1.4 5,801 8.6 0.5 2,729 5.1 0.5
In families with a female hhldr., no husb. present 65.7 1.3 4,906 Δ Δ 1,681 x x
.With related children under 18 years 68.1 1.4 4,358 Δ Δ 1,386 x x
In families with a male hhldr., no wife present 61.6 2.7 931 x x 335 7.4 1.0
.With related children under 18 years 62.0 3.1 768 x x 270 7.6 0.9
Unrelated individuals 60.5 0.9 3,779 Δ Δ 1,432 7.3 0.8
Employment and Labor Force Status
.(people 18 years and over)
Employed full-time 47.9 1.2 2,168 7.1 0.5 1,145 4.8 0.1
Employed part-time 50.1 1.3 1,967 9.6 0.9 995 5.7 0.6
Unemployed 56.6 1.4 1,615 9.6 0.7 702 6.4 0.7
Not in labor force 63.4 0.8 5,064 Δ Δ 1,807 8.5 0.2
Marital Status
.(people 18 years and over)
Married 50.5 1.1 4,200 7.9 0.3 2,076 5.0 0.2
Separated, divorced, or widowed 60.7 1.0 2,909 Δ Δ 1,110 8.1 0.4
Never married 58.4 0.8 3,942 Δ Δ 1,609 6.6 0.9
Family Size
1 person (unrelated individual) 60.5 0.9 3,779 Δ Δ 1,432 7.3 0.8
2 people 55.7 1.3 2,589 10.6 1.0 1,142 6.4 1.1
3 people 55.8 1.7 2,492 x x 1,092 5.4 0.9
4 people 59.0 1.7 3,062 Δ Δ 1,281 6.0 0.8
5 people 58.3 2.0 2,497 x x 1,042 8.1 0.9
6 or more people 60.3 2.2 2,577 Δ Δ 1,011 5.1 0.7
Characteristics1
20102
Left Censored Included Left Censored Excluded
Std. Err.
Unwgtd.
Spells
Unwgtd.
Spells
Median
Spell
Length
(months)
Pct. Left
CensoredStd. Err.
Median
Spell
Length
(months) Std. Err.
Source: U.S. Census Bureau, Survey of Income and Program Participation, 2008 Panel. For information on confidentiality protection and sampling
and nonsampling error, see <http://www.census.gov/programs-surveys/sipp/tech-documentation/source-accuracy-statements/source-accuracy-
statements-2008.html>.
x This estimate has been determined to be unreliable due to a relative standard error greater than 30 percent of the estimate.
Δ Median spell length undetermined given that more than half of spells "survive" past month 11.
2 The universe for the 4-year analysis is all individuals in the poverty universe why had a valid interview all 48 months from 2009 to 2012 with a valid
panel weight. The universe for the annual analysis is all individuals in the poverty universe who had a valid interview all 12 months of the calendar
year with a valid calendar year weight.
1 Characteristics based on demographics at beginning of spell.

22
Table 7. Median Spell Length: CY 2011
All People With One or More Poverty Spell 59.6 0.7 16,260 x x 6,532 6.5 0.4
Race and Hispanic Origin
White 57.3 0.8 11,844 10.4 0.6 5,011 6.2 0.4
.White, non-Hispanic 56.0 0.9 8,255 9.5 0.4 3,593 6.2 0.5
Black 69.8 1.4 2,907 Δ Δ 887 8.0 2.2
Hispanic 60.8 1.6 3,917 Δ Δ 1,527 6.3 0.8
Non-Hispanic 59.2 0.7 12,343 11.5 2.8 5,005 6.6 0.5
Age
Under 18 years 64.8 1.0 5,440 Δ Δ 1,935 7.1 0.7
18 to 64 years 56.6 0.7 9,545 10.2 0.4 4,125 6.1 0.4
65 years and over 62.2 1.5 1,275 Δ Δ 472 8.4 0.5
Sex
Male 57.9 0.7 7,411 10.4 0.5 3,105 6.3 0.4
Female 61.2 0.7 8,849 Δ Δ 3,427 6.7 0.5
Educational Attainment
.(people 18 years and over)
Less than 4 years of high school 63.6 1.3 2,601 Δ Δ 925 8.6 2.1
High school graduate, no college 59.1 1.1 3,438 x x 1,417 6.7 0.5
One or more years of college 52.7 0.9 4,781 8.6 0.3 2,255 5.0 0.2
Disability Status
.(people 15 to 69 years)
With a work disability 61.1 1.3 2,469 Δ Δ 944 x x
With no work disability 55.7 0.8 8,335 9.1 0.3 3,693 5.5 0.5
Residence
Metropolitan 58.9 0.8 12,284 11.4 0.5 5,017 6.2 0.4
Nonmetropolitan 62.4 1.4 3,976 Δ Δ 1,515 8.3 0.4
Region
Northeast 58.5 1.7 2,252 Δ Δ 959 6.0 1.4
Midwest 60.6 1.6 3,525 x x 1,397 7.4 0.6
South 60.8 1.1 6,742 Δ Δ 2,612 6.1 0.7
West 57.6 1.4 3,741 10.3 1.2 1,564 6.3 0.8
Family Status
In families 59.2 0.8 12,679 11.4 0.4 5,176 6.2 0.5
.With related children under 18 years 61.5 0.9 10,255 Δ Δ 3,967 6.6 0.5
In married-couple families 52.8 1.1 7,159 8.3 0.4 3,357 5.0 0.5
.With related children under 18 years 54.4 1.3 5,575 8.7 0.6 2,549 5.5 0.8
In families with a female hhldr., no husb. present 69.4 1.3 4,568 Δ Δ 1,415 8.4 0.4
.With related children under 18 years 71.7 1.4 3,916 Δ Δ 1,118 x x
In families with a male hhldr., no wife present 55.5 2.7 952 x x 404 8.2 1.7
.With related children under 18 years 57.7 3.3 764 x x 300 x x
Unrelated individuals 61.1 1.0 3,581 Δ Δ 1,356 8.1 0.6
Employment and Labor Force Status
.(people 18 years and over)
Employed full-time 47.3 1.4 2,236 7.1 0.3 1,181 4.8 0.1
Employed part-time 54.5 1.4 1,759 8.7 0.3 821 6.6 0.6
Unemployed 60.6 1.5 1,358 10.9 0.7 535 7.4 1.1
Not in labor force 62.7 0.8 5,236 Δ Δ 1,925 8.2 0.3
Marital Status
.(people 18 years and over)
Married 50.8 1.1 4,104 8.0 0.4 1,991 5.0 0.2
Separated, divorced, or widowed 62.4 0.9 2,941 Δ Δ 1,106 8.1 0.7
Never married 59.5 1.0 3,775 x x 1,500 7.3 0.7
Family Size
1 person (unrelated individual) 61.1 1.0 3,581 Δ Δ 1,356 8.1 0.6
2 people 56.3 1.4 2,535 10.5 0.7 1,111 5.4 0.9
3 people 61.7 1.8 2,397 x x 936 7.2 0.9
4 people 59.4 2.0 2,885 x x 1,179 5.8 0.9
5 people 60.9 2.2 2,434 x x 954 6.2 1.3
6 or more people 57.2 2.7 2,428 x x 996 6.2 1.0
Characteristics1
20112
Pct. Left
CensoredStd. Err.
Left Censored Included Left Censored Excluded
Std. Err.
Unwgtd.
Spells
Median
Spell
Length
(months) Std. Err.
Unwgtd.
Spells
Median
Spell
Length
(months)
Source: U.S. Census Bureau, Survey of Income and Program Participation, 2008 Panel. For information on confidentiality protection and sampling
and nonsampling error, see <http://www.census.gov/programs-surveys/sipp/tech-documentation/source-accuracy-statements/source-accuracy-
statements-2008.html>.
x This estimate has been determined to be unreliable due to a relative standard error greater than 30 percent of the estimate.
Δ Median spell length undetermined given that more than half of spells "survive" past month 11.
2 The universe for the 4-year analysis is all individuals in the poverty universe why had a valid interview all 48 months from 2009 to 2012 with a valid
panel weight. The universe for the annual analysis is all individuals in the poverty universe who had a valid interview all 12 months of the calendar
year with a valid calendar year weight.
1 Characteristics based on demographics at beginning of spell.
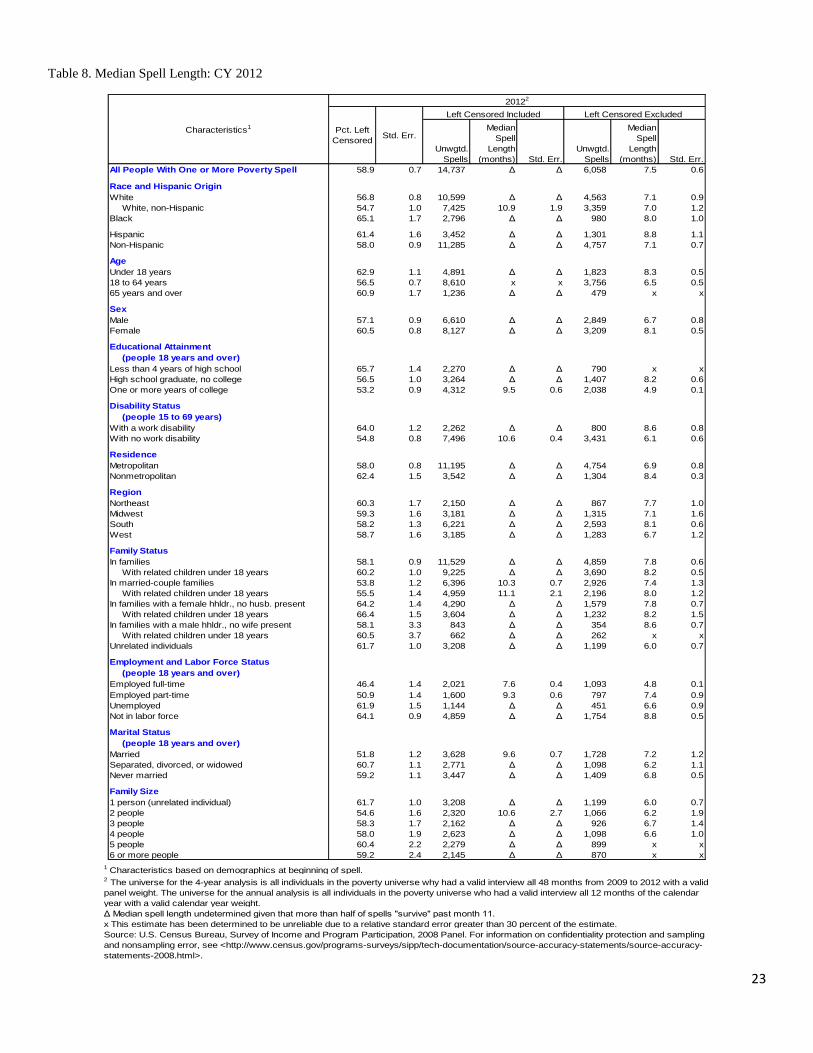
23
Table 8. Median Spell Length: CY 2012
All People With One or More Poverty Spell 58.9 0.7 14,737 Δ Δ 6,058 7.5 0.6
Race and Hispanic Origin
White 56.8 0.8 10,599 Δ Δ 4,563 7.1 0.9
.White, non-Hispanic 54.7 1.0 7,425 10.9 1.9 3,359 7.0 1.2
Black 65.1 1.7 2,796 Δ Δ 980 8.0 1.0
Hispanic 61.4 1.6 3,452 Δ Δ 1,301 8.8 1.1
Non-Hispanic 58.0 0.9 11,285 Δ Δ 4,757 7.1 0.7
Age
Under 18 years 62.9 1.1 4,891 Δ Δ 1,823 8.3 0.5
18 to 64 years 56.5 0.7 8,610 x x 3,756 6.5 0.5
65 years and over 60.9 1.7 1,236 Δ Δ 479 x x
Sex
Male 57.1 0.9 6,610 Δ Δ 2,849 6.7 0.8
Female 60.5 0.8 8,127 Δ Δ 3,209 8.1 0.5
Educational Attainment
.(people 18 years and over)
Less than 4 years of high school 65.7 1.4 2,270 Δ Δ 790 x x
High school graduate, no college 56.5 1.0 3,264 Δ Δ 1,407 8.2 0.6
One or more years of college 53.2 0.9 4,312 9.5 0.6 2,038 4.9 0.1
Disability Status
.(people 15 to 69 years)
With a work disability 64.0 1.2 2,262 Δ Δ 800 8.6 0.8
With no work disability 54.8 0.8 7,496 10.6 0.4 3,431 6.1 0.6
Residence
Metropolitan 58.0 0.8 11,195 Δ Δ 4,754 6.9 0.8
Nonmetropolitan 62.4 1.5 3,542 Δ Δ 1,304 8.4 0.3
Region
Northeast 60.3 1.7 2,150 Δ Δ 867 7.7 1.0
Midwest 59.3 1.6 3,181 Δ Δ 1,315 7.1 1.6
South 58.2 1.3 6,221 Δ Δ 2,593 8.1 0.6
West 58.7 1.6 3,185 Δ Δ 1,283 6.7 1.2
Family Status
In families 58.1 0.9 11,529 Δ Δ 4,859 7.8 0.6
.With related children under 18 years 60.2 1.0 9,225 Δ Δ 3,690 8.2 0.5
In married-couple families 53.8 1.2 6,396 10.3 0.7 2,926 7.4 1.3
.With related children under 18 years 55.5 1.4 4,959 11.1 2.1 2,196 8.0 1.2
In families with a female hhldr., no husb. present 64.2 1.4 4,290 Δ Δ 1,579 7.8 0.7
.With related children under 18 years 66.4 1.5 3,604 Δ Δ 1,232 8.2 1.5
In families with a male hhldr., no wife present 58.1 3.3 843 Δ Δ 354 8.6 0.7
.With related children under 18 years 60.5 3.7 662 Δ Δ 262 x x
Unrelated individuals 61.7 1.0 3,208 Δ Δ 1,199 6.0 0.7
Employment and Labor Force Status
.(people 18 years and over)
Employed full-time 46.4 1.4 2,021 7.6 0.4 1,093 4.8 0.1
Employed part-time 50.9 1.4 1,600 9.3 0.6 797 7.4 0.9
Unemployed 61.9 1.5 1,144 Δ Δ 451 6.6 0.9
Not in labor force 64.1 0.9 4,859 Δ Δ 1,754 8.8 0.5
Marital Status
.(people 18 years and over)
Married 51.8 1.2 3,628 9.6 0.7 1,728 7.2 1.2
Separated, divorced, or widowed 60.7 1.1 2,771 Δ Δ 1,098 6.2 1.1
Never married 59.2 1.1 3,447 Δ Δ 1,409 6.8 0.5
Family Size
1 person (unrelated individual) 61.7 1.0 3,208 Δ Δ 1,199 6.0 0.7
2 people 54.6 1.6 2,320 10.6 2.7 1,066 6.2 1.9
3 people 58.3 1.7 2,162 Δ Δ 926 6.7 1.4
4 people 58.0 1.9 2,623 Δ Δ 1,098 6.6 1.0
5 people 60.4 2.2 2,279 Δ Δ 899 x x
6 or more people 59.2 2.4 2,145 Δ Δ 870 x x
20122
Characteristics1 Pct. Left
CensoredStd. Err.
Left Censored Included Left Censored Excluded
Unwgtd.
Spells
Median
Spell
Length
(months) Std. Err.
Unwgtd.
Spells
Median
Spell
Length
(months) Std. Err.
Source: U.S. Census Bureau, Survey of Income and Program Participation, 2008 Panel. For information on confidentiality protection and sampling
and nonsampling error, see <http://www.census.gov/programs-surveys/sipp/tech-documentation/source-accuracy-statements/source-accuracy-
statements-2008.html>.
x This estimate has been determined to be unreliable due to a relative standard error greater than 30 percent of the estimate.
Δ Median spell length undetermined given that more than half of spells "survive" past month 11.
2 The universe for the 4-year analysis is all individuals in the poverty universe why had a valid interview all 48 months from 2009 to 2012 with a valid
panel weight. The universe for the annual analysis is all individuals in the poverty universe who had a valid interview all 12 months of the calendar
year with a valid calendar year weight.
1 Characteristics based on demographics at beginning of spell.

24
Table 9. Differences in Median Spell Duration (Left-Censored Excluded): Panel and Year-to-Year Differences
Diff. SE Diff. SE Diff. SE Diff. SE Diff. SE Diff. SE Diff. SE
All People With One or More Poverty Spell 1.8 0.5 . . . . x x x x . . . .
Race and Hispanic Origin
White x x . . . . . . x x . . . .
.White, non-Hispanic x x . . . . . . . . . . . .
Black . . Δ Δ . . . . Δ Δ Δ Δ . .
Hispanic x x . . . . . . x x . . x x
Non-Hispanic x x . . . . . . x x . . . .
Age
Under 18 years x x . . . . x x x x . . . .
18 to 64 years x x . . . . . . x x . . . .
65 years and over . . . . . . . . . . . . . .
Sex
Male x x . . . . . . x x . . . .
Female 1.6 0.4 . . . . x x x x . . x x
Educational Attainment
.(people 18 years and over)
Less than 4 years of high school . . . . . . . . . . . . . .
High school graduate, no college x x . . . . x x x x . . x x
One or more years of college . . . . . . . . x x . . . .
Disability Status
.(people 15 to 69 years)
With a work disability . . . . . . . . . . . . . .
With no work disability x x . . . . . . x x . . . .
Residence
Metropolitan x x . . . . . . x x . . . .
Nonmetropolitan . . . . . . . . . . x x . .
Region
Northeast . . x x . . . . . . . . . .
Midwest x x . . x x . . . . . . . .
South x x . . . . . . -2.4 0.7 . . x x
West . . . . . . . . . . . . . .
Family Status
In families x x . . . . x x x x . . x x
.With related children under 18 years x x . . . . x x x x . . x x
In married-couple families . . . . . . . . . . . . x x
.With related children under 18 years . . . . . . . . . . . . x x
In families with a female hhldr., no husb. present . . . . . . . . . . . . . .
.With related children under 18 years . . . . . . . . . . . . . .
In families with a male hhldr., no wife present . . . . . . . . . . . . . .
.With related children under 18 years Δ Δ . . . . . . Δ Δ . . . .
Unrelated individuals x x . . x x . . . . . . x x
Employment and Labor Force Status
.(people 18 years and over)
Employed full-time . . . . . . . . . . . . . .
Employed part-time x x . . . . x x x x . . . .
Unemployed . . . . . . . . . . . . . .
Not in labor force . . . . . . . . . . . . . .
Marital Status
.(people 18 years and over)
Married . . . . . . . . x x . . x x
Separated, divorced, or widowed . . . . . . . . . . . . . .
Never married x x . . . . . . . . . . . .
Family Size
1 person (unrelated individual) x x . . x x . . . . . . x x
2 people x x . . . . . . . . . . . .
3 people x x . . . . . . x x . . . .
4 people . . . . . . . . . . . . . .
5 people . . . . . . . . . . . . . .
6 or more people . . . . . . . . . . . . . .
1 Characteristics based on demographics at beginning of spell.
Δ Median spell length undetermined given that more than half of spells "survive" past month 11.
x This estimate has been determined to be unreliable due to a relative standard error greater than 30 percent of the estimate.
. Difference is not statistically significant at the 90 percent confidence level.
Source: U.S. Census Bureau, Survey of Income and Program Participation, 2008 Panel. For information on confidentiality protection and sampling and nonsampling
error, see <http://www.census.gov/programs-surveys/sipp/tech-documentation/source-accuracy-statements/source-accuracy-statements-2008.html>.
Characteristics1
2 The universe for the 4-year analysis is all individuals in the poverty universe why had a valid interview all 48 months from 2009 to 2012 with a valid panel weight. The
universe for the annual analysis is all individuals in the poverty universe who had a valid interview all 12 months of the calendar year with a valid calendar year weight.
2009 to 2010 2011 to 20122010 to 2011
CY Year-to-Year Differences2
2009 2010 2011 2012
Difference Across 4-Year and CY Estimates2

25
Figure 1. Life-Table Survival Curves and Hazard Functions: Only Left-Censored Spells
Figure 2. Life-Table Survival Curves and Hazard Functions: Excluding Left-Censored Spells
Figure 3. Life-Table Survival Curves and Hazard Functions: All Spells

26
Table 10. Differences in Median Spell Durations: Left-Censored Spells Included and Excluded
L.C. In L.C. Out L.C. In L.C. Out L.C. In L.C. Out L.C. In L.C. Out L.C. In L.C. Out
All People With One or More Poverty Spell 7.9 6.2 1.7 0.2 x 7.9 . . Δ 6.2 Δ Δ x 6.5 . . Δ 7.5 Δ Δ
Race and Hispanic Origin
White 7.1 5.8 1.3 0.2 11.1 7.2 3.8 0.5 10.8 5.8 4.9 0.6 10.4 6.2 4.1 0.6 Δ 7.1 Δ Δ
.White, non-Hispanic 6.8 5.4 1.3 0.2 9.8 6.8 2.9 0.6 9.4 5.8 3.7 0.6 9.5 6.2 3.3 0.6 10.9 7.0 x x
Black 9.9 8.2 x x Δ x Δ Δ Δ Δ Δ Δ Δ 8.0 Δ Δ Δ 8.0 Δ Δ
Hispanic 8.2 6.4 1.7 0.3 Δ 8.3 Δ Δ Δ 6.0 Δ Δ Δ 6.3 Δ Δ Δ 8.8 Δ Δ
Non-Hispanic 7.7 6.0 1.6 0.2 11.2 7.7 3.5 0.4 11.7 6.4 x x 11.5 6.6 4.9 1.3 Δ 7.1 Δ Δ
Age
Under 18 years 8.5 6.6 1.8 0.3 Δ 8.2 Δ Δ Δ 6.6 Δ Δ Δ 7.1 Δ Δ Δ 8.3 Δ Δ
18 to 64 years 7.1 5.8 1.3 0.2 10.4 7.3 3.0 0.4 10.8 5.9 4.9 0.5 10.2 6.1 4.1 0.4 x 6.5 . .
65 years and over 8.9 8.4 . . Δ x Δ Δ Δ x Δ Δ Δ 8.4 Δ Δ Δ x Δ Δ
Sex
Male 7.1 5.7 1.3 0.2 10.6 7.5 3.1 0.4 11.3 6.0 5.3 0.5 10.4 6.3 4.1 0.5 Δ 6.7 Δ Δ
Female 8.3 6.6 1.7 0.2 Δ 8.1 Δ Δ Δ 6.5 Δ Δ Δ 6.7 Δ Δ Δ 8.1 Δ Δ
Educational Attainment
.(people 18 years and over)
Less than 4 years of high school 9.5 8.2 x x Δ x Δ Δ Δ 8.6 Δ Δ Δ 8.6 Δ Δ Δ x Δ Δ
High school graduate, no college 8.1 6.9 1.2 0.3 x 8.1 . . x 7.0 . . x 6.7 . . Δ 8.2 Δ Δ
One or more years of college 5.7 4.9 x x 8.6 5.9 2.7 0.4 8.6 5.0 3.6 0.3 8.6 5.0 3.6 0.3 9.5 4.9 4.6 0.6
Disability Status
.(people 15 to 69 years)
With a work disability 9.0 8.1 x x Δ 8.7 Δ Δ Δ 8.3 Δ Δ Δ x Δ Δ Δ 8.6 Δ Δ
With no work disability 6.5 5.3 1.3 0.2 9.4 7.1 2.3 0.4 9.6 5.5 4.0 0.4 9.1 5.5 3.5 0.5 10.6 6.1 4.5 0.6
Residence
Metropolitan 7.5 5.9 1.6 0.2 11.3 7.6 3.7 0.5 x 6.0 x x 11.4 6.2 5.2 0.5 Δ 6.9 Δ Δ
Nonmetropolitan 8.5 7.3 x x Δ x Δ Δ Δ 6.8 Δ Δ Δ 8.3 Δ Δ Δ 8.4 Δ Δ
Region
Northeast 8.0 6.2 x x 10.6 6.0 4.5 1.3 Δ 8.3 Δ Δ Δ 6.0 Δ Δ Δ 7.7 Δ Δ
Midwest 7.4 5.8 1.6 0.5 Δ 7.6 Δ Δ 10.6 6.4 x x x 7.4 . . Δ 7.1 Δ Δ
South 8.3 7.1 1.2 0.3 Δ 8.4 Δ Δ Δ 6.0 Δ Δ Δ 6.1 Δ Δ Δ 8.1 Δ Δ
West 6.7 5.1 1.6 0.5 10.8 6.5 4.3 0.9 x 5.6 x x 10.3 6.3 4.0 1.1 Δ 6.7 Δ Δ
Family Status
In families 7.5 6.0 1.5 0.2 11.4 7.6 3.7 0.5 x 6.0 x x 11.4 6.2 5.2 0.5 Δ 7.8 Δ Δ
.With related children under 18 years 8.1 6.4 1.7 0.2 Δ 8.1 Δ Δ Δ 6.2 Δ Δ Δ 6.6 Δ Δ Δ 8.2 Δ Δ
In married-couple families 6.1 5.1 1.0 0.2 8.3 5.9 2.4 0.5 8.2 5.0 3.2 0.4 8.3 5.0 3.3 0.5 10.3 7.4 x x
.With related children under 18 years 6.4 5.5 0.9 0.2 8.7 6.0 2.7 0.6 8.6 5.1 3.5 0.5 8.7 5.5 3.3 0.7 11.1 8.0 x x
In families with a female hhldr., no husb. present 10.8 8.1 x x Δ 8.6 Δ Δ Δ x Δ Δ Δ 8.4 Δ Δ Δ 7.8 Δ Δ
.With related children under 18 years 12.1 8.2 3.8 0.8 Δ 8.8 Δ Δ Δ x Δ Δ Δ x Δ Δ Δ 8.2 Δ Δ
In families with a male hhldr., no wife present 7.4 6.6 . . 9.7 x . . x 7.4 . . x 8.2 . . Δ 8.6 Δ Δ
.With related children under 18 years 8.0 7.1 . . x Δ Δ Δ x 7.6 . . x x . . Δ x Δ Δ
Unrelated individuals 8.4 6.8 1.6 0.4 Δ 8.5 Δ Δ Δ 7.3 Δ Δ Δ 8.1 Δ Δ Δ 6.0 Δ Δ
Employment and Labor Force Status
.(people 18 years and over)
Employed full-time 4.9 4.7 0.1 0.0 7.6 5.2 2.5 0.3 7.1 4.8 2.3 0.4 7.1 4.8 2.4 0.3 7.6 4.8 2.8 0.4
Employed part-time 6.7 5.7 1.0 0.2 9.0 7.6 x x 9.6 5.7 3.9 0.8 8.7 6.6 2.1 0.6 9.3 7.4 x x
Unemployed 7.9 7.1 x x 9.0 7.0 2.0 0.5 9.6 6.4 3.1 0.8 10.9 7.4 3.6 1.0 Δ 6.6 Δ Δ
Not in labor force 9.1 8.2 x x Δ 8.8 Δ Δ Δ 8.5 Δ Δ Δ 8.2 Δ Δ Δ 8.8 Δ Δ
Marital Status
.(people 18 years and over)
Married 5.8 5.0 x x 8.0 5.8 2.2 0.3 7.9 5.0 2.9 0.3 8.0 5.0 3.0 0.3 9.6 7.2 x x
Separated, divorced, or widowed 8.7 8.1 0.6 0.2 Δ 8.6 Δ Δ Δ 8.1 Δ Δ Δ 8.1 Δ Δ Δ 6.2 Δ Δ
Never married 8.0 6.3 1.8 0.2 Δ 8.0 Δ Δ Δ 6.6 Δ Δ x 7.3 . . Δ 6.8 Δ Δ
Family Size
1 person (unrelated individual) 8.4 6.8 1.6 0.4 Δ 8.5 Δ Δ Δ 7.3 Δ Δ Δ 8.1 Δ Δ Δ 6.0 Δ Δ
2 people 7.0 5.0 2.0 0.6 9.5 6.8 2.7 0.7 10.6 6.4 4.2 1.2 10.5 5.4 5.1 0.8 10.6 6.2 x x
3 people 7.4 6.1 x x x 8.1 x x x 5.4 x x x 7.2 . . Δ 6.7 Δ Δ
4 people 7.7 5.9 1.8 0.4 Δ 7.7 Δ Δ Δ 6.0 Δ Δ x 5.8 x x Δ 6.6 Δ Δ
5 people 8.1 6.6 x x Δ 7.8 Δ Δ x 8.1 . . x 6.2 . . Δ x Δ Δ
6 or more people 7.5 6.4 . . x 8.1 . . Δ 5.1 Δ Δ x 6.2 . . Δ x Δ Δ
Δ Median spell length undetermined given that more than half of spells "survive" past month 11.
x This estimate has been determined to be unreliable due to a relative standard error greater than 30 percent of the estimate.
Source: U.S. Census Bureau, Survey of Income and Program Participation, 2008 Panel. For information on confidentiality protection and sampling and nonsampling error, see <http://www.census.gov/programs-
surveys/sipp/tech-documentation/source-accuracy-statements/source-accuracy-statements-2008.html>.
. Difference across medians is not statistically significant at the 90 percent confidence level.
1 Characteristics based on demographics at beginning of spell.
CY 20122
Medians
Diff. SE
CY 20112
Medians
Diff. SE
Medians
Diff. SE
CY 20102
Characteristics1 Medians
Diff. SE
2 The universe for the 4-year analysis is all individuals in the poverty universe why had a valid interview all 48 months from 2009 to 2012 with a valid panel weight. The universe for the annual analysis is all
individuals in the poverty universe who had a valid interview all 12 months of the calendar year with a valid calendar year weight.
Medians
2009-20122
SEDiff.
CY 20092
27
References
Allison, Paul D. 2010. Survival Analysis Using SAS: A Practical Guide, Second Edition. Cary, NC: SAS Institute.
Anderson, Robin J. “Dynamics of Economic Well-Being: Poverty, 2004-2006.” Current Population Reports. P70-123. U.S. Census
Bureau. Washington, DC. 2011.
Bane, Mary Jo and David Ellwood. 1986. "Slipping Into and Out of Poverty: The Dynamics of Spells." Journal of Human Resources
21(Winter): 1-23.
Bane, Mary Jo and David Ellwood. 1994. Welfare Realities: From Rhetoric to Reform. Cambridge, MA: Harvard University Press.
Cellini, Stephanie R., Signe-Mary McKernan, and Caroline Ratcliffe. 2008. “The Dynamics of Poverty in the United States: A Review
of Data, Methods, and Findings.” Journal of Policy Analysis and Management 27: 577–605.
David, Martin, and John Fitzgerald. 1987. “Measuring Poverty and Crises: A Comparison of Annual and Subannual Accounting
Periods Using the Survey of Income and Program Participation.” Institute for Research on Poverty. Discussion Paper 843-87.
University of Wisconsin-Madison.
Duncan, Greg J., Smeeding, Timothy and Rodgers, Willard.1992. “The Incredible Shrinking Middle Class.” American Demographics
14(5): 34-38.
Edwards, Ashley. 2015. “Crisis, Chronic, and Churning: an Analysis of Varying Poverty Experiences.” Presented at the 2015
Population Association of America Annual Meetings. San Diego, CA.
Edwards, Ashley N. “Dynamics of Economic Well-Being: Poverty, 2009-2011.” Current Population Reports. P70-137. U.S. Census
Bureau. Washington, DC. 2014.
Eller, T. J. “Dynamics of Economic Well-Being: Poverty, 1992-1993.” Current Population Reports, P70-55. U.S. Census Bureau.
Washington, DC. 1996.
Engel, Rafael J. 1989. “Economic Vulnerability of the Transitory Poor Elderly.” Proceedings of the Social Statistics Section.
Alexandria, VA.: American Statistical Association.
Iceland, John. 1997. "The Dynamics of Poverty Spells and Issues of Left-Censoring." Population Studies Center Research Report No.
97-378. University of Michigan.
Iceland, John. “Dynamics of Economic Well-Being, Poverty 1996-1999.” Current Population Reports. P70-91. U.S. Census Bureau.
Washington, DC. 2003.
Iceland, John. 1996. "Urban Labor Markets and Transitions Out of Poverty." Presented at the 1996 Population Association of America
Annual Meetings. New Orleans. LA.
Lerman, Robert I. and Shlomo Yitzhaki. 1989. “The Time Dimension in Poverty and Inequality.” Draft paper prepared for the Office
of the Assistant Secretary for Planning and Evaluation, U.S. Department of Health and Human Services . Brandeis University
and Hebrew University, Israel.
McKernan, Signe-Mary and Caroline Ratcliffe. 2005. “Events that Trigger Poverty Entries and Exits.” Social Science Quarterly 86(5):
1146-1169.
Measuring Poverty: A New Approach. C. Citro and R. Michaels (Eds.) National Academies Press. 1995.
Naifeh, Mary. “Dynamics of Economic Well-Being, Poverty 1993-1994.” Current Population Reports. P70-63. U.S. Census Bureau.
Washington, DC. 1998.
Pavetti, LaDonna. 1993. “The Dynamics of Welfare and Work: Exploring the Process by Which Women Work Their Way Off
Welfare.” Ph.D. dissertation, Harvard University.

28
Ruggles, Patricia. 1988. “Accounting Period Impacts on the Measured Duration of Poverty Spells.” The Urban Institute, Washington,
D.C.
Shea, Martina. “Dynamics of Economic Well-Being: Poverty, 1990-1992.” Current Population Reports. P70-42. U.S. Census Bureau.
Washington, DC. 1995.
Stevens, Ann Huff. 1994. "The Dynamics of Poverty Spells: Updating Bane and Ellwood." American Economic Association Papers
and Proceedings. 84(2): 34-37.
Zhang, Wei. 1993. “Survival Data Analysis: Life Table Methods.” North East SAS Users Group Proceedings.