the surprising similarities of facebook social media and ......the surprising similarities of social...
TRANSCRIPT

The surprising similarities of social media and search engine business models Comparative Study Google, Facebook, Twitter,
Snapchat, Pinterest
Strategy - Business Model - Financials - Economics
Snapchat
© Dr Murat Uenlue, PgMP, PMP
Innovationtactics.com
For personal use only, not to be further distributed or uploaded.
This is a commented excerpt and walkthrough of my Comparative Study of Google, Facebook, Twitter, Snapchat, Pinterest. This product contains:
- The comparative study which is 130+ pages - 8 Worksheets - It comes with an individual case study of each of the 5
platforms: Google, Facebook, Twitter, Snapchat, Pinterest which have a several resources as well
What you can learn from it can be applied to a wide range of platform businesses, far beyond search engines or social networks. You can learn a lot about building your own business based on an app though I very rarely use the word app because an app by itself has no chance to succeed if there is no business model behind it.
The comparative study as well as this excerpt are subject to
Copyright I am respecting the intellectual property of others, and I am asking everybody to
do the same. Being able to use the internet as a convenient highway for
knowledge exchange depends on all of us reciprocating the respect for each
other’s intellectual property.
Copyright © 2020 by Murat Uenlue
All rights reserved.
This book or any portion thereof may not be reproduced or used in any manner
whatsoever without the express written permission of the publisher.
Dear innovator,
Thank you for your commitment to innovation! My contribution to your
innovation journey is to provide you with high-value, real-world knowledge.
My blog has allowed me to connect with a wonderful and diverse community of
innovators. Your wonderful feedback has been motivating me to ever increase the
value that you get from my resources. The guiding principle for this study was the
proverb:
“Give a man a fish and you feed him for a day; teach a man to fish and you
feed him for a lifetime.” - Anne Isabella Thackeray Ritchie
I have refrained from the urge to tell you why the bigger platforms that we are
covering here (Google, Facebook) are big and the smaller ones (Twitter, Snapchat,
Pinterest) are small. This would have been fraught inherently with the risk of
confirmation bias. Reading carefully you can still get my view what the key factors
were but it is not the overarching theme. (I have read too many management
books that have glorified companies successful at the time just to be proven
wrong a few years later.)
Instead, you will get valuable frameworks and tools (including worksheets) to
apply to questions that are most relevant to the problems you are trying to solve.
From there, we branch out into several comparisons across the 5 platforms.
Most of what you will learn can be applied far beyond Social & Search platforms!
You will learn the fundamentals paired with real-world examples (our 5
platforms). The worksheets will enable you to develop your own platform (and
save you big, big bucks on advisory, having to give shareholdership and being
dependent on others’ IP).
Without further ado, let’s jump into our exciting journey!
Dr Murat Uenlue, PgMP, PMP Sydney / Australia, 2020
Overview
This study starts with the macro view, goes to the detailed view and closes the
circle with more of the macro view. And this is how it will look like:
1. Macro revenue view
2. Value proposition
3. Multi-sided platforms
4. Data capture & targeting
5. Digital properties
6. Market overview and monetisation
7. Strategy & Business model
This study comes with 5 individual case studies (Google, Facebook, Twitter,
Snapchat, Pinterest). You don’t need to have read the individual case studies to
get started with this study. I have provided references as necessary.
The individual case studies may look similar to each other at first glance. But that
is not the case. Each of them shows the big picture but goes into details on
different aspects. This combines the big picture with essential details. The
references in this study will point you to the right chapter in the right case study.
I have chosen this approach to empower you to:
1. Educate yourself: Understand how platform businesses work
2. Analyse other platform businesses not covered here
3. Synthesise and be able to create your own platform business innovations
The worksheets (click here to access) can help you especially with the creation of
your own platform.
Revenue: How do Search and Social platforms make money?
Google and Facebook are highly profitable companies with good balance sheets,
little long-term debt and staggering income statements (statement of operations)
for over a decade. Twitter has started becoming profitable as of recent. Snapchat
and Pinterest have to still get there but are making good revenues.
Social and Search platforms
Search and Social , as I will call it in this study, are the biggest players in the digital 1
ad industry. Compare the charts on the next page. The first chart shows that US
digital advertising has exceeded TV ads a few years ago and remains on a growth
trajectory while the latter is forecasted to decline slowly (or stay put).
You can also see how small the three smaller players (Twitter, Snap Inc, Pinterest)
are by comparison. But you can interpret it also as great opportunities ahead due
to the market size.
The macro view shows how Google’s and Facebook’s revenues compare to the
GDP generated by entire industries in the US. This typically is the revenue of all
players in that industry (with some exceptions, notably retail). I have chosen
industries in a similar ballpark to Google+Facebook. There are some bigger ones
which are not shown.
The thick line shows Google+Facebook’s global revenue. Their global revenue is
now on par with the US air transportation industry and at 62% of gas and oil
exploration (a pretty big industry, right?). The dashed line shows the “software
industry” which they are part of. You can see how they are a major contributor to
its growth rates. This is not meant to be a perfect comparison.
The aim is to give us a feeling of what we are talking about. We will get into more
revenue details later. But I wanted you to be aware of the macro view.
1 Note that Pinterest, Twitter and Snapchat CEOs don’t call their platforms a social media platform. The reason is that Facebook dominates this category. But I will use this terminology (Social and Search) throughout this study.

Digital advertising in the US has exceeded TV and is still on a growth trajectory while broadcast TV is not. Digital TV may increasingly incorporate digital ads tapping into existing digital ad infrastructure (which we will cover later).
Google is the largest player followed by Facebook. Alibaba and Amazon are big in the ecommerce ad vertical. Snapchat, Pinterest and Twitter are trying to gain market share. Below you see how large Google and Facebook are in comparison to entire industries.
Value proposition (VP)
The core of every business is its value proposition. Traditional businesses typically
have to provide a value proposition to one type of end-customer. Platform
business models differ in that they have to deliver distinct value propositions to
more than one type of participant of the multi-sided platform (called “sides of the
platform”, more in the next chapter).
The key sides / participant types are:
1. Users (as in “ordinary” users)
2. Businesses
3. Advertisers
We will look at the value proposition to all the sides because they all have
different reasons for joining the platform and are crucial for the platform’s
existence / revenue generation.
We are starting with businesses and advertisers while we are still in the financial
mindset. It’s important to note that advertisers are a subset of businesses. But
there has to be an additional value proposition for businesses to become
advertisers, hence pay money to access the additional benefits. Many start-ups
struggle with this: finding a value proposition that someone is willing to pay for
(beyond free participation which is necessary to have users in the first place).
I will make sure that we introduce a common terminology across our 5 platforms
so that we have a harmonized terminology for this comparative case study. It is
one level up from what we have said in the individual case studies.
If you are interested in any of the platforms, check out the section Case study >>
vision and what they stand for and Case study >> value proposition . 2
2 I get the occasional question why I have used the terminology and words that I have used in the value proposition section of the case studies. The simple answer is that I have researched what the platforms say about themselves across several of their sources and overlaid with some other sources but with an overweight on their internal view. The result then is a heterogeneous clutter of terminology as the management in the different companies have their preferred expressions. For our purposes here, it’s important to tidy this up and stick with it throughout.
The next pages go through the
- Value proposition for Businesses
- Value proposition for Advertisers
- Value proposition for Users
I am bringing all 5 platforms that we are looking at to a
common set of value propositions. This is not only very useful
in realising how similar they are on this level of the business
model.
It actually is of great value to:
(1) know what these value propositions are
(2) Be able to apply to an analysis to other companies
(3) Be able to apply to your own ideas
Basically, you can literally take these value propositions and use
it as a checkbox for whatever is your goal.
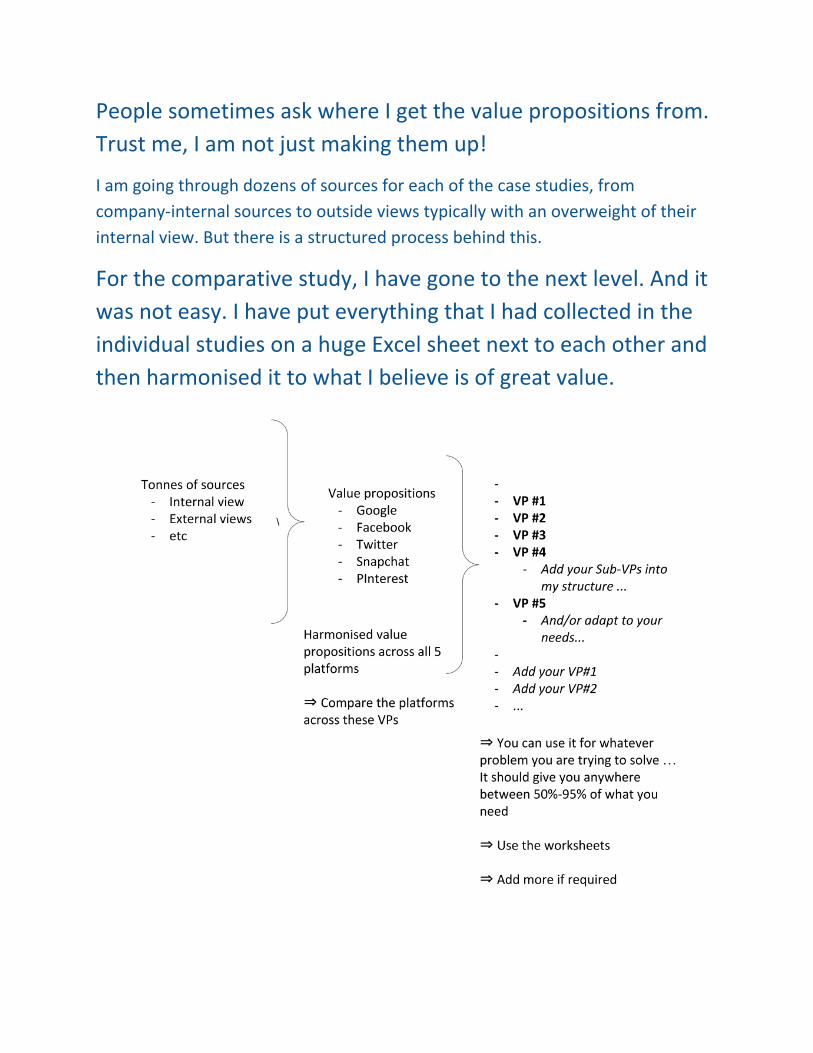
People sometimes ask where I get the value propositions from.
Trust me, I am not just making them up!
I am going through dozens of sources for each of the case studies, from
company-internal sources to outside views typically with an overweight of their
internal view. But there is a structured process behind this.
For the comparative study, I have gone to the next level. And it
was not easy. I have put everything that I had collected in the
individual studies on a huge Excel sheet next to each other and
then harmonised it to what I believe is of great value.
Skipping a few pages now
Many start-ups struggle to monetise their ideas.
By understanding the value proposition that these 5 platforms
offer their customers (i.e. advertisers), you will learn what you
need to do.
I have found it awe-inspiring! They are not just giving their
customer a little teeny-weeny value proposition.
They are providing HUGE additional value. You can literally
rattle down the list of important strategic / microeconomic
concepts …. If you are struggling to understand why your app
or platform is not monetising well, you will need to know these
details!!
As I said: it is absolutely inspiring and eye-opening!!
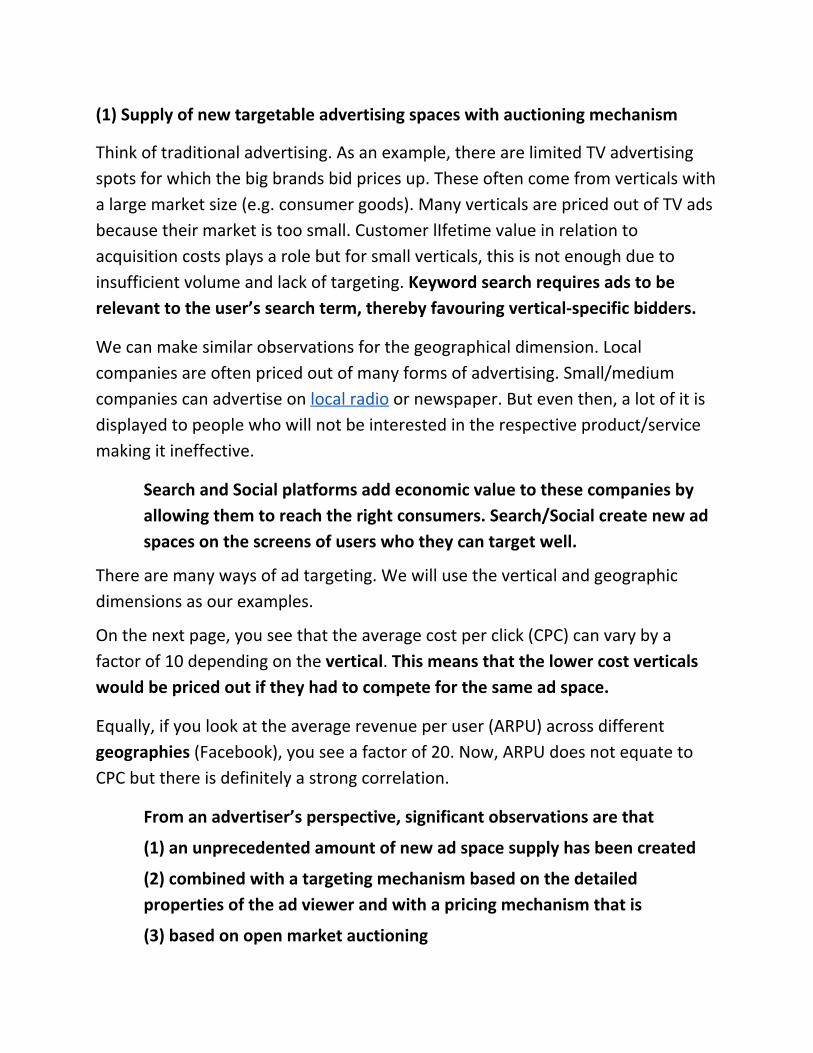
(1) Supply of new targetable advertising spaces with auctioning mechanism
Think of traditional advertising. As an example, there are limited TV advertising
spots for which the big brands bid prices up. These often come from verticals with
a large market size (e.g. consumer goods). Many verticals are priced out of TV ads
because their market is too small. Customer lIfetime value in relation to
acquisition costs plays a role but for small verticals, this is not enough due to
insufficient volume and lack of targeting. Keyword search requires ads to be
relevant to the user’s search term, thereby favouring vertical-specific bidders.
We can make similar observations for the geographical dimension. Local
companies are often priced out of many forms of advertising. Small/medium
companies can advertise on local radio or newspaper. But even then, a lot of it is
displayed to people who will not be interested in the respective product/service
making it ineffective.
Search and Social platforms add economic value to these companies by
allowing them to reach the right consumers. Search/Social create new ad
spaces on the screens of users who they can target well.
There are many ways of ad targeting. We will use the vertical and geographic
dimensions as our examples.
On the next page, you see that the average cost per click (CPC) can vary by a
factor of 10 depending on the vertical. This means that the lower cost verticals
would be priced out if they had to compete for the same ad space.
Equally, if you look at the average revenue per user (ARPU) across different
geographies (Facebook), you see a factor of 20. Now, ARPU does not equate to
CPC but there is definitely a strong correlation.
From an advertiser’s perspective, significant observations are that
(1) an unprecedented amount of new ad space supply has been created
(2) combined with a targeting mechanism based on the detailed
properties of the ad viewer and with a pricing mechanism that is
(3) based on open market auctioning
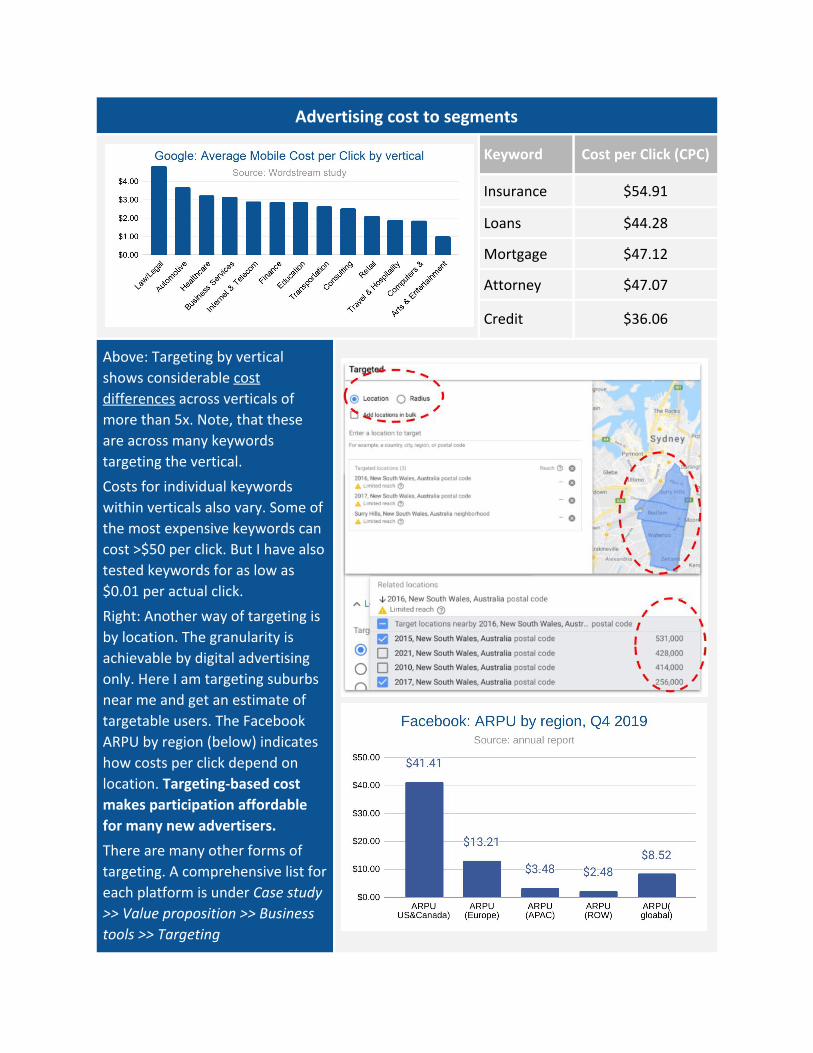
Advertising cost to segments
Keyword Cost per Click (CPC)
Insurance $54.91
Loans $44.28
Mortgage $47.12
Attorney $47.07
Credit $36.06
Above: Targeting by vertical
shows considerable cost
differences across verticals of
more than 5x. Note, that these
are across many keywords
targeting the vertical.
Costs for individual keywords
within verticals also vary. Some of
the most expensive keywords can
cost >$50 per click. But I have also
tested keywords for as low as
$0.01 per actual click.
Right: Another way of targeting is
by location. The granularity is
achievable by digital advertising
only. Here I am targeting suburbs
near me and get an estimate of
targetable users. The Facebook
ARPU by region (below) indicates
how costs per click depend on
location. Targeting-based cost
makes participation affordable
for many new advertisers.
There are many other forms of
targeting. A comprehensive list for
each platform is under Case study
>> Value proposition >> Business
tools >> Targeting
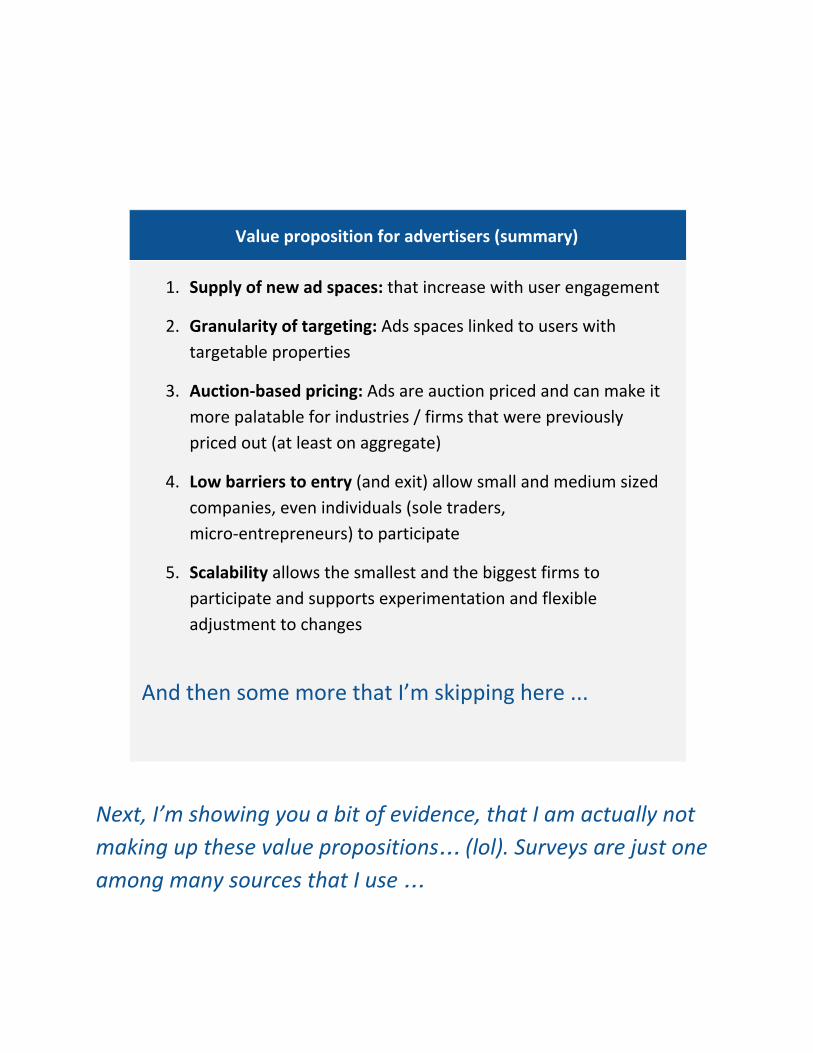
Value proposition for advertisers (summary)
1. Supply of new ad spaces: that increase with user engagement
2. Granularity of targeting: Ads spaces linked to users with
targetable properties
3. Auction-based pricing: Ads are auction priced and can make it
more palatable for industries / firms that were previously
priced out (at least on aggregate)
4. Low barriers to entry (and exit) allow small and medium sized
companies, even individuals (sole traders,
micro-entrepreneurs) to participate
5. Scalability allows the smallest and the biggest firms to
participate and supports experimentation and flexible
adjustment to changes
And then some more that I’m skipping here ...
Next, I’m showing you a bit of evidence, that I am actually not
making up these value propositions… (lol). Surveys are just one
among many sources that I use …
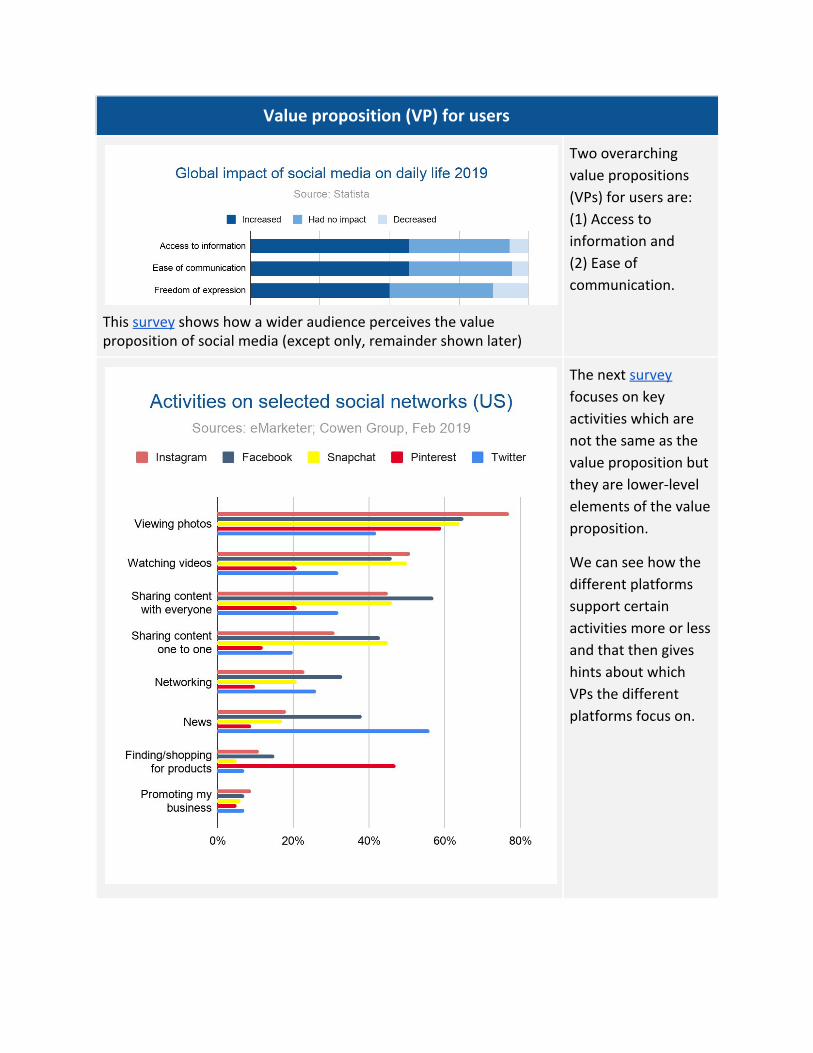
Value proposition (VP) for users
This survey shows how a wider audience perceives the value proposition of social media (except only, remainder shown later)
Two overarching
value propositions
(VPs) for users are:
(1) Access to
information and
(2) Ease of
communication.
The next survey
focuses on key
activities which are
not the same as the
value proposition but
they are lower-level
elements of the value
proposition.
We can see how the
different platforms
support certain
activities more or less
and that then gives
hints about which
VPs the different
platforms focus on.
The next few pages are about the value proposition to the
users.
The platforms are fiercely competing on providing
ever-increasing top-notch value to the users (for free)...
You can use these value propositions to check how you are
doing across those and to branch out further into whatever
problem you are using this for...
Multi-sided Search and Social platforms
Now that we are on the same page on the value propositions for each of the
major participant types, let’s take a look at how the sides come together. If each
side remained among themselves, the platform would be a very different place.
You may have come across platforms that have not been able to get the different
sides interacting. They are not likely to grow as much.
Professor Andrei Hagiu describes multi-sided platforms (=platform businesses) as:
“Multi-sided platforms (MSPs) are technologies, products or services that
create value primarily by enabling direct interactions between two or more
customer or participant groups.”
Note that there can be different and legitimate ways of defining the sides of a
platform depending on the problem one wants to solve or analyse . We have the 3
three major sides (participant types): Users, businesses and advertisers.
1. Users: the majority of participants are “ordinary” users (non-businesses)
- Close connections: users interact with other users, such as friends,
family, groups, etc. through two-way communication. I am calling
this out separately because we will use the term where it makes
sense to look at things from a single-user perspective. Secondly, this
sub-side does not exist on Search platforms that are more single-user
centric
2. Businesses: (e.g. Influencer, VIPs, brands, businesses, organisations, web
site owners, etc). From a single-user perspective, we also call them wider
connections / network. These are typically characterised by a one-way
followership (or Search) relationship and communication
3. Advertisers: Are the subset of businesses that pay for ads and who are
essential for the monetisation of the platform
3 For other purposes, it can make sense to subdivide these sides further or even differently. I have done so in the case studies myself because it made sense to do so in the context of analysing a single platform. As mentioned a few times now, for the comparative study, it makes sense to harmonise the terminology.
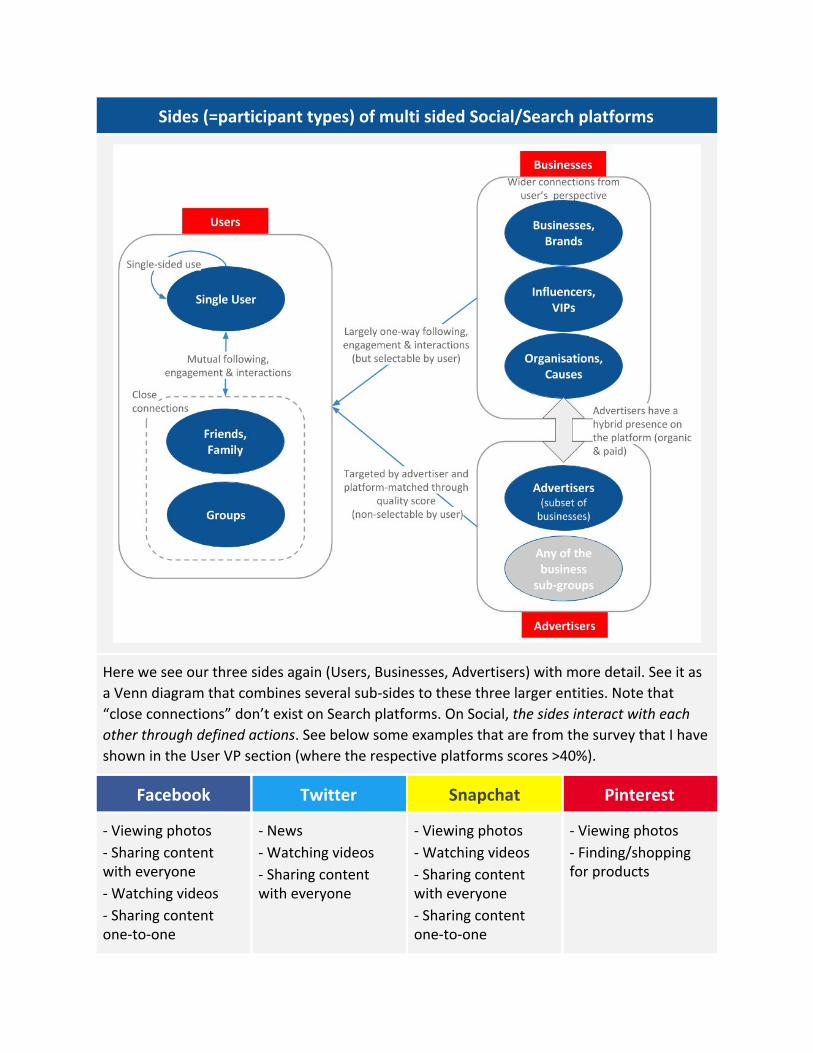
Sides (=participant types) of multi sided Social/Search platforms
Here we see our three sides again (Users, Businesses, Advertisers) with more detail. See it as
a Venn diagram that combines several sub-sides to these three larger entities. Note that
“close connections” don’t exist on Search platforms. On Social, the sides interact with each
other through defined actions. See below some examples that are from the survey that I have
shown in the User VP section (where the respective platforms scores >40%).
Facebook Twitter Snapchat Pinterest
- Viewing photos
- Sharing content with everyone
- Watching videos
- Sharing content one-to-one
- News
- Watching videos
- Sharing content with everyone
- Viewing photos
- Watching videos
- Sharing content with everyone
- Sharing content one-to-one
- Viewing photos
- Finding/shopping for products
What are network effects (NWE)?
Network effects (NWE) are the effects that incremental participants and
participation have on the value of the network to other participants.
In the context of multi-sided platforms (=platform businesses), we distinguish
between two different types of network effects:
1. Direct network effects, also called same-side network effects, are the
effects of participants on one side of the network on other participants on
the same side of the network. An example on Social is the creation of
relatable content among users (esp. close connections)
2. Indirect network effects are effects of one side of the MSP on the other
side of the MSP and are also called cross-side network effects. Content
created by businesses is an example for cross-side network effect on Social
and crucial on Search
Matching: network effects take place after a matching process. This can be
platform-determined or user-determined. In the latter case, it can require mutual
consent (e.g. “friend request”) or not (e.g. “followership” of a VIP). The matching
type often concurs with the directionality of the communication.
Positive and negative network effects: Network effects can be positive or
negative. Network effects on Social among close connections tend to be mostly
positive. But they can also turn negative (bullying, harassment, etc).
Enhancing positive network effects and reducing negative ones is the
most important activity of a platform business
Then there are wider negative network effects (and externalities) where e.g. the
platform is misused to spread disinformation (more later). Negative network
effects need to be managed by the platform. Facebook had 30,000 staff (2018,
pdf) to manage the multitude of negative network effects of which they say:
“This work will never be finished, but I now believe we've built some of the
most advanced systems in the world for dealing with these issues.”
Platforms sides, network effects and matching types
Platform Sides Network effects and matching types
Google Search
Ah well, there is some actual content
in this table (of course) ….
Snapchat
There are several comparisons
throughout the comparative study
across our 5 platforms

Platform sides & network effects - 2 examples
1. Users-Groups: Facebook is recommending me to join groups that some of my
connections have joined. Thereby - more than likely -, I would find more people to
connect to, increasing network effects further. There are 10m groups on Facebook
with 1.4b people using groups
2. Users-Firms/Employers: In the jobs section, employers (i.e. firms) can post jobs. This
is of value for Facebook for several reasons: (1) firms are potential advertisers, (2)
more data about (a) firms and (b) jobseeker-users, (3) more value for users, (4) user
engagement = reason to come back more often to check for jobs (i.e. more screen
time, more ads to be displayed in news feed, etc)
There is a lot of chatter and mention of network effects that
underpin the success of platform businesses. Everybody agrees
how important they are.
But what on Earth are network effects????
Excuse me … there are very few attempts to ever explain these.
And those few attempts are not good (sorry, I know it sounds
arrogant)....
I have identified 8 categories of factors that contribute to
network effects by (once again) creating a massive Excel sheet
where I have compared the network effects that I had identified
for the individual platforms.
I believe you MUST know this. I think it is of great value… here a
short excerpt
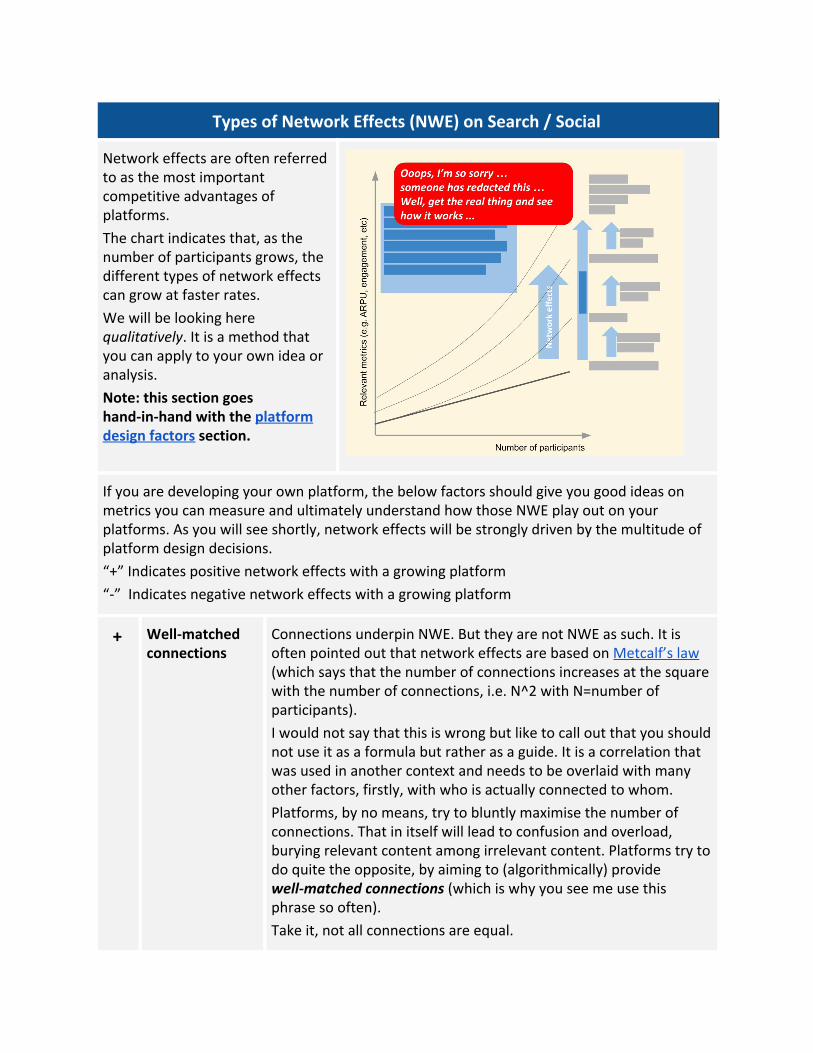
Types of Network Effects (NWE) on Search / Social
Network effects are often referred to as the most important competitive advantages of platforms.
The chart indicates that, as the number of participants grows, the different types of network effects can grow at faster rates.
We will be looking here qualitatively. It is a method that you can apply to your own idea or analysis.
Note: this section goes hand-in-hand with the platform design factors section.
If you are developing your own platform, the below factors should give you good ideas on metrics you can measure and ultimately understand how those NWE play out on your platforms. As you will see shortly, network effects will be strongly driven by the multitude of platform design decisions.
“+” Indicates positive network effects with a growing platform
“-” Indicates negative network effects with a growing platform
+ Well-matched connections
Connections underpin NWE. But they are not NWE as such. It is often pointed out that network effects are based on Metcalf’s law (which says that the number of connections increases at the square with the number of connections, i.e. N^2 with N=number of participants).
I would not say that this is wrong but like to call out that you should not use it as a formula but rather as a guide. It is a correlation that was used in another context and needs to be overlaid with many other factors, firstly, with who is actually connected to whom.
Platforms, by no means, try to bluntly maximise the number of connections. That in itself will lead to confusion and overload, burying relevant content among irrelevant content. Platforms try to do quite the opposite, by aiming to (algorithmically) provide well-matched connections (which is why you see me use this phrase so often).
Take it, not all connections are equal.
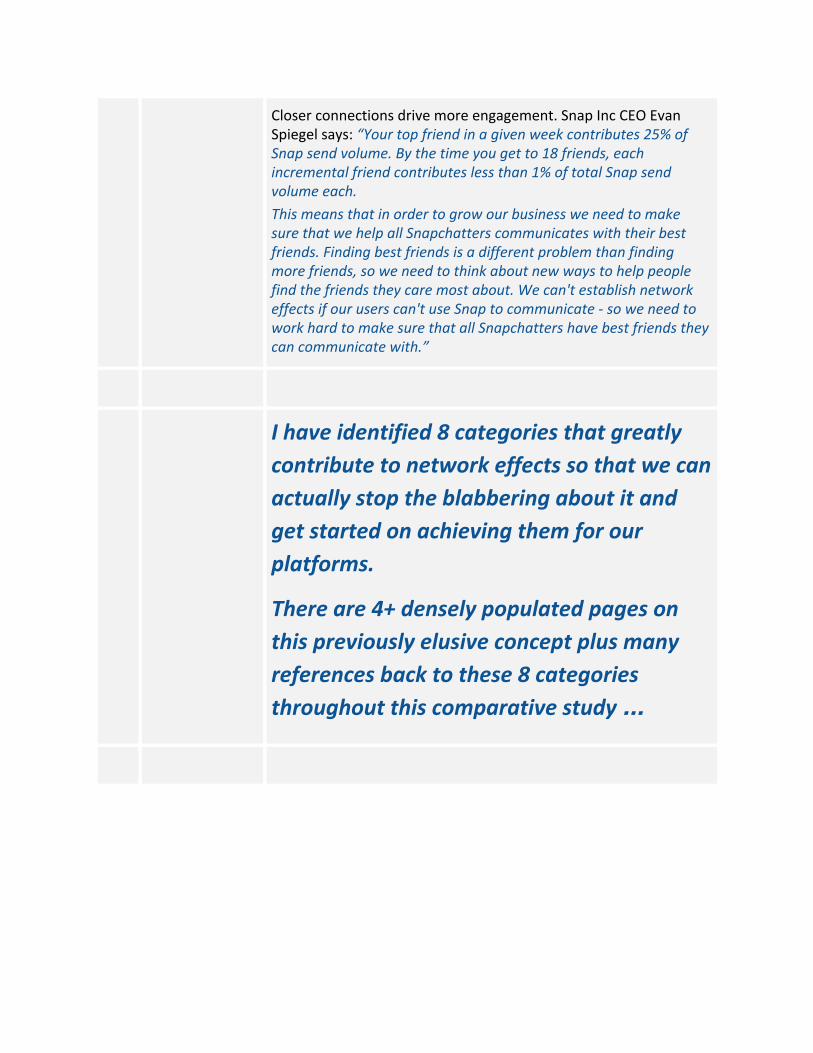
Closer connections drive more engagement. Snap Inc CEO Evan Spiegel says: “Your top friend in a given week contributes 25% of Snap send volume. By the time you get to 18 friends, each incremental friend contributes less than 1% of total Snap send volume each.
This means that in order to grow our business we need to make sure that we help all Snapchatters communicates with their best friends. Finding best friends is a different problem than finding more friends, so we need to think about new ways to help people find the friends they care most about. We can't establish network effects if our users can't use Snap to communicate - so we need to work hard to make sure that all Snapchatters have best friends they can communicate with.”
I have identified 8 categories that greatly
contribute to network effects so that we can
actually stop the blabbering about it and
get started on achieving them for our
platforms.
There are 4+ densely populated pages on
this previously elusive concept plus many
references back to these 8 categories
throughout this comparative study …
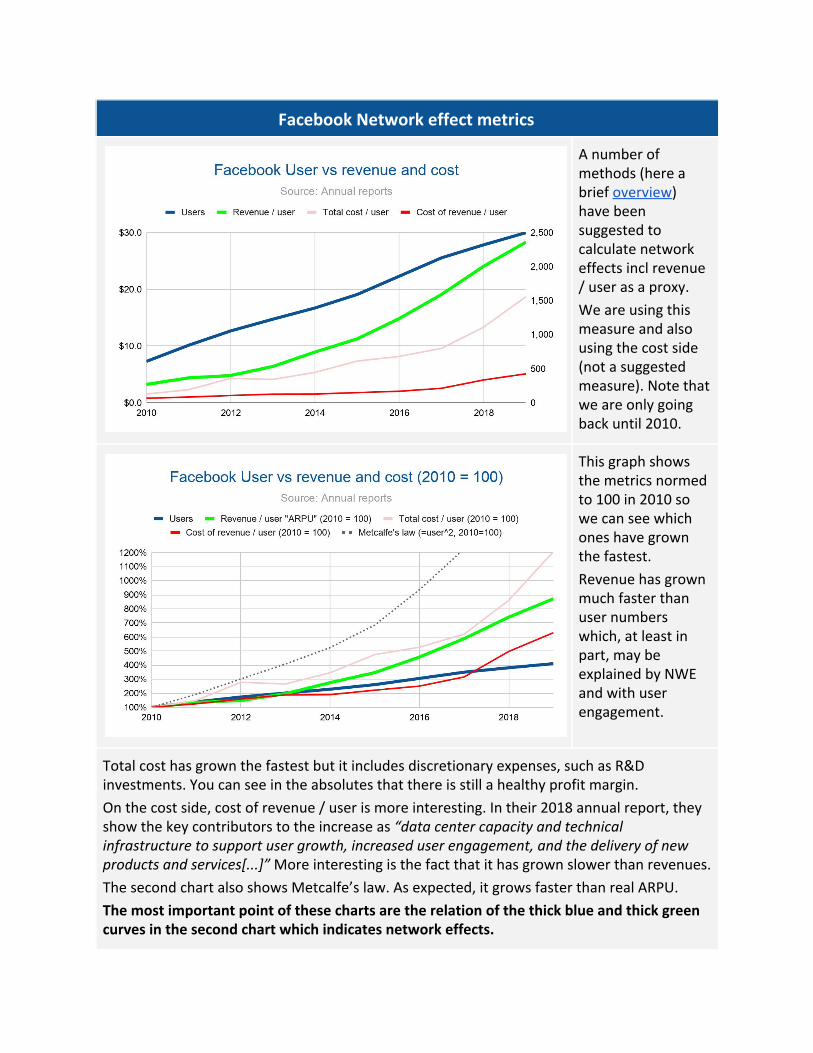
Facebook Network effect metrics
A number of methods (here a brief overview) have been suggested to calculate network effects incl revenue / user as a proxy.
We are using this measure and also using the cost side (not a suggested measure). Note that we are only going back until 2010.
This graph shows the metrics normed to 100 in 2010 so we can see which ones have grown the fastest.
Revenue has grown much faster than user numbers which, at least in part, may be explained by NWE and with user engagement.
Total cost has grown the fastest but it includes discretionary expenses, such as R&D investments. You can see in the absolutes that there is still a healthy profit margin.
On the cost side, cost of revenue / user is more interesting. In their 2018 annual report, they show the key contributors to the increase as “data center capacity and technical infrastructure to support user growth, increased user engagement, and the delivery of new products and services[...]” More interesting is the fact that it has grown slower than revenues.
The second chart also shows Metcalfe’s law. As expected, it grows faster than real ARPU.
The most important point of these charts are the relation of the thick blue and thick green curves in the second chart which indicates network effects.
Platform Comparison
I appreciate this is pretty heavy stuff. Now, we will apply these concepts in a
lighter and practical format. It will show what we have covered so far.
I am using the terminology that we have introduced in bold italics. And I
recommend you do so in the worksheets as well for your analysis or synthesis.
We will compare our platforms across 5 dimensions of which we have covered the
first three with the latter two to follow shortly:
1. Platform sides
2. Network effects
3. Value proposition
4. Digital properties (explained later)
5. Monetisation (explained later)
Following the individual comparison, I will compare Google and Facebook based
on the categories that we have defined for the value propositions and network
effects so that you can see what the strength of such methods are. It is a high
level comparison but you can apply it in far more depth on any platform if you
wish (I keep this example to the value proposition to users and advertisers
skipping businesses).
Platform design factors
What we have not yet covered is how the platform design affects network effects
and value proposition. This is a complex but very important topic that we will
cover after the comparison.
I believe that the platform design factor determines its trajectory (including the
achievable network effects) more than any other factor. In the early days,
Facebook and Twitter were perceived as being head-to-head by some analysts. I
could never understand this comparison. Understanding platform design factors,
you can make your own assessment on this.

Sides
- Users | Businesses | Advertisers - Non-consensual following createts
networks of users not knowing each other
Network effects
Engagement among users / super users through content creation and fast-paced interaction (including retweeting, liking, commenting). This has a signaling effect on the News Feed ranking algorithm for each user. It also creates data about user’s interests.
Value proposition
Relatable/engaging content in form of news (incl sports, entertainment) shared by users and businesses. “What’s happening in the world right now?” Consuming users mostly follow unfolding events, get viewpoints and can express/share their views or add updates to the events.
For super users / businesses, Twitter offers access to audience which is well-matched due to the non-consensual following (self-selection). It allows them to get their messages out to build influence, followerships / a brand. Retweet/like buttons can lead to word-of-mouth and virality.
Digital properties (DP)
The News Feed is the most important digital property. It can be exploratively searched by scrolling down or searched targetedly through hashtags and tabs. A weakness of Twitter is the (over-)reliance on this one digital property.
Monetisation
Monetisation is mainly through native ads. Video ads play an increasing role, often embedded in professional streaming/video content.
So, it starts to pay off …
We are using the concepts that we have introduced for:
- the value proposition,
- the sides (=participant types) of our platform and
- the network effects
in our comparison
See on the previous page the bold italics terms.
They are the stuff that we have previously defined…
And we are doing the same for all platforms

Sorry about hiding the text on the previous pages .. you know
how it works
On the next page you see a more detailed side-by-side
comparison.
It’s more detailed but still somewhat high level.
I am providing you with worksheets to apply this onto whatever
the problem is that you are trying to solve.
Remember: I am teaching you how to fish to feed you for a
lifetime….

Side-by-side comparison tool w/ example
Facebook Google
Network effects
Engagement 2-way, direct communication 1-way, website content
Interaction Close conn: 2-way, frequent: Wider conn: 1-way, infrequent
Wider connections, on user demand
Content creation Fast paced: 100b message & 1b stories / day
Long-lasting (except news): 400m sites, ~1.6b+ pages
Signalling Liking, emoji, sharing, commenting, etc
User→owner: Analytics Owner→owner: Linking
Data Geo-demo, interest, behaviour Interest, behaviour, geo
Specialisation / diversification Sentiment, metrics-driven Analytics/metrics-driven, SEO
Platform health >30,000 employees Unknown; 10,000 for Youtube
Value Proposition for users
Find/access information & solutions to problems
Through enhanced access to close and wide connections
Through access to websites and expertise behind (EAT)
Low search costs/efforts Platform search, user groups Highly optimised in many ways
Different search modes Social search (“asking”) Targeted, explorative search
Convenient communication Text, image, video, etc Google had/has its own set of social platforms and tools. But these did not reach the scale that Google expects (e.g. Google+). Tools still exist but not core priority.
Relatable/engaging content Created by connections
Expression/sharing views Posts, comments, liking, etc
Messaging/chat Messenger, WhatsApp, etc
Single-sided uses Games, videos and lots more Many single-sided tools
Value Proposition for advertisers
Access audience ~5% of followers reached organically
High penetration in many countries
Well-matched traffic Interest based & followership Onpage SEO and other signals
Increase leads, sales Organically and paid ads Sales, lead-generation pages
Brand marketing Very well suited to build brand Website design
Build followerships / influence Through engaging posts, etc Subscription or social accounts
Word-of-mouth Sharing, linking, virality Mostly through social sharing
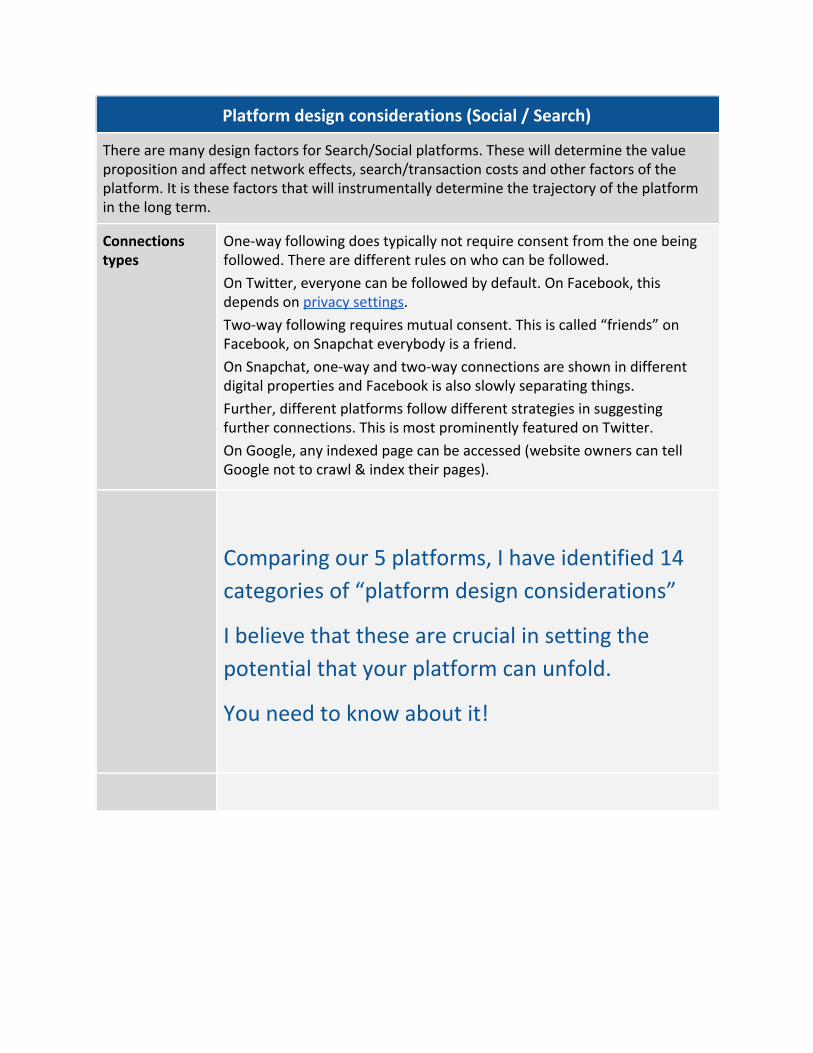
Platform design considerations (Social / Search)
There are many design factors for Search/Social platforms. These will determine the value proposition and affect network effects, search/transaction costs and other factors of the platform. It is these factors that will instrumentally determine the trajectory of the platform in the long term.
Connections types
One-way following does typically not require consent from the one being followed. There are different rules on who can be followed.
On Twitter, everyone can be followed by default. On Facebook, this depends on privacy settings. Two-way following requires mutual consent. This is called “friends” on Facebook, on Snapchat everybody is a friend.
On Snapchat, one-way and two-way connections are shown in different digital properties and Facebook is also slowly separating things.
Further, different platforms follow different strategies in suggesting further connections. This is most prominently featured on Twitter.
On Google, any indexed page can be accessed (website owners can tell Google not to crawl & index their pages).
Comparing our 5 platforms, I have identified 14
categories of “platform design considerations”
I believe that these are crucial in setting the
potential that your platform can unfold.
You need to know about it!
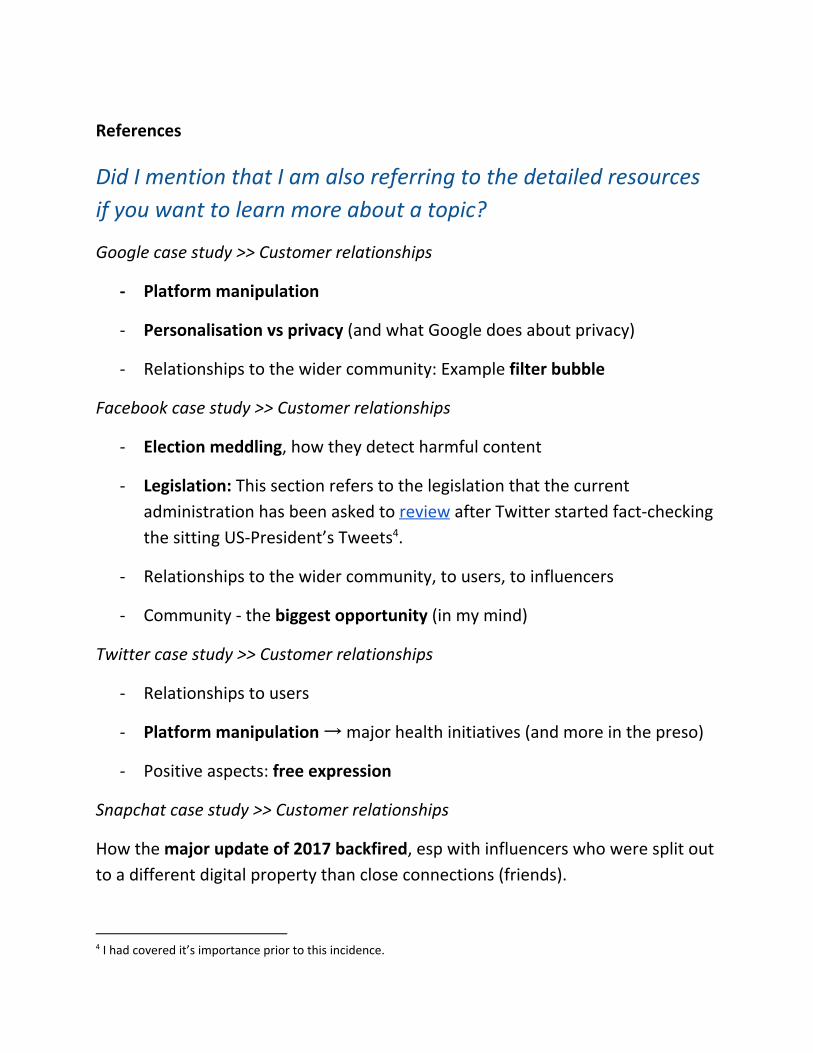
References
Did I mention that I am also referring to the detailed resources
if you want to learn more about a topic?
Google case study >> Customer relationships
- Platform manipulation
- Personalisation vs privacy (and what Google does about privacy)
- Relationships to the wider community: Example filter bubble
Facebook case study >> Customer relationships
- Election meddling, how they detect harmful content
- Legislation: This section refers to the legislation that the current
administration has been asked to review after Twitter started fact-checking
the sitting US-President’s Tweets . 4
- Relationships to the wider community, to users, to influencers
- Community - the biggest opportunity (in my mind)
Twitter case study >> Customer relationships
- Relationships to users
- Platform manipulation → major health initiatives (and more in the preso)
- Positive aspects: free expression
Snapchat case study >> Customer relationships
How the major update of 2017 backfired, esp with influencers who were split out
to a different digital property than close connections (friends).
4 I had covered it’s importance prior to this incidence.
Data capture & targeting
We have said that accurate ad targeting is one of the most important value
propositions for advertisers. Essential for this is the capturing of user data. And it
should not be an accidental by-product of the design of a platform. Rather we
should design our platform and digital properties with data capture in mind.
There will be digital properties used for engagement, provision of the value
proposition with little need for data capture. But there can also be digital
properties that can provide a great value proposition when capturing data. In this
case, the data can also be used to deliver well-targeted ads. The reality, of course,
looks a bit different. Data is captured “because we can”.
Three important reasons (among others) to capture data are:
1. Provision of a better value proposition / customer experience to users: this
is the best reason
2. For continuous improvement and innovation of the platform: this requires
only anonymised aggregated data. It should not be linkable to a user, thus
not be used for advertising (yes, this is a tough stand!)
3. For better targeting of advertisements: this should only be a secondary
reason if reason (1) is satisfied. Specifically, data collection for the purpose
of providing “personalised” ads should not be a reason by itself
We are going to look at some methods on how platforms collect data.
Given I am taking a tough stand on data capturing, I will spend some time to show
you three great examples for capturing location data for a good reason. I hope it
will inspire you to come up with similarly good ideas. Equally, it will future-proof
your innovation given underlying platforms give users more control over the data
that is being collected.
Then we will be learning about how it relates to penetration, segmentation and
ultimately targeting of users with (the right) ads.
What data do platforms capture?
Let’s start with a really sad example. A torch app (“Brightest Flashlight LED - Super
Bright Torch" with 10 million installs) asking for permissions like:
- Precise user location
- Access to user’s contacts
- Send SMS messages(!)
- Permission to directly call phone numbers(!)
- Permission to reroute outgoing calls(!)
- Access to camera
- Record audio via microphone
- And more ...
Really?
There should be good reasons to record Personally Identifiable Information
(phone number, email address, home address, username) and for requesting risky
permissions (location tracking, camera access, audio recording, read phone call
log, read SMS messages, etc).
I have covered how Google does this in the Google case study >> Customer
relationships (pg 55-66). I find that it is one of the best examples . 5
As mentioned, things are changing in this space in that the underlying platform
owners are improving visibility and control over permissions granted to apps. This
should make it easier for users to make a trade-off whether the value provided by
a platform justifies the permissions granted.
If you are planning to develop a platform, I encourage you to familiarise yourself
with data ethics principles in anticipation of more user data protection.
5 There are reports which state that Google would capture data from over 250,000 apps through Android. Google rejected this saying that this is referring to data that apps send to Android when they crash. Call me naive, but I would be surprised if Google captured user data via 3rd party apps that they then don’t show in the privacy and data capture section. But I am calling this out to show that there are other views so that you can look into this if it is of interest for you.

Ok skipping some pages on how to get users to share their data
with you …
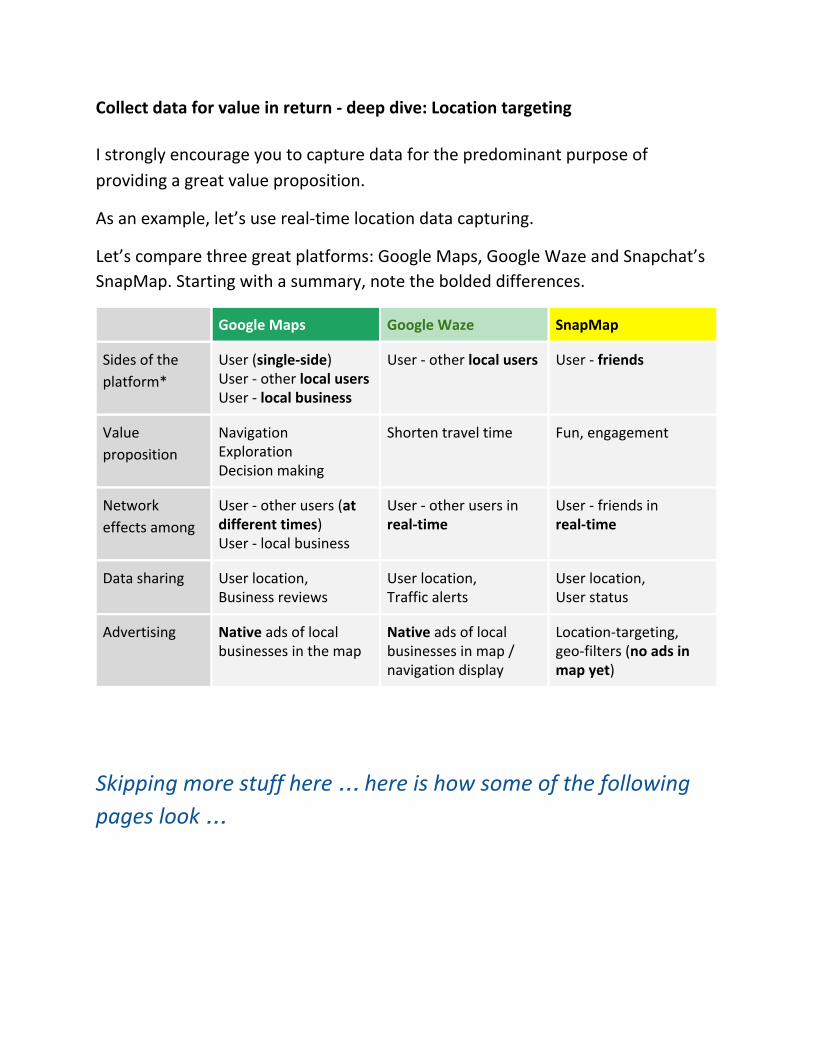
Collect data for value in return - deep dive: Location targeting
I strongly encourage you to capture data for the predominant purpose of
providing a great value proposition.
As an example, let’s use real-time location data capturing.
Let’s compare three great platforms: Google Maps, Google Waze and Snapchat’s
SnapMap. Starting with a summary, note the bolded differences.
Google Maps Google Waze SnapMap
Sides of the
platform*
User (single-side) User - other local users User - local business
User - other local users User - friends
Value
proposition
Navigation Exploration Decision making
Shorten travel time Fun, engagement
Network
effects among
User - other users (at different times) User - local business
User - other users in real-time
User - friends in real-time
Data sharing User location, Business reviews
User location, Traffic alerts
User location, User status
Advertising Native ads of local businesses in the map
Native ads of local businesses in map / navigation display
Location-targeting, geo-filters (no ads in map yet)
Skipping more stuff here … here is how some of the following
pages look …
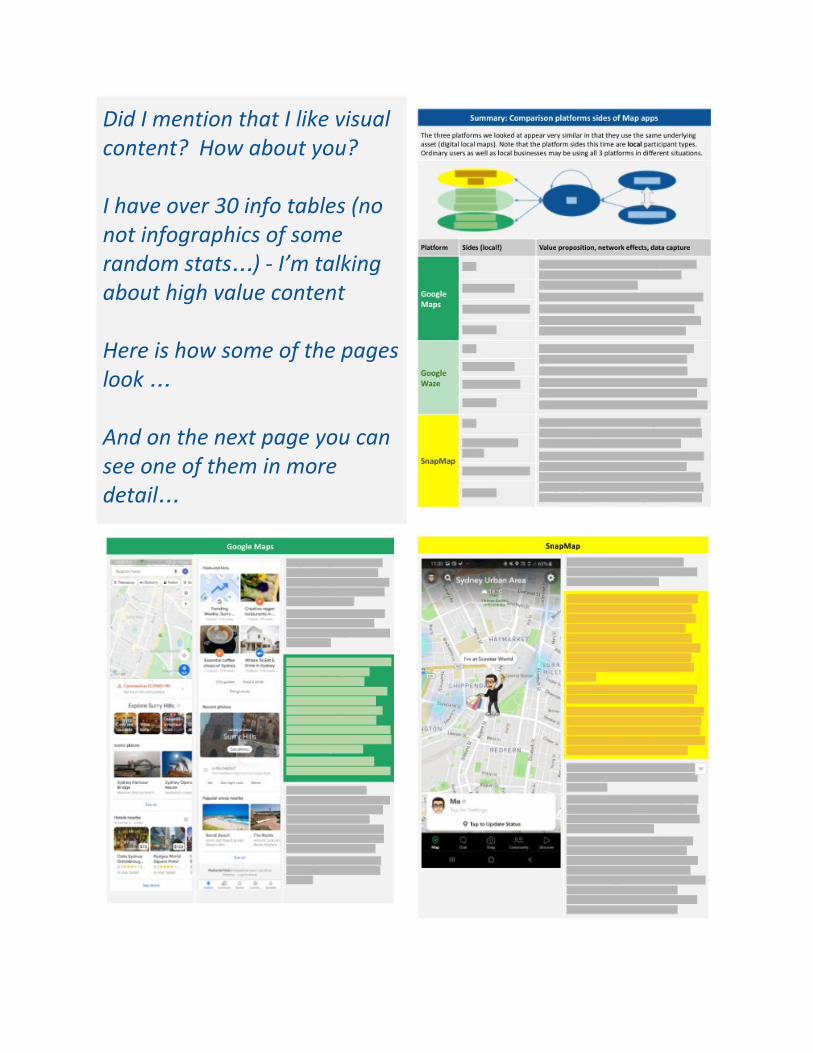
Did I mention that I like visual content? How about you? I have over 30 info tables (no not infographics of some random stats…) - I’m talking about high value content Here is how some of the pages look … And on the next page you can see one of them in more detail…
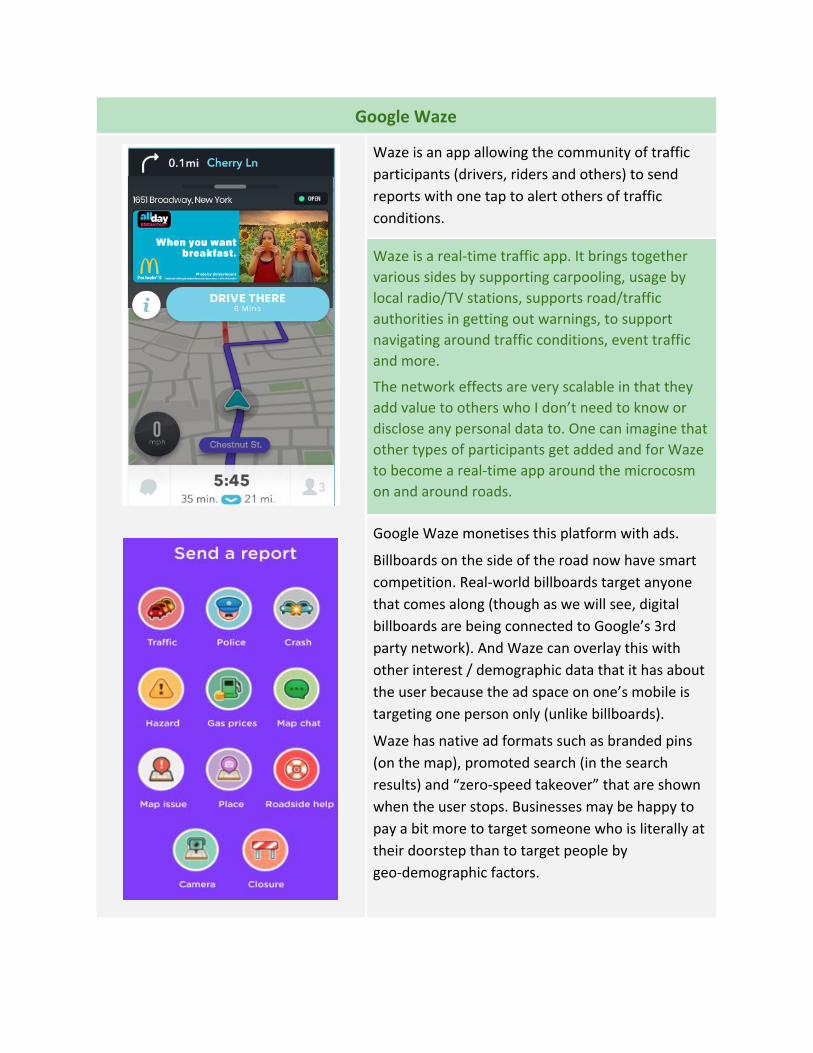
Google Waze
Waze is an app allowing the community of traffic
participants (drivers, riders and others) to send
reports with one tap to alert others of traffic
conditions.
Waze is a real-time traffic app. It brings together
various sides by supporting carpooling, usage by
local radio/TV stations, supports road/traffic
authorities in getting out warnings, to support
navigating around traffic conditions, event traffic
and more.
The network effects are very scalable in that they
add value to others who I don’t need to know or
disclose any personal data to. One can imagine that
other types of participants get added and for Waze
to become a real-time app around the microcosm
on and around roads.
Google Waze monetises this platform with ads.
Billboards on the side of the road now have smart
competition. Real-world billboards target anyone
that comes along (though as we will see, digital
billboards are being connected to Google’s 3rd
party network). And Waze can overlay this with
other interest / demographic data that it has about
the user because the ad space on one’s mobile is
targeting one person only (unlike billboards).
Waze has native ad formats such as branded pins
(on the map), promoted search (in the search
results) and “zero-speed takeover” that are shown
when the user stops. Businesses may be happy to
pay a bit more to target someone who is literally at
their doorstep than to target people by
geo-demographic factors.
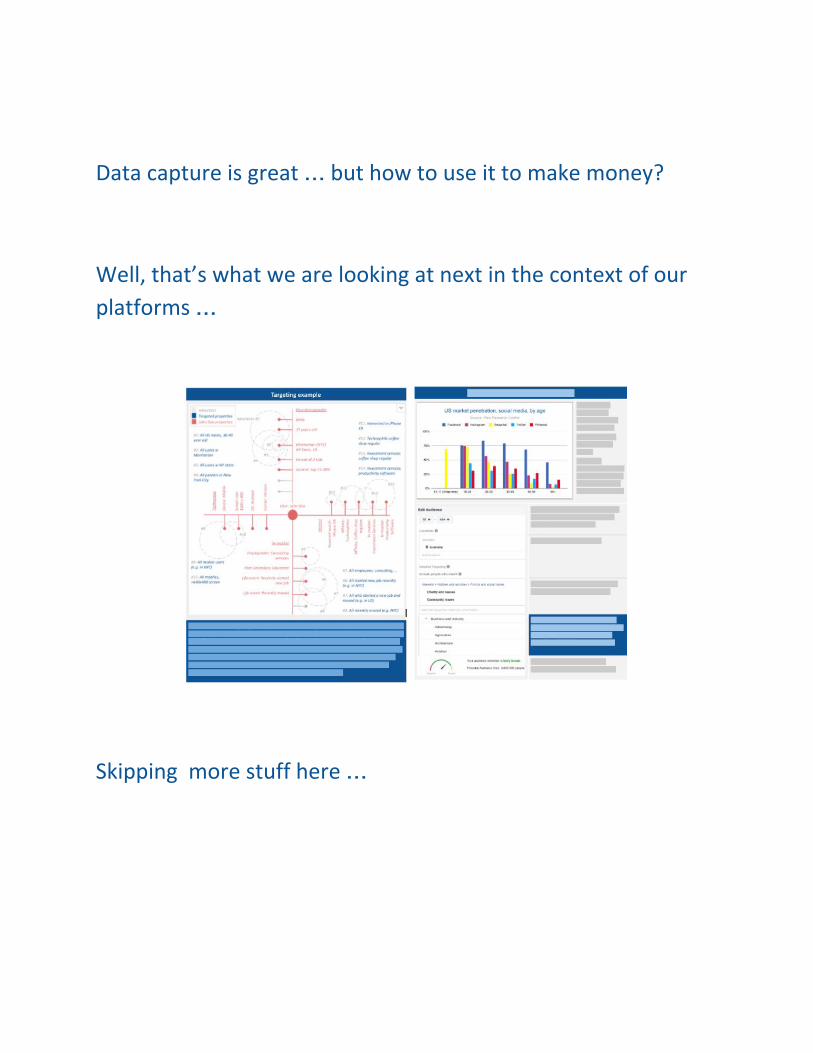
Data capture is great … but how to use it to make money?
Well, that’s what we are looking at next in the context of our
platforms …
Skipping more stuff here …
Digital properties
Digital properties are those powerful hubs (like the News Feed) where some of
the most important elements of platform business models come together!
This chapter is about something you know well ..
apps/websites. We are looking a bit more systematically about
the key functions that make a successful app.
I call the major elements: digital properties (e.g. the Facebook
News Feed). But they are not just some visual elements.
They have important functions some of which we have
explained at this stage of the report and others that are still
following.
Here are their key functions:
Digital properties:
- Are instrumental in delivering the value proposition at low search /
transaction costs
- Bring together defined sides of the multi-sided platform and create
network effects
- Capture data
- Create ad spaces (i.e. are instrumental in monetisation)
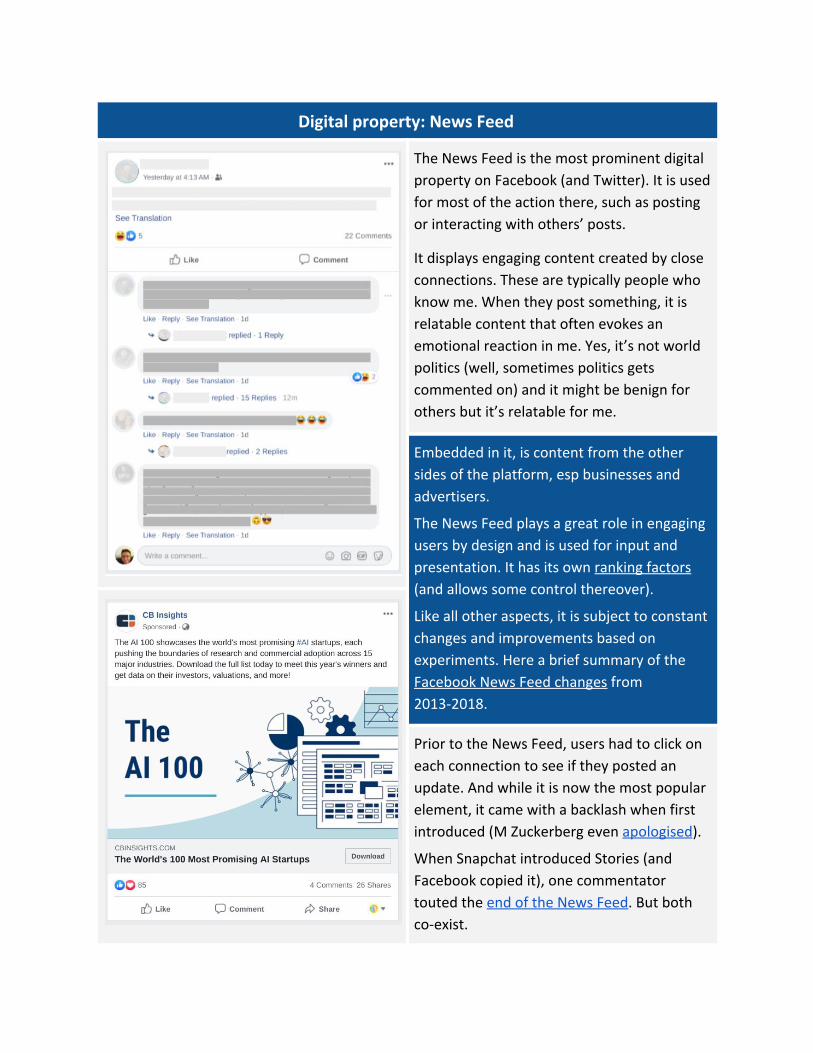
Digital property: News Feed
The News Feed is the most prominent digital
property on Facebook (and Twitter). It is used
for most of the action there, such as posting
or interacting with others’ posts.
It displays engaging content created by close
connections. These are typically people who
know me. When they post something, it is
relatable content that often evokes an
emotional reaction in me. Yes, it’s not world
politics (well, sometimes politics gets
commented on) and it might be benign for
others but it’s relatable for me.
Embedded in it, is content from the other
sides of the platform, esp businesses and
advertisers.
The News Feed plays a great role in engaging
users by design and is used for input and
presentation. It has its own ranking factors
(and allows some control thereover).
Like all other aspects, it is subject to constant
changes and improvements based on
experiments. Here a brief summary of the
Facebook News Feed changes from
2013-2018.
Prior to the News Feed, users had to click on
each connection to see if they posted an
update. And while it is now the most popular
element, it came with a backlash when first
introduced (M Zuckerberg even apologised).
When Snapchat introduced Stories (and
Facebook copied it), one commentator
touted the end of the News Feed. But both
co-exist.
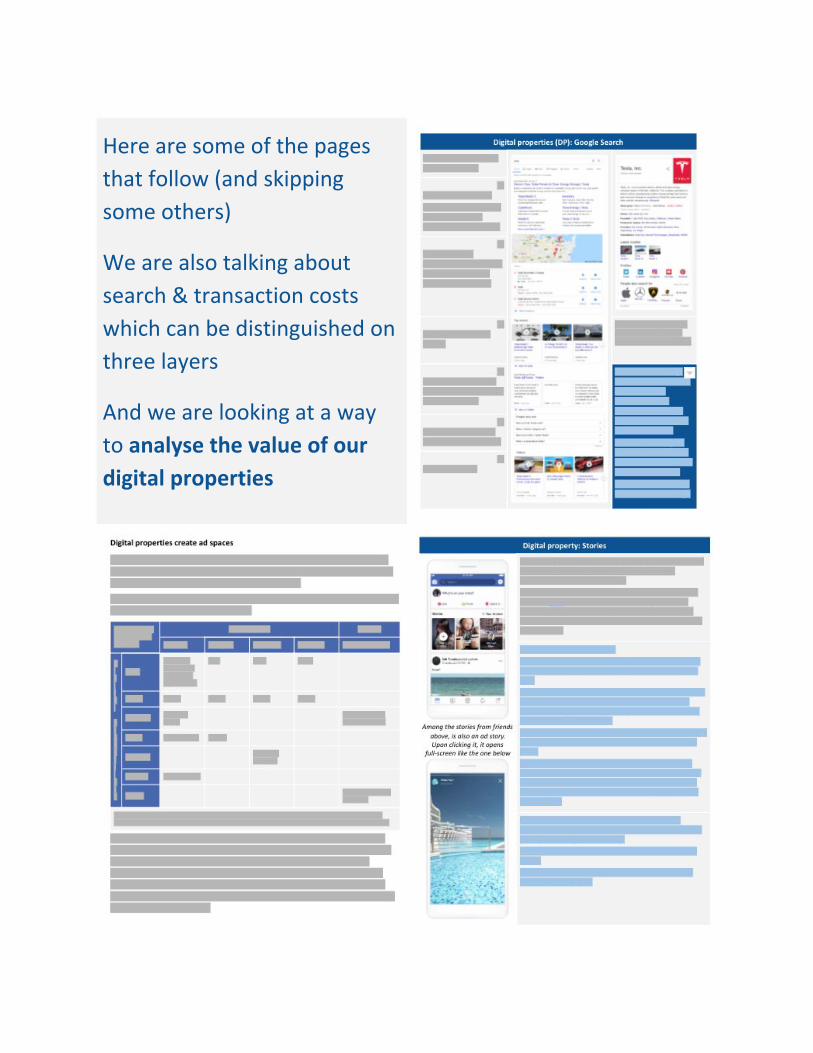
Here are some of the pages
that follow (and skipping
some others)
We are also talking about
search & transaction costs
which can be distinguished on
three layers
And we are looking at a way
to analyse the value of our
digital properties
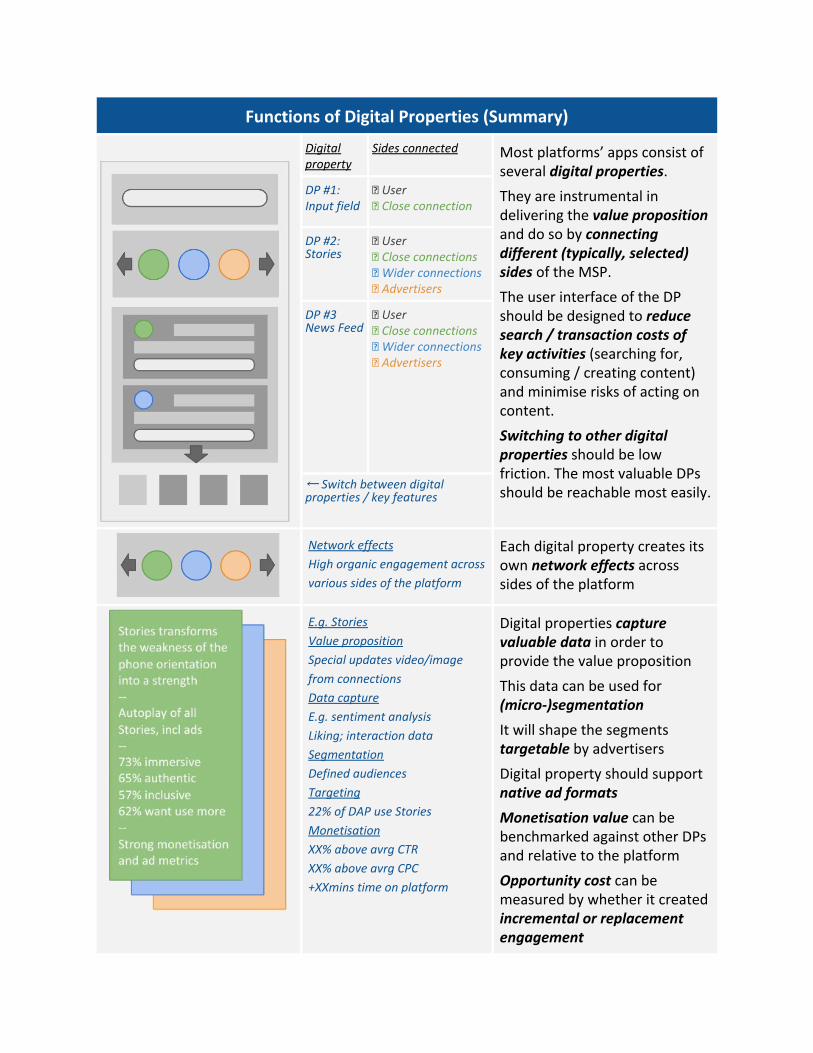
Functions of Digital Properties (Summary)
Digital property
Sides connected Most platforms’ apps consist of several digital properties. They are instrumental in delivering the value proposition and do so by connecting different (typically, selected) sides of the MSP.
The user interface of the DP should be designed to reduce search / transaction costs of key activities (searching for, consuming / creating content) and minimise risks of acting on content.
Switching to other digital properties should be low friction. The most valuable DPs should be reachable most easily.
DP #1: Input field
User Close connection
DP #2: Stories
User Close connections Wider connections Advertisers
DP #3 News Feed
User Close connections Wider connections Advertisers
← Switch between digital properties / key features
Network effects
High organic engagement across
various sides of the platform
Each digital property creates its own network effects across sides of the platform
E.g. Stories
Value proposition
Special updates video/image
from connections
Data capture
E.g. sentiment analysis
Liking; interaction data
Segmentation
Defined audiences
Targeting
22% of DAP use Stories
Monetisation
XX% above avrg CTR
XX% above avrg CPC
+XXmins time on platform
Digital properties capture valuable data in order to provide the value proposition
This data can be used for (micro-)segmentation
It will shape the segments targetable by advertisers
Digital property should support native ad formats
Monetisation value can be benchmarked against other DPs and relative to the platform
Opportunity cost can be measured by whether it created incremental or replacement engagement

I am skipping the concept of 3rd party advertising networks
altogether from this excerpt.
It is explained in detail and very fascinating. And after that we
are moving on to monetisation.
We have over 20 pages and 15 charts to look at various sub
markets and elaborate how our 5 platforms try to capture
market share in the various sub-markets.
This will demonstrate that there are various ways that
companies can enter markets … something that many
innovators struggle with…
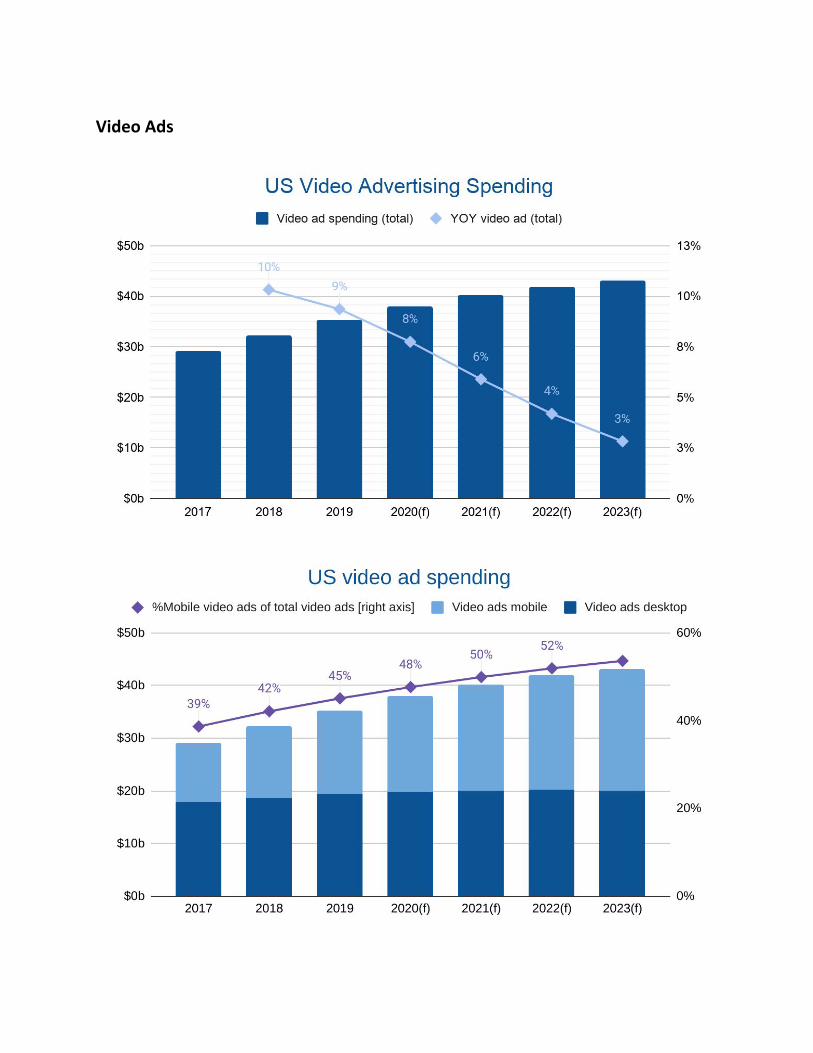
Video Ads
Video ad spending is also growing faster than the average ad industry. Among
this, video ad spending is clocking in double-digit growth which is forecasted to
prevail until 2021 (before Coronavirus).
As part of the shift to mobile, it happens that video ads also move further to
mobile phones. The platforms we looked at all offer video ad formats (in some
cases it is called rich media when it’s not embedded in a player).
And there are all sorts of different approaches on how to embed video ads.
Here some thoughts on which digital properties allow for the most native way to
embed video ads:
- Pinterest has many autoplay (and autoloop) ad videos. Given they are
embedded among pins (mainly images), they should not be considered
native. And they certainly impact the customer experience negatively (esp
auto looping ones). But they (likely) attract a higher price point, thus
revenues. I anticipate - like most platforms - Pinterest will prioritise
customer experience higher as they grow. A typical observation among
platforms
- It is very important to test the impacts of video ads on customer experience
- Take Snapchat: On their Discover digital property, videos don’t autoplay
- And as mentioned, Stories (first invented by Snapchat and successfully
copied by Facebook) are a great digital property for video ads. I would think
this is the most-native digital property for embedding video ads
- Then there are video ads which are embedded within live streams or other
video content. In this case, there are revenue-sharing agreements with the
content creators (booked under traffic/content acquisition costs)
One could think that embedding video ads within video content is the most native
form of doing this. But that is not necessarily the case.
There are different forms of video ad placement with pros and cons.
- Pre-roll: video ads prior to the premium video, often non-skippable for at
least a few seconds, typically around 6secs. They are often seen as the most
recallable video ad placement. Much less interruptive than mid-roll
- Mid-roll: video ads during premium content (one downside is that these
are typically seen as the most interruptive ones)
- Post-roll: video ads at the end of the premium content (less interruptive,
easy to skip and typically lower recall and purchase intention)
Ideally, platforms would only use pre-roll ads but that would considerably limit
the available ad spaces. Prices would increase but overall revenues would
certainly suffer. Hence, we are likely to still “enjoy” mid-roll.
Some studies try to benchmark the various options on the competing dimensions.
Here are two examples that touch on this (one from YuMe, one from AppNexus, before renamed to Xandr).
I would recommend taking these with considerable caution. Any platform needs
to check these and other factors (such as the impact on engagement, measured in
session duration, number of visits/day, etc) to make sure that they don't
adversely impact important engagement factors.
Hence these tests need to include:
1. Customer experience
2. Value for advertisers (marketing ROI)
3. Platform engagement metrics
There are different pricing methods, typically cost per view (CPM/CPV) and cost
per completed view (CPCV) but also other ones.
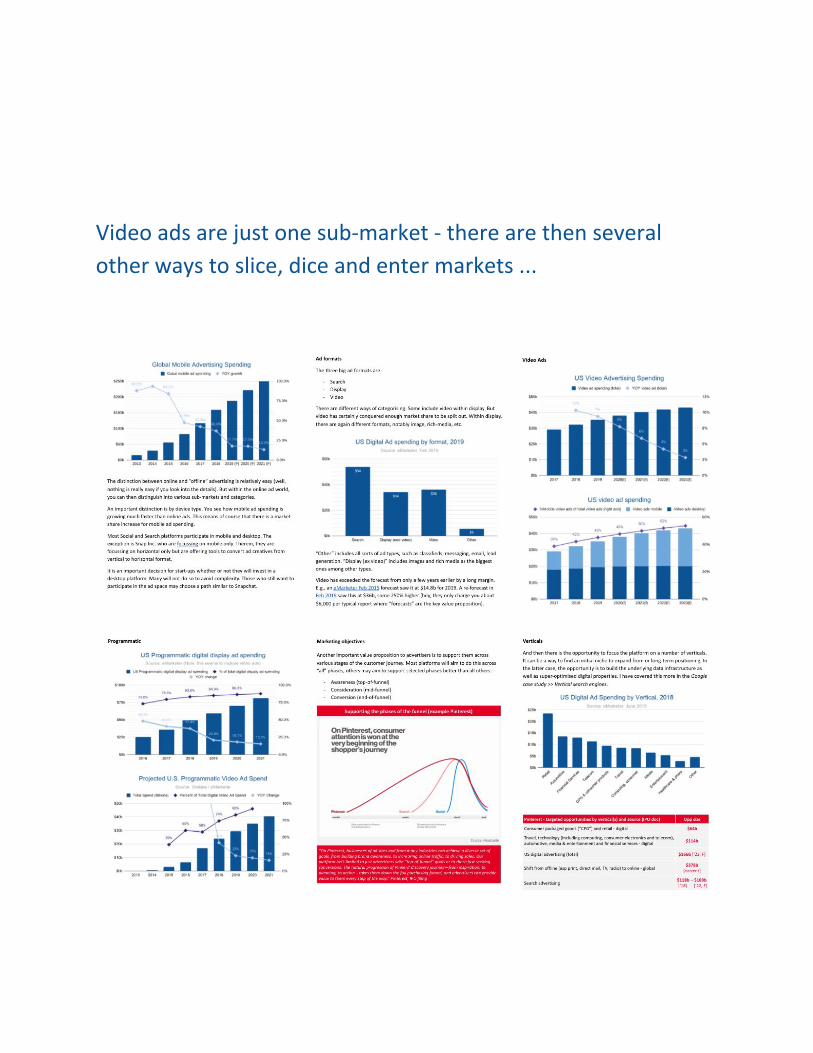
Video ads are just one sub-market - there are then several
other ways to slice, dice and enter markets ...
We are then entering the final stretch … which is about
strategy and the business model.
First, we are looking at the three flywheels:
- The advertiser flywheel
- The business flywheel
- The user flywheel
Then we are looking at the 9 business model canvas categories:
- Key partners
- Key activities
- Key resources
- Value proposition
- Cost structure
- Revenue
- Channels
- Customer relationships
- Customer segments
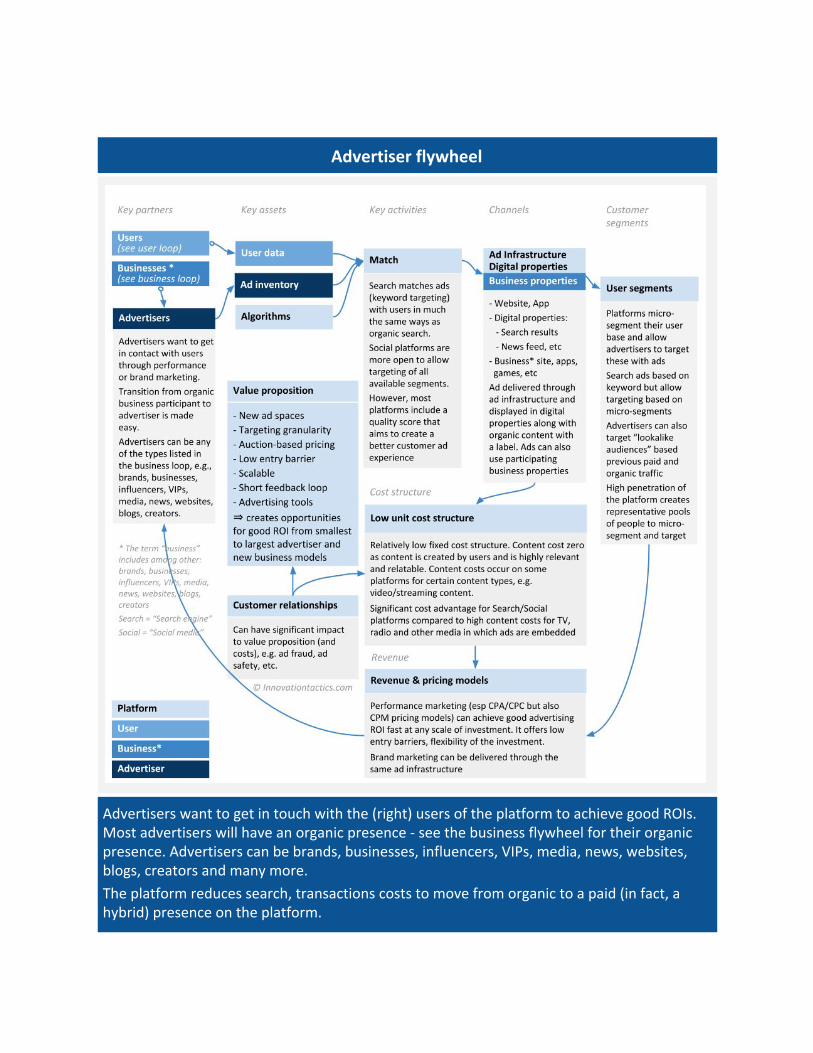
Advertiser flywheel
Advertisers want to get in touch with the (right) users of the platform to achieve good ROIs. Most advertisers will have an organic presence - see the business flywheel for their organic presence. Advertisers can be brands, businesses, influencers, VIPs, media, news, websites, blogs, creators and many more.
The platform reduces search, transactions costs to move from organic to a paid (in fact, a hybrid) presence on the platform.
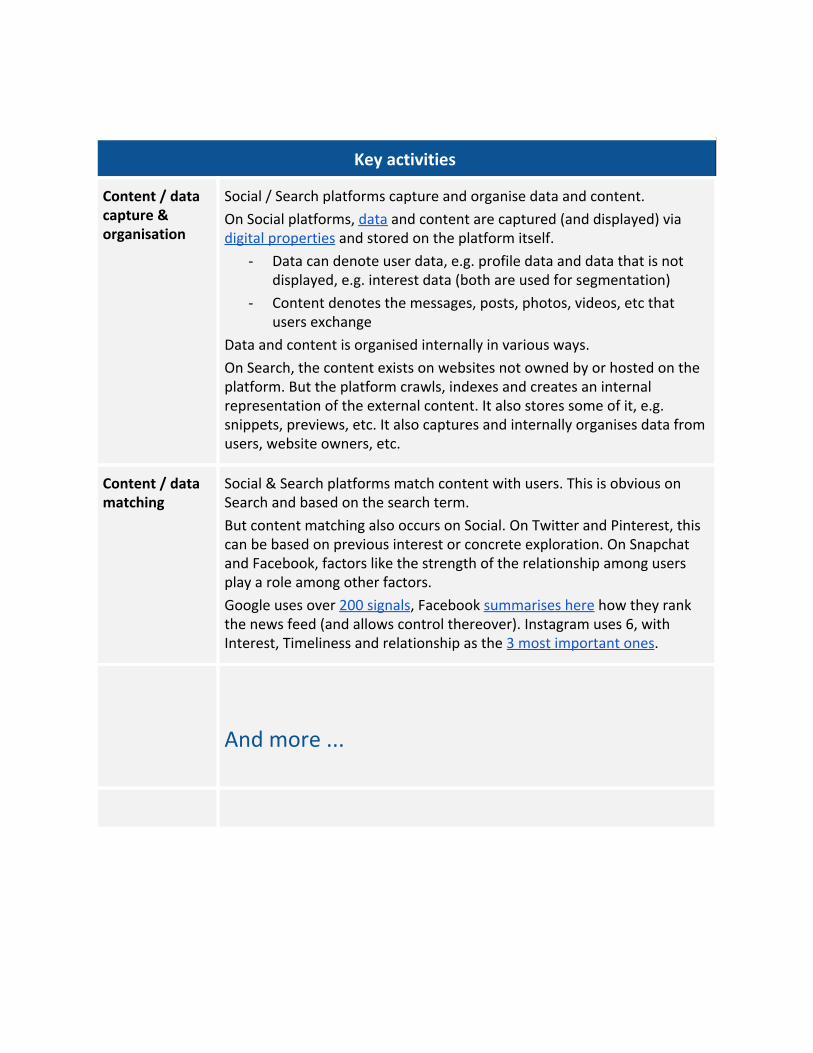
Key activities
Content / data capture & organisation
Social / Search platforms capture and organise data and content.
On Social platforms, data and content are captured (and displayed) via digital properties and stored on the platform itself.
- Data can denote user data, e.g. profile data and data that is not displayed, e.g. interest data (both are used for segmentation)
- Content denotes the messages, posts, photos, videos, etc that users exchange
Data and content is organised internally in various ways.
On Search, the content exists on websites not owned by or hosted on the platform. But the platform crawls, indexes and creates an internal representation of the external content. It also stores some of it, e.g. snippets, previews, etc. It also captures and internally organises data from users, website owners, etc.
Content / data matching
Social & Search platforms match content with users. This is obvious on Search and based on the search term.
But content matching also occurs on Social. On Twitter and Pinterest, this can be based on previous interest or concrete exploration. On Snapchat and Facebook, factors like the strength of the relationship among users play a role among other factors.
Google uses over 200 signals, Facebook summarises here how they rank the news feed (and allows control thereover). Instagram uses 6, with Interest, Timeliness and relationship as the 3 most important ones.
And more ...
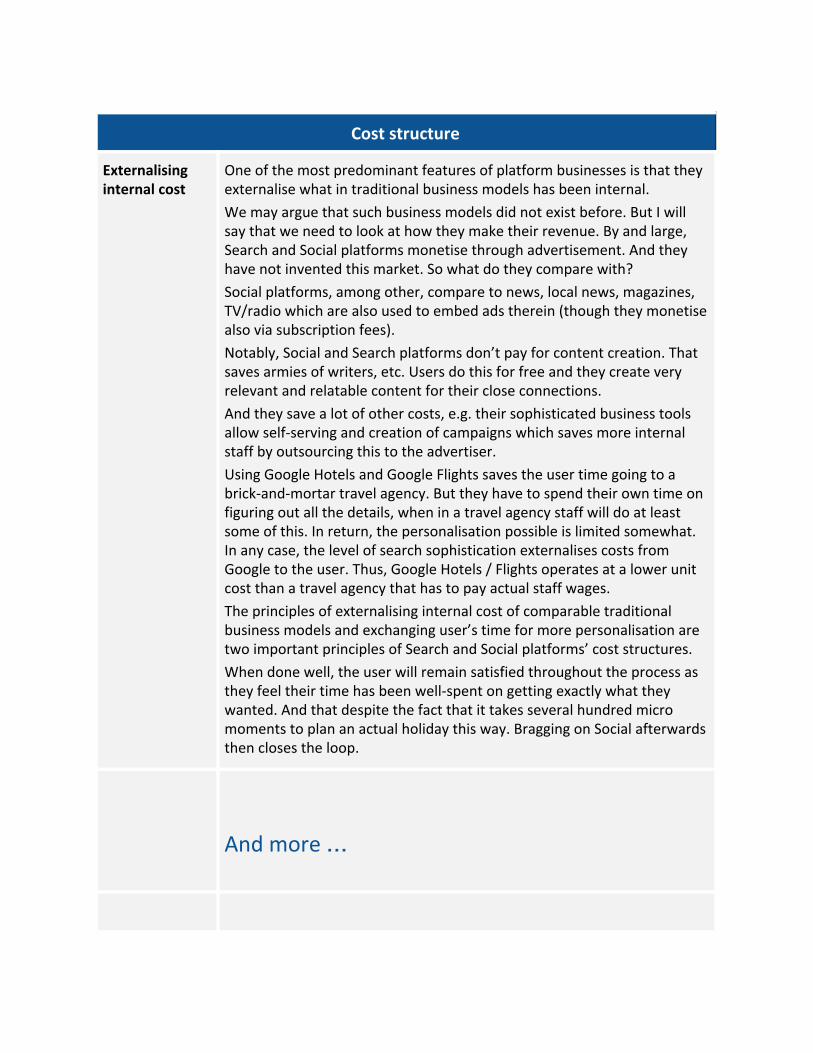
Cost structure
Externalising internal cost
One of the most predominant features of platform businesses is that they externalise what in traditional business models has been internal.
We may argue that such business models did not exist before. But I will say that we need to look at how they make their revenue. By and large, Search and Social platforms monetise through advertisement. And they have not invented this market. So what do they compare with?
Social platforms, among other, compare to news, local news, magazines, TV/radio which are also used to embed ads therein (though they monetise also via subscription fees).
Notably, Social and Search platforms don’t pay for content creation. That saves armies of writers, etc. Users do this for free and they create very relevant and relatable content for their close connections.
And they save a lot of other costs, e.g. their sophisticated business tools allow self-serving and creation of campaigns which saves more internal staff by outsourcing this to the advertiser.
Using Google Hotels and Google Flights saves the user time going to a brick-and-mortar travel agency. But they have to spend their own time on figuring out all the details, when in a travel agency staff will do at least some of this. In return, the personalisation possible is limited somewhat. In any case, the level of search sophistication externalises costs from Google to the user. Thus, Google Hotels / Flights operates at a lower unit cost than a travel agency that has to pay actual staff wages.
The principles of externalising internal cost of comparable traditional business models and exchanging user’s time for more personalisation are two important principles of Search and Social platforms’ cost structures.
When done well, the user will remain satisfied throughout the process as they feel their time has been well-spent on getting exactly what they wanted. And that despite the fact that it takes several hundred micro moments to plan an actual holiday this way. Bragging on Social afterwards then closes the loop.
And more …

This guided excerpt showed you about 25-30 pages of 130+
pages of the complete study
I hope you already got some value out of this excerpt but wait
until you see the whole thing …
Then there are more products included in the super bundle
THE SUPER BUNDLE
By now you certainly can see the value that you will get from
this resource. But I will still show you what else is included in
the Super Bundle
Each of the following resources covers these topics
- Business model canvas details
- Key user/growth metrics
- Business tools
- Financial metrics
- Monetisation
- Strategy
- Competitor analysis
- Industry analysis
- Microenonomic principles
AND focuses on different aspects that are specific to the
platform we cover (here’s more) ...

Google Google impressed me on the strategy dimension that we are covering in valuable detail. They became a huge player despite not owning any of the underlying platforms initially. This is true strategy mastery! 120+ page case study 7 Infographics
Facebook It is remarkable how Facebook managed to maintain its growth for such a long period of time against 200 other social network platforms trying to take share away. Facebook is about how to become a giant (=grow)! 90+ page case study 6 Infographics
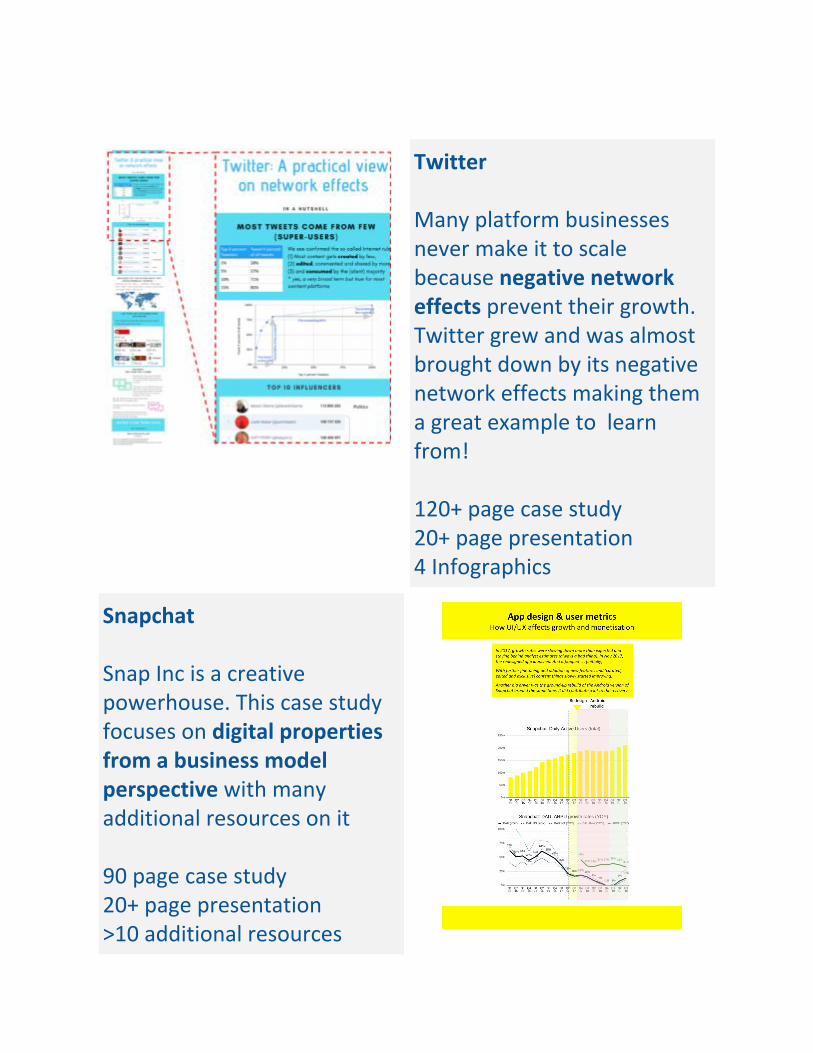
Twitter Many platform businesses never make it to scale because negative network effects prevent their growth. Twitter grew and was almost brought down by its negative network effects making them a great example to learn from! 120+ page case study 20+ page presentation 4 Infographics
Snapchat Snap Inc is a creative powerhouse. This case study focuses on digital properties from a business model perspective with many additional resources on it 90 page case study 20+ page presentation >10 additional resources
Pinterest Pinterest is super-interesting for new platform businesses because they came late to the party but have shown how through a distinct value proposition and positioning in the market one can still get to hundreds of millions of users. Very instructive for new start-ups! 85+ page case study 45+ page presentation 3 infographics
Now, you don’t need to read all parts.
You can read the comparative study first and then the case
study that you are most interested in.
Or you can read the comparative study and follow the
references to the other studies as that are listed throughout
the comparative study...
Oh!
And as if this was not enough, ….
For a temporary period of time, you get these two resources as
a bonus:
Groupon Groupon was once the fastest-growing company before things stalled. We are looking at “what happened” and which opportunities in ecommerce they see and focusing on! 60+ page case study 3 Infographics
Netflix Netflix is based on the subscription business model. This resource is the best way I can imagine to learn about finance in combination with strategy and the business model. 120+ page case study 9 additional resources

Learn great innovation and business management knowledge
and get the full potential out of your idea ….
Get the
SUPER BUNDLE now (click here)
or use this link:
https://innovationtactics.com/checkout-super-bundle-1/?product_id=44627