the superstructure determination of displacive distortions ...iso.byu.edu/iso/2012 kerman.pdfsean...
TRANSCRIPT

research papers
222 doi:10.1107/S0108767311046241 Acta Cryst. (2012). A68, 222–234
Acta Crystallographica Section A
Foundations ofCrystallography
ISSN 0108-7673
Received 29 July 2011
Accepted 2 November 2011
# 2012 International Union of Crystallography
Printed in Singapore – all rights reserved
The superstructure determination of displacivedistortions via symmetry-mode analysis
Sean Kerman,a Branton J. Campbell,a* Kiran K. Satyavarapu,a Harold T. Stokes,a
Francesca Persellib and John S. O. Evansb*
aBrigham Young University, Department of Physics and Astronomy, Provo, Utah 84602, USA, andbUniversity of Durham, Department of Chemistry, South Road, Durham, DH1 3LE, UK.
Correspondence e-mail: [email protected], [email protected]
For any crystal structure that can be viewed as a low-symmetry distortion of
some higher-symmetry parent structure, one can represent the details of the
distorted structure in terms of symmetry-adapted distortion modes of the parent
structure rather than the traditional list of atomic xyz coordinates. Because most
symmetry modes tend to be inactive, and only a relatively small number of mode
amplitudes are dominant in producing the observed distortion, symmetry-mode
analysis can greatly simplify the determination of a displacively distorted
structure from powder diffraction data. This is an important capability when
peak splittings are small, superlattice intensities are weak or systematic absences
fail to distinguish between candidate symmetries. Here, the symmetry-mode
basis is treated as a binary (on/off) parameter set that spans the space of
all possible P1 symmetry distortions within the experimentally determined
supercell. Using the average Rwp over repeated local minimizations from
random starting points as a cost function for a given mode set, global search
strategies are employed to identify the active modes of the distortion. This
procedure automatically yields the amplitudes of the active modes and the
associated atomic coordinates. The active modes are then used to detect the
space-group symmetry of the distorted phase (i.e. the type and location of each
of the parent symmetry elements that remain within the distorted supercell).
Once a handful of active modes are identified, traditional refinement methods
readily yield their amplitudes and the resulting atomic coordinates. A final
symmetry-mode refinement is then performed in the correct space-group
symmetry to improve the sensitivity to any secondary modes present.
1. Introduction
The characterization of structural distortions from powder
diffraction data is a distinct subclass of the broader field of
‘structure determination from powder data’ (SDPD). A
distorted structure can, by definition, be parameterized in
terms of its deviations from a known ‘parent’ structure, and
has a space-group symmetry that is a subgroup of the
symmetry of the parent. Normally, distortions lower symmetry
and increase structural complexity. It is common to define a
structural distortion relative to the experimentally observed
parent structure from which it arises. We note, however, that it
is often more convenient to define a distortion relative to a
more distant parent separated by several phase transitions,
or even a hypothetical parent structure. We use the term
‘distortion’ quite generally here to indicate the presence of
any type of physical order parameter such as atomic displa-
cements, magnetic moments, compositional ordering, lattice
strain etc., which distinguishes the parent and child structures.
Distortions arising from second-order (i.e. continuous) phase
transitions tend to be of special interest, though arbitrary
discontinuous transformations involving one or more super-
posed order parameters also fall within the scope of this work.
After removing the parent symmetries that are broken by
the distortion, those symmetry operations that remain
comprise the ‘distortion symmetry’, which is simply the space-
group symmetry of the distorted structure. Here, it is impor-
tant to distinguish a space group from its ‘type’. The 230
crystallographic space-group types are tabulated in the Inter-
national Tables for Crystallography, Volume A (Hahn, 2005),
whereas a complete space group describes both the symmetry
operators and their actual locations within the crystal. Thus,
there can be multiple ways to remove a portion of the parent
symmetry, each of which yields the same space-group type but
different distortion symmetries by virtue of differences in the
locations of the remaining operators. Pm3m, for example, has
an (a0 = 3a, b0 = 3b, c0 = 3c) maximal subgroup of the same
Pm3m type, but which clearly has a much lower overall
symmetry. A given distortion symmetry can always be iden-
tified by its combination of space-group type, lattice basis (i.e.

the size/shape of the supercell) and supercell origin relative to
the parent cell, provided that standard origin choices are
employed (Campbell, Stokes, Tanner & Hatch, 2006). In
general, the distortions allowed by different distortion
symmetries are fundamentally distinct.
When the powder diffraction pattern contains sufficient
information, one can treat an unknown distortion like any
other unknown structure: extracting the integrated intensities
and attempting a direct solution of the phase problem via
direct methods, charge flipping, real-space global search or
some hybrid algorithm (David et al., 2002). In many cases,
however, the combination of small peak splittings, weak
superlattice reflections and structural complexity makes it
difficult or impossible to extract reliable intensities, so that
real-space models must then be tested directly against the
entire powder pattern (whole-pattern fitting). This problem
reflects the fact that the number of well measurable and
clearly resolvable Bragg reflections often fails to keep up with
the increased structural complexity during subtle distortions.
For highly complex structures, real-space methods can be
greatly enhanced by the use of global optimization algorithms,
which explore a wide parameter space and are more robust
against getting caught in local minima (Cerny & Favre-Nicolin,
2007). Monte Carlo (Evans et al., 2003; Tremayne et al., 1997),
simulated annealing (Deem & Newsam, 1989; Coelho, 2000;
Campbell et al., 1998), parallel tempering (Falcioni & Deem,
1999; Favre-Nicolin & Cerny, 2002), genetic algorithms
(Kariuki et al., 1997; Shankland et al., 1997) and various hybrid
approaches have been successfully applied in the broader
context of general SDPD work.
In an ideal case, the space-group type is identifiable from
systematic absences or other considerations, so that the
number of structural variables can be restricted by symmetry
to a manageable number with the help of reasonable
constraints and/or restraints. Unfortunately, the same
problems that inhibit the extraction of useful intensities (too
few resolved/well measured reflections) can also make it very
difficult to conclusively detect systematic absences. Candidate
distortion models therefore have to be generated by trial and
error, which requires a great deal of time, patience and
intuition. The challenge is compounded by the need to
customize constraints and restraints for each distortion model
that are both physically reasonable and appropriate to the
symmetry.
When the distortion symmetry is not known, the trial and
error approach to model building can still be guided by
symmetry principles rather than by brute force. A relatively
simple first step is to try each of the maximal subgroups of the
parent space group (tabulated in International Tables of
Crystallography, Vol. A; Hahn, 2005) to see if the resulting cell
parameters and crystal system are consistent with the size and
shape of the experimentally identified supercell. If not, some
successive chain of maximal subgroups is guaranteed to
produce the correct result, provided that the structure really is
a distortion of the chosen parent. It may, however, be neces-
sary to explore a large number of such chains before unco-
vering the right one.
The development of sophisticated computational tools for
mapping out symmetry-descent chains has helped to make
the symmetry-descent process simpler and more robust
(Carpenter et al., 2010; Evans et al., 2003; Howard & Stokes,
1998; Howard & Zhang, 2003; Zhao et al., 2009). For example,
Bi2Sn2O7 exhibits a high-temperature pyrochlore phase (�)
with space group Fd3m as well as two non-centrosymmetric
distorted pyrochlore phases: an intermediate-temperature �phase with a 2 � 2 � 2 supercell and a room-temperature �phase with a 21/2
� 21/2� 2 supercell (Jones & Knight, 1997;
Shannon et al., 1980). When the two maximal subgroups of
Fd3m consistent with the �-phase metric failed to produce a
good fit (Kennedy et al., 1998), Evans et al. (2003) system-
atically generated a symmetry-descent tree containing all of
the non-centrosymmetric subgroups of the parent �-phase
symmetry that are consistent with the observed �-phase
metric, and which also descend from an intermediate
subgroup consistent with the �-phase metric. They then
created models for each candidate subgroup and performed
combined simulated-annealing refinements against synchro-
tron X-ray and neutron powder data sets in order to discern
the correct monoclinic structure.
Group-theoretical symmetry-mode analysis tools now exist
which generate all of the candidate distortion symmetries of a
parent structure that are consistent with an experimentally
observed supercell and point-group or space-group type
(Campbell, Stokes, Tanner & Hatch, 2006; Campbell, Stokes &
Hatch, 2006). They also generate structural models for each
candidate distortion, thus dramatically reducing the effort
required for trial and error exploration. Most importantly, the
resulting distortion models can either be expressed in terms
of traditional atomic parameters (e.g. atomic coordinates,
moments, occupancies etc.) or in terms of symmetry-mode
amplitudes. The traditional and symmetry-mode parameter
sets are related by a simple linear transformation, such that
one atom can be influenced by many modes, and one mode can
influence many atoms; both parameter sets always provide the
same number of degrees of freedom. In practice, the active-
mode amplitudes can either be calculated from the atomic
positions after the refinement (Orobengoa et al., 2009), or can
be refined directly themselves and used to calculate the atomic
positions at each step (Campbell et al., 2007). Muller et al.
(2010) further demonstrated a parametric refinement in which
the temperature dependencies of the key symmetry modes
were modelled via the direct refinement of their critical
exponents. The importance of the symmetry-mode description
of a distorted structure lies in the fact that most of the modes
available to a distortion tend to be inactive, so that the
essential structural features can be expressed in terms of
a relatively small number of non-zero mode amplitudes
(Campbell et al., 2007; Campbell, Stokes, Tanner & Hatch,
2006; Perez-Mato et al., 2010).
When the symmetry of a distortion is unknown, one might
naively consider a global optimization without symmetry (i.e.
in space group P1) that simply restrains each atom to stay
close to its position in the high-symmetry parent structure.
However the P1 model will, in general, be grossly under-
Acta Cryst. (2012). A68, 222–234 Sean Kerman et al. � Superstructure determination of displacive distortions 223
research papers

determined. In the present work, we demonstrate that one
can readily ‘bootstrap’ a P1-symmetry model that has been
parameterized in terms of symmetry-mode amplitudes. The
systematic elimination of all the inactive symmetry modes is
equivalent to constructing a network of structural constraints,
and greatly simplifies the structure solution by allowing only
the essential degrees of freedom to be explored. The funda-
mental issue that we address here is how to discover which
symmetry modes are inactive without prior knowledge of the
distorted structure.
2. Methods
Rietveld refinements were performed on room-temperature
(RT) powder diffraction data from LaMnO3 and WO3 using
the TOPAS-Academic software package (Coelho, 2007). The
refinements reported here employed a global optimization
strategy best described as ‘repeated local minimization from
random starting values’ (RLM), which is similar to the
approach described by Shankland et al. (2010). This was
accomplished via the ‘continue_after_convergence’ keyword
of TOPAS and custom macros for variable randomization
after each convergence cycle. Displacive symmetry-mode
amplitudes, rather than traditional atomic xyz coordinates,
were refined directly (Campbell et al., 2007). The ISODIS-
TORT software package was used to express the atomic
coordinates as linear functions of the symmetry-mode ampli-
tudes and to export these symbolic relationships in TOPAS
.str format.
A WO3 sample was prepared according to the method
described by Woodward et al. (1997). Approximately 12 g of
reagent-grade WO3 (Alpha Aesar, 99.8% pure) was ground
with a pestle and mortar and placed in a platinum crucible.
This was heated in air to 1273 K and allowed to cool to 298 K
at a cooling rate of 0.25 K min�1. The sample was a green
crystalline powder with no visible yellow impurities. We found
no impurities belonging to the lower-temperature P1-
symmetry phase.
Laboratory X-ray powder data from WO3 were collected
over the range 10–150� 2� on a Bruker D8 Advance diffract-
ometer in Cu K�1 mode with Soller slits and a Lynx-Eye
detector. The data were subsequently corrected to account for
the variable divergence slit, which maintained a 6 mm beam
footprint on the sample. The samples were finely ground and
passed through an 80-mesh sieve onto a zero-background
silicon disc coated in petroleum jelly to ensure good orienta-
tion sampling. RT X-ray powder patterns were recorded over
54 min at 290 K on a sample mounted in an Anton–Parr
HTK1200 furnace attachment. These X-ray powder diffrac-
tion patterns did not have exceptional counting statistics
owing to the experimental configuration. The decision to use
modest-quality data for the current study was deliberate
because it better demonstrates the limits of the novel analysis
method that we present here. Neutron powder diffraction data
on an equivalent batch of WO3 were collected at the HRPD
beamline at the ISIS facility at the Rutherford Appleton
Laboratory (Didcot, UK) over a time-of-flight range of 25–
110 ms using its back-scattering detector bank. The RT
neutron powder pattern was taken from an extremely rapid
variable-temperature sequence of 1 min scans (300 to 85 K)
collected in a CCR cryostat to test instrument performance
and data quality.
The LaMnO3 X-ray diffraction patterns were simulated
from a published model (Rodriguez-Carvajal et al., 1998) and
included various levels of artificial noise. These simulated
patterns had a constant background, a simple peak shape and
zero thermal parameters. All LaMnO3 refinements discussed
here employed the simulated pattern with artificial noise
added, whereas all WO3 refinements employed experimental
data. The WO3 refinements were performed separately against
X-ray and neutron data, and also jointly against both X-ray
and neutron data.
The analysis of each powder pattern began with a Pawley
fit in order to obtain reasonable estimates for the cell para-
meters, the peak profile and the sample height. The peak
shape and background were subsequently improved during
Rietveld refinements of a structural model. When the high-
symmetry phase above the transition is known, one can
instead use a refinement against the high-temperature data
set to obtain an adequate peak shape. All non-structural
parameters were fixed for symmetry-detection work. Because
no significant stoichiometric deviations were expected, all
occupancies were fixed at 1. For WO3, one isotropic thermal
parameter was permitted for W and another for O. These
thermal parameters were estimated from the best fit
amongst several RLM convergences in P1 symmetry and then
fixed.
Only the scale factor and the displacive-mode amplitudes
were allowed to refine when performing the RLM runs, which
consisted of over 1000 convergence cycles. The mode ampli-
tudes were randomized relative to zero after each conver-
gence using a uniform distribution of preset width in order to
ensure good statistical sampling. The selection of the width
used is described below.
3. Results and discussion
3.1. Symmetry-mode description of WO3
The temperature phase diagram of WO3 is quite compli-
cated (Diehl et al., 1978; Woodward et al., 1995; Vogt et al.,
1999). At room temperature, it is reported to have a mono-
clinic P21/n supercell of the cubic (Pm3m) aristotype with ao =
2ac, bo = 2bc and co = 2cc (Tanasaki, 1960; Howard et al., 2002).
The supercell origin is located at (1/2, 0, 1/2) within the parent
cell. Being eight times larger than the cubic parent cell, this
supercell contains a total of 32 atoms and possesses either 24
free displacive variables in P21/n symmetry or 96 free displa-
cive variables in P1 symmetry. Of the 24 displacive symmetry
modes available to RT WO3 in space group P21/n, Campbell et
al. (2007) demonstrated that only five of these modes have
large amplitudes. They further showed that a refinement
including only these five modes produced nearly as good a fit
as a refinement that included all 24 modes.
research papers
224 Sean Kerman et al. � Superstructure determination of displacive distortions Acta Cryst. (2012). A68, 222–234

If reducing 24 structural variables down to five important
active-mode amplitudes provides an advantage in P21/n, the
advantage of using symmetry modes will be far greater in P1
symmetry where there are 96 displacive degrees of freedom.
Because of low-symmetry mode splitting, however, there will
be six rather than five P1-symmetry counterparts to the five
important P21/n-symmetry modes (listed in Table 1). To
illustrate mode splitting, consider that X�5 is a six-dimensional
irreducible representation (irrep) of the parent cubic sym-
metry at the X = [0, 1/2, 0] point in k-space, and therefore has a
general order parameter direction with six degrees of
freedom, which is indicated as (a; b; c; d; e; f ). Order para-
meter directions are described in more detail elsewhere
(Stokes & Hatch, 1987; Campbell, Stokes, Tanner & Hatch,
2006). A distortion along this general order parameter direc-
tion (OPD) would result in a rather complicated super-
structure having P1 symmetry. The RT distortion with P21/n
symmetry, on the other hand, is achieved via the action of a
special six-dimensional OPD containing only two free para-
meters: (0, 0, a, a, b, �b). This special OPD provides the
parent W atom with two displacive modes (one for a and
one for b), only one of which (the b branch) is shown
to be important (i.e. has a substantially non-zero amplitude
and a significant effect on the diffraction pattern) in RT
WO3. In P1 symmetry, this X�5 ð0; 0; a; a; b;�bÞ½W�T1uðbÞ
mode splits into two modes, X�5 ða; b; c; d; e; f Þ½W�T1uðeÞ and
X�5 ða; b; c; d; e; f Þ½W�T1uðf Þ, which, if they maintained equal
and opposite amplitudes, would describe a structure that
actually has P21/n symmetry. These mode labels indicate an
irrep of the parent space-group symmetry (e.g. X5�), an OPD
[e.g. ð0; 0; a; a; b;�bÞ] of this irrep, the affected parent atom
(e.g. W), an irrep of the point-group symmetry of the Wyckoff
site of this atom (e.g. T1u) and a specific branch of the OPD
(e.g. b). (Text files containing the symmetry-mode definitions
for RT distortions of WO3 and LaMnO3, relative to a cubic
perovskite parent structure, are included as supplemental
information in TOPAS .str format. These four files contain the
P21/n-symmetry description of monoclinic WO3, the P1-
symmetry description of WO3, the Pnma-symmetry descrip-
tion of LaMnO3 and the P1-symmetry description of
LaMnO3.)1
3.2. WO3 symmetry detection
When the RT structure of WO3 is
represented with 96 displacive modes in
P1 symmetry, the ability to experimen-
tally identify the important modes
(those in Table 1) would enable us to
establish the true P21/n symmetry of the
structure without making any a priori
assumptions. The identification of these
modes is the principal objective of the
present work. Rather than attempting
to achieve a ‘best fit’ of a P1 model to
Acta Cryst. (2012). A68, 222–234 Sean Kerman et al. � Superstructure determination of displacive distortions 225
research papers
Table 1Important distortion modes in RT WO3 (space-group symmetry P21/n).
AtomMode #(P1) Mode name (P1)
Amplitude(A) (P1) Mode name (P21/n)
W 14 X�5 ða; b; c; d; e; f Þ½W�T1uðeÞ �0.47168�
X�5 ð0; 0; a; a; b;�bÞ½W�T1uðbÞW 15 X�5 ða; b; c; d; e; f Þ½W�T1uðf Þ 0.47168
W 16 M�3 ða; b; c; d; e; f Þ½W�T1uðaÞ 0.73279 M�3 ða; b; 0Þ½W�T1uðaÞ
O 37 Rþ4 ða; b; cÞ½O�EuðaÞ �1.10338 Rþ4 ða; b; 0Þ½O�EuðaÞ
O 38 Rþ4 ða; b; cÞ½O�EuðbÞ 0.83820 Rþ4 ða; b; 0Þ½O�EuðbÞ
O 78 Mþ3 ða; b; cÞ½O�EuðcÞ �1.08814 Mþ3 ð0; 0; aÞ½O�EuðaÞ
Figure 1P21/n-symmetry fits from final joint X-ray/neutron refinement against RTdiffraction data from WO3: (a) laboratory X-ray data, Rwp = 8.5%, (b)time-of-flight neutron data, Rwp = 18.9%. Calculated, observed anddifference patterns are shown. Because the lattice parameters, profileshape and background were included in this refinement, the Rwp valuesare lower than those encountered during the structure solution processdescribed below.
1 Supplementary material for this paper has been deposited in the IUCrelectronic archives (Reference: SC5045). Services for accessing these data aredescribed at the back of the journal.

experimental diffraction data, which would not be likely to
succeed because of the large number of parameters, we
instead statistically sample a large number of convergence
cycles from randomized starting points (RLM method), and
accumulate the individual parameter values from each
convergence. From these results, we are able to compile a
separate histogram for each of the 96 free displacive-mode
amplitudes. While a mode may converge to an incorrect value
on occasion, it statistically tends toward its true value, which is
manifested as a peak in its amplitude histogram. A peak
whose position clearly deviates from zero is evidence that the
mode is active.
When detecting active modes in P1 symmetry, the global
structural origin needs to either be constrained or restrained
so as not to wander randomly. In this case the origin was
constrained by fixing the three ferroelectric tungsten ��4modes at zero amplitude. Note that, in the symmetry-mode
description, only ferroelectric modes can translate the origin.
A more sophisticated approach would be to restrain the centre
of mass to stay close to zero.
This approach was first tested against the room-temperature
laboratory X-ray powder diffraction data shown in Fig. 1. All
non-displacive parameters except the scale factor were fixed,
as well as the three ferroelectric tungsten-mode amplitudes,
which left 93 refinable atomic displacement mode amplitudes.
More than 1000 convergence cycles were then run in TOPAS
in RLM mode and histograms were generated for each mode.
We found it helpful to keep the number of convergence cycles
greater than ten times the number of free parameters.
As can be seen from Fig. 2, the histograms of the three
important tungsten modes belonging to the X�5 irrep (#14 and
#15 in Table 1) and the M�3 irrep (#16) have very well defined
peaks at non-zero values, clearly showing that they are active,
while all other tungsten modes have distinct peaks at zero. The
splitting occurs because these modes consistently refine to
large non-zero values, though the sign, or direction, of
displacement is arbitrary from one convergence cycle to the
next. Unfortunately, the combination of these X�5 and M�3tungsten modes is insufficient for detecting the true P21/n
distortion symmetry in this example: they don’t break enough
symmetry by themselves, but instead produce a 1 � 2 � 2
supercell with orthorhombic space group Pbcm.
Several of the important oxygen modes must be included in
order to lower the symmetry to the true level and must,
therefore, be identified. Oxygen-mode amplitudes are,
however, less well determined by X-ray diffraction data, and
their histograms did not yield well defined peaks, tending
instead to display a relatively uniform distribution over a
broad range of amplitudes. The oxygen-mode histograms
belonging to the Rþ4 irrep (#37 and #38 in Table 1) are what are
needed to achieve the true P21/n distortion symmetry, but are
not well defined by the present X-ray data. Similarly the large-
amplitude oxygen Mþ3 mode (#78), which is not helpful for
identifying the actual symmetry, is not well determined. One
oxygen X�5 mode (#88) is clearly split; and two oxygen M�3modes (#62 and #63) are slightly split; but these modes don’t
add any new symmetry information to the tungsten X�5 and
M�3 modes discussed above, as they belong to corresponding
branches of the same irreps. Because of the relative insignif-
icance of the large-amplitude Rþ4 oxygen modes in these
modest-quality X-ray powder patterns, we were unable to
clearly detect the P21/n symmetry of RT WO3, which under-
scores the importance of obtaining high-quality data that are
sensitive to all of the important order parameters.
It is, of course, possible to introduce additional chemical
information to help identify the oxygen modes. For example,
in this case we can use restraints to
keep the bond valence sums (Brown &
Altermatt, 1985) at around 6.0 for W
sites and 2.0 for O sites and can include
a simple ‘anti-bump’ penalty function to
prevent O—O distances shorter than
�2.4 A. Both of these are relatively
unbiased pieces of information and are
designed to restrict the RLM process to
finding chemically plausible structures.
Introduction of these restraints leads to
a significant narrowing of the majority
of the histograms of Fig. 2 and gives
clear indication of the importance of
the Rþ4 and Mþ3 modes. We also found
that the important oxygen modes could
be readily detected from significantly
higher quality X-ray data.
Similar refinements were also per-
formed against very rapidly collected
RT time-of-flight neutron powder
diffraction data (Fig. 1) in order to
achieve greater sensitivity to oxygen
relative to tungsten. In the neutron-
research papers
226 Sean Kerman et al. � Superstructure determination of displacive distortions Acta Cryst. (2012). A68, 222–234
Figure 2Multi-convergence histograms for each of the displacive-mode amplitudes of P1-symmetry WO3
based on a refinement against laboratory X-ray data. Histograms above the horizontal black linecorrespond to tungsten modes, while those below the black line correspond to oxygen modes. Thehorizontal axis of each plot runs from �2.5 to 2.5 A, with tick marks placed every 1.0 A (modeamplitude is defined as root-summed-squared displacement of all affected atoms). A histogram witha clearly split peak is evidence that the mode is active. The histograms of several important activemodes have been highlighted. The full label for each mode is given in the supplementaryinformation (for this and all similar figures).

based histograms of Fig. 3, the active oxygen Rþ4 (#37 and #38)
and Mþ3 (#78) modes are clearly identified, while two of the
oxygen modes belonging to the X�5 irrep (#46 and #47) also
display very slight peak splittings, which turn out to be real.
Unfortunately, these modes alone are once again insufficient
to detect the P21/n symmetry. The active W modes could
resolve the matter but are not conclusively split. In addition,
the oxygen M�3 mode (#88) that showed up clearly in its X-ray
histogram is not at all observable in the neutron histogram. As
a result, one should judge its appearance in the X-ray histo-
gram as unreliable (possibly a phantom mode – see below).
Some of the mode histograms in Figs. 2 and 3 that we have
not yet discussed are not nicely shaped as single peaks. Some
modes, for example, have small satellite peaks, indicating that
they tend towards an alternate amplitude in a significant
fraction of the convergence cycles. Owing to the nature of
multi-variable optimization problems, this is to be occasionally
expected, even for modes that actually have zero amplitude.
But by collecting a sufficiently large statistical sample, we are
usually able to distinguish between amplitudes associated with
global versus local minima. While this outcome cannot always
be guaranteed, it is necessary for the success of the method.
The probability of detecting active- versus what we call
‘phantom’-mode amplitudes increases with the quality of the
data and the simplicity of the distorted structure. We will
discuss the observation and elimination of phantom modes in
more detail below.
The separate X-ray and neutron
RLM analyses were followed by a joint
analysis using both X-ray and neutron
data sets, in an effort to achieve good
sensitivity to both oxygen and tungsten
modes. Because the X-ray contribution
to the joint Rwp value was initially
dominant relative to the neutron
contribution, the relative weights of the
two data sets were adjusted to make
their contributions approximately
equal. The refined parameters were as
described above. In this case, we were
able to immediately identify every
large-amplitude mode (both oxygen and
tungsten), along with a number of less
important modes that yielded slightly
split histograms (Fig. 4). No phantom
modes were observed.
As discussed above, the six important
modes identified from the joint X-ray/
neutron histograms in Fig. 4 must be
merged into a smaller set of five
parameters in order to correspond to
the correct P21/n symmetry. In other
words, one of these modes must be
related to one of the others by sym-
metry. In Fig. 4, we can see at a
glance that X�5 ða; b; c; d; e; f Þ½W�T1uðeÞ
and X�5 ða; b; c; d; e; f Þ½W�T1uðf Þ (#14
and #15) have peaks at essentially
equal amplitudes. The two-dimensional
correlation plot in Fig. 5 (bottom panel)
further reveals that these two
mode amplitudes are perfectly anti-
correlated. These modes therefore
prove to be the b and�b components of
the X�5 ð0; 0; a; a; b;�bÞ½W�T1uðbÞ mode
of the P21/n distortion. In contrast, the
top panel shows that modes belonging
to different irreps (e.g. M�3 and X�5 ) are
uncorrelated. The two oxygen Rþ4modes shown in the middle panel,
Acta Cryst. (2012). A68, 222–234 Sean Kerman et al. � Superstructure determination of displacive distortions 227
research papers
Figure 4Multi-convergence histograms for each of the displacive-mode amplitudes of P1-symmetry WO3
based on a combined refinement against both laboratory X-ray data and neutron time-of-flight data.Histograms above the horizontal black line correspond to tungsten modes, while those below theblack line correspond to oxygen modes. The horizontal axis of each plot runs from �2.5 to 2.5 A,with tick marks placed every 1.0 A. The histograms of several important active modes have beenhighlighted.
Figure 3Multi-convergence histograms for each of the displacive-mode amplitudes of P1-symmetry WO3
based on a refinement against neutron time-of-flight data. Histograms above the horizontal blackline correspond to tungsten modes, while those below the black line correspond to oxygen modes.The horizontal axis of each plot runs from �2.5 to 2.5 A, with tick marks placed every 1.0 A. Thehistograms of several important active modes have been highlighted.

Rþ4 ða; b; cÞ½O�EuðaÞ and Rþ4 ða; b; cÞ½O�EuðbÞ (#37 and #38), are
clearly anti-correlated, but not perfectly (they have rather
different amplitudes), which tells us that the a and b branches
of this order parameter are not related by symmetry. These
observations are all consistent with the details of Table 1.
Thus, the P21/n distortion symmetry can be clearly and
unambiguously determined.
When all distortion modes were turned off, effectively
restricting the internal symmetry to Pm3m, the value of Rwp
for the combined X-ray/neutron refinement was quite large at
38.0%. The minimum Rwp value encountered during the RLM
runs that included all 93 atomic displacement modes in P1
symmetry was 22.1%. The two-dimensional correlation plots
of Fig. 6 show that peaks in the single-mode histograms are
associated with the lowest Rwp values (i.e. the best fits)
obtained from the RLM runs. When only the five most
research papers
228 Sean Kerman et al. � Superstructure determination of displacive distortions Acta Cryst. (2012). A68, 222–234
Figure 5Multi-convergence mode-correlation plots from the combined refinementof a P1-symmetry WO3 model against both laboratory X-ray data andneutron time-of-flight data. In the top panel, the tungsten M�3 (a, 0, 0) andX�5 (0, 0, 0, 0, e, 0) modes (#16 and #14) are both sharply split, but notcorrelated to one another because they belong to separate irreps. In themiddle panel, the oxygen Rþ4 (a, 0, 0) and Rþ4 (0, b, 0) modes (#37 and #38)are strongly anti-correlated, but still independent. In the bottom panel,the tungsten X�5 (0, 0, 0, 0, e, 0) and X�5 (0, 0, 0, 0, 0, f ) modes (#14 and #15)are perfectly anti-correlated so as to represent only one independentparameter within the true symmetry.
Figure 6Multi-convergence plots for the combined refinement of a P1-symmetryWO3 model against both laboratory X-ray data and neutron time-of-flightdata, illustrating the correlation of specific mode amplitudes with theRwp factor. Top: tungsten X�5 (0, 0, 0, 0, e, 0) mode #14. Middle: oxygenRþ4 (a, 0, 0) mode #37. Bottom: oxygen ��4 (0, 0, c) mode #27.

important modes were included and the
P21/n symmetry was imposed, Rwp
increased slightly to 22.4%. Subse-
quently turning on all of the secondary
modes available in P21/n symmetry (24
modes in total), Rwp dropped to a final
value of 22.1%, equivalent to the lowest
Rwp from the P1-symmetry RLM runs.
3.3. WO3 structure determination
Once the important active modes
have been identified, the structure has
essentially been solved by virtue of the
fact that we have refined a model
containing only these modes. It is a straightforward matter to
then decide the space-group symmetry of the resulting struc-
ture, though we have not yet explained how this is done. It is
helpful to imagine activating the important modes one at a
time. Upon invoking the first important mode (i.e. order
parameter component), using a package like ISODISTORT,
the resulting distortion symmetry will include this mode as a
symmetry-allowed degree of freedom. Additionally, any
secondary modes that are permitted to operate within this
distortion symmetry will also be automatically included with
it. If the total mode list contains all of the important modes
that have been identified, the process is complete. If not, one
continues invoking additional important modes, each of which
will further lower the distortion symmetry, until all of the
important modes are included. The resulting distortion
symmetry will be the correct one. In practice, there is a much
easier way to determine the distortion symmetry. After
refining the model that includes only the active modes, one can
simply employ a symmetry-detection tool like MISSYM/
ADDSYM (Le Page, 1987), KPLOT (Hannemann et al., 1998;
Hundt et al., 1999) or FINDSYM (Stokes & Hatch, 2004). This
approach readily identified the correct P21/n distortion
symmetry of RT WO3.
After the correct symmetry has been identified based on a
handful of important modes, one can then free up all of the
less important modes that are still permitted within that
distortion symmetry. These small-amplitude contributions
should lead to the most complete structure description,
provided that the information content of the powder pattern is
sufficient to support them.
3.4. LaMnO3
In order to further explore the limitations of our approach,
we next attempted to detect the symmetry of RT LaMnO3
while controlling statistical variables such as data signal-to-
noise level and mode-randomization amplitude. RT LaMnO3
has an orthorhombic supercell with space-group symmetry
Pnma that is related to its cubic perovskite parent lattice by
ao = ac + bc, bo = �ac + bc and co = 2cc. Its supercell has the
same origin as the parent structure. Being four times larger
than the parent cell, the RT LaMnO3 supercell contains a
total of 20 atoms and possesses either seven free displacive
variables in the true Pnma symmetry (two for La and five for
O) or 60 free displacive variables in P1 symmetry. Owing to
mode splitting, the P1-symmetry representation of this Pnma-
symmetry structure has ten free displacive variables (three for
La and seven for O). But only seven of them can be inde-
pendent when maintaining the Pnma symmetry.
For this work, we employed a simulated X-ray diffraction
pattern which was free of systematic experimental errors (Fig.
7). As with the WO3 data, the oxygen modes are more difficult
to detect than the heavy-atom modes. In this case, however,
the modes of the heavy lanthanum atom break enough
symmetry by themselves to generate the observed distortion
symmetry. Luckily, the new oxygen degrees of freedom don’t
lower the symmetry any further. In the discussion that follows,
we will abbreviate the names of the active modes as shown in
Table 2.
Starting with the simulated LaMnO3 data described above,
we fixed the lattice parameters, background shape, peak shape
Acta Cryst. (2012). A68, 222–234 Sean Kerman et al. � Superstructure determination of displacive distortions 229
research papers
Figure 7Pnma-symmetry fit to low-noise simulated X-ray diffraction data fromLaMnO3 (Rwp = 8.74%). Calculated, observed and difference patterns areshown.
Table 2Distortion modes in RT LaMnO3 (space-group symmetry Pnma).
AtomMode #(P1) Mode name (P1)
Amplitude(A) (P1) Mode name (Pnma)
La 4 Rþ5 ða; b; cÞ½La�T1uðaÞ 0.06196�
Rþ5 ða; a; 0Þ½La�T1uðaÞLa 5 Rþ5 ða; b; cÞ½La�T1uðbÞ 0.06196
La 9 Xþ5 ða; b; 0; 0; 0; 0Þ½La�T1uðbÞ 0.54731 Xþ5 ða; b; 0; 0; 0; 0Þ½La�T1uðbÞ
O 37 Rþ4 ða; b; cÞ½O�EuðaÞ �0.83865�
Rþ4 ða;�a; 0Þ½O�EuðaÞO 38 Rþ4 ða; b; cÞ½O�EuðbÞ 0.83865
O 40 Rþ5 ða; b; cÞ½O�EuðaÞ �0.01886�
Rþ5 ða; a; 0Þ½O�EuðaÞO 41 Rþ5 ða; b; cÞ½O�EuðbÞ �0.01886
O 45 Xþ5 ða; b; 0; 0; 0; 0Þ½O�EuðbÞ 0.14768 Xþ5 ða; b; 0; 0; 0; 0Þ½O�EuðbÞ
O 53 Mþ2 ð0; 0; aÞ½O�A2uðaÞ 0.36055 Mþ2 ð0; 0; aÞ½O�A2uðaÞ
O 54 Mþ3 ð0; 0; aÞ½O�EuðaÞ �0.89971 Mþ3 ð0; 0; aÞ½O�EuðaÞ

and all other non-displacive parameters except the scale factor
at appropriate values. The three ferroelectric lanthanum-
mode amplitudes that set the origin were also fixed, which left
57 refinable atomic displacement mode amplitudes. More than
1000 RLM convergence cycles were then run in TOPAS, and
histograms were generated for each of the mode amplitudes.
The lanthanum-mode histograms in Fig. 8 have sufficiently
well defined peaks to determine which are active and which
are not, whereas only two oxygen-mode histograms (#45 and
#53) have well defined peaks. One inactive lanthanum Rþ5mode (#6) and one inactive manganese M�5 mode (#23) also
appeared to split (Fig. 9 provides a closer view of mode
#6). We call these ‘phantom modes’. Such phantom modes
potentially point us to the wrong space-group symmetry and
must be eliminated if we are to detect the true space group.
The phantom modes appear to arise primarily from corre-
lations between inactive modes, such that small amplitudes
applied to these modes approximately cancel one another’s
contributions to the diffraction pattern. The top panel of Fig.
10 illustrates that the amplitudes (but not signs) of the
phantom modes #46 and #47 are correlated. The bottom panel
reveals a somewhat more complicated correlation between
modes #44 and #60, which both exhibit both central and
satellite peaks. The central peaks are indicative of the true
structure, while the correlated satellite
peaks indicate phantom amplitudes due
to correlations that arise in some (but
not all) RLM convergence cycles.
3.5. A procedure to eliminate phantommodes
A P1-symmetry refinement of a
higher-symmetry structure is inherently
underdetermined. When one atom is
incorrectly placed, the fit may be
improved if a correlated atom is like-
wise incorrectly placed. By creating an
overall tendency towards misplacement,
this correlated behaviour can give rise
to phantom modes, which are inactive
in reality, but still give rise to split mode-
amplitude histograms. Fortunately,
phantom modes have certain char-
research papers
230 Sean Kerman et al. � Superstructure determination of displacive distortions Acta Cryst. (2012). A68, 222–234
Figure 8Multi-convergence mode-amplitude histograms for each of the displacive-mode amplitudes ofLaMnO3 in P1 symmetry based on a refinement against simulated low-noise X-ray data. Thehorizontal axis of each plot runs from �0.5 to 0.5 A, with tick marks placed every 0.25 A. The twohorizontal black lines separate the well defined La modes (top), the Mn modes (middle) and the Omodes (bottom). The histograms of several important active modes have been highlighted.
Figure 9Zoomed-in view of the multi-convergence mode-amplitude histogram forphantom mode #6, for which the splitting is not apparent in Fig. 8.
Figure 10Multi-convergence mode-correlation plots from the refinement of a P1-symmetry LaMnO3 model against simulated laboratory X-ray data. The‘X’-shaped characters of these plots reveal correlations in amplitude butnot sign. The top panel shows a modest correlation between the split-histogram peaks of the oxygen X�3 (a, 0, 0) and X�4 (a, 0, 0) phantommodes (#46 and #47). The bottom panel reveals a rather strongcorrelation between the satellite peaks in the histograms of the oxygenXþ5 (a, 0, 0, 0, 0, 0) and M�5 (0, b, 0, 0, 0, 0) phantom modes (#44 and #60).

acteristics that allow us to distinguish them from true active
modes. Most importantly, fixing the amplitude of an active
mode to zero should noticeably increase the R value of the fit,
whereas fixing the amplitude of a phantom mode at zero
would not be expected to increase R under normal circum-
stances. Because phantom modes are inherently correlated,
however, simple R-value tests don’t always make their iden-
tification easy. But with some care, phantoms can be identified
and eliminated by iterative testing. The procedure that we
employed requires that we define some terms as follows:
(i) Initial mode set: an initial collection of modes whose
mode-amplitude histograms are sufficiently well split to be
interesting candidates.
(ii) Current mode set: the set of candidate modes that we
are considering at any given step of the procedure.
(iii) ‘Measure R’: deactivate all modes (i.e. fix the ampli-
tudes to zero) that are not in the mode set, and determine the
minimum number (N) of least-squares cycles needed to
achieve a representative (but potentially underdetermined)
best fit involving these modes. N should be large enough to
be effective, but no larger than necessary, as this process will
be repeated many times. For this example, we obtained a
reasonably good fit in under 1 min on a desktop PC with N =
100 least-squares cycles, which yielded approximately ten
RLM convergences. Record the minimum Rwp value achieved
during the course of these N cycles. This is what it means to
‘measure R’ for a given mode set.
(iv) Mode inclusion run: perform an inclusion test on each
mode that is not part of the current mode set one at a time in a
convenient order (e.g. lexicographical order by name). This
means that, for each mode, we activate it, measure R for the
new mode set (adjust N as needed), and deactivate it again.
Make a chart of measured R values from these tests, sorted
according to ascending R value, and use it to determine which
modes, if any, should be added to the current mode set. The
best candidates will be those that lower R the most relative to
the current mode set (i.e. the modes on the left-hand side of
the graph). Then activate the included modes.
(v) Mode exclusion run: perform an exclusion test on each
mode in the current mode set one at a time in a convenient
order. This means that, for each mode, we note the original
amplitude, deactivate it, measure R for the new mode set
(adjust N as needed), activate the mode again (i.e. allow it to
be refined) and restore its original amplitude. Make a chart of
the measured R values from these tests, sorted according to
descending R value, and use it to determine which, if any,
modes should be deleted from the current mode set. The best
candidates to exclude will be those that raise R the least
relative to the current mode set (i.e. the modes on the right-
hand side of the graph). Then deactivate the excluded modes.
Using Python scripts to run TOPAS from the command
line, we applied the above method to our simulated LaMnO3
data, beginning with 1000 RLM convergence cycles, from
which we created amplitude histograms. Based on the histo-
grams, we selected modes #(4, 5, 9, 23, 27, 33, 45, 46, 47, 53, 54,
59) as our initial mode set, though we could just as easily have
selected a few more or a few less. We treated this step as an
effective mode inclusion run, and followed it with a mode
exclusion run, which led to the elimination of modes #(23, 33,
46). Next, we performed a mode inclusion run (Fig. 11a) in
which we added all modes that had an impact on the R value
greater or equal to that of mode #60 (i.e. those that brought
Rwp below 9.6%), namely modes #(37, 38, 40, 41, 30, 31, 28, 32,
44, 60). Another mode exclusion run (Fig. 11b) led us to
eliminate all modes with an impact less than or equal to that of
mode #40 (i.e. those that took Rwp above 8.8%), namely modes
#(40, 30, 31, 60, 47, 44, 27, 41, 28, 32, 59). Additional inclusion–
exclusion iterations required no changes to the mode set,
which gave us considerable confidence in the result. The final
mode set, #(4, 5, 9, 37, 38, 45, 53, 54), consisted only of large-
amplitude active modes and was sufficient to identify the
correct Pnma symmetry. One can, in principle, repeat the
inclusion and exclusion steps as many times as desired.
The same approach was also applied separately to the X-ray
and neutron data from WO3 described above. For the X-ray
data, the final mode set consisted of three WO3 modes, #(14,
15, 16), while for the neutron data, it consisted of #(14, 15, 16,
37, 38, 46, 47, 78). All of these modes are real – every phantom
mode was eliminated. As per the previous discussion of WO3
histogram analysis, the modes identified from the X-ray data
were insufficient to fully detect the correct P21/n symmetry. In
the case of the neutron data, however, the iterative mode
inclusion and exclusion runs enhanced the sensitivity of the
analysis so that the correct P21/n symmetry was conclusively
established without using the complementary X-ray informa-
tion.
3.6. Short cuts
If we were to skip steps (i) through (iii), i.e. to initially
include all modes, a single mode exclusion run might be
Acta Cryst. (2012). A68, 222–234 Sean Kerman et al. � Superstructure determination of displacive distortions 231
research papers
Figure 11Mode inclusion and exclusion charts for the 57-parameter LaMnO3
refinement against simulated X-ray data (the three ferroelectric Lamodes were deactivated to fix the origin). (a) A mode inclusion run thatbegan with a nine-mode preliminary set (see text for details) tested theremaining 48 modes. The bar labelled ‘0’ tested only the current mode set.The ten modes up to #60 were selected for inclusion. (b) A modeexclusion run that tested each of 19 modes from the current set led to theexclusion of all but the first eight modes (up to #4). The first mode in theexclusion chart is mode #9, which has its top cropped off because it had amuch larger impact than any of the others (Rwp = 27.2%).

sufficient to correctly identify the most important active
modes without picking up any phantom modes. With such a
large number of refined amplitudes, however, each least-
squares cycle can be very slow, and the number of cycles
required to achieve a single convergence can become very
large. We tried this approach on the X-ray data from WO3 and
found it to be computationally prohibitive. Using a small
preliminary mode set based on mode histograms proved far
more efficient. Skipping step (i) and instead starting with an
empty initial mode set also worked quite well for our WO3 and
LaMnO3 examples, ultimately yielding the same final mode
sets with much lower overall computational expense. This is,
perhaps, the best option of all, though a greater number of
inclusion/exclusion iterations are needed because of the lower
quality of the preliminary information.
The generation and use of mode histograms has both pros
and cons. On the one hand, histograms deliver a superior
preliminary mode set that already includes most of the
important modes that can be detected, so that further analysis
is relatively easy. On the other hand, the histograms can be
relatively computationally expensive to generate for large
diffraction data sets and require user interaction. Using a
simplistic RLM approach, without any effort to improve
speed, it took about 72 h to achieve 10 � 96 convergences in
the WO3 example above. We thus recommend trying an empty
preliminary mode set first. If unsuccessful, one can then
generate and visualize mode-amplitude histograms to obtain a
higher-quality initial mode set.
3.7. Signal-to-noise limitations
We also tested the limit to which active-mode detection is
sensitive to noisy diffraction data by refining the LaMnO3
model against simulated X-ray data to which artificial Gaus-
sian noise was added. For each noise level studied, over a
range between zero and the approximate average Bragg-peak
height, histogram sets comparable to those of Fig. 8 were
generated. Because La is a strong scatterer, the active
lanthanum modes proved to be robust against modest noise
levels, but eventually disappeared (i.e. lost their distinctive
histogram splittings) at higher noise levels. The large-
amplitude Rþ5 ða; b; cÞ½La�T1uðbÞ (#5) mode persisted until the
noise level exceeded the heights of all but the strongest Bragg
peak. The weaker oxygen modes were difficult to detect, even
with zero noise, and washed out completely at intermediate
noise levels. It seems intuitive that when the magnitude of the
noise becomes comparable to a mode’s strongest contribution
to the diffraction pattern, the mode’s histogram splitting will
disappear.
Phantom modes tend to become more prevalent at higher
noise levels. This happens because inactive modes can take on
larger amplitudes at higher noise levels without significantly
impacting the R value of the fit. They are then more likely to
be pulled to consistently non-zero amplitudes via correlations
with other modes. After completing a fit that included
phantom-mode number #6 of La, we manually varied its
amplitude while holding all others constant and observed that
the minimum R value occurred at a distinctly non-zero value
(see Fig. 12) for this particular refinement model. The
lowering of R was, however, very small and this effect was
correlated with other trivial aspects of the fitting model such
as peak shape or background description.
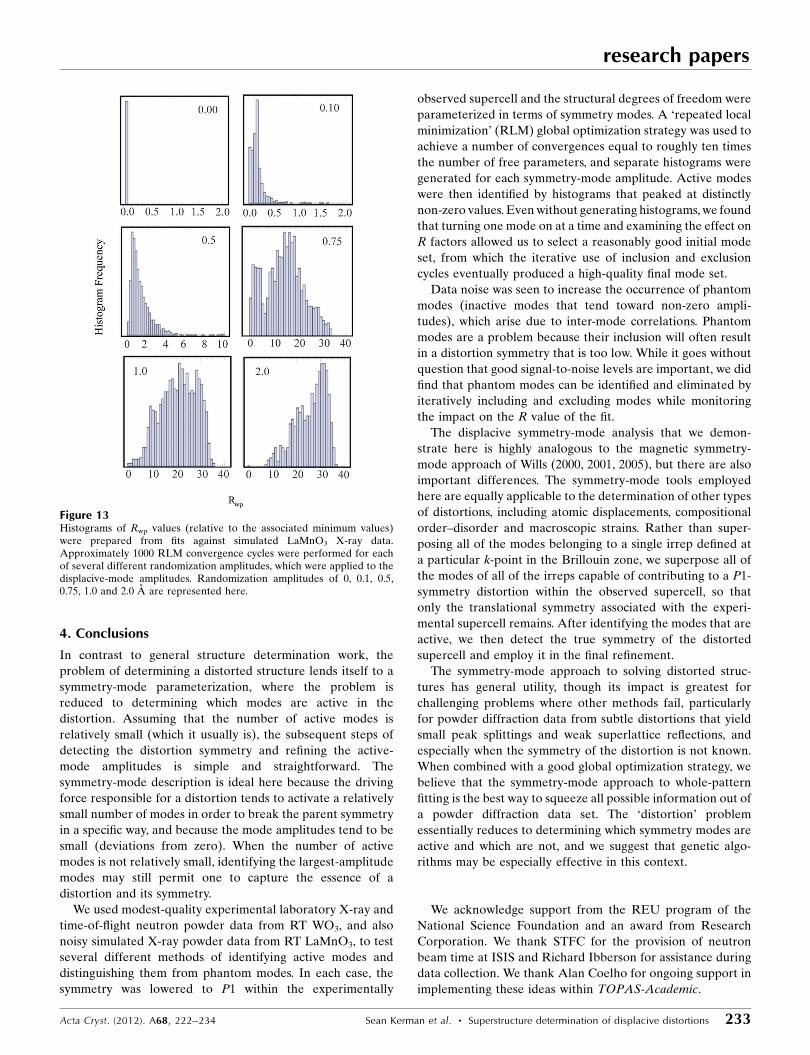
3.8. Randomization range
We also explored the optimum displacement width for
the uniform distribution of initial mode-amplitude values.
We tested a variety of widths between 0.01 and 2.0 A. For each
candidate width, we ran a series of 1000 or more RLM-
mode convergences against an LaMnO3 data set with a
low noise level and generated a histogram of converged Rwp
values, as shown in Fig. 13. The Rwp axis on these histograms
has been shifted so that the lowest Rwp value recorded in
the refinement is defined to be zero. The histograms tend to
be bimodal, possessing a low-R peak of relatively good fits
that are likely to be close to the correct structure, and a
broader high-R peak of relatively poor fits. At 0.75 A displa-
cement width, the size of the low-R peak indicates that about
one in five of the convergence cycles end with a good fit. A
width of 0.75 A is probably the highest tolerable value in this
example – reasonable fits are rare beyond that point. As the
frequency of high-R fits to the LaMnO3 data set increased, we
observed that the split peaks in the mode-amplitude histo-
grams of the important modes tended to be washed out,
especially weakly indicated oxygen modes. As the distribution
width decreases towards zero, the frequency of a good fit
increases. If the width of the distribution is too small, however,
it may be impossible for the fit to escape a common local
minimum. For this example, we concluded that a randomiza-
tion range of �0.1 A provided sufficient randomness for
effective parameter-space exploration, but not so much that
the refinements didn’t converge to a low-R solution. This
width was employed when generating the mode histograms in
Figs. 2, 3, 4 and 8.
research papers
232 Sean Kerman et al. � Superstructure determination of displacive distortions Acta Cryst. (2012). A68, 222–234
Figure 12Plot of �Rwp versus mode amplitude for phantom mode #6 of theLaMnO3 distortion. After allowing the active-mode amplitudes to refineto their optimal values, they were all fixed, at which point only mode #6was varied over a narrow range around zero in steps of 0.002 A. Thisanalysis was performed at two different simulated noise levels relative tothe height of the strongest Bragg peak: 0.3% (open circles) and 0.9%(filled circles). Deviations from the expected parabolic behaviour aremore apparent at higher noise levels.
4. Conclusions
In contrast to general structure determination work, the
problem of determining a distorted structure lends itself to a
symmetry-mode parameterization, where the problem is
reduced to determining which modes are active in the
distortion. Assuming that the number of active modes is
relatively small (which it usually is), the subsequent steps of
detecting the distortion symmetry and refining the active-
mode amplitudes is simple and straightforward. The
symmetry-mode description is ideal here because the driving
force responsible for a distortion tends to activate a relatively
small number of modes in order to break the parent symmetry
in a specific way, and because the mode amplitudes tend to be
small (deviations from zero). When the number of active
modes is not relatively small, identifying the largest-amplitude
modes may still permit one to capture the essence of a
distortion and its symmetry.
We used modest-quality experimental laboratory X-ray and
time-of-flight neutron powder data from RT WO3, and also
noisy simulated X-ray powder data from RT LaMnO3, to test
several different methods of identifying active modes and
distinguishing them from phantom modes. In each case, the
symmetry was lowered to P1 within the experimentally
observed supercell and the structural degrees of freedom were
parameterized in terms of symmetry modes. A ‘repeated local
minimization’ (RLM) global optimization strategy was used to
achieve a number of convergences equal to roughly ten times
the number of free parameters, and separate histograms were
generated for each symmetry-mode amplitude. Active modes
were then identified by histograms that peaked at distinctly
non-zero values. Even without generating histograms, we found
that turning one mode on at a time and examining the effect on
R factors allowed us to select a reasonably good initial mode
set, from which the iterative use of inclusion and exclusion
cycles eventually produced a high-quality final mode set.
Data noise was seen to increase the occurrence of phantom
modes (inactive modes that tend toward non-zero ampli-
tudes), which arise due to inter-mode correlations. Phantom
modes are a problem because their inclusion will often result
in a distortion symmetry that is too low. While it goes without
question that good signal-to-noise levels are important, we did
find that phantom modes can be identified and eliminated by
iteratively including and excluding modes while monitoring
the impact on the R value of the fit.
The displacive symmetry-mode analysis that we demon-
strate here is highly analogous to the magnetic symmetry-
mode approach of Wills (2000, 2001, 2005), but there are also
important differences. The symmetry-mode tools employed
here are equally applicable to the determination of other types
of distortions, including atomic displacements, compositional
order–disorder and macroscopic strains. Rather than super-
posing all of the modes belonging to a single irrep defined at
a particular k-point in the Brillouin zone, we superpose all of
the modes of all of the irreps capable of contributing to a P1-
symmetry distortion within the observed supercell, so that
only the translational symmetry associated with the experi-
mental supercell remains. After identifying the modes that are
active, we then detect the true symmetry of the distorted
supercell and employ it in the final refinement.
The symmetry-mode approach to solving distorted struc-
tures has general utility, though its impact is greatest for
challenging problems where other methods fail, particularly
for powder diffraction data from subtle distortions that yield
small peak splittings and weak superlattice reflections, and
especially when the symmetry of the distortion is not known.
When combined with a good global optimization strategy, we
believe that the symmetry-mode approach to whole-pattern
fitting is the best way to squeeze all possible information out of
a powder diffraction data set. The ‘distortion’ problem
essentially reduces to determining which symmetry modes are
active and which are not, and we suggest that genetic algo-
rithms may be especially effective in this context.
We acknowledge support from the REU program of the
National Science Foundation and an award from Research
Corporation. We thank STFC for the provision of neutron
beam time at ISIS and Richard Ibberson for assistance during
data collection. We thank Alan Coelho for ongoing support in
implementing these ideas within TOPAS-Academic.
Acta Cryst. (2012). A68, 222–234 Sean Kerman et al. � Superstructure determination of displacive distortions 233
research papers
Figure 13Histograms of Rwp values (relative to the associated minimum values)were prepared from fits against simulated LaMnO3 X-ray data.Approximately 1000 RLM convergence cycles were performed for eachof several different randomization amplitudes, which were applied to thedisplacive-mode amplitudes. Randomization amplitudes of 0, 0.1, 0.5,0.75, 1.0 and 2.0 A are represented here.

References
Brown, I. D. & Altermatt, D. (1985). Acta Cryst. B41, 244–247.Campbell, B. J., Bellussi, G., Carluccio, L., Perego, G., Cheetham,
A. K., Cox, D. E. & Millini, R. (1998). Chem. Commun. pp. 1725–1726.
Campbell, B. J., Evans, J. S. O., Perselli, F. & Stokes, H. T. (2007). IUCrComputing Commission Newsletter, pp. 81–95.
Campbell, B. J., Stokes, H. T. & Hatch, D. M. (2006). TheISODISTORT software package. Brigham Young University,USA. http://stokes.byu.edu/isodistort.html.
Campbell, B. J., Stokes, H. T., Tanner, D. E. & Hatch, D. M. (2006). J.Appl. Cryst. 39, 607–614.
Carpenter, M. A., McKnight, R. E. A., Howard, C. J. & Knight, K. S.(2010). Phys. Rev. B, 82, 094101.
Cerny, R. & Favre-Nicolin, V. (2007). Z. Kristallogr. 222, 105–113.Coelho, A. A. (2000). J. Appl. Cryst. 33, 899–908.Coelho, A. A. (2007). TOPAS Academic: General Profile and
Structure Analysis Software for Powder Diffraction Data. BrukerAXS, Karlsruhe, Germany.
David, W. I. F., Shankland, K., McCusker, L. B. & Baerlocher, C.(2002). Structure Determination from Powder Diffraction Data.Oxford University Press.
Deem, M. W. & Newsam, J. M. (1989). Nature (London), 342, 260–262.
Diehl, R., Brandt, G. & Salje, E. (1978). Acta Cryst. B34, 1105–1111.Evans, I. R., Howard, J. A. K. & Evans, J. S. O. (2003). J. Mater. Chem.
13, 2098–2103.Falcioni, M. & Deem, M. W. (1999). J. Chem. Phys. 110,
1754–1766.Favre-Nicolin, V. & Cerny, R. (2002). J. Appl. Cryst. 35, 734–743.Hahn, Th. (2005). International Tables for Crystallography, Vol. A,
5th ed. Dordrecht: Kluwer Academic Publishers.Hannemann, A., Hundt, R., Schon, J. C. & Jansen, M. (1998). J. Appl.
Cryst. 31, 922–928.Howard, C. J., Luca, V. & Knight, K. S. (2002). J. Phys. Condens.
Matter, 14, 377–387.Howard, C. J. & Stokes, H. T. (1998). Acta Cryst. B54, 782–789.Howard, C. J. & Zhang, Z. M. (2003). J. Phys. Condens. Matter, 15,
4543–4553.Hundt, R., Schon, J. C., Hannemann, A. & Jansen, M. (1999). J. Appl.
Cryst. 32, 413–416.
Jones, R. H. & Knight, K. S. (1997). J. Chem. Soc. Dalton Trans. pp.2551–2555.
Kariuki, B. M., Serrrano-Gonzalez, H., Johnston, R. L. & Harris,K. D. M. (1997). Chem. Phys. Lett. 280, 189–195.
Kennedy, B. J., Ismunandar & Elcombe, M. M. (1998). Mater. Sci.Forum, 278-2, 762–767.
Le Page, Y. (1987). J. Appl. Cryst. 20, 264–269.Muller, M., Dinnebier, R. E., Ali, N. Z., Campbell, B. J. & Jansen, M.
(2010). Mater. Sci. Forum, 651, 79–95.Orobengoa, D., Capillas, C., Aroyo, M. I. & Perez-Mato, J. M. (2009).
J. Appl. Cryst. 42, 820–833.Perez-Mato, J. M., Orobengoa, D. & Aroyo, M. I. (2010). Acta Cryst.
A66, 558–590.Rodriguez-Carvajal, J., Hennion, M., Moussa, F., Moudden, A. H.,
Pinsard, L. & Revcolevschi, A. (1998). Phys. Rev. B, 57, R3189–R3192.
Shankland, K., David, W. I. F. & Csoka, T. (1997). Z. Kristallogr. 210,550–552.
Shankland, K., Markvardsen, A. J., Rowlatt, C., Shankland, N. &David, W. I. F. (2010). J. Appl. Cryst. 43, 401–406.
Shannon, R. D., Bierlein, J. D., Gillson, J. L., Jones, G. A. & Sleight,A. W. (1980). J. Phys. Chem. Solids, 41, 117–122.
Stokes, H. T. & Hatch, D. M. (1987). Isotropy Subgroups of the 230Crystallographic Space Groups. Singapore: World Scientific.
Stokes, H. T. & Hatch, D. M. (2004). The FINDSYM software utility.Brigham Young University, USA. http://stokes.byu.edu/findsym.html.
Tanasaki, S. (1960). J. Phys. Soc. Jpn, 15, 573–581.Tremayne, M., Kariuki, B. M., Harris, K. D. M., Shankland, K. &
Knight, K. S. (1997). J. Appl. Cryst. 30, 968–974.Vogt, T., Woodward, P. M. & Hunter, B. A. (1999). J. Solid State
Chem. 144, 209–215.Wills, A. S. (2000). Physica B, 276, 680–681.Wills, A. S. (2001). Phys. Rev. B, 63, 064430.Wills, A. S. (2005). J. Mater. Chem. 15, 245–253.Woodward, P. M., Sleight, A. W. & Vogt, T. (1995). J. Phys. Chem.
Solids, 56, 1305–1315.Woodward, P. M., Sleight, A. W. & Vogt, T. (1997). J. Solid State
Chem. 131, 9–17.Zhao, J., Ross, N. L., Angel, R. J., Carpenter, M. A., Howard, C. J.,
Pawlaka, D. A. & Lukasiewicz, T. (2009). J. Phys. Condens. Matter,21, 235403.
research papers
234 Sean Kerman et al. � Superstructure determination of displacive distortions Acta Cryst. (2012). A68, 222–234