the substance in styles - nomura · pdf fileidentifying risk premia in fixed income markets...
TRANSCRIPT
© Nomura
Looking at alternative return sources in fixed income and equities
May 2013
The substance in styles
Anthony Morris Head of Quantitative Strategies +44 (0)20 7102 9215 [email protected]

Table of contents
■ Identifying risk premia in fixed income markets
- Investment styles in fixed-income are not new
- Defining styles in fixed-income
- Why bother with investment styles: performance, diversification and coherence
■ Applying fixed-income tools to equity markets
- The similarities between equity indexes and soybeans
- Performance of fixed-income styles in equity markets
■ Using economic momentum to allocate between equities and bonds

Identifying risk premia in fixed income markets

Investment styles in fixed-income are not new

Global asset allocation
Asset managers often position based on themes…
Source: Nomura Research.
Interest rates
Currencies
Commodities
Corporate credit
Low rates, deficit concerns
Falling gold
Global slowdown, rising risk aversion
Depressed yield levels
Asset class Theme Investment opportunity
Short global government bond markets
Short US$
Short gold
Short credit markets
Interest rate volatility High implied volatility Sell swaption straddles
4

Global asset allocation
…in effect using investment styles
Source: Nomura Research.
Interest rates
Currencies
Commodities
Corporate credit
Low rates, deficit concerns
Falling gold
Rising risk aversion
Depressed yield levels
Asset class Theme Investment style
Value
Carry, Macro Momentum
Price Momentum
Macro Momentum
Investment opportunity
Short global government bond markets
Short US$
Short gold
Short credit markets
Interest rate volatility High implied volatility Volatility selling Sell swaption straddles
5
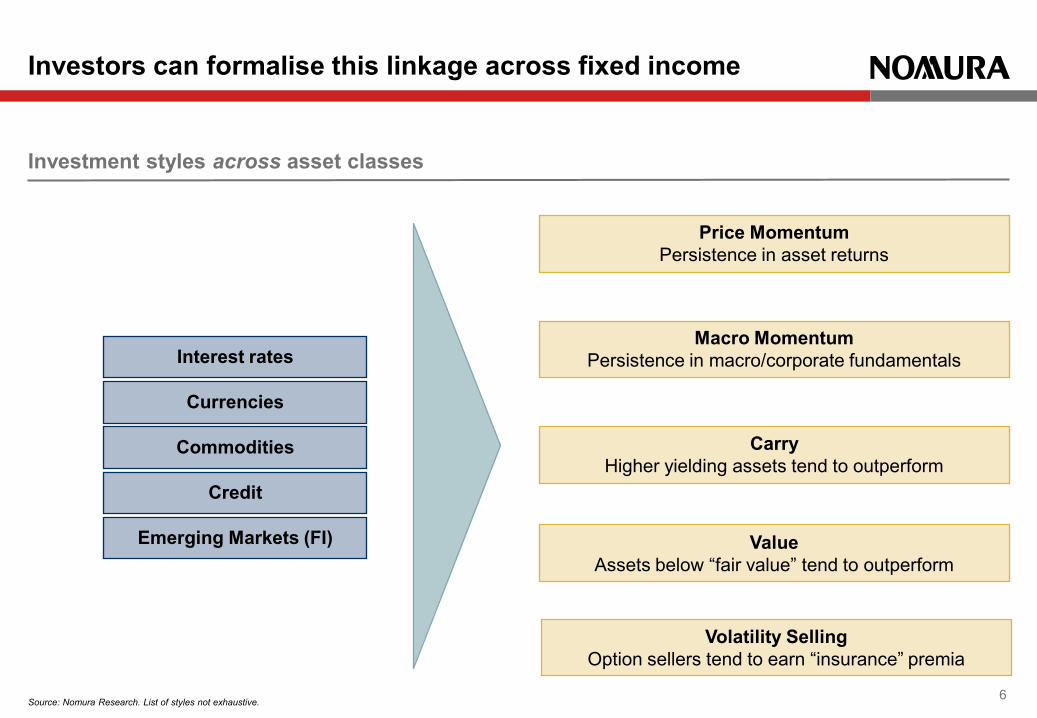
Investment styles across asset classes
Investors can formalise this linkage across fixed income
Source: Nomura Research. List of styles not exhaustive.
Macro Momentum Persistence in macro/corporate fundamentals
Carry Higher yielding assets tend to outperform
Value Assets below “fair value” tend to outperform
Price Momentum Persistence in asset returns
Interest rates
Currencies
Commodities
Credit
Volatility Selling Option sellers tend to earn “insurance” premia
Emerging Markets (FI)
6

Systematic study of styles is less common in fixed-income
Source: Bloomberg, Nomura Research. Excess returns refer to return over cash. US equities: MSCI US TR index, Global bonds: EFFAS US Bond Index , USD cash rate : 1 month LIBOR. Equity and bond returns have been vol-adjusted to target 15% volatility in this sample
Recent long-only performance is better than equities, maybe leading to complacency
7
Recent long-only experience of equities vs. bonds
0
100
200
300
400
500
600
1994 1996 1998 2000 2002 2004 2006 2008 2010 2012
Cum
ulat
ive
exce
ss re
turn
s (v
olat
ility
-adj
uste
d)
US equities US bonds
Defining investment styles in fixed income

Price momentum
– Long assets with strong returns and short those with weak returns
Macro momentum
– Long risky assets given economic strength and short risky ones given economic weakness
Carry
– Rates: Long duration when yield curves are steep
– Credit: Long corporate credit in benign risk environments
– Currencies (G10, EM): Long currencies with high interest rates against those with low interest rates
– Commodities: Long more backwardated commodities
Value
– Long assets significantly below fair value and short those above
– Essentially a mean-reversion, “rich-cheap” trade
Volatility
– Short implied volatility in rates (selling delta-hedged swaption straddles) and FX markets (selling delta-hedged straddles)
Defining investment styles
9
Styles are a way of understanding and systematising good practices, not something new
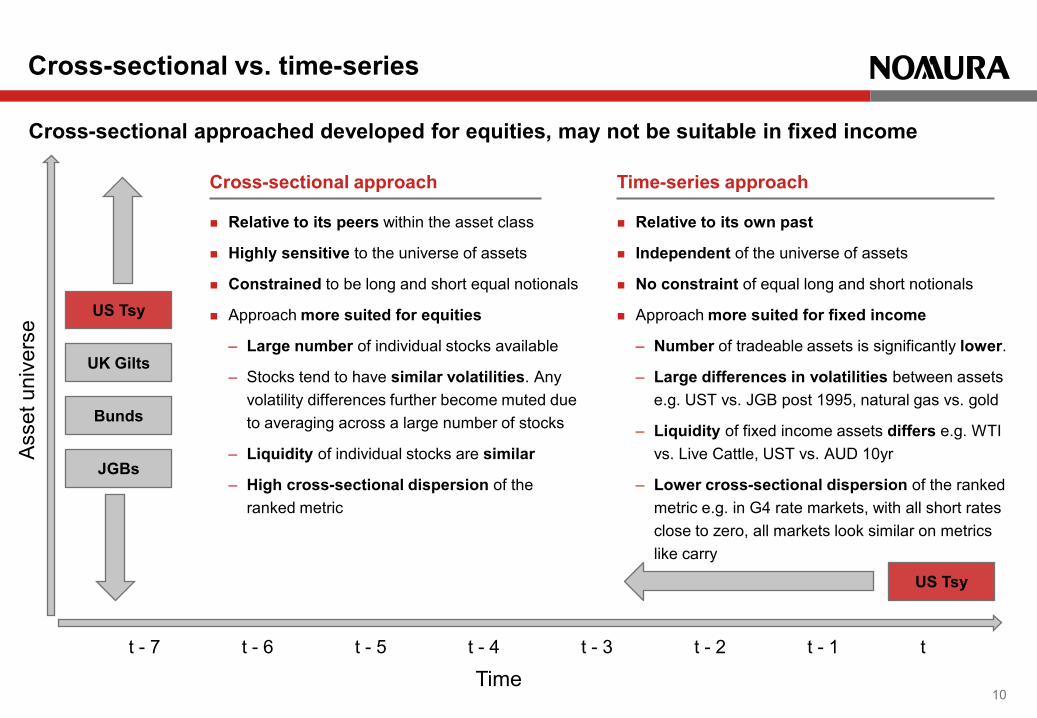
Relative to its peers within the asset class
Highly sensitive to the universe of assets
Constrained to be long and short equal notionals
Approach more suited for equities
– Large number of individual stocks available
– Stocks tend to have similar volatilities. Any volatility differences further become muted due to averaging across a large number of stocks
– Liquidity of individual stocks are similar
– High cross-sectional dispersion of the ranked metric
Relative to its own past
Independent of the universe of assets
No constraint of equal long and short notionals
Approach more suited for fixed income
– Number of tradeable assets is significantly lower.
– Large differences in volatilities between assets e.g. UST vs. JGB post 1995, natural gas vs. gold
– Liquidity of fixed income assets differs e.g. WTI vs. Live Cattle, UST vs. AUD 10yr
– Lower cross-sectional dispersion of the ranked metric e.g. in G4 rate markets, with all short rates close to zero, all markets look similar on metrics like carry
Cross-sectional vs. time-series
Cross-sectional approached developed for equities, may not be suitable in fixed income
Cross-sectional approach Time-series approach
US Tsy
US Tsy
UK Gilts
Bunds
JGBs
t t - 1 t - 2 t - 3 t - 4 t - 5 t - 6 t - 7
Ass
et u
nive
rse
Time 10

Why bother with investment styles?
# 1 Performance
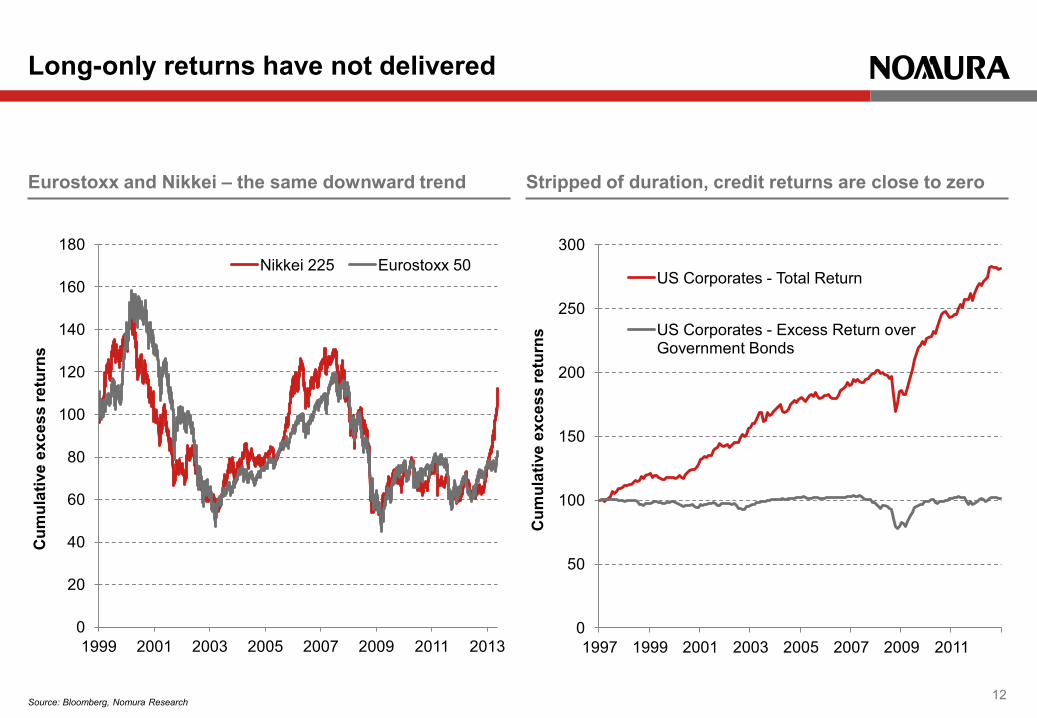
Long-only returns have not delivered
Source: Bloomberg, Nomura Research
Eurostoxx and Nikkei – the same downward trend Stripped of duration, credit returns are close to zero
12
0
20
40
60
80
100
120
140
160
180
1999 2001 2003 2005 2007 2009 2011 2013
Cum
ulat
ive
exce
ss re
turn
s
Nikkei 225 Eurostoxx 50
0
50
100
150
200
250
300
1997 1999 2001 2003 2005 2007 2009 2011
Cum
ulat
ive
exce
ss re
turn
s
US Corporates - Total Return
US Corporates - Excess Return over Government Bonds

Long-only returns can depend on where you start
Source: Nomura Research, Bloomberg.
The rates super cycle – past performance is not indicative of future returns
0%
5%
10%
15%
20%
0
50
100
150
200
250
1955 1960 1965 1970 1975 1980 1985 1990 1995 2000 2005 2010
Excess returns (LHS) US 10Y Yield (RHS)
13
Long-only bond indices start here

Performance of style portfolios: 1974–2012
All styles are unconditionally strong in fixed income
Source: Nomura Research. Note: All performance numbers are for volatility-adjusted investment strategies and are before transactions costs. 1. Hit ratio is defined as the proportion of months with strictly positive excess returns. 2. Vol selling results from June 1994
Price
momentum Macro
momentum Carry Value Vol Selling2
1974–2012
Average excess returns (p.a., %) 10.14 6.36 8.72 4.31 8.43
Annualised information ratio 1.39 0.89 1.18 0.61 1.31
Skew 0.29 0.59 0.29 -0.02 -0.90
Hit ratio1 65% 62% 66% 57% 66%
1990–2012
Average excess returns (p.a., %) 9.11 7.83 9.65 6.17 8.43
Annualised information ratio 1.25 1.06 1.31 0.84 1.31
Skew 0.54 1.00 -0.20 0.05 -0.90
Hit ratio1 62% 63% 68% 60% 66%
14

Annualised information ratios of style portfolios
Performance is relatively stable across different regimes
Source: Nomura Research, NBER. We define early and late periods of expansions as their first and second calendar halves. Note: The information ratio is defined as the ratio of average annual excess returns (over cash, except in the case of credit where excess returns are computed over duration matched government securities) to its
annualised volatility.
1974–2012 Price
momentum Macro
momentum Carry Value Volatility Selling
Full sample unconditional 1.39 0.89 1.18 0.61 1.31
Expansion periods 1.51 0.92 1.15 0.57 1.36
Early expansions 1.39 0.77 1.34 0.71 1.72
Late expansions 1.65 1.10 0.93 0.39 0.94
Recession periods 0.95 0.95 1.30 0.85 1.33
Early recessions 0.86 0.97 1.22 1.50 0.22
Late recessions 1.03 0.92 1.50 0.27 3.42
15

Style portfolios in periods of high vs. low risk aversion regimes
Styles are complementary
Source: Nomura Research, Bloomberg. Note: We divide the history into three equally sized buckets based on the quarterly changes in the VXO Index. A proxy for the VXO using realized equity volatility used before 1986. We then present the average
same-quarter excess returns and information ratios of the investment strategies based on the four styles in the top and bottom buckets.
1974–2011 Price
momentum Macro
momentum Carry Value Vol
Selling
Average quarterly excess return (bp) 67 29 85 46 62
Annualised information ratio 1.15 0.57 1.51 0.85 1.35
Average quarterly excess return (bp) 109 108 59 34 26
Annualised information ratio 1.45 1.37 0.84 0.51 0.62
Falling risk
aversion
Rising risk
aversion
16
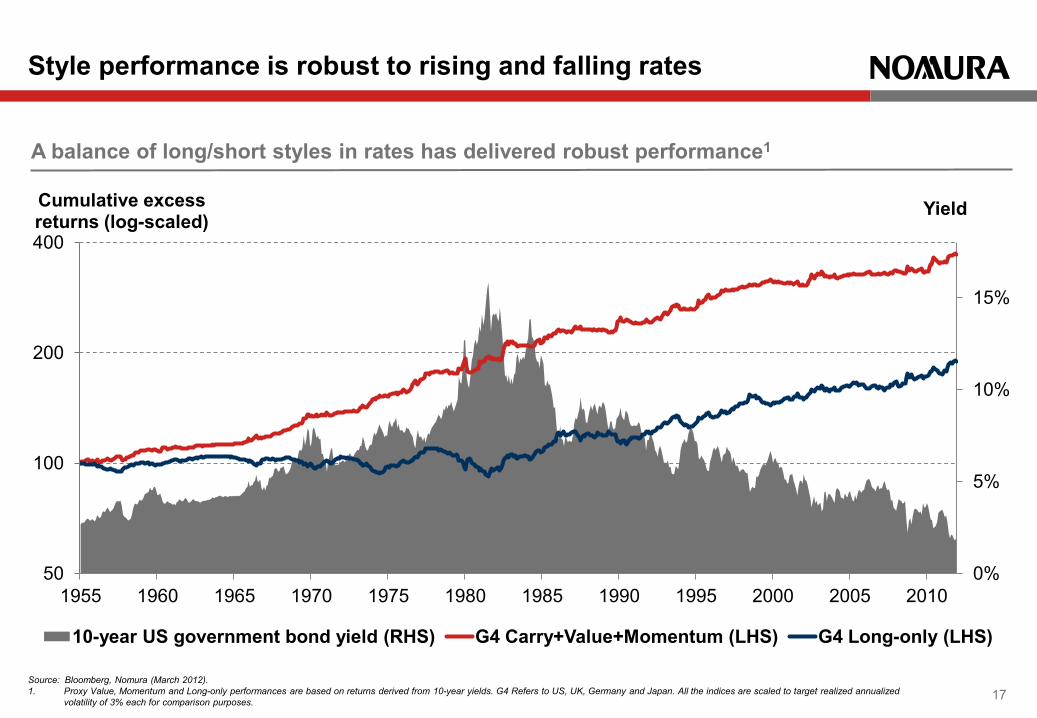
A balance of long/short styles in rates has delivered robust performance1
Style performance is robust to rising and falling rates
Source: Bloomberg, Nomura (March 2012). 1. Proxy Value, Momentum and Long-only performances are based on returns derived from 10-year yields. G4 Refers to US, UK, Germany and Japan. All the indices are scaled to target realized annualized
volatility of 3% each for comparison purposes.
0%
5%
10%
15%
50
100
200
400
1955 1960 1965 1970 1975 1980 1985 1990 1995 2000 2005 2010
Yield Cumulative excess returns (log-scaled)
10-year US government bond yield (RHS) G4 Carry+Value+Momentum (LHS) G4 Long-only (LHS)
17

Why bother with investment styles?
# 2 Diversification

During crashes risk-assets tend to move together
Asset classes become highly correlated during times of crises
Sources: Bloomberg, Nomura Research. Risk-off periods have been defined as times of sustained market stress where global equities underperformed by 15% or more over a six-month period.
50
100
200
400
800
1600
1974 1979 1984 1989 1994 1999 2004 2009
Cum
ulat
ive
exce
ss re
turn
s (lo
g-sc
aled
)
Risk-off FX G10 Carry Rates FX EM Carry Credit Commodities Equities
19

Bear market overlap and correlations of different fixed income asset classes with MSCI World
Bear market overlap can show what correlations often hide
Bear-market overlap is defined as MSCI World and the fixed income asset class experiencing a 15% draw down from the most recent peak during the same month after volatility scaling each asset class to 15% annual volatility. Source: Bloomberg. Nomura research
20
0%
10%
20%
30%
40%
50%
60%
70%
Commodities Credit FX G10 Carry Rates
Bear Market Overlap (-15%) Correlation
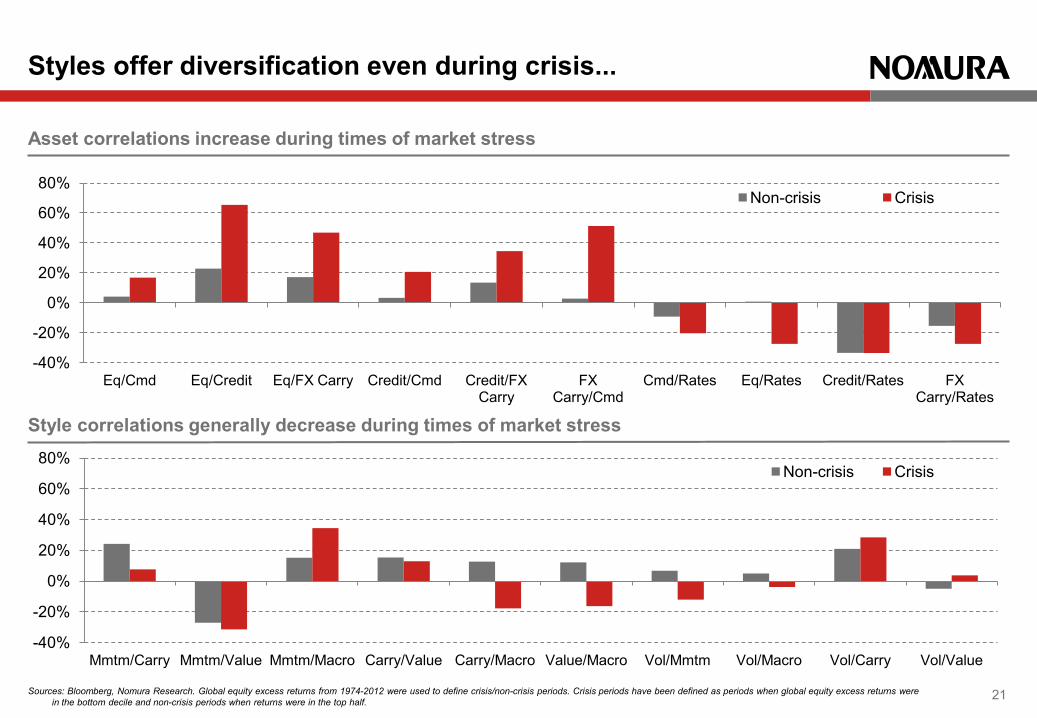
Styles offer diversification even during crisis...
Sources: Bloomberg, Nomura Research. Global equity excess returns from 1974-2012 were used to define crisis/non-crisis periods. Crisis periods have been defined as periods when global equity excess returns were in the bottom decile and non-crisis periods when returns were in the top half.
Asset correlations increase during times of market stress
Style correlations generally decrease during times of market stress
-40%
-20%
0%
20%
40%
60%
80%
Eq/Cmd Eq/Credit Eq/FX Carry Credit/Cmd Credit/FX Carry
FX Carry/Cmd
Cmd/Rates Eq/Rates Credit/Rates FX Carry/Rates
Non-crisis Crisis
-40%
-20%
0%
20%
40%
60%
80%
Mmtm/Carry Mmtm/Value Mmtm/Macro Carry/Value Carry/Macro Value/Macro Vol/Mmtm Vol/Macro Vol/Carry Vol/Value
Non-crisis Crisis
21

... resulting in more stable performance over time
Sources: Bloomberg, Nomura Research. Global equity excess returns from 1974-2012 were used to define crisis/non-crisis periods. Crisis periods have been defined as periods when global equity excess returns were in the bottom decile and non-crisis periods when returns were in the top half.
Asset classes sell-off together in times of crises
Styles performance remains robust across regimes
-4
-3
-2
-1
0
1
2
3
Commodities G10 FX EM FX Credit Equities Rates
Shar
pe ra
tio
Non-crisis periods Crisis periods
-4
-3
-2
-1
0
1
2
3
Momentum Carry Value Macro Vol
Shar
pe ra
tio
Non-Crisis periods Crisis periods
22

Why bother with investment styles?
# 3 Coherence – how styles are substance
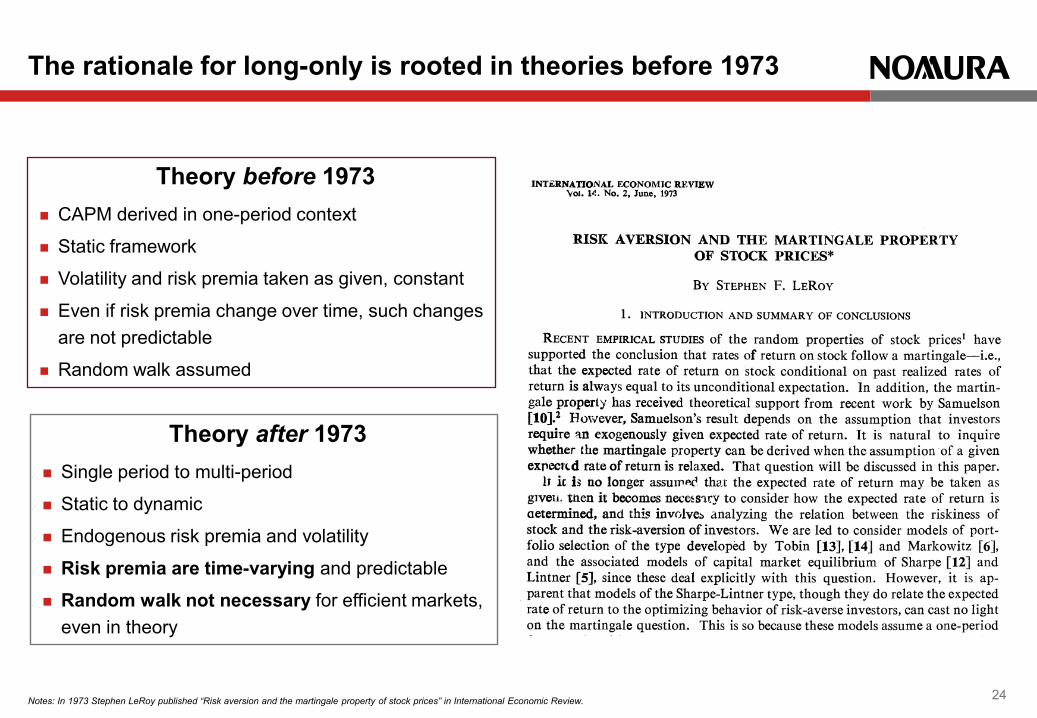
Notes: In 1973 Stephen LeRoy published “Risk aversion and the martingale property of stock prices” in International Economic Review.
The rationale for long-only is rooted in theories before 1973
Theory before 1973 CAPM derived in one-period context
Static framework
Volatility and risk premia taken as given, constant
Even if risk premia change over time, such changes are not predictable
Random walk assumed
Theory after 1973 Single period to multi-period
Static to dynamic
Endogenous risk premia and volatility
Risk premia are time-varying and predictable
Random walk not necessary for efficient markets, even in theory
24

Momentum can be explained by rational and behavioural reasons
Source: Nomura International, Bloomberg, Moody’s Investor Services.
Success of momentum can be linked to the existence of time-varying risk premia. This in turn is driven by the trends in economic cycle.
Macro-momentum captures this directly by trend-following in economic data; price momentum captures this indirectly
On the behavioural side, momentum has also been linked to investor behavior like under-reaction to new information
Drivers of price and macro momentum Inflation
Unemployment Copper inventories
0%
2%
4%
6%
8%
10%
12%
1948 1958 1968 1978 1988 1998 2008
US Unemployment rate
0.0
0.2
0.4
0.6
0.8
1.0
1970 1980 1990 2000 2010
Tons (m)
-5%
0%
5%
10%
15%
20%
1950 1960 1970 1980 1990 2000 201
US CPI y-o-y
25

Carry is linked to fundamentals in each asset class
1. Source: Nomura Research, Bloomberg. Note: We divide the history between 1983 and 2010into three equally sized buckets based on the y-o-y growth in inventories every month. We then present the average past 12 month excess returns and the
average annualised carry in the top and bottom buckets. Sample period for Natural Gas: 1990–2010. Positive carry indicates backwardation.
Carry in interest rate markets are closely linked with the economic cycle
Supply risk factors drive carry in commodities
-4%
-2%
0%
2%
4%
1953 1958 1963 1968 1973 1978 1983 1988 1993 1998 2003 2008
Slope of the US 10y–1y curve (recessions shaded)
Average annualised carry (%) WTI Crude Natural Gas Wheat Corn Copper
Rising inventories -3.4 -18.3 -11.0 -10.5 1.0
Falling inventories 9.6 0.8 2.3 -6.4 10.3
26

Value: identifying assets that are cheap relative to fair-value
Source: Nomura Research, Bloomberg.
Real yields (nominal yields adjusted for inflation) exhibit mean-reversion
Mean reversion is observed in FX markets too
-2%
0%
2%
4%
6%
1990 1992 1994 1996 1998 2000 2002 2004 2006 2008 2010 2012
Range (+/-1 stdev) US 10-year real yield Average (5-year)
0.40
0.75
1.10
1.45
1.80
1975 1980 1985 1990 1995 2000 2005 2010
EUR/USD Spot EUR/USD PPP adjusted
27

Selling volatility to earn risk premium
Source: Nomura Research.
Volatility selling is a pro-cyclical strategy like unconditional FX carry and long equities
0
50
100
150
200
250
300
2001 2002 2003 2004 2005 2006 2007 2008 2009 2010 2011 2012
Cum
ulat
ive
exce
ss re
turn
s
Volatility Selling FX Carry (unfiltered) S&P 500
28

Applying fixed-income tools to equity markets
The similarities between equity indexes and soybeans

Poor long-only returns in grains do not surprise many
Long-only returns are more similar than most people expect (1/3)
Source: Bloomberg, Nomura Research
1
10
100
1000
1969 1974 1979 1984 1989 1994 1999 2004 2009
Cum
ulat
ive
exce
ss re
turn
s
Corn Wheat Soybeans
31

Long-only returns are more similar than most people expect (2/3)
Source: Bloomberg, Nomura Research
Long-only performance of equities has been equally bad in many cases
32
Nikkei : equities can underperform cash over decades Eurostoxx are looking more and more like Nikkei
0
20
40
60
80
100
120
140
1988 1991 1994 1997 2000 2003 2006 2009 2012
Cum
ulat
ive
exce
ss re
turn
s
0
20
40
60
80
100
120
140
160
180
1998 2000 2002 2004 2006 2008 2010 2012
Cum
ulat
ive
exce
ss re
turn
s
EURO STOXX 50
Nikkei 225
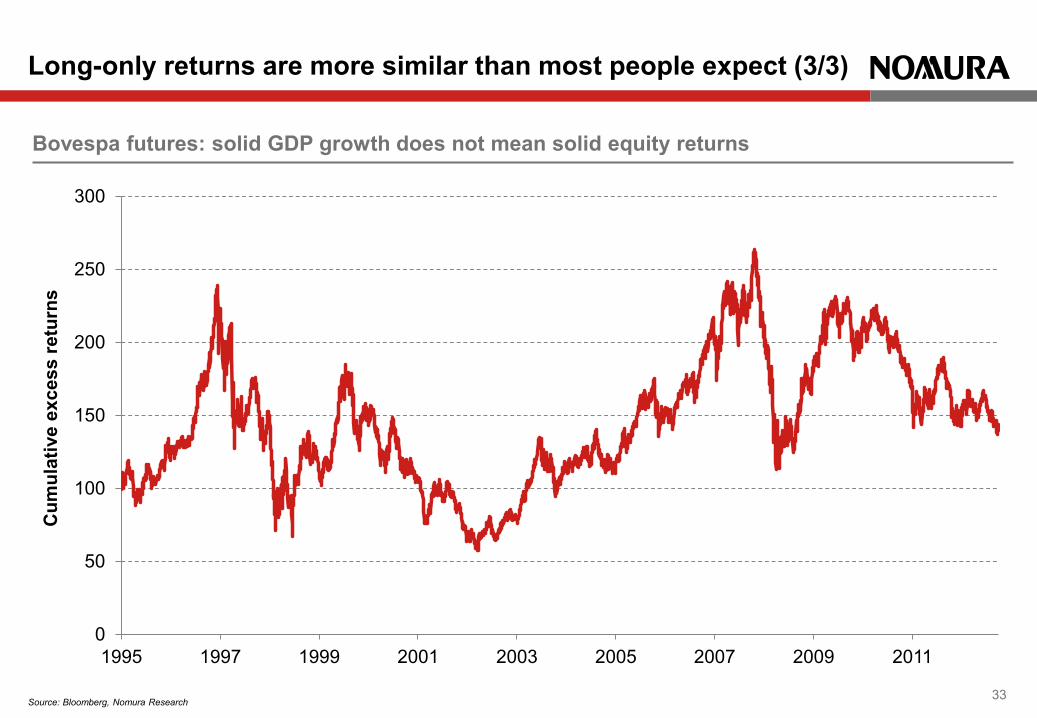
Bovespa futures: solid GDP growth does not mean solid equity returns
Long-only returns are more similar than most people expect (3/3)
Source: Bloomberg, Nomura Research 33
0
50
100
150
200
250
300
1995 1997 1999 2001 2003 2005 2007 2009 2011
Cum
ulat
ive
exce
ss re
turn
s
Performance of fixed-income styles in equity markets

Applying long-short styles can add value in both asset classes
Source: Bloomberg, Nomura Research. Excess returns have been scaled to a volatility of 10% for easy comparison.
35
Styles outperform long-only in grains ... ... and in equities
50
100
200
400
800
1990 1995 2000 2005 2010
Cum
ulat
ive
exce
ss re
turn
s (lo
g-sc
ale)
Styles portfolio
Long-only equities portfolio
50
100
200
400
1969 1974 1979 1984 1989 1994 1999 2004 2009
Cum
ulat
ive
exce
ss re
turn
s (lo
g-sc
ale)
Styles portfolio
Long-only grains portfolio
36 Source: Bloomberg, Nomura Research
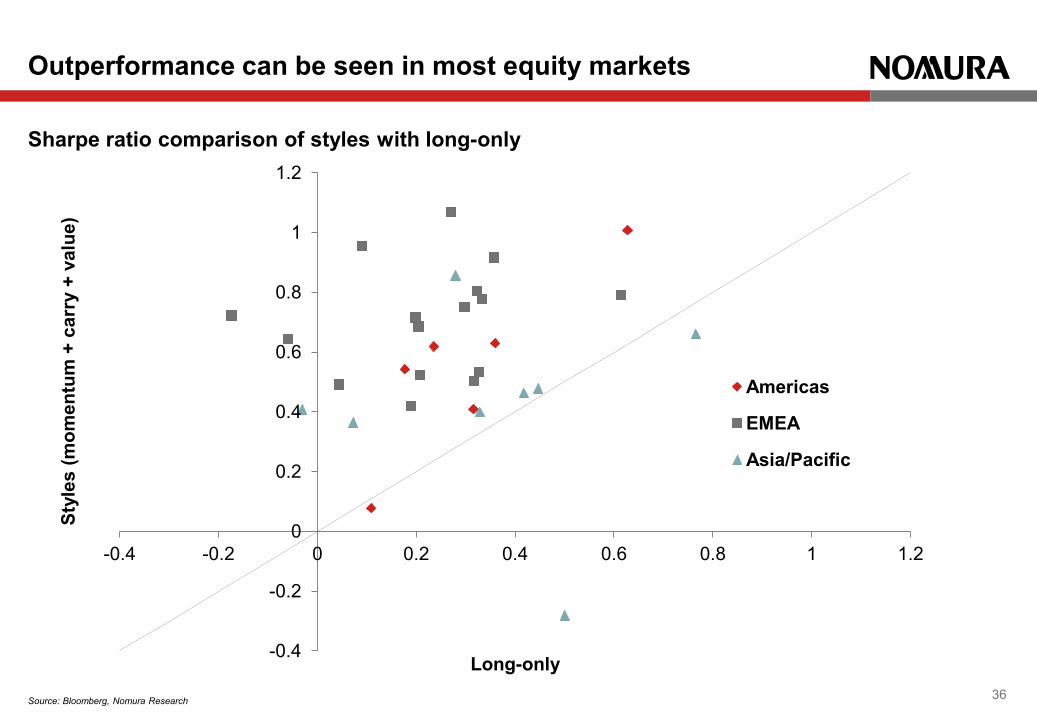
Sharpe ratio comparison of styles with long-only
Outperformance can be seen in most equity markets
-0.4
-0.2
0
0.2
0.4
0.6
0.8
1
1.2
-0.4 -0.2 0 0.2 0.4 0.6 0.8 1 1.2
Styl
es (m
omen
tum
+ c
arry
+ v
alue
)
Long-only
Americas
EMEA
Asia/Pacific

Revisiting our earlier examples
Source: Bloomberg, Nomura Research
37
Nikkei 225 Eurostoxx 50
0
20
40
60
80
100
120
140
160
180
1990 1995 2000 2005 2010
Cum
ulat
ive
exce
ss re
turn
s
Styles Long-only
0
20
40
60
80
100
120
140
160
180
1999 2001 2003 2005 2007 2009 2011 2013
Cum
ulat
ive
exce
ss re
turn
s
Styles Long-only
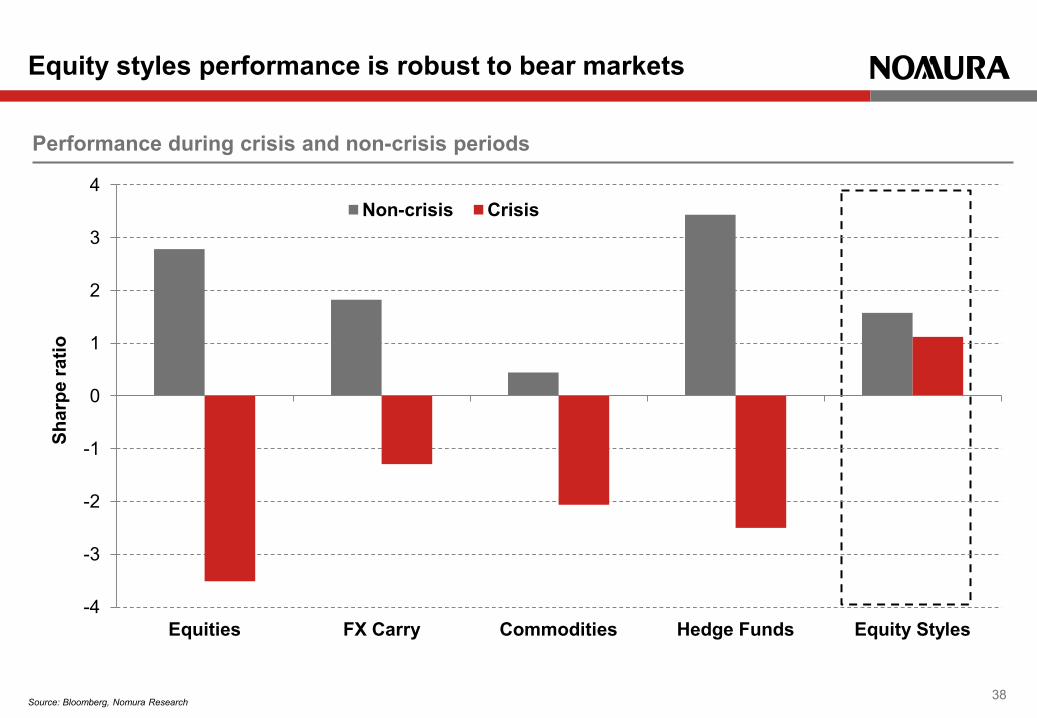
Performance during crisis and non-crisis periods
Equity styles performance is robust to bear markets
Source: Bloomberg, Nomura Research 38
-4
-3
-2
-1
0
1
2
3
4
Equities FX Carry Commodities Hedge Funds Equity Styles
Shar
pe ra
tio
Non-crisis Crisis

Our current asset allocation (1/2)
Source: Bloomberg, Nomura Research
Equities
39
-10 0 10
Hong Kong India
China Russia Mexico
Brazil Poland
Belgium Greece
Switzerland France
Netherlands Sweden
Italy Spain
Germany South Korea
Taiwan TOPIX
Australia Canada
DJ Industrial NASDAQ 100
EURO STOXX 50 FTSE 100 Nikkei 225
S&P 500
-10 0 10 -10 0 10 -10 0 10
Hong Kong India China Russia Mexico Brazil Poland Belgium Greece Switzerland France Netherlands Sweden Italy Spain Germany South Korea Taiwan TOPIX Australia Canada DJ Industrial NASDAQ 100 EURO STOXX 50 FTSE 100 Nikkei 225 S&P 500
Aggregate Momentum Carry Value

Our current asset allocation (2/2)
Source: Bloomberg, Nomura Research
Fixed-income
40
-10 0 10
Copper
Gold
Brent
WTI
Natural Gas
EUR/USD
GBP/USD
EUR/JPY
AUD/USD
USD/JPY
iTraxx AeJ
CDX Main
CDX HY
iTraxx XO
iTraxx Main
JGB
US Tsy
Bunds
Gilts
-10 0 10 -10 0 10 -10 0 10
Copper Gold Brent WTI Natural Gas EUR/USD GBP/USD EUR/JPY AUD/USD USD/JPY iTraxx AeJ CDX Main CDX HY iTraxx XO iTraxx Main JGB US Tsy Bunds Gilts
Aggregate Momentum Carry Value

Using economic momentum to switch between equities and bonds
41
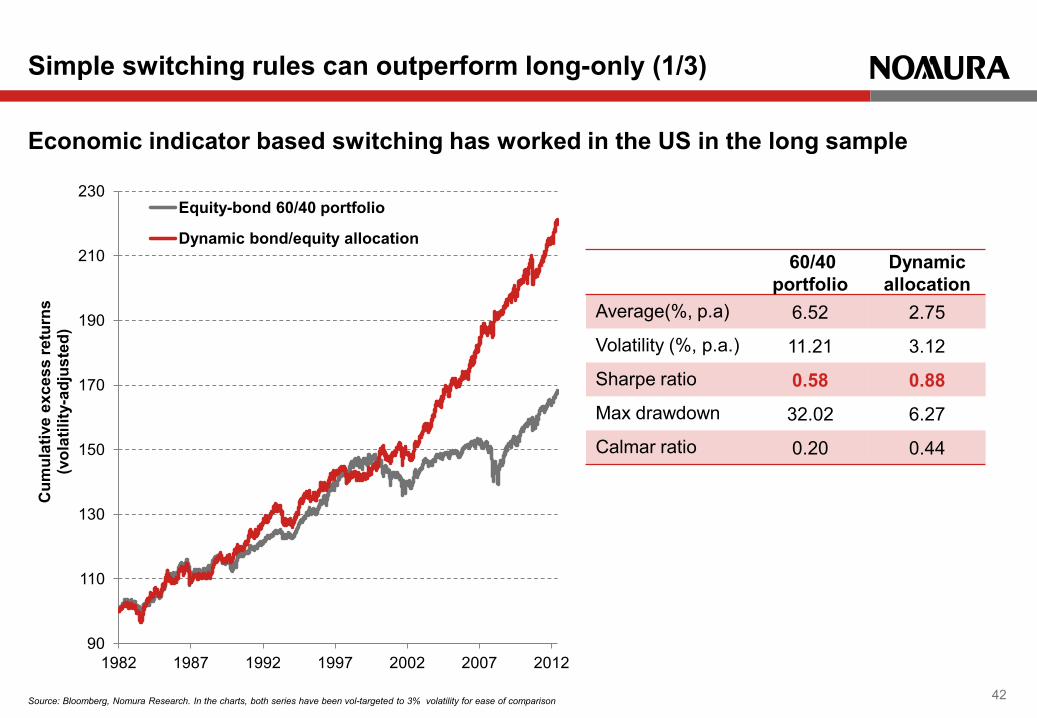
Source: Bloomberg, Nomura Research. In the charts, both series have been vol-targeted to 3% volatility for ease of comparison
Economic indicator based switching has worked in the US in the long sample
Simple switching rules can outperform long-only (1/3)
42
90
110
130
150
170
190
210
230
1982 1987 1992 1997 2002 2007 2012
Cum
ulat
ive
exce
ss re
turn
s (v
olat
ility
-adj
uste
d)
Equity-bond 60/40 portfolio
Dynamic bond/equity allocation 60/40
portfolio Dynamic allocation
Average(%, p.a) 6.52 2.75
Volatility (%, p.a.) 11.21 3.12
Sharpe ratio 0.58 0.88
Max drawdown 32.02 6.27
Calmar ratio 0.20 0.44
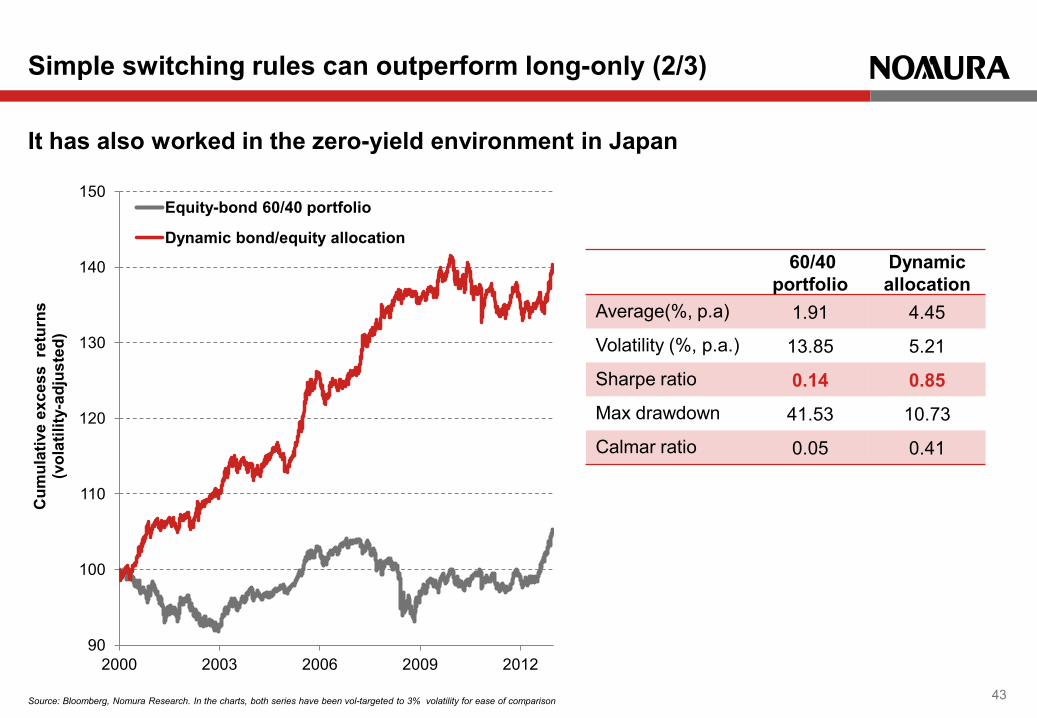
Source: Bloomberg, Nomura Research. In the charts, both series have been vol-targeted to 3% volatility for ease of comparison
It has also worked in the zero-yield environment in Japan
Simple switching rules can outperform long-only (2/3)
43
90
100
110
120
130
140
150
2000 2003 2006 2009 2012
Cum
ulat
ive
exce
ss r
etur
ns
(vol
atili
ty-a
djus
ted)
Equity-bond 60/40 portfolio
Dynamic bond/equity allocation 60/40
portfolio Dynamic allocation
Average(%, p.a) 1.91 4.45
Volatility (%, p.a.) 13.85 5.21
Sharpe ratio 0.14 0.85
Max drawdown 41.53 10.73
Calmar ratio 0.05 0.41
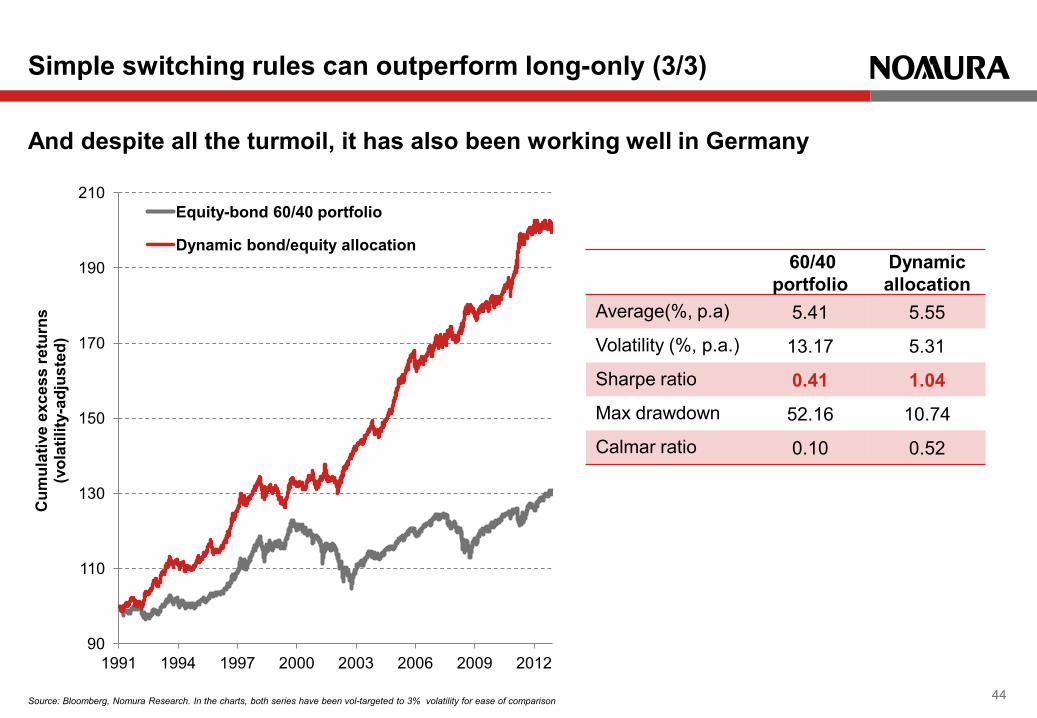
Source: Bloomberg, Nomura Research. In the charts, both series have been vol-targeted to 3% volatility for ease of comparison
And despite all the turmoil, it has also been working well in Germany
Simple switching rules can outperform long-only (3/3)
44
90
110
130
150
170
190
210
1991 1994 1997 2000 2003 2006 2009 2012
Cum
ulat
ive
exce
ss re
turn
s
(vol
atili
ty-a
djus
ted)
Equity-bond 60/40 portfolio
Dynamic bond/equity allocation 60/40
portfolio Dynamic allocation
Average(%, p.a) 5.41 5.55
Volatility (%, p.a.) 13.17 5.31
Sharpe ratio 0.41 1.04
Max drawdown 52.16 10.74
Calmar ratio 0.10 0.52

Appendix Asset-wise performance

Source: Bloomberg, Nomura
Equities
long only vol-scaled momentum carry value MC CV MV MCV DJ Industrial since Oct, 99 0.18 0.31 0.25 0.42 0.53 0.46 0.56 0.43 0.54 S&P 500 since Dec, 89 0.32 0.41 0.36 0.15 0.38 0.36 0.28 0.45 0.41 NASDAQ 100 since Apr, 98 0.24 0.39 0.40 0.58 0.26 0.66 0.55 0.43 0.62 Canada since Nov, 01 0.36 0.48 0.37 0.35 0.50 0.50 0.58 0.51 0.63 Mexico since May, 01 0.63 0.68 0.74 0.70 0.57 0.87 0.93 0.87 1.01 Brazil since Oct, 97 0.11 0.09 0.25 -0.04 -0.07 0.13 -0.08 0.13 0.08 EURO STOXX 50 since Jun, 00 -0.06 -0.06 0.43 0.43 0.65 0.55 0.62 0.60 0.64 FTSE 100 since Feb, 90 0.19 0.24 0.21 0.48 0.14 0.46 0.45 0.20 0.42 France since Dec, 90 0.20 0.20 0.39 0.60 0.54 0.61 0.70 0.56 0.69 Germany since Nov, 92 0.32 0.41 0.53 0.71 0.54 0.72 0.81 0.68 0.80 Spain since Jul, 94 0.32 0.32 0.44 0.11 0.43 0.39 0.36 0.51 0.50 Italy since Jun, 06 -0.17 -0.30 0.46 0.67 0.35 0.70 0.71 0.52 0.72 Netherlands since Jan, 91 0.30 0.31 0.56 0.56 0.41 0.75 0.61 0.63 0.75 Sweden since Feb, 07 0.21 0.20 0.49 0.24 0.27 0.51 0.31 0.54 0.52 Switzerland since Sep, 00 0.09 0.18 0.70 0.76 0.76 0.91 0.85 0.89 0.95 Austria since Jul, 95 0.33 0.47 0.59 0.12 0.90 0.50 0.62 0.86 0.78 Belgium since Nov, 95 0.27 0.45 0.82 0.89 0.68 1.04 0.95 0.95 1.07 Portugal since Apr, 00 -0.14 -0.05 0.87 0.86 1.01 1.01 1.16 1.16 1.20 Russia since Aug, 07 0.04 0.01 0.11 0.69 0.25 0.51 0.57 0.23 0.49 Poland since Jun, 02 0.33 0.35 0.40 0.60 0.32 0.57 0.53 0.41 0.53 Finland since Dec, 01 0.36 0.45 0.69 0.91 0.33 0.99 0.80 0.69 0.92 Greece since Sep, 01 0.20 0.36 0.70 0.44 0.41 0.72 0.57 0.64 0.72 S. Africa since Jul, 97 0.61 0.60 0.78 0.61 0.08 0.87 0.53 0.67 0.79 Nikkei 225 since Sep, 90 -0.03 -0.06 0.33 0.25 0.23 0.39 0.30 0.38 0.41 TOPIX since May, 92 0.07 0.10 0.40 0.06 0.26 0.31 0.18 0.45 0.36 Hong Kong since Apr, 94 0.33 0.39 0.26 0.15 0.43 0.30 0.32 0.39 0.40 China since Dec, 05 0.50 0.62 0.74 -0.70 -0.42 0.02 -0.82 0.31 -0.28 Australia since May, 02 0.28 0.48 0.78 0.63 0.48 0.84 0.70 0.81 0.86 S. Korea since Jun, 02 0.45 0.46 0.36 0.13 0.56 0.33 0.41 0.53 0.48 India since Jun, 02 0.77 0.88 0.59 0.24 0.54 0.49 0.48 0.79 0.66 Taiwan since Jun, 02 0.42 0.45 0.21 0.29 0.53 0.37 0.46 0.41 0.46
Rates Credit FX Commodities Portfolio
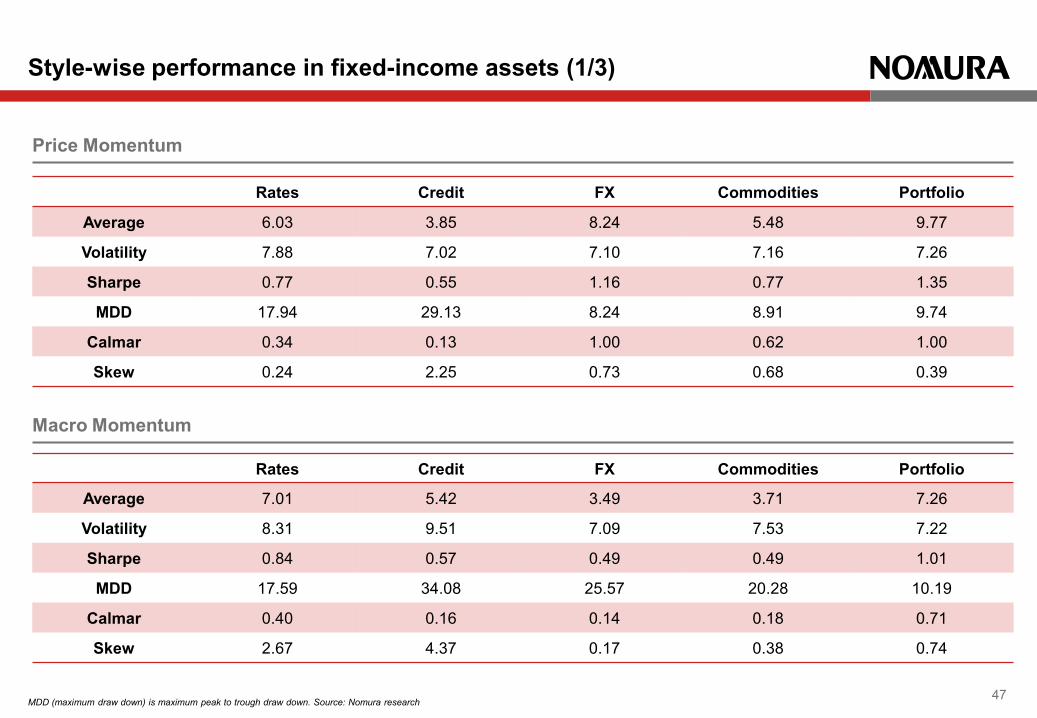
Average 6.03 3.85 8.24 5.48 9.77
Volatility 7.88 7.02 7.10 7.16 7.26
Sharpe 0.77 0.55 1.16 0.77 1.35
MDD 17.94 29.13 8.24 8.91 9.74
Calmar 0.34 0.13 1.00 0.62 1.00
Skew 0.24 2.25 0.73 0.68 0.39
Style-wise performance in fixed-income assets (1/3)
MDD (maximum draw down) is maximum peak to trough draw down. Source: Nomura research 47
Price Momentum
Macro Momentum
Rates Credit FX Commodities Portfolio
Average 7.01 5.42 3.49 3.71 7.26
Volatility 8.31 9.51 7.09 7.53 7.22
Sharpe 0.84 0.57 0.49 0.49 1.01
MDD 17.59 34.08 25.57 20.28 10.19
Calmar 0.40 0.16 0.14 0.18 0.71
Skew 2.67 4.37 0.17 0.38 0.74

Rates Credit FX Commodities Portfolio
Average 4.76 1.65 6.36 3.82 9.03
Volatility 7.55 6.22 7.12 7.00 7.40
Sharpe 0.63 0.27 0.89 0.55 1.22
MDD 35.44 23.65 22.49 24.60 13.99
Calmar 0.13 0.07 0.28 0.16 0.65
Skew -0.18 1.64 0.11 0.13 0.34
Style-wise performance in fixed-income assets (2/3)
MDD (maximum draw down) is maximum peak to trough draw down. Source: Nomura research 48
Carry
Value
Rates Credit FX Commodities Portfolio
Average 1.97 2.42 2.26 4.40 4.81
Volatility 7.52 6.66 7.05 6.96 7.11
Sharpe 0.26 0.36 0.32 0.63 0.68
MDD 26.23 37.94 22.87 24.17 21.29
Calmar 0.08 0.06 0.10 0.18 0.23
Skew -0.36 -0.86 0.12 0.00 0.06

Rates FX Portfolio
Average 8.23 9.15 6.26
Volatility 8.34 8.91 5.73
Sharpe 0.99 1.03 1.09
MDD 14.07 26.14 11.53
Calmar 0.58 0.35 0.54
Skew -0.54 -1.24 -1.06
Style-wise performance in fixed-income assets (3/3)
MDD (maximum draw down) is maximum peak to trough draw down. Source: Nomura research 49
Volatility

This presentation has been prepared by Nomura International plc ("NIplc") as a marketing communication in order to promote investment services. NIplc is authorised by the Prudential Regulation Authority and regulated by the Financial Conduct Authority and the Prudential Regulation Authority, and is a member of the London Stock Exchange. The products described in this presentation are intended only for investors who are "eligible counterparties" or "professional clients" for the purposes of applicable regulatory rules in the European Economic Area. This presentation is not intended for retail clients and should not be distributed as such. In particular, this presentation is not for distribution in or into the United States of America. This publication has been approved for distribution in Australia by Nomura Australia Ltd, which is authorised and regulated in Australia by the Australian Securities and Investment Commission (“ASIC”). This presentation is subject to the copyright of NIplc. You may not without the prior written consent of NIplc distribute, reproduce, in whole or in part, summarise, quote from or otherwise publicly refer to the contents of this presentation. This presentation is for discussion purposes and contains indicative terms only. Neither of us will be legally bound until we agree to enter into a transaction subject to material terms, which shall be set out in agreed documentation. This presentation does not constitute an offer to sell, or the solicitation of an offer to purchase, any securities. This presentation does not constitute a prospectus and you should not subscribe for any securities referred to in this presentation except on the basis of the information contained in the prospectus (or similar document), which is published in respect of such securities. All opinions and estimates included in this document constitute NIplc's judgment as of this date and are subject to change without notice. There can be no assurance, nor is there any guarantee (implied or otherwise), that any opinions contained in this document related to any forecasts will be met. The information contained herein is believed to be accurate in all respects, but no representation or warranty, expressed or implied, as to its accuracy or completeness is made by any party. Nothing contained herein should be relied upon as a promise or representation as to the future. Information contained in this presentation is not intended to provide, and should not be relied upon for, accounting, legal, or tax advice or investment recommendations. It does not constitute a personal recommendation within the meaning of applicable regulatory rules in the European Economic Area, or take into account the particular investment objectives, financial situations, or needs of individual investors. You should consult your tax, legal and accounting advisers about the issues discussed herein and you shall be responsible for evaluating the risks and merits involved in any investment described in this presentation. Information on any particular tax treatment may not be applicable to your individual circumstance and may be subject to change in the future. NIplc is not your designated investment adviser. The information contained herein is based on sources, which NIplc believes to be reliable, but NIplc makes no representation or warranty as to its accuracy completeness or correctness. You should place no reliance on the fairness, accuracy, completeness or correctness of the information, projections, analyses and opinions contained in this presentation. The information contained and any opinions expressed herein are subject to change without notification. NIplc gives no assurance or guarantee that forecasts contained in this presentation will be met. Figures presented in this document may refer to the past or simulated past performance. Past and simulated past performance is not a reliable indicator of future performance. Where information contains an indication of future performance, such forecasts are not a reliable indicator of future performance. If the transaction described includes leverage, embedded options forwards or futures, the exchange of currencies, or other structural elements, the value of the transaction, and your exposure, could change more quickly, more frequently or by a greater magnitude (or all three) relative to other derivative transactions or cash market instruments. Generally, all over-the-counter ("OTC") derivative transactions involve the risk of adverse or unanticipated market developments, risk of counterparty default, risk of illiquidity and other risks and may involve the risk of loss due to default or potential default by the issuer of obligations or securities. In certain transactions, counterparties may lose their entire stake or incur an unlimited loss. Foreign currency-denominated securities are subject to fluctuations in exchange rates that could have an adverse effect on the value or price of or income derived from the investment. In addition, investors in securities such as ADRs, the value of which are influenced by foreign currencies, effectively assume currency risk.
The securities described herein may not have been registered under the U.S. Securities Act 1933 and in such a case, may not be offered or sold in the United States or to U.S.
persons unless they have been registered under such Act, or except in compliance with an exemption from the registration requirements of such Act.
Disclaimer