the study on water quality management …open_jicareport.jica.go.jp/pdf/11798006.pdftable 2.12...
TRANSCRIPT

JAPAN INTERNATIONAL COOPERATION AGENCY (JICA) NATIONAL RIVER CONSERVATION DIRECTORATE (NRCD) MINISTRY OF ENVIRONMENT AND FORESTS
THE STUDY ON
WATER QUALITY MANAGEMENT PLAN FOR
GANGA RIVER IN
THE REPUBLIC OF INDIA
FINAL REPORT VOLUME IV FEASIBILITY STUDY FOR PROJECT CITIES VOLUME IV-4 FEASIBILITY STUDY FOR VARANASI CITY
PART I SEWERAGE SCHEME
JULY 2005
TOKYO ENGINEERING CONSULTANTS CO., LTD. CTI ENGINEERING INTERNATIONAL CO., LTD.
No.
GE JR
05-038

JAPAN INTERNATIONAL COOPERATION AGENCY (JICA) NATIONAL RIVER CONSERVATION DIRECTORATE (NRCD) MINISTRY OF ENVIRONMENT AND FORESTS
THE STUDY ON
WATER QUALITY MANAGEMENT PLAN FOR
GANGA RIVER IN
THE REPUBLIC OF INDIA
FINAL REPORT VOLUME IV FEASIBILITY STUDY FOR PROJECT CITIES VOLUME IV-4 FEASIBILITY STUDY FOR VARANASI CITY
PART I SEWERAGE SCHEME
JULY 2005
TOKYO ENGINEERING CONSULTANTS CO., LTD. CTI ENGINEERING INTERNATIONAL CO., LTD.

FINAL REPORT ON
WATER QUALITY MANAGEMENT PLAN FOR GANGA RIVER JULY 2005
GENERAL TABLE OF CONTENTS
VOLUME I SUMMARY
VOLUME II RIVER POLLUTION MANAGEMENT PLAN
VOLUME III MASTER PLAN FOR PROJECT CITIES
VOLUME III-1 SEWERAGE MASTER PLAN FOR LUCKNOW CITY
VOLUME III-2 SEWERAGE MASTER PLAN FOR KANPUR CITY
VOLUME III-3 SEWERAGE MASTER PLAN FOR ALLAHABAD CITY
VOLUME III-4 SEWERAGE MASTER PLAN FOR VARANASI CITY
VOLUME III-5 NON-SEWERAGE SCHEME
VOLUME III-6 SOCIAL CONSIDERATION AND HYGIENE EDUCATION PLAN
VOLUME III-7 RECOMMENDATIONS ON SOLID WASTE MANAGEMENT
VOLUME III-8 GIS DATA MANAGEMENT
VOLUME III-9 INSTITUTIONAL DEVELOPMENT PROGRAMME
VOLUME III-10 FINANCIAL AND ECONOMIC EVALUATION
VOLUME III-11 (SUPPORTING REPORT) CASE STUDY OF SEWAGE TREATMENT PLANTS

VOLUME IV FEASIBILITY STUDY FOR PROJECT CITIES
VOLUME IV-1 FEASIBILITY STUDY FOR LUCKNOW CITY PART I SEWERAGE SCHEME
PART II NON-SEWERAGE SCHEME PART III PUBLIC PARTICIPATION AND AWARENESS PROGRAMME PART IV INSTITUTIONAL DEVELOPMENT PROGRAMME PART V ECONOMIC AND FINANCIAL EVALUATION PART VI STAKEHOLDER MEETING PART VII DRAWINGS
VOLUME IV-2 FEASIBILITY STUDY FOR KANPUR CITY PART I SEWERAGE SCHEME
PART II NON-SEWERAGE SCHEME PART III PUBLIC PARTICIPATION AND AWARENESS PROGRAMME PART IV INSTITUTIONAL DEVELOPMENT PROGRAMME PART V ECONOMIC AND FINANCIAL EVALUATION PART VI STAKEHOLDER MEETING PART VII DRAWINGS
VOLUME IV-3 FEASIBILITY STUDY FOR ALLAHABAD CITY PART I SEWERAGE SCHEME PART II NON-SEWERAGE SCHEME PART III PUBLIC PARTICIPATION AND AWARENESS PROGRAMME PART IV INSTITUTIONAL DEVELOPMENT PROGRAMME PART V ECONOMIC AND FINANCIAL EVALUATION PART VI STAKEHOLDER MEETING PART VII DRAWINGS
VOLUME IV-4 FEASIBILITY STUDY FOR VARANASI CITY
PART I SEWERAGE SCHEME PART II NON-SEWERAGE SCHEME PART III PUBLIC PARTICIPATION AND AWARENESS PROGRAMME PART IV INSTITUTIONAL DEVELOPMENT PROGRAMME PART V ECONOMIC AND FINANCIAL EVALUATION PART VI STAKEHOLDER MEETING PART VII DRAWINGS
VOLUME V PILOT PROJECT FOR SANITARY IMPROVEMENT OF MANIKARNIKA GHAT

i
VOLUME IV-4
PART I SEWERAGE SCHEME Table of Contents List of Tables List of Figures Appendix Abbreviations Glossary of Terms
TABLE OF CONTENTS
CHAPTER 1 INTRODUCTION ................................................................................................... 1-1
1.1 BACKGROUND .................................................................................................................. 1-1 1.2 PRIORITY SEWERAGE PROJECTS FOR FEASIBILITY STUDY ................................. 1-1
1.2.1 Selection of Sewerage Priority Projects ........................................................................ 1-1 1.2.2 Sewerage Priority Projects ............................................................................................ 1-2 1.2.3 Scope of Works for Sewerage Feasibility Study ........................................................... 1-3
CHAPTER 2 PRELIMINARY DESIGN AND COST ESTIMATION FOR SEWERAGE PRIORITY PROJECT .......................................................................................... 2-1
2.1 PLANNING BASIS.............................................................................................................. 2-1 2.1.1 Design Criteria............................................................................................................... 2-1 2.1.2 Design Basis for Sewer Network................................................................................... 2-7 2.1.3 Design Basis for Sewage Treatment Plants ................................................................. 2-11 2.1.4 Design Basis of Sewage Pumping Station................................................................... 2-24
2.2 PROVISIONS FOR DISTRICT I ....................................................................................... 2-34 2.2.1 Planning Scheme ......................................................................................................... 2-34 2.2.2 Inspection, Cleaning and Rehabilitation of Old Trunk Sewer..................................... 2-35 2.2.3 Rehabilitation of Ghat Pumping Stations .................................................................... 2-50 2.2.4 Renovation / Rehabilitation of Existing Konia Pumping Station................................ 2-60 2.2.5 Renovation / Rehabilitation of Existing STP at Dinapur............................................. 2-61
2.3 PROVISIONS FOR DISTRICT II AND IV....................................................................... 2-64 2.3.1 Planning Scheme ......................................................................................................... 2-64 2.3.2 Varuna River Interceptor Sewer .................................................................................. 2-64 2.3.3 Proposed Sewage Pumping Stations (Under Sathwa Catchment) ............................... 2-70

ii
2.3.4 Sathwa Sewage Treatment Plant ................................................................................. 2-78 2.3.5 Effluent Disposal Channel and Lining of Irrigation Canal.......................................... 2-87
2.4 PROVISIONS FOR DISTRICT III .................................................................................... 2-90 2.4.1 Planning Scheme ......................................................................................................... 2-90 2.4.2 Renovation / Rehabilitation of Existing STP at Bhagwanpur ..................................... 2-90 2.4.3 Assi Nala Interceptor Sewer ........................................................................................ 2-93
CHAPTER 3 ENVIRONMENTAL IMPACT ASSESSMENT FOR SEWERAGE PRIORITY PROJECT ............................................................................................................... 3-1
3.1 INTRODUCTION ................................................................................................................ 3-1 3.1.1 Introduction ................................................................................................................... 3-1 3.1.2 Justification of the Project ............................................................................................. 3-1 3.1.3 Objective of the EIA Study ........................................................................................... 3-2 3.1.4 EIA Methodology.......................................................................................................... 3-2
3.2 POLICY, LEGAL AND ADMINISTRATIVE FRAMEWORK ......................................... 3-6 3.2.1 General .......................................................................................................................... 3-6 3.2.2 Legal Framework........................................................................................................... 3-7 3.2.3 Environmental Protection Standards ............................................................................. 3-8 3.2.4 Administrative Framework.......................................................................................... 3-12
3.3 PROJECT DESCRIPTION................................................................................................. 3-15 3.3.1 General ........................................................................................................................ 3-15 3.3.2 Existing Sewerage Facilities in Varanasi City ............................................................ 3-16 3.3.3 Sanctioned Sewerage Facilities in Varanasi ................................................................ 3-18 3.3.4 Proposed Sewerage Facilities in Varanasi City ........................................................... 3-19
3.4 BASELINE ENVIRONMENTAL SCENARIO................................................................. 3-26 3.4.1 The Study Area............................................................................................................ 3-26 3.4.2 Physical Environment.................................................................................................. 3-26 3.4.3 Socio-Cultural Environment........................................................................................ 3-46
3.5 ANALYSIS OF ALTERNATIVES (INCLUDING WITHOUT PROJECT OPTION)..... 3-54 3.5.1 Project Benefits and Positive Impacts ......................................................................... 3-54 3.5.2 With and Without Proposed Project ............................................................................ 3-54 3.5.3 Alternatives.................................................................................................................. 3-55
3.6 IMPACT IDENTIFICATION AND MITIGATION MEASURES.................................... 3-57 3.6.1 Overall Impact Identification....................................................................................... 3-57 3.6.2 Prediction of Impacts and Mitigation Measures during Construction Phase............... 3-59 3.6.3 Prediction of Impacts and Mitigation Measures during Operation Phase ................... 3-73 3.6.4 Risk Analysis and Mitigation Plan .............................................................................. 3-82
3.7 ENVIRONMENTAL MANAGEMENT PLAN................................................................. 3-83 3.7.1 Environmental Mitigation Plan ................................................................................... 3-83
iii
3.7.2 Mitigatory Measures.................................................................................................... 3-83 3.7.3 Environmental Management, Monitoring Plan, and Training..................................... 3-84
3.8 CONCLUSIONS ................................................................................................................ 3-89
CHAPTER 4 COST ESTIMATION AND IMPLEMENTATION PROGRAMME ................ 4-1
4.1 CAPITAL COST ESTIMATION OF THE PRIORITY PROJECTS................................... 4-1 4.2 IMPLEMENTATION PROGRAMME ................................................................................ 4-1 4.3 OPERATION & MAINTENANCE COST ESTIMATION................................................. 4-2
iv
LIST OF TABLES Table 2.1 Per capita Sewage Generation ............................................................................................ 2-2 Table 2.2 Sewage Zones Proposed in Master Plan............................................................................. 2-2 Table 2.3 District Wise Population Projection and Wastewater Discharged ...................................... 2-3 Table 2.4 Details of Assi SPS............................................................................................................. 2-6 Table 2.5 Existing Facilities in Konia MPS ....................................................................................... 2-6 Table 2.6 Existing STPs in Varanasi................................................................................................... 2-7 Table 2.7 Peak Factors Considered for Sewage Design ..................................................................... 2-7 Table 2.8 Guideline for Selection of Pipe Class for Sewers with B-class Bedding ......................... 2-11 Table 2.9 Raw Sewage Characteristics considered for Design Purpose........................................... 2-13 Table 2.10 Treated Wastewater Quality............................................................................................ 2-13 Table 2.11 Area Statement for Waste Stabilisation Pond System..................................................... 2-14 Table 2.12 Comparison between Conventional Centrifugal Pump vs. Submersible Pumps ............ 2-30 Table 2.13 Salient Operation and Maintenance Aspects of Conventional Centrifugal Pumps and
Submersible Centrifugal Pumps ...................................................................................... 2-32 Table 2.14 Sewer Rehabilitation Options ......................................................................................... 2-40 Table 2.15 Sewer Manhole Rehabilitation Options.......................................................................... 2-42 Table 2.16 Flow Measurement Details under Old Trunk Main........................................................ 2-43 Table 2.17 Old trunk Sewer Inventory ............................................................................................. 2-44 Table 2.18 Cost Estimate for Detailed Investigation of Old Trunk Sewer ....................................... 2-50 Table 2.19 Cost Estimate of Old Trunk Sewer Rehabilitation ......................................................... 2-50 Table 2.20 Specifications of the Existing Ghat Pumping Stations ................................................... 2-51 Table 2.21 Break up of Costs for Rehabilitation of Ghat Pumping Station...................................... 2-60 Table 2.22 Existing Facilities in Konia MPS ................................................................................... 2-61 Table 2.23 Provisions for Upgradation of Konia Pumping Station .................................................. 2-61 Table 2.24 Rehabilitation Cost of Konia SPS .................................................................................. 2-61 Table 2.25 Characteristics of Raw Wastewater Considered for Design Purpose ............................. 2-62 Table 2.26 Characteristics of Treated Wastewater Considered for Design Purpose......................... 2-62 Table 2.27 Provisions for Upgradation of Dinapur STP .................................................................. 2-63 Table 2.28 Rehabilitation Cost of Dinapur STP............................................................................... 2-64 Table 2.29 Projected Population of Sathwa STP Catchment............................................................ 2-68 Table 2.30 Design Flow of Sathwa STP Catchment......................................................................... 2-68 Table 2.31 Pipe Length Details of Varuna River Interceptor Sewer................................................. 2-69 Table 2.32 Pipe Length Details of Varuna River Secondary Sewer ................................................. 2-69 Table 2.33 Cost Estimation of Varuna River Catchment Sewers ..................................................... 2-70 Table 2.34 Design Flow of Sewage Pumping Station ...................................................................... 2-72
v
Table 2.35 Sewage Pumping Stations Detail.................................................................................... 2-73 Table 2.36 Unit Details of Sewage Pumping Stations...................................................................... 2-74 Table 2.37 Unit Details of Allied Buildings of Sewage Pumping Stations ...................................... 2-74 Table 2.38 Land Acquisition Cost for Pumping Stations ................................................................. 2-75 Table 2.39 Capital and O&M Cost of Sathwa MPS......................................................................... 2-75 Table 2.40 Capital and O&M Cost of Chaukaghat Right bank SPS ................................................ 2-76 Table 2.41 Capital and O&M Cost of Chaukaghat Left Bank SPS.................................................. 2-76 Table 2.42 Capital and O&M Cost of Narokhar Nala SPS .............................................................. 2-77 Table 2.43 Capital and O&M Cost of Phulwaria Nala SPS ............................................................. 2-77 Table 2.44 Capital and O&M Cost of Saraiya Nala SPS.................................................................. 2-78 Table 2.45 Total Cost of Pumping Stations ...................................................................................... 2-78 Table 2.46 Cost Comparison of Treatment Alternatives for Sathwa STP ........................................ 2-79 Table 2.47 Recommended Peak Factors for Design of Treatment Plants......................................... 2-83 Table 2.48 Raw Sewage Characteristics........................................................................................... 2-83 Table 2.49 Desired Treated Wastewater Quality .............................................................................. 2-84 Table 2.50 Design Basis of STP....................................................................................................... 2-84 Table 2.51 Unit Sizing...................................................................................................................... 2-86 Table 2.52 Capital Cost of Sathwa STP ........................................................................................... 2-86 Table 2.53 Capital Cost of Effluent Disposal Channel and Irrigation Canal.................................... 2-87 Table 2.54 Characteristics of Raw Wastewater Design Purpose for 8 mld STP............................... 2-91 Table 2.55 Characteristics of Treated Wastewater Design Purpose for 8 mld STP.......................... 2-91 Table 2.56 Rehabilitation of Bhagwanpur STP................................................................................ 2-91 Table 2.57 Provisions for Upgradation of Bhagwanpur Sewage Treatment Plant ........................... 2-92 Table 2.58 Projected Population for Assi Nala Catchment .............................................................. 2-93 Table 2.59 Design Flow for Assi Nala Catchment ........................................................................... 2-94 Table 2.60 Pipe Length Details of Assi Nala Interceptor Sewer ...................................................... 2-94 Table 2.61 Pipe Length Details of Nakha Nala and Samne Ghat Interceptor Sewer ....................... 2-94 Table 2.62 Pipe Length Details of Assi nala Secondary Sewer........................................................ 2-94 Table 2.63 Cost Estimation of Assi Nala Catchment Sewer............................................................. 2-95 Table 3.1 Detail of Sampling Locations, Study Items, and the Parameters........................................ 3-5 Table 3.2 Key Indicators of Inland Surface Water Quality under the Revised Criteria Proposed by
CPCB............................................................................................................................... 3-10 Table 3.3 Discharge Standards ......................................................................................................... 3-11 Table 3.4 Treated Water Quality for Irrigation ................................................................................. 3-11 Table 3.5 Recommended Microbiological Quality Guidelines for Wastewater Use in Agriculture. 3-12 Table 3.6 Average Inflow and Effluent Characteristics of Dinapur STP.......................................... 3-17 Table 3.7 Av. Inflow & Effluent Characteristics of Bhagwanpur STP for Year 1999-2000............. 3-17 Table 3.8 Preliminary Process Calculations for Ramna STP ........................................................... 3-19 Table 3.9 Month-wise Rainfall in Varanasi District ......................................................................... 3-27
vi
Table 3.10 Month-wise Surface Rainfall of Varanasi (Bhuj) (Station Index 42483)........................ 3-27 Table 3.11 Monthly Maximum and Minimum Temperature Observed During the Year 1991 in
Varanasi District .............................................................................................................. 3-27 Table 3.12 Surface Water Quality Monitoring Stations.................................................................... 3-29 Table 3.13 The Salient Water Quality Features of the Ganga River................................................. 3-30 Table 3.14 Surface Water Quality Statistics of Ganga River............................................................ 3-31 Table 3.15 Results of On-site Surface Water Quality Monitoring of Ganga .................................... 3-32 Table 3.16 The Salient Water Quality Features of the Varuna River................................................ 3-36 Table 3.17 Surface Water Quality Statistics of Varuna River ........................................................... 3-37 Table 3.18 Results of On-site Surface Water Quality Monitoring of Varuna River and Assi Nala
During March 04 ............................................................................................................. 3-38 Table 3.19 Ground Water Qualities at Proposed Sathwa STP Site & its Adjoining Area................. 3-39 Table 3.20 Ground Water Quality at Sanctioned Ramna STP Site and its Adjoining Area.............. 3-41 Table 3.21 List of Wastewater Samples............................................................................................ 3-42 Table 3.22 Wastewater Sampling Results of Dinapur and Bhagwanpur STP .................................. 3-43 Table 3.23 Quality of Sludge from Dinapur and Bhagwanpur Sewage Treatment Plants................ 3-45 Table 3.24 Details of Soil Quality Monitoring Stations ................................................................... 3-45 Table 3.25 Physico-Chemical Characteristics of Soil in the Study Corridor.................................... 3-46 Table 3.26 Land Use Characteristics (in hectares) in Villages around Sathwa STP Site ................. 3-47 Table 3.27 Breakup (%) of Irrigated Land in Villages around Sathwa STP Site.............................. 3-47 Table 3.28 Summary of Socio-economic Features of Varanasi ........................................................ 3-48 Table 3.29 Village Wise Socio-economic Details around Sathwa STP Site..................................... 3-49 Table 3.30 Summary of Socio-economic Features around Sathwa STP Site ................................... 3-50 Table 3.31 Village Wise Amenities (No.) Available around Sathwa STP Site ................................. 3-51 Table 3.32 Summary of Amenities & Infrastructural Facilities around Sathwa STP Site ................ 3-51 Table 3.33 List of Ghat along the Ganga River in Varanasi ............................................................. 3-53 Table 3.34 Average per Capita Water Production: Varanasi City ..................................................... 3-53 Table 3.35 Comparison of With and Without Project....................................................................... 3-55 Table 3.36 Comparison of Treatment Technologies ......................................................................... 3-56 Table 3.37 Scope Matrix for Project Components ........................................................................... 3-59 Table 3.38 International Standards for Noise of Construction Equipment....................................... 3-60 Table 3.39 Comparison of the Impact for Two Proposed Layouts ................................................... 3-72 Table 3.40 Depth of the Ground Water Table ................................................................................... 3-76 Table 3.41 Canal Design Capacity and STP Effluent Flow.............................................................. 3-78 Table 3.42 Cultivated Area Increase With Project............................................................................ 3-78 Table 3.43 Discharge Standards ....................................................................................................... 3-79 Table 3.44 Treated Water Quality for Irrigation ............................................................................... 3-80 Table 3.45 Preliminary Post Project Environmental Monitoring Programme.................................. 3-87 Table 4.1 Summary of Estimated Sewerage Priority Project Cost ..................................................... 4-4

vii
Table 4.2 Implementation Schedule of Sewerage Priority Project (Varanasi).................................... 4-5 Table 4.3 Operation and Maintenance Cost Estimation ..................................................................... 4-6
viii
LIST OF FIGURES Figure 2.1 Sewerage District Boundary and Existing Facility ........................................................... 2-4 Figure 2.2 Schematic Flow Diagram of Waste Stabilisation Pond System ...................................... 2-20 Figure 2.3 Schematic Flow diagram of Activated Sludge Process................................................... 2-21 Figure 2.4 Schematic Flow diagram of UASB Process + Facultative Aerated Lagoon................... 2-22 Figure 2.5 Schematic Flow diagram of Facultative Aerated Lagoon + Maturation Ponds .............. 2-23 Figure 2.6 Pumping Station Design Procedure ................................................................................ 2-24 Figure 2.7 Pump Classification ........................................................................................................ 2-28 Figure 2.8 Schematic of Conventional Centrifugal Pump................................................................ 2-29 Figure 2.9 Schematic of Submersible Centrifugal pump ................................................................. 2-29 Figure 2.10 Interrelation of Each Phase and Individual Step ........................................................... 2-39 Figure 2.11 Average Monthly Discharge from Harishchandra Ghat SPS ........................................ 2-52 Figure 2.12 Average Monthly Discharge from Mansarovar Ghat SPS ............................................ 2-52 Figure 2.13 Average Monthly Discharge from Dr R P Ghat SPS .................................................... 2-53 Figure 2.14 Average Monthly Discharge from Jalesan Ghat SPS.................................................... 2-53 Figure 2.15 Average Monthly Discharge from Trilochan Ghat SPS ................................................ 2-54 Figure 2.16 Application of Variable Frequency Drives in Wastewater Pumping Station................. 2-57 Figure 2.17 Sathwa STP Catchment Details .................................................................................... 2-67 Figure 2.18 Layout Plan of Sathwa Sewage Treatment Plant .......................................................... 2-87 Figure 2.19 Cross Section of Existing Irrigation Canal at Udapuir Culvert on Azamgarh Road..... 2-88 Figure 2.20 Treated Water Disposal Channel and Existing Irrigation Canal ................................... 2-89 Figure 3.1 Schematic Diagram for Approach and Methodology of EIA............................................ 3-4 Figure 3.2 Environmental Protection Set Up in India ...................................................................... 3-13 Figure 3.3 The Location Map of Proposed Sathwa STP Site ........................................................... 3-25 Figure 3.4 Locations of Water Quality Monitoring Stations ............................................................ 3-29 Figure 3.5 Variation in pH & TSS at Various Monitoring Points of Ganga River in Varanasi......... 3-34 Figure 3.6 Variation in DO & BOD at Various Monitoring Points of Ganga River in Varanasi ...... 3-35 Figure 3.7 Proposed Layout of Sathwa Sewage Treatment Plant..................................................... 3-72 Figure 3.8 Recommended Layout of Sathwa Sewage Treatment Plant ........................................... 3-73

ix
APPENDIX Appendix A Process of land acquisition
A.1 Summary of Land Acquisition Act, 1894 A.2 Comparison of Different Methods of Assessing Market Value
Appendix B.1 Tolerance Limits for Inland Surface Water (as per IS:2296) B.2 Drinking Water Quality Standards (as per IS:10500) B.3 General Standards for Discharge of Effluents B.4 Revised Criteria for Classification of Inland Water Quality Proposed by CPCB B.5 Discharge Criteria for Wastewaters Used for Irrigation B.6 Suggested Limits for Salinity in Irrigation Waters B.7 Maximum Permissible Concentration of Toxic Elements in Irrigation Waters B.8 National Ambient Air Quality Standards B.9 Ambient Air Quality Standards in respect of Noise B.10 Permissible Exposure Levels of Impulse or Impact Noise for Work Zone Area [as per Model Rules of Factories Act, 1948] B.11 Permissible Exposure in Case of Continuous Noise for Work Zone Area [as per Model Rules of Factories Act, 1948]
Appendix C Project details C.1 Dinapur STP: Design Criteria C.2 Details of Different Units of Dinapur STP C.3 Details of Pump Facility Provided To Dinapur STP C.4 Major Liquid Process Components of Dinapur STP C.5 Major Solid Handling Components of Dinapur STP C.6 Average Monthly Inflow and Effluent Characteristics of Dinapur STP C.7 Design Parameter vs. Actual Parameter of Dinapur STP C.8 Major Liquid Process Components of Bhagwanpur STP C.9 Average Monthly Inflow and Effluent Characteristics of Bhagwanpur STP C.10 Assi Main Pumping Station Detail C.11 Konia MPS and Pretreatment Works C.12 Summary of Capacity of Konia MPS C.13 Summary of Discharge to Konia MPS via Main Trunk Sewer C.14 Unit wise Details of the 5-Ghat Sewage Pumping Stations C.15 Capacity Analysis of Ghat Pumping Stations

x
Appendix D
D.1 Ward Wise Socio-economic Details of Varanasi D.2 Area, Households, Population and Density in Varanasi D.3 SC-ST Population in Varanasi D.4 Sex Ratio and Literacy Rate in Varanasi D.5 Work Participation Rate in Varanasi D.6 Male-Female Distribution (%) of Workers in Varanasi D.7 Category Wise Distribution (%) of Main Workers in Varanasi D.8 Sector Wise Distribution (%) of Main Workers in Varanasi D.9 Area, Households, Population and Density in Villages around Sathwa STP Site D.10 SC-ST Population in Villages around Sathwa STP Site D.11 Sex Ratio and Literacy Rate in Villages around Sathwa STP Site D.12 Work Participation Rate in Villages around Sathwa STP Site D.13 Male-Female Distribution (%) of Workers in Villages around Sathwa STP Site D.14 Category Wise Distribution (%) of Main Workers in Villages around Sathwa STP D.15 Sector Wise Distribution (%) of Main Workers in Villages around Sathwa STP Site D.16 Amenities and Facilities Available in Villages around Sathwa STP Site
xi
ABBREVIATIONS
AD/MM Average Day / Max Month ML Million Litres ADF Average Daily Flow mld Million Litres per Day ADWF Average Dry Weather Flow MLSS Mixed Liquor Suspended Solids
AIWSP Advanced Integrated Wastewater Stabilization Ponds M/P Master Plan
AL Aerated Lagoon MPN Most Probable Number per 100 ml AS Activated Sludge MPS Main Sewage Pumping Station ASR Aquifer Storage and Recovery System MPS Meter per Second
Avg Average MUD MoEF
Ministry of Urban Development Ministry of Environment and Forests
AWT Advanced Wastewater Treatment N/A Not Available BOD Biochemical Oxygen Demand NBC National Building Code CI Cast Iron NH3-N Ammonia-Nitrogen CMS Cubic Meter per Second NRCD National River Conservation Directorate CO2 Carbon Dioxide NSA Non Sewerage Area CPCB Central Pollution Control Board O&M Operations and Maintenance CWR Clear Water Reservoir PDWF Peak Dry Weather Flow DLW Diesel Locomotive Work PFR Project Feasibility Report DO Dissolved Oxygen PS Pumping Station DPR Detailed Project Report PSC Pre-Stressed Concrete ES Equalization/Storage RAS Return Activated Sludge FAB Fluidised Aerated Bioreactor SMF Sankat Mochan Foundation F/S Feasibility Study SPS Sewage Pumping Station FSA Future Service Area SS Suspended Solids GAP GoAP
Ganga/Gomti Action Plan Gomti Action Plan SSO Sanitary Sewer Overflow
GIS Geographical Information System STP Sewage Treatment Plant gpd Grams per day TDS Total Dissolved Solids GOI Government of India TKN Total Kjeldahl Nitrogen GOJ Government of Japan TMDL Total Maximum Daily Load GWI Ground Water Infiltration TN Total Nitrogen HDR High-Density Residential TP Total Phosphorus HP Horse Power TSS Total Suspended Solids I/I Infiltration/Inflow UASB Up flow Anaerobic Sludge Blanket ISC Indian Standard Code UFW Unaccounted for Water JICA Japan International Cooperation Agency UPJN Uttar Pradesh Jal Nigam JS Jal Sansthan UPPCB Uttar Pradesh Pollution Control Board
KVA Kilo Volt Ampere USAID United States Agency for International Development
LDR Low-Density Residential UV Ultra Violet lpcd Litres per capita per day VCP Vitrified Clay Pipe lpm Litres per minute WAS Waste Activated Sludge lps Litres per second WRF Water Reclamation Facility MC Municipal Corporation WSP Waste Stabilization Pond MDR Medium-Density Residential WTP Water Treatment Plant mg/l Milligrams per Litre YAP Yamuna Action Plan

xii
GLOSSARY OF TERMS Aerated Lagoons: Like WSPs but with mechanical aeration. Oxygen requirement mostly from aeration and hence more complicated and higher O&M costs requires less land than WSP. Activated-Sludge Process: A biological wastewater treatment process in which a mixture of wastewater and biologically enriched sludge is aerated to facilitate aerobic decomposition by microbes. Advance Wastewater Treatment: Treatment process designed to remove pollutants that are not adequately removed by conventional secondary treatment processes. Aeration: The addition of air or oxygen to water or wastewater, usually by mechanical means, to increase dissolved oxygen levels and maintain aerobic conditions. Anaerobic Digestion: Sludge stabilization process in which the organic material in biological sludge is converted to methane and carbon dioxide in an airtight reactor. Assimilative Capacity: The ability of a water body to receive wastewater and toxic materials without deleterious effects on aquatic life or the humans who consume the water. Average Daily Flow: The total flow past a physical point over a period of time divided by the number of days in that period. Biochemical Oxygen Demand (BOD): A standard measure of wastewater strength that quantifies the oxygen consumed in a stated period of time, usually 5 days and at 20oC. Biological Process: The process by which the metabolic activities of bacteria and other micro organisms break down complex organic materials to simple, more stable substances. Bio solids: Solid organic matter recovered from municipal wastewater treatment that can be beneficially used, especially as a fertilizer. Bio solids are solids that have been stabilized within the treatment process, whereas sludge has not. Chlorination: The addition of chlorine to water or wastewater, usually for the purpose of disinfection. Coliform Bacteria: Rod shaped bacteria from intestinal track of man used as an indication that pathogenic organisms may also be present. Collection System: In wastewater, a system of conduits, generally underground pipes, that receives and conveys sanitary wastewater and/or storm water. In water supply, a system of conduits or canals used to capture a water supply and convey it to a common point. Composting: Stabilization process relying on the aerobic decomposition of organic matter in sludge by bacteria and fungi. Dechlorination: The partial or complete reduction of residual chlorine by any chemical or physical process. Design Storm: The magnitude of a storm on which the design of a system and/or facility is based; usually expressed in terms of the probability of an occurrence over a period of years. Diffused-Air Aeration: The introduction of compressed air to water by means of submerged diffusers or nozzles. Digester: A tank or vessel used for sludge digestion. Disinfection: The selective destruction of disease-causing microbes through the application of chemicals or energy. Diurnal: A daily fluctuation in flow or composition that is of similar pattern from one 24-hour period to another.

xiii
Effluent: Partially or completely treated water or wastewater flowing out of a basin or treatment plant. Fine-Bubble Aeration: Method of diffused aeration using fine bubbles to take advantage of their high surface areas to increase oxygen-transfer rate. Fixed Film Process: Biological wastewater treatment process whereby the microbes responsible for conversion of the organic matter in wastewater are attached to an inert medium such as rock or plastic material. Also called attached-growth process. Force Main: The pipeline through which flow is transported from a point of higher pressure to a point of lower pressure. Friction Factor: A measure of the resistance to liquid flow that results from the wall roughness of a pipe or channel. Gravity Thickening: A process that uses a sedimentation basin designed to operate at high solid loading rate, usually with vertical pickets mounted to revolving sludge scrapers to assist in releasing entrained water. Grit Chamber: A settling chamber used to remove grit from organic solids through sedimentation or an air-induced spiral agitation. Head Loss: The difference in water level between the upstream and downstream sides of a conduit or a treatment process attributed to friction losses. Headworks: The initial structure and devices located at the receiving end of a water or wastewater treatment plant. Infiltration: Water entering a sewer system through broken or defective sewer pipes, service connections, or manhole walls. Influent: Water or wastewater flowing to a basin or treatment plant. Invert: The lowest point of the internal surface of a drain, sewer, or channel at any cross section. Land Application: The disposal of wastewater or municipal solids onto land under controlled conditions. Lift Station: A chamber that contains pumps, valves, and electrical equipment necessary to pump water or wastewater. Methane: A colourless, odourless combustible gas that is the principal by-product of anaerobic decomposition or organic matter in wastewater. Chemical formula is CH4. Mixed Liquid Suspended Solids (MLSS): Suspended solids in the mixture of wastewater and activated sludge undergoing aeration in the aeration basin. Nitrification: Biological process in which ammonia is converted first to nitrite and then to nitrate. Nutrient: Any substance that is assimilated by organisms to promote or facilitate their growth. Pathogen: Highly infectious, disease-producing microbes commonly found in sanitary wastewater. Peak Flow: Excessive flows experienced during hours of high demand; usually determined to be the highest 2-hour flow expected under any operational conditions. Preliminary Treatment: Treatment steps including screening, grit removal, preparation, and/or flow equalization that prepare wastewater influent for further treatment. Pump Station: (see lift station)

xiv
Primary Clarifier: Sedimentation basin that precedes secondary wastewater treatment. Primary Treatment: Treatment steps including sedimentation and/or fine screening to produce an effluent suitable for biological treatment. Rising Main : (see force main) Reclaimed Wastewater: Wastewater treated to a level that allows its reuse for a beneficial purpose. Return Activated Sludge (RAS): Settled activated sludge that is returned to mix with raw or primary settled wastewater. Sanitary Sewer Overflow (SSO): Overloaded operating condition of a sanitary sewer that results from inflow/infiltration. Screening: (1) A treatment process using a device with uniform openings to retain coarse solids. (2) A preliminary test method used to separate according to common characteristics. Scum: Floatable materials found on the surface of primary and secondary clarifiers consisting of food wastes, grease, fats, paper, foam, and similar matter. Secondary Clarifier: A clarifier following a secondary treatment process and designed for gravity removal of suspended matter. Secondary Treatment: The treatment of wastewater through biological oxidation after primary treatment. Sludge: Accumulated and concentrated solids generated within the wastewater treatment process that have not undergone a stabilization process. Sludge Dewatering: The removal of a portion of the water contained in sludge by means of a filter press, centrifuge, or other mechanism. Sludge Stabilization: A treatment process used to convert sludge to a stable product for ultimate disposal or use and to reduce pathogens to produce a less odorous product. Suspended-Growth Process: Biological wastewater treatment process in which the microbes and substrate are maintained in suspension within the liquid. Thickening: A procedure used to increase the solids content of sludge by removing a portion of the liquid. Trickling Filters: Sewage passes down through a loose bed of stones, and the bacteria on the surface of the stones treats the sewage. An aerobic process in which bacteria take oxygen from the atmosphere (no external mechanical aeration). Has moving parts, which often break down. Total Suspended Solids (TSS): The measure of particulate matter suspended in a sample of water or wastewater. After filtering a sample of a known volume, the filter is dried and weighed to determine the residue retained. Waste Activated Sludge (WAS): Excess activated sludge that is discharged from an activated-sludge treatment process. Wetlands Treatment: A wastewater treatment system using the aquatic root system of cattails, reeds, and similar plants to treat wastewater applied either above or below the soil surface. Waste Stabilization Pond: Large surface area ponds that provide treatment essentially by action of sunlight, encouraging algal growth which provides the oxygen requirement for bacteria to oxidize the organic waste. Requires significant land area, but one of the few processes which is effective at treating pathogenic material. Natural process with no power/oxygen requirement. Often used to provide water of sufficient quality for irrigation, and very suited to hot, sunny climates. UASB: Anaerobic process using blanket of bacteria to absorb polluting load. Suited to hot climates. Produces

xv
little sludge, no oxygen requirement or power requirement, but produces a poorer quality effluent than processes such as ASP. (NOTE: other anaerobic processes exist, but UASB is the most common at present). Collection System Terminology
1. Interceptor Sewer: A sewer that receives flow from a number of other sewers or outlets for disposal or
conveyance to a treatment plant. 2. Manhole: An opening in a vessel or sewer to permit human entry. Also called manway.
3. Trunk Sewer: Trunk sewers are large sewers that are used to convey wastewater from main sewers to
treatment or other disposal facilities or to large intercepting sewers. 4. Main Sewer: Main sewers are used to convey wastewater from one or more lateral sewers to trunk
sewers or to intercepting sewers. 5. Lateral Sewer: Lateral sewers form the first element of a wastewater collection system and are usually
in streets or special easements. They are used to collect wastewater from one or more building sewers and convey it to a main sewers.

CHAPTER 1
INTRODUCTION
Final Report on Water Quality Management Plan for Ganga RiverVolume IV-4, Feasibility Study for Varanasi City, Part I, Sewerage Scheme
1-1
PART I SEWERAGE SCHEME CHAPTER 1 INTRODUCTION 1.1 BACKGROUND In response to a request from the Government of India, Japan International Cooperation Agency (JICA) has undertaken “The Study on Water Quality Management Plan for Ganga River in the Republic of India”. The objectives of the Study are:
i. To formulate the Master Plan (M/P) for water quality management for Ganga River with the target year of 2030, focusing on Kanpur, Allahabad, Varanasi and Lucknow, and
ii. To carry out Feasibility Study (F/S) for the priority projects identified in the M/P. To accelerate the implementation of projects and early realisation of M/P, the scope of work has provisions for selection of a city among the four cities as Priority City to carry out F/S. The Study Team along with the Steering Committee, comprising Ministry of Environment and Forest, Department of Urban Development of Uttar Pradesh and other government agencies, has selected Varanasi as the Priority City. The selection was made comparing and evaluating several indicators, i.e. pollution impact on river, beneficiary, current sanitary conditions, cultural & religious importance of the River, etc. The M/P for Varanasi has been formulated and the projects have been categorized into priority projects and urgent projects. The F/S for the identified priority and urgent projects has been carried out and the outcomes of the F/S are complied in this Report. Major contents of the Sewerage M/P for Varanasi are as follows:
• Facility Plan including Cost Estimation and Implementation Plan • Institutional Development Programme of Sewerage Sector • Financial and Economic Evaluation of Proposed Projects • Sanitary Education and Social Considerations (Public Participation / Awareness Programme) • Initial Environmental Examination of Proposed Projects • Selection of Priority Projects
1.2 PRIORITY SEWERAGE PROJECTS FOR FEASIBILITY STUDY 1.2.1 Selection of Sewerage Priority Projects Sewerage priority projects are defined as projects that should be implemented as soon as possible to achieve pollution reduction targets. Projects that have already been sanctioned are not identified because funding is in place and it is assumed they will be fully implemented in the short term. To select priority projects in M/P, following criteria were adopted.
• The projects selected are to contribute to significant improvement of water quality of rivers Ganga and Varuna
• Most of domestic wastewater discharging into the rivers are to be intercepted and treated by the year 2015
• Interceptor sewerage system is to be adopted as an immediate / intermediate measure and conventional sewerage system as a long term measure that requires considerable investment
• Internal or branch sewer is not to be included in priority projects • Interceptor sewerage system is to be utilized in conventional sewerage system of future

Final Report on Water Quality Management Plan for Ganga RiverVolume IV-4, Feasibility Study for Varanasi City, Part I, Sewerage Scheme
1-2
development • Upgrades and rehabilitation of existing major facilities are to be considered • Required programmes to support and to properly operate & maintain the facilities constructed
are to be considered. 1.2.2 Sewerage Priority Projects The sewerage priority projects selected in M/P include:
• To Intercept wastewater in all major drains and sewer outfalls • To convey collected wastewater to sewage treatment plant (STP) • To treat wastewater at STP with appropriate technology and discharging effluent that comply
with national effluent standards for STP The following facilities have been identified in the Master Plan for the priority project and a further feasibility study, which should be implemented before 2015 (1) Ghat pumping station upgrades
• Review of sanctioned augmentation plan of Ghat Pumping Stations • Determination of augmentation capacity for the F/S • Planning of augmentation and rehabilitation
(2) Rehabilitation of STP at Dinapur and Sewage Pumping Station (SPS) at Konia (3) Rehabilitation of STP at Bhagwanpur (4) Operational plan for inspection and rehabilitation of main trunk sewer
• Preliminary inspection of existing main trunk sewer for cleaning and rehabilitation planning
(5) Relieving trunk sewer
• Extension of Relief Trunk Sewer from Sigra to Durgakund (6) Chaukaghat main pumping station, and connection to Sathwa treatment plant
• Trunk main crossing under Varuna River • Main Pumping Station • Connection rising main • Connection gravity trunk main
(7) Sathwa treatment plant
• Pumping facility • Treatment plant • Treated effluent drain to the local canal
(8) Varuna River interceptor sewer
• Left bank interceptor (up stream) • Left bank interceptor (down stream) • Right bank interceptor (up stream) • Right bank interceptor (down stream) • Interceptor for Samne Ghat and Nakkhi drains • Secondary trunk sewers and connection facility to the interceptors
(9) Pump station at Narokhar drain and connection to Varuna River Interceptor
• Pumping Station at Narokhar drain

Final Report on Water Quality Management Plan for Ganga RiverVolume IV-4, Feasibility Study for Varanasi City, Part I, Sewerage Scheme
1-3
• Rising main (10) Assi Nala Interceptor sewer
• Left bank interceptors • Right bank interceptors • Secondary trunk sewers and connection facility to the interceptors
(11) Secondary trunk sewers in all four sewerage districts
• Secondary trunk sewers under central sewage district & sub- central district 1.2.3 Scope of Works for Sewerage Feasibility Study (1) Study Items The scope of works for the F/S includes engineering services and to carry out required survey activities i.e. topographical survey and geo-technical survey. The following studies/ works have been carried out:
1) Review/ collection of existing documents, 2) Review of Master planning framework, 3) Assessing capacities of existing facilities, 4) Evaluation of design alternatives and determination of planning framework for F/S, 5) Detailed field survey for the F/S covering topographical survey and soil investigation, 6) Preliminary design and cost estimation for priority project of sewerage scheme, 7) Implementation planning 8) Organisation, operation & maintenance and human resource development plan, 9) Financial planning and evaluation, and 10) Formulation of work implementation plan
(2) Survey Works Topographic and soil investigation surveys have to be conducted at designated locations in the proposed site. The results of this survey shall be used for obtaining topographic and geo-technical information, which is essential to design interceptor and trunk sewer, pumping station and treatment plant and to select the most appropriate construction technology respectively.
1) Preliminary Inspection of Existing Main Trunk Sewer The existing main brick trunk sewer from Assi to Rajghat was constructed in 1917 and is the main lifeline of the sewerage system of Varanasi. The works of the GAP-I are dependent on functioning of the existing trunk sewer. Preliminary investigation of the trunk main is proposed under F/S to prepare a comprehensive cleaning, inspection and rehabilitation plan. Following activities are proposed under preliminary inspection of trunk sewer: • Identification of sewer alignment and manholes • Sewer alignment level survey. • Manhole survey • Preparation of drawings and manhole database
2) Topographical Survey The objective of the investigation is to obtain topographic information, which is necessary to design interceptor and trunk sewer, pumping station and treatment plant. Following topographic survey shall be carried out at the designated locations in the Proposed Site.

Final Report on Water Quality Management Plan for Ganga RiverVolume IV-4, Feasibility Study for Varanasi City, Part I, Sewerage Scheme
1-4
• Levelling Survey on land, structure and water level of designated locations. • Levelling Survey shall be carried out, by direct levelling at the proposed points, to show
the ground level contour lines at one (1) meter intervals. • Plane Survey on land of designated locations for the proposed sites of pumping stations
and sewerage treatment plan. The survey works are divided in the following two sub-schedules: Sub-schedule (A): Plane and Longitudinal Survey of Proposed Pipeline Route Sub-schedule (B): Levelling and Plane Survey of Propose Facility (PS and STP) Sub schedule (A): Plane and Longitudinal Survey of Proposed Pipeline Route • Assi Nala left and right bank interceptor sewer • Pipeline crossing the Varuna River • Varuna River left and right bank interceptor • Connecting rising main between Narokhar Nala PS and Varuna River interceptor • Secondary trunk sewers (only longitudinal survey shall be conducted) • Rising main and gravity trunk sewer between Chaukaghat MPS and Sathwa STP • Treated effluent drain between the Sathwa STP and the local canal near the STP Sub schedule (B): Levelling and Plane Survey of Propose Facility (PS and STP) • Site of Chaukaghat Main Pumping Station • Site of Narokhar Nala Pumping Station • Site of Sathwa STP • Site of five (5) Ghat Pumping Stations including supplemental level survey of pumping
station structure
3) Geo-technical Survey Following geo-technical investigation shall be carried out at the designated locations along the sewer alignments and at pumping stations and sewage treatment plant site. Sub-schedule (A): Boring Sub-schedule (B) : Standard Penetration Test (SPT) Sub-schedule (C) : Sampling and Laboratory Test
(3) Ghat Pumping Station Survey The entire Ghat pumping stations constructed / refurbished under GAP-I are poorly maintained and need rehabilitation / capacity expansion. Following survey is proposed for data collection to facilitate the rehabilitation plan:
• Collection of available data • Site survey for the preparation of layout plan, hydraulic flow diagram and general arrangement
drawings • Conditional assessment of mechanical and electrical equipment • Assessment of present inflow condition.
CHAPTER 2
PRELIMINARY DESIGN AND COST ESTIMATION FOR
SEWERAGE PRIORITY PROJECT

Final Report on Water Quality Management Plan for Ganga RiverVolume IV-4, Feasibility Study for Varanasi City, Part I, Sewerage Scheme
2-1
CHAPTER 2 PRELIMINARY DESIGN AND COST ESTIMATION FOR SEWERAGE PRIORITY PROJECT
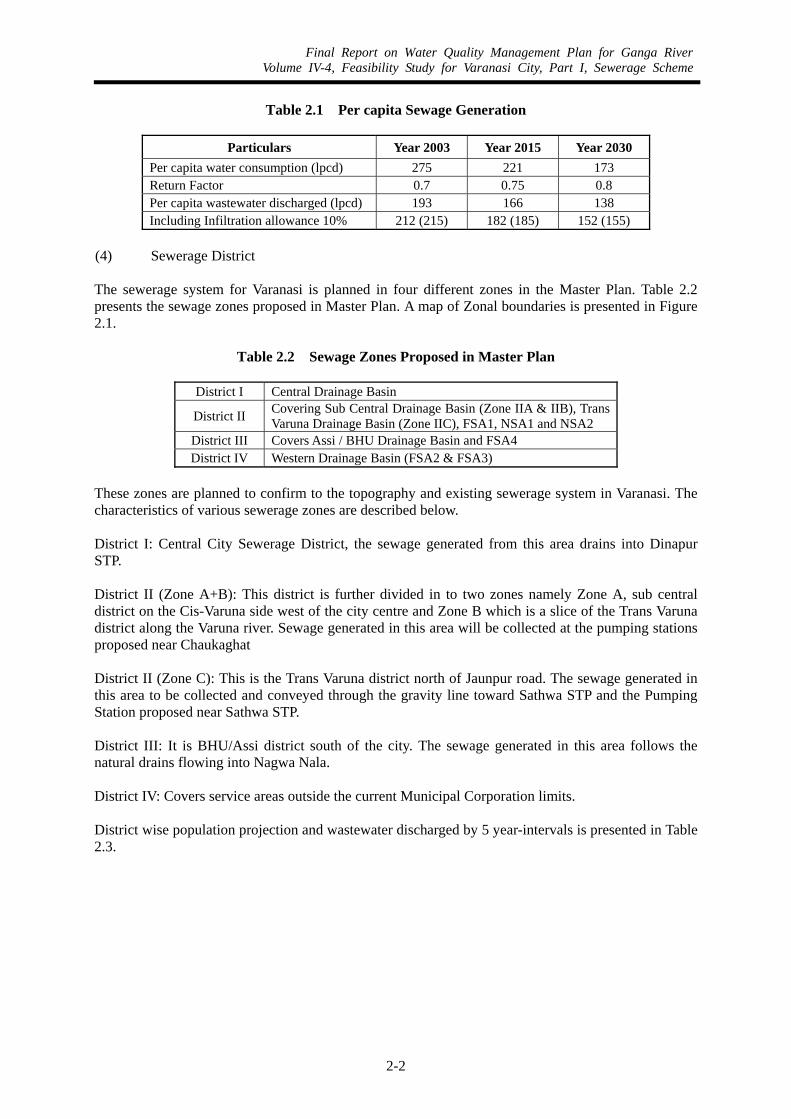
2.1 PLANNING BASIS 2.1.1 Design Criteria (1) Design Years Master Plan (M/P) has identified a set of priority projects, which is proposed to be completed basically within five years after the adoption of M/P. Further, the capacity of Civil Works is sized for year 2030 and the capacity of mechanical and electrical works is planned for Year 2015 with provision for future expansion. Land requirements for sewage treatment works are based on year 2030. In Stage-I, STP capacity sufficient for Year 2015 will be implemented. (2) Population Projections Population projection forms the basis for estimation of capacity of the various engineering interventions. The ward wise population projected for Master Plan was reviewed and used in the feasibility study. The outcome of the review of the method adopted for population projection is as follows: A detailed ward-wise population projection has been carried out in M/P. This has enabled to group the anticipated population into sewage zones, namely, FSA, NSA 1, NSA 2, Zone 1, Zone 2A, Zone 2B, Zone 2C and Zone 3. It is clear that the ward wise growth rate has been used as a basis for population projection; however, it did not have the criteria or the assumption used for estimating the growth rates. It is presumed that these growth rates are comparable with the growth rate of Varanasi Development Authority (VDA). This is because the growth rate depends on the anticipated development of a particular ward over the years and the prevailing development control regulations. VDA is the agency looking after the development activities and also responsible for formulation and implementation of development control regulations. The growth rate adopted can be reviewed further only if the criteria and/or assumptions used for projections are made available. Population projections prepared in M/P are evaluated and agreed upon by UP Jal Nigam and NRCD. The details on the ward-wise population projections is included in the Annexure 2-1 (3) Wastewater Discharged Wastewater discharged per capita is calculated using the proposed per capita water supply and is presented in Table 2.1.
Final Report on Water Quality Management Plan for Ganga RiverVolume IV-4, Feasibility Study for Varanasi City, Part I, Sewerage Scheme
2-2
Table 2.1 Per capita Sewage Generation
Particulars Year 2003 Year 2015 Year 2030 Per capita water consumption (lpcd) 275 221 173 Return Factor 0.7 0.75 0.8 Per capita wastewater discharged (lpcd) 193 166 138 Including Infiltration allowance 10% 212 (215) 182 (185) 152 (155)
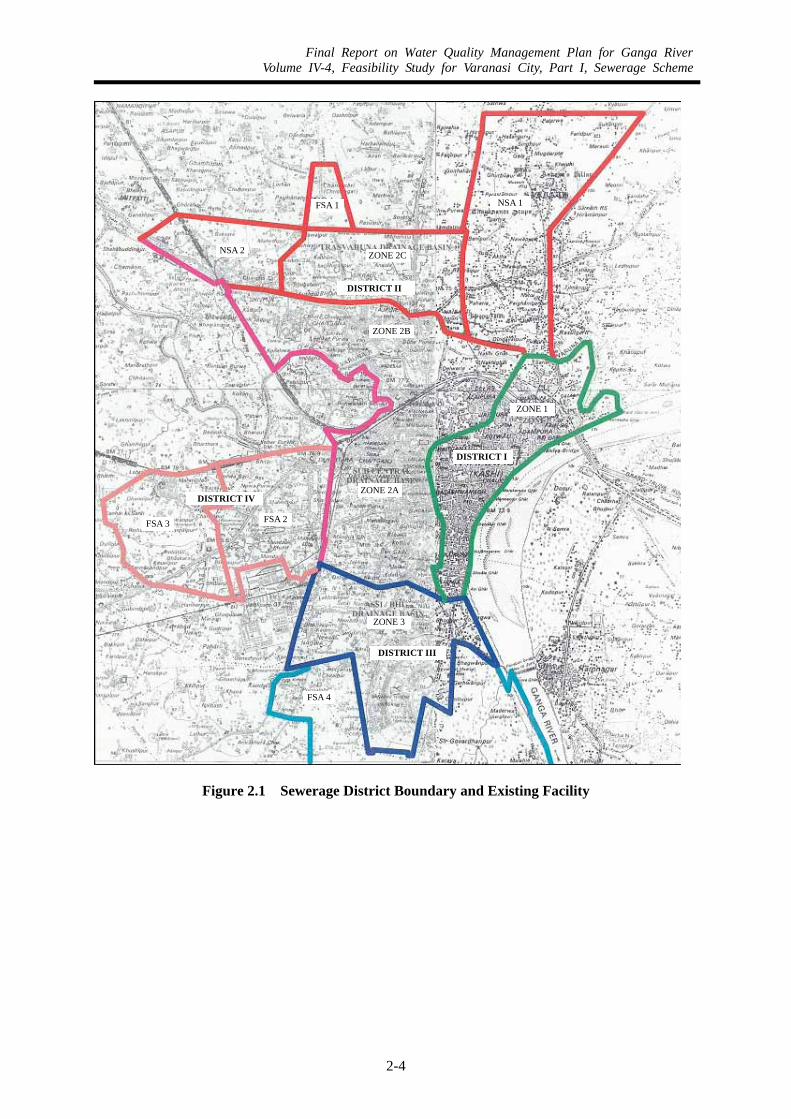
(4) Sewerage District The sewerage system for Varanasi is planned in four different zones in the Master Plan. Table 2.2 presents the sewage zones proposed in Master Plan. A map of Zonal boundaries is presented in Figure 2.1.
Table 2.2 Sewage Zones Proposed in Master Plan
District I Central Drainage Basin
District II Covering Sub Central Drainage Basin (Zone IIA & IIB), Trans Varuna Drainage Basin (Zone IIC), FSA1, NSA1 and NSA2
District III Covers Assi / BHU Drainage Basin and FSA4 District IV Western Drainage Basin (FSA2 & FSA3)
These zones are planned to confirm to the topography and existing sewerage system in Varanasi. The characteristics of various sewerage zones are described below. District I: Central City Sewerage District, the sewage generated from this area drains into Dinapur STP. District II (Zone A+B): This district is further divided in to two zones namely Zone A, sub central district on the Cis-Varuna side west of the city centre and Zone B which is a slice of the Trans Varuna district along the Varuna river. Sewage generated in this area will be collected at the pumping stations proposed near Chaukaghat District II (Zone C): This is the Trans Varuna district north of Jaunpur road. The sewage generated in this area to be collected and conveyed through the gravity line toward Sathwa STP and the Pumping Station proposed near Sathwa STP. District III: It is BHU/Assi district south of the city. The sewage generated in this area follows the natural drains flowing into Nagwa Nala. District IV: Covers service areas outside the current Municipal Corporation limits. District wise population projection and wastewater discharged by 5 year-intervals is presented in Table 2.3.

Final Report on Water Quality Management Plan for Ganga RiverVolume IV-4, Feasibility Study for Varanasi City, Part I, Sewerage Scheme
2-3
Table 2.3 District Wise Population Projection and Wastewater Discharged (mld)
2003 2015 2030 Wastewater discharge rate 215 lpcd 185 lpcd 155 lpcd
Sewer service area District I 110.2 103.7 93.7 District II 115.0 148.3 174.1 District III 31.9 54.2 73.5 District IV 17.1 32.0 45.1 Sub-total 274.2 338.2 386.4
Non sewer areas NSA 1 9.3 17.2 33.4 NSA 2 5.1 10.6 17.8
Cantonment 3.8 3.2 2.7 Sub-total 18.2 31.0 53.9 Total 292.3 369.2 440.3
Final Report on Water Quality Management Plan for Ganga RiverVolume IV-4, Feasibility Study for Varanasi City, Part I, Sewerage Scheme
2-4
Figure 2.1 Sewerage District Boundary and Existing Facility
District II
District IV
District III
District I
NSA 1
District IIA
Zone 2C
District IIB
FSA 1
NSA 2
FSA 2 FSA 3
FSA 1
NSA 2
DISTRICT II
NSA 1
DISTRICT I
DISTRICT IV
DISTRICT III
FSA 2 FSA 3
ZONE 2B
ZONE 2A
ZONE 1
ZONE 2C
ZONE 3
FSA 4
Final Report on Water Quality Management Plan for Ganga RiverVolume IV-4, Feasibility Study for Varanasi City, Part I, Sewerage Scheme
2-5
(5) Existing Sewerage System
1) Old Main Trunk Sewer (District I) The sewerage system in Varanasi was commissioned in the Year 1917 (Old Main Trunk Sewer). This sewer begins at Assi and passes thorough thickly populated areas of the town viz. Central Drainage Zone and used to discharge untreated sewage into River Ganga, nearly 400 meters downstream of Malviya Bridge. It is a circular brick sewer in lime mortar of 7 km length. Its size varies from 750 mm to 2400 mm diameter. In GAP I, this untreated sewage was diverted to Konia MPS, from where it was pumped and treated at Dinapur STP. The capacity of Dinapur STP is 80 mld, however the Konia MPS receives around 130 MLD of sewage. Presently, this excess flow of sewage is diverted to River Ganga with a gate arrangement provided in a Special Manhole. In the absence of any interceptor sewer, in Sub Central Drainage Basin (District II), the sewage flow of this area is not fully defined. A part of sewage from District II is discharged into Old Main Trunk Sewer and remaining flow is discharged into River Varuna through storm water drains.
2) Orderly Bazaar Sewer (District I and II) Orderly Bazaar Sewer was commissioned in Year 1917 along with Old Main Trunk Sewer. This sewer was laid from Collectorate’s office and, earlier, connected to old Main Trunk Sewer after crossing the Varuna River and railway line. In 1946, bridge supporting this line across Varuna River was washed away in the floods resulting in the discharge of untreated sewage into Varuna River.
3) Ghat Intercepting Sewer (District I)
The Ghat Intercepting sewers were constructed in 1971 for the purpose of sewage discharge to the River Ganga from a number of old drains between Meer Ghat and Trilochan Ghat. It consists of 300 mm dia CI pipe of 1184 m length and the outfall of this sewer was at Trilochan Ghat. The interceptor sewer serves the Ghat portion of the town on bank of river that cannot be drained into the Old Main Trunk Sewer. Several branch sewers and laterals have been laid from time to time. It is assessed that the total length of sewer network in city is about 400 kms. Under GAP I, interception and diversion works of following six major drains on western bank of River Ganga was carried out, through five Ghat pumping stations. These pumping stations lift sewage into Old Main Trunk Sewer.
• Shiwala Ghat Drain • Harischandra Ghat Drain • Mansarovar Drain • Ghora Nala (Dr. R. P. Ghat Drains) • Jalesan Drain • Trilochan Drain
4) Existing Pumping Stations
Ghat Pumping Stations (District I) Under GAP I, a new pumping station was added at Mansarovar Ghat and the other four existing pumping stations along the left bank of River Ganga were upgraded, by UP Jal Nigam.

Final Report on Water Quality Management Plan for Ganga RiverVolume IV-4, Feasibility Study for Varanasi City, Part I, Sewerage Scheme
2-6
Assi Main Pumping Station (District II) Under GAP-I, a pumping station was installed for interception and diversion of sewage flowing through Assi Nala. The sewage is being lifted and pumped to Bhagwanpur STP from Assi Nala. The details of this pumping station are given in Table 2.4.
Table 2.4 Details of Assi SPS
Installed capacity 833 lps
Installed pumps 3 x 50 HP – 5,000 lpm @ 24 m head 1 x 22.5 HP – 3,000 lpm @ 15 m head
Diesel Generating Sets 1 x 70 kVA Rising Main 400 mm dia PSC
Konia Main Pumping Station (District I) 100 MLD MPS was constructed under GAP-I at village Konia. This MPS was constructed to lift sewage from Old Main Trunk sewer to Dinapur STP. In this MPS, pumping is carried out in two stages, three screw pumps in first stage followed by a set of centrifugal pumps in second stage. The sewage lifted by screw pumps passes through screening and grit removal units. The existing facilities in Konia MPS are presented in Table 2.5.
Table 2.5 Existing Facilities in Konia MPS
Konia MPS First Stage Installed capacity 3 x 1,158 = 3474 lps Installed pumps 3 x 215 HP – 1,158 lps @ 8.51 m head Pre-treatment Units Screens 2 nos. mechanically operated – 50 MLD each 1 no. manually operated – 50 MLD Detritor 2 nos. of 100 MLD each Konia MPS Second Stage Dimensions 32 m x 6 m Installed capacity 3480 lps
Installed pumps 3 x 215 HP – 740 lps @ 8.51 m head 3 x 150 HP – 420 lps @ 8.51 m head
Diesel Generating Sets 4 x 500 kVA
Rising Main 1200 mm dia PSC (New) 900 mm dia Hume Steel (Old)
5) Existing Sewage Treatment Facilities
In total there are four STPs in Varanasi, to treat the sewage generated in the city. Among these four STPs, three are constructed under the GAP-I and are, presently, maintained by UPJN. The fourth STP of 1.8 MLD, Lalpur STP lies outside the project area, which serves the area covered under the Lalpur Town planning scheme Phase-I. This STP is maintained by VDA. Table 2.6 presents the source of sewage, design capacity of this STP.
Final Report on Water Quality Management Plan for Ganga RiverVolume IV-4, Feasibility Study for Varanasi City, Part I, Sewerage Scheme
2-7
Table 2.6 Existing STPs in Varanasi
(mld)
Sr. Location Source of sewage Design capacity
Amount of sewage received District
1 Dinapur Konia MPS 80 100 Outside of the City limit
2 Bhagwanpur / BHU
Assi pumping station and BHU campus 8 12 District III
3 DLW DLW campus 12 6 Outside of the City limit
4 Lalpur Lalpur Town Planning Scheme Phase I 1.8 Nil* Outside of the
City limit * The plant was not in operation during the site visit made by JICA Study Team.
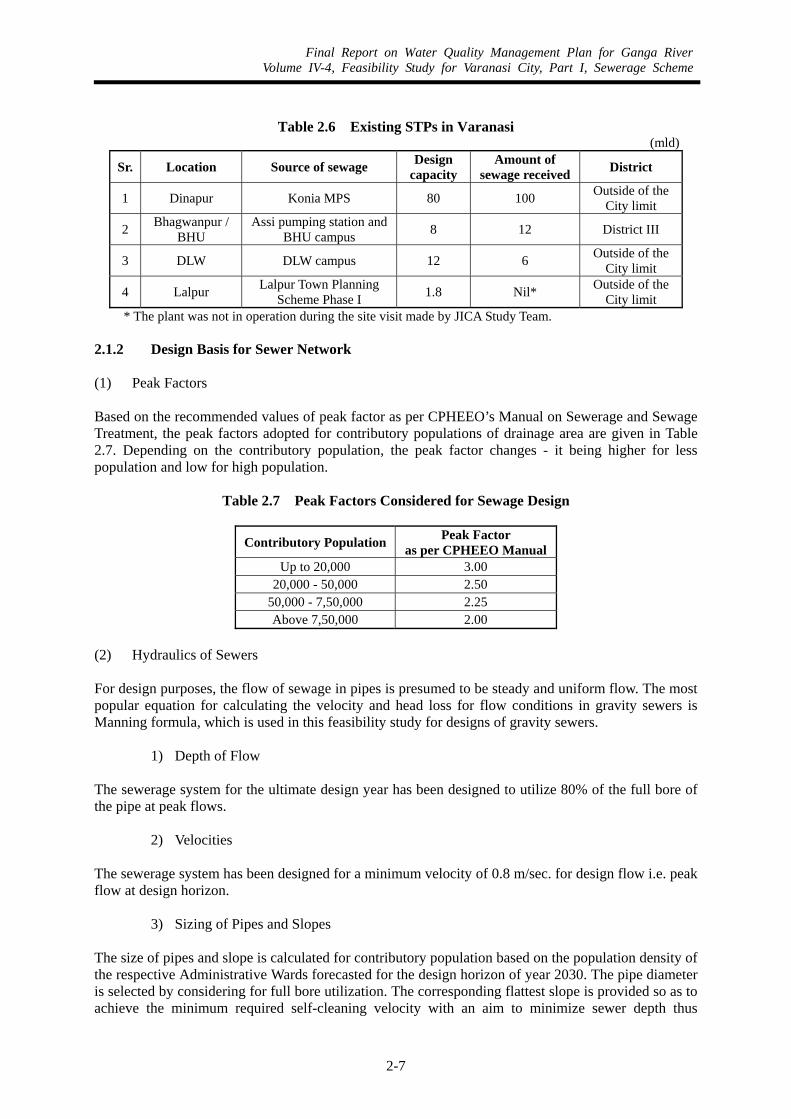
2.1.2 Design Basis for Sewer Network (1) Peak Factors Based on the recommended values of peak factor as per CPHEEO’s Manual on Sewerage and Sewage Treatment, the peak factors adopted for contributory populations of drainage area are given in Table 2.7. Depending on the contributory population, the peak factor changes - it being higher for less population and low for high population.
Table 2.7 Peak Factors Considered for Sewage Design
Contributory Population Peak Factor as per CPHEEO Manual
Up to 20,000 3.00 20,000 - 50,000 2.50
50,000 - 7,50,000 2.25 Above 7,50,000 2.00
(2) Hydraulics of Sewers For design purposes, the flow of sewage in pipes is presumed to be steady and uniform flow. The most popular equation for calculating the velocity and head loss for flow conditions in gravity sewers is Manning formula, which is used in this feasibility study for designs of gravity sewers.
1) Depth of Flow The sewerage system for the ultimate design year has been designed to utilize 80% of the full bore of the pipe at peak flows.
2) Velocities The sewerage system has been designed for a minimum velocity of 0.8 m/sec. for design flow i.e. peak flow at design horizon.
3) Sizing of Pipes and Slopes The size of pipes and slope is calculated for contributory population based on the population density of the respective Administrative Wards forecasted for the design horizon of year 2030. The pipe diameter is selected by considering for full bore utilization. The corresponding flattest slope is provided so as to achieve the minimum required self-cleaning velocity with an aim to minimize sewer depth thus
Final Report on Water Quality Management Plan for Ganga RiverVolume IV-4, Feasibility Study for Varanasi City, Part I, Sewerage Scheme
2-8
ensuring reduced cost. In cases where (i) the topography does not permit to have the calculated gradient for full bore utilization and/or (ii) the proposed sewer is to be connected to an existing line, which is at a shallow depth, a higher size pipe is selected to match the crown of connecting sewers.
4) Minimum Pipe Size The interceptor sewers have been designed considering the minimum size of sewer as 500 mm and secondary sewers as 300 mm.
5) Minimum Depth of Cover
The starting manhole depth of the proposed sewers ranges from 1.2 m to 2.5 m depending upon the topography and detail of road planning network available. The minimum depth of cover thus depends on the depth of starting manhole and the subsequent ground level of the road along the sewer. The actual depth of cover shall vary, as most of the sewers are planned on proposed roads.
6) Maximum Depth of Sewer The sewerage system has been designed such that the maximum cover of sewer will be about 10 meters below ground level. In many areas construction of sewers below 10 meters becomes very difficult. This shall increase the cost of construction and maintenance. Hence as per the prevailing practice it is proposed to lift the sewage by the proposition of a Sewage Pumping Station once the sewer depth reaches @ 10 meters.
7) Sewer Appurtenances Manholes Standard circular manholes have been recommended for pipe diameter up to 1200-mm. However, rectangular manholes should be provided for shallow depths. Scraper Manholes For sewers of diameter 600 mm and above, scraper manholes shall be provided at major junctions and at an interval of every 150 m. Scraper manhole openings will be of minimum 900 to 1200 mm size to permit lowering of sewer cleaning equipment. It is very important to construct scraper manholes as the sewers are designed to serve for long term, which shall run with quite less flow during the initial years resulting into silting. Drop Arrangement The drop arrangement consists of a pipe that drops the invert of the incoming sewer to that of the main sewer in the manhole. The diameter of the drop pipe should be at least as large as the incoming pipe. Theoretically drop arrangements are provided where the drop of an incoming sewer in manhole exceeds 600 mm. Drop arrangements are provided in manhole for the following reasons:
• To convey the sewage to bottom of the manhole without splashing • To minimize the scouring action of the sewage falling from a height on the cement
concrete floor of the manhole • For the safety of the personnel who enter the manhole
Receiving Manhole at Pressure line Discharge A 2 m x 2 m receiving sump with the provision of PVC splash pad is proposed for chamber-type manhole into which pressure line is discharged prior to joining the gravity sewer. Vent Shafts Ventilation shafts will be provided at the head end of every sewer and along the sewers at about 150-m

Final Report on Water Quality Management Plan for Ganga RiverVolume IV-4, Feasibility Study for Varanasi City, Part I, Sewerage Scheme
2-9
interval as well as at junctions. Pipe selection The materials used extensively for sewerage in most Indian cities are glazed stoneware / vitrified clay and reinforced concrete pipes for gravity sewers whereas cast iron / ductile iron pipes are employed for rising / force mains of pumping stations. Concrete pipes conforming to IS: 458 of appropriate strength with proper anti-corrosive lining may even last for about 50-60 years. Considering the capital cost, durability and availability of the pipes, RCC pipes, preferably NP3/NP4 class as per IS: 458-1988, have been proposed. Concrete pipes are usually laid and jointed by collar joints. The class of concrete pipes is decided on the basis of analysis of design loads likely to be imposed upon on the sewer depending upon its depth. Structural Design of Buried Sewers Any sewer line buried into the ground should have adequate strength to withstand the stresses imposed not only by the internal pressure but also more importantly, by the stresses induced by external loads. There are two types of external loads, one is due to the backfill material known as backfill load and other is due to superimposed loads. Besides these external loads, the sewer line is also subjected to the load of water in the pipeline, especially during surcharge conditions. Load on Conduit due to Backfill The load on a buried conduit is equal to the weight of the prism of earth directly over the conduit plus the frictional shearing forces transferred to the prism by the adjacent prism of earth. The most widely used method for determining the vertical load due to backfill on buried conduit is Martson’s Formula, the general form of which is
W = C.w.B2 where, W = Vertical load in kg per meter length acting on the conduit due to gravity
loads w = Unit weight of earth, kg/m3 B = Width of trench or conduit depending upon type of installation condition,
m C = Dimensionless coefficient that measures the effect of ratio of height of fill
to width of trench or conduit The value of C for various types of installation and depending on the height / width ratio is given in the Manual of Sewerage and Sewage Treatment (CPHEEO) published by the Ministry of Housing and Urban Affairs, New Delhi. The C-value for 'Ordinary maximum for clay' has been considered for design purposes. The unit weight of earth varies from 1600 kg / m3 for dry sand to 2100 kg/ m3 for saturated clay. Load on Conduit due to Superimposed load Superimposed loads may be either concentrated or distributed loads. The formula for load due to concentrated load such as truck wheel is given by Boussinesq’s formula
Wsc = Cs(PF/L) where, Wsc = load on the conduit, kg/m P = concentrated load acting on the surface, kg F = impact factor (1.0 for air field runways, 1.5 for highway traffic and air
taxi ways, 1.75 for railway traffic) and Cs = load coefficient which is a function of Bc/2H and L/2H, where
Final Report on Water Quality Management Plan for Ganga RiverVolume IV-4, Feasibility Study for Varanasi City, Part I, Sewerage Scheme
2-10
H = the height of the top of conduit to ground surface, m Bc = the outside width of conduit, m and L = effective length of the conduit to which the load is transmitted, m.
For distributed superimposed loads, the formula for the conduit is given by Wsd = Cs.p.F.Bc where, Wsd = load on conduit, kg/m p = intensity of distributed load, kg/m2 F = impact factor Bc = width of conduit, m Cs = load coefficient, a function of D/2H and L/2H H = height of the top of conduit to the ground surface, m and D and L are
width and length respectively of the area over which the distributed load acts, in meters.
For class AA IRC loading in the critical case of 6.25 tones wheel load, the intensity of distributed load with wheel area 300mm x 150mm is given by P = 6.25/(0.3x0.15) T/m2. Supporting Strength of Rigid Conduit The ability of a conduit to resist safely the earth load depends on its inherent strength as well as the distribution of vertical load and bedding reaction and on the lateral pressure acting against the sides of the conduit. The inherent strength of a rigid conduit is usually expressed in terms of the three edge bearing test results, the condition of which are however different from the field load conditions. For strength calculations of NP class precast RCC pipes, IS: 458 (1988) is used. Field Supporting Strength The field supporting strength of a rigid conduit is the maximum load per unit length, which the pipe will support while retaining complete serviceability when installed under specified conditions of bedding and backfilling. The field supporting strength however does not include any factor of safety. The ratio of the strength of a pipe under any stated condition of loading and bedding to its strength measured by the three edge-bearing test is called the load factor. The load factor does not contain a factor of safety. Load factors have been determined experimentally and analytically for the commonly used construction condition for both trench and embankment conduits. The basic design relationships between the different design elements are: Safe supporting strength,
W = Field supporting strength/Factor of Safety = (Load factor x three edge bearing Strength)/Factor of safety
A factor of safety of at least 1.5 should be applied to the specified minimum three edge bearing strength to determine the working strength for all the rigid conduits. The class of bedding considered is B type, whose load factor as per the CPHEEO Manual is 1.9. Based on the above consideration, a general guide for selecting the class of pipe from 200 to 600-mm diameter is given in Table 2.8. However, in our case we have carried out the structural designs for all pipes above 300mm.

Final Report on Water Quality Management Plan for Ganga RiverVolume IV-4, Feasibility Study for Varanasi City, Part I, Sewerage Scheme
2-11
Table 2.8 Guideline for Selection of Pipe Class for Sewers with B-class Bedding
Diameter NP2 NP3 NP4
200 1.2 to 7.0 m 250 1.2 to 7.0 m 300 1.2 to 4.2 m 4.2 to 6.0 m 6.0 to 10.0 m 350 1.2 to 2.7 m 2.7 to 3.5 m 3.5 to 10.0 m 400 1.2 to 2.7 m 2.7 to 3.5 m 3.5 to 10.0 m 450 1.2 to 2.7 m 2.7 to 3.5 m 3.5 to 9.5 m 500 1.5 to 3.5 m 3.5 to 8.5 m 600 1.5 to 3.5 m 3.5 to 7.5 m
Note: For larger diameters of 700-mm and above, pipe class cannot be generalized and has to be calculated on a case-to-case basis.
Type of Bedding The type of bedding provided for pipes will be selected from granular bedding, concrete (M20) cradle bedding or concrete encasement (M20) and the choice will depend on the depth at which the sewer is laid, three edge bearing strength of pipes used, load due to backfill and superimposed vehicular traffic loads. Technical suitability of such bedding, as per the guidelines of CPHEEO, is studied and adopted as found acceptable. Force Main Sewage may have to be carried to higher elevations through force main. The size of the main should be determined by taking into account the initial cost of pipeline and cost of operation of pumping for different sizes. The size of pressure main has been calculated for velocity of 1.1 to 1.5 m/sec for design peak flows with a maximum velocity up to 2.0 m/sec. Losses in valves, fittings, etc. are dependent upon the velocity head V2/2g. Loss in bends, elbows depend upon the ratio of absolute friction factor to pipe diameter, besides the velocity head. Loss due to sudden enlargement depends upon the ratio of diameters. Each individual case needs to be studied from various aspects such as operation of pumps, the specified limits, availability of land required for duplicating the main in future, etc. CI pipes conforming to IS: 1536 (1989) and DI pipes as per IS: 8329 (1994) are corrosion resistant with an expected life of about 100 years. CI pipes will be jointed either by rubber gaskets suitable tyton joints or by lead joint. 2.1.3 Design Basis for Sewage Treatment Plants (1) Concept of Decentralized Sewage Treatment Plant One of the basic design concepts required to be studied for the design of sewerage system for a city is whether centralized or de-centralized sewage treatment plants are suitable. The main criteria governing the choice of the scheme are:
• Topography of the contributing area • Usage of existing sewerage system • Proximity to the discharge point for the treated sewage • Location of discharge of the treated sewage from intake of water works • Availability and accessibility of site for the STP • Location of the selected site for STP vis-à-vis the City • Availability of other utilities such as power, roads, communications etc.

Final Report on Water Quality Management Plan for Ganga RiverVolume IV-4, Feasibility Study for Varanasi City, Part I, Sewerage Scheme
2-12
• Capitalized Operation and Maintenance costs
1) Topography of the contributing area (sewerage zone) The Varanasi City is divided into various sewerage districts considering topography and natural drainage system. Considering these facts of natural topography, which conveys sewage in different directions, will make it economically a non-viable solution to bring the sewage generated in different areas to a common point.
2) Usage of existing sewerage system The existing sewerage system consists of the main trunk sewer line viz. existing Old Trunk Sewer and Relief Trunk sewer. The Old Trunk Main sewer is discharging at the Konia Pumping station and the Relief Trunk Sewer, which is under construction, discharging the sewage to Chaukaghat Pumping Station. In addition to these trunk mains, there are over 400 kms lengths of sewers existing in Varanasi. The intricate existing sewerage system and non-availability of the land, which will be required for large capacity, STP makes it non-conducive for planning of centralized STP.
3) Proximity to the discharge point for the treated sewage It is necessary to locate the proposed plant at a suitable site from where the treated sewage can be safely discharged. The treated sewage from the Sathwa STP is proposed to be used for irrigation application and can be discharged into the irrigation canal located about a one km from the proposed STP site.
4) Location of discharge of the treated sewage from intake of water works It is very essential that the location of discharge point of treated sewage into receiving body is on the downstream side of the water intake points for water supply system. The discharge point envisaged for the proposed STP is far away from the raw water intake points.
5) Availability and accessibility of site for the STP It is essential to have proper access roads to the STP location. The site identified for the proposed Sathwa STP is adjacent to the Azamgarh road, which is easily accessible from Varanasi. The land earmarked for construction of this STP is found to be adequate for the recommended treatment scheme. The existing land use of the city makes it necessary to locate the proposed STP at the outskirts.
6) Location of the selected site for STP vis-à-vis the City The location of the proposed Sathwa STP site is about 7 kms from Pandeypur junction, which is one of the most important road connections of traffic in Varanasi City. It is a vast distance from the human settlements and is not envisaged to have any detrimental effect on the City’s population.
7) Availability of other utilities like power supply, roads, communications etc. The STP site proposed under the master plan is easily approachable being on the Azamgarh road. The site is location being located on a proper road network ensures that other utilities such as power supply, communication facilities can be made available.
8) Capitalized Operation and Maintenance costs Looking at the existing sewerage facilities and all above factors which have influence on the selection of STP locations have any adverse impact on the Capital Costs as well as on the Operation &

Final Report on Water Quality Management Plan for Ganga RiverVolume IV-4, Feasibility Study for Varanasi City, Part I, Sewerage Scheme
2-13
Maintenance costs and the existing facilities will be utilized to fullest possible extent.
9) Conclusion After studying the Centralized v/s Decentralized System proposed in the Master plan, it is evident that the proposed decentralized system for constructing the sewage treatment plant is appropriate. (2) Raw Sewage Characteristics Considered for Design Purpose The wastewater characteristics used for design of the proposed sewage treatment plant at Sathwa are based on the projected wastewater characteristics presented in the Table 2.9.
Table 2.9 Raw Sewage Characteristics considered for Design Purpose
Sr. Parameter Average Value
1 Minimum Temperature, oC 20 2 pH 6.0 - 8.5 3 Biochemical Oxygen Demand (BOD5), mg/l 300 4 Total Suspended Solids, mg/l 600 5 Faecal Coliform Count, MPN/100 ml 2 x 10⁷
(3) Discharge Standards NRCD have conveyed the recommendations of the Expert Committee through their letter no DO. No. A-33013/1/99-NRCD dated 5th October 1999, suggesting that the maximum permissible value for Faecal Coliform in treated water should not exceed 10,000 MPN per 100 ml sample irrespective of its mode of disposal in river or its use for irrigation to grow either restricted or unrestricted crops. It is also mentioned in NRCD guidelines that BOD and TSS concentration less than 30 mg/l and 50 mg/l respectively. The sewage treatment plant has been therefore designed so as to achieve treated wastewater of equal or better quality as mention in the Table 2.10 hereunder.
Table 2.10 Treated Wastewater Quality
Sr. Parameter Value (Irrigation Field/River)
1 pH 5.5 – 9.0 2 Biochemical Oxygen Demand, mg/l < 30 3 Total Suspended Solids, mg/l < 50 4 Faecal Coliform Count, MPN/100 ml <10,000
(4) Selection of Sewage Treatments Scheme for Sathwa The requirement of a feasible sewage treatment system are as following:
• Simple to construct and operate, • Ability to handle strong sewage within short detention time, • Minimum capital and operation cost, • Possibility of cost recovery, • Minimum land requirement, • Ability to treat unto the prescribed discharge standards, • Minimum odour, flies and other nuisance, and

Final Report on Water Quality Management Plan for Ganga RiverVolume IV-4, Feasibility Study for Varanasi City, Part I, Sewerage Scheme
2-14
• General acceptance to the people in the vicinity of the STP. (5) Treatment Options for Varanasi City for Use of Treated Water for Irrigation Purpose The techno-economic treatment option should take into consideration the site-specific constraints and the inlet characteristics of the sewage. Further, for a city of Varanasi that is fast growing and with huge quantum of sewage being generated every day with high organic load, the treatment option should not be separately looked into without considering the land costs. The four treatment options for the prescribed standards under consideration for getting through the best feasible option for the sewage treatment plant at Sathwa are as following: Alternative 1: Waste Stabilisation Pond System consisting of Anaerobic Pond followed by
Facultative pond followed by Maturation pond, Alternative 2: Activated Sludge Process with Chlorination System, Alternative 3: UASB Process followed by Facultative Aerated Lagoon with Chlorination System, Alternative 4: Facultative Aerated Lagoon followed by Maturation Ponds with Chlorination
System, Alternative 1: Waste Stabilisation Pond System of Anaerobic Pond + Facultative + Maturation
Pond Stabilisation ponds are open, flow through earthen basins specially designed and constructed to treat sewage and biodegradable industrial wastewater. Stabilisation ponds provide long detention periods extending to several days. In ponds the organic waste is stabilized through symbiotic relationship between the algae and bacteria. Oxygen is provided by photosynthesis of algae or by mechanical aeration in some cases. The treatment process will consist of inlet chamber, screen channel, and an anaerobic pond having hydraulic retention time of 2.0 days. The Facultative pond having a detention time of 21 days will follow the anaerobic pond. Subsequent to the Facultative pond, there shall be Maturation ponds having detention time of 5 days. The waste stabilisation ponds are designed for ambient temperature of 16 deg cel. The schematic flow diagram of this Alternative is presented in the Figure 2.2.
Table 2.11 Area Statement for Waste Stabilisation Pond System
Unit Detention time (day)
Depth (m)
Anaerobic Lagoon 2 3.0 Facultative Pond 21 2.0 Maturation Pond 5 1.2
Alternative 2: Activated Sludge Process with Chlorination System An Activated Sludge Process (ASP) is a type of Aerobic Suspended Growth system. The ASP plant essentially consist of the following:
• Aeration Tank containing micro organisms in suspension in which biological degradation of organic matter takes place aerobically,
• Activated Sludge Recirculation System to maintain the sufficient micro organisms in Aeration Tank,
• Excess Sludge wasting and disposal facilities,

Final Report on Water Quality Management Plan for Ganga RiverVolume IV-4, Feasibility Study for Varanasi City, Part I, Sewerage Scheme
2-15
• Aeration system to transfer oxygen, • Secondary Settling tank to settle the suspended solids, • Thickener to thicken activated sludge, • Digester for sludge digestion, • Gasholder for gas storage resulting from sludge digestion, and • Chlorination system for disinfecting treated sewage.
This Alternative consists of the following treatment units-
• Inlet Chamber, • Fine Screen Channel, • Detritor Tank, • Primary Clarifier, • Aeration Tank, • Secondary Clarifier, • Chlorination System, • Sludge Pumping Station, • Filtrate Pumping Station, • Sludge Thickener, • Sludge Digester, • Gasholder and • Sludge Drying Beds.
Raw sewage will be received in the inlet chamber and then passed to the screen channel and subsequently to the Detritor tank. In screen channel floating matters are trapped and removed whereas in Detritor tank, grit is removed. After screening and grit removal the wastewater is taken into a primary Clarifier. This is provided for the removal of suspended matter before taking wastewater for further biological treatment. The sludge generated as a result of primary settling is taken for thickening and subsequently for digestion. A sludge digester and pumps are provided for this purpose. After primary settlement of the suspended matter, the wastewater is taken to aeration tank containing microorganisms in suspension in which the biological degradation takes place. Further, a secondary Clarifier is provided to separate the activated sludge. A part of the incoming flow is re-circulated upstream of the aeration tank. A tapping is provided on this line to lead the excess sludge to the sludge sump. A two-stage digestion system is provided for sludge digestion. The detention time in the digester is about 20 days. Mixers are provided to operate in a completely mixed regime in the digester. It is proposed to use sludge-drying beds for sludge dewatering prior to sludge disposal. The schematic flow diagram of this Alternative is presented in the Figure 2.3. Alternative 3: UASB Process followed by Facultative Aerated Lagoon with Chlorination The UASB process followed by Facultative Aerated Lagoon with chlorination essentially consist of the following:
• Primary treatment consisting of screening and degritting, • UASB reactor for anaerobic degradation of sewage, • Facultative Aerated Lagoon having aeration system to transfer oxygen, • Chlorination system for further reduction of faecal coliform and disinfecting treated sewage • Gasholder for gas storage and Gas utilisation system, and • UASB Sludge wasting and dewatering facilities
Final Report on Water Quality Management Plan for Ganga RiverVolume IV-4, Feasibility Study for Varanasi City, Part I, Sewerage Scheme
2-16
The treatment process will consist of the following treatment units:
• Inlet Chamber, • Fine Screen Channel, • Detritor Tank, • UASB Reactors • Facultative Aerated Lagoon, • Chlorination System, • Sludge Pumping Station, • Filtrate Pumping Station, • Gas Utilisation System, and • Sludge Drying Beds.
UASB Technology The development of the Upflow Anaerobic Sludge Blanket (UASB) reactor dates back from early 1970’s. Pre-sedimentation, anaerobic wastewater treatment and final sedimentation including sludge stabilisation are essentially combined in one reactor making it most attractive high-rate wastewater treatment Alternative. It produces high value by-products viz.
• Treated wastewater usable for gardening purpose or for pisciculture after a simple post treatment,
• Methane enriched biogas having high calorific value is converted into a usable energy resource like heat energy, electricity etc., and
• Mineralised excess sludge produced in UASB reactor for its usage as manure for agricultural purpose.
UASB initially was developed for the anaerobic treatment of Industrial wastewater with a moderate to high COD and BOD concentrations. The basic idea is flocculent or granular sludge developed in the reactor depending on the wastewater characteristics and operational parameters will tend to settle under gravity when applying moderate upward velocities in the reactor. In this way no separate sedimentation basin is necessary. Anaerobic bacteria are developed in the reactor and are kept in the biological reaction compartment for sufficient time. Organic compounds present in the wastewater are absorbed or adsorbed on the sludge particles in the reaction zone during its passage through the sludge bed. Organic compounds there after get anaerobically biodegraded converting it into methane-enriched biogas and a small part into the new bacterial mass. Biogas consists of Methane CH4, Carbon dioxide CO2, Hydrogen H, Hydrogen Sulfide H2S and traces of Ammonia NH3 and Nitrogen N2. This biogas can be used as energy source and for this reason is collected in gas collectors.

Final Report on Water Quality Management Plan for Ganga RiverVolume IV-4, Feasibility Study for Varanasi City, Part I, Sewerage Scheme
2-17
Feed Inlet
Sludge Bed
DeflectorBeam
BiogasCollectorBiogas
Settling Zone
GasCollector
AngleFrame
Stubs
Gas Dome
Gas Pipe
Effluent Launder
Baffle Plate
Feed Inlet Pipe
Feed Inlet Box
A Gas, Liquid and Solids Separator (GLSS) is provided below the gas collectors in order to provide an opportunity to the sludge particles to which Biogas bubbles are attached to lose biogas and settle back into the reaction compartment. In between two gas collectors a settling zone is provided where virtually no gas bubbles are present in the liquid. The sludge particles carried with the wastewater flow are settled in the settling zone and slide down into the biological reaction zone. Wastewater enters the UASB reactor from the bottom and travels through the reactor in the upward direction. In order to ensure sufficient contact between the incoming wastewater and the anaerobic bacterial mass present in the reactor, the wastewater is fed uniformly all over the bottom of the reactor. Further mixing in the reaction zone is achieved by the production of the biogas travelling in the upward direction, settling velocity of the sludge particles and the density currents in the sludge mass. With proper seed material available at the time of Start-Up of the UASB reactor, the microbial population is developed within three months period. Proper care is taken while designing the UASB reactor to absorb estimated shock loads in terms of hydraulic and organic contents in the wastewater. The reactor is having the following zones:
• Gas collection zone • Clarification zone • Sludge blanket zone
The schematic flow diagram of this Alternative is presented in the Figure 2.4. Alternative 4: Facultative Aerated Lagoon followed by Maturation Pond with Chlorination
System Facultative Aerated Lagoons are generally provided in the form of simple earthen basins with inlet at one end and outlet at the other to enable the wastewater to flow through while aeration is usually provided by mechanical means to stabilise the organic matter. The major difference between activated sludge systems and aerated lagoons is that in the latter, settling tanks and sludge recirculation is absent.
Final Report on Water Quality Management Plan for Ganga RiverVolume IV-4, Feasibility Study for Varanasi City, Part I, Sewerage Scheme
2-18
Aerated lagoons are of two principal types depending on how the microbial mass of solids in the system is handled. Facultative Aerated Lagoons are those in which some solids may leave with the effluent stream and some settle down in the lagoon since aeration power input is just enough for oxygenation and not for keeping all solids in suspension. As the lower part of such lagoons may be anoxic and anaerobic while the upper layers are aerobic, the term facultative is used. Aerobic Lagoons, on the other hand, are fully aerobic from top to bottom as the aeration power input is sufficiently high to keep all the solids in suspension besides meeting the oxygenation needs of the system. No settlement occurs in such lagoons and under equilibrium conditions the new (microbial) solids produced in the system equal the solids leaving the system. Thus, the solids concentration in the effluent is relatively high and some further treatment is generally provided after such lagoons. If the effluent is settled and the sludge recycled, the aerobic lagoon, in fact, becomes an activated sludge or extended aeration type lagoon. Facultative type aerated lagoons have been more commonly used the world over because of their simplicity in operation and minimum need of machinery. They are often referred to simply as ‘aerated lagoons’. Their original use came as a means of upgrading overloaded oxidation ponds in some countries without adding to the land requirement. In fact, much less land is required compared to oxidation ponds. Aerated lagoons are generally provided in the form of simple earthen basins with inlet at one end and outlet at the other to enable the wastewater to flow through while aeration is usually provided by mechanical means to stabilise the organic matter. The major difference between activated sludge systems and aerated lagoons is that in the latter settling tanks and sludge recirculation is absent. Depending on how the microbial mass of solids in the system is handled, Aerated lagoons are of two principal types viz.;
• Facultative Aerated Lagoons are those in which some solids may leave with the effluent stream and some settle down in the lagoon since aeration power input is just enough for oxygenation and not for keeping all solids in suspension. As the lower part of such lagoons may be anoxic and anaerobic while the upper layers are aerobic, the term facultative is used. Facultative type aerated lagoons have been more commonly used the world over because of their simplicity in operation and minimum need of machinery.
• Aerobic Lagoons are fully aerobic from top to bottom as the aeration power input is sufficiently high to keep all the solids in suspension besides meeting the oxygenation needs of the system. No settlement occurs in such lagoons and under equilibrium conditions the new (microbial) solids produced in the system equal the solids leaving the system. Thus, the solids concentration in the effluent is relatively high and some further treatment is generally provided after such lagoons.
The schematic flow diagram of this Alternative is presented in the Figure 2.5. (6) Existing STP at Lalpur Discussion with the VDA officials revealed that they have constructed a STP near Lalpur to treat the sewage generated by the residents residing within limits of Lalpur Town Planning Scheme Phase I. The outcome of the survey is as follows:
• The STP is located out side the boundary of the present study • The STP is 1.8 MLD capacity of Facultative Aerated Lagoon with Polishing Pond • At present there is no flow from the STP • The treated effluent is discharged into the irrigation canal located at around 800 m distance
Final Report on Water Quality Management Plan for Ganga RiverVolume IV-4, Feasibility Study for Varanasi City, Part I, Sewerage Scheme
2-19
from the STP site • The irrigation canal merges with River Varuna near Panchkoshi Road • In this 800 m length, VDA has laid sewer for around 300m and for rest of the distance the
VDA has to acquire land. As this STP is located outside the boundaries of this study it is decided not to integrate this STP with the proposed scheme.

Final Report on Water Quality Management Plan for Ganga River Volume IV-4, Feasibility Study for Varanasi City, Part I, Sewerage Scheme
2-20
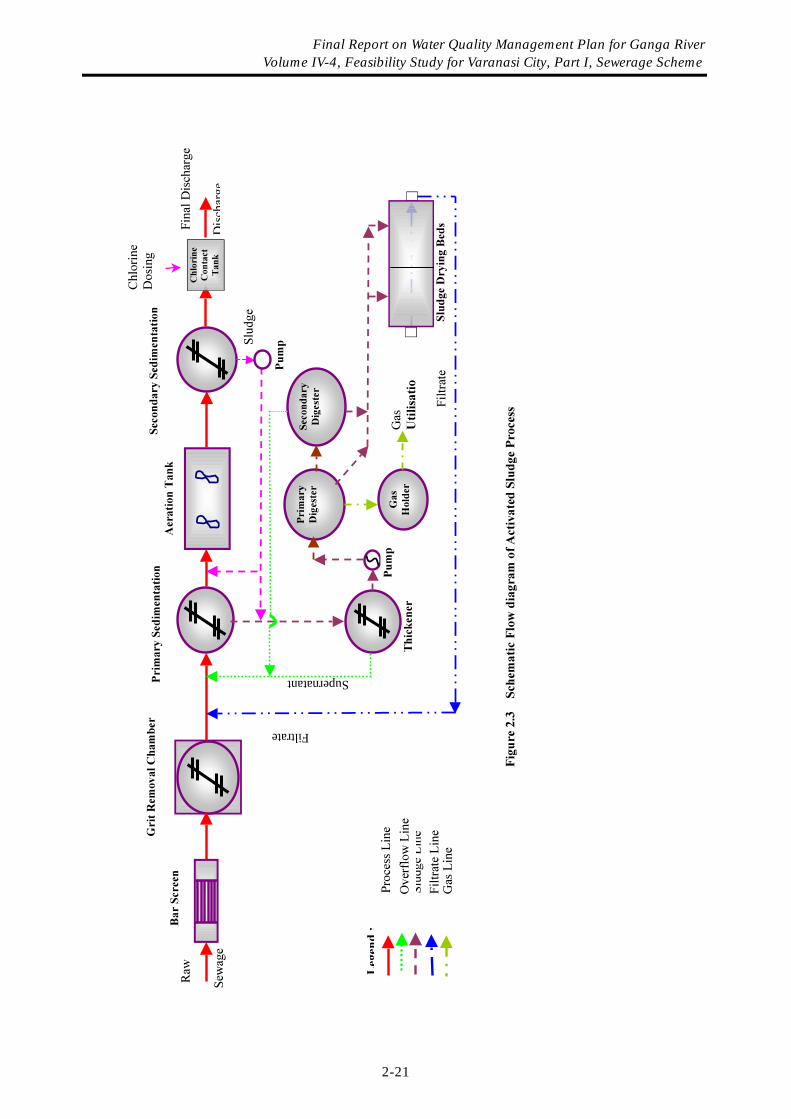
Supernatant
Filtrate
Final Report on Water Quality Management Plan for Ganga River Volume IV-4, Feasibility Study for Varanasi City, Part I, Sewerage Scheme
2-21

Final Report on Water Quality Management Plan for Ganga River Volume IV-4, Feasibility Study for Varanasi City, Part I, Sewerage Scheme
2-22

Final Report on Water Quality Management Plan for Ganga River Volume IV-4, Feasibility Study for Varanasi City, Part I, Sewerage Scheme
2-23
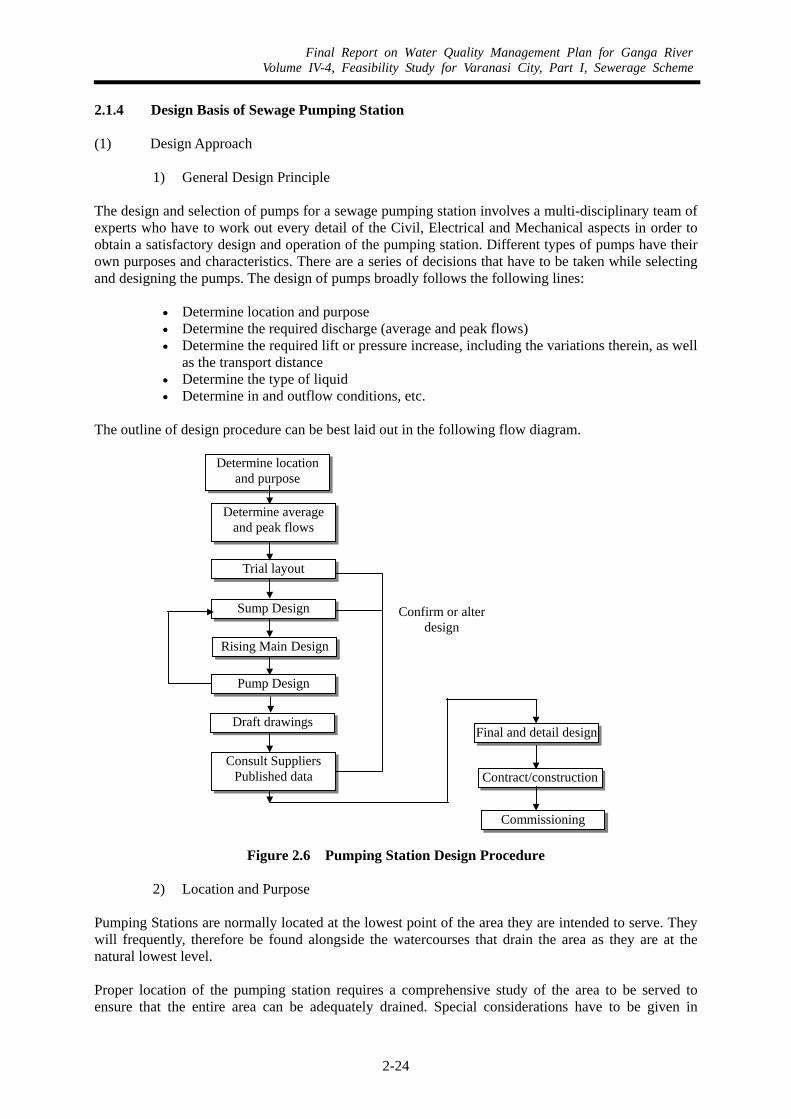
Final Report on Water Quality Management Plan for Ganga RiverVolume IV-4, Feasibility Study for Varanasi City, Part I, Sewerage Scheme
2-24
2.1.4 Design Basis of Sewage Pumping Station (1) Design Approach
1) General Design Principle The design and selection of pumps for a sewage pumping station involves a multi-disciplinary team of experts who have to work out every detail of the Civil, Electrical and Mechanical aspects in order to obtain a satisfactory design and operation of the pumping station. Different types of pumps have their own purposes and characteristics. There are a series of decisions that have to be taken while selecting and designing the pumps. The design of pumps broadly follows the following lines:
• Determine location and purpose • Determine the required discharge (average and peak flows) • Determine the required lift or pressure increase, including the variations therein, as well
as the transport distance • Determine the type of liquid • Determine in and outflow conditions, etc.
The outline of design procedure can be best laid out in the following flow diagram.
Figure 2.6 Pumping Station Design Procedure
2) Location and Purpose Pumping Stations are normally located at the lowest point of the area they are intended to serve. They will frequently, therefore be found alongside the watercourses that drain the area as they are at the natural lowest level. Proper location of the pumping station requires a comprehensive study of the area to be served to ensure that the entire area can be adequately drained. Special considerations have to be given in
Draft drawings
Determine location and purpose
Determine average and peak flows
Trial layout
Sump Design
Pump Design
Rising Main Design
Consult Suppliers Published data
Confirm or alter design
Commissioning
Contract/construction
Final and detail design

Final Report on Water Quality Management Plan for Ganga RiverVolume IV-4, Feasibility Study for Varanasi City, Part I, Sewerage Scheme
2-25
undeveloped or developing areas to the probable future growth, as the location of the pumping station will, in many cases, be determined by the future overall development of the area. The site should also be aesthetically satisfactory. The pumping station shall be located and constructed in such a manner that it will not be flooded at any time. The station should be easily accessible under all weather conditions. In deciding the purpose, one must have first priority for pumping domestic sewage which is the prime purpose of most pumping stations. The pumping station is thus to pump only foul flows, including commercial and trade effluents, from a designated area. "Purpose" would also include a decision, in principal, on screening and grit removal at the pumping station.
3) Determination of Flows Having decided on the location of the pumping station, its purpose and the contributory area, the next stage is to calculate average and peak flows for the present day and a point in the future at a set "design horizon'. Whilst in the structural sense, concrete structures are designed to last for 30-50 years; they are normally sized to deal with the peak flow at a 30-year horizon. The basic step of the existing procedure is therefore to:
• Determine existing population • Extrapolate for development and growth • Derive per capita consumption • Estimate trade flows • Allow for other losses and gains • Estimate peak factor • Produce maximum and minimum design flows
4) Layout
For the layout of pumping stations no overall criteria can be formulated, as local conditions will be of great influence. Generally the layout is the result of a design process in which all the design factors will be taken into account. In general, it can be said that the layout of a pumping station is a logic fit of all functions of the station, with sufficient room to move between machinery for erection and maintenance purposes, but without unnecessary empty spaces neither in a horizontal plane not in vertical direction. In principle, flow lines shall be as short as possible and no unnecessary bends shall be present in the piping. Spaces that may be required are for the following units.
• Inlet chamber • Screen chamber • Main Collection Sump • Valve chamber/ Dry well • Transformer station • Electrical panel room • DG set room • Operations Office
Two type of pump house layout is considered based on type of pumps:
• Dry well and wet well for horizontal centrifugal pumps

Final Report on Water Quality Management Plan for Ganga RiverVolume IV-4, Feasibility Study for Varanasi City, Part I, Sewerage Scheme
2-26
• Wet well and valve chamber for submersible pumps All spaces should be well lighted. Also, outside lighting may be required. Proper railings are required along stairs or on platforms. Sufficient space shall be available for future extension of the station.
5) Pump Sizing Pump sizing is carried out with reference to manufacturer's catalogues, as these are the most reliable guides. Having determined the HP (or kW), the pipe work, solids handling capacity and basic dimensions will be known.
Sump Design
a) Wet Well Capacity of wet well sump is taken considering CPHEEO Manual and NRCD guidelines for submersible and horizontal centrifugal type of pumps. A maximum of 5 minutes detention time at peak flow condition has been considered to size the sump well. There are two basic criteria to be incorporated. • Free fall into the well: governed by the level of the impeller and the invert of the
sewer. • Sufficient space to enable pumps within the well to be removed for maintenance
(submersibles only). In addition to these sizing criteria, the well must be self-cleansing and hence have a shaped base (benching) b) Dry Well/ valve Chamber Sizing of Dry well (for horizontal centrifugal pumps) or Valve chamber (for submergible pumps) has been taken considering common header diameter, fittings, valves, working space and operating space.
6) Rising main Design The concept of rising main design is to meet following criteria:
• The main must be self cleaning with minimum flows • Velocities shall not be excessive with design peak flows • Techno-economic diameter of rising main is calculated considering capitalised cost of
pumps and rising main for 15 years (2) Technical Evaluation for Selection of Pumps
1) General Sewage pumps are used to lift liquid wastes from one level of the Collection System to another (as in the case of Intermediate Pumping Stations) or to the treatment plant for treatment (as in the case of Main Pumping Stations). Even though the sewage is normally screened at larger installations before entering the suction wet well, it still contains a large quantity of problem materials, such as rags, jute bags, fiber and plastic pouches, which find their way through the coarse screens. This is typical for Indian Conditions. A

Final Report on Water Quality Management Plan for Ganga RiverVolume IV-4, Feasibility Study for Varanasi City, Part I, Sewerage Scheme
2-27
sewage pump shall be reliable, unchokable and accessible for quick maintenance, be robust and wear resisting. Some measure of overall efficiency may have to be sacrificed to secure these properties and safety features. The type of pump to be installed at each pumping station shall be judged on its technical merits in relation to the rate of pumping, the total head, the physical composition of the sewage, septicity and preliminary treatment before pumping. Pumps may be classified on the basis of the purpose or the application they serve, the material of construction, the liquids they handle, and even their orientation in the space. A more basic system of classification is to categorize the pumps on the principle by which the energy is supplied to the pump. Under this system, all pumps may be divided into two major categories. Dynamic, in which energy is continuously added to increase the fluid velocities within the machine to values in excess of those occurring at the discharge such that subsequent velocity reduction within or beyond the pump produces a pressure increase. Displacement, in which energy is periodically added by application of force to one or more movable boundaries of any desired number of enclosed, fluid containing volumes, resulting in a direct increase in pressure upto the value required to move the fluid through valves or ports into the discharge line. Dynamic pumps may be further sub-divided into several varieties of Centrifugal Pumps and other special-effect pumps, like Jet Pumps and Hydraulic Ram Pumps etc. Displacement Pumps are essentially divided into Reciprocating Pumps and Rotary pumps. Reciprocating Pumps are suitable for applications where the required capacity is expected to be virtually constant over a wide range of system head variations. Another factor that has to be taken into consideration is that the output from the reciprocating pumps is pulsating. Where this is objectionable, Rotary pumps are preferred over the Reciprocating Pumps. However the application of Rotary Pumps is limited to low to medium pressure ranges. In India, for sewage pumping application Centrifugal Pumps are in use. A centrifugal pump consists of a set of rotating vanes, enclosed within a housing or casing and used to impart energy to a fluid through centrifugal force. Thus, stripped of all the refinements, a centrifugal pump has two main parts.
• A rotating element, including an impeller and a shaft • A stationary element made up of a casing, stuffing box, and bearings.
In this type of pump, atmospheric pressure or other pressure, into a set of rotating vanes, forces the liquid. These vanes constitute an impeller, which discharges the liquid at its periphery at a higher velocity. This velocity is converted into pressure energy by means of a volute or by a set of stationary diffusion vanes surrounding the impeller periphery. Pumps with volute casings are called Volute Pumps, while those with diffusion vanes are called Diffuser Pumps. Depending on the location of motor with respect to the pump, Centrifugal Pumps can be divided into two types, namely the Conventional Centrifugal Pumps and the Submersible Centrifugal Pumps. The broad classification of the commonly used pumps is shown in the following chart.

Final Report on Water Quality Management Plan for Ganga RiverVolume IV-4, Feasibility Study for Varanasi City, Part I, Sewerage Scheme
2-28
Figure 2.7 Pump Classification
2) Conventional Centrifugal Pumps
A Conventional Centrifugal Pump is more specifically described as an end-suction, volute-type, with an overhung impeller of either the Non-clog or the Radial Flow Type or the Mixed Flow Type Pump. The installation of Conventional Centrifugal Pump requires considerable length of drive shafting. The addition of this shafting, of the many line bearings, and of an external lubrication system represents a major portion of the total installed cost. Furthermore, power losses increase rapidly due to elongation of shafts. Conventional Centrifugal Pumps operate within a dry well adjacent to the wet well. The pumps are connected with the wet well through a suction line (Figure 2.8). One of the major drawbacks with these pumps is that they generally do not work with any suction lift. Instead they need a suction head or minimum submergence for trouble free pumping. Therefore, it is always advisable to install these pumps at such a level that the impeller or the volute of the pump is positioned below the low water level of the wet well to ensure a positive suction or prime.
3) Submersible Centrifugal Pumps Submersible Centrifugal Pumps are based on Modern developments and have integral motors with special seals suitable for operation below liquid level. The pump, along with the motor, is submerged into the wet well and does not need a dry well for installation (Figure 2.9). The pumps are fitted with Semi-open type of Impellers Cutting and Tearing Contra-Block System, which efficiently handles jute bag pieces, long fibers, plastic bags & pouches, cigarette buts, solid admixes etc. present in the typical Indian Sewage. Submersible Centrifugal Pumps eliminate the need for extended shafting, shaft couplings, a stuffing box, a sub-surface motor stand, and an expensive dry well. Submersible Centrifugal Pumps are available with closed coupled submersible motors. The pumps are supported by guide rails, which make it possible to lower and lift the pumps by means of a chain hoist. During this operation, the discharge is connected and disconnected without dewatering the wet well. Motors for this type of pump are hermetically sealed, employing a double mechanically sealed oil
Pumps
Dynamic Displacement
Jet Reciprocating
Hydraulic Ram Rotary
Centrifugal
Conventional Submersible

Final Report on Water Quality Management Plan for Ganga RiverVolume IV-4, Feasibility Study for Varanasi City, Part I, Sewerage Scheme
2-29
chamber with moisture sensing probe to detect any influx or conductive liquid past the outer seal. Due to their inherent advantages over Conventional Centrifugal Pumps, Submersible Centrifugal Pumps have been popular all over the world, for pumping municipal wastewater. Over the past 10 years, the application of Submersible Centrifugal Pumps has become very popular in India, for pumping municipal wastewater and is replacing Conventional Centrifugal Pumps.
Figure 2.8 Schematic of Conventional Centrifugal Pump
Figure 2.9 Schematic of Submersible Centrifugal pump
A Technical Evaluation has been carried out for selection of pumps. For this purpose, Conventional Centrifugal Pumps and Submersible Centrifugal Pumps have been compared.
4) General Comparison of Conventional Centrifugal Pumps and Submersible Centrifugal Pumps
The Conventional Centrifugal Pumps and Submersible Centrifugal Pumps have their own advantages and disadvantages. The merits and demerits of both types can be summarized as given below in Table 2.12.

Final Report on Water Quality Management Plan for Ganga RiverVolume IV-4, Feasibility Study for Varanasi City, Part I, Sewerage Scheme
2-30
Table 2.12 Comparison between Conventional Centrifugal Pump vs. Submersible Pumps
Sr. Parameter Conventional Centrifugal Pumps Submersible Centrifugal Pumps 1 Civil Structure to
house the pumps Superstructure is needed for protection of motors and therefore these pumps require a dry well in conjunction with a wet well (sump). Sectional view of a Pumping Station with Conventional Centrifugal Pumps has been given in Figure 2.8
Both pump and motor are installed in the wet well. This saves substantial space and brings about significant saving in the civil engineering costs. Sectional View of a Pumping Station with Submersible Centrifugal Pumps has been given in Figure 2.9
2 Land Requirements Require more space Require very little space 3 Piping Extended Shorter 4 Column Pipes Required Not required 5 Suction Pipes Required Not required 6 Discharge Pipes Required Required 7 Delivery Piping and
Common Header The Conventional Centrifugal Pumps require column assembly
In case of Submersible Centrifugal Pumps, the discharge pipes of all pumps can be terminated at the common header, which is installed in a shallow valve chamber just adjacent to the Collection Sump
8 Solid Handling Capacity
Lower (80 mm) Higher (100 mm and above)
9 Weight of Pumps Heavy Relatively much lighter 10 Lubrication Special attention is required for
lubricating lines of intermediate bearing support and further design is required to check intermediate floor for bearing supports, etc.
No such attention required. Further, the supports required for the intermediate bush bearings is also not applicable
11 Vibrations and Noise Large column lengths always cause vibrations and motor mounted on top causes noise pollution. The vibrations are also due to their heavy weight
Submersible Centrifugal Pump being a mechanically robust mono-block unit where impeller is mounted on the motor shaft which is supported by two sturdy bearing, ensures a mechanically robust design which in turn results in vibration free performance of the pump and further whatever vibrations that still remain, are damped because the pump is submerged in sewage
12 Starts and Stops Capable of less stops and starts per hour (4 to 5) and hence requires more hydraulic retention time (5 minutes at peak flow) for wet well
Capable of relatively more starts and stops per hour (8 to 10). This results in reducing the hydraulic retention time (3.75 minutes at peak flow) of the sump, ensuring the compactness of wet sump itself.
13 Impeller The Conventional Centrifugal Pumps are normally offered with closed impeller having both front and back shrouds. This type of impeller is not suitable for Indian sewage, which has solids like plastic bags & pouches and jute fibre. Choking and clogging of impeller is quite frequent
Submersible Centrifugal Pumps are fitted with specially designed and specially shaped single/double vane impeller of open type with Contra-Block Cutting system. These two combined features make this pump truly non-clogging and therefore substantially more reliable under Indian conditions
14 Motor In a Conventional Centrifugal Pump, the Squirrel Cage Induction Motor is the Prime Mover, which is coupled
In a Submersible Centrifugal Pump, the Squirrel Cage Motor is an integral part of the pump and fitted with a

Final Report on Water Quality Management Plan for Ganga RiverVolume IV-4, Feasibility Study for Varanasi City, Part I, Sewerage Scheme
2-31
Sr. Parameter Conventional Centrifugal Pumps Submersible Centrifugal Pumps with the pump by means of a Rigid or Flexible Coupling
Aluminum Die Cast Rotor. This totally enclosed motor is equipped with sealing features to permit operation while submerged in a specified medium at a specified depth.
15 Electrical Cabling and Control Panels
Since Conventional Centrifugal Pumps offer substantially reduced kilowatt consumption, the ampere consumption also reduces, resulting in reduction in size of motor cabling, length of cabling, reduction in capacity of transformer & generator set.
Cabling and Control Cabling is extended.
16 Installation and Removal
Installation and removal is cumbersome since the assembly is on a foundation and each pump has to be specially removed and then lifted
The pump installation and removal are automatic, without having to enter into the sewage pit. Guide Rail System and guide pipe are provided to facilitate the Automatic Coupling of the pump
5) Operation and Maintenance Aspects Operation and Maintenance is an important aspect to be considered while selecting the type of pumps. It is therefore, necessary to consider ease of installation and removal, materials of construction, safety features and frequency of lubrication etc. as important parameters. In case of Conventional Centrifugal Pumps, the changes of frequent clogging of impeller are more due to its Closed Type Design and Lower Solid Handling Capacity. Also, due to presence of Line Shaft Bearings, there is a need of frequent lubrication. There is more wear and tear of glands and other parts due to extended shafts. It is not easy to install and remove these pumps because of their heavy weight and manual fixing onto the foundation. In case of Submersible Centrifugal Pumps, due to their Semi-Open Type Impeller, clogging is less frequent. Furthermore, the special Contra-Block Cutting and Tearing System provides on the suction side of the pump facilitates disposing off soft materials like plastic pouches, small jute pieces, which is very typical of Indian sewage. Pump bearings are of Anti-Friction Type and are maintenance free and are grease lubricated for long life. The bearings are capable of taking normal thrust loads due to unbalanced hydraulic loads on the impellers. The maintenance of Submersible Centrifugal Pumps is comparatively less because there are no line shaft bearings, which need reliable lubrication and periodic replacement. Only mechanical seal of this type of pump may need replacement after certain working hours, thereby reducing the maintenance cost substantially. Selecting a pump with less moving parts and low RPM reduces wear and tear of parts and ensures trouble and maintenance free operations. Submersible pumps offer state of the art technology in pump protection ensuring trouble free operation in toughest applications. The salient operation and maintenance features of Conventional Centrifugal Pumps and Submersible Centrifugal Pumps are given in Table 2.13.
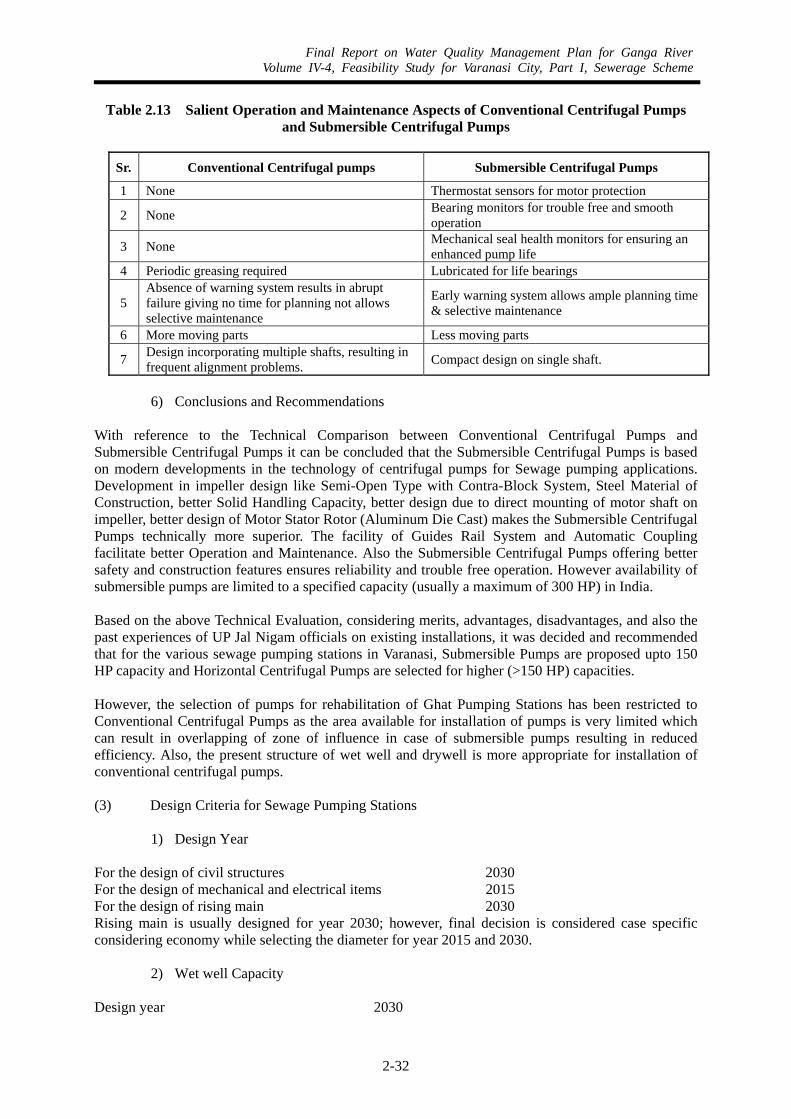
Final Report on Water Quality Management Plan for Ganga RiverVolume IV-4, Feasibility Study for Varanasi City, Part I, Sewerage Scheme
2-32
Table 2.13 Salient Operation and Maintenance Aspects of Conventional Centrifugal Pumps and Submersible Centrifugal Pumps
Sr. Conventional Centrifugal pumps Submersible Centrifugal Pumps
1 None Thermostat sensors for motor protection
2 None Bearing monitors for trouble free and smooth operation
3 None Mechanical seal health monitors for ensuring an enhanced pump life
4 Periodic greasing required Lubricated for life bearings
5 Absence of warning system results in abrupt failure giving no time for planning not allows selective maintenance
Early warning system allows ample planning time & selective maintenance
6 More moving parts Less moving parts
7 Design incorporating multiple shafts, resulting in frequent alignment problems. Compact design on single shaft.
6) Conclusions and Recommendations
With reference to the Technical Comparison between Conventional Centrifugal Pumps and Submersible Centrifugal Pumps it can be concluded that the Submersible Centrifugal Pumps is based on modern developments in the technology of centrifugal pumps for Sewage pumping applications. Development in impeller design like Semi-Open Type with Contra-Block System, Steel Material of Construction, better Solid Handling Capacity, better design due to direct mounting of motor shaft on impeller, better design of Motor Stator Rotor (Aluminum Die Cast) makes the Submersible Centrifugal Pumps technically more superior. The facility of Guides Rail System and Automatic Coupling facilitate better Operation and Maintenance. Also the Submersible Centrifugal Pumps offering better safety and construction features ensures reliability and trouble free operation. However availability of submersible pumps are limited to a specified capacity (usually a maximum of 300 HP) in India. Based on the above Technical Evaluation, considering merits, advantages, disadvantages, and also the past experiences of UP Jal Nigam officials on existing installations, it was decided and recommended that for the various sewage pumping stations in Varanasi, Submersible Pumps are proposed upto 150 HP capacity and Horizontal Centrifugal Pumps are selected for higher (>150 HP) capacities. However, the selection of pumps for rehabilitation of Ghat Pumping Stations has been restricted to Conventional Centrifugal Pumps as the area available for installation of pumps is very limited which can result in overlapping of zone of influence in case of submersible pumps resulting in reduced efficiency. Also, the present structure of wet well and drywell is more appropriate for installation of conventional centrifugal pumps. (3) Design Criteria for Sewage Pumping Stations
1) Design Year
For the design of civil structures 2030 For the design of mechanical and electrical items 2015 For the design of rising main 2030 Rising main is usually designed for year 2030; however, final decision is considered case specific considering economy while selecting the diameter for year 2015 and 2030.
2) Wet well Capacity
Design year 2030

Final Report on Water Quality Management Plan for Ganga RiverVolume IV-4, Feasibility Study for Varanasi City, Part I, Sewerage Scheme
2-33
Detention time of wet well at peak flow 5 minutes for horizontal centrifugal pumps 3.75 minutes for submersible pumps
3) Dry Well/ Valve Chamber Size
Based on number of pumps and clear spacing requirement for pumps, pumps dimension, valves, fittings and working space requirement.
4) Rising Main The pump capacity together with rising main diameter should be calculated considering pump cost, rising main cost and annual operation & maintenance cost. Lesser diameter rising main may be cheaper in initial cost but the operation cost may be more due to increased pump head. The most economical size of the pumping main should be selected after analysing following factors:
• The different diameter of pipes for different head losses, which can be considered for the quantity of sewage, intended to be transported.
• The design period and the quantum of flow to be carried out for design period. • The pipe and its relative cost including cost of laying and jointing. • The cost of pump and its installation against the various diameters of pipes. • The annual and capitalised cost of electric charges. • Minimum required velocity (scouring) in pipeline (should be 0.6 m/sec) during non-peak
condition. • Maximum allowable velocity in pipe line (should not more than 2.0 m/sec)
5) Pumps
Design year: 2015 Number of pumps:
A) For small capacity plant i) When rising main is long a) 3 nos. pumps of Half Peak Flow b) 2 nos. pumps of Non Peak Flow ii) When rising main is short a) 5 nos. pumps of One fourth Peak flow B) For large capacity plant equal capacity pumps (6 to 8) + 50% standby on peak flow Above criteria for selection of pumps is basic guideline. Final decision on pump configuration is taken based on availability of pump capacity in market. Pump capacity in kW 9.81 * H * Q/ (Ep * Em) Where H = working pressure, m Q = pump discharge, m3/sec Ep = Pump efficiency Em = Motor efficiency Electric charges Rs. 3.25 per unit Capitalised energy charges CC = CR *{ [ 1 – (1+r) ^ (-n)]/ r } Where CR = annual energy charges n = period in years = 15 r = rate of interest = 10% For n=15 & r=10%; CC=7.61 CR

Final Report on Water Quality Management Plan for Ganga RiverVolume IV-4, Feasibility Study for Varanasi City, Part I, Sewerage Scheme
2-34
6) Screens & Screen Channel
Screening of incoming wastewater is required for the removal of large floating materials, which can damage the pumps. This will be carried out in two stages, viz. 40 mm opening manually cleaned bar screen followed by a 20 mm opening mechanically cleaned bar screen.
Design year 2030 Standby Units 50 % (normally) Stage - I Clear spacing between screen bar 40 mm Thickness of screen bar 10 mm Type of working screens Manual screen Stage - II Clear spacing between screen bar 20 mm Thickness of screen bar 10 mm Type of working screens Mechanical screen Type of standby screen Manual screen Minimum Approach velocity @ avg. flow 0.3 m/sec Minimum velocity through screens 0.6 m/sec Maximum velocity through screens 1.2 m/sec 7) Electrical Load capacity
Main Transformer and other electrical equipments are designed for peak flow electrical load requirement.
8) Standby Power Supply Source In case of electrical power failure, Diesel Generator set of peak flow load capacity is proposed for sewage pumping station with auto exchanger arrangement from grid power to DG power. 2.2 PROVISIONS FOR DISTRICT I 2.2.1 Planning Scheme The following Table summaries the existing, sanctioned and proposed priority facilities in District I.
1) Existing Major Sewage Facility a) Old trunk sewer b) Five Ghat pumping stations: located along the left bank of the Ganga River c) Konia Main pumping station and rising main to Dinapur STP d) Dinapur STP (80 mld)
2) Sanctioned Facility a) Increase pumping capacity at Harishchandra and Trilochan SPS b) Provide new Ghat interceptor sewers to Trilochan SPS
3) Proposed Facility for Priority Project a) Rehabilitation of old trunk sewer b) Ghat pumping stations upgrades c) Renovation and rehabilitation of Dinapur STP d) Renovation and rehabilitation of Konia MPS
Final Report on Water Quality Management Plan for Ganga RiverVolume IV-4, Feasibility Study for Varanasi City, Part I, Sewerage Scheme
2-35
2.2.2 Inspection, Cleaning and Rehabilitation of Old Trunk Sewer (1) Background Sewer systems are an important part of infrastructure and play an essential part of maintaining public health. Yet they are largely out of sight and in the past this has often been a cause of neglect, leading to sewer flooding, pollution, collapse and blockage. A sewer normally fails to receive attention till it starts giving serious trouble. First sewerage system for Varanasi city was commissioned in 1917 which was designed for a population of 0.20 millions. The works included laying of a main brick sewer from Assi to Rajghat, which comes under Central city sewerage zone. It starts from Assi area and runs parallel to the bank of River Ganga, passing through heavily built up area to Church crossing and onwards along Nai Sadak to Benia, Kabir Chauraha, Maidagin and Rajghat, after which it discharges into the river Ganga at about 0.50 km down stream of rail cum- road bridge, now known as Malviya bridge. Sewer alignment of this existing trunk sewer passes through the built-up areas at certain places Various measures were taken under Ganga Action Plan (Phase 1) for the pollution abatement of holy river Ganga in which old trunk sewer plays an important part. Following major schemes which involves old trunk sewer as an integral part were executed under GAP-1:
a) Out of the 12 nala/ drains along the Ganga River, 8 nala/ drains namely, Shiwala Drain, Harishchandra Ghat Drain, Mansarovar Drain, Dr. R.P. Ghat Nala, Jalesan Drain, Sankatha Ghat, Trilochan Ghat Drain and Telia Nala were intercepted at their tail ends and diverted to the Old Trunk sewer by pumping the sewage water flowing into the drains.
b) The main trunk sewer was intercepted near Rajghat by providing a special manhole with diversion gates to divert the sewage flow (maximum 130 mld) to Konia pumping station. Out of the 130 mld flow, 80 to 100 mld is pumped to Dinapur Sewage Treatment Plant and the remaining 30 to 50 mld is discharged into Varuna river after pre-treatment.
The Old Trunk Sewer is the main lifeline of the sewerage system of the Varanasi and it cannot be dispensed with or abandoned. Maximum carrying capacity of the trunk sewer is around 130 mld and is presently running with overloaded capacity resulting in surcharge/ overflow conditions during peak hours. Trunk relief sewer was planned and is under execution (GAP-II) in the central sewerage zone to relieve the flow in main trunk sewer as well as to carry the flow of sub central sewerage zone. There has been subsidence in the past on the trunk sewer, which is a warning that due to the aging effect the sewer may collapse anywhere any time, which may dislocate the city life with a total chaos. Considering the importance of existing Old Trunk Sewer as a part of overall sewerage system of Varanasi, the woks of inspection, cleaning and rehabilitation of the Old Trunk Sewer an urgent should be proposed as one of urgent components Feasibility Study. (2) Basics of Sewer Rehabilitation Plan Sewers are one infrastructure investment that most communities would like to install and forget. And with good reason, with good design and installation many sewers are trouble free for many years. Sewers are constructed of many different materials. These, typically, included brick, precast or cast in place concrete, vitrified clay, plastic. Sewers are not however indestructible. Over time heavy earth and traffic loads, corrosion from chemicals and sewer gasses, and loss of supporting soil weaken the pipe. The traditional method for repairing a failed sewer is excavation and replacement. This may be done at a single point of failure (point repair) or long lengths of failed sewer may be replaced. Excavation is often expensive and can be extremely disruptive to traffic and pedestrians. Excavation
Final Report on Water Quality Management Plan for Ganga RiverVolume IV-4, Feasibility Study for Varanasi City, Part I, Sewerage Scheme
2-36
can also be dangerous, and worker safety is always an issue. Excavation can become impossible due to unplanned development of the town and congestion and inaccessibility of the sites as a result of this. In such situation trench less rehabilitation becomes the only viable option. Some communities are rehabilitating their sewers because of continued maintenance problems. An ongoing rehabilitation programme helps minimize catastrophic failures by identifying and systematically rehabilitating at risk sewers. This controlled rehabilitation reduces disruption of the services and inconvenience to citizen through planning, preparation, scheduling, advanced funding, and design. The procedure followed for any rehabilitation plan is divided into three main stages as described below: Stage 1: Initial Planning This is an initial (preliminary) investigation to collect the preliminary data and to establish the extent and type of problems in the drainage area (trunk sewer) and to plan the approach for the diagnostic study. Stage 2: Diagnostic Study (Inspection Programme) This is the detailed investigation stage, which is further subdivided into a number of diagnostic studies, the details of each study will therefore depend on the nature of the problems identified during the initial planning (preliminary investigation) stage. There are many methods and procedures, and it is necessary to consider their limitations in selecting among them. The combination of two or more methods usually provides sufficient information for making a cost effective evaluation. The investigation methods are decided on the basis of the initial study (planning).
a) Closed Circuit Television (CCTV) Inspection
CCTV or man entry inspection is required for thorough internal pipe and appurtenant inspection. The pipe size or internal dimensions that permit in –pipe observation are as follows: Upto 900 mm diameter CCTV inspection Above 900 mm diameter Man entry inspection and CCTV The CCTV inspection technique has been further enhanced in to techniques like Sewer Evaluation Technique (SET) with the help of modern electronics and computers. This helps in categorizing the sewers through a grading plan outlined in the WRc’s Sewer Rehabilitation Manual, which forms the basis for systematic rehabilitation of sewers. The sewers are graded in to five distinct categories with Grade 1 as satisfactory and Grade 5 as collapsed or imminent collapse with other stages in between. b) Ground Water Monitoring Groundwater depths and normal fluctuations shall be identified along pipeline alignments. This information is necessary for determining groundwater infiltration and its impact on field investigations and any subsequent rehabilitation/ replacement project activity. c) Flow Measurement The objective of a flow-monitoring programme is to quantify the magnitudes of flow occurring in the pipeline. Quantification of dry and wet weather flow along the sewer

Final Report on Water Quality Management Plan for Ganga RiverVolume IV-4, Feasibility Study for Varanasi City, Part I, Sewerage Scheme
2-37
length could be important in making flow diversion plan and in identifying the major problem of concern. d) Soil investigation Soil investigation along the sewer alignment could be important in deciding the rehabilitation methods and material. e) Ground surface condition Driving and/or walking the pipeline route provide the above ground information for determining certain geological or surface conditions. Features above ground, which may affect the sewer system, include swales, surface drainage, types and volume of traffic etc. f) Waste water analysis
Sampling and analysis of wastewater flowing through the sewer line may provide important information about corrosiveness, gas contents (methane, hydrogen sulphides) and other factors important in selecting the rehabilitation material. g) Structural Assessment
This is carried out through Non-destructive techniques (NDT) like SONAR, rebound hammer, geo-physical imaging etc. These investigations and grading/ evaluation assist in selection of rehabilitation philosophy based on WRc Manual. The Philosophies for trenchless rehabilitation are divided in to Type I- Composite, Type- Standalone, Type III- Non-structural liners.
Stage 3: Implementation (Rehabilitation) The final stage of the procedure involves the implementation of the rehabilitation plan, operation of the system in accordance with the operation and maintenance plan, and the long term monitoring of the system. Trenchless Rehabilitation has following advantages:
• Non-disruptive • Fast • Environment/ Eco- friendly • Use of advanced materials resulting in increased service life • Improved hydraulic efficiency if used in proper manner • Does not need additional space for laying of additional utility (especially significant in
congested cities) Limitations:
• Costly if only direct costs are accounted for • Reduction in CSA/ Carrying capacity if not used properly • Dependant on foreign technology/ manpower/ inputs
Each stage is further divided into phases and steps. The interrelation of each phase and individual step is shown in the detailed flow diagram below (Figure 2.10). Rehabilitation Methods and Material The selection of rehabilitation methods and materials depends on an understanding of the specific

Final Report on Water Quality Management Plan for Ganga RiverVolume IV-4, Feasibility Study for Varanasi City, Part I, Sewerage Scheme
2-38
problems to be corrected. It is also important to evaluate external as well as internal factors before a decision can be made on the methods and materials that will most effectively solve the problem. The effects of the pipe zone soil structure and groundwater conditions are essential considerations in the analysis of pipeline rehabilitation. Groundwater can rise and fall, creating a soil pumping action adjacent to the leaking or failing pipe. The movement of groundwater can affect the soil around the pipeline. The soil type and grain size can impact the rate of this soil pumping action and its effects on the pipeline. Soil structure and groundwater conditions also greatly influence the feasibility of certain methods or materials. Other factors, which significantly influence the choice of methods and materials, are:
• Accessibility • Magnitude of flows • Available bypassing or rerouting flows • Mechanism of failure or problem • Type and magnitude of problem • Rights-of-way • Lateral connections • Length and size of pipe(line). • Need for up-sizing
The best rehabilitation procedure chosen for a pipeline repair is the one that taken into account all of these conditions, and meets the parameters for solving the entire problem.
1) Methods and Materials for sewer rehabilitation The various available internal and external rehabilitation options are tabulated below.
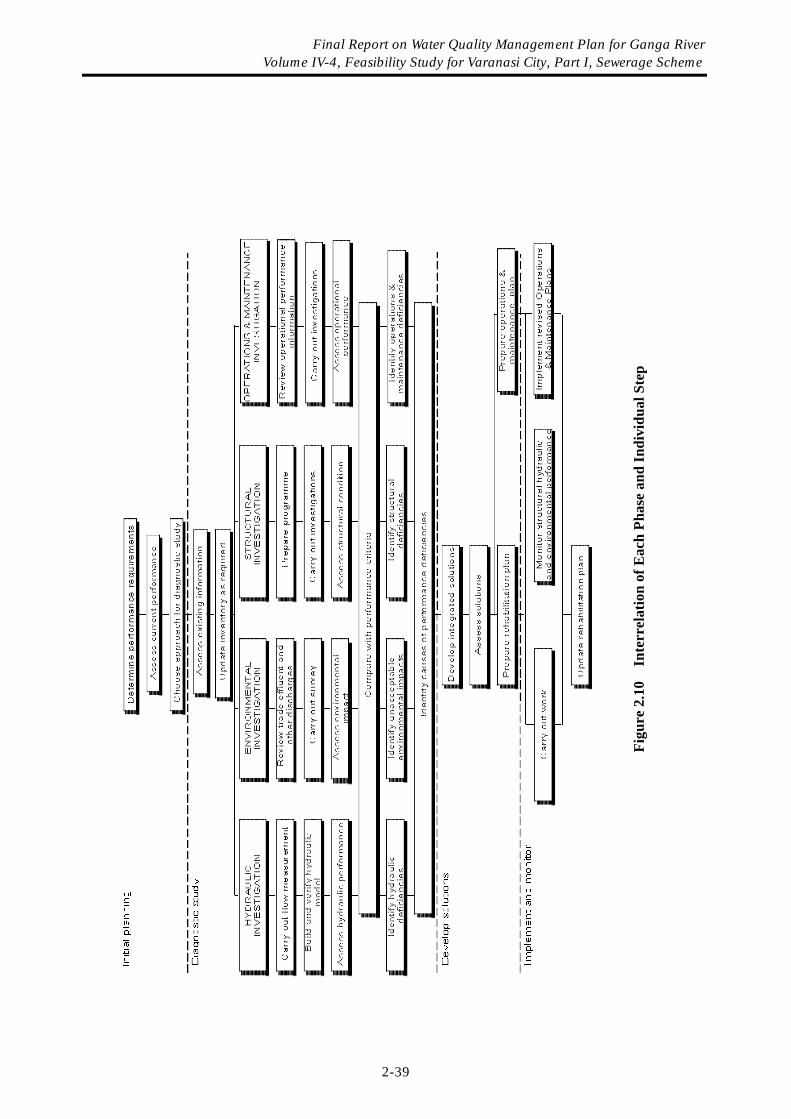
Fi
gure
2.1
0 I
nter
rela
tion
of E
ach
Phas
e an
d In
divi
dual
Ste
p
Final Report on Water Quality Management Plan for Ganga River Volume IV-4, Feasibility Study for Varanasi City, Part I, Sewerage Scheme
2-39

Final Report on Water Quality Management Plan for Ganga RiverVolume IV-4, Feasibility Study for Varanasi City, Part I, Sewerage Scheme
2-40
Table 2.14 Sewer Rehabilitation Options
Rehabilitation
Option Principal Advantages Principal Disadvantages Diameter Range
A. Pipeline Preparation
Cleaning Increases effective capacity May resolve localized problems
May cause damage. May become a routine requirement and add enormously to the O&M cost
All
Root Removal May increase effective capacity May resolve localize problems
Problem likely to recur Does not address the cause of the problem and may be unable to ensure structural repairs
All
B. External
External Grouting Improves soil conditions surrounding Difficult to assess effectiveness Can be costly
All
C. Internal
Internal Grouting Seals leaking joints and minor cracks Prevents soil loss Moderate cost and causes minimal disruption Can reduce infiltration Can include root inhibitor
Infiltration may find other routes of entry Existing sewer must be structurally sound
All
Short Pipe (PSE, PB, PVC, RPM, FRL, DI, Steel)
High strength-to-weight ratio Variety of cross section can be manufactured Minimal disruption
Some materials easily damaged during installation Larger pipes may require stage grouting. External lateral connection
150mm to 3000mm
Cured-in-place pipe Rapid installation No excavation Accommodates bends and minor deformation Maximizes capacity Grouting not required Internal lateral connection
Full bypass pumping necessary High set-up costs on small projects Chemical process can be severely affected by tropical and hot climate hence not recommended for large diameter and longer length than those could be handled within the setting time
150mm to 1000mm (in general)
Deformed Pipe
a) U-Liner/Nu-Pipe Rapid installation Continuous pipes Maximizes capacity No excavation Grouting not required Internal lateral connection
Relies on existing pipe for installation support
150mm to 600mm
b) Swage Lining /Roll Down
Rapid installation Maximizes capacity Minimal excavation Grouting not required Internal lateral connection
Relies on existing pipe for installation support
150mm to 600mm
Spiral Wound Pipe
a) Danby/ Rib-Loc Tailor-made inside the conduit. No excavation required External lateral connection Maximizes capacity Non-circular available
Joints rely on sealants Relies on existing pipe for Support Required careful grouting of annulus Large diameter requires person entry
300mm to 3000mm
b) Coatings Connections easily accommodate Zero/minimal excavation Variety of cross sections possible
Difficult to supervise May be labor intensive Control of infiltration required
150mm to 800mm
c) Mechanical Sealing
Seals leaking joints and minor cracks Prevents soil loss Low cost and causes minimal disruption
Infiltration may find other routes of entry Existing sewer must be structurally
Person- entry only

Final Report on Water Quality Management Plan for Ganga RiverVolume IV-4, Feasibility Study for Varanasi City, Part I, Sewerage Scheme
2-41
Rehabilitation Option Principal Advantages Principal Disadvantages Diameter
Range Can reduce infiltration sound
Suitable for person entry sewers only
d) Spot (Point) Repairs
Deals with isolated problems Requires excavation for small conduits May require extensive work on brick sewers
All
Pipe Linings a) Reinforced Shotcrete Placement
Variety of cross section possible Requires person entry – may be labor intensive Lacks corrosion resistance
1000mm and larger
b) Segmented Linings High strength-to-weight ratio Variety of cross section can be manufactured Minimal disruption
Some materials easily damaged during installation May require temporary support during routing Labor intensive Requires person entry
36" and larger
c) Continuous Pipe (Fusion-welded Polyethylene / Polybutyline / Polypropylene)
Quick insertion Large-radius bends accommodated
Circular cross section only Insertion trench disruptive High loss of area in smaller sizes Less cost effective where deep External lateral connection
150mm to 600mm due to availability of the pipes only in this range in India
Trenchless Replacement a) Pipe Bursting Can replace a variety of materials
Not dependent on condition of existing conduit Size for size or size increase
Potential damage to adjacent laterals Full bypass pumping required Only suitable for brittle pipes Body connections to existing pipes are difficult to handle requiring robotic cutting
100mm to 600mm existing pipe
Conventional Replacement a) Open Cut Removes all problems in length
Traditional designs Expensive, particularly if deep Disruptive
All
2) Manhole Rehabilitation
Manholes are rehabilitated to correct structural deficiencies, to address maintenance concerns, and to eliminate extraneous flows. Manhole rehabilitation may also minimize or prevent corrosion of the internal surface caused by sulfuric acid formed when hydrogen sulfide gas is released from the sewerage into the sewer environment. Many methods to rehabilitate Manhole are currently available. New products and application technologies are continually being developed. The evaluation of each method should consider:
• The type or types of problem • The physical characteristics of the structure such as the construction material • The condition and age • The location of the manhole with respect to traffic and accessibility • The risk of damage or injury associated with the current condition of the structure • The cost/value in terms of rehabilitation performance
The rehabilitation of Manholes can be divided into the following methods.
• Chemical grouting • Coating systems
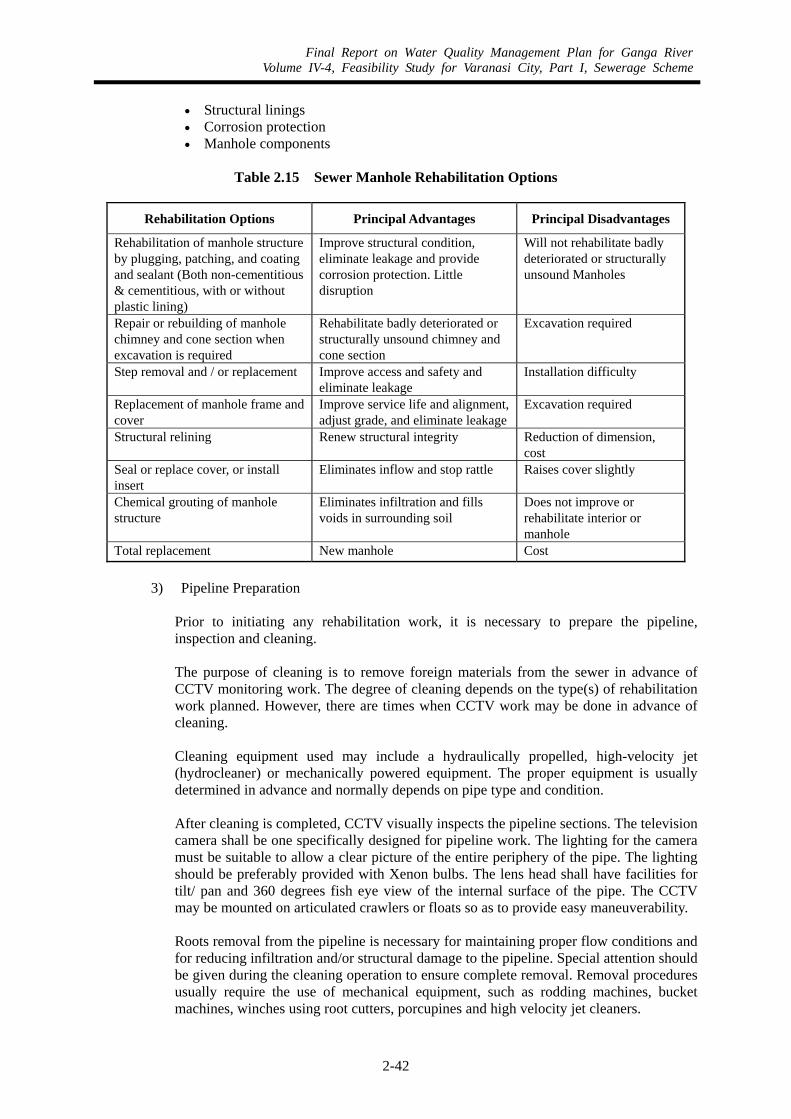
Final Report on Water Quality Management Plan for Ganga RiverVolume IV-4, Feasibility Study for Varanasi City, Part I, Sewerage Scheme
2-42
• Structural linings • Corrosion protection • Manhole components
Table 2.15 Sewer Manhole Rehabilitation Options
Rehabilitation Options Principal Advantages Principal Disadvantages
Rehabilitation of manhole structure by plugging, patching, and coating and sealant (Both non-cementitious & cementitious, with or without plastic lining)
Improve structural condition, eliminate leakage and provide corrosion protection. Little disruption
Will not rehabilitate badly deteriorated or structurally unsound Manholes
Repair or rebuilding of manhole chimney and cone section when excavation is required
Rehabilitate badly deteriorated or structurally unsound chimney and cone section
Excavation required
Step removal and / or replacement Improve access and safety and eliminate leakage
Installation difficulty
Replacement of manhole frame and cover
Improve service life and alignment, adjust grade, and eliminate leakage
Excavation required
Structural relining Renew structural integrity Reduction of dimension, cost
Seal or replace cover, or install insert
Eliminates inflow and stop rattle Raises cover slightly
Chemical grouting of manhole structure
Eliminates infiltration and fills voids in surrounding soil
Does not improve or rehabilitate interior or manhole
Total replacement New manhole Cost
3) Pipeline Preparation Prior to initiating any rehabilitation work, it is necessary to prepare the pipeline, inspection and cleaning. The purpose of cleaning is to remove foreign materials from the sewer in advance of CCTV monitoring work. The degree of cleaning depends on the type(s) of rehabilitation work planned. However, there are times when CCTV work may be done in advance of cleaning. Cleaning equipment used may include a hydraulically propelled, high-velocity jet (hydrocleaner) or mechanically powered equipment. The proper equipment is usually determined in advance and normally depends on pipe type and condition. After cleaning is completed, CCTV visually inspects the pipeline sections. The television camera shall be one specifically designed for pipeline work. The lighting for the camera must be suitable to allow a clear picture of the entire periphery of the pipe. The lighting should be preferably provided with Xenon bulbs. The lens head shall have facilities for tilt/ pan and 360 degrees fish eye view of the internal surface of the pipe. The CCTV may be mounted on articulated crawlers or floats so as to provide easy maneuverability. Roots removal from the pipeline is necessary for maintaining proper flow conditions and for reducing infiltration and/or structural damage to the pipeline. Special attention should be given during the cleaning operation to ensure complete removal. Removal procedures usually require the use of mechanical equipment, such as rodding machines, bucket machines, winches using root cutters, porcupines and high velocity jet cleaners.

Final Report on Water Quality Management Plan for Ganga RiverVolume IV-4, Feasibility Study for Varanasi City, Part I, Sewerage Scheme
2-43
(3) Varanasi Project - Collection of Data and Manhole Survey Data Collection
a) Flow Measurement Flow measurements were carried out on the old trunk sewer outfall at Rajghat as well as on Nala/ drains, which were intercepted and diverted to old trunk main sewer via Ghat pumping stations.
Table 2.16 Flow Measurement Details under Old Trunk Main
Measured Discharge, mld Sr. Name of Nala & Drains
1986 2000 Type Remark
1 Old Trunk Sewer outfall at Rajghat 100 130 Circular pipe Main trunk sewer catchment flow +
intercepted nala flow 2 Shiwala Drain 1.00 5.50 Circular pipe Intercepted into main trunk sewer 3 Harishchandra Ghat Drain 1.50 2.50 Rectangular Intercepted into main trunk sewer
4 Mansarovar Drain 2.50 2.50 Circular pipe Intercepted into main trunk sewer under GAP-1
5 Dr. R.P. Ghat Nala 20.00 25.00 Rectangular Intercepted into main trunk sewer 6 Jalesan Drain 2.75 3.75 Rectangular Intercepted into main trunk sewer 7 Sankatha Ghat 0.30 Rectangular Intercepted into main trunk sewer 8 Trilochan Ghat Drain 2.00 3.50 Rectangular Intercepted into main trunk sewer
9 Telia Nala 1.00 3.00 Intercepted into main trunk sewer under GAP-1
Total (2 to 9) 30.75 46.05
b) Trunk Sewer Inventory At present around 130 MLD of sewage flows out of the Old Trunk sewer at special manhole near railway bridge. Available collected data from UP Jal Nigam on old trunk sewer were examined to ascertain the maximum carrying capacity of trunk sewer and is tabulated below. Earlier manhole survey carried out by UP Jal Nigam shows heavy silting conditions especially in the upstream reach. It may also be possible that due to inadequate flows- especially in upstream stretches; self-cleansing velocity may not be achievable due to larger than necessary size. Large size hydraulically is not necessarily the efficient option. It would be essential to evaluate the water supplied and water returned in to sewers before concluding anything.

Final Report on Water Quality Management Plan for Ganga RiverVolume IV-4, Feasibility Study for Varanasi City, Part I, Sewerage Scheme
2-44
Table 2.17 Old trunk Sewer Inventory
Case 1: Considering brick sewer internal surface in rough condition (n = 0.017)
Sr. Location Dia (inches) Slope Length
(meter)
Max flow (80% flow)
lpm
Max flow (Full bore)
lpm 1 Assi to Shiwala 30 1:600 924 320.0 363.70 2 Shiwala to Gudaulia 48 1:1100 1,740 830.0 940.39 3 Gudaulia to Benia Park 72 1:1600 697 2,000.0 2,298.27 4 Benia Park to Hirapur 78 1:1600 595 2,500.0 2,844.97 5 Hirapur to Baraganesh 84 1:1300 250 3,350.0 3,845.65 6 Baraganesh to Hansapur 90 1:1800 1,511 3,450.0 3,928.14 7 Hansapur to Konia SMH 96 1:2450 1,175 3,490.0 3,999.13 8 Konia SMH to Rajghat outfall 96 280
Case 2: Considering brick sewer internal surface in bad condition (n = 0.02)
Sr. Location Dia (inches) Slope Length
(meter)
Max flow (80% flow)
lpm
Max flow (Full bore)
lpm 1 Assi to Shiwala 30 1:600 924 270.0 309.14 2 Shiwala to Gudaulia 48 1:1100 1,740 700.0 799.33 3 Gudaulia to Benia Park 72 1:1600 697 1,700.0 1,953.53 4 Benia Park to Hirapur 78 1:1600 595 2,100.0 2,418.22 5 Hirapur to Baraganesh 84 1:1300 250 2,850.0 3,268.80 6 Baraganesh to Hansapur 90 1:1800 1,511 2,900.0 3,338.92 7 Hansapur to Konia SMH 96 1:2450 1,175 2,950.0 3,399.26 8 Konia SMH to Rajghat outfall 96 280
Roughly present flow condition represents more than 50% silting in sewers and corresponding loss in carrying capacity and internal brick surface of sewer from rough to bad condition.
c) Proposed Relief Trunk Sewer (Under Construction) At present U.P. Jal Nigam is constructing a trunk relief sewer of maximum 225 mld capacity for sub-central and part central district sewerage zone. Provision has been given to connect this relief sewer to existing Old Trunk Sewer near Beniya Park so that excess wastewater can be diverted to this relief trunk sewer. Considering the existing ground situation (heavy traffic, narrow roads) along the alignment of old trunk sewer, the under execution trunk relief sewer will play a vital role during rehabilitation of old trunk sewer by facilitating flow diversion. Manhole Survey Due to heavy traffic congestion on the route of trunk sewer, manholes could only be opened for inspection during midnight to early morning hours. Out of 83 manholes identified during survey, 70 manholes could be surveyed for assessments of condition. Remaining 13 identified manholes could not be surveyed despite best effort. Remaining manholes of the possible 200 manholes could not be located due to its buried positions, construction over manholes, and presence of manholes within private/ inaccessible boundaries.
Final Report on Water Quality Management Plan for Ganga RiverVolume IV-4, Feasibility Study for Varanasi City, Part I, Sewerage Scheme
2-45
(4) Inferences based on the available information Manhole survey was carried out at night during lean flow conditions. A number of manholes were found under surcharged condition during lean flow periods also, which is due to heavy silting condition or probable damage to sewer section. Important outcome of manhole survey are:
• Manholes were found heavily surcharged in the downstream section of Old Trunk Sewer between Vishewarganj and Rajghat passing through Maidagin, Mokimganj and Prahlad Ghat. This might lead to caving in of the old brick sewer.
• Moderate to heavy silting was found in most of the manholes. • Internal plaster of most of the manholes was corroded resulting in further deterioration of
structural integrity of manholes. Probable reason of deterioration of manhole plaster could be presence of hydrogen sulphide gases resulting in formation of sulphuric acid.
• Cast Iron steps were missing in most of the manholes. • Cast iron square and circular manhole covers in fairly good condition were found on most of
the manholes. • Mechanical bucket machines were used for the desilting of sewers. • The external surface of the bucket is glittery mainly due to the abrasion, which indicate the
presence of hardened silt deposition • The use of buckets for desilting might erode the pointing as well as the bricks, which might
reduce the structural stability, and cause increased silt deposition. • Manhole cleaning is required to get further useful data.
Manhole survey shows major problem of silting, surcharge, unsatisfactory internal manhole plaster and possible structural deterioration (plaster). It gives very limited information about the internal condition of sewers, however it can be presumed that severe conditions can be expected on some of the sewer sections. A detailed investigation (diagnostic study) in accordance with the guidelines of the Sewer Rehabilitation Manual of WRc, UK is further required as a first step of proposed rehabilitation plan to gather more information about the internal condition of sewers which will help in evaluating its performance in terms of hydraulic, environmental, structural integrity and operational performance indicators. (5) Proposed Rehabilitation Programme After evaluating the preliminary investigation outcome following line of action is proposed under three steps. Step 1: Database Generation Detailed information of old trunk sewer is required before planning any rehabilitation and maintenance plan. After reviewing the initial investigation following survey is required to generate more database. Manhole cleaning and inspection During preliminary investigation only 70 manholes could be surveyed against an expected 200 numbers. Most of the manholes are buried under structures or under road surface, which need to be located. Manhole survey of surveyed manholes shows heavy silting and surcharges conditions resulting in inability to gather key information at this stage. Hence, it would be imperative to carry out a detailed manhole inspection after desilting/ cleaning the manholes, which would be done in next stage for enabling preparation of DPR. So, the proposed manhole cleaning and inspection programme needs following activities:

Final Report on Water Quality Management Plan for Ganga RiverVolume IV-4, Feasibility Study for Varanasi City, Part I, Sewerage Scheme
2-46
• Identification and opening of all buried manholes • Manual or mechanical (super suction machine) cleaning of manholes • Detailed inspection of manholes
Conditional Assessment of Sewer Internal inspection of sewer is required to understand the present condition of sewer. Inspection survey can be carried out either by high-resolution colour CCTV camera or by man entry survey depending upon the sizes of the sewers. Man entry survey requires special safety equipments and flow diversion. CCTV inspection survey can be carried out along with sewer cleaning, however, considering the age of the Old Trunk Sewer and the amount of silting, CCTV survey prior to any cleaning programme is recommended in stretches where essential and possible to prevent any major damage during cleaning. CCTV survey should be carried out during lean flow conditions and under general circumstance 40% of pipe bore should be empty during inspection. Two options are available for condition assessment of sewer: Option 1: CCTV inspection of sewer Option 2: CCTV inspection along with sonar equipment for continuous liquid depth & clear opening depth recording. Option 2 will give more details of sewer in terms of silt depth, hydraulic line, pipe sagging details and is recommended. Some new structural assessment techniques like geophysical sounding may be used in combination of the inspection to provide more information. The information gathered shall be recorded preferably on digital media and shall be used for grading of the sewer condition as per the WRc Sewer Rehabilitation Manual (SRM). This shall be recorded in a database for further use of the client. Step 2: Pipe Preparation Based on the CCTV survey outcome, sewer sections shall be graded in to the five grades defined under the SRM and a detailed desilting plan will be formulated. Desilting of sewers can be carried out by high pressure jetting cum suction machines (upto 1000 mm diameter), mechanical bucket machines or manually paying careful attention to the likely state of the sewer. Flow bypassing or over-pumping may be required at various sections for effective cleaning of pipeline. CCTV survey after desilting shall be required to check the effectiveness of cleaning. Step 3: Sewer Rehabilitation Stabilisation (local repairs): Sealing of joints and openings. Stabilisation is only appropriate if it can be assumed that the original sewer is structurally sound. A structural design check on the renovation is therefore unnecessary. Lining The structural linings can be considered as either "Type I" or "Type II", depending on how they interact with the existing pipe: Type I - The lining, grout (where present) and existing sewer act as a rigid composite section. A bond
Final Report on Water Quality Management Plan for Ganga RiverVolume IV-4, Feasibility Study for Varanasi City, Part I, Sewerage Scheme
2-47
is required between the lining and existing sewer (and grout where present). Type II - The lining is designed as a flexible pipe and it does not require a bond between the lining, and grout (where present) or the existing sewer. The third type, Type III is only non-structural lining for improvement of hydraulic condition. After taking into account various technologies adopted in Indian scenario pertaining to the ongoing/ completed sewer rehabilitation projects in India, following sewer rehabilitation methods are considered for this project Slip Lining The insertion of smaller diameter pipe, usually plastic (like HDPE) or glass reinforced plastic (GRP) into deteriorated pipe to retain the function of the 'the hole in the ground' is widely practiced. The liner pipe is usually selected to withstand all soil and traffic loads and the annular space between the liner pipe and the existing pipe is filled with a grout compound to secure the line and level of the liner and transfer structural loading from the existing pipe. There is usually a significant loss (may be up to 20%) of cross sectional area and flow capacity. But to keep the loss of cross sectional area to an acceptable level, proprietary techniques like reaming would be required case by case. There is a number of pipe pushing and pulling devices available and the method is widely practiced for short crossings and other applications where capacity is not a major issue. Slip lining can be used to achieve both Type I and Type II rehabilitation and is especially suitable for man-entry sizes and works out to be economical over other methods like CIPP under such circumstances. Lining with cured in place liners (CIPP) First developed in 1971 by Insituform Technologies Inc. cured in place liners are applicable to pipe in the size range 100-2700 mm. Cured in place liners can be installed in non-circular pipe, can accommodate bends and changes of pipe diameter, can incorporate fibre optics and other communications media. The process is generally applied to lengths between manholes but may run through several manholes if a long length is required. Most liners are 70 – 200 m, but longer lengths up to 900m can be attempted. Short lengths patch repairs can also be installed using a packer arrangement. The majority of cured in place pipe installed are small and middle sized pipe, liners up to 1000 mm are commonplace, larger liners up to 2750mm have been successfully installed, but experienced crews, special equipment and extreme planning are required Catalyzed resins are extremely light and temperature sensitive and require shade and refrigerated storage for transportation to site. The design methods are used to determine the thickness of cured in place pipe required to accommodate the external loads. Lining with Spirally Wound Pipe Originally developed in Australia as Ribloc, this process was first used to make formwork for cast in place pipe with the outback. It was first implemented for sewer renovation about 1987. The profiled PVC strip incorporates a male and female joint form and ribs to provide stiffness. Fed through a winding machine usually located in a manhole the strip can be rapidly formed into pipe and introduced into the pipe line with some loss of cross sectional area. The annular space is filled with a cement grout to secure the pipe in place and bond to the existing structure. Spiral wound pipes should be designed as WRc Type II liners; Type 1 designs are inapplicable due to
Final Report on Water Quality Management Plan for Ganga RiverVolume IV-4, Feasibility Study for Varanasi City, Part I, Sewerage Scheme
2-48
the profound strain incompatibility between the plastic strip and the brick or concrete pipe structure. Lining with Segments The use of precast sections to restore the fabric of deteriorated sewer is probably one of the earliest methods known, the development in the late 1970s of glass reinforced cement and glass reinforced plastic technology made possible the construction of relatively light weight repair sections more readily manhandled in to confined spaces. Good quality polyester resins and glass fibre materials are locally available in India and segment manufacture requires manufacturing skill easily assimilated. Circular, semicircular and non-circular section can be readily made using hand lay up, mechanized and closed mould processes of varying qualities. Segments are usually made with a sandwich structure for stiffness and economy and with glass rich layers concentrated in zones where higher tensile stresses can be expected. A resin rich skin usually protects the glass rich zones. Where joints are incorporated, gaskets or solvent bonds are used to ensure strength and water tightness. Segments can be installed by manual intervention in conditions of modest flow, but flow should be suspended for grouting operations. Lining with sprayed coating Gunite or Shotcrete is used to repair large structures such as tunnels and can be employed in sewers. Shotcrete is a pneumatically applied mortar or concrete in which the cementitious mix is projected at high speed to impact on the wall of the existing structure with such force that it compacts and can support itself without sagging or sloughing. Gunite is the 'dry mix' process in which cement and damp aggregate are fed into a stream of compressed air in a hose and carried to a delivery nozzle where water is introduced under pressure and intimately mixed, the dry mix can include flash set accelerators. Gunite with accelerators can be applied to surfaces covered by running water, though severe infiltration must be controlled. If applied slowly and with care it forms a good bond with finely distributed reinforcement and its high cement – low w/c ratio mixture makes for a strong and durable concrete. Use in combination with reinforcing mesh to control crack propagation and increase strength Shotcrete or Gunite forms a ferro-cement Type 1 liner. The Shotcrete/Gunte process can be used to produce pre-fabricated sections in a factory condition; such units are almost always used for the invert of the lining system so that flow can be accommodated with a minimum of over-pumping or diversion. In situ Gunite can be used to complete the liner or seal over joints. This form of construction requires cleaning and preparation of the surface of the sewer often with a primer such as PVA to enhance the bond. However, considering the life cycle analysis of the systems, it would be preferable to adopt non-cementatious materials like GRP or Polymers so as to ensure cost effectiveness in long term. Safety and safe working practices are also critical elements in the application of trenchless technologies. Due attention must be mandated for these works and all obligations concerning the safety of client, contractor and consultant personnel must be properly documented and promulgated in all required languages to promote safe working practices. Particular attention must be given to underground and confined spaces working. Manhole Rehabilitation Manhole rehabilitation should also be considered with any pipe rehabilitation project. Old Trunk Sewer manholes are constructed of brick. Manholes are complicated structures and all individual components need consideration. Various parts of manhole rehabilitation covers:

Final Report on Water Quality Management Plan for Ganga RiverVolume IV-4, Feasibility Study for Varanasi City, Part I, Sewerage Scheme
2-49
• Plastering, grouting • Fixing of steps • Repair/ replacement of manhole cover and frame • Raising of manholes (presently buried) • Restoration of benching • On spot repair
Flow Diversion For most trenchless technology work, it is necessary to bypass flow around the sewer that is being rehabilitated. Trunk relief sewer presently under execution will play an important part in the rehabilitation of old trunk sewer by diverting majority flow. Further segmental flow diversion can be achieved by providing portable pumps and temporary on ground rising main from upstream manhole of the sewer section under rehabilitation to the downstream manhole. Another important aspect of rehabilitation programme is traffic diversion planning during rehabilitation. It must be borne in mind that flow diversion is the crucial process and may be deciding factor about success of a particular method of rehabilitation rather than the method itself. (6) Cost Estimates Budgetary cost estimation of sewer inspection, cleaning and rehabilitation plan for the Old Trunk Sewer has been calculated based on certain assumptions and feedback from ongoing/ completed similar type of projects under Delhi Jal Board and Municipal Corporation of Greater Mumbai. Following details were considered while estimating the sewer inspection and rehabilitation cost:
• Total Length of sewer line is considered as 7500 m. • Diameter wise breakup of sewer length is taken based on data from UPJN as accurate
diameter wise breakup of length could not be possible from manhole survey due to submerged manhole condition.
Diameter, mm Sewer Length (m)
750 815 1200 815 1800 970 2100 840 2250 1,290 2400 2,770
• Maximum expected manholes on sewer line = 200
Cost estimation for the rehabilitation project is divided into two broad categories:
a) Cost estimation for detailed investigation (Diagnostic study)

Final Report on Water Quality Management Plan for Ganga RiverVolume IV-4, Feasibility Study for Varanasi City, Part I, Sewerage Scheme
2-50
Table 2.18 Cost Estimate for Detailed Investigation of Old Trunk Sewer
Sr. Particular Cost (Rs.)
1 Identification, cleaning and inspection of manholes 440,000
2 CCTV inspection of sewers along with sonar continuous depth measurement equipment 3,375,000
3 Ground water monitoring, soil investigation and NDT structural assessment along the sewer alignment 500,000
4 Total ( 1 to 3) 4,315,000
b) Cost estimation for Sewer Rehabilitation Assumption1: 80% of the sewer length of 750 - 1200 mm diameter needs rehabilitation Assumption2: 60% of the sewer length of 1800 – 2400 mm diameter needs rehabilitation Assumption3: 750 mm diameter sewer shall be rehabilitated by CIPP Assumption3: 1200 to 2400 mm diameter shall be rehabilitated by GRP lining
Table 2.19 Cost Estimate of Old Trunk Sewer Rehabilitation
Sr. Particular Cost (Rs.)
1 Sewer Desilting including flow diversion arrangement and cleaned pipe CCTV inspection 59,586,000
2 Rehabilitation of 750 mm diameter, 652 m sewer length by CIPP technology 45,640,000
3 Rehabilitation of 1200 mm – 2400 mm diameter sewer line by GRP lining technology 502,920,000
4 Total (1to 3) 608,146,000 2.2.3 Rehabilitation of Ghat Pumping Stations (1) Background Under GAP-I, a new pumping station was added at Mansarovar Ghat and the other four existing pumping stations along the left bank of River Ganga were upgraded, by UP Jal Nigam. The specifications of the existing Ghat pumping stations are given in the following table.

Final Report on Water Quality Management Plan for Ganga RiverVolume IV-4, Feasibility Study for Varanasi City, Part I, Sewerage Scheme
2-51
Table 2.20 Specifications of the Existing Ghat Pumping Stations
1. Harischandra Ghat SPS
Dimensions 6m dia circular sump cum pump house Sump floor is 6.5 m below the operating platform
Installed capacity 146 lps
Installed pumps 1 x 50 HP – 5,000 lpm @ 24 m head 1 x 25 HP – 2,600 lpm @ 13.5 m head 1 x 10 HP – 1,150 lpm @ 9.5 m head
Diesel Generating Sets 1 x 70 kVA Rising Main 200 mm dia CI 2. Mansarovar Ghat SPS
Dimensions 9m dia circular sump cum pump house Sump floor is 11m below the operating platform
Installed capacity 173 lps
Installed pumps 2 x 10 HP – 1,300 lpm @ 15 m head 3 x 25 HP – 2,600 lpm @ 21 m head
Diesel Generating Sets 1 x 100 kVA Rising Main 400 mm dia CI 3. Dr. R.P. Ghat SPS
Dimensions 6.1m dia circular sump cum pump house Sump floor is 18.3 m below the operating platform
Installed capacity 793 lps
Installed pumps 2 x 125 HP – 15,000 lpm @ 23 m head 2 x 75 HP – 8,800 lpm @ 22 m head
Diesel Generating Sets 3 x 160 kVA Rising Main 600 mm dia CI 4. Jalesan Ghat SPS
Dimensions 6.1m dia circular sump cum pump house sump floor is 16.3 m below the operating platform
Installed capacity 160 lps
Installed pumps 2 x 30 HP – 3,600 lpm @ 20 m head 2 x 15 HP – 1,200 lpm @ 15 m head
Diesel Generating Sets 1 x 70 kVA Rising Main 250 mm dia CI 5. Trilochan Ghat SPS
Dimensions 6.1m dia circular sump cum pump house Sump floor is 18.3 m below the operating platform
Installed capacity 182 lps
Installed pumps 2 x 35 HP – 4,100 lpm @ 20.5m head 2 x 12 HP – 1,365 lpm @ 18 m head
Diesel Generating Sets 1 x 160 kVA Rising Main 300 mm dia CI
The monthly average quantum of sewage pumped from these pumping station during the period April 2002 to August 2003 are presented in Figure 2.11 to Figure 2.15.

Final Report on Water Quality Management Plan for Ganga RiverVolume IV-4, Feasibility Study for Varanasi City, Part I, Sewerage Scheme
2-52
0
1
2
3
4
5
Apr-02
May-02
Jun-0
2Ju
l-02
Aug-02
Sep-02
Oct-02
Nov-02
Dec-02
Jan-0
3
Feb-03
Mar-03
Apr-03
May-03
Jun-0
3Ju
l-03
Aug-03
Average Monthly Discharge from Harishchandra Ghat SPS
Flow
in M
LD
Figure 2.11 Average Monthly Discharge from Harishchandra Ghat SPS
0
0.5
1
1.5
2
2.5
3
Apr-02
May-02
Jun-0
2Ju
l-02
Aug-02
Sep-02
Oct-02
Nov-02
Dec-02
Jan-0
3
Feb-03
Mar-03
Apr-03
May-03
Jun-0
3Ju
l-03
Aug-03
Average Monthly Discharge from Mansarovar Ghat SPS
Flow
in M
LD
Figure 2.12 Average Monthly Discharge from Mansarovar Ghat SPS

Final Report on Water Quality Management Plan for Ganga RiverVolume IV-4, Feasibility Study for Varanasi City, Part I, Sewerage Scheme
2-53
0
5
10
15
20
25
Apr-02
May-02
Jun-0
2Ju
l-02
Aug-02
Sep-02
Oct-02
Nov-02
Dec-02
Jan-0
3
Feb-03
Mar-03
Apr-03
May-03
Jun-0
3Ju
l-03
Aug-03
Average Monthly Discharge from Dr RP Ghat SPS
Flow
in M
LD
Figure 2.13 Average Monthly Discharge from Dr R P Ghat SPS
0
1
2
3
4
5
Apr-02
May-02
Jun-0
2Ju
l-02
Aug-02
Sep-02
Oct-02
Nov-02
Dec-02
Jan-0
3
Feb-03
Mar-03
Apr-03
May-03
Jun-0
3Ju
l-03
Aug-03
Average Monthly Discharge from Jalesan Ghat SPS
Flow
inM
LD
Figure 2.14 Average Monthly Discharge from Jalesan Ghat SPS

Final Report on Water Quality Management Plan for Ganga RiverVolume IV-4, Feasibility Study for Varanasi City, Part I, Sewerage Scheme
2-54
0
0.51
1.52
2.5
33.5
44.5
5
Apr-02
May-02
Jun-0
2Ju
l-02
Aug-02
Sep-02
Oct-02
Nov-02
Dec-02
Jan-0
3
Feb-03
Mar-03
Apr-03
May-03
Jun-0
3Ju
l-03
Aug-03
Average Monthly Discharge from Trilochan Ghat SPS
Flow
in M
LD
Figure 2.15 Average Monthly Discharge from Trilochan Ghat SPS (2) Preliminary Inspection of Pumping Stations All the five ghat pumping stations, located along the banks of the River Ganga were visited to understand the existing situation of these pumping stations. The observations made during the survey of these pumping stations are as follows:
• During peak hours all pumps are running including standby pumps and some amount of over
flow also observed during the visit • There is no capacitor panel provided in these pumping stations • There is no spare feeder in L.T. Panel • Indication lamps on panels are either missing or not working • The appearance of the Civil structure is poor • Earthing system at all the IPS is improper and requires urgent attention and improvements • Alternative power supply (DG Generator) is available at all IPS. However, there is no standby
generator, except at R.P.Ghat • There is not a single instrument to measure level, flow, pressure, temperature etc for proper
operation at all IPS • There is no mechanized screen (only wire mesh) available to screen the sewage water • There is no telecommunication facility provided at any of the IPS • Skilled operation and maintenance staff is unavailable
(3) Inferences based on the available information Based on the reviewing the data collected, from the various organisations and the observations made during the site visits to these pumping stations following inferences are made. Wastewater flowing through the branch sewers are intercepted and diverted to the pumping stations. The proposals, of UPJN, for increasing the pumping capacity in these pumping stations have been sanctioned. From the observation, overflow of sewage in the pumping stations, it can be concluded that the incoming raw sewage volume is more than the capacity of the pumping stations. The pumping

Final Report on Water Quality Management Plan for Ganga RiverVolume IV-4, Feasibility Study for Varanasi City, Part I, Sewerage Scheme
2-55
capacities in all these pumping stations are increased as and when it is required considering only the present needs. Thus, strategies for further enhancement, in the capacity, of these pumping stations has to be developed with a space constraint. As the present flow observed in the pumping stations is more than the existing capacity of these pumping stations, the stand by pumps are also in operation during the normal days. This shall lead to a sudden breakdown of the pump equipment due to excess wear and tear. The life of the pump installed in these pumping station has expired, which leads to the temporary breakdowns. These temporary breakdowns, especially during the peak hours shall lead to a considerable amount of pollution to the River Ganga. To overcome the electricity breakdowns and facilitate continuous operation all these Ghat pumping stations are equipped with a diesel generator. However, due to the limited resource these generators are not fully utilized in all the pumping stations. It is confirmed that there is an immediate need to rehabilitate these pumping stations to achieve the over all objective of reducing the pollution level in River Ganga. (4) Evaluation of Alternatives As mentioned above, the life of the pumping equipment has expired thus the existing pump equipment has to be replaced and there is a need to enhance the pumping capacity. With the available data and time, it can be said that mechanical engineering interventions are to be undertaken immediately. The various possible rehabilitation and augmentation alternatives for these pumping stations are:
1. Replacement of the existing pump equipment by new centrifugal pumps with vertical motor
2. Convert the existing dry well to wet well and provide new submersible pumps It is obvious, that any equipment requires proper and timely maintenance. Especially in the case of sewage pumps it is very necessary to adhere to a strict maintenance schedule to avoid breakdowns. It is therefore, necessary to select an alternative, which can be maintained with ease. Alternative 1: Replacement of the existing pump equipment by new centrifugal pumps with vertical motor. The main advantage of this strategy is that the total augmentation time taken will be very minimized. The other advantage of this system is that the existing operation and maintenance schedule can be used. Centrifugal Pumps also offer substantial reduction in the energy consumption, resulting in reduction in size of motor cabling, length of cabling, reduction in capacity of transformer & generator set. Alternative 2: Convert the existing dry well to wet well and provide new submersible pumps The main constraint in space, for augmentation and rehabilitation, in the existing pumping station can be overcome, however the structural stability, water tightness, of the dry well has to be further investigated. (5) Proposed Rehabilitation Programme Based on the comparison of the various technical and commercial aspects it is apparent that the Alternative Replacement of the existing pumping equipment by new centrifugal pumps with vertical motor is more attractive and it is also the least cost alternative. Thus, the Feasibility Study proposes
Final Report on Water Quality Management Plan for Ganga RiverVolume IV-4, Feasibility Study for Varanasi City, Part I, Sewerage Scheme
2-56
that this alternative for Rehabilitation of the Ghat Pumping station shall be adopted. New provisions are made to cater to the demand in the year 2003. Pumps have been provided in order to get the flexibility in operation and maintenance.
Trilochan Ghat SPS • Required pumping capacity is 262 lps including 25 % stand by capacity • All the pumps are replaced as the existing pumps are more than 15 years old • Two pumps, one of 5,300 lpm @ 26 m head and another of 2,600 lpm @ 26 m head,
have already been acquired by UP Jal Nigam and same are to be installed • In addition, three pumps, two of 5,300 lpm @ 26 m head and another of 2,600 lpm @
26 m head, are proposed to take care of the ultimate flow • Altogether five are required, where 2 pumps of 5,300 lpm and one of 2,600 lpm will be
working to handle the peak flow with one of 5,300 lpm as stand by • One pump of 2,600 lpm is provided as spare for the same capacity pump and has to be
kept in the store • Therefore, the total capacity provided is 308 lps • All the above pumps will be connected to the two rising mains viz. 300 mm dia existing
and 350 mm dia under execution Jalesan Ghat SPS • Required pumping capacity is 136 lps including 25 % stand by capacity • All the pumps are replaced as the existing pumps are more than 15 years old • Four pumps, each of 2,176 lpm @ 27 m head, are proposed to take care of the ultimate
flow • At peak, three pumps of 2,176 lpm will be working with one as stand by • Therefore, the total capacity provided is 145 lps • All the above pumps will be connected to the existing rising main of 250 mm dia that is
connected, to 350 mm dia rising main originating from Dr. R.P. Ghat pumping station. This 350 mm dia rising main finally connects to a 600 mm dia rising main.
Dr. R.P. Ghat SPS • Required pumping capacity is 904 lps including 25 % stand by capacity • All the pumps are replaced as the existing pumps are more than 15 years old • Three pumps, each of 21,696 lpm @ 23 m head, are proposed to take care of the
ultimate flow • At peak, two pumps of 21,696 lpm will be working with one as stand by • Therefore, the total capacity provided is 1084.8 lps • All the above pumps will be connected to a common header that will be connected to
two existing rising mains of 350 mm dia and 450 mm dia. Both rising mains are connected to two rising mains of 600 mm dia separately. Also, a 250 mm dia rising main from Jalesan Ghat SPS is connected to the above 350 mm dia rising main.
Mansarovar Ghat SPS • Required pumping capacity is 90 lps including 25 % stand by capacity • All the pumps are replaced as the existing pumps are more than 15 years old • Three pumps, each of 2,160 lpm @ 20 m head, are proposed to take care of the ultimate
flow • At peak, two pumps of 2,160 lpm will be working with one as stand by • Therefore, the total capacity provided is 108 lps • All the above pumps will be connected to the existing rising main of 400 mm dia
Harischandra Ghat SPS

Final Report on Water Quality Management Plan for Ganga RiverVolume IV-4, Feasibility Study for Varanasi City, Part I, Sewerage Scheme
2-57
• Required pumping capacity is 290 lps including 25 % stand by capacity • All the pumps are replaced as the existing pumps are more than 15 years old • Two pumps, each of 6,800 lpm @ 15 m head, have already been acquired by UP Jal
Nigam and same are to be installed • In addition, one more pump of 6,800 lpm @ 15 m head, is proposed to take care of the
ultimate flow • Altogether three pumps are required, where 2 pumps of 6,800 lpm will be working to
handle the peak flow with one as stand by • Therefore, the total capacity provided is 339 lps • All the above pumps will be connected to a new 400 mm dia rising main, which is
under execution and the existing rising main of 150 mm dia may be discarded. There is need to complement the mechanical intervention with the electrical and instrumentation interventions at each Ghat pumping station. The electrical interventions for the entire Ghat pumping stations are described below. Electrical Interventions: Variable Frequency Drive A Variable Frequency Drive (VFD) has been proposed in the entire Ghat pumping stations; the principle of the VFD is illustrated in Figure 2.16.
Figure 2.16 Application of Variable Frequency Drives in Wastewater Pumping Station
a) The objective is to pump the wet-well down when it is full (similar to a sump pump in a house). The control scheme consists of an ultrasonic level controller, which will monitor the level in the wet-well and send this information to the VFD. The controller will start, stop, and vary the speed of the pump based on set fonts in the wet-well.
b) As influent wastewater fills the-wet well, the level controller starts the VFD: the VFD will turn the pump on at zero speed, and ramp the pump at a smooth acceleration rate to maximum speed.
c) With the pump operating at maximum speed, it starts drawing the level in the wet-well down. As the wet well level decreases, so does the speed of the VFD. The VFD will operate at maximum operating speed at the start level and the minimum operating speed at the stop level.
d) While the VFD is operating the pump, one of two scenarios will take place:

Final Report on Water Quality Management Plan for Ganga RiverVolume IV-4, Feasibility Study for Varanasi City, Part I, Sewerage Scheme
2-58
• The pump will overcome the influent into the wet-well. As the level decreases, so does the VFD (pump) speed. The level becomes low enough to shut down the VFD that causes the pump to stop.
• The pump will reach a speed at which the influent and effluent are equal. When the amount of liquid entering the wet-well and the amount of liquid being pumped out of the wet-well become equal, the control system has achieved flow matching.
e) The advantage of the above two scenarios are:
• Soft start and stop reduces mechanical wear. • Acceleration and deceleration is controllable. • Speed is controllable. • Motor current limiting. • Power savings.
The advantages of the VFD drive are:
Starting current kicks are eliminated
With conventional starting methods or star delta starting, the motor draws 5 to 6 times the rated current at start. The AC drive controls both the voltage and frequency at any given time. Hence, the starting current kick is eliminated. This reduces the maximum demand of the plant and electrical stresses on the upstream equipment e.g. cable breakers and transformers. Lower starting current also means that the plant DG set can be of a lower rating.
Better Input Power factor
With conventional control methods, if the motor runs on part load, it operates at a very poor efficiency and power factor. Since a majority of the motors usually operate at lower than rated load continuously, this leads to power wastage. Modern generation of AC drives have an in-built flux optimisation feature that allows defluxion of the motor at light loads. This allows the motor to run at its best efficiency point even at light load. Also, the AC drive presents a near unity power factor to the mains. These factors lead to savings of energy that would otherwise have been wasted.
Longer Equipment life
With conventional methods there is a big jerk at starting due to sudden surge of starting current. Inbuilt soft start feature of the ac drive provides smooth acceleration and limits sudden jerks. This leads to longer mechanical life of equipment e.g. fan blades; pump impellers, gearbox, belts, pulleys etc. Complete Motor protection Conventional methods of motor protection e.g. fuse and overload relays offer limited motor protection. Moreover, these devices are prone to drift due to aging and hence need frequent recalibration. Modern AC drives offer comprehensive motor protection against faults like over-current, overload, short circuit, ground fault, over-voltage and under-voltage. Since, all settings are digital in nature, they do not change with age and do not need recalibration.
Interface with Higher-level Systems
Modern AC drives have in built communication ports for communication to high level systems e.g. DCS, PLC’s and plant computers. This allows for extensive data logging, fault monitoring and operation from a centralised location.
Depreciation Benefits
AC drives are classified as energy saving devices under the Income Tax rules of Govt. of India. Hence, the amount invested in ac drives can be deducted from the taxable income in the very first year of investment. This reduces the payback period further.
Energy saving by reduction in pump loading
Variable frequency drive reduces the pump loading proportionately with the flow of incoming sewage. The pump running at 100% load at peak flow will run at 75% load at average flow. The same pump

Final Report on Water Quality Management Plan for Ganga RiverVolume IV-4, Feasibility Study for Varanasi City, Part I, Sewerage Scheme
2-59
will run at 50% load at lean flow. Thus reducing the input power consumption proportionately based on the flow.
DG Sets
There is a frequent electricity breakdown in the city of Varanasi. Thus for proper operation of the pump equipment in these Ghat pumping stations there is a need to provide alternate power source (DG Sets). All the five Ghat pumping stations have DG Sets, however, some of them are of lesser capacity than required to meet the augmented pumping capacity. Thus the following strategy is developed for provision of DG sets. While proposing the strategy the existing assets are also considered.
• Each Pumping station shall have proper DG Set • All the Pumping station shall have DG sets to meet the power requirement at peak flow as
well as average/lean flow • The use of VFD with this strategy will further save the fuel cost. • At Trilochan Ghat SPS, a new DG set of 200 KVA is proposed to handle the revised pump
capacity. • At HarishchandraGhat SPS, the existing DG sets, 2 nos. of 70 kVA, are adequate to take
care of new pumping capacity. However, provision has been made for an auto synchronisation system for these DG sets.
• At Jalesan Ghat SPS, the existing DG set of 70 kVA is to be replaced with a 100 kVA DG set from Mansarovar Ghat SPS.
• At Dr. R.P. Ghat SPS, the existing DG sets, 3 nos. of 160 kVA, are adequate to take care of new pumping capacity. However, provision has been made for an auto synchronisation system for these DG sets.
• At, Mansarovar Ghat SPS, the existing DG set of 100 kVA is to be replaced with a 70 kVA DG set from Jalesan Ghat SPS.
• It is proposed to have an Auto Mains Failure (AMF) panel for DG sets at each Ghat SPS • A level sensor has been proposed at diesel storage tank of the DG set.
Capacitor Panel It is observed during the field visits, that none of the SPS has power factor correction capacitor panel. As per the existing regulations formulated by the Electricity Authority, it is required to maintain a power factor equivalent to 0.95 and if it is maintained at more than 0.95, the facilities are eligible for the rebate in the energy bill. If the facility has a poor power factor then a penalty can be levied on that facility. Considering the global concern of reducing the energy losses it is proposed to have a capacitor control panel at each Ghat SPS to maintain a power factor equivalent to 0.98. Earthing System It is proposed to have an earthing system at each Ghat SPS as per the IS: 3043 to maintain earth resistance to less than 1 ohm. Instrumentation Interventions Ultrasonic Level Controller It is proposed to install an ultrasonic level controller at all the five Ghat SPS to regulate the switching of the pumps automatically based on the sewage level in wet well. PLC Control Panel To facilitate the automatic operation of the pumps it is proposed to install a PLC control panel at each Ghat SPS. Pressure Gauge It is necessary to maintain the pressure at the inlet to carry necessary precautionary measures at the inlet so as to avoid the damages to the suction pipe due to abnormal pressure at the inlet. Thus a

Final Report on Water Quality Management Plan for Ganga RiverVolume IV-4, Feasibility Study for Varanasi City, Part I, Sewerage Scheme
2-60
pressure gauge is proposed at all the Ghat SPS. (6) Cost Estimates The augmentation / rehabilitation cost for the selected alternative and complementing interventions are estimated and presented in Table 2.21.
Table 2.21 Break up of Costs for Rehabilitation of Ghat Pumping Station
(Rs.)
Sr. Location Mechanical Cost Electrical Cost Total Capital Cost O & M Cost @ 3%
1 Trilochan Ghat 1,585,000 6,467,000 8,052,000 241,5602 Harsichandra Ghat 719,000 4,240,000 4,959,000 148,7703 Jalesan Ghat 1,077,000 4,076,000 5,153,000 154,5904 Dr. RP Ghat 5,975,000 13,531,000 19,506,000 585,1805 Mansarovar Ghat 622,000 3,452,000 4,074,000 122,220 Grand total 41,744,000 1,252,320
2.2.4 Renovation / Rehabilitation of Existing Konia Pumping Station (1) Existing Scheme Main Pumping Station (MPS) was constructed under GAP-I at village Konia. This pumping station is located near Rajghat for conveyance of sewage from old trunk main sewer to the treatment works at Dinapur. The pumping station has a capacity of 100 mld. In this MPS, pumping is carried out in two stages, three screw pumps in first stage followed by a set of centrifugal pumps in second stage. The sewage lifted by screw pumps passes through screening and grit removal units. The existing facilities in Konia MPS are presented in Table 2.22. A special manhole has been provided near Rajghat for diversion of sewage to this pumping station through a 305 m long and 2,286 mm dia brick sewer. A sluice gate has been provided in this manhole to prevent flow of sewage into the outfall sewer and also to control the amount of sewage flowing to Konia MPS. Power requirement at Konia pumping station is around 1600 kVA. A switchyard is provided to accommodate 3 nos., 1000 kVA transformers with other accessories. A Metering Room is provided adjacent to the switchyard. It is further supplied to the individual equipment panels through the air circuit breaker, bus duct and a bus bar. Stand by power arrangement is provided by 4 nos.-generating sets. A heat exchanger is provided for cooling of these engines.

Final Report on Water Quality Management Plan for Ganga RiverVolume IV-4, Feasibility Study for Varanasi City, Part I, Sewerage Scheme
2-61
Table 2.22 Existing Facilities in Konia MPS
Konia MPS First Stage Installed capacity 3 x 1,158 = 3,474 lps Installed pumps 3 x 215 HP – 1,158 lps @ 8.51 m head Pre-treatment Units Screens 2 nos. mechanically operated – 50 mld each 1 no. Manually operated – 50 mld Detritor 2 nos. of 100 mld each Konia MPS Second Stage Dimensions 32 m x 6 m Installed capacity 3480 lps
Installed pumps 3 x 215 HP – 740 lps @ 8.51 m head 3 x 150 HP – 420 lps @ 8.51 m head
Diesel Generating Sets 5 x 500 kVA
Rising Main 1200 mm dia PSC (New) 900 mm dia Hume Steel (Old)
(2) Provisions for Upgradation Following table presents unit wise provisions made for upgradation Konia Pumping Station
Table 2.23 Provisions for Upgradation of Konia Pumping Station
Sr. Unit Civil Mechanical
1 Diversion works at Rajghat Repair of existing manhole chamber Sluice gate
2 Pumps - Ist stage 1 nos. Screw Type, 215 HP, 1,158 lpm @ 8.51 m head, 29 RPM
3 Screen - IInd Stage 1 no. Mechanical type screen with 6mm spacing
4 Detritor - IInd Stage Replacement of 1 no. gear box for a 100 MLD capacity with 20% overloading
5 Pumps - IInd stage 1 pump 740 lps and 1 of 420 lps at 18.5m head, 590 rpm
6 Miscellenous Painting of entire plant (3) Cost Estimation The rehabilitation cost for interventions for Konia PS is estimated to be Rs. 9,870,000.
Table 2.24 Rehabilitation Cost of Konia SPS
Sr. Works Cost (Rs.) 1 Civil Works 300,000 2 Mechanical Works 9,570,000 3 Total capital cost 9,870,000
2.2.5 Renovation / Rehabilitation of Existing STP at Dinapur (1) Existing Scheme One 80 mld STP was constructed under GAP-I at Dinapur. This STP receives sewage from Konia pumping station. This plant is designed and constructed in three streams, each of 26.67 mld capacity.

Final Report on Water Quality Management Plan for Ganga RiverVolume IV-4, Feasibility Study for Varanasi City, Part I, Sewerage Scheme
2-62
This plant is based on activated sludge process with an extra provision of trickling filter to care of high loads of BOD in the raw wastewater and thereby reducing the overall operation and maintenance cost of plant. The plant consists of inlet chamber, parshall flume, primary settling tank, roughening filter, aeration tank, secondary settling tank, sludge digester, gas holder, power generation system, gas burner, raw sludge pump house, filtrate pump house, treated effluent pump house and sludge drying beds. Settled sludge from primary settling tank is pumped to digester where anaerobic digestion takes place resulting in production of biogas. Dual fuel engines, of 400 kVA capacity each, have been provided for generating electricity, using biogas produced from the plant. 2 nos. transformers, each of 1,000 kVA capacity, are provided for power supply to the plant. An effluent channel of 4 km length is provided for conveyance of treated wastewater for irrigation purpose. In case of reduction in demand of treated wastewater, for irrigation, it is discharged into River Ganga near Sehbar village.
Table 2.25 Characteristics of Raw Wastewater Considered for Design Purpose
Sr. Parameter Average Value
1 Minimum Temperature, oC 20 2 pH 7.0 – 8.0 3 Biochemical Oxygen Demand (BOD5), mg/l 300 4 Total Solids, mg/l 1,500 5 Suspended Solids, mg/l 600 6 Volatile Suspended Solids, mg/l 420
Table 2.26 Characteristics of Treated Wastewater Considered for Design Purpose
Sr. Parameter Average Value
1 pH 7.0 – 8.0 2 Biochemical Oxygen Demand (BOD5 ), mg/l < 20 3 Suspended Solids, mg/l < 30
(2) Provisions for Upgradation The observations during site inspection are presented in Table 2.27 with its required upgradation.

Final Report on Water Quality Management Plan for Ganga RiverVolume IV-4, Feasibility Study for Varanasi City, Part I, Sewerage Scheme
2-63
Table 2.27 Provisions for Upgradation of Dinapur STP
Sr. Unit Civil Mechanical Electrical Instrumentation
1 Inlet Chamber - - - -
2 Parshall Flume -
1 nos. flow meter for throat width 450 mm, range of flume - 40 to 180 MLD to be provided
- 1 no. Flow Transmitter to be replaced
3 Primary Clarifier - 1 no. 2 HP motor and complete gear box assembly as spare
- -
1 no. Scum Box - -
1 no. overflow weir to be replaced - -
4 Distribution Chamber for Trickling Filter - - - -
5 Roughening Trickling filter -
3 nos. Trickling filter central drum to be replaced
- -
6 Aeration Tank - 1 no. Standby gear box required - -
7 Secondary Clarifier - 1 no. 2 HP motor and complete gear box assembly as spare
- -
1 no. Scum Box - -
1 no. Overflow weir to be replaced - -
8 Treated Effluent Pump House - - - 1 no. Level switch with
cables
9 Primary Sludge Pump House
2 nos. of 80 m long pipe lines for carrying the primary sludge from clarifier to pumping station
1 no. Standby pump needs to be provided - 1 no. Level switch with
cables
10 Return Sludge Pump House
1 nos. 200 m long pipe line for carrying excess return sludge to digester
3 sets of impeller of return sludge pumps (2 W + 1 S) to be replaced
- 1 no. Level switch with cables
11 Sludge Digester Repairs and lining in 2 digesters 1 nos. mixer and 20 HP motor required as standby - -
12 Sludge Drying Beds New sand layer to be provided on all the beds - - -
13 Filtrate Pump House -
4 nos. pumps to be replaced by non clog semi open impeller type submersible pumps (2+2 nos. of 35 cum/hr@ 14 m)
- 1 no. Level switch with cables
14 Gas Holder Leakage to be trapped and lining to be provided - - 1 no. Gas flow meter
15 Power Generator Room -
1 nos. Cooling tower as stand by, 2 nos. of Turbo start Engine Air starter of DFG to be replaced
Relay, PF meter, Capacitor Bank to be changed in 1-of-2 APFC Panel
-
16 Gas Burner - - AVR for 500 kVA DFG set
Required automation for flair
17 Miscellaneous Repairs, painting and roads 2 nos. 1.5 tonne capacity Air Conditioners for lab - -
18 Effluent channel (5000m) Repair
1 no. 3 tonne capacity Air Conditioners for Electrical Panel Room
Lightening Arrester for gas digester and gas holder
-
19
Chlorination room, chlorine contact tank, inter connecting piping and dechlorination by aeration
Provision of chlorination for removal of coliform as per revised NRCD Guidelines. Additional provision of dechlorination is made as the treated water is proposed to be used for irrigation.
- - -
20 Miscellaneous - 1 no. Microscope, 1 nos. water cooler - -

Final Report on Water Quality Management Plan for Ganga RiverVolume IV-4, Feasibility Study for Varanasi City, Part I, Sewerage Scheme
2-64
(3) Cost Estimation The rehabilitation cost for interventions for Dinapur STP is estimated to be Rs. 29,765,333.
Table 2.28 Rehabilitation Cost of Dinapur STP
Sr. Items Cost (Rs.) 1 Civil Works 21,218,333 2 Mechanical Works 6,547,000 3 Electrical Works 1,385,000 4 Instrumentation Works 615,000
Total capital cost 29,765,333 2.3 PROVISIONS FOR DISTRICT II AND IV 2.3.1 Planning Scheme The following Table summaries the existing, sanctioned and proposed priority facilities in District II and IV.
1) Existing Major Sewage Facility a) Orderly Bazaar trunk sewer
2) Sanctioned Facility a) Reliving trunk sewer
3) Proposed Facility for Priority Project a) Varuna River interceptor sewer and extension of relieving trunk sewer b) Sewage pumping stations (Sathwa at STP site and interceptor pumping stations) c) Sathwa sewage treatment plant
2.3.2 Varuna River Interceptor Sewer (1) Master Plan Provisions The Master Plan strategies are categorized in to two components, Varuna Left Bank Interceptor and Varuna right Bank Interceptor, based on natural drainage. The Varuna left bank interceptor is further divided into two interceptors, namely left bank upstream (u/s) and downstream (d/s) interceptor and these interceptors meet at the proposed Pumping Station at Chaukaghat. The interceptor proposed on the upstream of Varuna left bank upto Chaukaghat diverts the flow from the Central Jail Nala, Rajghat Nala, Chamrautia Nala, and Nala of Khajuri Colony. This interceptor will also cater to the sewage generated from the sub districts. Similarly, the interceptor proposed on the down stream of the left bank Varuna River will cater to the settlements located in the sub district while diverting the flow from Nala of Basti, Hukulganj Nala, Banaras Nala and Narokhar Nala. The Varuna right bank interceptor is also divided into two interceptors, viz. right bank (u/s) and right bank (d/s) sections. The up stream section of the interceptor diverts flow from the Phulwaria Nala, Sadar Bazar Nala, Drain of Hotels Nala, Raja Bazar Nala and Telia Bagh Nala. The down stream section of this interceptor will divert the flow from the nala near Nakkhi Ghat. This interceptor is also planned to convey the sewage generated in the respective sewage sub districts. As per Master Plan, Varuna River left and right bank interceptor sewers (upstream and downstream) shall intercept the sewage water of area and will transfer it to intermediate pumping station at
Final Report on Water Quality Management Plan for Ganga RiverVolume IV-4, Feasibility Study for Varanasi City, Part I, Sewerage Scheme
2-65
Chaukaghat (left bank). Sewage flow of sub-central drainage basin (District II, Zone A) conveyed by Trunk relief sewer (presently under construction) shall also be transferred to the Chaukaghat intermediate pumping station. Varuna River crossing below bed level is proposed under the Master Plan for transfer of flow of trunk relief sewer and right bank interceptor sewer to left bank Chaukaghat pumping station. From Chaukaghat pumping station sewage will be pumped and transferred to Pandeypur Crossing by a rising main. From Pandeypur Crossing to proposed Sathwa Sewage Treatment Plant, sewage flows by gravity trunk sewer (Sathwa Trunk Sewer). Sewage from District II, Zone C and Future Service Area (FSA 1) will be also intercepted by the same Sathwa trunk sewer. (2) Evaluation of Alternatives on Planning While planning the Varuna River interceptor sewerage system following important points were considered: Interception of Phulwaria Nala Phulwaria nala meets Varuna River near cantonment boundary. Catchment of Phulwaria falls in District IV under FSA 2 (Future Service Area). This area comes under Stage II phase in Master Plan for which a sewage treatment plant is proposed at Lohta. However, census data and visual interpretation of land use indicates that density in this area is already greater than 120 persons per hectare. Present measured flow of Phulwaria Nala is around 7.60 mld. This nala can be intercepted near Varuna River confluence point and can be conveyed to Chaukaghat pumping station or can be intercepted near railway line for its conveyance to proposed Lohta STP. It is proposed to intercept and divert the Phulwaria Nala flow to the Varuna river right bank interceptor sewer (u/s) until Lohta STP scheme is commissioned. I & D works for Phulwaria Nala is thus designed for present flow only. Single pumping station vs two pumping station at Chaukaghat As per Master Plan, Varuna river, left and right bank, interceptor sewer (u/s and d/s) shall carry the sewage to Chaukaghat. Two options are available for the conveyance of sewage from Chaukaghat to Pandeypur Crossing: Option 1: Under this option a single pumping station can be constructed for both side interceptor sewers at left or right bank of river Varuna at Chaukaghat. This requires river under bed sewer crossing from left bank to right bank or right bank to left bank. Sewer crossing through river bed from right bank to left bank requires special measures as the diameter of sewer shall be more that 2200 mm (will include trunk relief sewer flow). Similarly left bank sewer flow to right bank pumping station requires two-time river crossing (one for gravity sewer and second for rising main). Option 2: Under this option two separate pumping stations can be constructed on both the banks of Varuna River to cater both bank interceptor flows. Considering the site conditions, area availability, amount of flow and flexibility in operation and maintenance, two separate sewage pumping stations are proposed to cater the left bank and right bank interceptor sewer flow separately. Narokhar Nala flow diversion Narokhar nala catchment covers areas of ward No. 7 (Pahadiya), 25 (Mavaiya) and 27 (Sarnath) which falls under Non Sewered Area (NSA1). It is proposed to intercept this nala at the downstream end near Varuna River. Narokhar Nala flow can be diverted to a) Dinapur STP, or b) Left bank interceptor sewer (d/s) on Panchkoshi road. Anticipated flow in year 2015 and 2030 at Narokhar Nala is 14 mld
Final Report on Water Quality Management Plan for Ganga RiverVolume IV-4, Feasibility Study for Varanasi City, Part I, Sewerage Scheme
2-66
and 18 mld respectively. A rising main of 2760 m long is required for conveyance of sewage from identified location for I&D works for Narokhar Nala, which is only 1880 m in case the sewage is to be conveyed to left bank interceptor on Panchkoshi Road. Static head requirement for both the cases is same. So the option of transfer of Narokhar Nala flow to Dinapur STP shall require high capital cost for rising main and higher operation and maintenance cost due to high head pumps, as the head loss will be more in longer rising main. Further, construction cost for providing an additional 18 MLD capacity sewage treatment plant at Dinapur plant shall be more than the cost of same capacity plant in Sathwa STP as the overall effective increase in plant capacity at Sathwa would be lesser. Considering the above factors, it is decided to divert the Narokhar Nala flow to Varuna River Left Bank Interceptor Sewer (d/s). (3) Proposed Scheme Based on survey results and preliminary design of Varuna river interceptor sewerage system following scheme is proposed for the collection and transportation of wastewater (Figure2.17): Right Bank
• Phulwaria Nala shall be intercepted and diverted to right bank interceptor sewer (u/s) by 1620 m long rising main. Interception and diversion work shall be designed for present flow (7.60 mld) as the catchment flow of this nala will ultimately go to Lohta STP.
• Right bank Interceptor Sewer (u/s) from Varanasi Cantonment Board to proposed Chaukaghat pumping station (R/B) through Kennedy Road and Raja Bazar Road (3150 m).
• Right bank interceptor sewer (d/s) on GT Road starting near City Railway Station from Nakkhi drain to Chaukaghat pumping station (right bank) of 750 m length.
• An interception and diversion works with a pumping station to intercept Saraiya Nala near Puranapul which will be connected to Varuna Right Bank (d/s) interceptor sewer.
• Chaukaghat pumping station (right bank) and rising main (1200 m) up to Pandeypur Crossing including river crossing on Varuna. Capacity of Chaukaghat pumping station shall also include the trunk relief sewer flow.
Left Bank
• Left bank interceptor sewer (u/s) from Sun Beam School to Chaukaghat pumping station (left bank) through Central Jail Road, State Bank of India and on Makbul Alam Marg (2100 m).
• Left bank interceptor sewer (d/s) from Panchkoshi road to Pandeypur crossing (1035 m). • Interception and diversion (including pumping) of Narokhar nala, at the junction of railway
line and Narokhar nala, and its disposal into left bank interceptor sewer (d/s) on Panchkoshi road through a 1880 m rising main.
• Chaukaghat pumping station (left bank) and rising main (1000 m) up to Pandeypur Crossing. • A trunk sewer (3870 m) from Pandeypur Crossing to Sathwa Main Pumping Station at STP
site. • Sathwa Sewage Treatment Plant.
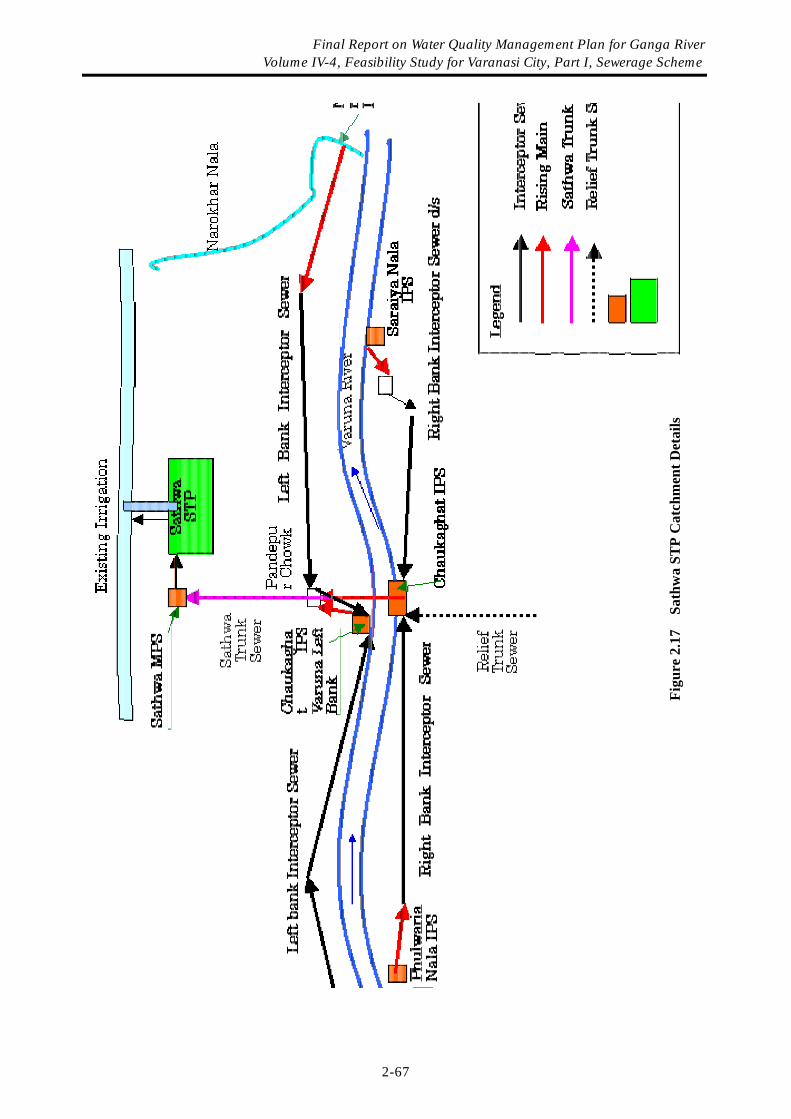
Fi
gure
2.1
7 S
athw
a ST
P C
atch
men
t Det
ails
Final Report on Water Quality Management Plan for Ganga River Volume IV-4, Feasibility Study for Varanasi City, Part I, Sewerage Scheme
2-67

Final Report on Water Quality Management Plan for Ganga RiverVolume IV-4, Feasibility Study for Varanasi City, Part I, Sewerage Scheme
2-68
(4) Design Engineering Works Design Population Catchment boundary was marked for different interceptor sewers and contributing population and sewage flow for various years were calculated.
Table 2.29 Projected Population of Sathwa STP Catchment
Contributing Population Sr. Catchment Contributing Ward
2008 2015 2023 2030 1 Varuna river right bank (u/s) 6, 19, 33, 51 75,448 85,223 99,067 110,4942 Varuna river right bank (d/s) 8,9,14,19, 36 64,854 72,246 79,707 85,6123 Varuna river left bank (u/s) 2, 21, 38, 82 52,733 75,672 97,583 121,7704 Varuna river left bank (d/s) 7, 25, 27, 20, 23, 82 68,896 92,885 123,353 148,898
5 Sathwa Trunk sewer (Pandeypur to Sathwa STP)
2,4,5,7,20,21,23, 38, 73, 82 99,019 140,576 198,955 239,960
6 Relief Trunk Sewer (including diverted old trunk flow area)
Sub Central District Zone 572,973 632,258
Design Flow Wastewater generation for various areas under different catchment is tabulated below:
Table 2.30 Design Flow of Sathwa STP Catchment (mld)
Contributing Flow Sr. Catchment
2008 2015 2023 2030 1 Varuna river right bank (u/s)1 14.09 15.77 16.50 17.13 2 Varuna river right bank (d/s) 12.97 13.37 13.15 13.27
3 Relief Trunk Sewer (including diverted old trunk flow area) 93.00 106.00 97.00 98.00
A Total Flow to Chaukaghat Right Bank Pumping Stations 120.06 135.14 126.65 128.40
3 Varuna river left bank (u/s) 10.55 14.00 16.10 18.88
B Total Flow to Chaukaghat Left Bank Pumping Stations 10.55 14.00 16.10 18.88
4 Varuna river left bank (d/s)2 13.78 17.19 20.35 23.08
5 Sathwa Trunk sewer (Pandeypur to Sathwa STP) 19.80 26.01 32.83 37.19
C Total Flow of Sathwa MPS (A+B+4+5) 164.19 192.34 195.93 207.55
Note: 1. Sewage flow includes 7.60 mld of Phulwaria nala flow. 2. Sewage flow includes 10.83 mld (2008), 13.24 mld (2015), 15.32 mld (2023) & 17.21 mld (2030) of Narokhar Nala flow
Design of Interceptor Sewer Detailed design of interceptor sewer is given in Annexure 4-1 and is summarised below:
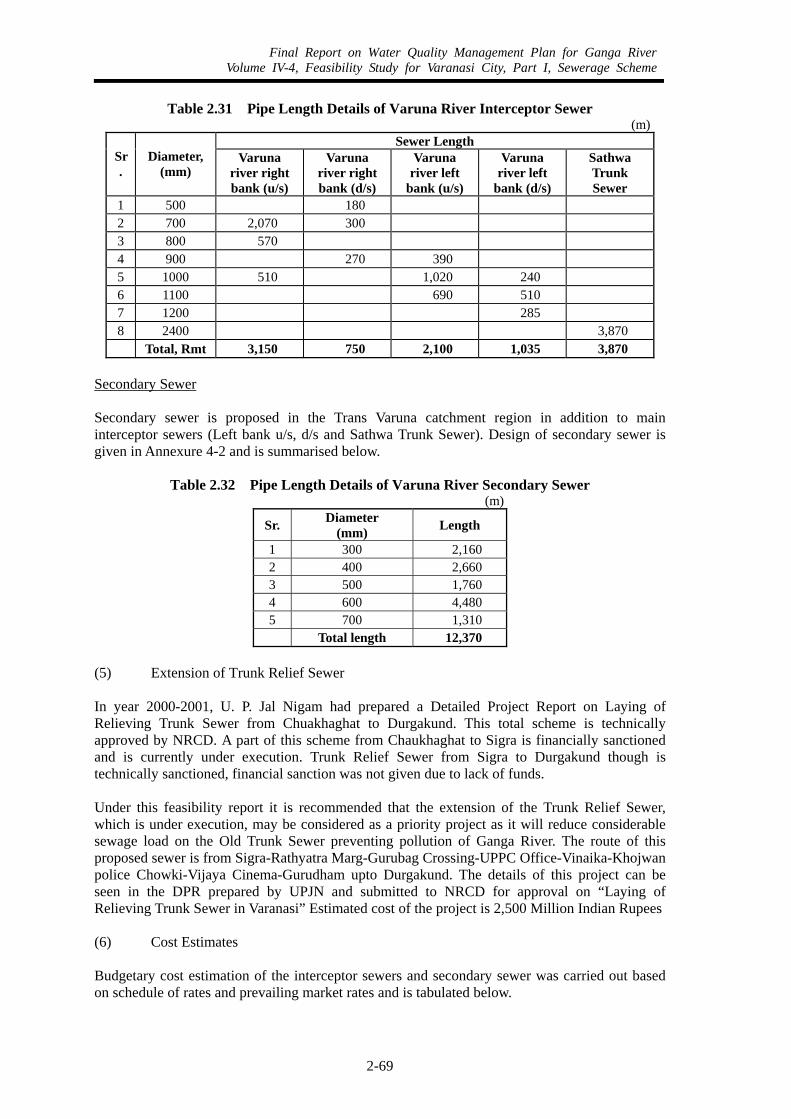
Final Report on Water Quality Management Plan for Ganga RiverVolume IV-4, Feasibility Study for Varanasi City, Part I, Sewerage Scheme
2-69
Table 2.31 Pipe Length Details of Varuna River Interceptor Sewer (m)
Sewer Length Sr.
Diameter, (mm)
Varuna river right bank (u/s)
Varuna river right bank (d/s)
Varuna river left
bank (u/s)
Varuna river left
bank (d/s)
Sathwa Trunk Sewer
1 500 180 2 700 2,070 300 3 800 570 4 900 270 390 5 1000 510 1,020 240 6 1100 690 510 7 1200 285 8 2400 3,870 Total, Rmt 3,150 750 2,100 1,035 3,870
Secondary Sewer Secondary sewer is proposed in the Trans Varuna catchment region in addition to main interceptor sewers (Left bank u/s, d/s and Sathwa Trunk Sewer). Design of secondary sewer is given in Annexure 4-2 and is summarised below.
Table 2.32 Pipe Length Details of Varuna River Secondary Sewer (m)
Sr. Diameter (mm) Length
1 300 2,160 2 400 2,660 3 500 1,760 4 600 4,480 5 700 1,310 Total length 12,370
(5) Extension of Trunk Relief Sewer In year 2000-2001, U. P. Jal Nigam had prepared a Detailed Project Report on Laying of Relieving Trunk Sewer from Chuakhaghat to Durgakund. This total scheme is technically approved by NRCD. A part of this scheme from Chaukhaghat to Sigra is financially sanctioned and is currently under execution. Trunk Relief Sewer from Sigra to Durgakund though is technically sanctioned, financial sanction was not given due to lack of funds. Under this feasibility report it is recommended that the extension of the Trunk Relief Sewer, which is under execution, may be considered as a priority project as it will reduce considerable sewage load on the Old Trunk Sewer preventing pollution of Ganga River. The route of this proposed sewer is from Sigra-Rathyatra Marg-Gurubag Crossing-UPPC Office-Vinaika-Khojwan police Chowki-Vijaya Cinema-Gurudham upto Durgakund. The details of this project can be seen in the DPR prepared by UPJN and submitted to NRCD for approval on “Laying of Relieving Trunk Sewer in Varanasi” Estimated cost of the project is 2,500 Million Indian Rupees (6) Cost Estimates Budgetary cost estimation of the interceptor sewers and secondary sewer was carried out based on schedule of rates and prevailing market rates and is tabulated below.
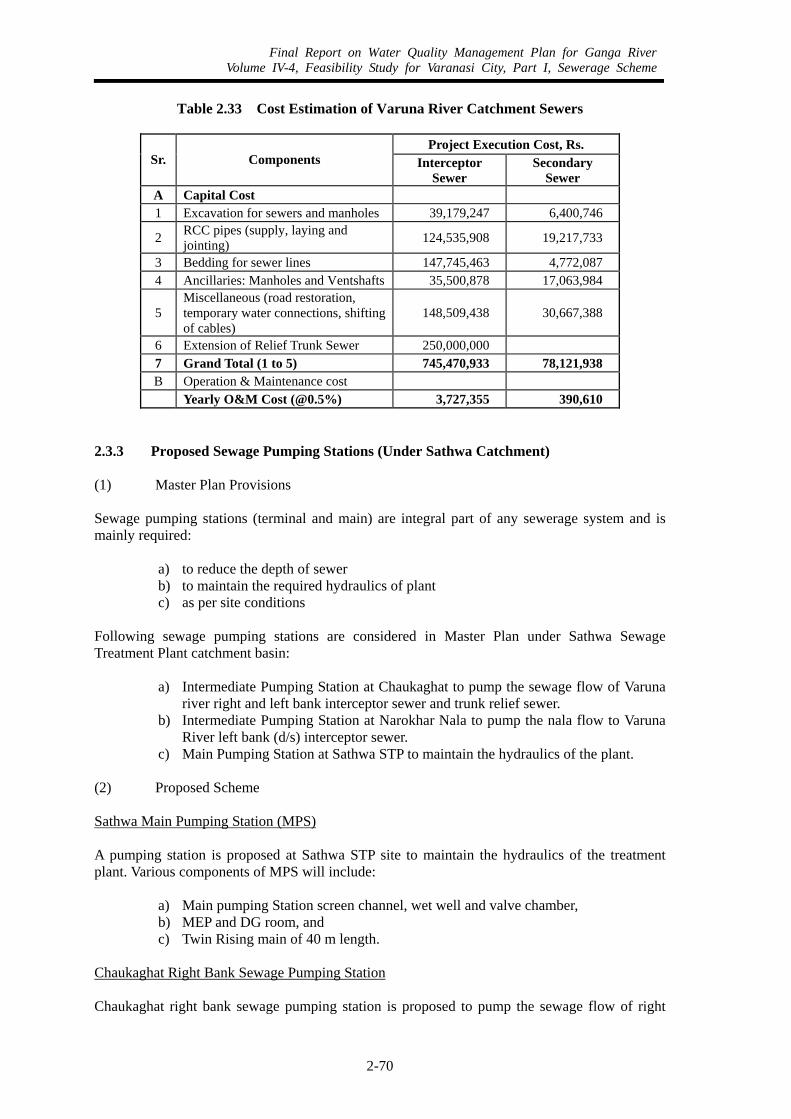
Final Report on Water Quality Management Plan for Ganga RiverVolume IV-4, Feasibility Study for Varanasi City, Part I, Sewerage Scheme
2-70
Table 2.33 Cost Estimation of Varuna River Catchment Sewers
Project Execution Cost, Rs. Sr. Components Interceptor
Sewer Secondary
Sewer A Capital Cost 1 Excavation for sewers and manholes 39,179,247 6,400,746
2 RCC pipes (supply, laying and jointing) 124,535,908 19,217,733
3 Bedding for sewer lines 147,745,463 4,772,087 4 Ancillaries: Manholes and Ventshafts 35,500,878 17,063,984
5 Miscellaneous (road restoration, temporary water connections, shifting of cables)
148,509,438 30,667,388
6 Extension of Relief Trunk Sewer 250,000,000 7 Grand Total (1 to 5) 745,470,933 78,121,938 B Operation & Maintenance cost Yearly O&M Cost (@0.5%) 3,727,355 390,610
2.3.3 Proposed Sewage Pumping Stations (Under Sathwa Catchment) (1) Master Plan Provisions Sewage pumping stations (terminal and main) are integral part of any sewerage system and is mainly required:
a) to reduce the depth of sewer b) to maintain the required hydraulics of plant c) as per site conditions
Following sewage pumping stations are considered in Master Plan under Sathwa Sewage Treatment Plant catchment basin:
a) Intermediate Pumping Station at Chaukaghat to pump the sewage flow of Varuna river right and left bank interceptor sewer and trunk relief sewer.
b) Intermediate Pumping Station at Narokhar Nala to pump the nala flow to Varuna River left bank (d/s) interceptor sewer.
c) Main Pumping Station at Sathwa STP to maintain the hydraulics of the plant. (2) Proposed Scheme
Sathwa Main Pumping Station (MPS) A pumping station is proposed at Sathwa STP site to maintain the hydraulics of the treatment plant. Various components of MPS will include:
a) Main pumping Station screen channel, wet well and valve chamber, b) MEP and DG room, and c) Twin Rising main of 40 m length.
Chaukaghat Right Bank Sewage Pumping Station Chaukaghat right bank sewage pumping station is proposed to pump the sewage flow of right
Final Report on Water Quality Management Plan for Ganga RiverVolume IV-4, Feasibility Study for Varanasi City, Part I, Sewerage Scheme
2-71
bank interceptor sewers and, presently, relief trunk sewer (under construction) upto Pandeypur Crossing. Various component of pumping station include:
a) Sewage pumping station screen channel, wet well and valve chamber, b) MEP and DG Room, c) Rising main of 1200 m length from pumping station to Pandeypur Crossing, and d) River crossing structure on Varuna river for rising main
Chaukaghat Left Bank Sewage Pumping Station Chaukaghat left bank sewage pumping station will receive the sewage flow of left bank u/s interceptor sewer and this flow will be pumped to Pandeypur Crossing. Various component of pumping station includes:
a) Sewage pumping station, screen channel, wet well and valve chamber, b) MEP and DG Room, c) Rising main for 1000 m length from pumping station to Pandeypur Crossing.
Narokhar Nala Sewage Pumping Station It is proposed to intercept and divert (I&D) the flow of Narokhar Nala near the junction of Railway line with Narokhar Nala. Flow of this nala shall be pumped to the Left bank interceptor sewer (d/s) on Panchkoshi Road. Proposed scheme for Narokhar Nala includes:
a) Construction of Intake weir and training of Nala, b) Diversion of flow to Grit channels, c) Intermediate Sewage Pumping station screen channel, wet well and valve
chamber, d) Main Electrical Panel (MEP) and Diesel Genset (DG) Room, and e) Rising main of 1830 m length from pumping station to left bank interceptor sewer
(d/s) on Panchkoshi road. Phulwaria Nala Pumping Station It is proposed to intercept and divert (I&D) the flow of Phulwaria nala, near Cantonment into right bank interceptor sewer. Phulwaria nala catchment falls under District IV, FSA 2, which comes under Lohta STP catchment in Phase II. Therefore, Interception and Diversion work is proposed for the present flow only and this facility will be dismantled in the future. Proposed scheme for Phulwaria Nala includes:
a) Construction of Intake weir and training of Nala, b) Diversion of flow to Grit channels, c) Intermediate Sewage Pumping station of 7.60 MLD average flow capacity
including screen channel, wet well and valve chamber, d) Main Electrical Panel (MEP) and Diesel Genset (DG) Room, and e) Rising main of 1620 m length from pumping station to right bank interceptor
sewer Saraiya Nala Pumping Station It is proposed to intercept and divert (I&D) the flow of Nala running in Saraiya near the barrage on River Varuna. Flow of this nala shall be pumped to the Right bank interceptor sewer (d/s) on Mugalsarai Road near Nakkhi Nala. Proposed scheme for Saraiya Nala includes:
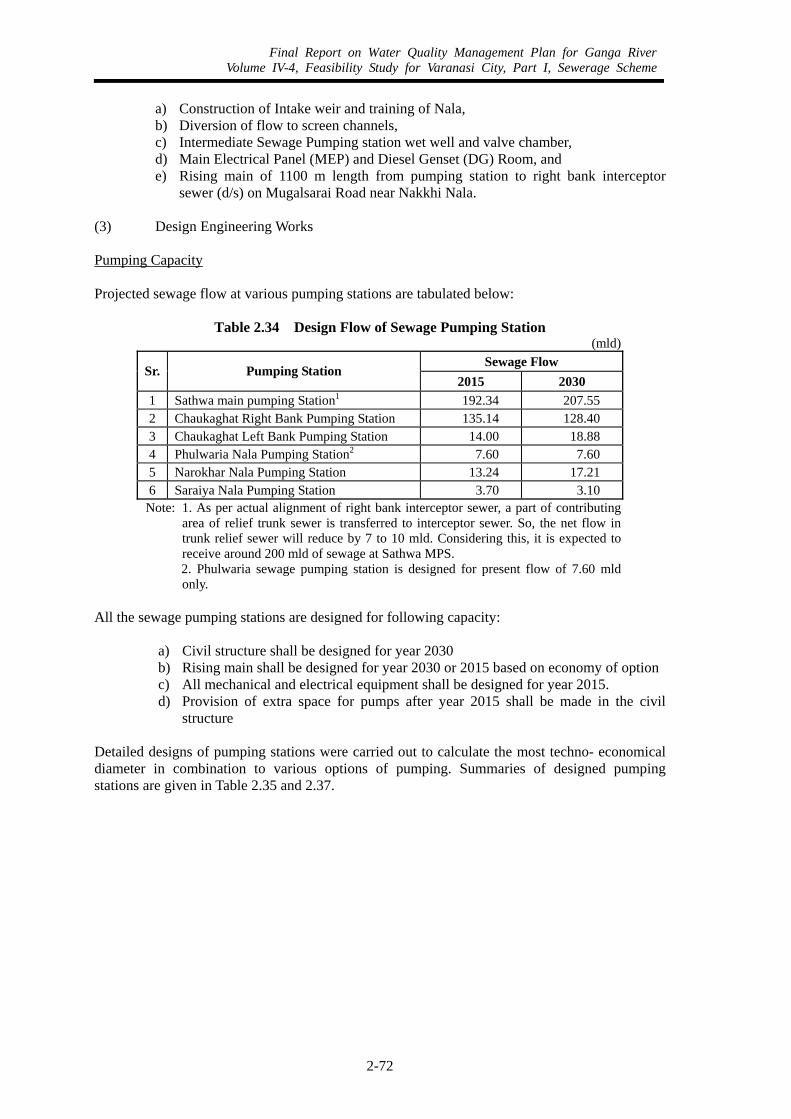
Final Report on Water Quality Management Plan for Ganga RiverVolume IV-4, Feasibility Study for Varanasi City, Part I, Sewerage Scheme
2-72
a) Construction of Intake weir and training of Nala, b) Diversion of flow to screen channels, c) Intermediate Sewage Pumping station wet well and valve chamber, d) Main Electrical Panel (MEP) and Diesel Genset (DG) Room, and e) Rising main of 1100 m length from pumping station to right bank interceptor
sewer (d/s) on Mugalsarai Road near Nakkhi Nala. (3) Design Engineering Works
Pumping Capacity Projected sewage flow at various pumping stations are tabulated below:
Table 2.34 Design Flow of Sewage Pumping Station (mld)
Sewage Flow Sr. Pumping Station
2015 2030 1 Sathwa main pumping Station1 192.34 207.55 2 Chaukaghat Right Bank Pumping Station 135.14 128.40 3 Chaukaghat Left Bank Pumping Station 14.00 18.88 4 Phulwaria Nala Pumping Station2 7.60 7.60 5 Narokhar Nala Pumping Station 13.24 17.21 6 Saraiya Nala Pumping Station 3.70 3.10
Note: 1. As per actual alignment of right bank interceptor sewer, a part of contributing area of relief trunk sewer is transferred to interceptor sewer. So, the net flow in trunk relief sewer will reduce by 7 to 10 mld. Considering this, it is expected to receive around 200 mld of sewage at Sathwa MPS. 2. Phulwaria sewage pumping station is designed for present flow of 7.60 mld only.
All the sewage pumping stations are designed for following capacity:
a) Civil structure shall be designed for year 2030 b) Rising main shall be designed for year 2030 or 2015 based on economy of option c) All mechanical and electrical equipment shall be designed for year 2015. d) Provision of extra space for pumps after year 2015 shall be made in the civil
structure Detailed designs of pumping stations were carried out to calculate the most techno- economical diameter in combination to various options of pumping. Summaries of designed pumping stations are given in Table 2.35 and 2.37.
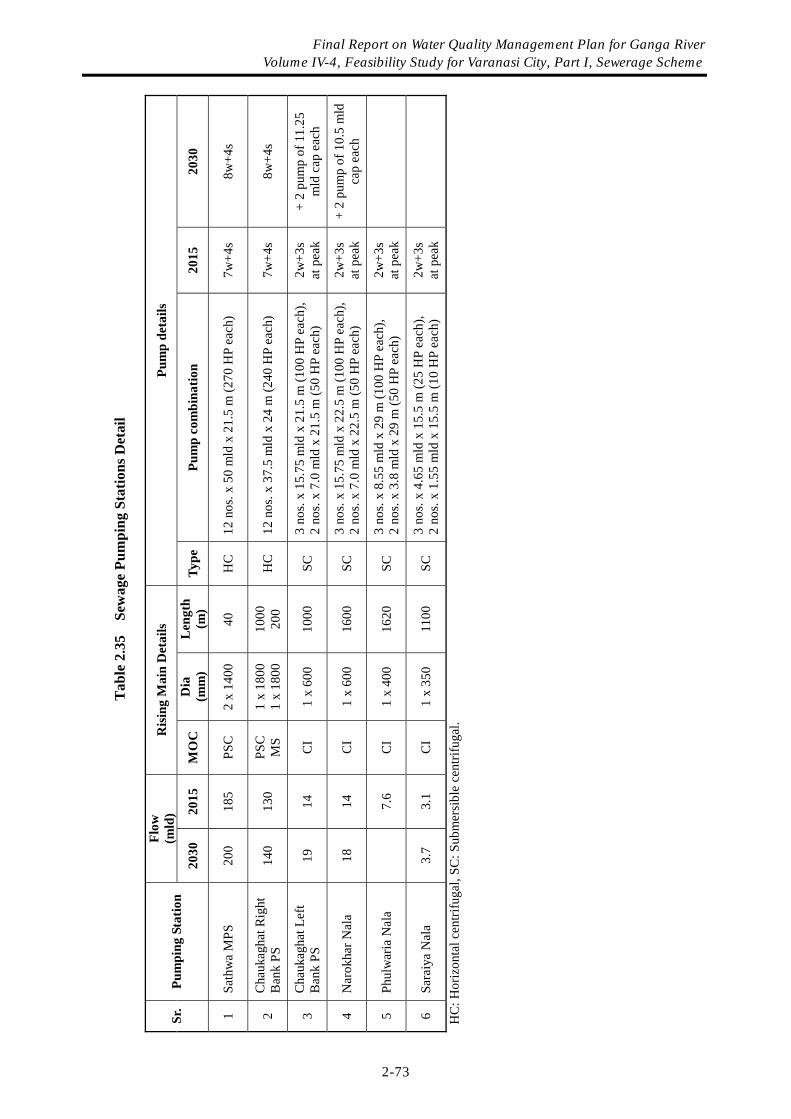
T
able
2.3
5 S
ewag
e Pu
mpi
ng S
tatio
ns D
etai
l
Flow
(m
ld)
Ris
ing
Mai
n D
etai
ls
Pum
p de
tails
Sr
. Pu
mpi
ng S
tatio
n 20
30
2015
M
OC
D
ia
(mm
) L
engt
h (m
) Ty
pe
Pum
p co
mbi
natio
n 20
15
2030
1 Sa
thw
a M
PS
200
185
PSC
2
x 14
00
40
HC
12
nos
. x 5
0 m
ld x
21.
5 m
(270
HP
each
) 7w
+4s
8w+4
s
2 C
hauk
agha
t Rig
ht
Ban
k PS
14
0 13
0 PS
C
MS
1 x
1800
1
x 18
00
1000
20
0 H
C
12 n
os. x
37.
5 m
ld x
24
m (2
40 H
P ea
ch)
7w+4
s 8w
+4s
3 C
hauk
agha
t Lef
t B
ank
PS
19
14
CI
1 x
600
1000
SC
3
nos.
x 15
.75
mld
x 2
1.5
m (1
00 H
P ea
ch),
2
nos.
x 7.
0 m
ld x
21.
5 m
(50
HP
each
)
2w+3
s
at p
eak
+ 2
pum
p of
11.
25
mld
cap
eac
h
4 N
arok
har N
ala
18
14
CI
1 x
600
1600
SC
3
nos.
x 15
.75
mld
x 2
2.5
m (1
00 H
P ea
ch),
2
nos.
x 7.
0 m
ld x
22.
5 m
(50
HP
each
)
2w+3
s
at p
eak
+ 2
pum
p of
10.
5 m
ld
cap
each
5 Ph
ulw
aria
Nal
a
7.6
CI
1 x
400
1620
SC
3
nos.
x 8.
55 m
ld x
29
m (1
00 H
P ea
ch),
2
nos.
x 3.
8 m
ld x
29
m (5
0 H
P ea
ch)
2w
+3s
at
pea
k
6 Sa
raiy
a N
ala
3.7
3.1
CI
1 x
350
1100
SC
3
nos.
x 4.
65 m
ld x
15.
5 m
(25
HP
each
),
2 no
s. x
1.55
mld
x 1
5.5
m (1
0 H
P ea
ch)
2w
+3s
at p
eak
HC
: Hor
izon
tal c
entri
fuga
l, SC
: Sub
mer
sibl
e ce
ntrif
ugal
.
Final Report on Water Quality Management Plan for Ganga River Volume IV-4, Feasibility Study for Varanasi City, Part I, Sewerage Scheme
2-73

T
able
2.3
6 U
nit D
etai
ls o
f Sew
age
Pum
ping
Sta
tions
Scre
en C
hann
el
Wet
Wel
l D
ry W
ell /
Val
ve C
ham
ber*
Sr
Pu
mpi
ng S
tatio
n N
o.
L (m
) W
(m)
A
(sqm
) D
T (m
in)
No.
L
(m)
W (m
) A
(s
qm)
No.
L
(m)
W (m
) A
(s
qm)
1 Sa
thw
a M
PS
6 6
2.4
86.4
5.
00
2 20
.0
14.0
56
0.0
1 20
.0
16.0
32
0.0
2 C
hauk
agha
t Rig
ht B
ank
PS
4 6
2.4
57.6
5.
00
1 38
.0
11.6
44
0.8
1 38
.0
10.0
21
6.0
3 C
hauk
agha
t Lef
t Ban
k PS
2
6 1.
2 14
.4
3.75
1
12.0
6.
2 74
.4
1 12
.0
3.5
42.0
4 N
arok
har N
ala
PS
2 6
1.2
14.4
3.
75
1 12
.0
5.9
70.8
1
12.0
3.
5 42
.0
5 Ph
ulw
aria
Nal
a PS
2
6 1.
0 12
.0
3.75
1
8.0
3.8
30.4
1
8.0
3.0
24.0
6 Sa
raiy
a N
ala
PS
2 6
0.5
6.0
3.75
1
9.0
2.4
21.6
1
9.0
3.0
27.0
N
ote:
L =
Len
gth,
W =
Wid
th, A
= A
rea,
DT
= D
eten
tion
time
at p
eak
flow,
MEP
= M
ain
Elec
trica
l Pan
el, D
G =
Die
sel G
ense
t, PS
= Pu
mpi
ng S
tatio
n *
Dry
wel
l in
Cas
e of
1 &
2; V
alve
cha
mbe
r in
case
of 3
, 4, 5
& 6
Tab
le 2
.37
Uni
t Det
ails
of A
llied
Bui
ldin
gs o
f Sew
age
Pum
ping
Sta
tions
Sr.
Pum
ping
Sta
tion
HT
/ Met
erin
g R
oom
M
EP
Bui
ldin
g D
G R
oom
+ C
ontr
ol
Roo
m
Tran
sfor
mer
Yar
d
1 Sa
thw
a M
PS
21.0
x 6
.5
26.0
x 6
.5
33.5
x 1
0.0
15.0
x 9
.0
2 C
hauk
agha
t Rig
ht B
ank
PS
14.0
x 6
.5
26.0
x 6
.5
33.5
x 1
0.0
15.0
x 8
.5
3 C
hauk
agha
t Lef
t Ban
k PS
14
.0 x
6.0
16
.0 x
6.0
14
.0 x
7.5
13
.0 x
7.5
4 N
arok
har N
ala
PS
14.0
x 6
.0
16.0
x 6
.0
14.0
x 7
.5
13.0
x 7
.5
5 Ph
ulw
aria
Nal
a PS
14
.0 x
6.0
16
.0 x
6.0
14
.0 x
7.5
13
.0 x
7.5
6 Sa
raiy
a N
ala
PS
7.0
x 6.
0 8.
0 x
6.0
8.0
x 6.
0 8.
0 x
6.0
All
the
dim
ensi
ons a
re in
met
ers.
Final Report on Water Quality Management Plan for Ganga River Volume IV-4, Feasibility Study for Varanasi City, Part I, Sewerage Scheme
2-74

Final Report on Water Quality Management Plan for Ganga RiverVolume IV-4, Feasibility Study for Varanasi City, Part I, Sewerage Scheme
2-75
(4) Cost Estimates Budgetary cost estimation of sewage pumping stations was carried out considering prevailing market rates and applicable schedule of rates. Estimated Capital cost and Operation & Maintenance cost of the pumping station is given below. Land Acquisition Cost
Table 2.38 Land Acquisition Cost for Pumping Stations
Sr. Pumping Station Cost (Rs.)
1 Sathwa MPS Considered in STP 2 Chaukaghat Right Bank PS 12,551,000 3 Chaukaghat Left Bank PS 4,967,000 4 Narokhar Nala PS 3,372,000 5 Phulwaria Nala PS 3,620,000 6 Saraiya Nala 1,592,000 Total Cost (1 to 5) 26,102,000
Sathwa Main Pumping Station Cost
Table 2.39 Capital and O&M Cost of Sathwa MPS
Sr. Item Cost (Rs.)
A Capital Cost 1 Civil Cost 60,113,700 2 Mechanical Cost 33,310,000 3 Electrical & Instrumentation Cost 126,714,138 4 Rising main cost 1,059,808 5 Grand Total (1 to 4) 221,197,646
B Yearly Operation & Maintenance Cost
1 Manpower Cost 198,000 2 Power consumption cost (20 hr @ Rs. 3.25/ kWh) 19,114,758 3 Diesel consumption cost (4 hr @ Rs. 20/ ltr) 16,611,556 4 Maintenance of civil work @ 1.5% 901,705 5 Maintenance of rising main @ 0.25% 2,650 6 Maintenance of E&M work @ 3% 4,800,724
Total O & M Cost (Yearly) 41,629,393 Power consumption cost depends on peak flow

Final Report on Water Quality Management Plan for Ganga RiverVolume IV-4, Feasibility Study for Varanasi City, Part I, Sewerage Scheme
2-76
Chaukaghat Right Bank Sewage Pumping Station Cost
Table 2.40 Capital and O&M Cost of Chaukaghat Right bank SPS
Sr. Item Cost (Rs.)
A Capital Cost 1 Civil Cost 68,623,450 2 Mechanical Cost 34,510,000 3 Electrical & Instrumentation Cost 102,875,882 4 Rising main cost 30,771,740 5 Grand Total ( 1 to 4) 236,781,072
B Yearly Operation & Maintenance Cost 1 Manpower Cost 944,000 2 Power consumption cost (20 hr @ Rs.3.25/ kWh) 16,990,896 3 Diesel consumption cost (4 hr @ Rs. 20/ ltr) 16,611,556 4 Maintenance of civil work @ 1.5% 461,576 5 Maintenance of rising main @ 0.25% 76,929 6 Maintenance of E&M work @ 3% 4,121,576 Total O & M Cost (Yearly) 39,206,533
Power consumption cost depends on peak flow
Chaukaghat Left Bank Sewage Pumping Station Cost
Table 2.41 Capital and O&M Cost of Chaukaghat Left Bank SPS
Sr. Item Cost (Rs.)
A Capital Cost 1 Civil Cost 13,835,050 2 Mechanical Cost 4,650,000 3 Electrical & Instrumentation Cost 18,735,479 4 Rising main cost 7,794,700 5 Grand Total ( 1 to 4) 45,015,229
B Yearly Operation & Maintenance Cost
1 Manpower Cost 587,000 2 Power consumption cost (20 hr @ Rs. 3.25/ kWh) 1,769,885 3 Diesel consumption cost (4 hr @ Rs. 20/ ltr) 1,297,778 4 Maintenance of civil work @ 1.5% 116,921 5 Maintenance of rising main @ 0.25% 19,487 6 Maintenance of E&M work @ 3% 701,564 Total O & M Cost (Yearly) 4,492,635
Power consumption cost depends on peak flow
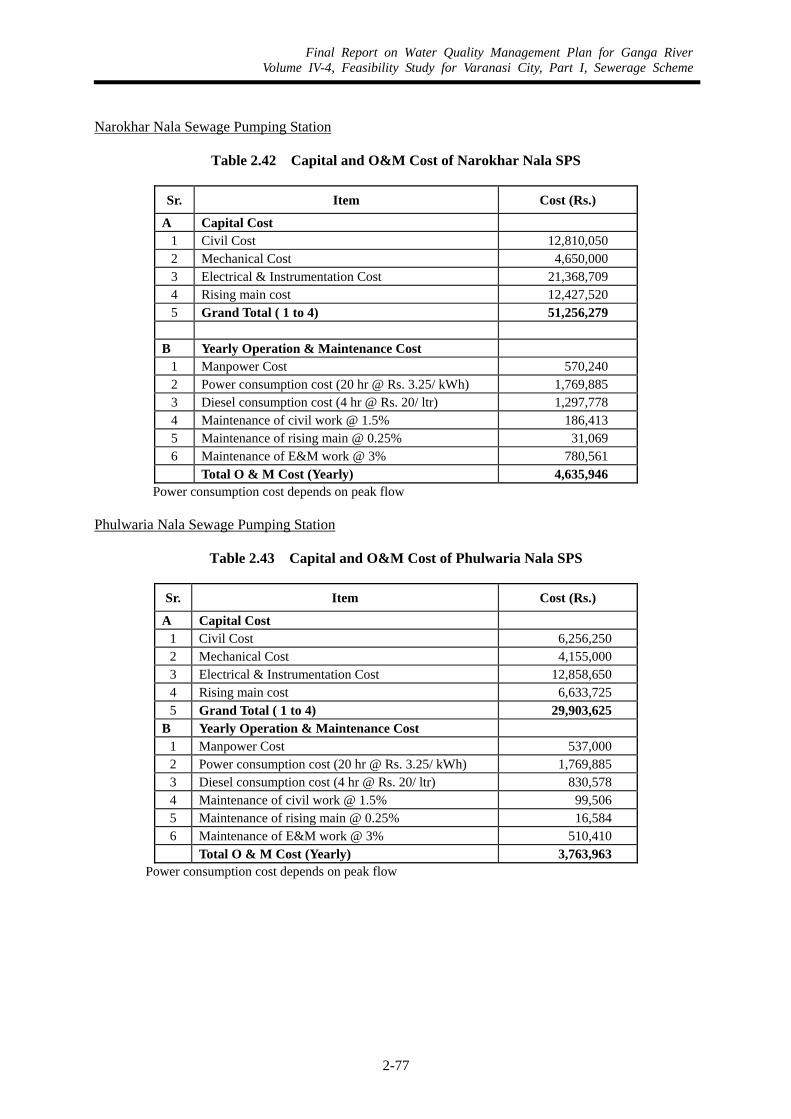
Final Report on Water Quality Management Plan for Ganga RiverVolume IV-4, Feasibility Study for Varanasi City, Part I, Sewerage Scheme
2-77
Narokhar Nala Sewage Pumping Station
Table 2.42 Capital and O&M Cost of Narokhar Nala SPS
Sr. Item Cost (Rs.)
A Capital Cost 1 Civil Cost 12,810,050 2 Mechanical Cost 4,650,000 3 Electrical & Instrumentation Cost 21,368,709 4 Rising main cost 12,427,520 5 Grand Total ( 1 to 4) 51,256,279
B Yearly Operation & Maintenance Cost
1 Manpower Cost 570,240 2 Power consumption cost (20 hr @ Rs. 3.25/ kWh) 1,769,885 3 Diesel consumption cost (4 hr @ Rs. 20/ ltr) 1,297,778 4 Maintenance of civil work @ 1.5% 186,413 5 Maintenance of rising main @ 0.25% 31,069 6 Maintenance of E&M work @ 3% 780,561
Total O & M Cost (Yearly) 4,635,946 Power consumption cost depends on peak flow
Phulwaria Nala Sewage Pumping Station
Table 2.43 Capital and O&M Cost of Phulwaria Nala SPS
Sr. Item Cost (Rs.)
A Capital Cost 1 Civil Cost 6,256,250 2 Mechanical Cost 4,155,000 3 Electrical & Instrumentation Cost 12,858,650 4 Rising main cost 6,633,725 5 Grand Total ( 1 to 4) 29,903,625
B Yearly Operation & Maintenance Cost 1 Manpower Cost 537,000 2 Power consumption cost (20 hr @ Rs. 3.25/ kWh) 1,769,885 3 Diesel consumption cost (4 hr @ Rs. 20/ ltr) 830,578 4 Maintenance of civil work @ 1.5% 99,506 5 Maintenance of rising main @ 0.25% 16,584 6 Maintenance of E&M work @ 3% 510,410
Total O & M Cost (Yearly) 3,763,963 Power consumption cost depends on peak flow

Final Report on Water Quality Management Plan for Ganga RiverVolume IV-4, Feasibility Study for Varanasi City, Part I, Sewerage Scheme
2-71
bank interceptor sewers and, presently, relief trunk sewer (under construction) upto Pandeypur Crossing. Various component of pumping station include:
a) Sewage pumping station screen channel, wet well and valve chamber, b) MEP and DG Room, c) Rising main of 1200 m length from pumping station to Pandeypur Crossing, and d) River crossing structure on Varuna river for rising main
Chaukaghat Left Bank Sewage Pumping Station Chaukaghat left bank sewage pumping station will receive the sewage flow of left bank u/s interceptor sewer and this flow will be pumped to Pandeypur Crossing. Various component of pumping station includes:
a) Sewage pumping station, screen channel, wet well and valve chamber, b) MEP and DG Room, c) Rising main for 1000 m length from pumping station to Pandeypur Crossing.
Narokhar Nala Sewage Pumping Station It is proposed to intercept and divert (I&D) the flow of Narokhar Nala near the junction of Railway line with Narokhar Nala. Flow of this nala shall be pumped to the Left bank interceptor sewer (d/s) on Panchkoshi Road. Proposed scheme for Narokhar Nala includes:
a) Construction of Intake weir and training of Nala, b) Diversion of flow to Grit channels, c) Intermediate Sewage Pumping station screen channel, wet well and valve
chamber, d) Main Electrical Panel (MEP) and Diesel Genset (DG) Room, and e) Rising main of 1830 m length from pumping station to left bank interceptor sewer
(d/s) on Panchkoshi road. Phulwaria Nala Pumping Station It is proposed to intercept and divert (I&D) the flow of Phulwaria nala, near Cantonment into right bank interceptor sewer. Phulwaria nala catchment falls under District IV, FSA 2, which comes under Lohta STP catchment in Phase II. Therefore, Interception and Diversion work is proposed for the present flow only and this facility will be dismantled in the future. Proposed scheme for Phulwaria Nala includes:
a) Construction of Intake weir and training of Nala, b) Diversion of flow to Grit channels, c) Intermediate Sewage Pumping station of 7.60 MLD average flow capacity
including screen channel, wet well and valve chamber, d) Main Electrical Panel (MEP) and Diesel Genset (DG) Room, and e) Rising main of 1620 m length from pumping station to right bank interceptor
sewer Saraiya Nala Pumping Station It is proposed to intercept and divert (I&D) the flow of Nala running in Saraiya near the barrage on River Varuna. Flow of this nala shall be pumped to the Right bank interceptor sewer (d/s) on Mugalsarai Road near Nakkhi Nala. Proposed scheme for Saraiya Nala includes:
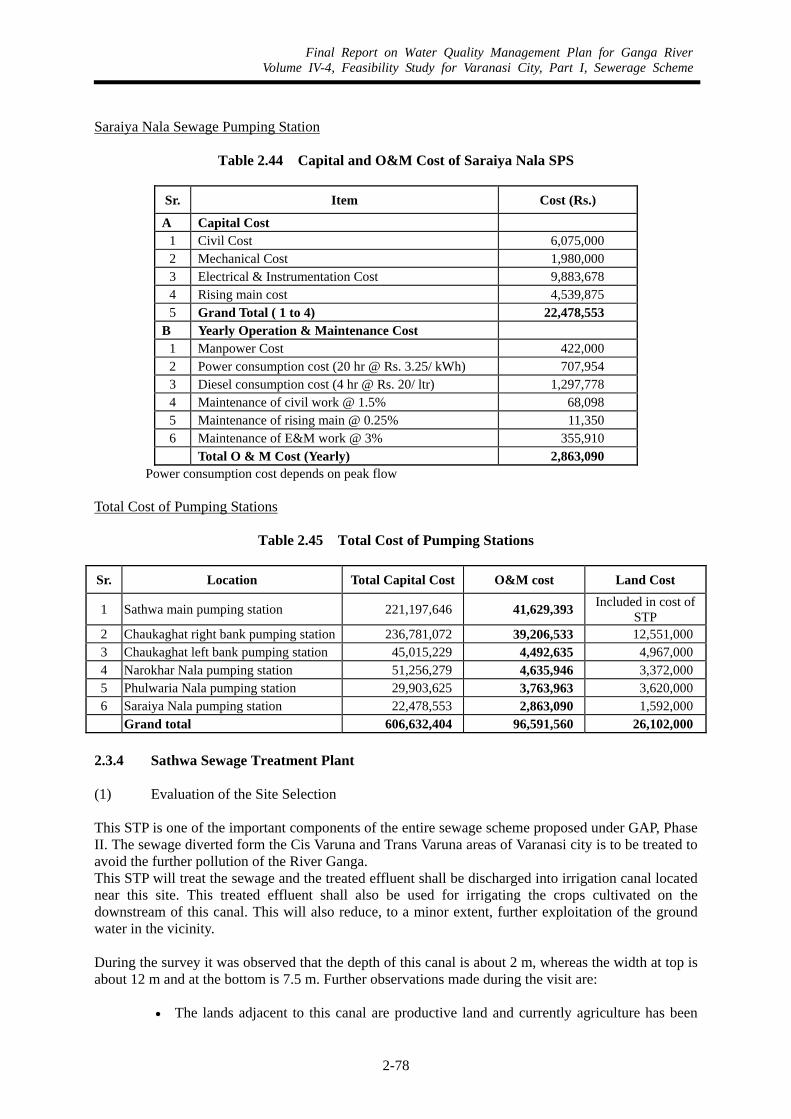
Final Report on Water Quality Management Plan for Ganga RiverVolume IV-4, Feasibility Study for Varanasi City, Part I, Sewerage Scheme
2-78
Saraiya Nala Sewage Pumping Station
Table 2.44 Capital and O&M Cost of Saraiya Nala SPS
Sr. Item Cost (Rs.)
A Capital Cost 1 Civil Cost 6,075,000 2 Mechanical Cost 1,980,000 3 Electrical & Instrumentation Cost 9,883,678 4 Rising main cost 4,539,875 5 Grand Total ( 1 to 4) 22,478,553
B Yearly Operation & Maintenance Cost 1 Manpower Cost 422,000 2 Power consumption cost (20 hr @ Rs. 3.25/ kWh) 707,954 3 Diesel consumption cost (4 hr @ Rs. 20/ ltr) 1,297,778 4 Maintenance of civil work @ 1.5% 68,098 5 Maintenance of rising main @ 0.25% 11,350 6 Maintenance of E&M work @ 3% 355,910
Total O & M Cost (Yearly) 2,863,090 Power consumption cost depends on peak flow
Total Cost of Pumping Stations
Table 2.45 Total Cost of Pumping Stations Sr. Location Total Capital Cost O&M cost Land Cost
1 Sathwa main pumping station 221,197,646 41,629,393 Included in cost of STP
2 Chaukaghat right bank pumping station 236,781,072 39,206,533 12,551,000 3 Chaukaghat left bank pumping station 45,015,229 4,492,635 4,967,000 4 Narokhar Nala pumping station 51,256,279 4,635,946 3,372,000 5 Phulwaria Nala pumping station 29,903,625 3,763,963 3,620,000 6 Saraiya Nala pumping station 22,478,553 2,863,090 1,592,000
Grand total 606,632,404 96,591,560 26,102,000 2.3.4 Sathwa Sewage Treatment Plant (1) Evaluation of the Site Selection This STP is one of the important components of the entire sewage scheme proposed under GAP, Phase II. The sewage diverted form the Cis Varuna and Trans Varuna areas of Varanasi city is to be treated to avoid the further pollution of the River Ganga. This STP will treat the sewage and the treated effluent shall be discharged into irrigation canal located near this site. This treated effluent shall also be used for irrigating the crops cultivated on the downstream of this canal. This will also reduce, to a minor extent, further exploitation of the ground water in the vicinity. During the survey it was observed that the depth of this canal is about 2 m, whereas the width at top is about 12 m and at the bottom is 7.5 m. Further observations made during the visit are:
• The lands adjacent to this canal are productive land and currently agriculture has been
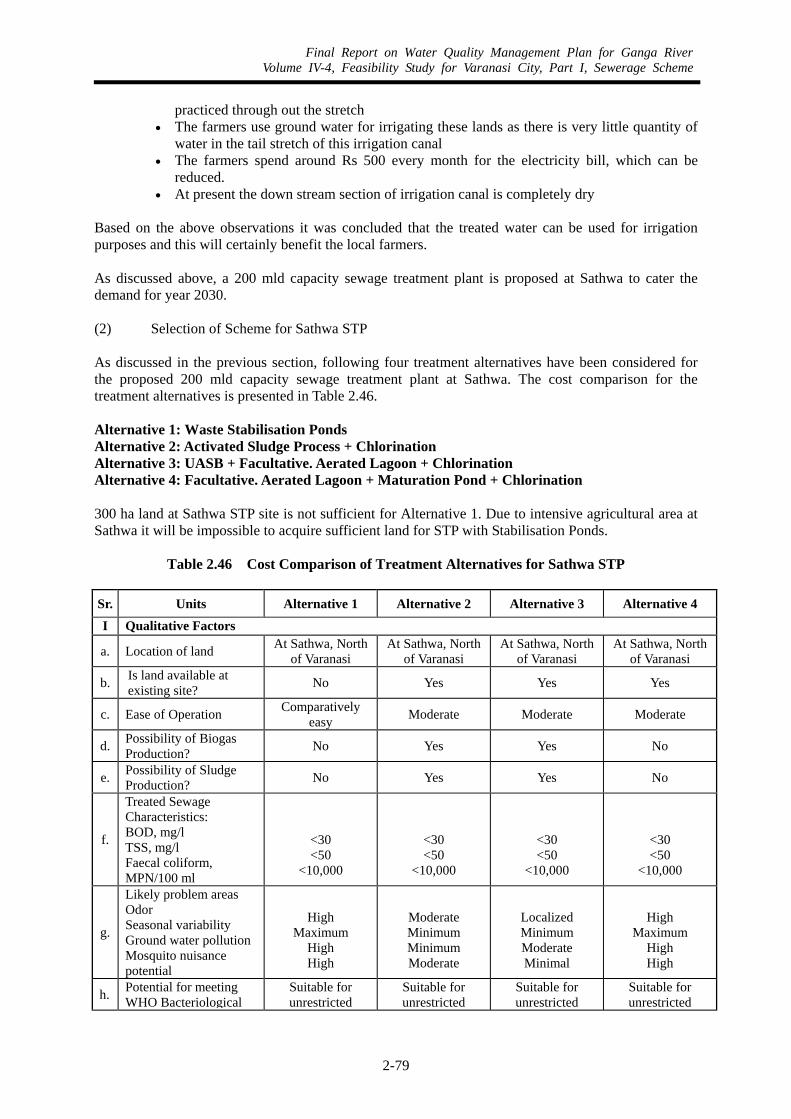
Final Report on Water Quality Management Plan for Ganga RiverVolume IV-4, Feasibility Study for Varanasi City, Part I, Sewerage Scheme
2-79
practiced through out the stretch • The farmers use ground water for irrigating these lands as there is very little quantity of
water in the tail stretch of this irrigation canal • The farmers spend around Rs 500 every month for the electricity bill, which can be
reduced. • At present the down stream section of irrigation canal is completely dry
Based on the above observations it was concluded that the treated water can be used for irrigation purposes and this will certainly benefit the local farmers. As discussed above, a 200 mld capacity sewage treatment plant is proposed at Sathwa to cater the demand for year 2030. (2) Selection of Scheme for Sathwa STP As discussed in the previous section, following four treatment alternatives have been considered for the proposed 200 mld capacity sewage treatment plant at Sathwa. The cost comparison for the treatment alternatives is presented in Table 2.46. Alternative 1: Waste Stabilisation Ponds Alternative 2: Activated Sludge Process + Chlorination Alternative 3: UASB + Facultative. Aerated Lagoon + Chlorination Alternative 4: Facultative. Aerated Lagoon + Maturation Pond + Chlorination 300 ha land at Sathwa STP site is not sufficient for Alternative 1. Due to intensive agricultural area at Sathwa it will be impossible to acquire sufficient land for STP with Stabilisation Ponds.
Table 2.46 Cost Comparison of Treatment Alternatives for Sathwa STP
Sr. Units Alternative 1 Alternative 2 Alternative 3 Alternative 4
I Qualitative Factors
a. Location of land At Sathwa, North of Varanasi
At Sathwa, North of Varanasi
At Sathwa, North of Varanasi
At Sathwa, North of Varanasi
b. Is land available at existing site? No Yes Yes Yes
c. Ease of Operation Comparatively easy Moderate Moderate Moderate
d. Possibility of Biogas Production? No Yes Yes No
e. Possibility of Sludge Production? No Yes Yes No
f.
Treated Sewage Characteristics: BOD, mg/l TSS, mg/l Faecal coliform, MPN/100 ml
<30 <50
<10,000
<30 <50
<10,000
<30 <50
<10,000
<30 <50
<10,000
g.
Likely problem areas Odor Seasonal variability Ground water pollution Mosquito nuisance potential
High
Maximum High High
Moderate Minimum Minimum Moderate
Localized Minimum Moderate Minimal
High
Maximum High High
h. Potential for meeting WHO Bacteriological
Suitable for unrestricted
Suitable for unrestricted
Suitable for unrestricted
Suitable for unrestricted

Final Report on Water Quality Management Plan for Ganga RiverVolume IV-4, Feasibility Study for Varanasi City, Part I, Sewerage Scheme
2-80
Sr. Units Alternative 1 Alternative 2 Alternative 3 Alternative 4 guidelines for irrigation irrigation irrigation irrigation irrigation
II Quantitative Factors A. Cost (Rs.)
1 Capital Cost Civil cost 402,767,654 666,687,915 587,167,044 448,339,415 Mechanical cost 9,050,000 67,949,763 29,370,505 73,100,000
Electrical & Instrumentation cost 3,008,000 221,623,000 25,810,000 17,318,500
Total Civil, E & M Cost 414,825,654 956,260,678 642,347,549 538,757,915 2 STP Utilities 17,357,923 17,357,923 15,857,923 17,357,923 3 Total Capital Cost 432,183,577 973,618,601 658,205,472 556,115,838
B. Land Requirement As per Design
Area required for 200 mld, ha 370.00 28.00 41.00 94.00
Land Cost+ Land rate (Rs/hectare) 4,199,000 4,199,000 4,199,000 4,199,000 Land Cost (Rs.) 1,553,630,000 117,572,000 172,159,000 394,706,000 C. O & M Cost per annum
1 Operation Cost a Manpower 3,247,200 7,611,600 7,611,600 4,570,800 b Power 921,258 47,524,584 17,922,216 51,134,748 c Chemicals - 2,976,000 2,976,000 2,976,000
2 Maintenance Cost a Civil 8,632,521 13,333,759 11,743,341 8,966,789
b Mechanical and Electrical & Instrumentation 361,740 2,122,156 930,471 2,712,555
3 Total O & M Cost 8,994,261 80,133,126 41,908,573 70,360,892 D. Cost Analysis Land Cost 1,553,630,000 117,572,000 172,159,000 394,706,000 Total Capital Cost 432,183,577 973,618,601 658,205,472 556,115,838 Total Cost 1,985,813,577 1,091,190,601 830,364,472 950,821,838 O & M Cost per year 13,162,725 80,133,126 41,908,573 70,360,892 Resource Recovery* - 12,760,000 12,760,000 - Capitalized Cost (1) 2,188,156,922 2,126,880,681 1,278,449,483 2,032,441,204 Ranking IV III I II Capitalized Cost (2) 2,085,930,310 1,603,635,954 1,052,070,836 1,485,992,377 Ranking IV III I II Note : + Source : Finance & Revenue Dept., Govt. of Uttar Pradesh (1) : Capitalised Cost calculated for 30 years at interest rate of 5% (2) : Capitalised Cost calculated for 15 years at interest rate of 10% * : Cost recovered through Resource Recovery is not considered while working out the Capitalised Cost. (3) Evaluation of Treatment Scheme Alternatives Each treatment Alternative has some positive and some negative aspects to it. These are discussed below with reference to certain key factors. Process Performance The treatment schemes proposed under the four alternatives are suitable and technically viable to meet
Final Report on Water Quality Management Plan for Ganga RiverVolume IV-4, Feasibility Study for Varanasi City, Part I, Sewerage Scheme
2-81
the NRCD guidelines for treated sewage discharge. All the treatment schemes are time tested proven treatment schemes. Inference All four treatment processes satisfy the Process Performance criteria as these will meet the discharge standards as stipulated by NRCD for land irrigation as well as for river discharge. Seasonal Variability As regards coliform removal, the performance of the ponds considered in the Alternatives 1 & 4 will be reduced substantially in the winter months due to low temperatures. While in summer months, coliform removal will improve but effluent BOD will increase owing to algae in the effluent. This effect will not be so pronounced in the alternative of UASB followed by Aerated Lagoon owing to the dampening effect of the UASB. Alternative 3 will be least affected by seasonal variations. Inference Alternative 3 namely, UASB followed by Aerated Lagoon with chlorination, is the most suitable treatment process from the Seasonal Variability aspect as it is least affected by the temperature variations. Environmental Impact (Preliminary Evaluation) Ground Water There is a possibility of ground water contamination in case of first and Alternative 4 due to seepage from the holding area of the ponds although as a precaution all the ponds are proposed to be lined at considerable cost. This possibility is minimum in case of Alternative 2 as well as Alternative 3. Since, the aerated lagoon has the least detention time and therefore, least contact surface with the soil. The aerated lagoon will also be lined Mosquito Mosquito breeding in the pond is generally caused due to weed growth and marginal vegetation in badly maintained ponds. Fly breeding may be another problem in badly maintained ponds. Hence this problem can occur only in badly a maintained pond, which is more likely in case of large size ponds as in Alternative 1 & 4. Odour In summer months, blue green algae may grow vigorously in the pond, giving rise to floating mats of algae. The algae in the mats may then die and give rise to odours. Some odorous sulphides may also be generated in warmer months. Due to mechanical aeration in the second and Alternative 3, odour problem is not foreseen, which could occur in the other alternatives nos. 1 and 4. The UASB may at worst give a slight localised odour problem Inference Alternative 3 of UASB followed by Aerated Lagoon with Chlorination is the most suitable treatment process as it has minimal adverse environmental impact on the population. No odour and mosquito problem is envisaged due to aeration. In comparison to the other alternatives, the holding area of the aerated lagoon, which will also be lined, is very small and there is a minimal possibility of ground water contamination due to seepage.

Final Report on Water Quality Management Plan for Ganga RiverVolume IV-4, Feasibility Study for Varanasi City, Part I, Sewerage Scheme
2-82
Land Availability The available land of 300 hectares is adequate for the Alternatives 2, 3 & 4. The land requirement for the Alternative 1 is lager and found substantially more than the available land. Inference The Alternative 2, 3 & 4 are feasible treatment process from the Land Availability viewpoint as the existing land for the proposed plant at Sathwa is sufficient for this alternative only. However, Alternative 2 & 3 have the least quantum of land requirement. Resource Recovery The treatment Alternative 2 & 3 only offer the avenue for resource recovery from the treatment scheme. The by-products of ASP and UASB system are biogas and excess sludge. The biogas formed can be utilized as an energy source and the sludge as manure. The Operation & Maintenance cost can be partly recovered from the sale of these products. This benefit is available with both Alternative 2 and 3. There is neither possibility of resource recovery from Alternative 1 nor 4. Inference Alternative 2 & 3 are equally beneficial from the Resource Recovery viewpoint as both generate biogas and sludge, which can partly reduce the operating costs. Capitalised Costs The Capitalized Cost of the treatment alternatives is based on Capital Cost, O&M Cost as well as Resource Recovery. The costs are annualised for 15 years at an interest rate of 10%. The Alternative 3 of UASB followed by Aerated Lagoon is the lowest as shown in the Table 2.46. The land cost is included since it will be a revenue asset. Inference Alternative 3 is the least from the Capitalised Cost viewpoint as it has the lowest Present Worth in comparison to the other three treatment alternatives. (4) Recommendation
It can finally be concluded that “Alternative 3: UASB followed by Facultative Aerated Lagoon with Chlorination System” is best suited for the proposed 200 MLD capacity sewage treatment plant at Sathwa. The process will comply with the all the relevant discharge standards as well as being the most economically viable. (5) Sewage Quantity The design year for the sewage treatment plant is 2030. Forecasting the population for the design year meets at the sewage quantity for design of treatment plant. A STP of 200 mld capacity is proposed based on the sewage generation. The Manual on Sewerage and Sewage Treatment prepared by CPHEEO prescribes the guidelines for peak factor for the design of sewerage and sewage treatment plant. The same is reproduced below hereunder.
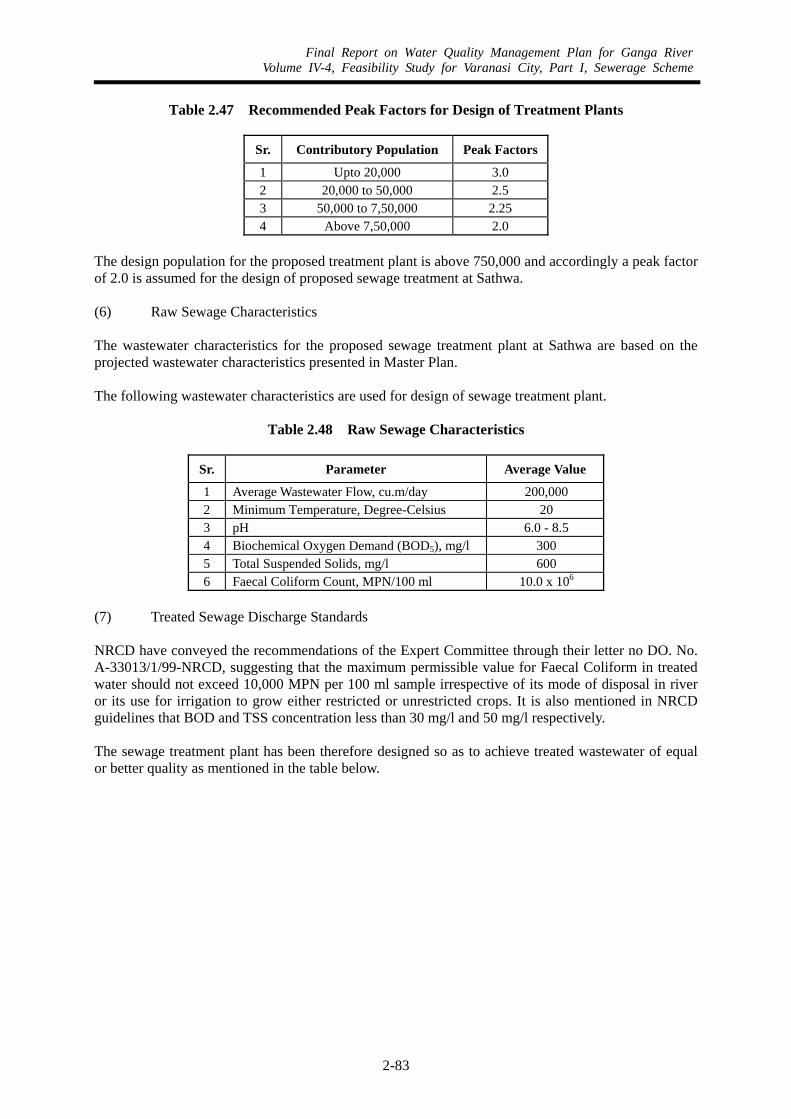
Final Report on Water Quality Management Plan for Ganga RiverVolume IV-4, Feasibility Study for Varanasi City, Part I, Sewerage Scheme
2-83
Table 2.47 Recommended Peak Factors for Design of Treatment Plants
Sr. Contributory Population Peak Factors
1 Upto 20,000 3.0 2 20,000 to 50,000 2.5 3 50,000 to 7,50,000 2.25 4 Above 7,50,000 2.0
The design population for the proposed treatment plant is above 750,000 and accordingly a peak factor of 2.0 is assumed for the design of proposed sewage treatment at Sathwa. (6) Raw Sewage Characteristics The wastewater characteristics for the proposed sewage treatment plant at Sathwa are based on the projected wastewater characteristics presented in Master Plan. The following wastewater characteristics are used for design of sewage treatment plant.
Table 2.48 Raw Sewage Characteristics
Sr. Parameter Average Value
1 Average Wastewater Flow, cu.m/day 200,000 2 Minimum Temperature, Degree-Celsius 20 3 pH 6.0 - 8.5 4 Biochemical Oxygen Demand (BOD5), mg/l 300 5 Total Suspended Solids, mg/l 600 6 Faecal Coliform Count, MPN/100 ml 10.0 x 10⁶
(7) Treated Sewage Discharge Standards
NRCD have conveyed the recommendations of the Expert Committee through their letter no DO. No. A-33013/1/99-NRCD, suggesting that the maximum permissible value for Faecal Coliform in treated water should not exceed 10,000 MPN per 100 ml sample irrespective of its mode of disposal in river or its use for irrigation to grow either restricted or unrestricted crops. It is also mentioned in NRCD guidelines that BOD and TSS concentration less than 30 mg/l and 50 mg/l respectively. The sewage treatment plant has been therefore designed so as to achieve treated wastewater of equal or better quality as mentioned in the table below.

Final Report on Water Quality Management Plan for Ganga RiverVolume IV-4, Feasibility Study for Varanasi City, Part I, Sewerage Scheme
2-84
Table 2.49 Desired Treated Wastewater Quality
Sr. Parameter Value(Irrigation Field/River)
1 pH 5.5 – 9.0 2 Biochemical Oxygen Demand, mg/l < 30 3 Total Suspended Solids, mg/l < 50 4 Faecal Coliform Count, MPN/100 ml <10,000
Design Basis of STP The design basis for the treatment scheme “UASB Process followed by Facultative Aerated Lagoon with Chlorination System” is presented below:
Table 2.50 Design Basis of STP
Sr. Component Value Unit
Data Average flow 200 mld (Average flow) 2.315 cu.m/sec Peak factor 2 times Peak flow 4.630 cu.m/sec
1.0 Inlet Chamber Detention period 30 sec Number of units 1 nos.
2.0 Screen Channel Minimum Approach velocity at average flow 0.3 m/sec Minimum Velocity through screens 0.6 m/sec Maximum Velocity through screens 1.2 m/sec Width of screen bars 4.00 mm Clear Spacing between screen bars (Matt type screen) 6.00 mm Maximum headloss across the screen 0.3 m
3.0 Grit Chamber Velocity 0.3 m/sec Particle size 0.15 mm Specific gravity 2.65 Temperature 20 Deg. C. Settling velocity of particles V 0.0168 m/sec Settling velocity of particles V 1451.52 cu.m/sq.m/day Efficiency 75 % n 1/8 or 0.125 Surface loading 958.95 cu.m/sq.m/day
4.0 UASB Reactor Solids Retention Time 38 days Sludge Bed Concentration 65 kg TSS/cum
Maximum Sludge Bed Height 80 % of hgt. to Gas Collector
Average Upflow velocity 0.5 m/h Maximum Upflow velocity 1.5 m/h Average aperture velocity 0.22 m/h Maximum aperture velocity 5 m/h Average Biogas loading 1 m/h
Angle of gas collector 50 Degrees to horizontal
Hood width 0.44 m Settling zone surface % 75 %
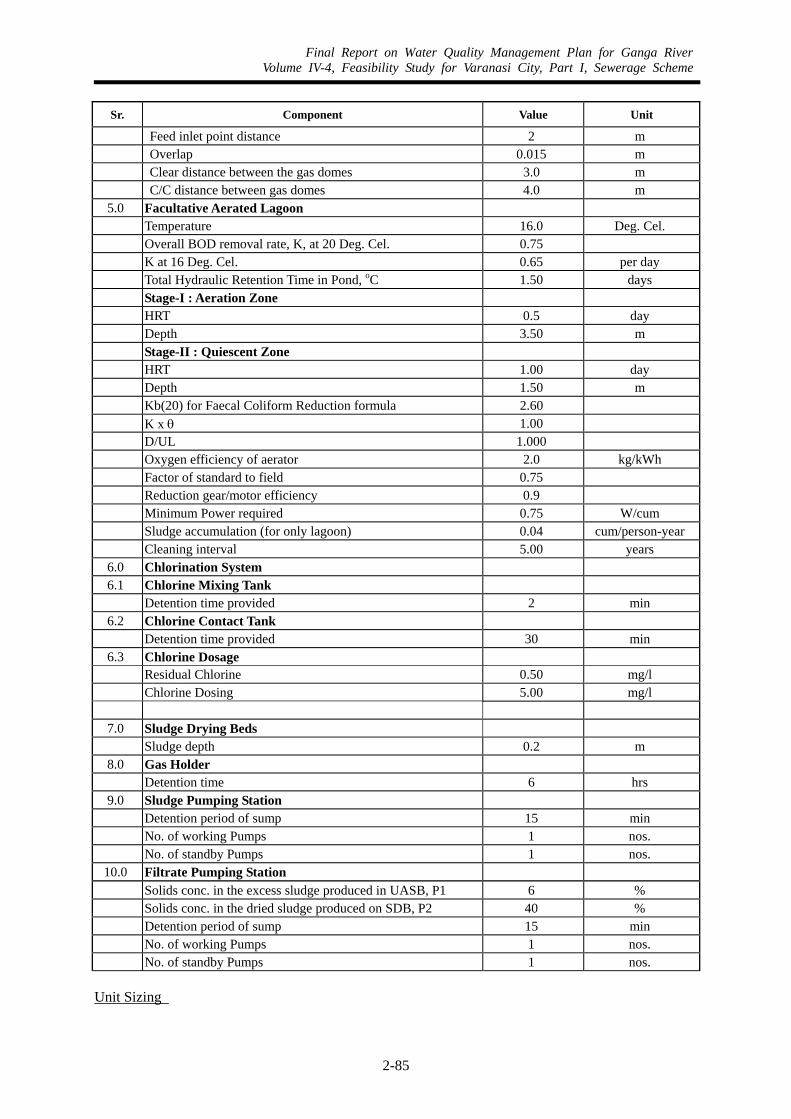
Final Report on Water Quality Management Plan for Ganga RiverVolume IV-4, Feasibility Study for Varanasi City, Part I, Sewerage Scheme
2-85
Sr. Component Value Unit
Feed inlet point distance 2 m Overlap 0.015 m Clear distance between the gas domes 3.0 m C/C distance between gas domes 4.0 m
5.0 Facultative Aerated Lagoon Temperature 16.0 Deg. Cel. Overall BOD removal rate, K, at 20 Deg. Cel. 0.75 K at 16 Deg. Cel. 0.65 per day Total Hydraulic Retention Time in Pond, oC 1.50 days Stage-I : Aeration Zone HRT 0.5 day Depth 3.50 m Stage-II : Quiescent Zone HRT 1.00 day Depth 1.50 m Kb(20) for Faecal Coliform Reduction formula 2.60 K x θ 1.00 D/UL 1.000 Oxygen efficiency of aerator 2.0 kg/kWh Factor of standard to field 0.75 Reduction gear/motor efficiency 0.9 Minimum Power required 0.75 W/cum Sludge accumulation (for only lagoon) 0.04 cum/person-year Cleaning interval 5.00 years
6.0 Chlorination System 6.1 Chlorine Mixing Tank
Detention time provided 2 min 6.2 Chlorine Contact Tank
Detention time provided 30 min 6.3 Chlorine Dosage
Residual Chlorine 0.50 mg/l Chlorine Dosing 5.00 mg/l
7.0 Sludge Drying Beds Sludge depth 0.2 m
8.0 Gas Holder Detention time 6 hrs
9.0 Sludge Pumping Station Detention period of sump 15 min No. of working Pumps 1 nos. No. of standby Pumps 1 nos.
10.0 Filtrate Pumping Station Solids conc. in the excess sludge produced in UASB, P1 6 % Solids conc. in the dried sludge produced on SDB, P2 40 % Detention period of sump 15 min No. of working Pumps 1 nos. No. of standby Pumps 1 nos.
Unit Sizing

Final Report on Water Quality Management Plan for Ganga RiverVolume IV-4, Feasibility Study for Varanasi City, Part I, Sewerage Scheme
2-86
The sizing of various treatment units for the treatment scheme “UASB Process followed by Facultative Aerated Lagoon with Chlorination System” is presented below:
Table 2.51 Unit Sizing
Sr. Units Quantity (nos.)
Length/ Dia, (m)
Width (m)
Side Water Depth (m)
Freeboard(m)
1 Inlet Chamber 1 2.0 14.2 5.0 0.5 2 Screen Channel 6 5.0 2.2 1.0 0.5 3 Grit Chamber 4 11.6 11.6 0.7 0.6 4 UASB Reactor 20 26.0 32.0 5.7 0.6 5 Facultative Aerated Lagoon a) Stage I : Aeration Zone 2 84.6 168.9 3.5 0.6 b) Stage II : Quiescent Zone 2 394.8 168.9 1.5 0.5
6 Chlorine Mixing Tank 1 10.6 10.6 2.5 0.5 7 Chlorine Contact Tank 1 57.7 28.9 2.5 0.5 8 Treated Water Disposal Channel 1 1,800.0 3.4 1.5 0.5 9 Sludge Drying Beds 74 31.5 18.5 0.2
10 Gas Holder 2 19.2 6.0 0.4 11 Sludge Pumping Station 2 1.9 1.9 2.5 5.0 12 Filtrate Pumping Station 1 2.5 2.5 2.0 5.0 13 Transformer Yard for MPS 1 15.0 9.0 14 Generator Room for MPS 1 33.5 10.0 15 MEP Room for MPS 1 26.0 6.5 16 HT / Metering Room 1 21.0 6.5 17 Transformer Yard for STP 1 8.0 10.0 18 Generator Room for STP 1 20.0 10.0 19 MEP Room for STP 1 18.0 6.5 20 DG cum Control Room 1 20.0 10.0 21 Administration Block cum lab 1 12.0 20.0
The layout showing the proposed Sathwa STP based on the UASB process followed by Facultative Aerated Lagoon with Chlorination system is presented in Figure 2.18. (8) Cost Estimation of Sathwa STP The cost estimation of Sathwa STP is summaries in the following table and total cost is 522,405,000 Rs.
Table 2.52 Capital Cost of Sathwa STP
Sr. Particulars Costs (Rs.) 1 Civil 451,367,044 2 Mechanical 29,370,505 3 Electrical & Instrumentation 25,810,000 4 STP Utilities 15,857,923 Total Cost 522,405,472 round 522,405,000

Final Report on Water Quality Management Plan for Ganga RiverVolume IV-4, Feasibility Study for Varanasi City, Part I, Sewerage Scheme
2-87
Figure 2.18 Layout Plan of Sathwa Sewage Treatment Plant
2.3.5 Effluent Disposal Channel and Lining of Irrigation Canal A new treated water disposal channel and lining for existing irrigation canal are proposed.
• Treated Water Disposal Channel from Sathwa STP to Irrigation canal: 1 line, 4 km • Lining for the existing irrigation canal to increase flow carrying capacity: 1 line, 14 km
Table 2.53 Capital Cost of Effluent Disposal Channel and Irrigation Canal
Sr. Units No. Length m Width m
Depth m Amount, Rs.
1 Lining for existing irrigation canal 1.0 14,000.0 82,600,0002 Treated Water Disposal Channel 1.0 4,000.0 3.4 2.0 53,200,000 Total 135,800,000
The cross section and plan drawing for the existing irrigation canal is shown in Figure 2.19 and Figure 2.20.
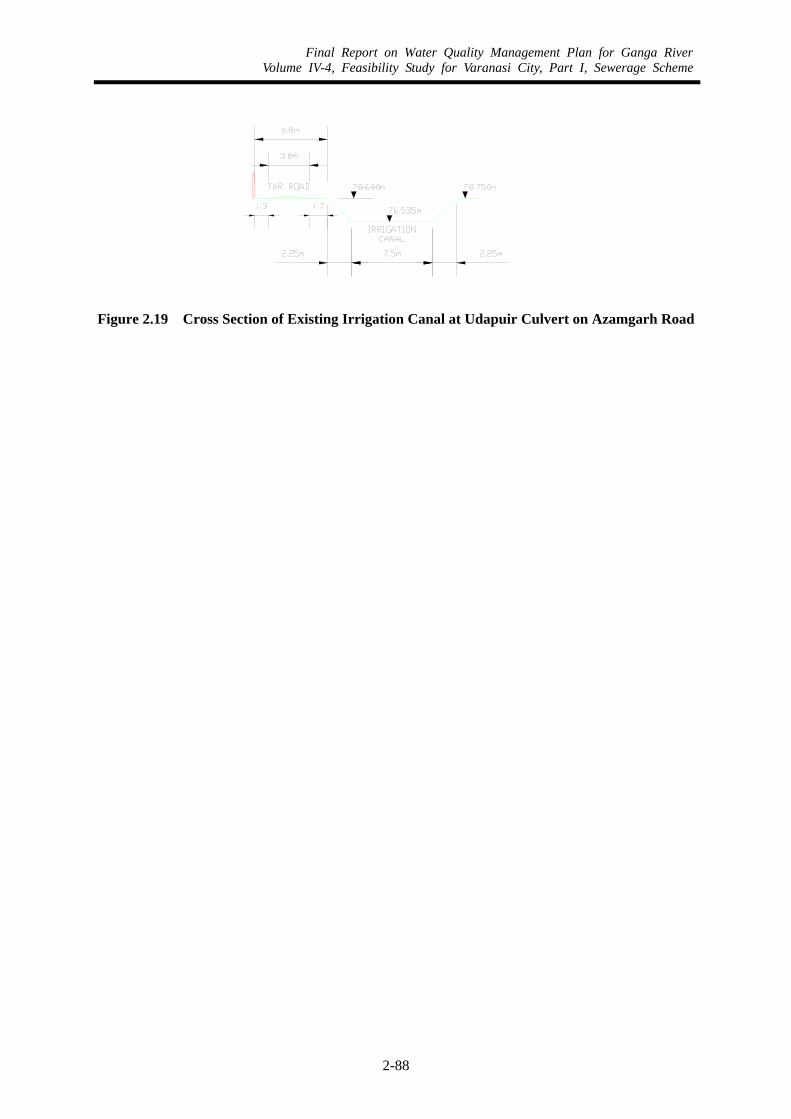
Final Report on Water Quality Management Plan for Ganga RiverVolume IV-4, Feasibility Study for Varanasi City, Part I, Sewerage Scheme
2-88
Figure 2.19 Cross Section of Existing Irrigation Canal at Udapuir Culvert on Azamgarh Road
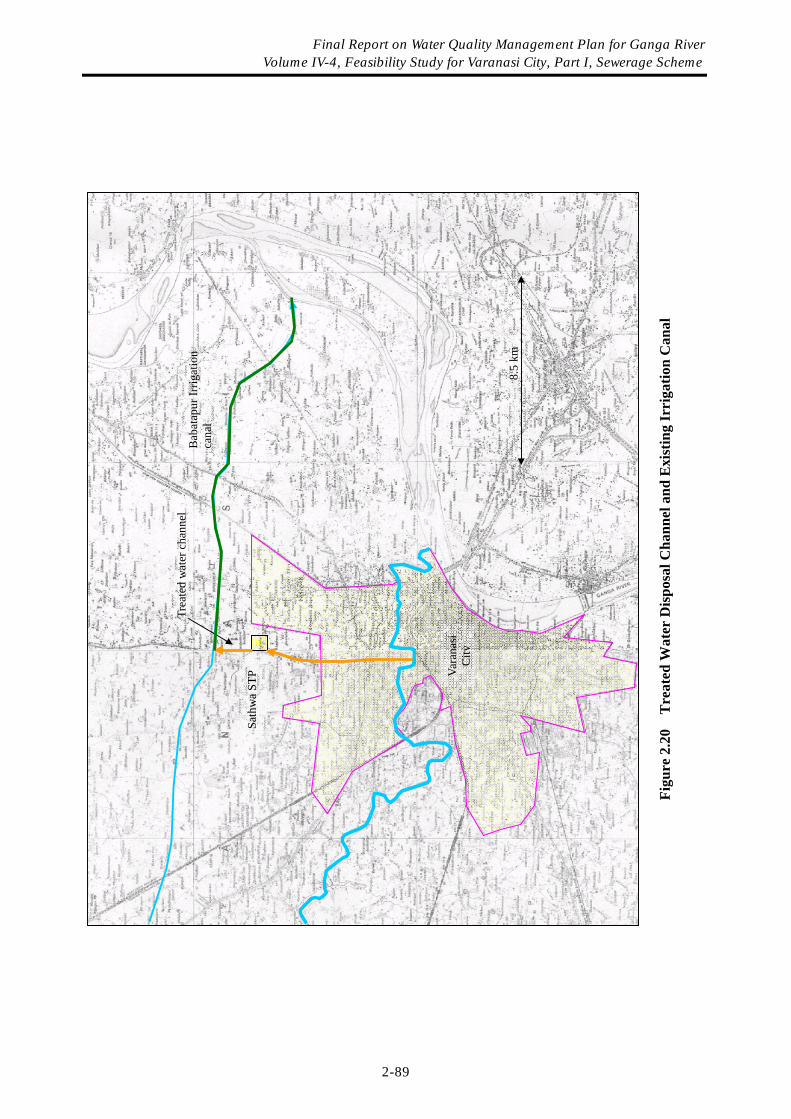
Fi
gure
2.2
0 T
reat
ed W
ater
Dis
posa
l Cha
nnel
and
Exi
stin
g Ir
riga
tion
Can
al
8.5
km
Bab
atap
ur Ir
rigat
ion
cana
l
Sath
wa
STP Va
rana
si
City
Trea
ted
wat
er c
hann
el
Final Report on Water Quality Management Plan for Ganga River Volume IV-4, Feasibility Study for Varanasi City, Part I, Sewerage Scheme
2-89
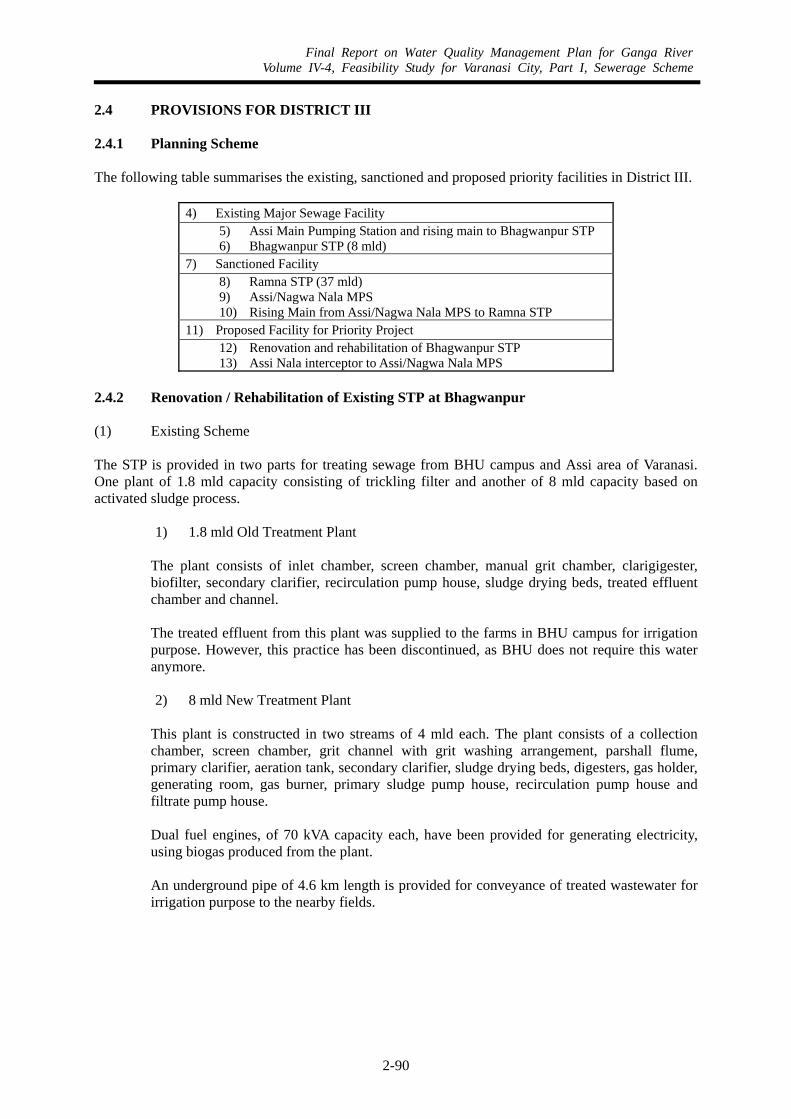
Final Report on Water Quality Management Plan for Ganga RiverVolume IV-4, Feasibility Study for Varanasi City, Part I, Sewerage Scheme
2-90
2.4 PROVISIONS FOR DISTRICT III 2.4.1 Planning Scheme The following table summarises the existing, sanctioned and proposed priority facilities in District III.
4) Existing Major Sewage Facility 5) Assi Main Pumping Station and rising main to Bhagwanpur STP 6) Bhagwanpur STP (8 mld)
7) Sanctioned Facility 8) Ramna STP (37 mld) 9) Assi/Nagwa Nala MPS 10) Rising Main from Assi/Nagwa Nala MPS to Ramna STP
11) Proposed Facility for Priority Project 12) Renovation and rehabilitation of Bhagwanpur STP 13) Assi Nala interceptor to Assi/Nagwa Nala MPS
2.4.2 Renovation / Rehabilitation of Existing STP at Bhagwanpur (1) Existing Scheme
The STP is provided in two parts for treating sewage from BHU campus and Assi area of Varanasi. One plant of 1.8 mld capacity consisting of trickling filter and another of 8 mld capacity based on activated sludge process.
1) 1.8 mld Old Treatment Plant
The plant consists of inlet chamber, screen chamber, manual grit chamber, clarigigester, biofilter, secondary clarifier, recirculation pump house, sludge drying beds, treated effluent chamber and channel. The treated effluent from this plant was supplied to the farms in BHU campus for irrigation purpose. However, this practice has been discontinued, as BHU does not require this water anymore. 2) 8 mld New Treatment Plant
This plant is constructed in two streams of 4 mld each. The plant consists of a collection chamber, screen chamber, grit channel with grit washing arrangement, parshall flume, primary clarifier, aeration tank, secondary clarifier, sludge drying beds, digesters, gas holder, generating room, gas burner, primary sludge pump house, recirculation pump house and filtrate pump house. Dual fuel engines, of 70 kVA capacity each, have been provided for generating electricity, using biogas produced from the plant. An underground pipe of 4.6 km length is provided for conveyance of treated wastewater for irrigation purpose to the nearby fields.
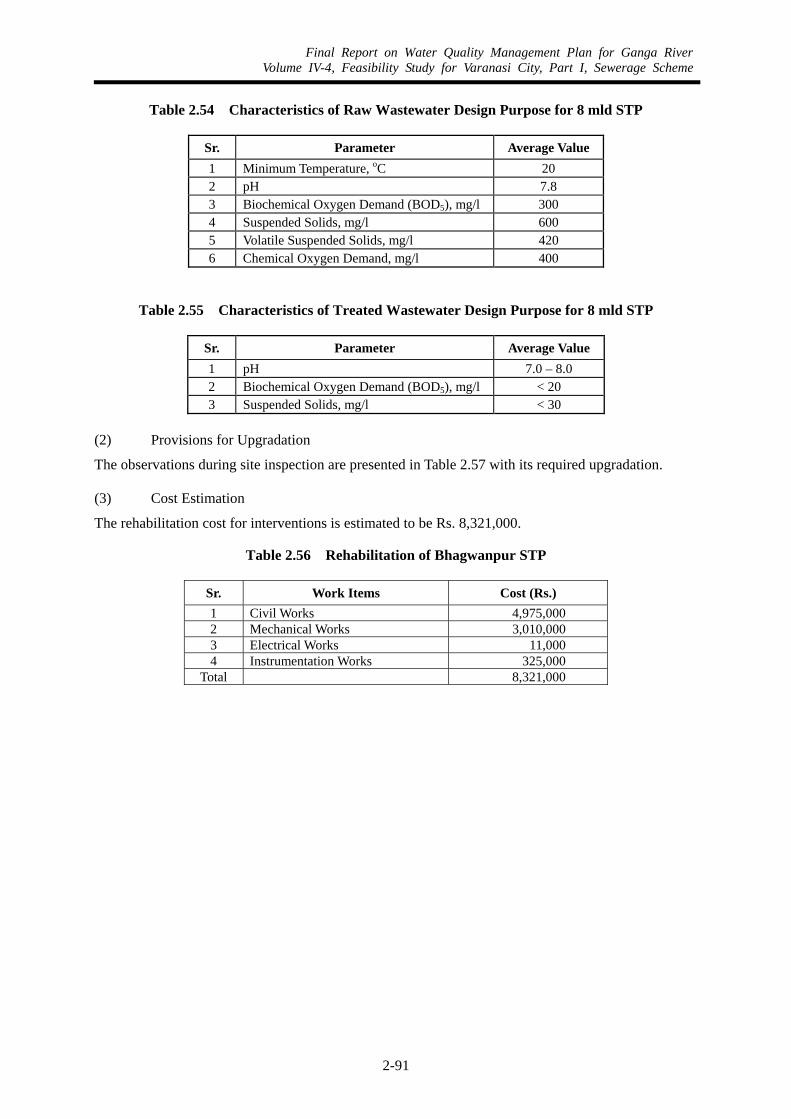
Final Report on Water Quality Management Plan for Ganga RiverVolume IV-4, Feasibility Study for Varanasi City, Part I, Sewerage Scheme
2-91
Table 2.54 Characteristics of Raw Wastewater Design Purpose for 8 mld STP
Sr. Parameter Average Value 1 Minimum Temperature, oC 20 2 pH 7.8 3 Biochemical Oxygen Demand (BOD5), mg/l 300 4 Suspended Solids, mg/l 600 5 Volatile Suspended Solids, mg/l 420 6 Chemical Oxygen Demand, mg/l 400
Table 2.55 Characteristics of Treated Wastewater Design Purpose for 8 mld STP
Sr. Parameter Average Value 1 pH 7.0 – 8.0 2 Biochemical Oxygen Demand (BOD5), mg/l < 20 3 Suspended Solids, mg/l < 30
(2) Provisions for Upgradation
The observations during site inspection are presented in Table 2.57 with its required upgradation.
(3) Cost Estimation
The rehabilitation cost for interventions is estimated to be Rs. 8,321,000.
Table 2.56 Rehabilitation of Bhagwanpur STP
Sr. Work Items Cost (Rs.) 1 Civil Works 4,975,000 2 Mechanical Works 3,010,000 3 Electrical Works 11,000 4 Instrumentation Works 325,000
Total 8,321,000
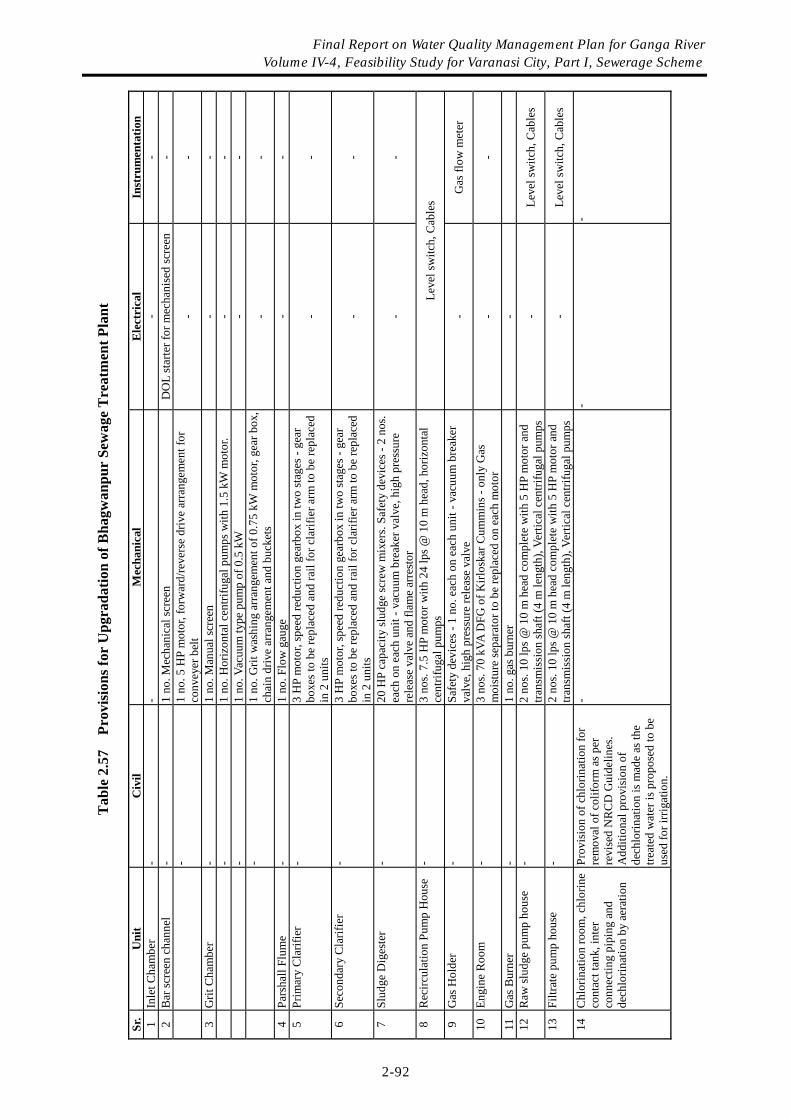
Tab
le 2
.57
Pro
visi
ons f
or U
pgra
datio
n of
Bha
gwan
pur
Sew
age
Tre
atm
ent P
lant
Sr.
Uni
t C
ivil
Mec
hani
cal
Ele
ctri
cal
Inst
rum
enta
tion
1 In
let C
ham
ber
- -
- -
2 B
ar sc
reen
cha
nnel
-
1 no
. Mec
hani
cal s
cree
n D
OL
star
ter f
or m
echa
nise
d sc
reen
-
- 1
no. 5
HP
mot
or, f
orw
ard/
reve
rse
driv
e ar
rang
emen
t for
co
nvey
er b
elt
- -
3 G
rit C
ham
ber
- 1
no. M
anua
l scr
een
- -
- 1
no. H
oriz
onta
l cen
trifu
gal p
umps
with
1.5
kW
mot
or.
-
-
-
1 no
. Vac
uum
type
pum
p of
0.5
kW
-
-
-
1 no
. Grit
was
hing
arr
ange
men
t of 0
.75
kW m
otor
, gea
r box
, ch
ain
driv
e ar
rang
emen
t and
buc
kets
-
-
4 Pa
rsha
ll Fl
ume
- 1
no. F
low
gau
ge
- -
5 Pr
imar
y C
larif
ier
- 3
HP
mot
or, s
peed
redu
ctio
n ge
arbo
x in
two
stag
es -
gear
bo
xes t
o be
repl
aced
and
rail
for c
larif
ier a
rm to
be
repl
aced
in
2 u
nits
-
-
6 Se
cond
ary
Cla
rifie
r -
3 H
P m
otor
, spe
ed re
duct
ion
gear
box
in tw
o st
ages
- ge
ar
boxe
s to
be re
plac
ed a
nd ra
il fo
r cla
rifie
r arm
to b
e re
plac
ed
in 2
uni
ts
- -
7 Sl
udge
Dig
este
r -
20 H
P ca
paci
ty sl
udge
scre
w m
ixer
s. Sa
fety
dev
ices
- 2
nos.
each
on
each
uni
t - v
acuu
m b
reak
er v
alve
, hig
h pr
essu
re
rele
ase
valv
e an
d fla
me
arre
stor
-
-
8 R
ecirc
ulat
ion
Pum
p H
ouse
-
3 no
s. 7.
5 H
P m
otor
with
24
lps @
10
m h
ead,
hor
izon
tal
cent
rifug
al p
umps
Le
vel s
witc
h, C
able
s
9 G
as H
olde
r -
Safe
ty d
evic
es -
1 no
. eac
h on
eac
h un
it - v
acuu
m b
reak
er
valv
e, h
igh
pres
sure
rele
ase
valv
e -
Gas
flow
met
er
10
Engi
ne R
oom
-
3 no
s. 70
kVA
DFG
of K
irlos
kar C
umm
ins -
onl
y G
as
moi
stur
e se
para
tor t
o be
repl
aced
on
each
mot
or
- -
11
Gas
Bur
ner
- 1
no. g
as b
urne
r -
12
R
aw sl
udge
pum
p ho
use
- 2
nos.
10 lp
s @ 1
0 m
hea
d co
mpl
ete
with
5 H
P m
otor
and
tra
nsm
issi
on sh
aft (
4 m
leng
th),
Verti
cal c
entri
fuga
l pum
ps
- Le
vel s
witc
h, C
able
s
13
Filtr
ate
pum
p ho
use
- 2
nos.
10 lp
s @ 1
0 m
hea
d co
mpl
ete
with
5 H
P m
otor
and
tra
nsm
issi
on sh
aft (
4 m
leng
th),
Verti
cal c
entri
fuga
l pum
ps
- Le
vel s
witc
h, C
able
s
14
Chl
orin
atio
n ro
om, c
hlor
ine
cont
act t
ank,
inte
r co
nnec
ting
pipi
ng a
nd
dech
lorin
atio
n by
aer
atio
n
Prov
isio
n of
chl
orin
atio
n fo
r re
mov
al o
f col
iform
as p
er
revi
sed
NR
CD
Gui
delin
es.
Add
ition
al p
rovi
sion
of
dech
lorin
atio
n is
mad
e as
the
treat
ed w
ater
is p
ropo
sed
to b
e us
ed fo
r irr
igat
ion.
- -
-
Final Report on Water Quality Management Plan for Ganga River Volume IV-4, Feasibility Study for Varanasi City, Part I, Sewerage Scheme
2-92

Final Report on Water Quality Management Plan for Ganga RiverVolume IV-4, Feasibility Study for Varanasi City, Part I, Sewerage Scheme
2-93
2.4.3 Assi Nala Interceptor Sewer The Assi Nala is located in the south (upstream) of River Ganga (sewerage district III, Zone 3) and presently carries sewage from the southern part of the city and BHU campus, thus pollutes the River Ganga. The F/S has evaluated the various possible alternatives to intercept and divert the sewage and the same is discussed in this section. (1) Need for the Scheme The development in the region and increase in the population contributes to this overflow leading to the pollution in River Ganga. It is estimated that about 85% to 90% of sewage is emanating upstream of existing Assi SPS. Downstream stretch, between existing Assi SPS till proposed Nagwa MPS, is very congested and does not have a proper road network. Nakha Nala and Samne Ghat Drain situated on the upstream side of the Assi Nala are left untapped in Phase-I works. (2) Evaluation of Alternatives and Selection of Scheme Various feasible interceptor sewers alignments were evaluated for the laying of interceptor sewer considering the Master Plan provision. Based on detailed site survey, it was concluded that only a single interceptor alignment (along left bank of Assi Nala in the stretch between Chitaipur upto Sunderpur Culvert and then along the right bank up to Nagwa pumping station) is feasible against the Master Plan provision of two interceptor sewers along the both bank of Nala. Nakha Nala and Samne Ghat Drain situated on the upstream side of the Assi Nala are left untapped in Phase-I works. These nalas are proposed to be tapped by providing Interception and Diversion works on these nalas and laying an Interceptor, which will be connected, to Assi Interceptor. (3) Design Engineering Works Design Population Catchment boundary was marked for Assi Nala interceptor alignment as per Master Plan and contributing population and sewage flow for various years were calculated.
Table 2.58 Projected Population for Assi Nala Catchment
Contributing population Sr. Catchment Contributing Ward
2015 2030
1 Assi Nala Catchment (excluding BHU campus area)
15,56,68,71,89 and 90 155,757 220,102
Design Flow Wastewater generation for Assi Nala catchment is tabulated below:

Final Report on Water Quality Management Plan for Ganga RiverVolume IV-4, Feasibility Study for Varanasi City, Part I, Sewerage Scheme
2-94
Table 2.59 Design Flow for Assi Nala Catchment (mld)
Contributing Flow Sr. Catchment
2015 2030
1 Assi Nala catchment (excluding BHU campus area) 21.94 31.01
Design of Interceptor Sewer Detailed design of interceptor sewer is given in Annexure 3-1 and is summarised below.
Table 2.60 Pipe Length Details of Assi Nala Interceptor Sewer
Sr. Diameter (mm)
Length (m)
1 600 640 2 700 620 3 800 400 4 900 240 5 1000 1,970 6 1200 1,300 Total length 5,170
Table 2.61 Pipe Length Details of Nakha Nala and Samne Ghat Interceptor Sewer
Sr. Diameter (mm)
Length (m)
1 400 655 2 500 1,300 Total length 1,955
Secondary Sewer Around 1.6 kilometers of secondary sewer is proposed in the Assi Nala catchment in addition to main interceptor sewer. Design of secondary sewer is given in Annexure 3-2 and is summarised below.
Table 2.62 Pipe Length Details of Assi nala Secondary Sewer
Sr. Diameter (mm)
Length (m)
1 300 1,170 2 400 450 Total length 1,620
Provision for Trenchless Technology Laying of Interceptor along Assi Nala and laying of extension of Trunk Relief Sewer is in a thickly populated area and also in these areas roads are narrow. It is found that laying of sewers in these areas with open cut method is not feasible in certain stretches. Hence provision of laying of sewer lines by trenchless technology is proposed in these areas. (4) Cost Estimates
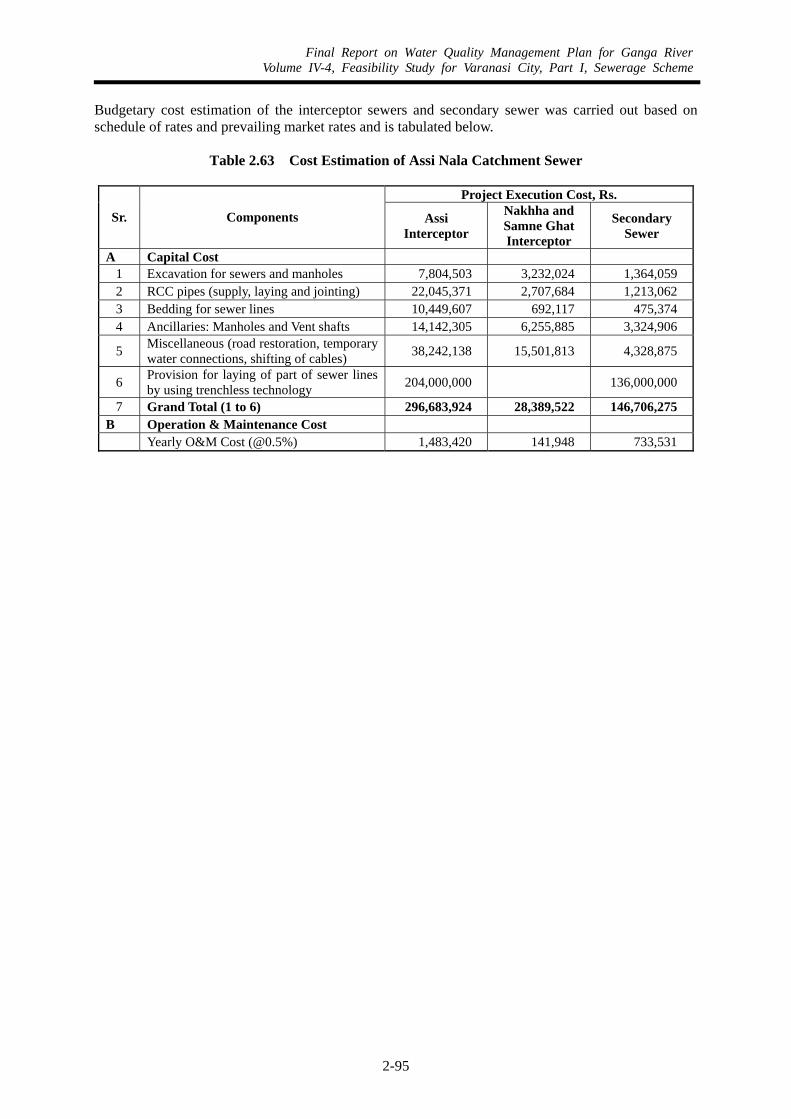
Final Report on Water Quality Management Plan for Ganga RiverVolume IV-4, Feasibility Study for Varanasi City, Part I, Sewerage Scheme
2-95
Budgetary cost estimation of the interceptor sewers and secondary sewer was carried out based on schedule of rates and prevailing market rates and is tabulated below.
Table 2.63 Cost Estimation of Assi Nala Catchment Sewer
Project Execution Cost, Rs.
Sr. Components Assi Interceptor
Nakhha and Samne Ghat Interceptor
Secondary Sewer
A Capital Cost 1 Excavation for sewers and manholes 7,804,503 3,232,024 1,364,059 2 RCC pipes (supply, laying and jointing) 22,045,371 2,707,684 1,213,062 3 Bedding for sewer lines 10,449,607 692,117 475,374 4 Ancillaries: Manholes and Vent shafts 14,142,305 6,255,885 3,324,906
5 Miscellaneous (road restoration, temporary water connections, shifting of cables) 38,242,138 15,501,813 4,328,875
6 Provision for laying of part of sewer lines by using trenchless technology 204,000,000 136,000,000
7 Grand Total (1 to 6) 296,683,924 28,389,522 146,706,275 B Operation & Maintenance Cost Yearly O&M Cost (@0.5%) 1,483,420 141,948 733,531

Ann
exur
e 2-
1: W
ard-
wis
e Po
pula
tion
Proj
ectio
ns
W
ard
No.
War
d N
ame
Are
a in
Ha
Pop
2001
GR
200
1-03
Pop
2003
GR
200
3-08
Pop
2008
GR
200
8-15
Pop
2015
GR
201
5-18
Pop
2018
GR
201
8-23
1La
har T
ara
2912
384
1.00
%12
633
0.75
%13
114
0.75
%13
818
0.50
%14
026
0.50
%2
Indr
a Pu
r23
515
694
10.0
0%18
990
6.00
%25
413
6.00
%38
211
3.00
%41
754
3.00
%3
Chh
ittan
pura
913
135
0.20
%13
188
0.15
%13
287
0.10
%13
380
0.05
%13
400
0.05
%4
Nar
ayan
186
1431
37.
50%
1654
06.
00%
2213
56.
00%
3328
35.
50%
3908
25.
50%
5Ta
rna
438
1302
710
.00%
1576
310
.00%
2538
67.
50%
4211
77.
50%
5232
17.
50%
6N
ades
hwar
7812
877
5.00
%14
197
5.00
%18
119
4.00
%23
844
3.50
%26
436
3.50
%7
Paha
diya
160
2050
65.
00%
2260
85.
00%
2885
44.
00%
3797
03.
50%
4209
83.
50%
8Ka
mal
Gar
ha30
1587
40.
20%
1593
80.
15%
1605
70.
10%
1617
00.
05%
1619
40.
05%
9Ka
ji Sa
idul
lapu
ra32
1456
10.
25%
1463
40.
20%
1478
10.
20%
1498
90.
10%
1503
40.
10%
10Ja
lalip
ura
6114
608
1.50
%15
050
1.50
%16
213
1.50
%17
993
1.00
%18
539
1.00
%11
Ras
ulpu
ra17
1575
80.
20%
1582
10.
15%
1594
00.
10%
1605
20.
05%
1607
60.
05%
12N
awap
ura
4013
989
1.00
%14
270
0.50
%14
631
0.50
%15
150
0.50
%15
379
0.50
%13
Sara
iyan
107
1585
43.
00%
1682
03.
00%
1949
82.
00%
2239
82.
00%
2376
82.
00%
14Al
ai P
ura
7812
823
3.00
%13
604
3.00
%15
771
1.50
%17
503
1.00
%18
033
1.00
%15
Sara
y Su
rjan
9513
669
10.0
0%16
539
7.50
%23
745
5.00
%33
411
3.00
%36
509
3.00
%16
Mad
an P
ura
611
945
0.10
%11
969
0.10
%12
029
0.10
%12
113
0.10
%12
150
0.10
%17
Raj
ghat
8822
373
3.00
%23
736
3.00
%27
516
2.00
%31
607
2.00
%33
542
2.00
%18
Kate
har
812
678
0.20
%12
729
0.15
%12
825
0.10
%12
915
0.05
%12
934
0.05
%19
Gha
usab
ad12
515
708
5.00
%17
318
5.00
%22
103
5.00
%31
101
3.50
%34
482
3.50
%20
Ram
erpu
r33
116
228
7.50
%18
753
7.50
%26
923
7.50
%44
667
6.00
%53
199
6.00
%21
Sikr
aul
147
1382
67.
50%
1597
86.
00%
2138
25.
00%
3008
63.
50%
3335
73.
50%
22D
ara
Nag
ar26
1105
20.
25%
1110
70.
20%
1121
90.
20%
1137
70.
10%
1141
10.
10%
23Ta
ktak
pur
113
1188
17.
50%
1373
05.
00%
1752
34.
00%
2305
93.
50%
2556
63.
50%
24Se
npur
a11
7193
0.20
%72
220.
15%
7276
0.10
%73
270.
05%
7338
0.05
%25
Mav
aiya
481
1316
97.
50%
1521
87.
50%
2184
87.
50%
3624
77.
50%
4502
97.
50%
26Ja
itpur
a23
1606
70.
20%
1613
10.
15%
1625
30.
10%
1636
70.
05%
1639
10.
05%
27Sa
rnat
h76
412
049
7.50
%13
924
7.50
%19
990
7.50
%33
164
7.50
%41
200
7.50
%28
Shiv
purw
a10
511
757
5.00
%12
962
5.00
%16
543
2.00
%19
003
2.00
%20
166
2.00
%29
Balu
abir
910
105
0.20
%10
145
0.15
%10
222
0.10
%10
294
0.05
%10
309
0.05
%30
Sale
m P
ura
2614
312
0.20
%14
369
0.15
%14
477
0.10
%14
579
0.05
%14
601
0.05
%31
Khoj
wan
4710
684
3.00
%11
335
4.00
%13
790
2.50
%16
392
2.50
%17
653
2.50
%32
Loco
Hitp
ura
8111
847
5.00
%13
061
5.00
%16
670
2.00
%19
148
2.00
%20
321
2.00
%33
Dhu
p C
hand
i60
1349
01.
50%
1389
81.
50%
1497
21.
50%
1661
61.
00%
1712
01.
00%
34Ja
gat G
anj
5315
920
1.50
%16
401
1.50
%17
669
1.50
%19
610
1.00
%20
204
1.00
%35
Das
hasw
amed
h11
9441
0.10
%94
600.
10%
9507
0.10
%95
740.
10%
9603
0.10
%36
Kam
alpu
r14
1458
80.
20%
1464
60.
15%
1475
70.
10%
1486
00.
05%
1488
20.
05%
37Ba
g H
ada
2011
206
0.10
%11
228
0.10
%11
285
0.10
%11
364
0.10
%11
398
0.10
%38
Sars
auli
148
1967
55.
00%
2169
23.
00%
2514
73.
00%
3092
72.
00%
3282
02.
00%
39Sh
ival
a22
1171
90.
10%
1174
20.
10%
1180
10.
10%
1188
40.
10%
1192
00.
10%
40Pi
yari
Kala
1612
275
0.20
%12
324
0.15
%12
417
0.10
%12
504
0.05
%12
523
0.05
%41
Ram
apur
a21
9700
0.25
%97
490.
20%
9846
0.20
%99
850.
10%
1001
50.
10%
42R
aj M
andi
r6
1074
90.
10%
1077
10.
10%
1082
40.
10%
1090
00.
10%
1093
30.
10%
43Pr
ahal
ad G
hat
611
476
0.10
%11
499
0.10
%11
557
0.10
%11
638
0.10
%11
673
0.10
%44
Gar
h Va
si T
ola
796
400.
10%
9659
0.10
%97
080.
10%
9776
0.10
%98
050.
10%
45Ka
gi P
ura
4612
576
1.50
%12
956
1.50
%13
957
1.50
%15
491
1.00
%15
960
1.00
%46
Beni
ya26
1278
10.
20%
1283
20.
15%
1292
90.
10%
1301
90.
05%
1303
90.
05%
Pop
2023
GR
202
3-30
Pop
2030
1438
00.
25%
1456
148
405
3.50
%62
184
1343
40.
02%
1346
551
078
3.00
%59
878
7511
44.
00%
9911
931
398
2.50
%37
670
4999
92.
50%
5998
816
235
0.02
%16
272
1510
90.
05%
1514
719
484
0.75
%20
429
1611
60.
02%
1615
315
767
0.50
%16
327
2624
22.
00%
3103
918
953
0.75
%20
766
4232
42.
00%
5116
512
211
0.05
%12
241
3703
31.
25%
4098
812
966
0.02
%12
996
4095
42.
50%
4774
571
192
4.00
%90
182
3961
82.
50%
4752
011
468
0.05
%11
497
3036
52.
50%
3643
173
570.
02%
7373
6464
66.
00%
9450
916
432
0.02
%16
470
5914
86.
00%
8647
222
265
1.25
%26
106
1033
50.
02%
1035
914
637
0.02
%14
671
1997
32.
00%
2373
122
436
1.25
%26
306
1799
30.
75%
1886
621
234
0.50
%21
772
9651
0.05
%96
7514
920
0.02
%14
954
1145
50.
05%
1148
436
236
2.00
%41
624
1198
00.
05%
1201
012
554
0.02
%12
583
1006
50.
05%
1009
010
988
0.05
%11
015
1173
10.
05%
1176
198
540.
05%
9879
1677
40.
75%
1758
713
072
0.02
%13
102
Final Report on Water Quality Management Plan for Ganga River Volume IV-4, Feasibility Study for Varanasi City, Part I, Sewerage Scheme
2-96
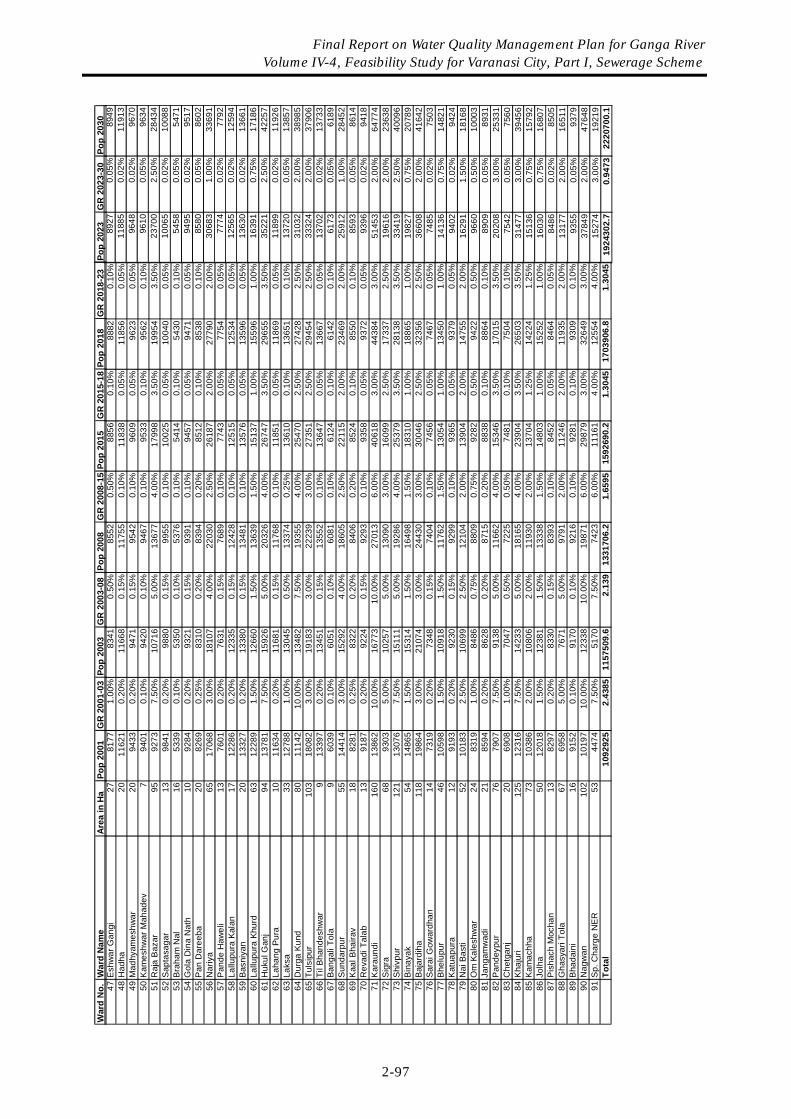
W
ard
No.
War
d N
ame
Area
in H
aPo
p 20
01G
R 2
001-
03Po
p 20
03G
R 2
003-
08Po
p 20
08G
R 2
008-
15Po
p 20
15G
R 2
015-
18Po
p 20
18G
R 2
018-
23Po
p 20
23G
R 2
023-
30Po
p 20
3047
Esh
war
Gan
gi27
8177
1.00
%83
410.
50%
8552
0.50
%88
560.
10%
8882
0.10
%48
Had
ha20
1162
10.
20%
1166
80.
15%
1175
50.
10%
1183
80.
05%
1185
60.
05%
49M
adhy
ames
hwar
2094
330.
20%
9471
0.15
%95
420.
10%
9609
0.05
%96
230.
05%
50K
ames
hwar
Mah
adev
794
010.
10%
9420
0.10
%94
670.
10%
9533
0.10
%95
620.
10%
51R
aja
Baz
ar95
9273
7.50
%10
716
5.00
%13
677
4.00
%17
998
3.50
%19
954
3.50
%52
Sap
tasa
gar
1398
410.
20%
9880
0.15
%99
550.
10%
1002
50.
05%
1004
00.
05%
53B
raha
m N
al16
5339
0.10
%53
500.
10%
5376
0.10
%54
140.
10%
5430
0.10
%54
Gol
a D
ina
Nat
h10
9284
0.20
%93
210.
15%
9391
0.10
%94
570.
05%
9471
0.05
%55
Pan
Dar
eeba
2082
690.
25%
8310
0.20
%83
940.
20%
8512
0.10
%85
380.
10%
56N
ariy
a65
1706
83.
00%
1810
74.
00%
2203
02.
50%
2618
72.
00%
2779
02.
00%
57P
ande
Haw
eli
1376
010.
20%
7631
0.15
%76
890.
10%
7743
0.05
%77
540.
05%
58La
llupu
ra K
alan
1712
286
0.20
%12
335
0.15
%12
428
0.10
%12
515
0.05
%12
534
0.05
%59
Bas
niya
n20
1332
70.
20%
1338
00.
15%
1348
10.
10%
1357
60.
05%
1359
60.
05%
60La
llupu
ra K
hurd
6312
289
1.50
%12
660
1.50
%13
639
1.50
%15
137
1.00
%15
596
1.00
%61
Huk
ul G
anj
9413
781
7.50
%15
926
5.00
%20
326
4.00
%26
747
3.50
%29
655
3.50
%62
Laha
ng P
ura
1011
634
0.20
%11
681
0.15
%11
768
0.10
%11
851
0.05
%11
869
0.05
%63
Laks
a33
1278
81.
00%
1304
50.
50%
1337
40.
25%
1361
00.
10%
1365
10.
10%
64D
urga
Kun
d80
1114
210
.00%
1348
27.
50%
1935
54.
00%
2547
02.
50%
2742
82.
50%
65Tu
lsip
ur10
318
082
3.00
%19
183
3.00
%22
239
3.00
%27
351
2.50
%29
454
2.50
%66
Til B
hand
eshw
ar9
1339
70.
20%
1345
10.
15%
1355
20.
10%
1364
70.
05%
1366
70.
05%
67B
anga
li To
la9
6039
0.10
%60
510.
10%
6081
0.10
%61
240.
10%
6142
0.10
%68
Sun
darp
ur55
1441
43.
00%
1529
24.
00%
1860
52.
50%
2211
52.
00%
2346
92.
00%
69K
aal B
haira
v18
8281
0.25
%83
220.
20%
8406
0.20
%85
240.
10%
8550
0.10
%70
Rev
adi T
alab
1391
870.
20%
9224
0.15
%92
930.
10%
9358
0.05
%93
720.
05%
71K
arau
ndi
160
1386
210
.00%
1677
310
.00%
2701
36.
00%
4061
83.
00%
4438
43.
00%
72S
igra
6893
035.
00%
1025
75.
00%
1309
03.
00%
1609
92.
50%
1733
72.
50%
73S
hivp
ur12
113
076
7.50
%15
111
5.00
%19
286
4.00
%25
379
3.50
%28
138
3.50
%74
Bin
ayak
5414
865
1.50
%15
314
1.50
%16
498
1.50
%18
310
1.00
%18
865
1.00
%75
Baj
ardi
ha11
819
864
3.00
%21
074
3.00
%24
430
3.00
%30
046
2.50
%32
356
2.50
%76
Sar
ai G
owar
dhan
1473
190.
20%
7348
0.15
%74
040.
10%
7456
0.05
%74
670.
05%
77B
helu
pur
4610
598
1.50
%10
918
1.50
%11
762
1.50
%13
054
1.00
%13
450
1.00
%78
Kat
uapu
ra12
9193
0.20
%92
300.
15%
9299
0.10
%93
650.
05%
9379
0.05
%79
Nai
Bas
ti52
1018
32.
50%
1069
92.
50%
1210
42.
00%
1390
42.
00%
1475
52.
00%
80O
m K
ales
hwar
2483
191.
00%
8486
0.75
%88
090.
75%
9282
0.50
%94
220.
50%
81Ja
ngam
wad
i21
8594
0.20
%86
280.
20%
8715
0.20
%88
380.
10%
8864
0.10
%82
Pan
deyp
ur76
7907
7.50
%91
385.
00%
1166
24.
00%
1534
63.
50%
1701
53.
50%
83C
hetg
anj
2069
081.
00%
7047
0.50
%72
250.
50%
7481
0.10
%75
040.
10%
84K
haju
ri12
512
316
7.50
%14
233
5.00
%18
165
4.00
%23
904
3.50
%26
503
3.50
%85
Kam
achh
a73
1038
62.
00%
1080
62.
00%
1193
02.
00%
1370
41.
25%
1422
41.
25%
86Jo
lha
5012
018
1.50
%12
381
1.50
%13
338
1.50
%14
803
1.00
%15
252
1.00
%87
Pis
hach
Moc
han
1382
970.
20%
8330
0.15
%83
930.
10%
8452
0.05
%84
640.
05%
88G
hasy
ari T
ola
6769
585.
00%
7671
5.00
%97
912.
00%
1124
62.
00%
1193
52.
00%
89B
hada
ini
1691
520.
10%
9170
0.10
%92
160.
10%
9281
0.10
%93
090.
10%
90N
agw
an10
210
197
10.0
0%12
338
10.0
0%19
871
6.00
%29
879
3.00
%32
649
3.00
%91
Sp.
Cha
rge
NE
R53
4474
7.50
%51
707.
50%
7423
6.00
%11
161
4.00
%12
554
4.00
%To
tal
1092
925
2.43
8511
5750
9.6
2.13
913
3170
6.2
1.65
9515
9269
0.2
1.30
4517
0390
6.8
1.30
45
8927
0.05
%89
4911
885
0.02
%11
913
9648
0.02
%96
7096
100.
05%
9634
2370
02.
50%
2843
410
065
0.02
%10
088
5458
0.05
%54
7194
950.
02%
9517
8580
0.05
%86
0230
683
1.00
%33
691
7774
0.02
%77
9212
565
0.02
%12
594
1363
00.
02%
1366
116
391
0.75
%17
186
3522
12.
50%
4225
711
899
0.02
%11
926
1372
00.
05%
1385
731
032
2.00
%38
985
3332
42.
00%
3790
613
702
0.02
%13
733
6173
0.05
%61
8925
912
1.00
%28
452
8593
0.05
%86
1493
960.
02%
9418
5145
32.
00%
6477
419
616
2.00
%23
638
3341
92.
50%
4009
619
827
0.75
%20
789
3660
82.
00%
4164
274
850.
02%
7503
1413
60.
75%
1482
194
020.
02%
9424
1629
11.
50%
1816
896
600.
50%
1000
389
090.
05%
8931
2020
83.
00%
2533
175
420.
05%
7560
3147
73.
00%
3945
615
136
0.75
%15
792
1603
00.
75%
1680
784
860.
02%
8505
1317
72.
00%
1651
193
550.
05%
9379
3784
92.
00%
4764
815
274
3.00
%19
219
1924
302.
70.
9473
2220
700.
1
Final Report on Water Quality Management Plan for Ganga River Volume IV-4, Feasibility Study for Varanasi City, Part I, Sewerage Scheme
2-97

Ann
exur
e 3-
1: H
ydra
ulic
Des
ign
of A
ssi N
ala
Inte
rcep
tor
Sew
er fo
r Yea
r 20
15
Ann
exur
e 3-
2: H
ydra
ulic
Des
ign
of A
ssi N
ala
Seco
ndar
y Se
wer
Ann
exur
e 3-
3: H
ydra
ulic
Des
ign
of A
ssi N
ala
Seco
ndar
y Se
wer
From
ToLe
ngth
Nod
alPo
pula
tion
Floa
ting
Popu
latio
nC
umul
ativ
ePo
pula
tion
Sew
age
Flow
Nod
alFl
owC
umul
ativ
eN
odal
Flo
wPe
akFa
ctor
Cum
ulat
ive
Peak
Flo
wD
esig
nD
iaSl
ope
Q fu
ll(Q
f)V
full
(Vf)
(M)
LPC
DLP
DLP
DLP
Dm
m1
inLP
Sm
/sec
AN
2A
N3
620.
0012
050
1205
3534
715
518
6781
249
8083
22.
5012
4520
8070
0.00
800.
0032
8.49
0.85
1873
AN
3A
N4
400.
0013
562
1356
5026
615
521
0216
470
8299
62.
2515
9367
4280
0.00
1000
.00
419.
440.
8328
04A
N4
AN
524
0.00
1473
214
7366
471
155
2283
497
9366
494
2.25
2107
4611
900.
0010
00.0
057
4.17
0.90
0762
AN
5A
N6
550.
0032
8332
874
859
155
5088
1610
5485
422.
2523
7342
1910
00.0
012
00.0
069
4.13
0.88
2052
AN
6A
N7
540.
0012
447
1245
8855
115
519
2932
612
4778
672.
2528
0752
0110
00.0
012
00.0
069
4.13
0.88
2052
AN
7A
N8
880.
0026
7926
891
498
155
4151
7912
8930
462.
2529
0093
5310
00.0
012
00.0
069
4.13
0.88
2052
AN
8A
N9
640.
0026
983
2698
1241
1615
541
8243
017
4892
342.
2539
3507
7612
00.0
015
00.0
010
09.4
50.
8907
87A
N9
AN10
600.
0028
0528
015
4700
155
4347
2621
7989
592.
2549
0476
5812
00.0
015
00.0
010
09.4
50.
8907
87
AN
10N
AG
WA
PS
60.0
00
015
5757
155
021
9478
052.
2549
3825
6212
00.0
015
00.0
010
09.4
50.
8907
87
Qa/
Qf
d/D
v/V
V ac
tual
Q a
ctua
lU
GL
DG
LU
ILD
ILD
rop
m/s
ecM
3 /sec
(M)
(M)
(M)
(M)
(M)
0.43
870.
520.
830.
700.
1441
73.8
573
.55
70.4
8669
.711
0.1
0.43
980.
520.
830.
690.
1845
73.5
574
.33
69.6
1169
.211
0.1
0.42
480.
510.
820.
740.
2439
74.3
374
.15
69.1
1168
.871
0.1
0.39
570.
490.
800.
710.
2747
74.1
573
.00
68.2
7167
.812
0.6
0.46
810.
540.
840.
740.
3249
73.0
072
.52
67.2
1266
.762
0.6
0.48
370.
550.
850.
750.
3358
72.5
272
.84
66.1
6265
.429
0.6
0.45
120.
530.
840.
740.
4554
72.8
472
.00
63.0
2962
.602
2.4
0.56
240.
60.
890.
790.
5677
72.0
068
.00
61.8
5061
.450
0.7
0.56
620.
60.
890.
790.
5716
68.0
065
.00
61.3
5061
.310
0.1
From
ToLe
ngth
Noda
lPo
pula
tion
Floa
ting
Popu
latio
nCu
mul
ativ
ePo
pula
tion
Sewa
geFl
owNo
dal
Flow
Cum
ulat
ive
Noda
l Flo
wPe
akFa
ctor
Cum
ulat
ive
Peak
Flo
wDe
sign
Dia
Slop
eQ
full
(Qf)
V fu
ll(V
f)Qa
/Qf
(M)
LPCD
LPD
LPD
LPD
mm
1 in
LPS
m/s
ecAN
5/1
AN5
450.
0066
5166
573
1615
510
3097
510
3097
53.
0030
9292
440
0.00
300.
0012
0.66
0.95
80.
2967
AN8/
1AN
887
0.00
4088
409
4497
155
6336
2063
3620
3.00
1900
861
300.
0030
0.00
56.0
40.
791
0.39
26AN
10/1
AN10
300.
0015
3115
316
8415
523
7365
2373
653.
0071
2095
300.
0020
0.00
68.6
30.
969
0.12
01
d/D
v/V
V ac
tual
Q ac
tual
UGL
DGL
UIL
DIL
Drop
m/s
ecM
3 /sec
(M)
(M)
(M)
(M)
(M)
0.42
0.73
0.70
0.03
5872
.05
74.1
570
.550
69.0
500.
490.
800.
630.
0220
70.0
072
.84
68.5
0065
.600
0.26
0.56
0.54
0.00
8265
.50
68.0
064
.000
62.5
00
From
ToLe
ngth
Noda
lPo
pula
tion
Floa
ting
Popu
latio
nCu
mul
ativ
ePo
pula
tion
Sewa
geFl
owNo
dal
Flow
Cum
ulat
ive
Noda
l Flo
wPe
akFa
ctor
Cum
ulat
ive
Peak
Flo
wDe
sign
Dia
Slop
eQ
full
(Qf)
V fu
ll(V
f)Qa
/Qf
(M)
LPCD
LPD
LPD
LPD
mm
1 in
LPS
m/s
ecAN
9/1
AN9/
265
5.00
1000
010
0011
000
155
1550
000
1550
000
3.00
4650
000
400.
0050
0.00
93.4
60.
7423
0.57
58AN
9/2
AN9/
357
3.00
1500
015
0027
500
155
2325
000
3875
000
2.50
9687
500
500.
0050
0.00
169.
430.
8612
0.66
18AN
9/3
AN9/
438
5.00
00
2750
015
50
3875
000
2.50
9687
500
500.
0050
0.00
169.
430.
8612
0.66
18AN
9/4
AN9
342.
000
027
500
155
038
7500
02.
5096
8750
050
0.00
500.
0016
9.43
0.86
120.
6618
d/D
v/V
V ac
tual
Q ac
tual
UGL
DGL
UIL
DIL
Drop
m/s
ecM
3 /sec
(M)
(M)
(M)
(M)
(M)
0.61
0.90
0.67
0.05
3876
.39
67.5
966
.760
65.4
500.
660.
930.
800.
1121
67.5
966
.30
65.3
5064
.204
0.1
0.66
0.93
0.80
0.11
2166
.30
66.0
364
.104
63.3
340.
10.
660.
930.
800.
1121
66.0
372
.00
63.2
3462
.550
0.1
Final Report on Water Quality Management Plan for Ganga River Volume IV-4, Feasibility Study for Varanasi City, Part I, Sewerage Scheme
2-98

Ann
exur
e 4-
1: H
ydra
ulic
Des
ign
of V
arun
a R
iver
Inte
rcep
tor
Sew
er fo
r Yea
r 20
30
From
To L
engt
hNo
dal
Popu
latio
nCu
mulat
ivePo
pulat
ion
Sewa
ge Fl
owNo
dal
Flow
Cumu
lative
Noda
l Flo
wPe
akFa
ctor
Peak
Flow
Desig
nDi
aSl
ope
Q fu
ll(Q
f)V
full (
Vf)
Qa/Q
fd/
D
(M)
LPCD
LPD
LPD
LPD
mm1 i
nLP
Sm/
sec
VR1
VR2
780.0
00
4903
215
50
7600
000
2.25
1710
0000
700.0
090
0.00
309.7
00.8
030.6
391
0.65
VR2
VR3
1290
.0014
194
6322
615
522
0000
098
0000
02.2
522
0500
0070
0.00
900.0
030
9.70
0.803
0.824
00.7
7VR
3VR
457
0.00
1539
378
619
155
2385
948
1218
5948
2.25
2741
8383
.1280
0.00
1000
.0041
9.44
0.833
0.756
60.7
2VR
4VR
542
0.00
3187
511
0494
155
4940
560
1712
6508
2.25
3853
4642
.8210
00.00
1200
.0069
4.13
0.882
0.642
50.6
5VR
5PS
290
.000
1104
9415
50
1712
6508
2.25
3853
4642
.8210
00.00
1200
.0069
4.13
0.882
0.642
50.6
5VR
11VR
1218
0.00
2836
528
365
155
4396
625
4396
625
2.50
1099
1562
.6450
0.00
600.0
015
4.67
0.786
0.822
50.7
7VR
12VR
1330
0.00
2820
556
570
155
4371
719
8768
345
2.50
2192
0861
.2570
0.00
800.0
032
8.49
0.852
0.772
40.7
3VR
13VR
1418
0.00
2904
285
612
155
4501
467
1326
9811
2.25
2985
7074
.7890
0.00
1200
.0052
4.15
0.822
0.659
30.6
6VR
14PS
290
.000
8561
215
50
1326
9811
2.25
2985
7074
.7890
0.00
1200
.0052
4.15
0.822
0.659
30.6
6VL
1VL
239
0.00
8083
680
836
155
1252
9638
1252
9638
2.25
2819
1686
.3290
0.00
1000
.0057
4.17
0.901
0.568
30.6
VL2
VL3
390.0
017
286
9812
215
526
7932
615
2089
642.2
534
2201
68.81
1000
.0012
00.00
694.1
30.8
820.5
706
0.6VL
3VL
439
0.00
2504
1006
2715
538
8165
1559
7129
2.25
3509
3540
.3710
00.00
1200
.0069
4.13
0.882
0.585
20.6
1VL
4VL
524
0.00
9498
1101
2515
514
7218
617
0693
152.2
538
4059
58.01
1000
.0012
00.00
694.1
30.8
820.6
404
0.65
VL5
VL6
540.0
054
9511
5620
155
8517
2817
9210
432.2
540
3223
46.73
1100
.0015
00.00
800.4
60.8
410.5
830
0.61
VL6
PS3
150.0
061
5012
1770
155
9533
1118
8743
542.2
542
4672
95.57
1100
.0015
00.00
800.4
60.8
410.6
140
0.63
VL11
VL12
240.0
011
1025
1110
2515
517
2089
0517
2089
052.2
538
7200
35.76
1000
.0012
00.00
694.1
30.8
820.6
456
0.65
VL12
VL13
510.0
024
183
1352
0815
537
4831
920
9572
242.2
547
1537
52.97
1100
.0014
00.00
828.5
50.8
700.6
587
0.66
VL13
VL25
285.0
013
691
1488
9815
521
2203
923
0792
632.2
551
9283
41.03
1200
.0015
00.00
1009
.450.8
910.5
954
0.62
VL25
VL26
850.0
014
805
1113
837
155
2294
756
1726
4469
12.0
034
5289
383
2400
.0020
00.00
5548
.301.2
240.7
203
0.7VL
26VL
2785
0.00
1147
711
2531
315
517
7886
717
4423
559
2.00
3488
4711
7.324
00.00
2000
.0055
48.30
1.224
0.727
70.7
1VL
27VL
2830
0.00
4964
1130
277
155
7694
1017
5192
969
2.00
3503
8593
7.424
00.00
2000
.0055
48.30
1.224
0.730
90.7
1VL
28VL
2911
00.00
011
7147
915
50
1815
7921
12.0
036
3158
421.2
2400
.0020
00.00
5548
.301.2
240.7
576
0.73
VL29
SSTP
770.0
00
1338
992
155
020
7543
719
2.00
4150
8743
8.124
00.00
2000
.0055
48.30
1.224
0.865
90.7
9
v/VV
actu
alQ
actu
alUG
LDG
LUI
LDI
LDr
op
m/se
cM3 /se
c(M
)(M
)(M
)(M
)(M
)0.9
20.7
40.1
979
79.10
77.50
74.10
073
.233
0.99
0.80
0.255
277
.5077
.2773
.233
71.80
00.9
60.8
00.3
173
77.27
73.61
71.70
071
.130
0.10.9
20.8
10.4
460
73.61
75.77
68.73
068
.380
2.40.9
20.8
10.4
460
75.77
68.00
65.98
065
.905
2.40.9
90.7
80.1
272
74.81
74.60
70.81
070
.510
0.97
0.83
0.253
774
.6074
.3370
.310
69.93
50.2
0.93
0.76
0.345
674
.3373
.6169
.835
69.68
50.1
0.93
0.76
0.345
673
.6168
.0066
.085
66.01
03.6
0.89
0.80
0.326
377
.5977
.0571
.590
71.20
00.8
90.7
90.3
961
77.05
76.92
71.20
070
.875
0.90
0.79
0.406
276
.9276
.4370
.875
70.55
00.9
20.8
10.4
445
76.43
75.25
70.55
070
.350
0.90
0.75
0.466
775
.2576
.8170
.350
69.99
00.9
10.7
60.4
915
76.81
69.00
66.99
066
.890
30.9
20.8
10.4
481
75.30
76.18
72.80
072
.600
0.93
0.81
0.545
876
.1876
.9672
.400
72.03
60.2
0.90
0.80
0.601
076
.9677
.8271
.936
71.74
60.1
0.95
1.17
3.996
477
.8279
.2570
.546
70.12
11.2
0.96
1.17
4.037
679
.2578
.5970
.121
69.69
60.9
61.1
74.0
554
78.59
78.45
69.69
669
.546
0.97
1.19
4.203
278
.4578
.7269
.546
68.99
61.0
11.2
34.8
043
78.72
79.40
68.99
668
.611
Final Report on Water Quality Management Plan for Ganga River Volume IV-4, Feasibility Study for Varanasi City, Part I, Sewerage Scheme
2-99
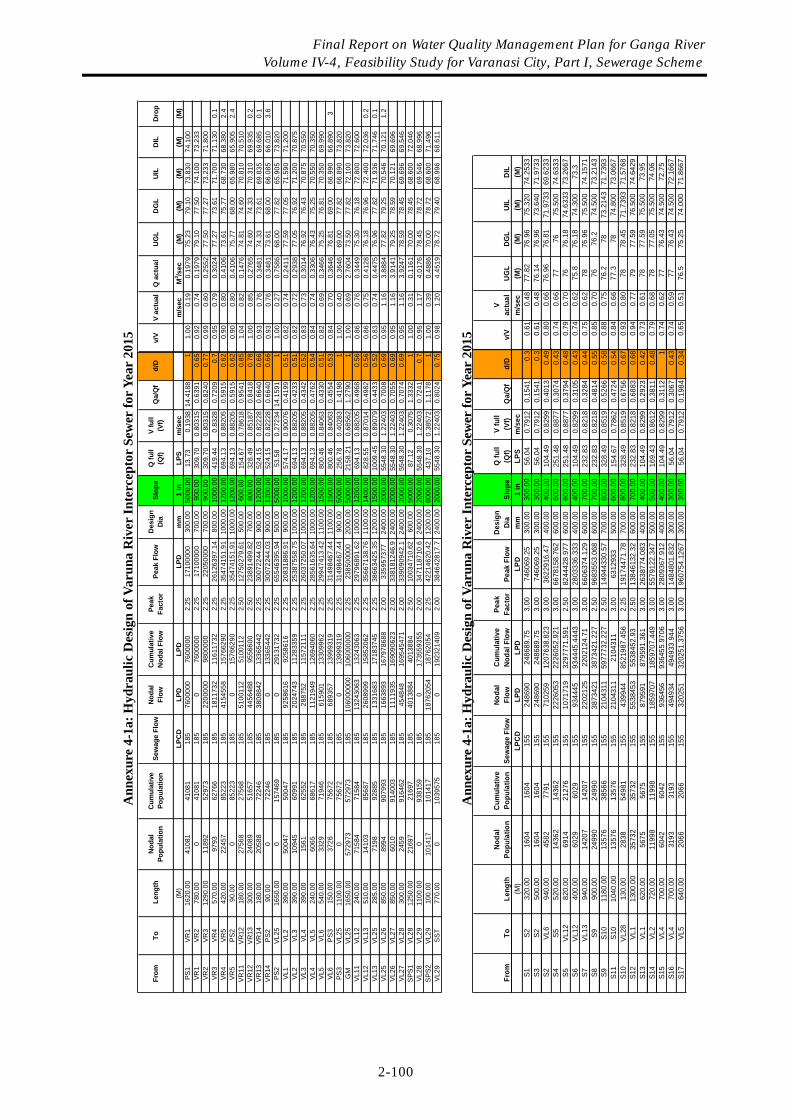
Ann
exur
e 4-
1a: H
ydra
ulic
Des
ign
of V
arun
a R
iver
Inte
rcep
tor
Sew
er fo
r Yea
r 20
15
Ann
exur
e 4-
1a: H
ydra
ulic
Des
ign
of V
arun
a R
iver
Inte
rcep
tor
Sew
er fo
r Yea
r 20
15
From
To L
engt
hN
odal
Popu
latio
nC
umul
ativ
ePo
pula
tion
Sew
age
Flow
Nod
alFl
owC
umul
ativ
eN
odal
Flo
wPe
akFa
ctor
Peak
Flo
wD
esig
nD
iaSl
ope
Q fu
ll(Q
f)V
full
(Vf)
Qa/
Qf
d/D
(M)
LPC
DLP
DLP
DLP
Dm
m1
inLP
Sm
/sec
PS1
VR1
1620
.00
4108
141
081
185
7600
000
7600
000
2.25
1710
0000
300.
0050
00.0
013
.73
0.19
3814
.418
81
VR1
VR2
780.
000
4108
118
50
7600
000
2.25
1710
0000
700.
0090
0.00
309.
700.
8031
50.
6391
0.65
VR2
VR3
1290
.00
1189
252
973
185
2200
000
9800
000
2.25
2205
0000
700.
0090
0.00
309.
700.
8031
50.
8240
0.77
VR3
VR4
570.
0097
9362
766
185
1811
732
1161
1732
2.25
2612
6397
.14
800.
0010
00.0
041
9.44
0.83
280.
7209
0.7
VR4
VR5
420.
0022
457
8522
318
541
5455
815
7662
902.
2535
4741
51.9
110
00.0
012
00.0
069
4.13
0.88
205
0.59
150.
62VR
5PS
290
.00
085
223
185
015
7662
902.
2535
4741
51.9
110
00.0
012
00.0
069
4.13
0.88
205
0.59
150.
62VR
11VR
1218
0.00
2756
827
568
185
5100
112
5100
112
2.50
1275
0279
.61
500.
0060
0.00
154.
670.
7861
80.
9541
0.85
VR12
VR13
300.
0024
089
5165
718
544
5648
895
5660
02.
5023
8914
99.8
270
0.00
800.
0032
8.49
0.85
187
0.84
180.
78VR
13VR
1418
0.00
2058
872
246
185
3808
842
1336
5442
2.25
3007
2244
.03
900.
0012
00.0
052
4.15
0.82
228
0.66
400.
66VR
14PS
290
.00
072
246
185
013
3654
422.
2530
0722
44.0
390
0.00
1200
.00
524.
150.
8222
80.
6640
0.66
PS2
VL25
1650
.00
015
7469
185
029
1317
322.
2565
5463
95.9
450
0.00
5000
.00
53.5
80.
2723
414
.159
11
VL1
VL2
390.
0050
047
5004
718
592
5861
692
5861
62.
2520
8318
86.9
190
0.00
1000
.00
574.
170.
9007
60.
4199
0.51
VL2
VL3
390.
0010
945
6099
118
520
2474
311
2833
592.
2525
3875
58.7
510
00.0
012
00.0
069
4.13
0.88
205
0.42
330.
51VL
3VL
439
0.00
1561
6255
218
528
8752
1157
2111
2.25
2603
7250
.07
1000
.00
1200
.00
694.
130.
8820
50.
4342
0.52
VL4
VL5
240.
0060
6568
617
185
1121
949
1269
4060
2.25
2856
1635
.64
1000
.00
1200
.00
694.
130.
8820
50.
4762
0.54
VL5
VL6
540.
0033
2971
946
185
6159
0113
3099
622.
2529
9474
13.4
211
00.0
015
00.0
080
0.46
0.84
063
0.43
300.
51VL
6PS
315
0.00
3726
7567
218
568
9357
1399
9319
2.25
3149
8467
.44
1100
.00
1500
.00
800.
460.
8406
30.
4554
0.53
PS3
VL25
1100
.00
075
672
185
013
9993
192.
2531
4984
67.4
490
0.00
5000
.00
256.
780.
4028
31.
4198
1G
MVL
2516
50.0
057
2973
5729
7318
510
6000
000
1060
0000
02.
2523
8500
000
2000
.00
5000
.00
2158
.21
0.68
562
1.27
901
VL11
VL12
240.
0071
584
7158
418
513
2430
6313
2430
632.
2529
7968
91.6
210
00.0
012
00.0
069
4.13
0.88
205
0.49
680.
56VL
12VL
1351
0.00
1410
385
687
185
2608
999
1585
2062
2.25
3566
7138
.76
1100
.00
1400
.00
828.
550.
8701
40.
4982
0.56
VL13
VL25
285.
0071
9892
885
185
1331
683
1718
3745
2.25
3866
3425
.35
1200
.00
1500
.00
1009
.45
0.89
079
0.44
330.
52VL
25VL
2685
0.00
8994
9079
9318
516
6389
316
7978
688
2.00
3359
5737
724
00.0
020
00.0
055
48.3
01.
2240
30.
7008
0.69
VL26
VL27
850.
0060
1091
4003
185
1111
935
1690
9062
32.
0033
8181
246.
924
00.0
020
00.0
055
48.3
01.
2240
30.
7055
0.69
VL27
VL28
300.
0024
5991
6462
185
4548
4816
9545
471
2.00
3390
9094
2.1
2400
.00
2000
.00
5548
.30
1.22
403
0.70
740.
69SP
S1VL
2812
50.0
021
697
2169
718
540
1388
440
1388
42.
5010
0347
10.6
260
0.00
5000
.00
87.1
20.
3075
1.33
321
VL28
VL29
1100
.00
093
8159
185
017
3559
355
2.00
3471
1871
0.6
2400
.00
2000
.00
5548
.30
1.22
403
0.72
410.
7SP
S2VL
2910
0.00
1014
1710
1417
185
1876
2054
1876
2054
2.25
4221
4620
.42
1200
.00
8000
.00
437.
100.
3857
21.
1178
1VL
29SS
T77
0.00
010
3957
518
50
1923
2140
92.
0038
4642
817.
724
00.0
020
00.0
055
48.3
01.
2240
30.
8024
0.75
v/V
V ac
tual
Q a
ctua
lU
GL
DG
LU
ILD
ILD
rop
m/s
ecM
3 /sec
(M)
(M)
(M)
(M)
(M)
1.00
0.19
0.19
7975
.23
79.1
073
.830
74.1
000.
920.
740.
1979
79.1
077
.50
74.1
0073
.233
0.99
0.80
0.25
5277
.50
77.2
773
.233
71.8
000.
950.
790.
3024
77.2
773
.61
71.7
0071
.130
0.1
0.90
0.80
0.41
0673
.61
75.7
768
.730
68.3
802.
40.
900.
800.
4106
75.7
768
.00
65.9
8065
.905
2.4
1.04
0.82
0.14
7674
.81
74.6
070
.810
70.5
101.
000.
850.
2765
74.6
074
.33
70.3
1069
.935
0.2
0.93
0.76
0.34
8174
.33
73.6
169
.835
69.6
850.
10.
930.
760.
3481
73.6
168
.00
66.0
8566
.010
3.6
1.00
0.27
0.75
8668
.00
77.8
265
.905
73.8
200.
820.
740.
2411
77.5
977
.05
71.5
9071
.200
0.82
0.72
0.29
3877
.05
76.9
271
.200
70.8
750.
830.
730.
3014
76.9
276
.43
70.8
7570
.550
0.84
0.74
0.33
0676
.43
75.2
570
.550
70.3
500.
820.
690.
3466
75.2
576
.81
70.3
5069
.990
0.84
0.70
0.36
4676
.81
69.0
066
.990
66.8
903
1.00
0.40
0.36
4669
.00
77.8
266
.890
73.8
201.
000.
692.
7604
73.5
077
.82
72.1
0073
.820
0.86
0.76
0.34
4975
.30
76.1
872
.800
72.6
000.
860.
750.
4128
76.1
876
.96
72.4
0072
.036
0.2
0.83
0.74
0.44
7576
.96
77.8
271
.936
71.7
460.
10.
951.
163.
8884
77.8
279
.25
70.5
4670
.121
1.2
0.95
1.16
3.91
4179
.25
78.5
970
.121
69.6
960.
951.
163.
9247
78.5
978
.45
69.6
9669
.546
1.00
0.31
0.11
6170
.00
78.4
568
.600
72.0
460.
951.
174.
0176
78.4
578
.72
69.5
4668
.996
1.00
0.39
0.48
8670
.00
78.7
268
.600
71.4
960.
981.
204.
4519
78.7
279
.40
68.9
9668
.611
From
ToLe
ngth
Noda
lPo
pula
tion
Cum
ulat
ive
Popu
latio
nSe
wag
e Fl
owNo
dal
Flow
Cum
ulat
ive
Noda
l Flo
wPe
akFa
ctor
Peak
Flo
wD
esig
nDi
aSl
ope
Q fu
ll(Q
f)V
full
(Vf)
Qa/
Qf
d/D
(M)
LPC
DLP
DLP
DLP
Dm
m1
inLP
Sm
/sec
S1S2
320.
0016
0416
0415
524
8690
2486
89.7
53.
0074
6069
.25
300.
0030
0.00
56.0
40.
7912
0.15
410.
3S3
S250
0.00
1604
1604
155
2486
9024
8689
.75
3.00
7460
69.2
530
0.00
300.
0056
.04
0.79
120.
1541
0.3
S2VL
694
0.00
4582
7791
155
7102
5912
0763
8.82
33.
0036
2291
6.47
400.
0040
0.00
104.
490.
8299
0.40
130.
49S4
S552
0.00
1436
214
362
155
2226
053
2226
052.
921
3.00
6678
158.
762
600.
0060
0.00
251.
480.
8877
0.30
740.
43S5
VL12
820.
0069
1421
276
155
1071
719
3297
771.
591
2.50
8244
428.
977
600.
0060
0.00
251.
480.
8877
0.37
940.
48S6
VL12
400.
0060
2960
2915
593
4445
9344
45.4
443
3.00
2803
336.
333
400.
0040
0.00
104.
490.
8299
0.31
050.
43S7
VL13
940.
0014
207
1420
715
522
0212
522
0212
4.71
3.00
6606
374.
129
600.
0070
0.00
232.
830.
8218
0.32
840.
44S8
S990
0.00
2499
024
990
155
3873
421
3873
421.
227
2.50
9683
553.
068
600.
0070
0.00
232.
830.
8218
0.48
140.
55S9
S10
1180
.00
1357
638
566
155
2104
311
5977
732.
227
2.50
1494
4330
.57
700.
0080
0.00
328.
490.
8519
0.52
660.
58S1
1S1
010
40.0
013
576
1357
615
521
0431
121
0431
13.
0063
1293
350
0.00
600.
0015
4.67
0.78
620.
4724
0.54
S10
VL28
130.
0028
3854
981
155
4399
4485
2198
7.45
62.
2519
1744
71.7
870
0.00
800.
0032
8.49
0.85
190.
6756
0.67
S12
VL1
1300
.00
3573
235
732
155
5538
453
5538
452.
932.
5013
8461
32.3
260
0.00
700.
0023
2.83
0.82
180.
6883
0.68
S13
VL1
620.
0056
7556
7515
587
9591
8795
91.3
613.
0026
3877
4.08
340
0.00
400.
0010
4.49
0.82
990.
2923
0.42
S14
VL2
720.
0011
998
1199
815
518
5970
718
5970
7.44
93.
0055
7912
2.34
750
0.00
500.
0016
9.43
0.86
120.
3811
0.48
S15
VL4
700.
0060
4260
4215
593
6456
9364
55.9
706
3.00
2809
367.
912
400.
0040
0.00
104.
490.
8299
0.31
121
S16
VL4
700.
0031
9331
9315
549
4934
4949
33.9
443.
0014
8480
1.83
230
0.00
300.
0056
.04
0.79
120.
3067
0.43
S17
VL5
640.
0020
6620
6615
532
0251
3202
51.3
756
3.00
9607
54.1
267
300.
0030
0.00
56.0
40.
7912
0.19
840.
34
v/V
Vac
tual
UG
LDG
LUI
LD
ILm
/sec
(M)
(M)
(M)
(M)
0.61
0.48
77.8
276
.96
75.3
2074
.253
30.
610.
4876
.14
76.9
673
.640
71.9
733
0.80
0.66
76.9
676
.81
71.9
733
69.6
233
0.74
0.66
7776
75.5
0074
.633
30.
790.
7076
76.1
874
.633
373
.266
70.
740.
6275
.876
.18
74.3
0073
.30.
750.
6278
76.9
675
.500
74.1
571
0.85
0.70
7676
.274
.500
73.2
143
0.88
0.75
76.2
7873
.214
371
.739
30.
840.
6677
.378
74.8
0073
.066
70.
930.
8078
78.4
571
.739
371
.576
80.
940.
7779
77.5
976
.500
74.6
429
0.73
0.61
7877
.59
75.5
0073
.95
0.79
0.68
7877
.05
75.5
0074
.06
0.74
0.62
7776
.43
74.5
0072
.75
0.74
0.59
7776
.43
74.5
0072
.166
70.
650.
5176
.575
.25
74.0
0071
.866
7
Final Report on Water Quality Management Plan for Ganga River Volume IV-4, Feasibility Study for Varanasi City, Part I, Sewerage Scheme
2-100
CHAPTER 3
ENVIRONMENTAL IMPACT ASSESSMENT FOR
SEWERAGE PRIORITY PROJECT

Final Report on Water Quality Management Plan for Ganga RiverVolume IV-4, Feasibility Study for Varanasi City, Part I, Sewerage Scheme
3-1
CHAPTER 3 ENVIRONMENTAL IMPACT ASSESSMENT FOR SEWERAGE PRIORITY PROJECT
3.1 INTRODUCTION 3.1.1 Introduction Varanasi, one of the biggest cities of Uttar Pradesh and located in North Eastern part of the State has an inadequate water supply and sanitation services for present population. The sewerage system in Varanasi city, which was initially commissioned in the year 1917, is quiet old and poorly maintained. The water supply is intermittent, and adverse sanitation conditions cause increasing hazards to public health. The large amount of wastewater flowing through open drains pollutes the river Ganga and Varuna. Total wastewater load is about 246 million liter per day and the present installed treatment capacity is only of 89.8 million liter per day. Therefore, there is a need for installation of new sewage treatment facilities and augmentation of existing facilities in the Varanasi city. In order to meet the above objective, interceptor sewers for Varuna river & Assi nala along with Sewage Treatment Plant (STP) at Sathwa and several pumping stations that would overcome the present sanitation scenario of the Varanasi city, is included in the Priority Project on Pollution Abatement of Ganga River in the Republic of India. The possible impacts of the proposed project on the social and natural environment during the project phase of construction and operation are assessed in this Chapter of the Feasibility Study Report. The objective of the study is to assess the environmental impacts of the priority projects for pollution abatement of river Ganga in Varanasi. Another objective of the study is to assist in carrying out construction and in operating the complete facilities in an environmental sound manner. The EIA study has also assessed how to ensure the sustainability of the project/programme from the environmental point of view. 3.1.2 Justification of the Project The current proposal is justified on the following considerations:
1. Presently in Varanasi city the wastewater load is about 246 million liters per day (mld or 1000 m3/day). But the present installed treatment capacity is only 89.8 mld. The amount of wastewater collected and diverted to treatment is only 35% of the total amount generated. Remaining 65% of the wastewater is discharged to Varuna and Ganga rivers through open drains. This causes significant pollution of the rivers. So, there is need for installation of additional treatment capacity.
2. Varanasi city’s population is projected to double from 1.27 million in 2003 to 2.35 million by 2030. This increased population will contribute an additional discharge of wastewater to the existing, causing a significant threat to the environment.
3. The present sewer infrastructure is old, and poorly maintained. 4. Water supply and sanitation services are inadequate for Varanasi’s present population. 5. The intermittent water supply and adverse sanitation conditions cause increasing hazards to
public health. 6. A large amount of wastewater flows into open drains, which pollute the river Ganga and
Varuna. 7. Presently only 40% of the total area is sewered. Entire trans-Varuna and some parts of the
Cis-Varuna are unsewered. 8. The existing sewerage system was designed to exclusively carry domestic sewage only but
storm water also enters the sewers directly or through manholes and open drains. 9. New colonies have been developed in the sub-central city sewerage district but there is no
sewerage system. In some localities branch sewers were laid in the past, which have been

Final Report on Water Quality Management Plan for Ganga RiverVolume IV-4, Feasibility Study for Varanasi City, Part I, Sewerage Scheme
3-2
either connected to the old existing trunk sewers or to the old drains. 10. In Varanasi, currently power supply is regulated due to energy shortage and daily power cut
for several hours is common. Power supply to the existing STPs and pumping stations is also cut. If this situation will continue in future, the proposed sewerage system will cause negative impacts during the power cut.
11. There is no regular sewerage system in the Trans Varuna area. The old Orderly Bazaar Sewer, which exists in the area, discharges in the river Varuna. Some branches have been laid in the area from time to time but their outfall is connected to the storm water drains, which ultimately drain into river Varuna. The existing sewer network covers over 315 km in the city. Though sewerage system has been designed exclusively to carry domestic sewage, storm water finds its way into the system during monsoon.
Thus there is a need to initiate few interceptor sewers, pumping stations & sewage treatment plants (STP) that will serve the purpose of treatment of the generated wastewater in the Varanasi city. The purpose of the EIA study is to identify the major impacts of the proposed projects followed by detailed survey and study on the important environmental impacts. 3.1.3 Objective of the EIA Study The purpose of the EIA Study is to ensure that development options under consideration are environmentally sound and sustainable and that the environmental consequences of the project are recognized early and taken into account in the project design. The major objective of this study was to establish present environmental conditions along the project corridor through available data/information supported by field studies, wherever necessary; to predict the impacts on relevant environmental attributes due to the construction and operation of the proposed sewerage facilities, to suggest appropriate & adequate mitigation measures to minimize/reduce adverse impacts and to prepare a Environmental Impact Assessment (EIA) report including Environmental Management Plan (EMP) for timely implementation and scheduling of the mitigation measures. The EIA has been carried out on the Priority Project only. The existing sewerage facilities and sanctioned projects have not been included. 3.1.4 EIA Methodology (1) Approach of the EIA Study An EIA study basically includes establishment of the present environmental scenario, study of the specific activities related to the project and evaluation of the probable environmental impacts, thus, leading to the recommendations of necessary environmental control measures. The EIA study has also been carried out from the environmental point of view so as to ensure the sustainability of the project. An EIA study, thus, necessarily includes collecting detailed data and information on the existing environmental set up for establishing "Baseline Environmental Scenario" and study of related data on the proposed activities, i.e., "Project Description" or project data due to construction and operation of the project. The project data is then superimposed on the baseline data and the resultant environmental conditions and environmental impacts associated with construction and operations are predicted with the help of effective and appropriate impact prediction tools and procedures under "Assessment of Environmental Impacts". To mitigate detrimental impacts on the environment, the necessary environmental control, protective and mitigation measures are finally recommended as "Environmental Management Plan". The major environmental disciplines in this EIA study include water, wastewater, and sludge quality, land use, & socio-economics. The EIA study has been conducted emphasizing the impact of the different components of the existing sanitation system as well as impact of the proposed sewage

Final Report on Water Quality Management Plan for Ganga RiverVolume IV-4, Feasibility Study for Varanasi City, Part I, Sewerage Scheme
3-3
treatment plant (STP). The main components of the project on which EIA study has been conducted are – rehabilitation of existing main trunk sewer, five (5) ghat pumping stations, Konia MPS, Dinapur STP and Bhagwanpur STP, construction of Assi nala interceptor sewer, Chaukaghat MPS and connection to Sathwa STP, Varuna river interceptors, and pumping stations connection to Varuna river interceptor. The entire EIA study has been carried out within existing policy, legal and administrative framework considering the applicable environmental legislations, regulations and guidelines. In addition to the primary data collected in the Master Plan stage, secondary data was collected with respect to physical, biological and human environment of the study area and other relevant information about the project. Primary field data was generated in the study area on surface water, wastewater, and sludge from the treatment plant. A comprehensive database was established after compilation of both primary and secondary data. In the way of the study, firstly the relevant aspects of the natural and socio-economic environment are described and the potential beneficial and adverse impacts on the social and natural environment during the implementation and operation phases have been identified. The environmental impacts associated with construction and operation of proposed projects have then been determined through appropriate impact prediction tools and procedures. An Environmental Management Plan (EMP) has been formulated for implementing the proposed mitigative measures as well as institutional arrangements required for the purpose. So, in brief, the scope of the EIA study includes:
• To carry out the survey at the different sites where the same treatment technology (WSP) is used by collecting existing data, visiting a few existing WSPs, evaluating the cause and level of impacts, and incorporating the results into the evaluation.
• To identify the major impacts such as resettlement, land acquisition, disposal site, change in landscape, land-use and vegetation, groundwater contamination from seepage of the STP, pollution and hydrological changes in receiving bodies of treated water, sludge production and disposal or reuse, odour production, health hazards to the plant operators, etc., of the proposed large sewage treatment plant (STP).
• To carry out the mitigation measures for the risk in construction and operation of the STP due to accident, power cut, etc. and to formulate the necessary mitigation and monitoring plan to reduce the impact of the proposed pumping stations and STP.
The methodology adopted is presented in the form of flow chart (Figure 3.1). The methodology is presented in detail in the subsequent sections.

Final Report on Water Quality Management Plan for Ganga RiverVolume IV-4, Feasibility Study for Varanasi City, Part I, Sewerage Scheme
3-4
Figure 3.1 Schematic Diagram for Approach and Methodology of EIA
(2) Establishing Baseline Environmental Scenario “Baseline Environmental Scenario” is generally established through:
- Collection of secondary data through review of existing literature/data/information - Generation/collection of primary data through survey and monitoring
The baseline environmental conditions of the study area have been established through survey and review of published literature, and field studies/monitoring/survey. At the outset, the relevant secondary data have been collected reviewed and analysed.
Primary Data Collection (Field Study, Survey &
Monitoring)
Establishing Baseline Environmental
Scenario
Assessment of
Environment
Institutional Strengthening for
Implementation of EMP
Mitigation Measures &
Plans
Post Project Environmental
Monitoring Programme
Fixing Monitoring Locations
Greenbelt & Afforestation
Plan
Suggestion of Mitigation Measures
Secondary Data Collection
(Literature Survey)
Study of Project Details & Reconnaissance
Survey
Identification of Critical Environmental Issues
Study & Review of Project Data/Activities
Impact Prediction Tools & Procedures
Cost of Mitigation Measures
Identification of Data Sources
Environmental Management Plan (EMP)
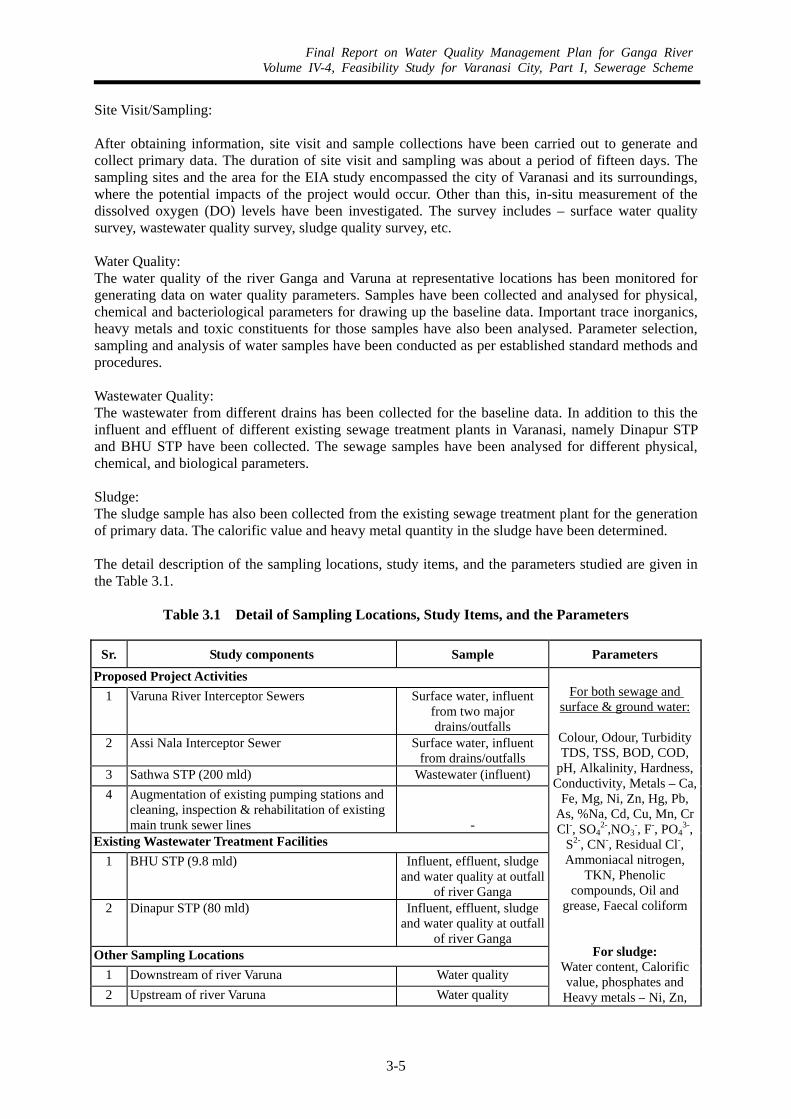
Final Report on Water Quality Management Plan for Ganga RiverVolume IV-4, Feasibility Study for Varanasi City, Part I, Sewerage Scheme
3-5
Site Visit/Sampling: After obtaining information, site visit and sample collections have been carried out to generate and collect primary data. The duration of site visit and sampling was about a period of fifteen days. The sampling sites and the area for the EIA study encompassed the city of Varanasi and its surroundings, where the potential impacts of the project would occur. Other than this, in-situ measurement of the dissolved oxygen (DO) levels have been investigated. The survey includes – surface water quality survey, wastewater quality survey, sludge quality survey, etc. Water Quality: The water quality of the river Ganga and Varuna at representative locations has been monitored for generating data on water quality parameters. Samples have been collected and analysed for physical, chemical and bacteriological parameters for drawing up the baseline data. Important trace inorganics, heavy metals and toxic constituents for those samples have also been analysed. Parameter selection, sampling and analysis of water samples have been conducted as per established standard methods and procedures. Wastewater Quality: The wastewater from different drains has been collected for the baseline data. In addition to this the influent and effluent of different existing sewage treatment plants in Varanasi, namely Dinapur STP and BHU STP have been collected. The sewage samples have been analysed for different physical, chemical, and biological parameters. Sludge: The sludge sample has also been collected from the existing sewage treatment plant for the generation of primary data. The calorific value and heavy metal quantity in the sludge have been determined. The detail description of the sampling locations, study items, and the parameters studied are given in the Table 3.1.
Table 3.1 Detail of Sampling Locations, Study Items, and the Parameters
Sr. Study components Sample Parameters
Proposed Project Activities 1 Varuna River Interceptor Sewers Surface water, influent
from two major drains/outfalls
2 Assi Nala Interceptor Sewer Surface water, influent from drains/outfalls
3 Sathwa STP (200 mld) Wastewater (influent) 4 Augmentation of existing pumping stations and
cleaning, inspection & rehabilitation of existing main trunk sewer lines
-
Existing Wastewater Treatment Facilities 1 BHU STP (9.8 mld) Influent, effluent, sludge
and water quality at outfall of river Ganga
2 Dinapur STP (80 mld) Influent, effluent, sludge and water quality at outfall
of river Ganga Other Sampling Locations
1 Downstream of river Varuna Water quality 2 Upstream of river Varuna Water quality
For both sewage and
surface & ground water:
Colour, Odour, TurbidityTDS, TSS, BOD, COD,
pH, Alkalinity, Hardness, Conductivity, Metals – Ca,
Fe, Mg, Ni, Zn, Hg, Pb, As, %Na, Cd, Cu, Mn, CrCl-, SO4
2-,NO3-, F-, PO4
3-, S2-, CN-, Residual Cl-, Ammoniacal nitrogen,
TKN, Phenolic compounds, Oil and
grease, Faecal coliform
For sludge: Water content, Calorific value, phosphates and
Heavy metals – Ni, Zn,
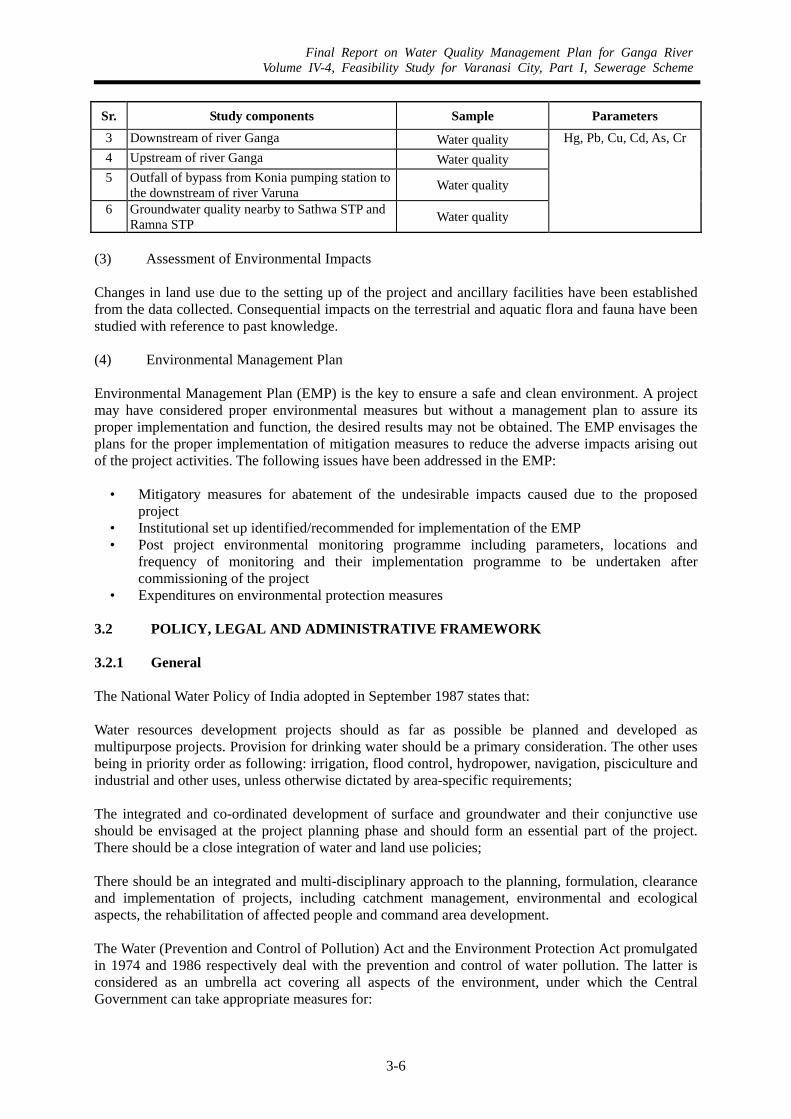
Final Report on Water Quality Management Plan for Ganga RiverVolume IV-4, Feasibility Study for Varanasi City, Part I, Sewerage Scheme
3-6
Sr. Study components Sample Parameters 3 Downstream of river Ganga Water quality 4 Upstream of river Ganga Water quality 5 Outfall of bypass from Konia pumping station to
the downstream of river Varuna Water quality
6 Groundwater quality nearby to Sathwa STP and Ramna STP Water quality
Hg, Pb, Cu, Cd, As, Cr
(3) Assessment of Environmental Impacts Changes in land use due to the setting up of the project and ancillary facilities have been established from the data collected. Consequential impacts on the terrestrial and aquatic flora and fauna have been studied with reference to past knowledge. (4) Environmental Management Plan Environmental Management Plan (EMP) is the key to ensure a safe and clean environment. A project may have considered proper environmental measures but without a management plan to assure its proper implementation and function, the desired results may not be obtained. The EMP envisages the plans for the proper implementation of mitigation measures to reduce the adverse impacts arising out of the project activities. The following issues have been addressed in the EMP:
• Mitigatory measures for abatement of the undesirable impacts caused due to the proposed project
• Institutional set up identified/recommended for implementation of the EMP • Post project environmental monitoring programme including parameters, locations and
frequency of monitoring and their implementation programme to be undertaken after commissioning of the project
• Expenditures on environmental protection measures 3.2 POLICY, LEGAL AND ADMINISTRATIVE FRAMEWORK 3.2.1 General The National Water Policy of India adopted in September 1987 states that: Water resources development projects should as far as possible be planned and developed as multipurpose projects. Provision for drinking water should be a primary consideration. The other uses being in priority order as following: irrigation, flood control, hydropower, navigation, pisciculture and industrial and other uses, unless otherwise dictated by area-specific requirements; The integrated and co-ordinated development of surface and groundwater and their conjunctive use should be envisaged at the project planning phase and should form an essential part of the project. There should be a close integration of water and land use policies; There should be an integrated and multi-disciplinary approach to the planning, formulation, clearance and implementation of projects, including catchment management, environmental and ecological aspects, the rehabilitation of affected people and command area development. The Water (Prevention and Control of Pollution) Act and the Environment Protection Act promulgated in 1974 and 1986 respectively deal with the prevention and control of water pollution. The latter is considered as an umbrella act covering all aspects of the environment, under which the Central Government can take appropriate measures for:

Final Report on Water Quality Management Plan for Ganga RiverVolume IV-4, Feasibility Study for Varanasi City, Part I, Sewerage Scheme
3-7
• Protecting and improving the quality of the environment, and • Preventing, controlling and abating environmental pollution.
The Pollution Control Boards (PCB) was established under this Act both at the Central Government and also at the State Government level for each state. The sewerage project of Varanasi city will be implemented by the GoUP. The GoUP will co-ordinate with different Government Departments like Varanasi Nagar Nigam (VNN), UP Jal Nigam, Varanasi Jal Sansthan, Varanasi Development Authority, Revenue Department, Irrigation Department, State Pollution Control Board at various stages of the implementation of the project and also during the operation phase of the project. During the construction phase mitigation measures necessary as per Water Pollution Control Act, 1974, Air (Prevention and Control of Pollution) Act, 1981 and Environmental Protection Act, 1986 will be taken. Since the State Pollution Control Board is the enforcing agency for these Acts, the UPJN/VNN/VJS will seek their advice, whenever necessary. 3.2.2 Legal Framework (1) Water Pollution Control The Water (Prevention & Control of Pollution) Act, 1974 was enforced by the Government of India in 1974. The Central Pollution Control Board and the State Boards were established under the provisions of this Act. The Act is applicable to all Union Territories and has been adopted by all the States, by resolution passed on that behalf under clause (I) of Article 252 of the Constitution. Under the provisions of this Act, no discharge of wastewater can be made into the environment without obtaining prior consent from State Pollution Control Boards (from the Central Pollution Control Board, in case of Union Territories). The consent prescribes the volume and quality of wastewater, in terms of concentration of various pollutants, which is permitted for discharge into the environment. The Act allows both the Union Territories and the State Governments and their respective Pollution Control Boards, to make rules for implementation of the Act. In case of a conflict, however, the Union Government rules prevail. (2) Air Pollution Control The Air (Prevention and Control of Pollution) Act, 1981 was formulated by the Central Government to regulate air pollution from various sources. Under this Act, the standards for various pollutants namely SO2, NOx, Suspended Particulate Matter, CO, hydrocarbons and several other air pollutants were stipulated by CPCB to protect the ambient air quality. The emissions from various stacks and other elevated sources were also simultaneously regulated as per recommended standards by the State Boards under the guidelines given by the Central Pollution Control Board. These standards were granted by the Boards by way of granting consent to establish and to operate the industry. The noise levels were also regulated by stipulating noise for residential areas and industrial areas. (3) Environment Protection Act The Environment Protection Act, 1986 came into existence after promulgation of the above Acts. This Act has an overriding effect on the other earlier environment Acts. The Ministry of Environment and Forests (MoEF) is responsible for the administration of this Act. The Act is an Omnibus Act subsuming the various pollution control, wildlife, forest conservation Acts. The Act therefore links the pollution control and natural resource conservation issues. The Act empowers the Union Government to make rules providing standards in excess of which environmental pollutants shall not be discharged or emitted into the environment. It also empowers the Union

Final Report on Water Quality Management Plan for Ganga RiverVolume IV-4, Feasibility Study for Varanasi City, Part I, Sewerage Scheme
3-8
Government to make rules regarding handling, storage, manufacture and import of hazardous substances including wastes. Violation of these rules constitutes a crime that is punishable by imprisonment and/or fine. (4) Hazardous Chemical Storage and Handling Under the Environment Protection Act, 1986, rules for hazardous waste handling have been defined, under which the State Pollution Control Boards could grant authorisation to the industry only when measures for safe disposal of such wastes is provided. (5) Notification of Environmental Impact Assessment The MoEF enforced the Notification in January 1994 for conducting Environmental Impact Assessment (EIA) studies, which are obligatory for the establishment of certain categories of industries specified in Schedule I. The Schedule I industries include the fertiliser, petrochemical, pharmaceutical, dyes and paint, iron and steel manufacturing industries, thermal power plants, mining industries and also port and harbour and the river valley projects. The appraisal committees comprising Experts, Governmental official and Non-Government Organisations (NGOs) were set up by the MoEF to scrutinise various EIA Reports prepared for the establishment of such industries and projects. The appraisal committees would accord an environmental clearance to the project in consultation with MoEF after scrutinising the EIA report for the proposed project. (6) Land Acquisition Act Land is normally acquired under the provisions of the Land Acquisition Act, 1894 that is general and basic law in the country for the acquisition of land for public purposes and companies. This Act was comprehensively amended in the year 1984, taking into consideration the recommendations of the Law Commission, the Land Acquisition Review Committee, headed by Justice A. N. Mulla, as well as suggestions from the State Governments and other quarters. The Conference of the Revenue Secretaries of States (July 1989) have also made recommendations that all land should be acquired under the provisions of the Land Acquisition Act, 1894 and other laws repugnant thereto should be brought in line with it or repealed altogether. However, these efforts have not met with success and a large number of laws, having different procedures and norms of compensation, continue to operate. In view of the acknowledged superiority of the Land Acquisition Act, 1894 land is acquired under the provisions of this Act. The underlying principle governing the acquisition of land under the Land Acquisition Act, 1894 is that compensation alone is payable in lieu of deprivation. However, there is a provision under Section 31 (3) in the Land Acquisition Act for grant of land in lieu of money compensation (Refer to Appendix A). 3.2.3 Environmental Protection Standards
1) River Water Quality Standards Until recently the only criteria available for classification of water bodies was as per the ‘Designated Best Use’ (DBU) prescribed by Bureau of Indian Standards and Central Pollution Control Board (CPCB) way back in 1981. According to this concept, out of various purposes for which the water body is used, the one that requires highest quality of water is taken as the benchmark and classified as ‘Designated Best Use’. According to this criteria water bodies are divided in five categories viz.:

Final Report on Water Quality Management Plan for Ganga RiverVolume IV-4, Feasibility Study for Varanasi City, Part I, Sewerage Scheme
3-9
Class A : Drinking water source without conventional treatment, but with
chlorination Class B : Outdoor bathing Class C : Drinking water source with conventional treatment Class D : Propagation of wildlife and fisheries Class E : Irrigation, industrial cooling and controlled waste disposal
This criteria lays down reference values for among others pH, dissolved oxygen, biological oxygen demand, Coliform etc. For instance specified limits for DO, BOD and coliform for Class A are 6 ppm, 2 ppm and 50/100 ml respectively. For lower category such as Class D, specified values for these indicators are 4 ppm, 6 ppm and 5000/100 ml respectively. A detailed parameter-wise criteria is presented in Appendix B. Recently, primary quality for class B regarding coliform number has been revised as follows; faecal coliform: <500 MPN/100 ml (Desirable), <2,500 MPN/100 ml (Maximum permissible). As of now this criteria is followed by various agencies responsible for management and control of water quality in the country including the two ongoing programmes viz. National River Conservation Plan and National Lake Conservation Plan. However, in the current context of increased pollution loads and concerns for long-term ecological sustainability, it is felt that this criteria has certain fundamental limitations. Some of these are listed below:
• DBU criteria consider only human requirements and exclude ecological aspects and
their relation to the human beings. In certain cases ecological violations are not identified while the desired criteria may be satisfied.
• It recognizes only organised uses and ignores the requirements of large rural community.
• Two decades back when the criteria were developed, concerns on non-domestic sources of pollution were not pronounced.
• In case of large water bodies and rivers, adhering to one particular class of water is practically difficult and has high costs associated with any technical intervention.
• There is inherent inconsistency with regard to the set of parameters applicable to higher and lower classes. For instance the category on ‘irrigation, industrial cooling and controlled waste disposal” specifies limits for TDS, sodium absorption ration etc. but does not cover BOD, coliform, helminth, toxicants.
Recognising these limitation, the Central Pollution Control Board has proposed a new criteria for classification of water bodies. The new approach is based on the premise of maintaining and restoring ‘wholesomeness’ of water for the health of ecosystem and environment in general; and protecting the designated organised uses of water by human beings and involving community for water quality management. The term ‘Wholesomeness’ here pertains to taking an ecosystem approach to aquatic environment and including socio-cultural aspects in to consideration. The new classification system proposes three categories or tiers of indicators of water quality depending on the ease or complexity involved in their determination with regard to knowledge, skills, and equipment. Secondly, it classifies water bodies into three broad categories viz. :
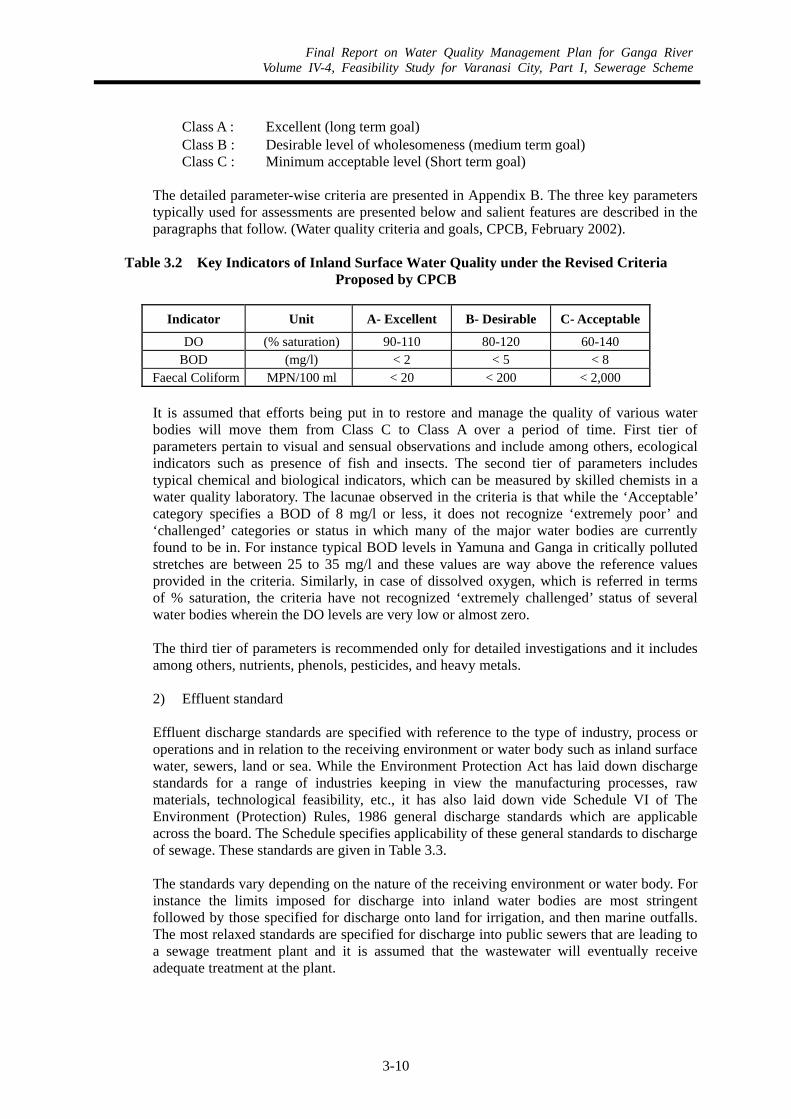
Final Report on Water Quality Management Plan for Ganga RiverVolume IV-4, Feasibility Study for Varanasi City, Part I, Sewerage Scheme
3-10
Class A : Excellent (long term goal) Class B : Desirable level of wholesomeness (medium term goal) Class C : Minimum acceptable level (Short term goal)
The detailed parameter-wise criteria are presented in Appendix B. The three key parameters typically used for assessments are presented below and salient features are described in the paragraphs that follow. (Water quality criteria and goals, CPCB, February 2002).
Table 3.2 Key Indicators of Inland Surface Water Quality under the Revised Criteria Proposed by CPCB
Indicator Unit A- Excellent B- Desirable C- Acceptable
DO (% saturation) 90-110 80-120 60-140 BOD (mg/l) < 2 < 5 < 8
Faecal Coliform MPN/100 ml < 20 < 200 < 2,000 It is assumed that efforts being put in to restore and manage the quality of various water bodies will move them from Class C to Class A over a period of time. First tier of parameters pertain to visual and sensual observations and include among others, ecological indicators such as presence of fish and insects. The second tier of parameters includes typical chemical and biological indicators, which can be measured by skilled chemists in a water quality laboratory. The lacunae observed in the criteria is that while the ‘Acceptable’ category specifies a BOD of 8 mg/l or less, it does not recognize ‘extremely poor’ and ‘challenged’ categories or status in which many of the major water bodies are currently found to be in. For instance typical BOD levels in Yamuna and Ganga in critically polluted stretches are between 25 to 35 mg/l and these values are way above the reference values provided in the criteria. Similarly, in case of dissolved oxygen, which is referred in terms of % saturation, the criteria have not recognized ‘extremely challenged’ status of several water bodies wherein the DO levels are very low or almost zero. The third tier of parameters is recommended only for detailed investigations and it includes among others, nutrients, phenols, pesticides, and heavy metals. 2) Effluent standard Effluent discharge standards are specified with reference to the type of industry, process or operations and in relation to the receiving environment or water body such as inland surface water, sewers, land or sea. While the Environment Protection Act has laid down discharge standards for a range of industries keeping in view the manufacturing processes, raw materials, technological feasibility, etc., it has also laid down vide Schedule VI of The Environment (Protection) Rules, 1986 general discharge standards which are applicable across the board. The Schedule specifies applicability of these general standards to discharge of sewage. These standards are given in Table 3.3. The standards vary depending on the nature of the receiving environment or water body. For instance the limits imposed for discharge into inland water bodies are most stringent followed by those specified for discharge onto land for irrigation, and then marine outfalls. The most relaxed standards are specified for discharge into public sewers that are leading to a sewage treatment plant and it is assumed that the wastewater will eventually receive adequate treatment at the plant.

Final Report on Water Quality Management Plan for Ganga RiverVolume IV-4, Feasibility Study for Varanasi City, Part I, Sewerage Scheme
3-11
Table 3.3 Discharge Standards
Indicator Inland surface water
Public sewers
Land for irrigation
Marine outfall
Suspended solids 100 600 200 100 Oil and grease 10 20 10 20
BOD5 30 350 100 100 Note : All values are in mg/l and are the maximum permissible levels. Source: Pollution control acts, rules and notifications issued hereunder, CPCB, September, 2001.
The general BOD limit specified for discharge of wastewater from typical industrial sources or domestic wastewater is same at 100 mg/l. However, the rules specify that the discharge limits can be made further stringent if the concerned pollution control authority finds it appropriate depending on the condition of the receiving environment and severity of the discharges from various sources. With regard to application of sewage for land farming the ‘Manual on Sewerage and Sewage Treatment’, CPHEEO, Ministry of Urban Development, Govt. of India, provides guidelines on characteristics of irrigation waters. These include conductivity/ salinity sodium absorption ratio, chlorides, boron, etc. In addition, the manual provides maximum permissible concentrations of toxic heavy metals etc. Constituent wise values are given in Appendix B. However, it is noted that while salinity and toxicity aspects have been addressed in these standards and guidelines, the issue of infection to agriculture workers and consumers of cultivated products due to bacterial population in sewage has not been addressed here. If treated sewage is to be used for irrigation, as is proposed in the sanitation project, upper limits for important parameters will be:
Table 3.4 Treated Water Quality for Irrigation
Parameter Unit Limits
BOD5 mg/l 100 Suspended Solids mg/l 200 Dissolved Solids mg/l 2100 pH 5.5-9.0 Oil & Grease mg/l 10 Arsenic mg/l 0.2 Boron mg/l 2.0 Cyanide mg/l 0.2 Chloride mg/l 600 Sulphate mg/l 1000
Source : CPCB, Stds for discharge of Ind./Dom. wastewater In addition to the standards prescribed by the CPCB, the Project proposes to take into account the WHO guidelines for wastewater reuse for irrigation of level B (cereals, industrial and fodder crops, pasture and trees). These guidelines were elaborated by WHO after reviewing epidemiological studies of untreated wastewater reuse. This review led to the conclusion that the danger of infection is:
1. high with intestinal nematodes; 2. moderate with bacteriological infections and diarrheas; 3. minimal with viral infections and diarrheas, and hepatitis A; and 4. high to non existent with trematode and cestode infections, schistosomiasis,
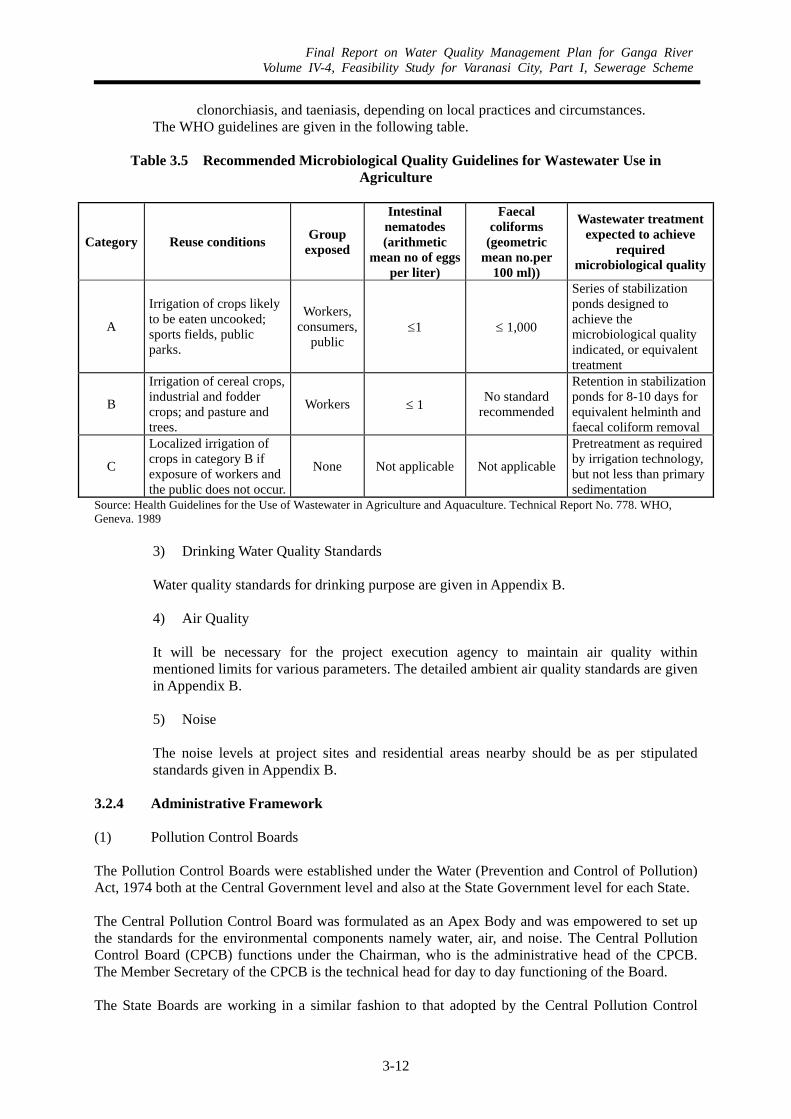
Final Report on Water Quality Management Plan for Ganga RiverVolume IV-4, Feasibility Study for Varanasi City, Part I, Sewerage Scheme
3-12
clonorchiasis, and taeniasis, depending on local practices and circumstances. The WHO guidelines are given in the following table.
Table 3.5 Recommended Microbiological Quality Guidelines for Wastewater Use in Agriculture
Category Reuse conditions Group exposed
Intestinal nematodes (arithmetic
mean no of eggs per liter)
Faecal coliforms
(geometric mean no.per
100 ml))
Wastewater treatment expected to achieve
required microbiological quality
A
Irrigation of crops likely to be eaten uncooked; sports fields, public parks.
Workers, consumers,
public ≤1 ≤ 1,000
Series of stabilization ponds designed to achieve the microbiological quality indicated, or equivalent treatment
B
Irrigation of cereal crops, industrial and fodder crops; and pasture and trees.
Workers ≤ 1 No standard recommended
Retention in stabilization ponds for 8-10 days for equivalent helminth and faecal coliform removal
C
Localized irrigation of crops in category B if exposure of workers and the public does not occur.
None Not applicable Not applicable
Pretreatment as required by irrigation technology, but not less than primary sedimentation
Source: Health Guidelines for the Use of Wastewater in Agriculture and Aquaculture. Technical Report No. 778. WHO, Geneva. 1989
3) Drinking Water Quality Standards Water quality standards for drinking purpose are given in Appendix B. 4) Air Quality It will be necessary for the project execution agency to maintain air quality within mentioned limits for various parameters. The detailed ambient air quality standards are given in Appendix B. 5) Noise The noise levels at project sites and residential areas nearby should be as per stipulated standards given in Appendix B.
3.2.4 Administrative Framework (1) Pollution Control Boards The Pollution Control Boards were established under the Water (Prevention and Control of Pollution) Act, 1974 both at the Central Government level and also at the State Government level for each State. The Central Pollution Control Board was formulated as an Apex Body and was empowered to set up the standards for the environmental components namely water, air, and noise. The Central Pollution Control Board (CPCB) functions under the Chairman, who is the administrative head of the CPCB. The Member Secretary of the CPCB is the technical head for day to day functioning of the Board. The State Boards are working in a similar fashion to that adopted by the Central Pollution Control
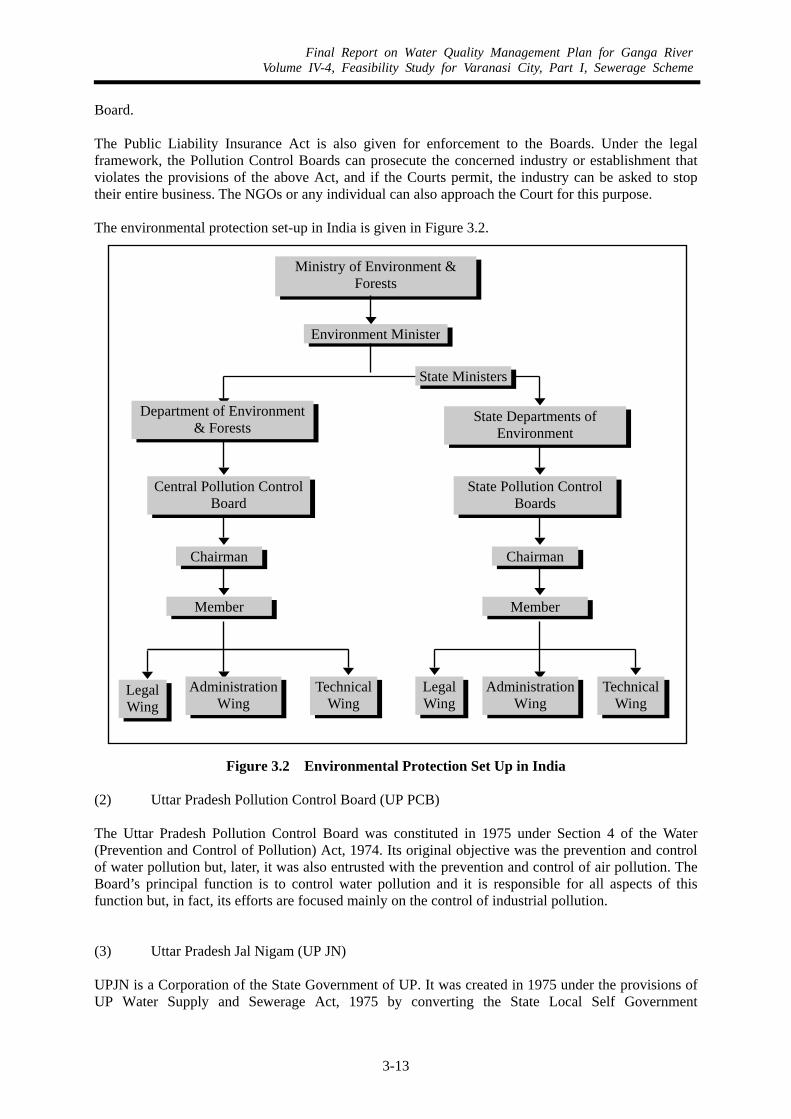
Final Report on Water Quality Management Plan for Ganga RiverVolume IV-4, Feasibility Study for Varanasi City, Part I, Sewerage Scheme
3-13
Board. The Public Liability Insurance Act is also given for enforcement to the Boards. Under the legal framework, the Pollution Control Boards can prosecute the concerned industry or establishment that violates the provisions of the above Act, and if the Courts permit, the industry can be asked to stop their entire business. The NGOs or any individual can also approach the Court for this purpose. The environmental protection set-up in India is given in Figure 3.2.
Figure 3.2 Environmental Protection Set Up in India (2) Uttar Pradesh Pollution Control Board (UP PCB) The Uttar Pradesh Pollution Control Board was constituted in 1975 under Section 4 of the Water (Prevention and Control of Pollution) Act, 1974. Its original objective was the prevention and control of water pollution but, later, it was also entrusted with the prevention and control of air pollution. The Board’s principal function is to control water pollution and it is responsible for all aspects of this function but, in fact, its efforts are focused mainly on the control of industrial pollution. (3) Uttar Pradesh Jal Nigam (UP JN) UPJN is a Corporation of the State Government of UP. It was created in 1975 under the provisions of UP Water Supply and Sewerage Act, 1975 by converting the State Local Self Government
Ministry of Environment & Forests
Environment Minister
Department of Environment & Forests
Central Pollution Control Board
Chairman
State Ministers
State Departments of Environment
State Pollution Control Boards
Member
Legal Wing
Administration Wing
Technical Wing
Chairman
Member
Administration Wing
Technical Wing
Legal Wing

Final Report on Water Quality Management Plan for Ganga RiverVolume IV-4, Feasibility Study for Varanasi City, Part I, Sewerage Scheme
3-14
Engineering Department into UP Jal Nigam. The UPJN is entrusted with the job of development of water supply and sewerage sector in the State. It has also been designated as the implementing agency for the NRCP and NLCP in the State of UP. The Ganga Pollution Control Unit in Varanasi was basically formed to undertake the construction, execution of the assets that were created under the Ganga Action Plan – Phase I. Under this, different pumping stations and two sewage treatment plants were built to take care of the sewage and effluent flowing into the Ganga river. Since then, it has been a primary body also responsible for the operation and maintenance of these assets. As per the order from the Central Government, the operation and maintenance of these assets were supposed to be transferred to the local body. However, these have not been transferred so far. (4) Varanasi Nagar Nigam (VNN) The Varanasi Nagar Nigam was formed in 1960 with the objective to provide all the necessary basic civic facilities to the residents of and visitors to the Varanasi city. These services include the cleaning of drains and gutters, solid waste management, maintenance of roads, lighting, etc. Historically Varanasi is a Holy City and attracts a large floating population in the form of pilgrims, which entail additional burden on the existing civic facilities. Varanasi Nagar Nigam has divided the city into 5 zones and 91 wards for administrative and management purposes. The sanitation aspect of the city is taken care by the Health and Sanitation Department, which has Health Officers, Additional Health Officers, Zonal Health Officers and Sanitary Inspector. On a broader level, the Nagar Nigam handles the following responsibilities like health and sanitation, primary education, solid waste management, plantation, slaughterhouses, cleaning of roads, maintenance of Ghats etc. With special reference to the surface and underground drainage system, Varanasi Nagar Nigam is involved in:
• Cleaning of surface drains and desilting of deep drains • Construction and maintenance of surface drains, deep drains along the roads and lanes within
municipal maintenance Additionally, Varanasi Nagar Nigam is responsible for the maintenance of the branch sewers and some portion of main sewers in the city. The laterals and the branch sewers since they are small in size and form the most initial components of the sewer network, are easier to maintain. Their maintenance does not require heavy mechanical equipment and is generally done manually. Varanasi Nagar Nigam is currently managing this with their staffs that are not formally trained but have gained experience over the years. Generally in case of complex problems where mechanically aided cleaning is required Jal Sansthan is approached for help. (5) Varanasi Jal Sansthan (VJS) Till 1975, the Municipal Corporation (Nagar Nigam) was a single organisation that looked after all the operation and maintenance of the infrastructure including water supply and sewerage and the Local Self Government Engineering Department of the State Government did the planning and implementation of the capital works. However, with the arrival of the International Monetary Fund, it was decided that two separate entities will be required. One will be responsible for construction and execution while the other one will be mainly into operation and maintenance of these structures. Accordingly, under the UP Water Supply and Sewerage Act, 1975, Jal Nigam was established for

Final Report on Water Quality Management Plan for Ganga RiverVolume IV-4, Feasibility Study for Varanasi City, Part I, Sewerage Scheme
3-15
capital works and Jal Sansthans were created for operation and maintenance. Varanasi Jal Sansthan came into existence in 1976. It is responsible mainly for the cleaning and maintenance of the main and trunk sewers. The cleaning is mostly done through use of mechanical equipments. Varanasi Jal Sansthan is presently operating with 6 bucket winching machines and 4 jetting cum suction units. In the first phase of the Ganga Action plan, Jal Sansthan has procured one jetting cum suction machine, 3 gully pit emptier and one pay loader which enable the department to clean the sewer lines. Often on request of Nagar Nigam, Jal Sansthan carries out the cleaning for branch sewers also as Nagar Nigam has neither equipment nor technical expertise to carry out complex operations. Varanasi Jal Sansthan currently maintains the following main sewer lines:
• Main Old and Trunk Sewer • Orderly Bazaar sewer • Kamachchha Brick sewer • Durga Kund Brick Sewer • Bengali Tola Brick sewer • Rewari Talab Brick sewer • Baluabeer Brick sewer • G.T. Road Main sewer • Nawapura Brick sewer • Maduwadih Main sewer
(6) Varanasi Development Authority (VDA) The Varanasi Development Authority is responsible for
• Overall development of the city • Implementation of the land use Master Plan • Planning for sewerage infrastructure for Varanasi Development Authority colonies • Zoning of the city • Maintenance of the sewer lines in the Varanasi Development Authority colonies
Varanasi Development Authority does not have the technical staff specifically with reference to sewerage sector. However, as and when required manpower is hired on contract basis to carry out the job. 3.3 PROJECT DESCRIPTION 3.3.1 General The sewerage priority projects selected in M/P include the projects to abate the pollution and improve water quality of river Ganga and Varuna with the following objectives: • To Intercept wastewater in all major drains and sewer outfalls • To convey collected wastewater to sewage treatment plant (STP) • To treat wastewater at STP with appropriate technology and discharging effluent that comply with
National effluent standards for STP The following facilities have been identified in the Master Plan for the priority projects.

Final Report on Water Quality Management Plan for Ganga RiverVolume IV-4, Feasibility Study for Varanasi City, Part I, Sewerage Scheme
3-16
Renovation/Rehabilitation 1) Ghat pumping station upgrades 2) Rehabilitation of STP at Dinapur and Sewage Pumping Station (SPS) at Konia 3) Rehabilitation of STP at Bhagwanpur 4) Operational plan for inspection and rehabilitation of existing main trunk sewer
New Construction
1) Construction of relieving trunk sewer 2) Chaukaghat main pumping station, and connection to Sathwa treatment plant 3) Sathwa treatment plant 4) Varuna river interceptor sewer 5) Pump station at Narokhar drain and connection to Varuna river Interceptor 6) Assi Nala Interceptor sewer 7) Secondary trunk sewers in all four sewerage districts
3.3.2 Existing Sewerage Facilities in Varanasi City
(1) Trunk Sewer Two main sewers exist in the city of Varanasi. The main Sewer (750-2440 mm diameter and 8 km long) runs from Assi to Rajghat outfall. Another is the Orderly Bazaar trunk sewer (600-900 mm diameter), which joins the main sewer at Kabir Chaura. Both these brick sewers are about 75 years old. The existing sewer network covers over 315 km in the city.
(2) Sewage Treatment Plants Presently in Varanasi there are three major sewage treatment plants. They are:
• Dinapur STP • Bhagwanpur STP, and • DLW STP.
1) Dinapur Sewage Treatment Plant Dinapur STP is based on Activated Sludge Process. It is under direct control of UP Jal Nigam for operation and maintenance purposes. The design capacity of the plant is 80 mld. The work on this plant was initiated during February 1988 and it was fully commissioned in June 1994. Different aspects of the Dinapur STP plant are given below. The process design parameters are available from original process calculations. However, there is insufficient operating data to compare present unit wise performance with design values. The STP consists of primary clarifiers, aeration tanks, secondary clarifiers, and anaerobic sludge digesters. The design criteria for different components of the treatment plant and the unit wise details of the different units and the pump details are given in Appenndix C. Major liquid process components of the Dinapur STP consist of head works, primary treatment and secondary treatment. All these three levels have been listed by the treatment stage. The condition of each component has been rated as poor, fair, or good depending upon age and condition. An itemized list of the major plant components related to the liquid process is given in Appendix C. In the sewage treatment plant sludge is produced from the sedimentation tanks as a result of conversion of organic material into cellular mass. After adequate solids retention time the digested sludge is conveyed to the sludge drying beds for dewatering. An inventory of solids handling process also is provided in Appendix C.

Final Report on Water Quality Management Plan for Ganga RiverVolume IV-4, Feasibility Study for Varanasi City, Part I, Sewerage Scheme
3-17
Average monthly inflow and effluent characteristics data from the beginning of the year 2000 and up to August 2002 have been obtained. From the BOD, COD, and TSS of influent sewage and effluent the performance of the plant is measured. Average yearly inflow and effluent characteristics for the year 2000-2002 are given in the Table 3.6 and the detail monthly characteristics data are given in Appendix C.
Table 3.6 Average Inflow and Effluent Characteristics of Dinapur STP
Influent Sewage (Raw) (mg/l)
Effluent (Treated) (mg/l) Overall Efficiency (%)Year
Flow (mld)
BOD COD TSS BOD COD TSS BOD COD TSS2000-2002 78.67 173.87 371.94 450.81 28.75 81.4 85.15 83 78 81
In Dinapur sewage treatment plant, influent wastewater quality appears to be within the treatment plants design parameters. However, the treatment plant is hydraulically overloaded. A comparative study of design parameters versus their actual value is provided in Appendix C. The treated water is utilised for irrigation purpose and unutilised water is discharged to the Ganga downstream of the confluence of Varuna river. 2) Bhagwanpur Sewage Treatment Plant The Bhagwanpur sewage treatment plant was commissioned in the year 1988 under Ganga Action Plan. The plant receives sewage from two pumping stations within BHU campus and from Assi pumping station. The design capacity of the plant is 9.8 mld (8 mld activated sludge process and 1.8 mld trickling filter). The present wastewater treatment process consists of three overall process stages: preliminary treatment, primary treatment, and secondary treatment. Each phase of treatment acts as a removal mechanism for targeted pollutants in the influent wastewater stream. The major liquid process units of Bhagwanpur STP consist of head works, primary system, and secondary system. An itemized list of major plant components related to the liquid process is provided in Appendix C. The various components are listed by treatment stage. Additionally the condition of each component has been rated poor, fair or good depending on age and condition. In the treatment plant sludge is produced from primary sedimentation and the biological sludge from the secondary clarifier. Average monthly inflow and effluent characteristics data for the recent three years test reports (1999-2001) have been obtained. From the BOD, COD, and TSS of influent sewage and effluent the performance of the plant is measured. The average data is shown in the Table 3.7 and the detail of the monthly data is provided in Appendix C. The treated water is discharged to the Ganga upstream of Assi nala outfall.
Table 3.7 Av. Inflow & Effluent Characteristics of Bhagwanpur STP for Year 1999-2000
Influent Sewage (Raw) Effluent (Treated) Overall Efficiency (%) Flow (mld) BOD COD TSS BOD COD TSS BOD COD TSS
AVG 13.68 93 179 183 17 54 19 82 70 89 3) Diesel Locomotive Works (DLW) Sewage Treatment Plant The Diesel Locomotive Works (DLW) STP is located in Railway area and it is operated and maintained by Railway Authority. It has a capacity to treat 12 mld of wastewater. This STP receives the raw sewage from DLW compound and treats the sewage by biological treatment process. The sewage is intercepted from Assi nala.
(3) Existing Pumping Stations in Varanasi
Final Report on Water Quality Management Plan for Ganga RiverVolume IV-4, Feasibility Study for Varanasi City, Part I, Sewerage Scheme
3-18
There are two main, and five intermediate sewerage-pumping stations, which were commissioned under GAP Phase-I. The detail data of the pumping station are provided in Appendix C. Assi Pumping Station Assi main pumping station is located on the bank of Assi nala adjacent to the BHU-Godauliya road. This PS intercepts sewage from Assi nala and pumps to the Bhagwanpur STP through a 400 mm diameter prestressed concrete pipe rising main for treatment. The capacity of the Assi MPS is 9 mld. Konia Main Pumping Station The Konia MPS is located in northern part of the Central City Sewerage District, and is isolated with the river Varuna on one side and railway track at Konia near Rajghat. This MPS was built during the GAP Phase-I. The pumping station has a capacity to pump 100 mld of sewage. It has two stage pumping arrangement having three screw pumps in the first stage and a battery of centrifugal pumps in the second stage. The sewage lifted by the screw pumps passes through the grit chamber and during high flow period part of the sewage pumped is bypassed into the river Varuna. The battery of the centrifugal pumps lifts the de-gritted sewage to the Dinapur main Sewage Treatment Plant through 1200 mm rising main about 2.9 km long. 5-Ghat Pumping Stations There are five intermediate pumping stations (IPS) on the ghats along the left bank of the river Ganga. They are – 1) Harischandra Ghat IPS (Capacity: 4 mld; Rising main: 200 mm) 2) Mansarovar Ghat IPS (Capacity: 6 mld; Rising main: 400 mm) 3) Dr. R. P. Ghat IPS (Capacity: 25 mld; Rising main: 600 mm) 4) Jalesan Ghat IPS (Capacity: 5 mld; Rising main: 250 mm) and 5) Trilochan Ghat IPS (Capacity: 5 mld; Rising main: 300 mm). These are old pumping stations and were re-commissioned under GAP Phase-I for intercepting sewage and pumping it back into the trunk sewer through rising main. The major units of all these pumping stations are – pump house, pumping plants, diesel generating set, and rising main. 3.3.3 Sanctioned Sewerage Facilities in Varanasi (1) Sewers and rising main Around 12.3 km sewers and a rising main is sanctioned under GAP Phase-II. (2) Sewage Treatment Plants Under GAP Phase-II one WSP sewage treatment plant with capacity 37 mld has been sanctioned at the Ramna site. Uttar Pradesh Jal Nigam has identified a 50 ha site near Ramna where a waste stabilization pond of 37 mld has been sanctioned under GAP Phase-II. This system includes pre-treatment facilities to remove grit and inorganic solids, followed by anaerobic ponds, facultative ponds and finally maturation ponds. Preliminary process details are shown in the Table 3.8 in summary form.

Final Report on Water Quality Management Plan for Ganga RiverVolume IV-4, Feasibility Study for Varanasi City, Part I, Sewerage Scheme
3-19
Table 3.8 Preliminary Process Calculations for Ramna STP
Basic Data Sewage flow 37 mld Influent BOD 180 mg/l Total coliform 107/100 ml Effluent BOD 30 mg/l Total coliform in effluent 10,000/100 ml
BOD removal For BOD removal anaerobic pond followed by facultative pond is provided
Anaerobic Pond Volume of the anaerobic pond 37,000 m3 Adopt depth of the pond 4.5 m Area of the pond 8,222 m2, say 8300 m2 Provided pond size 52 m x 160 m rectangular ponds Facultative Pond Area of the facultative pond 10 x 72 x 37,000 / 219 = 121,644 m2 Assuming 1.25 m depth. Detention period 4.1 days Land requirement 50 ha
(3) Pumping stations There will be one intermediate pumping station for which the plan has been sanctioned under GAP Phase-II. This pumping station is to be located at Nagwa for a design capacity of 50 mld. Capacity augmentation of existing 5-Ghat pumping stations is also sanctioned. 3.3.4 Proposed Sewerage Facilities in Varanasi City The proposed sewerage facilities under Feasibility Study were described and are explained briefly hereunder. (1) Rehabilitation of the Old Trunk Sewer Sewer system is an important part of infrastructure and plays an essential role for maintaining public health. Yet it is largely out of sight and in the past this has often been a cause of neglect, leading to sewer flooding, pollution, collapse and blockage. A sewer normally fails to receive attention till it starts giving serious trouble. The Old Trunk Sewer is the main lifeline of the sewerage system of the Varanasi and it cannot be dispensed with or abandoned. The procedure followed for any rehabilitation plan is divided into three main stages as described below: Stage 1: Initial planning Stage 2: Diagnostic study (Inspection Programme)
• Closed Circuit Television (CCTV) Inspection • Ground water monitoring • Flow measurement • Soil investigation • Ground surface condition • Waste water analysis • Structural assessment

Final Report on Water Quality Management Plan for Ganga RiverVolume IV-4, Feasibility Study for Varanasi City, Part I, Sewerage Scheme
3-20
Stage 3: Implementation (Rehabilitation) (2) Rehabilitation of Ghat Pumping Stations All the five ghat pumping stations located along the bank of the river Ganga have not been operated properly due to the problems as follows.
• During peak hours all pumps are running including standby pumps and some amount of over flow is also observed during the visit
• Alternative power supply (DG Generator) is available at all IPS. However, there is no standby generator, except at Dr. R.P.Ghat
• There is not a single instrument to measure level, flow, pressure, temperature etc for proper operation at any of the IPS
• There is no mechanized screen and only wire mesh is available to screen the sewagewater • There is no telecommunication facility provided at any of the IPS • Skilled operation and maintenance staff is not available
Replacement of the existing pumping equipment by new centrifugal pumps with vertical motors is proposed for all of the five pumping stations. (3) Rehabilitation of Existing Sewage Treatment Works
1) Konia Pumping Station Following rehabilitation and upgradation works are proposed for Konia Pumping Station.
• Diversion works at Rajghat • Pumps - Ist stage • Screen - IInd Stage • Detritor - IInd Stage • Pumps - IInd stage • Miscellaneous works
2) Dinapur STP Following rehabilitation and upgradation works are proposed for Dinapur Sewage Treatment Plant.
• Inlet Chamber • Parshall Flume • Primary Clarifiers • Distribution Chamber for Trickling Filters • Roughening Trickling filters • Aeration Tanks • Secondary Clarifiers • Treated Effluent Pump House • Primary Sludge Pump House • Return Sludge Pump House • Sludge Digesters • Sludge Drying Beds • Filtrate Pump House • Gas Holders • Power Generator Room • Gas Burner • Effluent Channel (5000m)

Final Report on Water Quality Management Plan for Ganga RiverVolume IV-4, Feasibility Study for Varanasi City, Part I, Sewerage Scheme
3-21
• Chlorination Room, Chlorine Contact Tank, Inter connecting piping and dechlorination by aeration
• Miscellaneous 3) Bhagwanpur STP Following rehabilitation and upgradation works are proposed for Bhagwanpur Sewage Treatment Plant.
• Inlet Chamber • Bar Screen Channel • Grit Chamber • Parshall Flume • Primary Clarifiers • Secondary Clarifiers • Sludge Digesters • Recirculation Pump House • Gas Holders • Engine Room • Gas Burner • Raw Sludge Pump House • Filtrate Pump House • Chlorination Room, Chlorine Contact Tank, Inter connecting piping and dechlorination
by aeration (4) Construction of Sathwa Treatment Plant
• Pumping facility • Treatment plant • Treated effluent channel to the local canal
For the wastewater generated in central Varanasi and trans Varuna area in future, a new Sewage Treatment Plant in northern area of the city is proposed. Location of the STP is presented in Figure 3.3.
Capacity: 200 mld Process: UASB + Facultative Aerated Lagoon Disinfection: Chlorination Effluent discharge: Irrigation canal
S.N. Units Value
1 Effluent BOD, mg/l < 30 2 Effluent TSS, mg/l < 50 3 Effluent faecal coliform, MPN/100 ml < 10,000 4 Odour Localized 5 Ground water contamination Moderate 6 Mosquito nuisance Minimal 8 Land requirement 41 ha
(5) Pumping Stations In the scheme of the project six pumping stations have been proposed.
• Sathwa Main Pumping Station • Chaukaghat Right Bank Pumping Station • Chaukaghat Left Bank Pumping Station • Narokhar Nala Pumping Station

Final Report on Water Quality Management Plan for Ganga RiverVolume IV-4, Feasibility Study for Varanasi City, Part I, Sewerage Scheme
3-22
• Phulwaria Nala Pumping Station • Saraiya Nala Pumping Station
1) Sathwa Main Pumping Station (MPS)
A pumping station is proposed at Sathwa STP site to maintain the hydraulics of the treatment plant. Various components of MPS will include:
• Main pumping station screen channel, wet well and valve chamber, • Main Electrical Panel (MEP) and Diesel Genset (DG) room, and • Twin rising main of 40 m length.
2) Chaukaghat Right Bank Pumping Station
Chaukaghat right bank pumping station is proposed to pump the sewage flow of right bank interceptor sewers and relief trunk sewer (under construction) upto Pandeypur crossing. Various components of pumping station include:
• Sewage pumping station screen channel, wet well and valve chamber, • MEP and DG room, • Rising main of 1200 m length from pumping station to Pandeypur crossing, and • River crossing structure on Varuna river for rising main
3) Chaukaghat Left Bank Pumping Station
Chaukaghat left bank pumping station will receive the sewage flow of left bank u/s interceptor sewer and this flow will be pumped to Pandeypur crossing. Various component of pumping station include:
• Sewage pumping station, screen channel, wet well and valve chamber, • MEP and DG room, • Rising main for 1000 m length from pumping station to Pandeypur crossing.
4) Narokhar Nala Pumping Station
• Pumping station at Narokhar nala • Rising main
It is proposed to intercept and divert the flow of Narokhar nala near the junction of Railway line with Narokhar nala. Flow of this nala shall be pumped to the left bank interceptor sewer (d/s) on Panchkoshi. Proposed scheme for Narokhar nala includes:
• Construction of intake weir and training of nala, • Diversion of flow to grit channels, • Intermediate sewage pumping station screen channel, wet well and valve chamber, • Main Electrical Panel (MEP) and Diesel Genset (DG) room, and • Rising main of 1830 m length from pumping station to left bank interceptor sewer (d/s)
on Panchkoshi road.
5) Phulwaria Nala Pumping Station It is proposed to intercept and divert the flow of Phulwaria nala, near Cantonment into right bank interceptor sewer. Phulwaria nala catchment falls under District IV, FSA 2, which comes under Lohta STP catchment in Phase II. Therefore, interception and diversion work is proposed for the present flow only and this facility will be decommissioned in the future. Proposed scheme for Phulwaria nala includes:
• Construction of intake weir and training of nala, • Diversion of flow to grit channels,
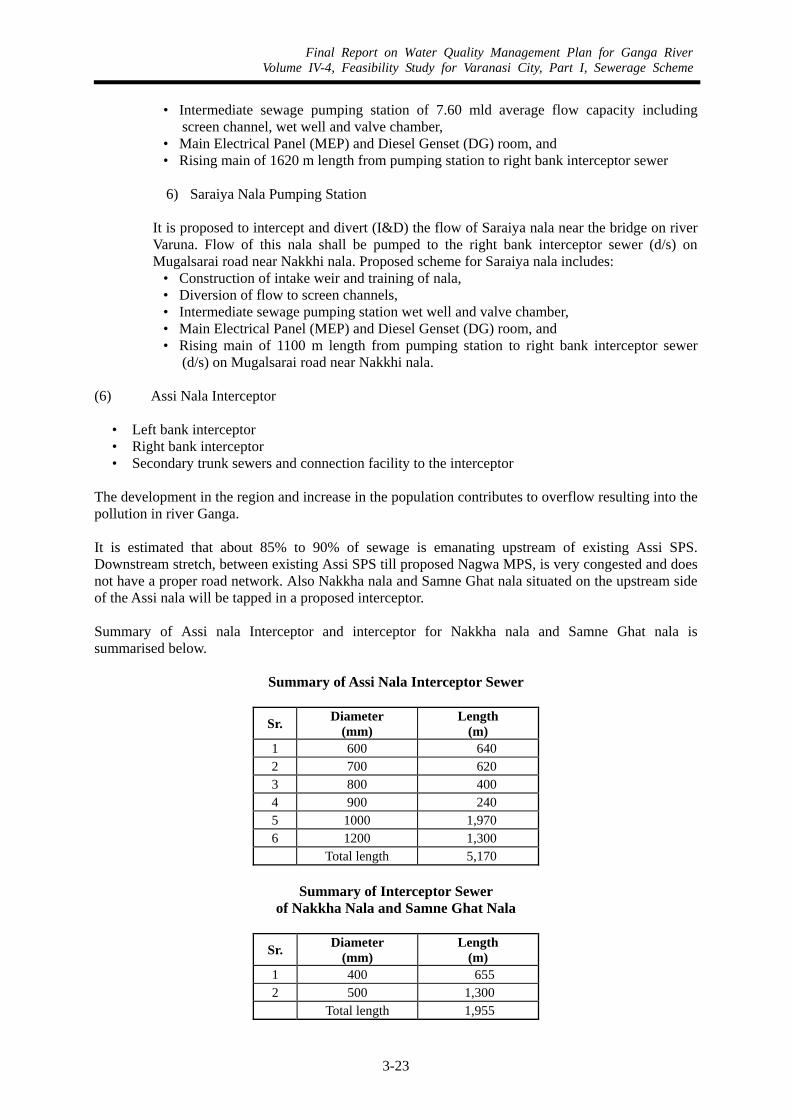
Final Report on Water Quality Management Plan for Ganga RiverVolume IV-4, Feasibility Study for Varanasi City, Part I, Sewerage Scheme
3-23
• Intermediate sewage pumping station of 7.60 mld average flow capacity including screen channel, wet well and valve chamber,
• Main Electrical Panel (MEP) and Diesel Genset (DG) room, and • Rising main of 1620 m length from pumping station to right bank interceptor sewer
6) Saraiya Nala Pumping Station
It is proposed to intercept and divert (I&D) the flow of Saraiya nala near the bridge on river Varuna. Flow of this nala shall be pumped to the right bank interceptor sewer (d/s) on Mugalsarai road near Nakkhi nala. Proposed scheme for Saraiya nala includes:
• Construction of intake weir and training of nala, • Diversion of flow to screen channels, • Intermediate sewage pumping station wet well and valve chamber, • Main Electrical Panel (MEP) and Diesel Genset (DG) room, and • Rising main of 1100 m length from pumping station to right bank interceptor sewer
(d/s) on Mugalsarai road near Nakkhi nala. (6) Assi Nala Interceptor
• Left bank interceptor • Right bank interceptor • Secondary trunk sewers and connection facility to the interceptor
The development in the region and increase in the population contributes to overflow resulting into the pollution in river Ganga. It is estimated that about 85% to 90% of sewage is emanating upstream of existing Assi SPS. Downstream stretch, between existing Assi SPS till proposed Nagwa MPS, is very congested and does not have a proper road network. Also Nakkha nala and Samne Ghat nala situated on the upstream side of the Assi nala will be tapped in a proposed interceptor. Summary of Assi nala Interceptor and interceptor for Nakkha nala and Samne Ghat nala is summarised below.
Summary of Assi Nala Interceptor Sewer
Sr. Diameter (mm)
Length (m)
1 600 640 2 700 620 3 800 400 4 900 240 5 1000 1,970 6 1200 1,300 Total length 5,170
Summary of Interceptor Sewer
of Nakkha Nala and Samne Ghat Nala
Sr. Diameter (mm)
Length (m)
1 400 655 2 500 1,300 Total length 1,955

Final Report on Water Quality Management Plan for Ganga RiverVolume IV-4, Feasibility Study for Varanasi City, Part I, Sewerage Scheme
3-24
(7) Varuna River Interceptors
• Left bank interceptor (up stream) • Left bank interceptor (down stream) • Right bank interceptor (up stream) • Right bank interceptor (down stream) • Sathwa trunk sewer • Secondary trunk sewers and connection facility to the interceptors
Around 14 drains discharge sewage in to Varuna river along its left and right banks. Interception and diversion of these drains has been considered under priority projects for immediate reduction of pollution load of Varuna river, which is a tributary of river Ganga. Summary of Varuna river Interceptors and Sathwa trunk sewer is given below.
Summary of Varuna River Interceptor
Sewer Length, meters
Sr. Diameter(mm)
Varuna river right bank
(u/s)
Varuna river right bank
(d/s)
Varuna river left bank
(u/s)
Varuna river left bank
(d/s)
Sathwa Trunk Sewer
1 500 180 2 700 2,070 300 3 800 570 4 900 270 390 5 1000 510 1,020 240 6 1100 690 510 7 1200 285 8 2400 3,870 Total 3,150 750 2,100 1,035 3,870
(8) Land Acquisition Land has to be acquired for proposed Sathwa Sewage Treatment Plant and pumping stations. The land area required for each proposed facility is shown below.
Land Acquisition for Proposed Facilities
Sr. Name of Facility Required Land (ha)
1 Sathwa Sewage Treatment Plant 41.00 2 Sathwa Main Pumping Station 0.23 3 Chaukaghat Right Bank Pumping Station 0.19 4 Chaukaghat Left Bank Pumping Station 0.08 5 Narokhar Nala Pumping Station 0.08 6 Phulwaria Nala Pumping Station 0.07 7 Saraiya Nala Pumping Station 0.04
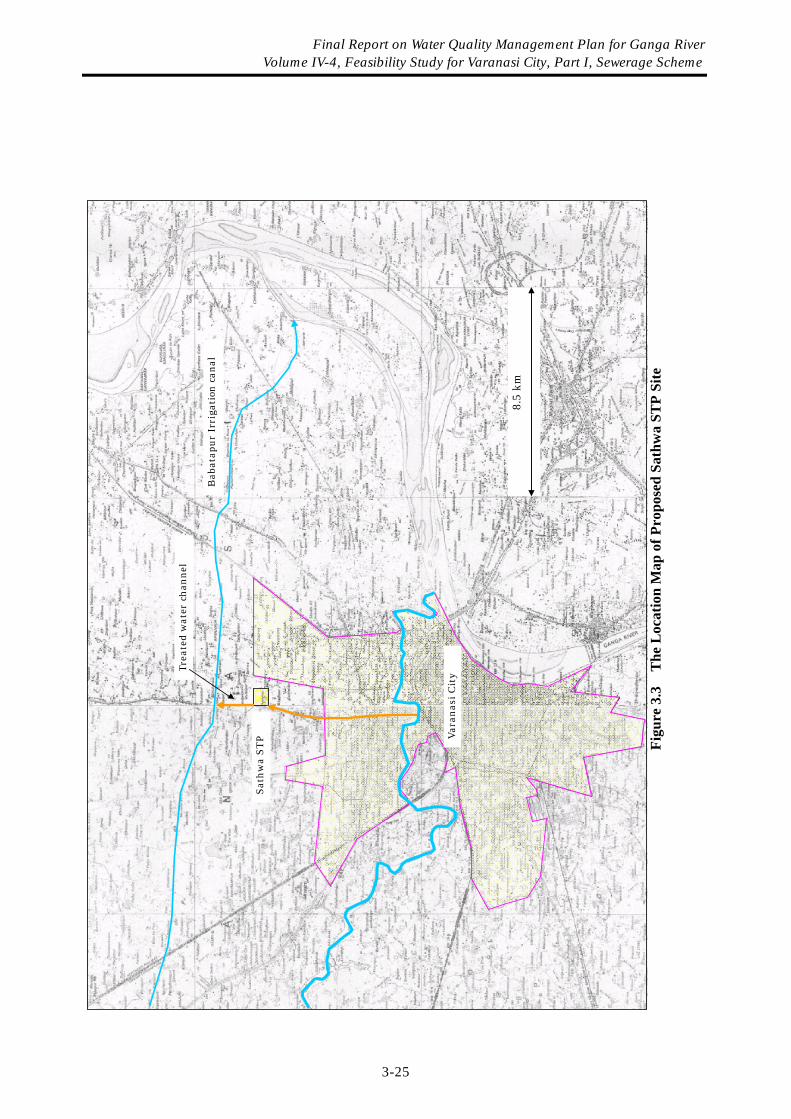
Figu
re 3
.3
The
Loc
atio
n M
ap o
f Pro
pose
d Sa
thw
a ST
P Si
te
8.5
km
Bab
atap
ur Ir
riga
tion
cana
l
Sath
wa
STP Va
rana
si C
ity Tr
eate
d w
ater
cha
nnel
Final Report on Water Quality Management Plan for Ganga River Volume IV-4, Feasibility Study for Varanasi City, Part I, Sewerage Scheme
3-25

Final Report on Water Quality Management Plan for Ganga RiverVolume IV-4, Feasibility Study for Varanasi City, Part I, Sewerage Scheme
3-26
3.4 BASELINE ENVIRONMENTAL SCENARIO 3.4.1 The Study Area The eternal and ancient city of Varanasi is a religious place on the bank of the Holiest river Ganga. It is a magnificent city with myriad attractions both as an exalted place of pilgrimage and micro center of faith. It is one of the most important places of pilgrimage for Hindus and Buddhists in the world. According to ‘Vaman Puran’, the Varuna and Assi rivers originated from the body of the primordial person at the beginning of time itself. The tract of the land lying between them is called Varanasi and believed to be the holiest of all pilgrimages. The Pali version of Varanasi is ‘Banarasi’ which ultimately gave birth to the name Banaras. The city is also famous as Kashi [derived from the root Kas which means to shine] the city of spiritual light. Steeped in tradition and mythological legacy, Kashi is believed to be the original ground created by Lord Shiva and Parvati, upon which they stood at the beginning of time. According to the historians, the city was founded some ten centuries before the birth of Christ. The city is mentioned in the Holy Scriptures like Vaman Puran, Buddhist Texts and in the epic ‘Mahabharat’. Puranic literature relates its existence to at least three millennia. Varanasi proudly tells that it was the birthplace of St. Kabir, worship place of Bhakta Ravidas and composing place of Mahakavya Sri Ramcharit Manas by Goswami Tulsidas. Varanasi is also renowned for its rich Tapestry of music, arts, crafts and education. Thousands of tourists visit the city daily from far and near places of India and all across the world. It is a unique city where the past and present, eternity and continuity live side by side. The city rises through the high northern bank on the outside curve of Ganga to form a magnificent panorama of buildings in many varieties of Indian architecture. The unique relationship between the city and sacred river is the essence of Varanasi – the land of Sacred Light. Varanasi is the microcosm of Hinduism, a city of traditional classical culture. Glorified by myth and legend and sanctified by religion, it has always attracted a large number of pilgrims and worshipped from time immemorial. Varanasi’s principal attractions for pilgrims and tourists are a long string of bathing Ghats along the Ganga river, including famous Dashashwamedh Ghat, Kashi Vishvanath Temple, Nepali Temple, Durga Temple, Sarnath, its silk brocade sarees and carpets, Ramnagar Fort, Chunar Fort, Banaras Hindu University, Kashi Vidya Peeth, etc. Besides a place of pilgrimage and tourists interests, Varanasi is a fast growing commercial, industrial and trading centre of Uttar Pradesh. It is also a centre of art, craft and education in the form of Banaras Hindu University. 3.4.2 Physical Environment (1) Climate and Meteorology
1) Month-wise Rainfall The following tables present monthly rainfall characteristics in Varanasi District. In general, the dry season is October to May and the rainy (monsoon) season is June to September. The average annual rainfall between 1996 and 2000 was around 1,000 mm. The monthly rainfall in August is largest during a year.

Final Report on Water Quality Management Plan for Ganga RiverVolume IV-4, Feasibility Study for Varanasi City, Part I, Sewerage Scheme
3-27
Table 3.9 Month-wise Rainfall in Varanasi District
Jun Jul Aug Sep Oct Nov Dec Jan Feb Mar Apr May Total96-97 237.7 100.3 314.7 77.9 18.6 0 0 4.4 0 0 15.7 0 769.397-98 65.7 292.3 257.7 204.6 20.6 37.6 47.1 0 6 6 0 27.4 965 98-99 116.4 423.8 531.3 138.3 34 1 0 7 0 0 0 22.2 127499-00 167.8 343.9 372.5 319.9 96.5 0 0.5 0 0.3 - - -
Average 146.9 290.08 369.05 185.18 42.425 9.65 15.7 2.975 1.5 1.575 5.2 16.5 1002.8Source: Indian Meteorological Department, Govt of India
Table 3.10 Month-wise Surface Rainfall of Varanasi (Bhuj) (Station Index 42483)
(During 1998)
Month Total Surface
Rainfall (mm)
No. of Observations
Heaviest in 24 hrs.
(mm) Date No. of Rainy
days
Jan 0.0 31 0 31 0 Feb 0.0 26 0 28 0 Mar 16.2 26 10 23 2 Apr 0.6 28 0.6 25 0 May 0.7 30 0.7 09 0 Jun 22.6 25 7.7 30 3 Jul 354.8 28 136.4 06 9
Aug 324.0 22 120.9 13 10 Sep 164.8 25 45.6 01 10 Oct 30.2 30 11.2 08 4 Nov 46.8 30 25.2 18 3 Dec 0.0 29 0 31 0
Source : Indian Meteorological Department, Govt. of India. 2) Temperature As shown in the following table, the hottest season is April to June and the coldest is December to February.
Table 3.11 Monthly Maximum and Minimum Temperature Observed During the Year 1991 in Varanasi District
Jan Feb Mar Apr May Jun Jul Aug Sep Oct Nov Dec
Max 28.8 32.1 39.5 43.0 44.0 42.8 35.6 35.3 35.5 35.5 32.2 27.5Min 2.6 7.2 9.0 15.0 19.8 22.4 21.5 20.4 20.0 13.4 7.8 4.8
(2) Surface Water Quality
1) Water Quality Monitoring Stations Ganga River The Ganga river, being the lifeline of the region, its quality and ecology has been attracting the attention of masses. As the main water body of the region, it receives pollution loads of domestic and industrial run off.

Final Report on Water Quality Management Plan for Ganga RiverVolume IV-4, Feasibility Study for Varanasi City, Part I, Sewerage Scheme
3-28
The main pollutant coming to the river Ganga is from Assi nala and the river Varuna. The contribution of the Bhagwanpur treated effluent to the pollution of river Ganga has also been monitored. In addition to these, pollution of river Ganga in Ghat area due to different human activities has also been studied. To assess the quality of water in the Ganga river, 7 monitoring stations (designated as GSW1, GSW2, GSW3, GSW4, GSW5, GSW6, and GSW7) along the stretch of river Ganga at Varanasi were selected. Station GSW1 was set up at 500 m upstream of the disposal point of Bhagwanpur STP. An intermediate station GSW2 was set up in between the disposal point of treated effluent of Bhagwanpur STP and the Assi nala outfall point. The station GSW3 was set up just after the Assi nala outfall point on the downstream. Three sampling stations namely GSW4, GSW5, and GSW6 were set up near Harischandra ghat, Dr. R.P. ghat, and Jalesan ghat respectively along the downstream stretch of river Ganga. The last monitoring station (GSW7) on the river Ganga was set up at 50 m downstream of the confluence point of Varuna and Ganga. Varuna River The other important river, which traverses the northern part of Varanasi, is the river Varuna. This river meets the Ganga at the downstream with a significant amount of pollution load. The old Orderly Bazaar Sewer discharges in to the river Varuna. A number of branch sewers, having been laid in the adjoining area from time to time discharge their pollutants to Varuna through storm water drains. A part of the sewage is bypassed from the main trunk sewer and directly discharged to the river Varuna. To assess the water quality of the Varuna, monitoring stations were set up at the upstream and at the downstream of the river. In the upstream, the monitoring station VSW1 was set up near Lohta area. In the downstream another monitoring station VSW2 was set up just before the confluence point of the river Ganga and Varuna. Assi Nala Assi nala discharges its pollutant near Assi Ghat. This nala contributes to the level of pollution in river Ganga in the upstream side. One monitoring station (ANWQ) before the outfall of Assi nala was established, and quality of the water of the nala at this location was studied. In total 10 surface water quality monitoring stations in the study area as described above, were selected for the purpose of monitoring, analysis and assessment of surface water quality. The location and brief description of the monitoring stations designated as GSW1, GSW2, GSW3, GSW4, GSW5, GSW6, GSW7, VSW1, VSW2 and ANWQ are listed in Table 3.12 and shown in Figure 3.4.
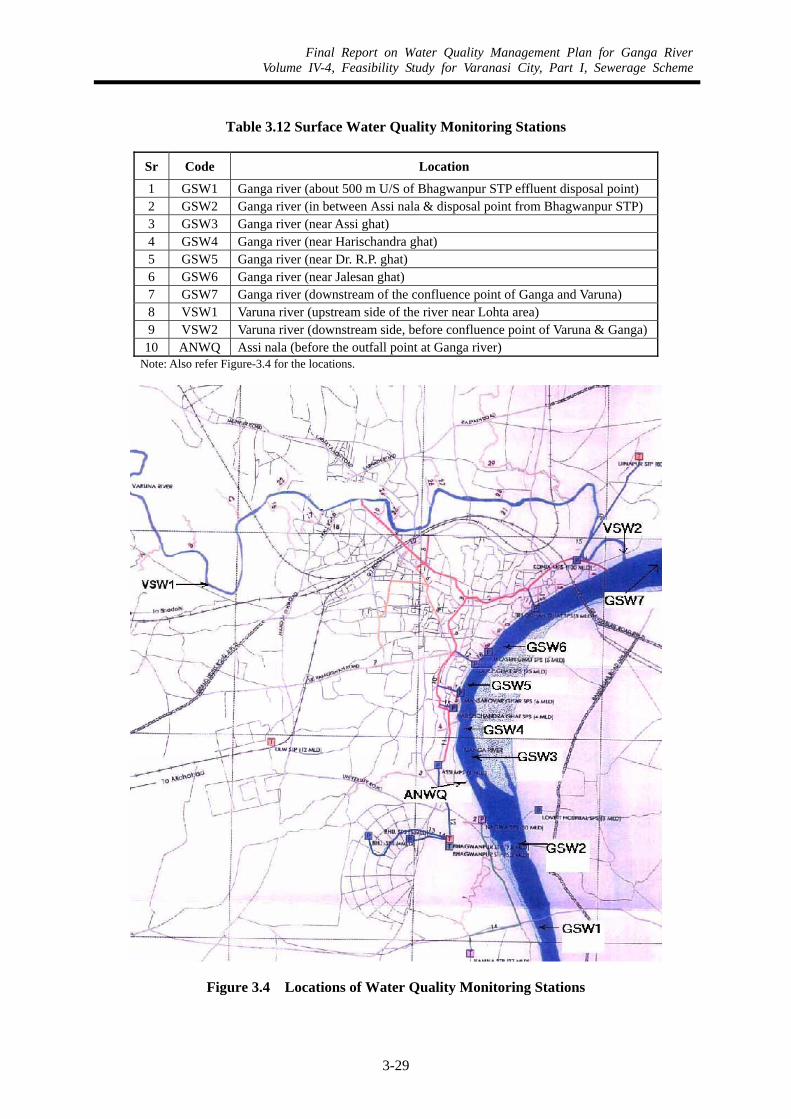
Final Report on Water Quality Management Plan for Ganga RiverVolume IV-4, Feasibility Study for Varanasi City, Part I, Sewerage Scheme
3-29
Table 3.12 Surface Water Quality Monitoring Stations
Sr Code Location
1 GSW1 Ganga river (about 500 m U/S of Bhagwanpur STP effluent disposal point) 2 GSW2 Ganga river (in between Assi nala & disposal point from Bhagwanpur STP) 3 GSW3 Ganga river (near Assi ghat) 4 GSW4 Ganga river (near Harischandra ghat) 5 GSW5 Ganga river (near Dr. R.P. ghat) 6 GSW6 Ganga river (near Jalesan ghat) 7 GSW7 Ganga river (downstream of the confluence point of Ganga and Varuna) 8 VSW1 Varuna river (upstream side of the river near Lohta area) 9 VSW2 Varuna river (downstream side, before confluence point of Varuna & Ganga)
10 ANWQ Assi nala (before the outfall point at Ganga river) Note: Also refer Figure-3.4 for the locations.
Figure 3.4 Locations of Water Quality Monitoring Stations
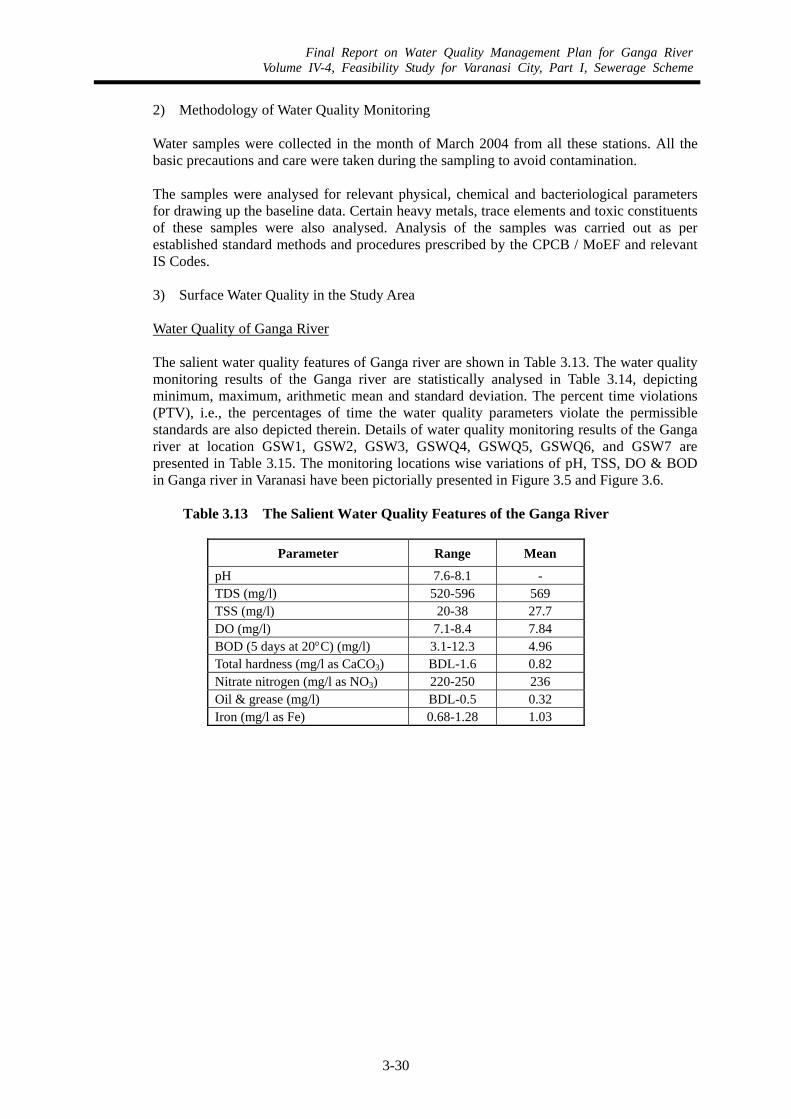
Final Report on Water Quality Management Plan for Ganga RiverVolume IV-4, Feasibility Study for Varanasi City, Part I, Sewerage Scheme
3-30
2) Methodology of Water Quality Monitoring Water samples were collected in the month of March 2004 from all these stations. All the basic precautions and care were taken during the sampling to avoid contamination. The samples were analysed for relevant physical, chemical and bacteriological parameters for drawing up the baseline data. Certain heavy metals, trace elements and toxic constituents of these samples were also analysed. Analysis of the samples was carried out as per established standard methods and procedures prescribed by the CPCB / MoEF and relevant IS Codes.
3) Surface Water Quality in the Study Area Water Quality of Ganga River The salient water quality features of Ganga river are shown in Table 3.13. The water quality monitoring results of the Ganga river are statistically analysed in Table 3.14, depicting minimum, maximum, arithmetic mean and standard deviation. The percent time violations (PTV), i.e., the percentages of time the water quality parameters violate the permissible standards are also depicted therein. Details of water quality monitoring results of the Ganga river at location GSW1, GSW2, GSW3, GSWQ4, GSWQ5, GSWQ6, and GSW7 are presented in Table 3.15. The monitoring locations wise variations of pH, TSS, DO & BOD in Ganga river in Varanasi have been pictorially presented in Figure 3.5 and Figure 3.6.
Table 3.13 The Salient Water Quality Features of the Ganga River
Parameter Range Mean
pH 7.6-8.1 - TDS (mg/l) 520-596 569 TSS (mg/l) 20-38 27.7 DO (mg/l) 7.1-8.4 7.84 BOD (5 days at 20°C) (mg/l) 3.1-12.3 4.96 Total hardness (mg/l as CaCO3) BDL-1.6 0.82 Nitrate nitrogen (mg/l as NO3) 220-250 236 Oil & grease (mg/l) BDL-0.5 0.32 Iron (mg/l as Fe) 0.68-1.28 1.03

Final Report on Water Quality Management Plan for Ganga RiverVolume IV-4, Feasibility Study for Varanasi City, Part I, Sewerage Scheme
3-31
Table 3.14 Surface Water Quality Statistics of Ganga River
(Based on On-site Water Quality Monitoring during March 04)
Sr Parameter and Unit N Min Max AM SD PTV Limit
1 Temperature (°C) 7 28.5 32 31 1.32 - - 2 Turbidity (NTU) 7 2 6 3.57 1.81 - - 3 pH 7 7.6 8.1 - - 0 8.5 4 Conductivity (µmhos/cm) 7 751 910 854 56.1 - - 5 DO (mg/l) 7 7.1 8.4 7.84 0.489 0 4 6 BOD (5 days at 20°C) (mg/l) 7 3.1 12.3 4.96 3.29 100 3 7 COD (mg/l) 7 8.3 28.4 12.6 7.13 - - 8 Faecal Coliforms (MPN/100 ml) 7 NIL 14 2 5 - - 9 Total Coliforms (MPN/100 ml) 7 7000 38060 21459 12328 100 5000
10 TSS (mg/l) 7 20 38 27.7 5.82 - - 11 TDS (mg/l) 7 520 596 569 28.3 0 150012 Oil and Grease (mg/l) 7 BDL 1.6 0.821 0.731 57 0.1 13 Total Residual Chlorine (mg/l) 7 BDL BDL BDL - - - 14 Ammonia Nitrogen (mg/l as N) 7 1.4 5.1 2.63 1.51 - - 15 Kjeldahl Nitrogen (mg/l as N) 7 5.2 10.4 7.37 1.8 - - 16 Cyanide (mg/l as CN) 7 BDL BDL BDL - 0 0.0517 Phenol (mg/l as C6H5OH) 7 BDL BDL BDL - 0 0.00518 Total Hardness (mg/l as CaCO3) 7 220 250 236 13.1 - - 19 Total Alkalinity (mg/l CaCO3) 7 230 280 256 17.2 - - 20 Chloride (mg/l as Cl) 7 70 80 75 5 0 600 21 Sulphate (mg/l as SO4) 7 30 45 37.6 4.79 0 400 22 Nitrate (mg/l as NO3) 7 BDL 0.5 0.319 0.142 0 50 23 Phosphate (mg/l as PO4) 7 BDL 0.4 0.256 0.126 - - 24 Fluoride (mg/l as F) 7 NIL NIL NIL NIL 0 1.5 25 Sodium (mg/l as Na) 7 65 68 66.4 1.4 - - 26 Potassium (mg/l as K) 7 13 16 13.7 1.11 - - 27 Calcium (mg/l as Ca) 7 64.1 76.1 70.7 4.1 - - 28 Magnesium (mg/l as Mg) 7 12.1 17 14.6 1.42 - - 29 Copper (mg/l as Cu) 7 BDL BDL BDL - 0 1.5 30 Iron (mg/l as Fe) 7 0.68 1.28 1.03 0.219 0 50 31 Manganese (mg/l as Mn) 7 BDL BDL BDL - - - 32 Zinc (mg/l as Zn) 7 0.25 0.65 0.447 0.155 0 15 33 Nickel (mg/l as Ni) 7 BDL BDL BDL - - - 34 Arsenic (mg/l as As) 7 BDL BDL BDL - 0 0.2 35 Mercury (mg/l as Hg) 7 BDL BDL BDL - - - 36 Lead (mg/l as Pb) 7 BDL BDL BDL - 0 0.1 37 Cadmium (mg/l as Cd) 7 BDL BDL BDL - 0 0.0138 Chromium (mg/l as Cr) 7 BDL 0.11 0.066 0.046 - - 39 Percent Sodium (%) 7 34.7 38.1 36.3 1.24 - -
N- No of measurements, AM- Arithmetic mean, SD- Standard deviation, BDL- Below detection limit PTV- Percent time violations over permissible limits* (maximum) stipulated for Inland Surface Waters (Class C) i.e. drinking water source with conventional treatment followed by disinfection (IS:2296).

Final Report on Water Quality Management Plan for Ganga RiverVolume IV-4, Feasibility Study for Varanasi City, Part I, Sewerage Scheme
3-32
Table 3.15 Results of On-site Surface Water Quality Monitoring of Ganga (During March 04)
Monitoring Stations
Sr. Parameter and Unit GSW1 GSW2 GSW3 GSW4 GSW5 GSW6 GSW7
1 Temperature (°C) 28.5 31.5 30 32 32 32 31 2 Odour Odls Odls Odls Odls Odls Odls Odls 3 Turbidity (NTU) 6 4 2 2 6 2 3 4 pH 7.8 7.6 7.7 7.8 8.1 7.96 8.1 5 Conductivity (µmhos/cm) 850 910 820 751 860 880 910 6 DO (mg/l) 8.3 8.4 7.3 7.8 8.1 7.9 7.1 7 BOD (5 days at 20°C) (mg/l) 3.1 3.3 4.8 4.3 3.4 3.5 12.3 8 COD (mg/l) 8.3 8.8 13 10.8 9.8 9.3 28.4 9 Faecal Coliforms (MPN/100 ml) NIL NIL NIL NIL 14 NIL NIL
10 Total Coliforms (MPN/100 ml) 21800 24200 9050 7000 14100 36000 3806011 TSS (mg/l) 32 38 28 24 26 20 26 12 TDS (mg/l) 570 596 548 520 596 560 590 13 Oil and Grease (mg/l) 1.4 1.6 1.4 1.2 BDL BDL BDL 14 Total Residual Chlorine (mg/l) BDL BDL BDL BDL BDL BDL BDL 15 Ammonia Nitrogen (mg/l as N) 4.5 5.1 2.1 1.8 1.4 1.6 1.9 16 Kjeldahl Nitrogen (mg/l as N) 9.2 10.4 7.2 6.4 5.2 6.4 6.8 17 Cyanide (mg/l as CN) BDL BDL BDL BDL BDL BDL BDL 18 Phenol (mg/l as C6H5OH) BDL BDL BDL BDL BDL BDL BDL 19 Total Hardness (mg/l as CaCO3) 240 250 230 220 250 220 245 20 Total Alkalinity (mg/l CaCO3) 260 270 250 240 280 230 260 21 Chloride (mg/l as Cl) 70 80 75 70 70 80 80 22 Sulphate (mg/l as SO4) 35 40 38 35 30 40 45 23 Nitrate (mg/l as NO3) 0.32 0.46 0.2 0.12 0.23 0.4 0.5 24 Phosphate (mg/l as PO4) 0.21 0.28 0.4 0.32 BDL 0.26 0.32 25 Fluoride (mg/l as F) BDL BDL BDL BDL BDL BDL BDL 26 Sodium (mg/l as Na) 65 68 67 65 65 67 68 27 Potassium (mg/l as K) 13 14 14 13 13 13 16 28 Calcium (mg/l as Ca) 72.1 76.1 68.1 64.1 72.1 68.1 74 29 Magnesium (mg/l as Mg) 14.6 14.5 14.5 14.6 17 12.1 14.6 30 Copper (mg/l as Cu) BDL BDL BDL BDL BDL BDL BDL 31 Iron (mg/l as Fe) 0.86 0.92 1.24 1.14 0.68 1.1 1.28 32 Manganese (mg/l as Mn) BDL BDL BDL BDL BDL BDL BDL 33 Zinc (mg/l as Zn) 0.46 0.65 0.3 0.25 0.35 0.5 0.62 34 Nickel (mg/l as Ni) BDL BDL BDL BDL BDL BDL BDL 35 Arsenic (mg/l as As) BDL BDL BDL BDL BDL BDL BDL 36 Mercury (mg/l as Hg) BDL BDL BDL BDL BDL BDL BDL 37 Lead (mg/l as Pb) BDL BDL BDL BDL BDL BDL BDL 38 Cadmium (mg/l as Cd) BDL BDL BDL BDL BDL BDL BDL 39 Chromium (mg/l as Cr) 0.095 0.09 BDL BDL 0.066 0.098 0.11 40 Percent Sodium (%) 35.5 35.6 37.1 37.4 34.7 38.1 35.8
The BOD value ranges from 3.1 to 12.3 mg/l with an arithmetic mean of 4.96 mg/l. At the upstream point (station GSW1) the BOD value (3.1 mg/l) was not so high due to low pollution load. At the sampling point GSW2, i.e., downstream point of the disposal of Bhagwanpur STP treated effluent, the BOD value (3.3 mg/l) did not increase too much. This implies that the quality of the effluent from the Bhagwanpur STP was not that much polluting, indicating the beneficial effect of sewage treatment plant to treat the sewage

Final Report on Water Quality Management Plan for Ganga RiverVolume IV-4, Feasibility Study for Varanasi City, Part I, Sewerage Scheme
3-33
before disposal. At the monitoring station GSW3 the BOD value was observed to increase to 4.8 mg/l. This is due to the high organic pollutant load of Assi nala. After that, at the downstream of this location, again BOD value was observed to decrease due to regeneration, and at monitoring station GSW4 near Harishchandra ghat it was 4.3 mg/l. Near the monitoring stations GSW5 and GSW6, no high pollution load was discharged to the Ganga. Therefore, the BOD values did not change significantly and limited to 3.5 mg/l. At the last monitoring station, i.e., in the downstream of Ganga and Varuna confluence point, the BOD value (12.3 mg/l) increased significantly. This was due to the high organic pollutant load coming with the Varuna river. The dissolved oxygen (DO) profile along the stretch also varied accordingly to the variation of BOD. Initially at the upstream (monitoring station GSW1), it was very high (8.3 mg/l). Gradually with the increase of BOD load, the organic pollutants consumed the DO for stabilization. At the monitoring point GSW7 in downstream, the DO value (7.1 mg/l) was observed to be very low due to the high organic pollutants coming from the river Varuna. Temperature of the river water varied between 28.5-32.0°C. pH values were generally above the neutral mark (7.6-8.1) and were within the tolerance limits of 6.5-8.5. Conductivity varied between 751-910 µmhos/cm (average 854 micromhos/cm) with TDS ranging between 520-596 mg/l (average 569 mg/l). TSS varied between 20-28 mg/l, while turbidity ranged between 2-6 mg/l. Low values of turbidity indicate very low sediment load in the surface run off into the river implying negligible soil erosion in the catchment area. Total coliform was found comparatively higher near the waste disposal points than at the other locations. At the monitoring station GSW7 it was 38060 MPN/100 ml due to the pollution load coming with Varuna river.
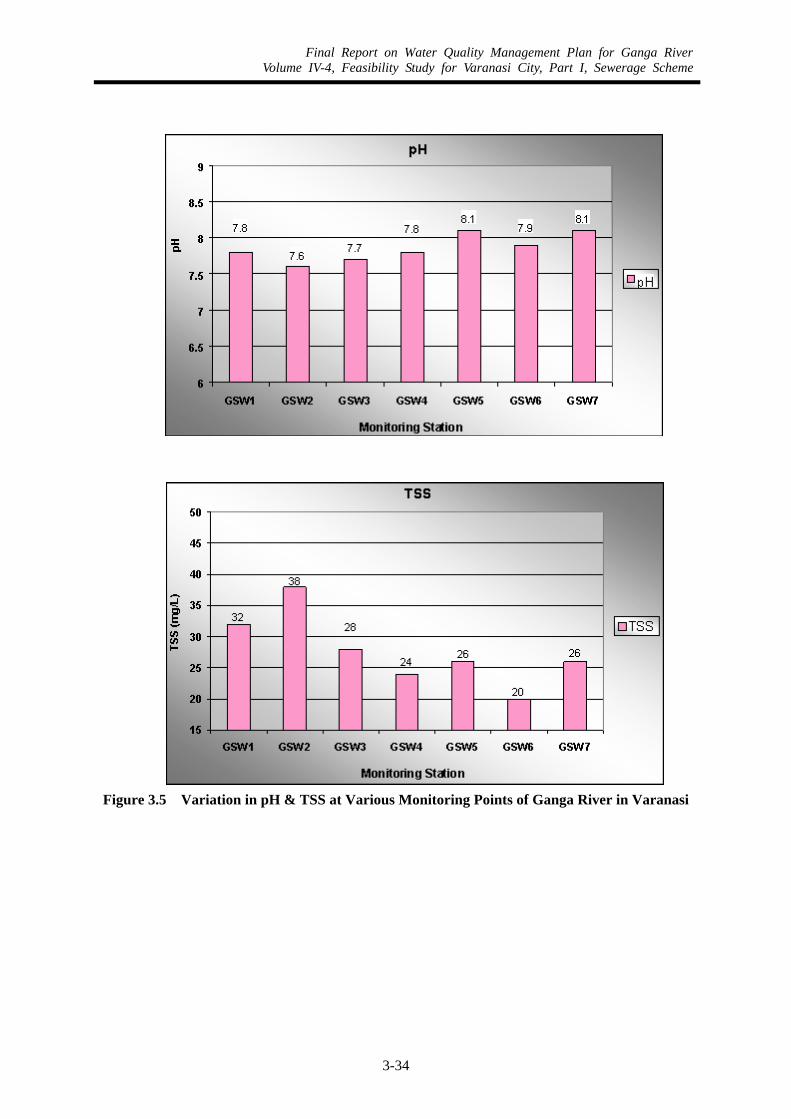
Final Report on Water Quality Management Plan for Ganga RiverVolume IV-4, Feasibility Study for Varanasi City, Part I, Sewerage Scheme
3-34
Figure 3.5 Variation in pH & TSS at Various Monitoring Points of Ganga River in Varanasi
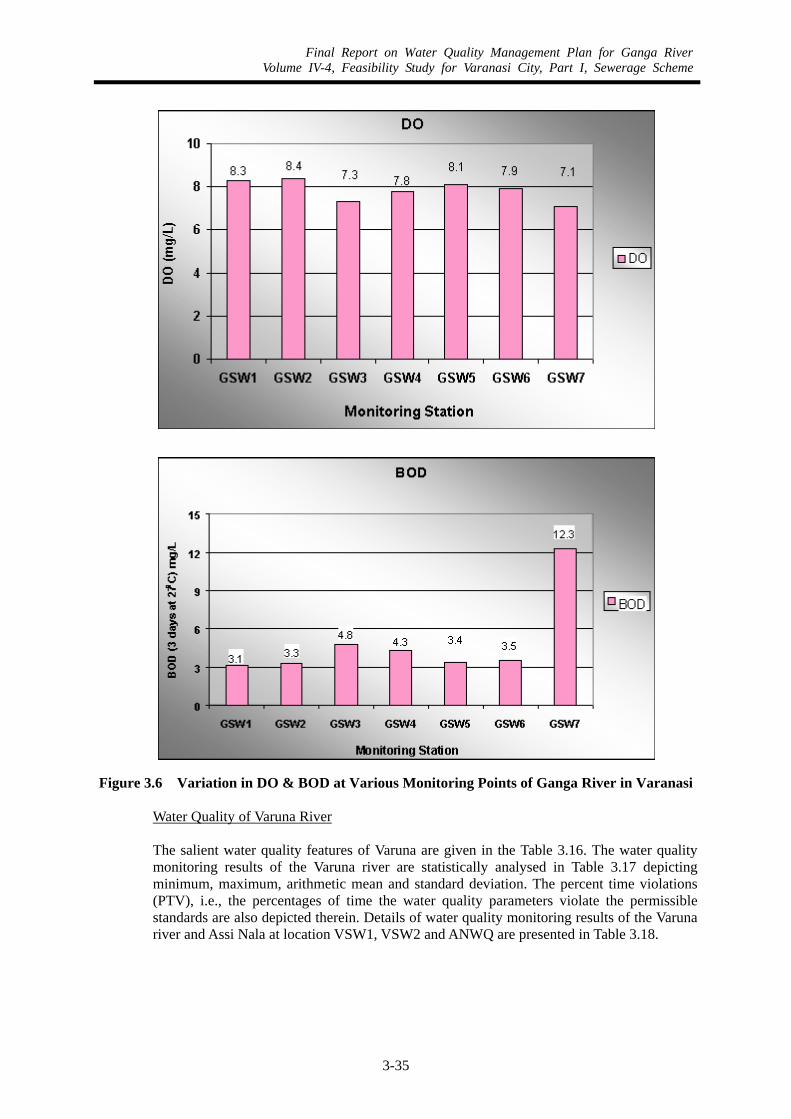
Final Report on Water Quality Management Plan for Ganga RiverVolume IV-4, Feasibility Study for Varanasi City, Part I, Sewerage Scheme
3-35
Figure 3.6 Variation in DO & BOD at Various Monitoring Points of Ganga River in Varanasi
Water Quality of Varuna River The salient water quality features of Varuna are given in the Table 3.16. The water quality monitoring results of the Varuna river are statistically analysed in Table 3.17 depicting minimum, maximum, arithmetic mean and standard deviation. The percent time violations (PTV), i.e., the percentages of time the water quality parameters violate the permissible standards are also depicted therein. Details of water quality monitoring results of the Varuna river and Assi Nala at location VSW1, VSW2 and ANWQ are presented in Table 3.18.
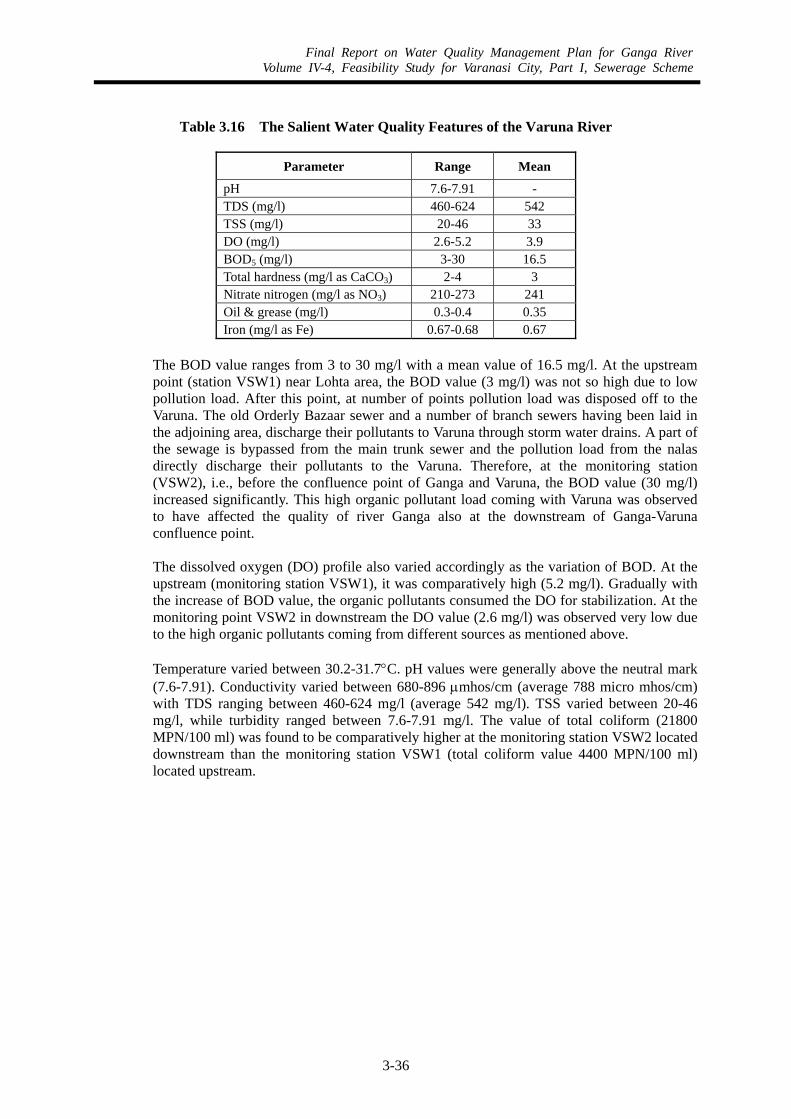
Final Report on Water Quality Management Plan for Ganga RiverVolume IV-4, Feasibility Study for Varanasi City, Part I, Sewerage Scheme
3-36
Table 3.16 The Salient Water Quality Features of the Varuna River
Parameter Range Mean
pH 7.6-7.91 - TDS (mg/l) 460-624 542 TSS (mg/l) 20-46 33 DO (mg/l) 2.6-5.2 3.9 BOD5 (mg/l) 3-30 16.5 Total hardness (mg/l as CaCO3) 2-4 3 Nitrate nitrogen (mg/l as NO3) 210-273 241 Oil & grease (mg/l) 0.3-0.4 0.35 Iron (mg/l as Fe) 0.67-0.68 0.67
The BOD value ranges from 3 to 30 mg/l with a mean value of 16.5 mg/l. At the upstream point (station VSW1) near Lohta area, the BOD value (3 mg/l) was not so high due to low pollution load. After this point, at number of points pollution load was disposed off to the Varuna. The old Orderly Bazaar sewer and a number of branch sewers having been laid in the adjoining area, discharge their pollutants to Varuna through storm water drains. A part of the sewage is bypassed from the main trunk sewer and the pollution load from the nalas directly discharge their pollutants to the Varuna. Therefore, at the monitoring station (VSW2), i.e., before the confluence point of Ganga and Varuna, the BOD value (30 mg/l) increased significantly. This high organic pollutant load coming with Varuna was observed to have affected the quality of river Ganga also at the downstream of Ganga-Varuna confluence point. The dissolved oxygen (DO) profile also varied accordingly as the variation of BOD. At the upstream (monitoring station VSW1), it was comparatively high (5.2 mg/l). Gradually with the increase of BOD value, the organic pollutants consumed the DO for stabilization. At the monitoring point VSW2 in downstream the DO value (2.6 mg/l) was observed very low due to the high organic pollutants coming from different sources as mentioned above. Temperature varied between 30.2-31.7°C. pH values were generally above the neutral mark (7.6-7.91). Conductivity varied between 680-896 µmhos/cm (average 788 micro mhos/cm) with TDS ranging between 460-624 mg/l (average 542 mg/l). TSS varied between 20-46 mg/l, while turbidity ranged between 7.6-7.91 mg/l. The value of total coliform (21800 MPN/100 ml) was found to be comparatively higher at the monitoring station VSW2 located downstream than the monitoring station VSW1 (total coliform value 4400 MPN/100 ml) located upstream.

Final Report on Water Quality Management Plan for Ganga RiverVolume IV-4, Feasibility Study for Varanasi City, Part I, Sewerage Scheme
3-37
Table 3.17 Surface Water Quality Statistics of Varuna River (Based on On-site Water Quality Monitoring during March 04)
Sr. Parameter and Unit N Min Max AM SD PTV Limit
1 Temperature (°C) 2 30.2 31.7 31 1.06 - - 2 Turbidity (NTU) 2 6 8 7 1.41 - - 3 pH 2 7.6 7.91 - - 0 8.5 4 Conductivity (µmhos/cm) 2 680 896 788 153 - - 5 DO (mg/l) 2 2.6 5.2 3.9 1.84 50 4 6 BOD (3 days at 27°C) (mg/l) 2 3 30 16.5 13.5 100 3 7 COD (mg/l) 2 24.2 72.4 48.3 34.1 - - 8 Faecal Coliforms (MPN/100 ml) 2 NIL NIL NIL NIL - - 9 Total Coliforms (MPN/100 ml) 2 4400 21800 13100 12304 50 5,000
10 TSS (mg/l) 2 20 46 33 18.4 - - 11 TDS (mg/l) 2 460 624 542 116 0 1,50012 Oil and Grease (mg/l) 2 2 4 3 1.41 100 0.1 13 Total Residual Chlorine (mg/l) 2 BDL BDL BDL - - - 14 Ammonia Nitrogen (mg/l as N) 2 2.6 3.2 2.9 0.424 - - 15 Kjeldahl Nitrogen (mg/l as N) 2 7.4 8.1 7.75 0.495 - - 16 Cyanide (mg/l as CN) 2 BDL BDL BDL - 0 0.05 17 Phenol (mg/l as C6H5OH) 2 BDL BDL BDL - 0 0.00518 Total Hardness (mg/l as CaCO3) 2 210 273 241 44.3 - - 19 Total Alkalinity (mg/l CaCO3) 2 225 290 258 46 - - 20 Chloride (mg/l as Cl) 2 52 70 61 12.7 0 600 21 Sulphate (mg/l as SO4) 2 26 40 33 9.9 0 400 22 Nitrate (mg/l as NO3) 2 0.3 0.4 0.35 0.071 0 50 23 Phosphate (mg/l as PO4) 2 0.25 0.32 0.285 0.049 - - 24 Fluoride (mg/l as F) 2 NIL NIL NIL NIL 0 1.5 25 Sodium (mg/l as Na) 2 46 65 55.5 13.4 - - 26 Potassium (mg/l as K) 2 9 13 11 2.83 - - 27 Calcium (mg/l as Ca) 2 64.1 80.2 72.1 11.4 - - 28 Magnesium (mg/l as Mg) 2 12.1 17.6 14.9 3.89 - - 29 Copper (mg/l as Cu) 2 BDL BDL BDL - 0 1.5 30 Iron (mg/l as Fe) 2 0.67 0.68 0.675 0.007 0 50 31 Manganese (mg/l as Mn) 2 BDL BDL BDL - - - 32 Zinc (mg/l as Zn) 2 BDL 0.7 0.35 0.494 0 15 33 Nickel (mg/l as Ni) 2 BDL BDL BDL - - - 34 Arsenic (mg/l as As) 2 BDL BDL BDL - 0 0.2 35 Mercury (mg/l as Hg) 2 BDL BDL BDL - - - 36 Lead (mg/l as Pb) 2 BDL BDL BDL - 0 0.1 37 Cadmium (mg/l as Cd) 2 BDL BDL BDL - 0 0.01 38 Chromium (mg/l as Cr) 2 BDL 0.106 0.054 0.074 - - 39 Percent Sodium (%) 2 31.1 32.8 32 1.2 - -

Final Report on Water Quality Management Plan for Ganga RiverVolume IV-4, Feasibility Study for Varanasi City, Part I, Sewerage Scheme
3-38
Table 3.18 Results of On-site Surface Water Quality Monitoring of Varuna River and Assi Nala During March 04
Monitoring Stations
Sr. Parameters and Unit VSW1 VSW2 ANWQ
1 Temperature (°C) 30.2 31.7 29 2 Odour Unob Odls Odrs 3 Turbidity (NTU) 8 6 24 4 pH 7.6 7.91 7.26 5 Conductivity (µmhos/cm) 680 896 1180 6 DO (mg/l) 5.2 2.6 2.3 7 BOD (3 days at 27°C) (mg/l) 3 30 34 8 COD (mg/l) 24.2 72.4 150 9 Faecal Coliforms (MPN/100 ml) NIL NIL 50
10 Total Coliforms (MPN/100 ml) 4400 21800 1111 11 TSS (mg/l) 46 20 140 12 TDS (mg/l) 460 624 720 13 Oil and Grease (mg/l) 4 2 5.4 14 Total Residual Chlorine (mg/l) BDL BDL BDL 15 Ammonia Nitrogen (mg/l as N) 2.6 3.2 10.2 16 Kjeldahl Nitrogen (mg/l as N) 7.4 8.1 22.4 17 Cyanide (mg/l as CN) BDL BDL BDL 18 Phenol (mg/l as C6H5OH) BDL BDL BDL 19 Total Hardness (mg/l as CaCO3) 210 273 330 20 Total Alkalinity (mg/l CaCO3) 225 290 330 21 Chloride (mg/l as Cl) 52 70 105 22 Sulphate (mg/l as SO4) 26 40 45 23 Nitrate (mg/l as NO3) 0.4 0.3 2.6 24 Phosphate (mg/l as PO4) 0.25 0.32 1.1 25 Fluoride (mg/l as F) BDL BDL BDL 26 Sodium (mg/l as Na) 46 65 77 27 Potassium (mg/l as K) 9 13 26 28 Calcium (mg/l as Ca) 64.1 80.2 84.2 29 Magnesium (mg/l as Mg) 12.1 17.6 29.2 30 Copper (mg/l as Cu) BDL BDL BDL 31 Iron (mg/l as Fe) 0.67 0.68 0.9 32 Manganese (mg/l as Mn) BDL BDL BDL 33 Zinc (mg/l as Zn) 0.7 BDL BDL 34 Nickel (mg/l as Ni) BDL BDL BDL 35 Arsenic (mg/l as As) BDL BDL BDL 36 Mercury (mg/l as Hg) BDL BDL BDL 37 Lead (mg/l as Pb) BDL BDL BDL 38 Cadmium (mg/l as Cd) BDL BDL BDL 39 Chromium (mg/l as Cr) 0.106 BDL BDL 40 Percent Sodium (%) 31.1 32.8 31.5
Water Quality of Assi nala The water quality monitoring results of the Assi nala are shown in Table 3.18. The BOD value (34 mg/l) at the monitoring station ANWQ, before outfall point at river Ganga was observed very high. This indicated the amount of organic pollutants, discharged daily to the

Final Report on Water Quality Management Plan for Ganga RiverVolume IV-4, Feasibility Study for Varanasi City, Part I, Sewerage Scheme
3-39
river Ganga through this nala. The dissolved oxygen (DO) at the monitoring station ANWQ was found to be very low (2.3 mg/l). This was obviously due to the high BOD concentration in the nala, which reduced the DO level because of its stabilization. Temperature was recorded as 29°C. pH value (7.26) was near the neutral mark with conductivity 1180 µmhos/cm and TDS and TSS values 720 and 140 mg/l, respectively. Total coliform value was found as 1111 MPN/100 ml and faecal coliform was 50 MPN/100 ml.
(3) Ground Water Quality in the Study Area The ground water quality of the proposed and sanctioned STP sites and their adjoining areas were analyzed for different physical, chemical, and bacteriological parameters, such as – turbidity, temperature, pH, coliforms, BOD, alkalinity, ions, heavy metals, etc. The details of the analysis results are given in the succeeding paragraphs.
1) Ground Water Quality at the Proposed STP Site at Sathwa and its Adjoining Area The Ground water quality at the proposed Sathwa site and its adjoining area are given in the Table 3.19.
Table 3.19 Ground Water Qualities at Proposed Sathwa STP Site & its Adjoining Area
Sr. Parameters and Unit GW1 GW2 GW3 GW4
1 Temperature (oC) 29.2 29 29.8 28.6 2 Odour Odls Odls Odls Odls 3 Taste Nrml Nrml Nrml Nrml 4 Turbidity (NTU) 4 2 4 2 5 pH 7.66 7.35 7.09 7.94 6 Conductivity (µmhos/cm) 1616 2126 1217 1240 7 Total Coliforms (MPN/100 ml) NIL NIL NIL NIL 8 TSS (mg/l) 12 NIL 10 10 9 TDS (mg/l) 1052 1320 844 832 10 Oil and Grease (mg/l) BDL BDL BDL BDL 11 Total Residual Chlorine (mg/l) BDL BDL BDL BDL 12 Free Ammonia (mg/l as NH3) BDL BDL BDL BDL 13 Cyanide (mg/l as CN) BDL BDL BDL BDL 14 Phenol (mg/l as C6H5OH) BDL BDL BDL BDL 15 Total Hardness (mg/l as CaCO3) 519 810 410 430 16 Total Alkalinity (mg/l CaCO3) 530 570 380 375 17 Chloride (mg/l as Cl) 110 185 110 105 18 Sulphate (mg/l as SO4) 75 145 0 50 19 Nitrate (mg/l as NO3) 1.4 1.1 NIL 0.56 20 Phosphate (mg/l as PO4) 0.5 0.76 0.5 1 21 Fluoride (mg/l as F) 1 1.3 0.6 0.75 22 Sodium (mg/l as Na) 106 74 79 65 23 Potassium (mg/l as K) 14 10 6.5 6 24 Calcium (mg/l as Ca) 128 224 112 120 25 Magnesium (mg/l as Mg) 48.5 60.5 31.5 31.5 26 Copper (mg/l as Cu) BDL BDL BDL BDL
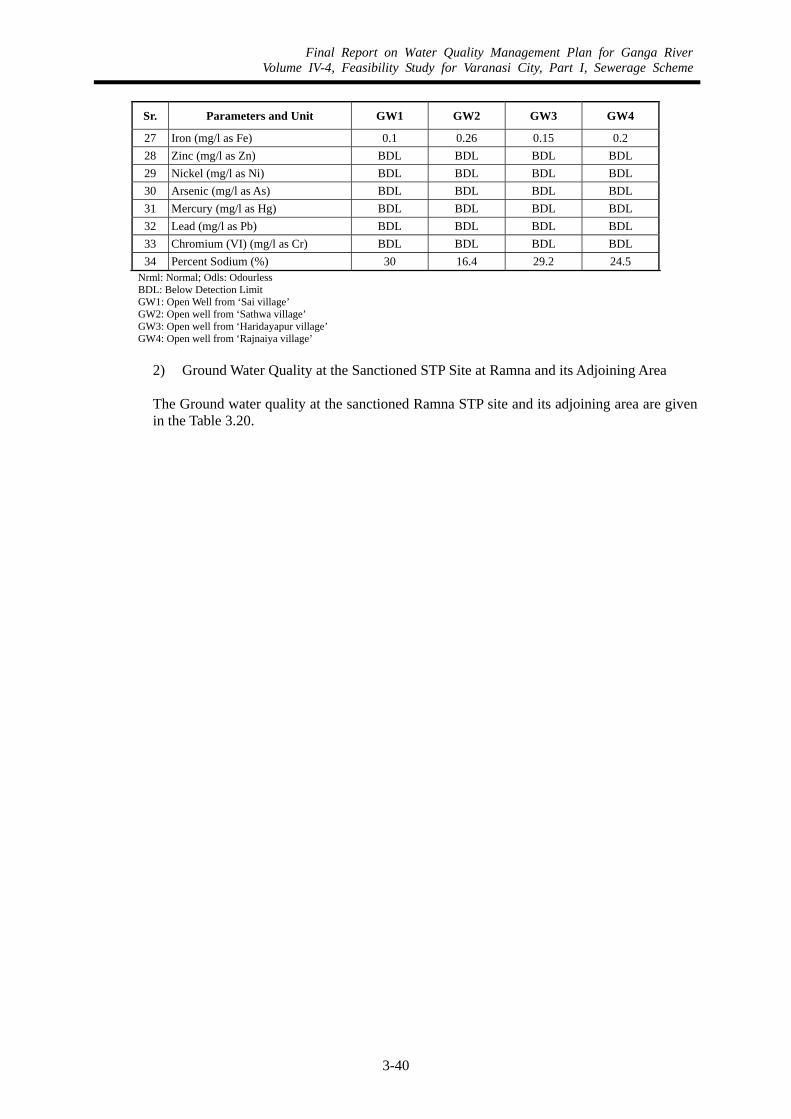
Final Report on Water Quality Management Plan for Ganga RiverVolume IV-4, Feasibility Study for Varanasi City, Part I, Sewerage Scheme
3-40
Sr. Parameters and Unit GW1 GW2 GW3 GW4
27 Iron (mg/l as Fe) 0.1 0.26 0.15 0.2 28 Zinc (mg/l as Zn) BDL BDL BDL BDL 29 Nickel (mg/l as Ni) BDL BDL BDL BDL 30 Arsenic (mg/l as As) BDL BDL BDL BDL 31 Mercury (mg/l as Hg) BDL BDL BDL BDL 32 Lead (mg/l as Pb) BDL BDL BDL BDL 33 Chromium (VI) (mg/l as Cr) BDL BDL BDL BDL 34 Percent Sodium (%) 30 16.4 29.2 24.5
Nrml: Normal; Odls: Odourless BDL: Below Detection Limit GW1: Open Well from ‘Sai village’ GW2: Open well from ‘Sathwa village’ GW3: Open well from ‘Haridayapur village’ GW4: Open well from ‘Rajnaiya village’
2) Ground Water Quality at the Sanctioned STP Site at Ramna and its Adjoining Area The Ground water quality at the sanctioned Ramna STP site and its adjoining area are given in the Table 3.20.

Final Report on Water Quality Management Plan for Ganga RiverVolume IV-4, Feasibility Study for Varanasi City, Part I, Sewerage Scheme
3-41
Table 3.20 Ground Water Quality at Sanctioned Ramna STP Site and its Adjoining Area
Sr. Parameters and Unit GW5 GW6 GW7 GW8
1 Temperature (oC) 28.5 28 29.1 28.4 2 Odour Odls Odls Odls Odls 3 Taste Nrml Nrml Nrml Nrml 4 Turbidity (NTU) 4 2 6 4 5 pH 7.15 7.34 7.3 7.46 6 Conductivity (µmhos/cm) 1190 1780 1440 1320 7 Total Coliforms (MPN/100 ml) NIL NIL NIL NIL 8 TSS (mg/l) 12 NIL 18 NIL 9 TDS (mg/l) 790 1190 920 860
10 Oil and Grease (mg/l) BDL BDL BDL BDL 11 Total Residual Chlorine (mg/l) BDL BDL BDL BDL 12 Free Ammonia (mg/l as NH3) BDL BDL BDL BDL 13 Cyanide (mg/l as CN) BDL BDL BDL BDL 14 Phenol (mg/l as C6H5OH) BDL BDL BDL BDL 15 Total Hardness (mg/l as CaCO3) 480 660 560 450 16 Total Alkalinity (mg/l CaCO3) 375 510 410 370 17 Chloride (mg/l as Cl) 105 185 145 140 18 Sulphate (mg/l as SO4) 30 80 65 56 19 Nitrate (mg/l as NO3) NIL 1.6 1.2 0.85 20 Phosphate (mg/l as PO4) 0.4 0.8 1.15 0.6 21 Fluoride (mg/l as F) 1.3 1.8 1.1 1.5 22 Sodium (mg/l as Na) 29 87 51 76 23 Potassium (mg/l as K) 10 8.5 6.5 9.4 24 Calcium (mg/l as Ca) 120 168 136 112 25 Magnesium (mg/l as Mg) 43.6 58.1 53.3 41.2 26 Copper (mg/l as Cu) BDL BDL BDL BDL 27 Iron (mg/l as Fe) 0.2 0.25 0.15 0.22 28 Zinc (mg/l as Zn) BDL BDL BDL BDL 29 Nickel (mg/l as Ni) BDL BDL BDL BDL 30 Arsenic (mg/l as As) BDL BDL BDL BDL 31 Mercury (mg/l as Hg) BDL BDL BDL BDL 32 Lead (mg/l as Pb) BDL BDL BDL BDL 33 Chromium (VI) (mg/l as Cr) BDL BDL BDL BDL 34 Percent Sodium (%) 11.4 22 16.3 26.4
Nrml: Normal; Odls: Odourless BDL: Below Detection Limit GW5: Open Well from near Ramna STP Site GW6: Open well from Narotampur GW7: Open well from Naipurakalan GW8: Open well from Sir goverdhan
(4) Wastewater Quality
1) Wastewater Sampling Location Dinapur STP Dinapur STP is under direct control of UP Jal Nigam for operation and maintenance purposes. The design capacity of the plant is 80 mld. The work on this plant was initiated during February 1988 and it was fully commissioned in June 1994. The wastewater was collected from this treatment plant and was analysed for different parameters. The influent
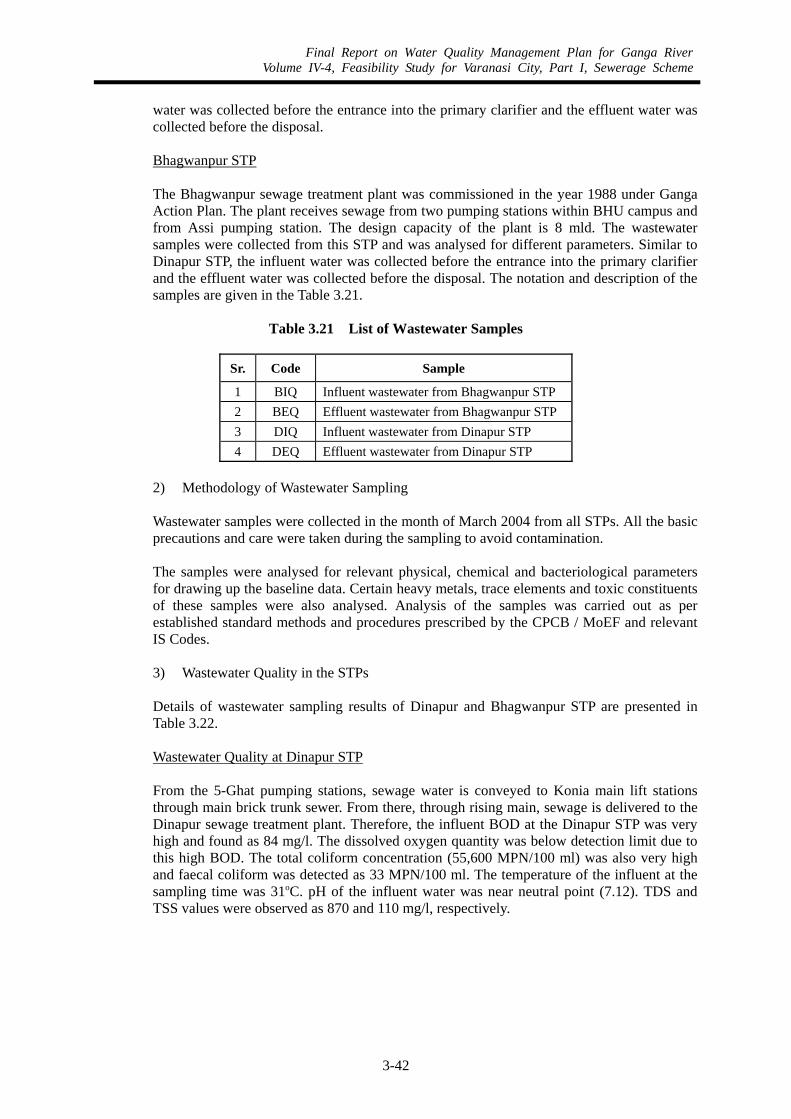
Final Report on Water Quality Management Plan for Ganga RiverVolume IV-4, Feasibility Study for Varanasi City, Part I, Sewerage Scheme
3-42
water was collected before the entrance into the primary clarifier and the effluent water was collected before the disposal. Bhagwanpur STP The Bhagwanpur sewage treatment plant was commissioned in the year 1988 under Ganga Action Plan. The plant receives sewage from two pumping stations within BHU campus and from Assi pumping station. The design capacity of the plant is 8 mld. The wastewater samples were collected from this STP and was analysed for different parameters. Similar to Dinapur STP, the influent water was collected before the entrance into the primary clarifier and the effluent water was collected before the disposal. The notation and description of the samples are given in the Table 3.21.
Table 3.21 List of Wastewater Samples
Sr. Code Sample
1 BIQ Influent wastewater from Bhagwanpur STP 2 BEQ Effluent wastewater from Bhagwanpur STP 3 DIQ Influent wastewater from Dinapur STP 4 DEQ Effluent wastewater from Dinapur STP
2) Methodology of Wastewater Sampling Wastewater samples were collected in the month of March 2004 from all STPs. All the basic precautions and care were taken during the sampling to avoid contamination. The samples were analysed for relevant physical, chemical and bacteriological parameters for drawing up the baseline data. Certain heavy metals, trace elements and toxic constituents of these samples were also analysed. Analysis of the samples was carried out as per established standard methods and procedures prescribed by the CPCB / MoEF and relevant IS Codes. 3) Wastewater Quality in the STPs Details of wastewater sampling results of Dinapur and Bhagwanpur STP are presented in Table 3.22. Wastewater Quality at Dinapur STP From the 5-Ghat pumping stations, sewage water is conveyed to Konia main lift stations through main brick trunk sewer. From there, through rising main, sewage is delivered to the Dinapur sewage treatment plant. Therefore, the influent BOD at the Dinapur STP was very high and found as 84 mg/l. The dissolved oxygen quantity was below detection limit due to this high BOD. The total coliform concentration (55,600 MPN/100 ml) was also very high and faecal coliform was detected as 33 MPN/100 ml. The temperature of the influent at the sampling time was 31oC. pH of the influent water was near neutral point (7.12). TDS and TSS values were observed as 870 and 110 mg/l, respectively.

Final Report on Water Quality Management Plan for Ganga RiverVolume IV-4, Feasibility Study for Varanasi City, Part I, Sewerage Scheme
3-43
Table 3.22 Wastewater Sampling Results of Dinapur and Bhagwanpur STP
Sample Description Sr. Parameter and Unit
BIQ BEQ DIQ DEQ 1 Temperature (°C) 30 30.5 31 31.5 2 Odour Odrs Odls Odrs Odls 3 Turbidity (NTU) 8 2 12 4 4 pH 7.14 7.19 7.12 7.22 5 Conductivity (µmhos/cm) 1040 1080 1340 1310 6 DO (mg/l) BDL 4.6 BDL 5.8 7 BOD (5 days at 20°C) (mg/l) 32 14.6 84 28 8 COD (mg/l) 74.1 33.3 187 72.1 9 Faecal Coliforms (MPN/100 ml) 30 NIL 33 NIL 10 Total Coliforms (MPN/100 ml) 51500 11180 55600 20000 11 TSS (mg/l) 66 44 110 40 12 TDS (mg/l) 710 770 870 830 13 Oil and Grease (mg/l) 5 2 6.4 1.5 14 Total Residual Chlorine (mg/l) BDL BDL BDL BDL 15 Ammonia Nitrogen (mg/l as N) 64.1 6.4 89 8.2 16 Kjeldahl Nitrogen (mg/l as N) 72.1 12.6 94.5 16.4 17 Cyanide (mg/l as CN) BDL BDL BDL BDL 18 Phenol (mg/l as C6H5OH) BDL BDL BDL BDL 19 Total Hardness (mg/l as CaCO3) 330 360 380 340 20 Total Alkalinity (mg/l CaCO3) 360 380 330 310 21 Chloride (mg/l as Cl) 50 65 140 130 22 Sulphate (mg/l as SO4) 40 42 80 70 23 Nitrate (mg/l as NO3) 3 0.34 1.06 0.92 24 Phosphate (mg/l as PO4) 2.35 2.1 1.35 0.43 25 Fluoride (mg/l as F) 1.02 BDL 0.9 BDL 26 Sodium (mg/l as Na) 57 60 85 85
Sample Description
Sr. Parameter and Unit BIQ BEQ DIQ DEQ
27 Potassium (mg/l as K) 14 17.4 36 35 28 Calcium (mg/l as Ca) 88.2 96.2 100 92.2 29 Magnesium (mg/l as Mg) 26.7 29.2 31.6 26.7 30 Copper (mg/l as Cu) BDL BDL BDL BDL 31 Iron (mg/l as Fe) 0.56 0.92 0.64 0.78 32 Manganese (mg/l as Mn) BDL BDL BDL BDL 33 Zinc (mg/l as Zn) BDL BDL BDL BDL 34 Nickel (mg/l as Ni) BDL BDL BDL BDL 35 Arsenic (mg/l as As) BDL BDL BDL BDL 36 Mercury (mg/l as Hg) BDL BDL BDL BDL 37 Lead (mg/l as Pb) BDL BDL BDL BDL 38 Cadmium (mg/l as Cd) BDL BDL BDL BDL 39 Chromium (mg/l as Cr) BDL BDL BDL BDL 40 Percent Sodium (%) 26.3 25.4 30.3 32.5
The effluent water quality at Dinapur STP was satisfactory. The BOD value was observed as only 28 mg/l, which was quite below the influent quality. The DO level (5.8 mg/l) of effluent was much higher than the influent value. The total coliform was found to have decreased to

Final Report on Water Quality Management Plan for Ganga RiverVolume IV-4, Feasibility Study for Varanasi City, Part I, Sewerage Scheme
3-44
20,000 MPN/100 ml. The TDS (830 mg/l)) and TSS (40 mg/l) values were also lower than in the influent wastewater. Wastewater Quality at Bhagwanpur STP The effluent from Assi MPS is delivered to the Bhagwanpur sewage treatment plant. The influent BOD level at the Bhagwanpur STP was comparatively high and found as 32 mg/l. The dissolved oxygen quantity was below detection limit due to this high BOD. The total coliform concentration (51500 MPN/100 ml) was also very high and faecal coliform was detected as 30 MPN/100 ml. The temperature of the influent at the sampling time was 30oC. pH of the influent water was near neutral point (7.14). TDS and TSS values were observed as 770 and 44 mg/l, respectively. The effluent water quality at Bhagwanpur STP was observed to be satisfactory. The BOD value was observed as only 14.6 mg/l, which was quite below than that in the influent. It proved the efficiency and beneficial effect of the treatment plant. The DO level (4.6 mg/l) of effluent was much higher than the influent value. The total coliform also decreased to 11800 MPN/100 ml. The TDS (770 mg/l)) and TSS (44 mg/l) values also decreased as compared to the influent wastewater.
(5) Sludge Quality
1) Sludge Sampling Location Dinapur STP The sludge was collected from the sludge digester of Dinapur sewage treatment plant and was analysed for phosphate, calorific value, water content, and different heavy metals. Bhagwanpur STP Similar to Dinapur STP, sludge sample was also collected from the sludge digester of Bhagwanpur sewage treatment plant. This sludge was also analysed for above-mentioned parameters. 2) Quality of Sludge Quality of the sludge was analysed with proper precautions and the results are tabulated in the Table 3.23.
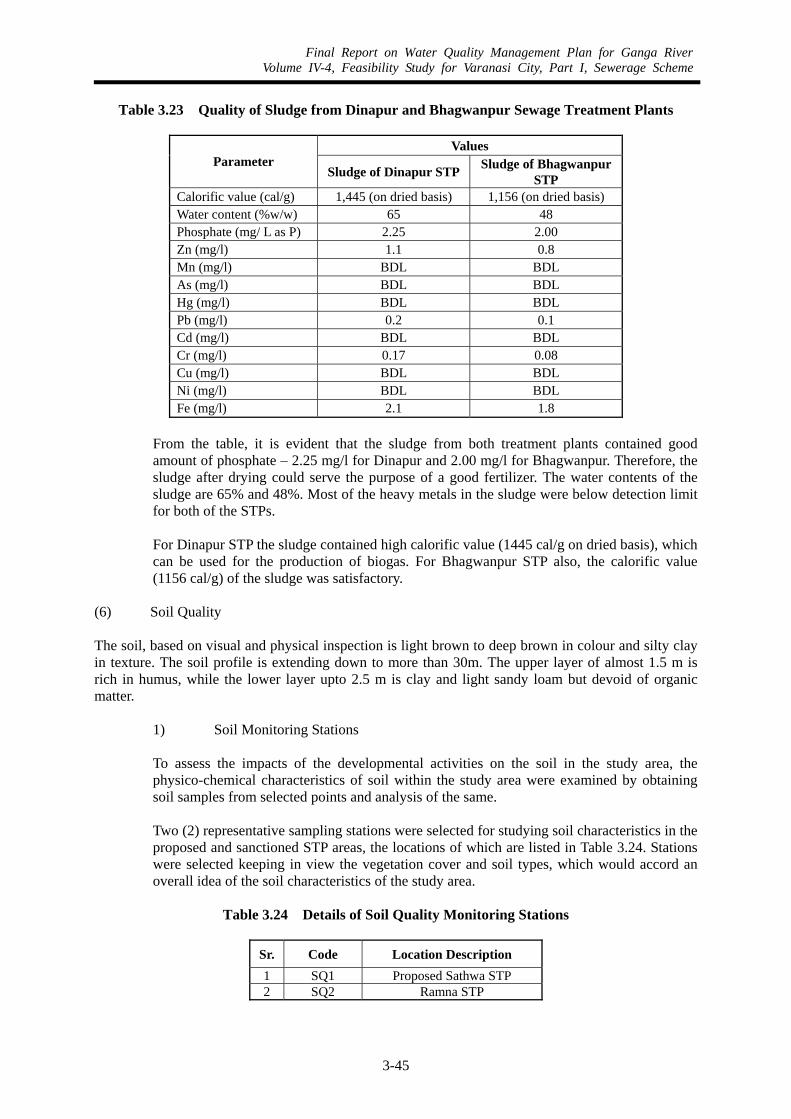
Final Report on Water Quality Management Plan for Ganga RiverVolume IV-4, Feasibility Study for Varanasi City, Part I, Sewerage Scheme
3-45
Table 3.23 Quality of Sludge from Dinapur and Bhagwanpur Sewage Treatment Plants
Values Parameter
Sludge of Dinapur STP Sludge of Bhagwanpur STP
Calorific value (cal/g) 1,445 (on dried basis) 1,156 (on dried basis) Water content (%w/w) 65 48 Phosphate (mg/ L as P) 2.25 2.00 Zn (mg/l) 1.1 0.8 Mn (mg/l) BDL BDL As (mg/l) BDL BDL Hg (mg/l) BDL BDL Pb (mg/l) 0.2 0.1 Cd (mg/l) BDL BDL Cr (mg/l) 0.17 0.08 Cu (mg/l) BDL BDL Ni (mg/l) BDL BDL Fe (mg/l) 2.1 1.8
From the table, it is evident that the sludge from both treatment plants contained good amount of phosphate – 2.25 mg/l for Dinapur and 2.00 mg/l for Bhagwanpur. Therefore, the sludge after drying could serve the purpose of a good fertilizer. The water contents of the sludge are 65% and 48%. Most of the heavy metals in the sludge were below detection limit for both of the STPs. For Dinapur STP the sludge contained high calorific value (1445 cal/g on dried basis), which can be used for the production of biogas. For Bhagwanpur STP also, the calorific value (1156 cal/g) of the sludge was satisfactory.
(6) Soil Quality The soil, based on visual and physical inspection is light brown to deep brown in colour and silty clay in texture. The soil profile is extending down to more than 30m. The upper layer of almost 1.5 m is rich in humus, while the lower layer upto 2.5 m is clay and light sandy loam but devoid of organic matter.
1) Soil Monitoring Stations To assess the impacts of the developmental activities on the soil in the study area, the physico-chemical characteristics of soil within the study area were examined by obtaining soil samples from selected points and analysis of the same. Two (2) representative sampling stations were selected for studying soil characteristics in the proposed and sanctioned STP areas, the locations of which are listed in Table 3.24. Stations were selected keeping in view the vegetation cover and soil types, which would accord an overall idea of the soil characteristics of the study area.
Table 3.24 Details of Soil Quality Monitoring Stations
Sr. Code Location Description 1 SQ1 Proposed Sathwa STP 2 SQ2 Ramna STP

Final Report on Water Quality Management Plan for Ganga RiverVolume IV-4, Feasibility Study for Varanasi City, Part I, Sewerage Scheme
3-46
2) Methodology of Soil Monitoring Soil samples representing the pre-monsoon condition were collected during April 2004. A number of parameters were determined which are indicative of physical, chemical and fertility characteristics. Sampling and analysis was conducted as per established standard methods and procedures prescribed in IS:2720 and ASTM. 3) Soil Characteristics in the Study Area The physico-chemical characteristics of the soil in the study area, as obtained from the analysis of the soil samples, are presented in Table 3.25. Soil in the study corridor was found to be silty clay. It was generally alkaline with pH range 7.89-8.14. Electrical conductivity (EC) was low, generally varying between 110-131 µmhos/cm. Sodium level (34.1-37.4 µg/g) in the soil samples was low and therefore good from agricultural viewpoint. Potassium level (38.0-45.3µg/g) and nitrogen level (40.5-8.4µg/g) were normal. Observed phosphorous level (10.1-14.6µg/g) was found low. Organic matter content (organic carbon 0.36-0.61%) was fairly high indicating good vegetation potential of the soil. The soil was observed to possess appreciable level of potassium and nitrogen indicating moderate to good fertility or agricultural potential of the soil. The levels of other elements were appreciably good. Thus, the overall fertility status of the soil in the study area is reasonably good and is not expected to be detrimental to the growth of agricultural and forest crops. Table 3.25 Physico-Chemical Characteristics of Soil in the Study Corridor
Sampling Location
Sr. Parameter & Unit SQ1 (Sathwa) SQ2 (Ramna)
1 Texture Silty clay Silty clay 2 Grain size distribution 3 a) Sand (%) 12.2 14.1 4 b) Silt (%) 47.3 43.4 5 c) Clay (%) 40.5 42.5 6 pH (10%w/v slurry) 8.14 7.89 7 Conductivity (µmhos/cm)* 110 131 8 Organic matter (%) 0.36 0.61 9 Nitrogen (µg/g) 80.4 47.1
10 Phosphorous (µg/g) 14.6 10.1 11 Sodium (µg/g) 37.4 34.1 12 Potassium (µg/g) 38.0 45.3 13 Lead (µg/g) BDL BDL
* Conductivity of 10% w/v of slurry at 30°C 3.4.3 Socio-Cultural Environment (1) Land Use Proposed lands for six pumping stations are public land, which have already been identified by public organisations for future public purposes. Also these lands are along public roads with heavy traffic laod and /or in open fields that means there is little likelihood of any significant impact due to acquisition of lands. Hereinafter, the discussion is focused on Sathwa STP site; agricultural land where people practice cultivation of crops such as wheat, rice, etc.

Final Report on Water Quality Management Plan for Ganga RiverVolume IV-4, Feasibility Study for Varanasi City, Part I, Sewerage Scheme
3-47
Land Use Pattern of Villages Around Sathwa STP Site The baseline land use pattern of the villages in and around the Sathwa STP site has been primarily established from the village level land use figures adopted from the data of Village & Town Directory, Census of India, 1991, of the State of Uttar Pradesh. Detail analysis of the land use pattern of the area derived from the Census report is portrayed in Table 3.26.
Table 3.26 Land Use Characteristics (in hectares) in Villages around Sathwa STP Site
Agricultural Area Item No of
Village Total Area
Forest Land Irrigated Un-
irrigated Sub-total
Culturable Waste Land
Area Not Available forCultivation
Land area (ha) 11 986.73 0 481 102 583 122 281.73 % of total area 0.00 59.08 12.36 28.55 % of agrl. area 82.50 17.50
Source: Census Data It has been observed that no forest land exists within the area. Majority (about 59%) of the area in the villages in and around the Sathwa STP site consists of agricultural land, most (about 83%) of which is irrigated. Irrigation facilities are not available only for 17% of the land under cultivation. This certainly reveals the presence of good irrigation facilities in the area. The remaining land accounts for about 41% of the total land use, out of which culturable wastelands is about 12% and land not available for cultivation occupies about 29% to the total area. Source of Irrigation Canal irrigation system existing in the study area is insufficient as it covers only about 8% of irrigated land (Table 3.27). Whatever canals exist are mainly Government canals. Majority of the irrigated area is irrigated using tube wells (about 83%) & wells (about 9%) through lift irrigation system. About 65% of the irrigation tube wells are driven by electricity.
Table 3.27 Breakup (%) of Irrigated Land in Villages around Sathwa STP Site
% of Irrigated Land Irrigated by Block
Canal Well Tube well Tank River Lake Waterfall Others% of irrigated area 8.32 9.15 82.54 0 0 0 0 0 % of Government canal 100.0 % with electricity 0.00 65.49 Source: Census Data (2) Socio-Economics
1) Socio-Economics of Varanasi The baseline socio-economic characteristics of Varanasi have been described based on the ward level demographic & occupational figures adopted from the data of Primary Census Abstract, Census of India, 1991, of the State of Uttar Pradesh. The town & ward wise demographic profile & occupational pattern is detailed in Appendix D. Varanasi urban area consists of 12 smaller towns. The summary of the socio-economic features of Varanasi is presented in Table 3.28.

Final Report on Water Quality Management Plan for Ganga RiverVolume IV-4, Feasibility Study for Varanasi City, Part I, Sewerage Scheme
3-48
Table 3.28 Summary of Socio-economic Features of Varanasi
Area 96.15 sq. km (distributed over 12 towns)
Total population Male: 5,68,428, Female: 4,89,544, Total: 10,57,972 No of households 1,43,453 (No of occupied residential houses: 1,32,303) Population density 11,003 persons/sq. km
Family size 7.4 persons per household SC-ST population SC: 89,009 (8.4%), ST: 70 (0.01%), Others: 9,68,893 (91.6%)
Sex ratio Overall: 861 females per 1000 males, SC: 855, ST: 750, General: 862 Literate Male: 73.3% of male population, 62.7% of literates
Female: 52% of female population, 37.3% of literates Total: 63.6 of total population
Worker Main: 2,83,280 (26.8%),Marginal:4,884 (0.5%), Nonworker:7,69,808(72.7%) Main: M:91.6% (45.6% of total M), F:8.4% (4.9% of total F) Marginal: M:13.9% (0.12% of total M), F:86.1% (0.86% of total F) Non-worker:M:40.0% (54.2% of total M), F:60.0% (94.3% of total F) Cultivators & agrl. labourers: 2.6%, Industrial workers: 40.8%, Trade & commerce: 26.6%, Other services: 20.4%, Rest: 9.6%
Break-up (% of Main worker)
Primary sector: 4%, Secondary sector: 43%,Tertiary sector: 53% Note: If otherwise not mentioned, the figures within ( ) indicates % of total population. Source: Census data.
Demographic Profile Total population within the 12 towns in Varanasi urban area is about 10,57,972 occupying about 1,32,303 houses and 1,43,453 households. Population density is very high (11,003 persons/sq. km). Average family size or size of household (persons/per household) is about 7.4. Percentage of scheduled caste (SC) to overall population is about 8.4%. Tribal people (scheduled tribe) are negligible (only 0.01%). Sex ratio (females per 1000 males) is about 861. Overall literacy rate is about 64%, literates among males being about 73% and among females being about 52%. Occupational Pattern Working population or main workers comprise about 27% of the total population. Marginal workers and non-workers are observed to be about 0.5% and 73% of the total population respectively. Work participation among females is poor, about 8% of the main workers being females that accounts for about 5% of the total female population. Majority of the main workers are industrial workers (about 41%) and in trade & commerce (about 27%), and in other services (about 20%). Sector wise, majority (about 53%) of the main workers is in tertiary (business & service) sector followed by (about 43%) secondary (industry) sector, while only about 4% are in primary (agricultural) sector. The principal language is Hindi. The main staple food is rice & wheat. The primary source of drinking water is tube well. 2) Socio-Economics of Villages Around Sathwa STP Site The baseline socio-economic characteristics of the villages neighbouring the Sathwa STP site have been described based on the village level demographic & occupational figures adopted from the data of Primary Census Abstract, Census of India, 1991, of the State of Uttar Pradesh. The village wise demographic profile & occupational pattern are detailed in Table 3.29. The 11 villages in & around the Sathwa STP site fall under 2 blocks namely Chiraigaon & Harhua in the district of Varanasi.
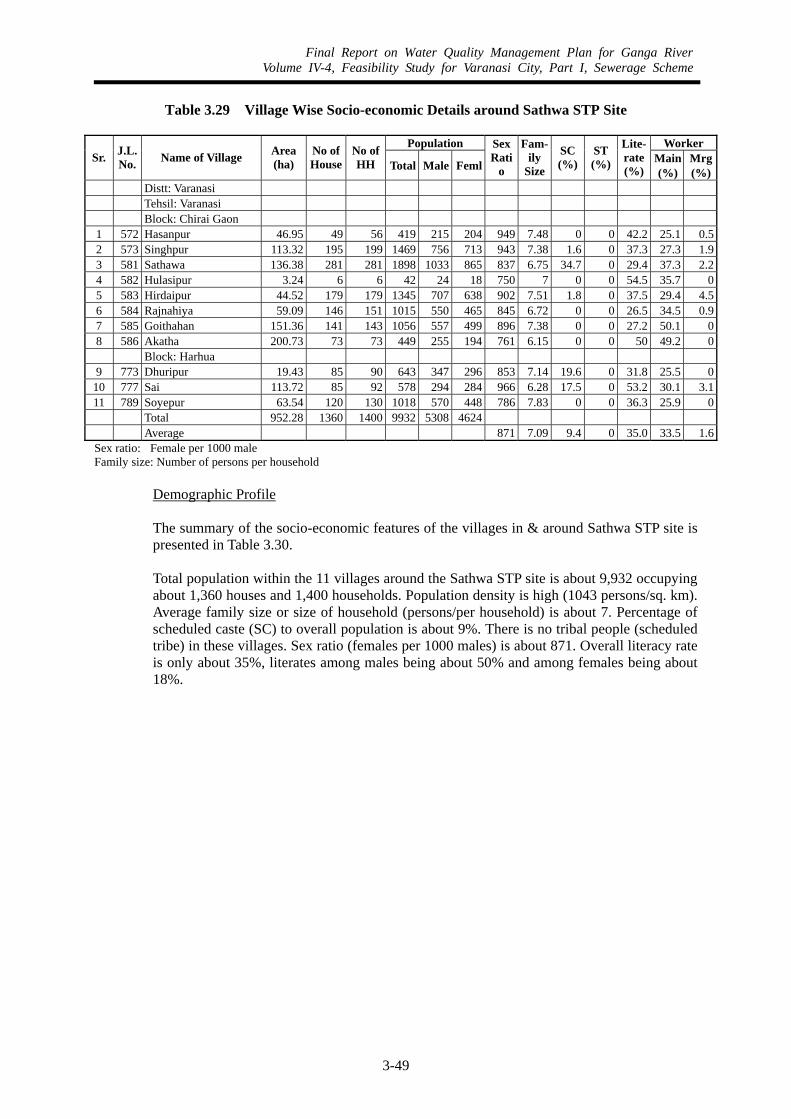
Final Report on Water Quality Management Plan for Ganga RiverVolume IV-4, Feasibility Study for Varanasi City, Part I, Sewerage Scheme
3-49
Table 3.29 Village Wise Socio-economic Details around Sathwa STP Site
Population Worker Sr. J.L.
No. Name of Village Area (ha)
No ofHouse
No ofHH Total Male Feml
Sex Rati
o
Fam-ily
Size
SC (%)
ST (%)
Lite-rate (%)
Main (%)
Mrg (%)
Distt: Varanasi Tehsil: Varanasi Block: Chirai Gaon 1 572 Hasanpur 46.95 49 56 419 215 204 949 7.48 0 0 42.2 25.1 0.52 573 Singhpur 113.32 195 199 1469 756 713 943 7.38 1.6 0 37.3 27.3 1.93 581 Sathawa 136.38 281 281 1898 1033 865 837 6.75 34.7 0 29.4 37.3 2.24 582 Hulasipur 3.24 6 6 42 24 18 750 7 0 0 54.5 35.7 05 583 Hirdaipur 44.52 179 179 1345 707 638 902 7.51 1.8 0 37.5 29.4 4.56 584 Rajnahiya 59.09 146 151 1015 550 465 845 6.72 0 0 26.5 34.5 0.97 585 Goithahan 151.36 141 143 1056 557 499 896 7.38 0 0 27.2 50.1 08 586 Akatha 200.73 73 73 449 255 194 761 6.15 0 0 50 49.2 0 Block: Harhua 9 773 Dhuripur 19.43 85 90 643 347 296 853 7.14 19.6 0 31.8 25.5 0
10 777 Sai 113.72 85 92 578 294 284 966 6.28 17.5 0 53.2 30.1 3.111 789 Soyepur 63.54 120 130 1018 570 448 786 7.83 0 0 36.3 25.9 0 Total 952.28 1360 1400 9932 5308 4624 Average 871 7.09 9.4 0 35.0 33.5 1.6
Sex ratio: Female per 1000 male Family size: Number of persons per household
Demographic Profile The summary of the socio-economic features of the villages in & around Sathwa STP site is presented in Table 3.30. Total population within the 11 villages around the Sathwa STP site is about 9,932 occupying about 1,360 houses and 1,400 households. Population density is high (1043 persons/sq. km). Average family size or size of household (persons/per household) is about 7. Percentage of scheduled caste (SC) to overall population is about 9%. There is no tribal people (scheduled tribe) in these villages. Sex ratio (females per 1000 males) is about 871. Overall literacy rate is only about 35%, literates among males being about 50% and among females being about 18%.

Final Report on Water Quality Management Plan for Ganga RiverVolume IV-4, Feasibility Study for Varanasi City, Part I, Sewerage Scheme
3-50
Table 3.30 Summary of Socio-economic Features around Sathwa STP Site
Area 9.52 sq. km (distributed over 11 villages) Total population Male: 5,308, Female: 4,624, Total: 9,932 No of households 1,400 (No of occupied residential houses: 1,360) Population density 1043 persons/sq. km Family size 7.1 persons per household SC-ST population SC: 933 (9.4%), ST: 0 (0%), Others: 8,999 (90.6%) Sex ratio Overall: 871 females per 1000 males, SC: 822, ST: NA, General: 876 Literate Male: 49.5% of male population, 76.8% of literates
Female: 17.7% of female population, 23.2% of literates Total: 35% of total population
Worker Main: 3,327 (33.5%), Marginal:159 (1.6%), Non-worker:6,446 (64.9%) Main: M:76.1% (47.7% of total M), F:23.9% (17.2% of total F) Marginal: M:07.6% (00.2% of total M), F:92.4% (03.2% of total F) Non-worker:M:42.9% (52.1% of total M), F:57.1% (79.7% of total F) Cultivators: 36.7%, Agricultural labourers: 29.6%, Industrial workers: 15.5%, Trade & commerce: 3.9%, Other services: 8.4%, Rest: 8.1%
Break-up (% of Main worker)
Primary sector: 67%, Secondary sector: 19.3%,Tertiary sector: 13.7% Note: If otherwise not mentioned, the figures within ( ) indicates % of total population. Source: Census data.
Occupational Pattern Working population or main workers comprise about 33% of the total population. Marginal workers and non-workers are observed to be about 2% and 65% of the total population, respectively. Work participation among females is moderate, about 24% of the main workers being females that accounts for about 17% of the total female population. Majority of the main workers are cultivators (about 37%) and agricultural labourers (about 30%). Sector wise, majority (about 67%) of the main workers is in primary (agricultural) sector, while about 19% in secondary (industry) sector and 14% in tertiary (business & service) sector. The principal language is Hindi. The staple food is mainly rice & wheat. The primary source of drinking water is tube well. Amenities Available in the Villages The village wise details of amenities & infrastructural facilities (educational, medical, drinking water, post & telegraph, market, communication, and power supply) available in the villages in & around the Sathwa STP Site have been presented in Table 3.31.

Final Report on Water Quality Management Plan for Ganga RiverVolume IV-4, Feasibility Study for Varanasi City, Part I, Sewerage Scheme
3-51
Table 3.31 Village Wise Amenities (No.) Available around Sathwa STP Site
No. of Educational Institutions
No. of Medical Institutions
Available within the Range in km Sr. J.L.
No. Name of Village P M H C A O H M H
C D FP W PP O DW P&T Mkt Com Pow
Distt : Varanasi Tehsil: Varanasi Block : Chirai Gaon
1 572 Hasanpur 0 0 0 0 0 0 0 0 0 0 0 1 0 0 0 <5 <5 <5 02 573 Singhpur 1 1 1 1 1 1 0 0 0 0 0 1 0 0 0 <5 <5 0 03 581 Sathawa 1 0 0 0 0 0 0 0 0 0 0 1 0 0 0 0 5-10 0 04 582 Hulasipur 0 0 0 0 0 0 0 0 1 0 0 0 0 0 0 <5 5-10 5-10 05 583 Hirdaipur 1 0 0 0 0 0 1 0 1 0 0 0 0 0 0 <5 <5 0 06 584 Rajnahiya 0 0 0 0 0 0 0 0 0 0 0 1 0 0 0 <5 <5 0 07 585 Goithahan 0 0 0 0 0 0 0 0 0 0 0 1 0 0 0 <5 <5 <5 08 586 Akatha 1 0 0 0 0 0 1 0 0 0 0 0 0 0 0 <5 <5 <5 0 Block : Harhua
9 773 Dhuripur 1 0 0 0 0 2 0 0 0 0 0 1 0 0 0 <5 5-10 0 010 777 Sai 0 0 0 0 0 0 0 0 0 0 0 1 0 0 0 <5 0 <5 011 789 Soyepur 0 0 0 0 0 1 0 0 0 0 0 1 0 0 0 <5 <5 0 0
Total 1 0 0 0 0 3 0 0 0 0 0 3 0 0 Educational Institutions: P-Primary School, M-Middle School, H-High School, C-PU/Graduate College, AL-Adult
Literacy Centre, O-Others Medical Institutions: H-Hospital, M-Maternity & Child Welfare Centre, HC-Health Centre/Subcentre, D-Dispensary,
FP-Family Planning Centre, W-Community Health Worker, PP-Private Practitioner, O-Others Other Amenities: DW-Drinking Water Facility, P&T: Post & Telegraph Facility, Mkt-Market Facility,
Com-Communication Facility, Pow-Power Supply Available within 0 km: Means the facility is available within the village.
The salient features of amenities & infrastructural facilities of all the villages in & around the Sathwa STP Site at a time have been summarized in Table 3.32.
Table 3.32 Summary of Amenities & Infrastructural Facilities around Sathwa STP Site
% of Villages Having the Amenities/Facilities
Amenity/Facility Within Village Within 5 km Within 5-10 km Beyond 10 km
Educational 55 45 - - Medical 100 - - - Drinking water 100 - - - Post & telegraph 9 91 - - Market 9 64 27 - Communication 55 36 9 - Power supply 100 - - - No of villages 11 No. of educational institutions
Primary School (5), Middle School (1), High School (1), PU/Graduate College (1), Adult Literacy Centre (1), Others (4)
No. of medical institutions
Hospital (2), Maternity/Child Welfare Centre (0), Health Centre/ Primary Health Centre/ Sub-centre (2), Dispensary (0), Family Planning Centre (0), Community Health Worker (8), Registered/Subsidiary Medical Practitioner (0), Others (0)
% of villages having Tap (0%), Well (100%), Tube Well (0%) Hand pump (55%) % of villages having Post office (9%), Telegraph office (0%), Telephone (0%) % of villages having Bus Stop (55%), Railway Station (0%) % of villages having Pucca Road (73%), Kuccha Road (36%) % of villages having power for
Domestic Purpose (45%), Agricultural Purpose (63%), All Purpose (9%)
Source: Census data.
Every village in the area has electricity, drinking water and medical facility. Educational

Final Report on Water Quality Management Plan for Ganga RiverVolume IV-4, Feasibility Study for Varanasi City, Part I, Sewerage Scheme
3-52
(available in 55% villages) & communication (available in 55% villages) facilities are less than adequate. Educational facilities are less than adequate, 45% of the villages having no educational facilities. Out of 11 villages, only 5 villages have primary school, and only in 1 village (Singhpur) there is high school & college. Most of the students therefore have to go outside their village for further education after primary school. Health care facilities are adequate, all (100%) of the villages have access to medical facilities. There are hospitals in 2 villages and primary health sub-centres in 2 villages. In remaining villages, there is at least one community health worker.
(3) Tourism and Cultural Assets Varanasi is well known as a city of Ghats as well as religious and spiritual city. It is considered very poise to liberate soul from human body to ultimate at Varanasi. Ghats in Varanasi have great religious and historical importance. Many ghats are regarded as Heritage Ghats as these Ghats were constructed long time ago for daily and religious bathing purpose. The Archaeological Survey of India (ASI), Ministry of Tourism and Culture, Government of India was assigned to conserve the Heritage Ghats in Varanasi in April 2003 and all the construction activities related to the Heritage Ghats required approval from ASI after a notification. According to the Department of Culture, Varanasi, there are 84 Ghats along the river Ganga in Varanasi. Important Ghats along the Ganga river are listed below.

Final Report on Water Quality Management Plan for Ganga RiverVolume IV-4, Feasibility Study for Varanasi City, Part I, Sewerage Scheme
3-53
Table 3.33 List of Ghat along the Ganga River in Varanasi
Sr. Site Name Sr. Site Name Sr. Site Name Bhelupur Ward Dashashwamegh Ward Kotawali Ward 1 Assi Ghat 29 Raja Ghat 53 Mehta Ghat 2 Ganga Mahal Ghat 30 Babuwa Pandey Ghat 54 Ram Ghat 3 Revan Ghat 31 Pandey Ghat 55 Jatar Ghat 4 Tulsi Ghat 32 Dimpatiya Ghat 56 Raja Gwalior Ghat 5 Bhadaini Ghat 33 Chwshahi Ghat 57 Bala Ghat 6 Janki Ghat 34 Rajamahal Ghat 58 Panch Ganga Ghat 7 Annadi Mai Ghat 35 Munshi Ghat 59 Durga Ghat 8 Vacchraj Ghat 36 Darbhanga Ghat 60 Brahma Ghat 9 Jain Ghat 37 Ahilyabai Ghat 61 Bundi Parkota Ghat
10 Shri Nishadraj Ghat 38 Sheetla Ghat 62 Lal Ghat 11 Panch Kot Ghat 39 Prayag Ghat 63 Shir Hanuman Garhi Ghat 12 Prabhu Ghat 40 Dashashwamegh Ghat 64 Gai Ghat 13 Chet Singh Ghat 41 Dr. Rajendra Prasad Ghat 14 Niranjani Ghat 42 Maan Mandir Ghat Adampur IInd Ward 15 Mahanirvani Ghat 43 Tripura Bhairavi Ghat 65 Badrinath Ghat 16 Shivala Ghat 44 Meer Ghat 66 Trilochan Ghat 17 Gularia Ghat 45 Lalita Ghat 67 Gola Ghat 18 Dandi Ghat 68 Maheshwar Ghat 19 Prachin Hanuman Ghat Chowk Ward 69 Samka Ghat 20 Karnatak State Ghat 46 Sindia Ghat 70 Teliyana Nala Ghat 21 Harishchandra Ghat 47 Manikarnika Ghat 71 Naya Ghat 22 Lali Ghat 48 Sankta Ghat 72 Nishad Ghat 23 Vijay Nagar Ghat 49 Bohshala Ghat 73 Prahalad Ghat 24 Kedar Ghat 50 Jalasen Ghat 74 Raj Ghat 25 Chowki Ghat 51 Gnagamahal Ghat 75 Bhaisasur (Raj Ghat) Ghat 26 Someshwar Ghat 52 Ganesh Ghat 76 Khrikeya Ghat 27 Mansarovar Ghat 77 Keshaw Ghat 28 Narad Ghat
According to an interview survey conducted by JICA Study Team in 2003, the following number of Ghat users for bathing is estimated. Regular users: 24,000 person/day Occasional users: 300,000 person/day (4) Water Consumption The total quantity of water supplied to the present population (in 2003) is approximately 340 mld. The composition of population served by water supply system is approximately as follows:
Table 3.34 Average per Capita Water Production: Varanasi City
Water Production (mld) Population 2003 Average per Capita
Production (lpcd) Municipal & private systems (1) 323 1,174,408 275
Cantonment 5 17,500 290 BHU 11.75 22,500 511
(1) Population is municipal area population plus 5% net in-migration less BHU population as estimated by JICA Study Team.
Presently, the average per capita water production (excluding Cantonment and BHU campus) is
Final Report on Water Quality Management Plan for Ganga RiverVolume IV-4, Feasibility Study for Varanasi City, Part I, Sewerage Scheme
3-54
approximately 275 lpcd. It is impossible to determine actual water consumption since most services are un-metered. Assuming UFW of 30% (as estimated by Jal Sansthan), the actual consumption would be of the order of 212 lpcd. As noted in a recent report “Report on State of the Environment for Varanasi, CPCB, 2000”, not all areas are served equally. The trans-Varuna area is facing an acute shortage of water because the distribution system is not well developed. Findings from the CPCB report indicate a supply of only 60 lpcd in the trans-Varuna, which would be insufficient to support water borne sewerage. 3.5 ANALYSIS OF ALTERNATIVES (INCLUDING WITHOUT PROJECT OPTION) 3.5.1 Project Benefits and Positive Impacts Objective of implementation of the sewerage and pollution control projects is to ameliorate overall development and betterment of public health and hygiene coupled with upgradation of environmental management in the target project area through abatement of pollution; improvement of public health and aesthetics leading to improvement in quality of living and inducing economic growth. The project therefore, is associated with following benefits and positive impacts:
• Varanasi is one of the sacred cities of Hindu. The river is a part and parcel of everyday life in the town and thousands of people bathe daily in the river along the famous seven kilometers stretch of ancient ghats of the town. The project benefits these people who come for bathing in the River.
• The collection and treatment of untreated wastewater before entering the rivers will improve water quality of the rivers and river environment.
• The project will improve river water quality of upstream of the city, where municipal water supply intake is located.
• Proper collection, treatment and disposal system of wastewater will reduce the risks of parasitic infections, incident of various diseases including malaria, typhoid etc.
• A proper wastewater handling and disposal arrangement will minimize the chances of contamination of ground and surface water.
• Such provisions assist to maintain ecological balance by reducing damages to flora and fauna. • Controlled reuse of wastewater supplements agricultural activities and development and
sustenance of environmental protection components like greenbelt development. • Improvement in the existing sewerage system will help reduce the nuisance in streets and road
blockages. • Development of the project will encourage increased economic activities like commercial,
industrial, etc. and will generate enhanced employment alternatives and economic growth for the city.
• Improvement in the existing sewerage facilities will help tourism and boost the economy of the area.
• Public health gains such as increased output through improved health resulting in higher economic activity and productivity.
• The construction activity can provide opportunities to the local population and residents of the neighbouring area to earn. They may come to provide labour or to service the construction camps.
• Nutrient rich treated water and dried sludge can be used for irrigation 3.5.2 With and Without Proposed Project The with and without project scenarios are compared in the following table.

Final Report on Water Quality Management Plan for Ganga RiverVolume IV-4, Feasibility Study for Varanasi City, Part I, Sewerage Scheme
3-55
Table 3.35 Comparison of With and Without Project Without Project With Project Estimated wastewater discharge in 2003 292 mld 292 mld Untreated wastewater in 2003 204 mld 204 mld Estimated wastewater discharge in 2015 369 mld 369 mld Treatment capacity in 2015 88 mld 325 mld Untreated wastewater in 2015 281 mld 44 mld Percentage of untreated wastewater in 2015 76 % 12 % Estimated BOD discharge 70.5 ton/day 18.8 ton/day BOD concentration in the River 2.3 mg/l 0.6 mg/l Environment for bathing Raw wastewater is discharged in
the Ganga and Varuna, which will cause unhygienic condition for bathing
Most raw wastewater will be intercepted before entering the Ganga and Varuna and treated. Bathing environment will be improved
Protection of water source of drinking water Raw wastewater is discharged upstream of the municipal water intake and pollution of the source will be increased.
The raw wastewater discharged upstream of the municipal intake will be intercepted and treated and thus the source will be protected.
Water quality of effluent of existing and proposed STP
Bacteria pollution because of no disinfection facility
Chlorination will be applied to both existing and proposed STPs. Bacterial pollution will be reduced
If the project are implemented (with the project scenario), 88 % of the wastewater discharge will be intercepted and treated in 2015 while if the project are not implemented (without the project scenario) only 24 % is treated and 76 % of wastewater discharge (70.5 ton/day) finds its way to the Ganga and Varuna degrading bathing environment of ghat in Varanasi. The preliminary estimation shows that the BOD concentration in Varanasi will be increased by 2.3 mg/l without the project and 0.6 mg/l with the project. 3.5.3 Alternatives The various treatment technologies considered include:
• Waste Stabilisation Ponds (WSP) • Conventional Activated Sludge Process (ASP) + Chlorination (CL) • Facultative Aerated Lagoons (AL) + Maturation Ponds (MP) • UASB + Facultative Aerated Lagoons (AL) + Chlorination (CL) • UASB + Mechanical Aeration followed by Solids Separation + Chlorination (CL) • Fluidised Aerated Bio-reactor (FAB) + Chlorination (CL)
These treatment technologies are usually, in a techno-economic analysis, compared on the basis of the following general parameters:
• Suitability to meet discharge standards • Capital costs • O&M costs • Power requirement

Final Report on Water Quality Management Plan for Ganga RiverVolume IV-4, Feasibility Study for Varanasi City, Part I, Sewerage Scheme
3-56
• Land requirement • Treated effluent discharge • Sludge disposal requirements • Resource recovery in terms of re-use of methane gas
The present project discharge standards are:
(i) BOD – 30 mg/l (ii) SS – 50 mg/l (iii) Faecal Coli -10,000 MPN/100 ml
The table below presents summary of technical and financial comparison of six alternatives.
Table 3.36 Comparison of Treatment Technologies
Sr. Units WSP ASP+CL AL+ MP UASB+ AL+CL
UASB+ Aeration +CL
FAB+CL
1 Effluent BOD, mg/l < 30 < 30 < 30 < 30 < 30 < 30 2 Effluent TSS, mg/l < 50 < 50 < 50 < 50 < 50 < 50
3 Effluent faecal coliform, MPN/100 ml
< 10,000 < 10,000 < 10,000 < 10,000 < 10,000 < 10,000
4 Reuse of treated effluent for irrigation
Suitable Suitable Suitable Suitable Suitable Suitable
5 Power Requirement (O&M costs)
Least High High Medium High High
6 Environmental Risk*1 Least High Medium Medium High High 7 Air Quality Medium *2 Minimum Medium Medium Minimum Minimum
8 Ground water contamination *3
Minimum Minimum Minimum Minimum Minimum Minimum
9 Land Requirement Highest High High Medium Medium Low
10 Maintenance Requirement
Least High Low Low Low Medium
11 Sludge Disposal Requirement
Least High Low Medium Medium High
12 Land requirement Highest Low High Medium Low Least
13 Life cycle cost Least, if land is available
High High Low High High
14 General recommendation
Depending on the situation
No No Depending on the situation
No Depending
on the situation
*1: Measured in terms of loss of treatment efficiency due to long and frequent power cuts *2: Some odour problems if ponds not operated properly. *3: Since lining or coating is proposed to the wall and bed of STP, local groundwater contamination is minimized. Regarding the above parameters, their related importance in the comparison of alternative sewage treatment technologies for the present project has been decided in view of the following site constraints:
(i) Power Constraint: - Power outages are common in Varanasi. Hence a technology with a high dependency on power for effective and reliable treatment of waste water would not be desirable for the cities where power cuts occur.
(ii) Land Constraint: - The city is densely populated and hence, offers few choices for locating the sewage treatment facilities
If the land availability is the major parameter to be considered for treatment process, the following

Final Report on Water Quality Management Plan for Ganga RiverVolume IV-4, Feasibility Study for Varanasi City, Part I, Sewerage Scheme
3-57
options are recommended.
1. If availability of land is not a major constraint, Waste Stabilization Pond (WSP) is the best alternative.
2. If availability of land is a constraint and is not enough for WSP, UASB+AL+CL is the best alternative.
3. If availability of land is very limited, FAB is recommended. This site of proposed Sathwa STP is located in the northern area of Varanasi city, bounded by several villages. Sufficient land for WSP is not available at this site. Also there is potential for re-use of treated effluent for irrigation. Hence, for this site UASB followed by AL and chlorination would be a better environmental solution than aerobic technologies like ASP and FAB in view of the frequent power cuts in Varanasi. 3.6 IMPACT IDENTIFICATION AND MITIGATION MEASURES 3.6.1 Overall Impact Identification (1) General The first step in EIA is to identify the potentially significant impacts. The various aspects considered in impact identification of the project are as follows:
Project components Project phases Impact generating activities Type of impact
The overall identification of the impacts has been carried out by using a matrix table, which is a common tool to identify and present the various impacts of a project in a compact way. Thereafter, the impacts are being described (Description Method) in more detail for the construction phase and the operation phase. (2) Activities During Construction Phase During the construction phase, the following activities among many are considered to be important towards contributing significant environmental impacts:
• Site preparation (fencing, grading & clearing of site) • Excavation • Hauling and dumping of earth materials & construction spoils • Erection of village houses • Clean up operations, landscaping and plantations • Employment of people
Several types of negative impacts upon environment may be caused during construction phase, primarily due to negligent practices. Appropriate techniques and responsible supervision are needed to avoid/ minimize/ mitigate these adversities. (3) Activities During Operational Phase The major project activities, which are likely to impact the environment when the project is operational, are:
Final Report on Water Quality Management Plan for Ganga RiverVolume IV-4, Feasibility Study for Varanasi City, Part I, Sewerage Scheme
3-58
• Energy requirement • Operation of DG sets in pumping stations • Operation of pumps and related equipments in the pumping stations • O & M of STPs • Treated effluent discharge from the STPs • Sludge disposal from the STPs
(4) Overall Impact Identification In the matrix table, the activities are arranged in rows and environmental parameters in columns (Table 3.37). The matrix thus identifies the environmental factors likely to be affected, and the activities responsible for this. The cells, which fall at the junction of an activity and an affected parameter, have been graded as A, B, C and blank. The environmental parameters that can be affected are:
1. Natural parameters: soil, air, noise/vibration, water, flora and fauna 2. Socio-cultural parameters: population, land use, traffic, socio-economic, public health,
culture & lifestyle, aesthetics, land acquisition The adverse impacts have been classified in two categories namely construction stage and operational stage. Impacts during construction phase may be regarded as temporary or short-term whereas those during operation stage are likely to have long-term effects. The environmental impacts have been discussed separately for the construction phase and the operational stage. Key objective of this study is prediction of likely environmental impacts and subsequently to frame up a comprehensive Environmental Management Plan (EMP) to offset/ reduce/ eliminate the adversities arising due to implementation of project.

Final Report on Water Quality Management Plan for Ganga RiverVolume IV-4, Feasibility Study for Varanasi City, Part I, Sewerage Scheme
3-59
Table 3.37 Scope Matrix for Project Components
Social Environment Natural Environment Pollution
Environmental Elements
Development Scheme
Res
ettle
men
t E
cono
mic
Act
ivity
Tr
affic
/Pub
lic F
acili
ties
Split
of C
omm
uniti
es
Cul
tura
l Pro
pert
ies
Wat
er R
ight
/Rig
ht o
f Com
mon
Pu
blic
Hea
lth C
ondi
tion
Solid
Was
te
Haz
ard
Topo
grap
hy a
nd G
eolo
gy
Soil
Ero
sion
G
roun
dwat
er
Hyd
rolo
gica
l Situ
atio
n C
oast
al Z
one
Flor
a an
d Fa
una
Loc
al M
eteo
rolo
gy
Lan
dsca
pe
Air
Pol
lutio
n W
ater
Pol
lutio
n So
il C
onta
min
atio
n N
oise
and
Vib
ratio
n G
roun
d Su
bsid
ence
O
dor
C B B C C C CSathwa STP O B C C C B B B B B C BC C C CChakughat MPS, Narokhar
SPS and other 3 PSs O C C CC C C C CGhat PS Rehabilitation O C C
Varuna River Interceptor C B CSewer O
C B CAssi Nala Interceptor Sewer O
Installation of the Main C C B CTrunk Sewer O Cleaning and Rehabilitation C C B C C Cof Existing Trunk Sewer O Note: C: Indicates construction (rehabilitation) stage. O: Indicates operation stage. A: Indicates that the development scheme is foreseen to have strong impact on the environmental element. B: Indicates that the development scheme is foreseen to have some impact on the environmental element. C: Indicates the impact is not quite sure but minor impact is expected. 3.6.2 Prediction of Impacts and Mitigation Measures during Construction Phase (1) Sewer Lines (Construction Phase) Most of the proposed trunk sewers are though in the developed areas, these sewers are proposed to be laid on the right of way of the road.
1) Noise Quality Impacts • Various site preparation and construction activities will generate increased noise levels
due to operation of mechanical equipment. Construction activities are expected to produce noise levels in the range of 80 – 95 dB (A). Table 3.38 presents international standards for noise from different construction equipment.
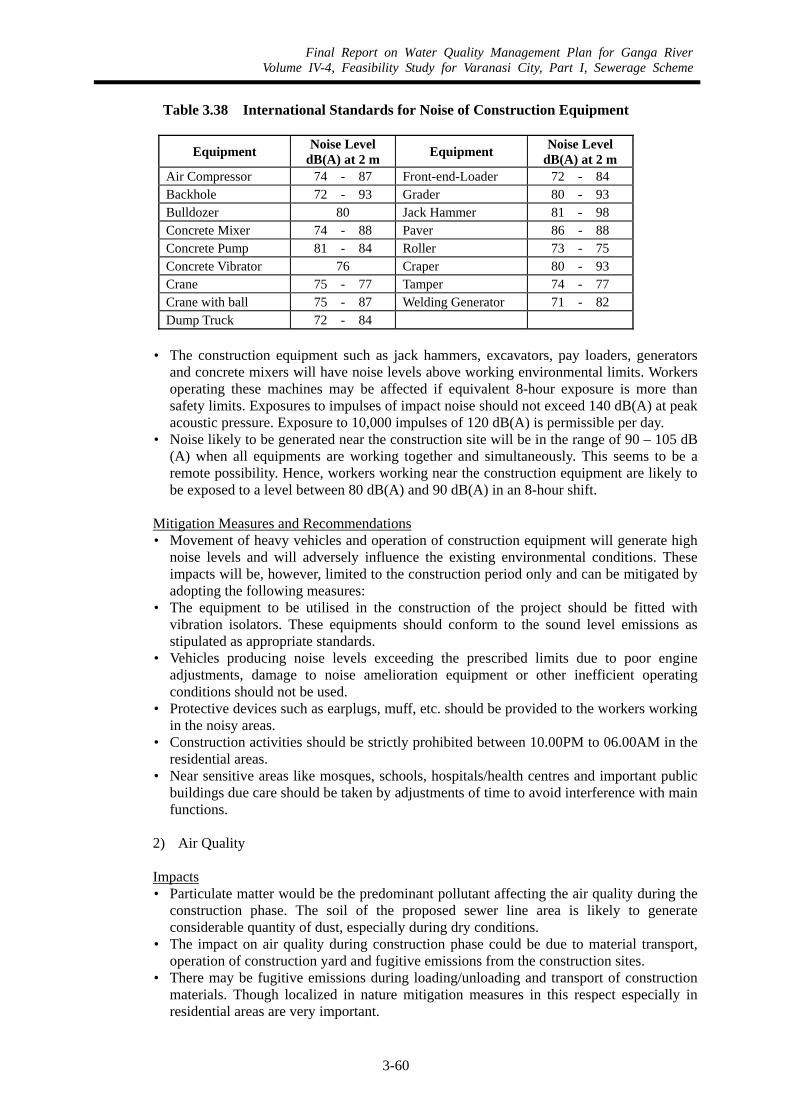
Final Report on Water Quality Management Plan for Ganga RiverVolume IV-4, Feasibility Study for Varanasi City, Part I, Sewerage Scheme
3-60
Table 3.38 International Standards for Noise of Construction Equipment
Equipment Noise Level dB(A) at 2 m Equipment Noise Level
dB(A) at 2 m Air Compressor 74 - 87 Front-end-Loader 72 - 84 Backhole 72 - 93 Grader 80 - 93 Bulldozer 80 Jack Hammer 81 - 98 Concrete Mixer 74 - 88 Paver 86 - 88 Concrete Pump 81 - 84 Roller 73 - 75 Concrete Vibrator 76 Craper 80 - 93 Crane 75 - 77 Tamper 74 - 77 Crane with ball 75 - 87 Welding Generator 71 - 82 Dump Truck 72 - 84
• The construction equipment such as jack hammers, excavators, pay loaders, generators
and concrete mixers will have noise levels above working environmental limits. Workers operating these machines may be affected if equivalent 8-hour exposure is more than safety limits. Exposures to impulses of impact noise should not exceed 140 dB(A) at peak acoustic pressure. Exposure to 10,000 impulses of 120 dB(A) is permissible per day.
• Noise likely to be generated near the construction site will be in the range of 90 – 105 dB (A) when all equipments are working together and simultaneously. This seems to be a remote possibility. Hence, workers working near the construction equipment are likely to be exposed to a level between 80 dB(A) and 90 dB(A) in an 8-hour shift.
Mitigation Measures and Recommendations • Movement of heavy vehicles and operation of construction equipment will generate high
noise levels and will adversely influence the existing environmental conditions. These impacts will be, however, limited to the construction period only and can be mitigated by adopting the following measures:
• The equipment to be utilised in the construction of the project should be fitted with vibration isolators. These equipments should conform to the sound level emissions as stipulated as appropriate standards.
• Vehicles producing noise levels exceeding the prescribed limits due to poor engine adjustments, damage to noise amelioration equipment or other inefficient operating conditions should not be used.
• Protective devices such as earplugs, muff, etc. should be provided to the workers working in the noisy areas.
• Construction activities should be strictly prohibited between 10.00PM to 06.00AM in the residential areas.
• Near sensitive areas like mosques, schools, hospitals/health centres and important public buildings due care should be taken by adjustments of time to avoid interference with main functions.
2) Air Quality Impacts • Particulate matter would be the predominant pollutant affecting the air quality during the
construction phase. The soil of the proposed sewer line area is likely to generate considerable quantity of dust, especially during dry conditions.
• The impact on air quality during construction phase could be due to material transport, operation of construction yard and fugitive emissions from the construction sites.
• There may be fugitive emissions during loading/unloading and transport of construction materials. Though localized in nature mitigation measures in this respect especially in residential areas are very important.
Final Report on Water Quality Management Plan for Ganga RiverVolume IV-4, Feasibility Study for Varanasi City, Part I, Sewerage Scheme
3-61
• The air quality impacts from the construction yard will be due to operation of equipment. The air pollution from the construction yard will be ground based and the effect will be mostly localized for the entire construction period. However, if the construction yard is located at a minimum distance of 500 m away from any residential areas, the impacts of air pollution arising out of the construction yard activities will be insignificant.
Mitigation Measures and Recommendations • Moderate air quality impacts during the construction phase of the project can be
anticipated due to fugitive dust generation in and around the working area and construction yards from the movement of vehicles, operation of the construction machinery and handling (loading/ unloading) of materials.
• Following mitigation measures should be taken for reducing the impacts on air quality: • The method of handling cement and other materials should include means of eliminating
atmosphere discharge of dust. • Equipment and vehicles producing excessive emissions of exhaust gases due to any
mechanical fault should not be allowed for operation. • Regular maintenance of vehicles and equipment should be carried out. • Regular third party inspection of construction sites should be carried out to ensure the
disposal of the construction debris to the approved landfill sites. • Low emission equipment should be used. • Vehicles carrying construction material should be covered with tarpaulin or canvas sheet
to avoid spilling. Additionally, left over of such materials deposited on the surfaces of vehicles should be removed before transportation.
• Sprinkling of water at construction sites for dust suppression wherever necessary. • Construction debris should be properly dumped into a closed area to prevent dust
propagation with the air.
3) Land Impacts • Due to trenching activities solid waste will be generated, which may cause pollution to
the land. Prolonged storage and surplus earth may cause dust pollution and soil transportation by rainwater into low areas.
• During construction stage, water pools are also likely to be generated due to spillage of wastewater (during rehabilitation of sewers) resulting in stagnant pools. These can be minimized by appropriate water and wastewater management practices at worksites. In addition, considerable amount of solid wastes out of scraps, packing materials, unused materials, etc. are also likely to be generated at construction sites. These need to be disposed off at the earliest as otherwise may lead to aesthetic nuisance and might cause obstruction to other services.
Mitigation Measures and Recommendations • For laying of the pipes in the trenches, fill material will be required for preparing the bed
of pipes and back-filling the trenches. Considering the urban nature of construction site and to minimise the inconvenience, prolonged storage of material near the site should not be permitted. Contractors should transport and use material preferably without any temporary storage on site.
• Solid Wastes should be properly managed. • Proper care should be taken during excavation. • Proper collection, handling, transport, and disposal of solid waste into places demarkated
by local authorities should be done. • If necessary, temporary storage may be permitted with the following conditions: • Temporary storage of materials will not be allowed more than two (2) days; • No existing access shall be disturbed unless unavoidable;
Final Report on Water Quality Management Plan for Ganga RiverVolume IV-4, Feasibility Study for Varanasi City, Part I, Sewerage Scheme
3-62
• No residual material will be allowed to be left at site, • Heaps shall be located only in that area, which is temporarily acquired for construction
purposes with proper approval. 4) Soil Quality
Impacts Digging and backfilling of trench for laying sewer lines may render topsoil loose. Soil of the construction area may be contaminated by wastewater also. This contamination will be due to: • Alteration of chemical make-up of the soil, increased acidity/alkalinity • Presence of pathogens and other organic material in the excavated material These impacts will be minor and limited to the construction phase only. No major impact on soil quality is anticipated. Mitigation Measures and Recommendations • As standard practice, proper shuttering with struts and props should be provided in the
excavated trenches during construction. The trenches should be backfilled and compacted properly at the earliest after laying and jointing of pipes. To minimize the soil erosion, vegetation cover/paving of appropriate type should be provided over reinstated surface.
• Backfilling in trenches and in other excavations must be compacted properly and reinstated to its original conditions with neat finish by providing vegetation cover or paving as the case may be.
5) Water Quality and Water Use Impacts • The drainage pattern of overland water flow of the project sites may be changed due to
alteration of the existing profile and slope of the land. • Large quantity of water will be used at construction sites for water tightness tests, curing
of concrete, flushing and washing of piles, etc. Some portion of such spent water will be wasted. During disconnection and making connections in sewerage system, there are chances of major spillage.
Mitigation Measures and Recommendations To avoid the spillages following measures are recommended: • Operations should be carried out with extreme care to avoid any spillage, by using
appropriate pumping, storage and transportation arrangements. • Spillages should not be allowed to flow into nearby drains/low lying areas or to
accumulate as stagnant pools. • All necessary equipment/machinery must be in readiness with standby units to take care
of any exigency. • Surplus quantity of used water and sewage should be collected neatly and transported to
designated disposal site. • No spillage of such wastewater should be allowed during transportation. • Transportation of wastewater should follow routes relatively clear of traffic and
congestion and such route plans should be prepared with due care. • Transportation tankers, piping, etc. should be washed properly at the end of every day or
after every operation, so that fly and odour nuisance is avoided. 6) Augmentation of Sewer Lines
Impacts

Final Report on Water Quality Management Plan for Ganga RiverVolume IV-4, Feasibility Study for Varanasi City, Part I, Sewerage Scheme
3-63
The augmentation of the existing sewer lines may render the following impacts to the natural environment. • Additional land requirement • Interference with other existing buried utilities • Growth of breeding grounds for rodents and pests in future inside discarded sewer lines if
left as it is. • Disturbance to existing branch lines • Accident due to sudden collapse of sewers in future • Disruption of existing sewerage facilities • If the existing main sewer pipes are to be replaced by new pipes, dismantling of these
pipes will generate debris. Mitigation Measures and Recommendations • During the augmentation of existing sewer lines and relaying of new sewers, the existing
system will meet with severe disruption, and the situation should be managed with extreme care so that liquid waste does not overflow, causing serious environmental hazards. Following mitigating steps should be adopted.
• Work schedule and sequencing should be worked out in advance with appropriate care commensurate with availability of resources and feasibility of operation.
• Critical stretches of sewer lines should be identified for priority action. Such priority stretches should generally be the downstream sections.
• Incoming sewage has to be by-passed to keep the work area free from hold ups. Bypassing arrangements may be by laying temporary by-pass sewer lines with gravity flow or combination of sewage pumping and temporary piping.
• By-pass arrangements should be worked out through appropriate design so that no sewage built-up occurs in upstream sections and also the downstream sections are not overloaded.
• The work scheduling/sequencing and by-pass arrangements should be finalised after comprehensive discussions with the appropriate authorities.
• If blockages to roads and other services are unavoidable, such blockage areas should be identified well in advance and circulated to public with appropriate details in maps.
• Blockage areas should be barricaded well in advance at least by a week before actual commencement of works so that the road users get accustomed to such blockages. Such blockage areas should be appropriately barricaded with warning signs.
• All actual works at site should commence only after mobilization of required resources including standby, back-up, spare parts, power connections, etc.
7) Traffic Impacts During the construction of the sewer lines traffic congestion will take place, which will have some temporary impact on the social environment. Hindrance to pedestrian movement will occur due to the construction of sewer lines. Mitigation Measures and Recommendations • Traffic diversion management should be properly implemented to control pedestrian
movement. • Proper demarcation by trenching, fencing should be done. • Precautionary signs for public movement should be incorporated.
8) Public Safety Impacts The city of Varanasi is a very congested one and construction activities comprising of

Final Report on Water Quality Management Plan for Ganga RiverVolume IV-4, Feasibility Study for Varanasi City, Part I, Sewerage Scheme
3-64
rehabilitation and laying of sewer lines are expected to take place inside densely populated city area. Following combination of the activities increases the risks of accidents (especially local population) during construction phase: • Unauthorized access to a construction site • Absence of control over access to construction sites • Conflict with construction vehicles • Poor site safety measures and warning system • Inadequate site management Mitigation Measures and Recommendations • At the time of construction, the safety of public is one of the most important issues. To
minimize the risk-involving public, the following measures are suggested: • Trenches for laying the sewer lines should be opened for minimum possible time period. • To permit safe crossing of trenches and to have access to properties and premises
appropriate trench-crossing facilities should be provided in sufficient numbers. • To separate the pedestrians from road traffic alternative appropriate pedestrian
route/crossings should be provided. Where roadway is restricted, the risk of pedestrian and vehicle conflict is significantly high. In such cases, temporary closure of the access may be considered.
• Temporary fences with appropriate warning signs should be used to isolate the trenches. • Trenches should be strictly fenced in the vicinity of schools, mosques and locations of
public concentration. • Precaution notice should be provided at required locations. • All traffic and pedestrian diversion plans should be finalized in consultation with
appropriate authority. • Excavation works should be commenced only after ensuring ready availability of all
resources. • In order to minimize such risks due to delay and avoid other adverse environmental
impacts, advanced construction techniques like trenchless technology should be considered for working in vital areas and busy roads.
• The use of all heavy and mobile equipment should be strictly controlled with all drivers and operators required to be licensed and all heavy equipment operated in strict accordance with manufacturer’s guidelines as applicable.
• All workers should be protected with adequate safety measures and insurance policies. 9) Public Hygiene Impacts Generation of sewage and domestic solid waste is the main source of pollution from construction camps. The waste generated at construction camp should be properly disposed to the approved landfill sites. Improper management of this waste, otherwise, may lead to health and hygiene related problems. Mitigation Measures and Recommendations • The contractor should provide adequate lavatories at construction camp to cater to the
requirement of the workers. • The contractor should build on-site facilities or other appropriate arrangements for safe
disposal of such wastes. • Periodic health check-ups of construction workers should be undertaken and basic
medical facilities should be made available. 10) Employment Opportunities and Temporary Establishment Impacts

Final Report on Water Quality Management Plan for Ganga RiverVolume IV-4, Feasibility Study for Varanasi City, Part I, Sewerage Scheme
3-65
The construction activity can provide opportunities to the local population and residents of the neighbouring area to earn. They may come to provide labour or to service the construction camps. After the completion of the construction the temporary residences of the labours may not be demolished and squatter colonies may develop. Mitigation Measures and Recommendations It is necessary to ensure that the persons after completion of construction work remove all temporary establishments that may prevent setting up of squatter colonies. 11) Rehabilitation of Sewer Line Impacts The existing sewer line passes through the busy roads of congested old town of Varanasi. On both the sides of the road there are residential buildings, shops and institutions. Therefore, during the rehabilitation of the sewer line the inconvenience to public may occur, especially with respect to traffic. However, replacement along the existing alignment will cause following impacts: • Disruption of existing sewerage facilities • Health hazard to construction workers • Public nuisance due to obnoxious odour Mitigation Measures and Recommendations • To minimise the inconvenience to public, special traffic management programme should
be undertaken to divert the vehicular traffic and pedestrians. The plan for narrow roads should be based on a diversion programme along parallel roads with restricted access for local residents and in case of wider roads by closure of one side of the roads. The Contractor should prepare and submit all plans to the local Nagar Nigam, traffic department and the local Civil Defense and other relevant authorities for approval before starting construction programme.
• Impacts, due to the replacement of the existing alignments can be mitigated by extensive pumping of the sewage from disconnected portion using mobile pumping units; Construction workers involved in the replacement activities should be provided with safety equipment, i.e., gloves, boots, etc. to avoid direct contact with wastewater and spillage of wastewater at construction site should be minimised and disposed off expeditiously.
12) Public Properties Impacts Access to the buildings adjacent to which construction activities are ongoing will be affected. Such disruption of access to commercial establishments leads to direct economic loss. These impacts will be minor and restricted to the construction phase only. Mitigation Measures and Recommendations Temporary access should be provided for such premises and proper areas should be restored at the earliest. 13) Public Utility Services
Impacts • During the construction of sewer lines, there will be instances where water supply may be
disrupted for a certain period of time. • Due to road blockage during construction phase, the residents have to cope up with the

Final Report on Water Quality Management Plan for Ganga RiverVolume IV-4, Feasibility Study for Varanasi City, Part I, Sewerage Scheme
3-66
temporary situation of hardship, as they have to traverse longer distance to reach their destination.
• There would be every possibility of interference and minor shifting with other utility lines such as, electrical cables, communication cables, water supply lines, etc.
Mitigation Measures and Recommendations Residents of the project area will have to devise coping strategies to meet the prevailing situation, i.e., • Storing appropriate quantity of water before hand • Buying water • Sharing water with neighbours • Fetching water by tankers • Rehabilitation of affected utilities should be done. • Proper compensation for loss of crops and for agricultural land should be made, if
required. 14) Water Use
Impacts Substantial amount of water would be required at the time of construction. To meet such requirement of water, local communities may be affected in the following ways: • The quantity of water available from their source may be reduced by construction
activities. • Their water sources may be contaminated. Mitigation Measures and Recommendations To avoid the impacts on the water use certain rules and regulations are to be followed. Those are as follows: • Contractors should bring all water on site in tankers and they would be allowed to fill
their tankers at the sites defined in agreement with the local authorities. These may be new facilities located at construction yard, in communities or pre-existing facilities.
• Off-site water source proposed for use by the contractor should be approved in the context of existing local pattern of use, availability of alternative supplies, etc.
(2) Pumping Stations (Construction Phase) The construction impacts of the pumping stations are similar in nature to the impacts due to laying sewer line.
1) Noise Quality Impacts Due to construction of the pumping stations the generated noise may exceed the allowable limit, causing nuisance to the adjoined residents. Mitigation Measures Low noise generating equipment should be used during the construction of the pumping stations. 2) Air Quality Impacts The fugitive emission during the construction of the pumping stations would pollute the ambient air quality.

Final Report on Water Quality Management Plan for Ganga RiverVolume IV-4, Feasibility Study for Varanasi City, Part I, Sewerage Scheme
3-67
Mitigation Measures Water should be sprinkled to avoid the emission of the dust generated from the construction activities. 3) Land Impacts The installation of the proposed pumping stations will not require much land. Therefore, it has very low impact to the natural environment. No significant mitigation measures are necessary.
(3) Sewage Treatment Plant (Construction Phase) The construction impacts for the treatment plant are similar in nature to the impacts for laying sewer lines but they may vary in intensity. The proposed site is in the rural area therefore the impact of setting up the sewage treatment plant in this location would be noticeable. The intensity of the impacts depends on the area to be covered by the treatment plant, which depends in turn on the process and the flow to be treated. Basically the proposed treatment processes are of two extreme types: (i) extensive treatment by lagoons; (ii) intensive conventional treatment. For the lagoon system, huge land area is required for the treatment. For conventional treatment, the land requirement is less for the treatment. The construction impacts are also related to the phasing of the works. In general the impacts will be more intense during the first phase of works because the land use of the site will change radically. Thereafter, when extension works will be executed, some of the construction impacts will affect the area again, but the nature of these impacts will not change. Project activities during construction phase may include demolishing of village houses, uprooting of plants and vegetations, and digging of soil for the construction of ponds. These activities will result in cutting of few trees, dust generation, noise generation by construction equipment, inflow of construction labour, sediment load in construction water, and generation of solid waste in the form of construction spoils. Construction phase activities would have moderate impacts on on-site noise & air quality, land use and ecology. It could also develop minor impacts on on-site soil, water use and water quality. The main impacts of construction phase are loss of village houses, agricultural land and few trees and such impacts are long term. The other impacts of construction phase will be small in magnitude as well as temporary in nature and are expected to wear out gradually once the construction activity is completed. Impacts on various environmental components during construction phase are discussed below along with suitable mitigation measures. The following description is made assuming the selected treatment process of UASB + Facultative Aerated Lagoons + Chlorination at Sathwa Village. However the comparison between the alternative treatment plant processes is presented in Section 3.5.5 of this Chapter. Type of STP : UASB + Facultative Aerated Lagoons + Chlorination Capacity : 200 mld Area required : 41.00 hectares Location : Near Village Sathwa on Varanasi-Azamgarh Road

Final Report on Water Quality Management Plan for Ganga RiverVolume IV-4, Feasibility Study for Varanasi City, Part I, Sewerage Scheme
3-68
1) Soil Quality Impacts • The proposed STP requires a land of nearly 41 ha. Excavation denudes the topsoil as well
as soil up to the depth of the proposed STP and makes it loose. • Destruction of topsoil leads to reduction of fertility and removal of vegetation cover with
associated hazards of soil erosion. • During storms, some of the excavated soil would be blown up in the air and dispersed
around the proposed sites; some would also tend to be compacted into the soil and clog intergranular spaces.
Mitigation Measures • Appropriate measures like plantation wherever needed in the neighbourhood of the
proposed site should be undertaken to appease the chances of soil erosion. • Earth materials should be stored in covered godowns or enclosed spaces. 2) Land Use Impacts • Preparatory activities like construction of access roads, temporary offices, quarters, etc.
will be confined within the proposed site. These will not generally exercise any significant impact except altering the land use pattern of the proposed STP site. There will be no impact on the adjoining land.
• The land, which is mostly private agricultural land, has to be acquired and to be diverted from its present use for creation of the proposed STP. As a result the impact on land use would have some significance and any impact due to construction will be confined within the boundary limits of the project area and will not hamper the land use aspects outside. However, indirectly there may be some change in the land use pattern of the proximate area due to influx of construction work force and suppliers who are likely to construct temporary tents in the vicinity.
Mitigation Measures • Construction camp should be provided for construction personnel to avoid indiscriminate
settlement of construction labourers. • The excavated material should be disposed of in suitable pre-identified areas. • Appropriate earthwork suppression measures should be implemented within the project
site during construction of the proposed wastewater treatment plant. • Appropriate compensatory plantation should be initiated to make up loss of trees and
vegetation due to the proposed project. 3) Hydrology and Water Use
Impacts As the proposed site of the project does not have any rivers or canals, no impact on hydrological regime is envisaged. Only the drainage pattern of overland water flow of the project sites may be changed due to alteration of the existing profile and slope of the land. Mitigation Measures • The water demand during construction of the proposed STP should be met from such
water sources, which is not likely to have impacts on other users.
4) Water Quality
Final Report on Water Quality Management Plan for Ganga RiverVolume IV-4, Feasibility Study for Varanasi City, Part I, Sewerage Scheme
3-69
Impacts • Water will be used in the construction process of the STP, of which some portion will
drain out as wastewater. Wastewater from construction activities would mostly contain suspended impurities. Other pollutants, which may find their way to it, will be in insignificant concentrations and may be safely disregarded.
• The deterioration of water quality during construction phase is expected due to wastewater disposal from the workers camp and sullage generated from construction sites. If adequate arrangements are not made to ensure proper drainage of wastewater from the construction sites, such waters may form stagnant pools and aggravate soil erosion. Stagnant pools of water promote breeding of mosquitoes and generally create unsanitary conditions.
Mitigation Measures • The construction activities/erosion should be limited to small area. • Drains from proposed construction sites should be led to sedimentation pits where excess
suspended solids will be settled out and relatively clear supernatant will be discharged into existing surface water drains.
• Proper sanitation facilities should be provided at the construction site.
5) Air Quality Impacts • Particulate matter would be the predominant pollutants affecting the air quality during the
construction phase. The soil of the project area is likely to generate considerable quantity of dust, especially during dry conditions. Dust will be generated mainly during excavation operations along with transportational activities and open storage of fine earth material. However, wind in the area generally being low to medium, wind blown dust is not expected to have tangible effects.
• Mostly the automobile traffic and construction machineries will generate undesirable gaseous pollutants. However, this would not lead to any tangible effect, as the expected traffic volume is low.
Mitigation Measures • Earth material should be stored in enclosed spaces. • To reduce fugitive dust emission at project site due to vehicular movement and material
transportation sprinkling of water should be undertaken wherever unpaved haul roads pass through habitation.
• Regular inspection of construction site should be carried out to ensure regular and timely removal of construction debris to the dumping sites.
• The quantity of earth generated from cuttings should be used to the maximum possible extent during site development.
• Low emission construction vehicles and generator sets should be used. • It should be ensured that all the vehicles plying during construction are properly tuned
and maintained to keep emissions within the permissible limits.
6) Noise Quality Impacts • During the construction phase, noise will be generated due to movement of vehicles, and
operation of light & heavy construction machineries including pneumatic tools (bull dozers, scrapers, concrete mixers, generators, pumps, vibrators, cranes, compressors, etc.) that are known to emit sounds with moderate to high decibel value.
• Noise generated from sources mentioned above will be intermittent and of short duration

Final Report on Water Quality Management Plan for Ganga RiverVolume IV-4, Feasibility Study for Varanasi City, Part I, Sewerage Scheme
3-70
mostly during daytime. Therefore, no significant impact is anticipated on account of noise generation around the project site. However, the workers are likely to be exposed to high noise levels that may affect them.
Mitigation Measures • Careful planning of the operation of construction equipment is required during this period
so that minimum disturbances are caused. • Construction camp should be located away from the construction sites. • Impacts of noise on construction workers should be minimized through adoption of
adequate protective measures in the form of (a) use of personal protective equipment (ear plugs, ear muffs, noise helmets etc.), (b) education and public awareness, and (c) exposure control through the rotation of work assignments in the intense noise (above 90 dBA for 8-hr exposure as per Factories Act) areas.
• Low noise construction equipment should be used. • It should be ensured that all the equipments used during construction are properly
maintained to keep noise within the permissible limits. • Construction machinery should be in good working condition and engines turned off
when not in use.
7) Ecology
Impacts • The impact of construction activities will be primarily confined to the proposed project
site. The site is presently in use as agricultural land and has some trees. The site does not involve any forestland. Thus, the site development works will not lead to any significant loss of any important taxa.
• A few species of common birds and animals are sited in and around the proposed site area. As the proposed site of the STP covers this area, there will be some impact on the inhabitation of fauna.
• As the water quality of the surface water bodies is not likely to change due to the construction activities, no impact on the aquatic life is expected.
Mitigation Measures • Plantation in the available balance open spaces is proposed to be implemented. • More valuable tree species could be planted in place of existing tree species of the project
area under plantation & landscaping programme.
8) Visual Impacts
Impacts The visual impacts at the construction site of the treatment plant will be unaesthetics. The dumping of construction materials will not look any better. Extensive movement of vehicles with badly maintained engines will generate smoke all around the site. The dust at the site will be carried over to nearby areas in windy or stormy weather conditions. Broken pavements and opened roads would add up giving an unaesthetic look to the construction site. However, the impact will be temporary and localised. Mitigation Measures To minimize visual impacts and landscape change, plantation of trees in surrounding area of the STP site is recommended.
9) Spoil and Soil Disposal
Impacts

Final Report on Water Quality Management Plan for Ganga RiverVolume IV-4, Feasibility Study for Varanasi City, Part I, Sewerage Scheme
3-71
The spoil will be generated during construction of the treatment plant by way of rejected plant materials, bushes during site clearing, excess earth, etc. Solid waste from the proposed plant during construction stage will be mainly earthwork and rubble. Mitigation Measures The spoil will have to be disposed of in a proper manner at the pre-identified safe disposal sites. Suitable dumping sites will have to be identified near the proposed treatment plant location for any of the options. If not disposed of in an environmentally compatible manner, it will create minor adverse impacts in the surrounding area. The excavated soil may be used for two distinct purposes: • The soil could be provided to the farmers, so that they can fill their low lands. • The excavated soil could be sold to the contractors for the construction of road
embankments. 10) Land Acquisition
Impacts The land requirement (41.0 ha) is of substantial amount, equivalent of a square area of 640 m x 640 m. The land falls on the right side of the canal (which remains dry almost through the year except monsoon) that crosses the Varanasi-Azamgarh road after the village Rajnahiya and is situated at about 1.8 km south from the irrigation canal where the treated wastewater is to be discharged. The location of proposed Sathwa STP site is shown in Figure 3.3 and the proposed layout of Sathwa STP is in Figure 3.7.
As per the original proposal, the settlement of 1 village (Rajnahiya) will be partly affected by land acquisition.

Final Report on Water Quality Management Plan for Ganga RiverVolume IV-4, Feasibility Study for Varanasi City, Part I, Sewerage Scheme
3-72
Figure 3.7 Proposed Layout of Sathwa Sewage Treatment Plant
Mitigation Measures • Minimization or avoidance of village displacement The original layout plan of Sathwa STP requires part displacement of 1 village. However, the revised layout plan (Figure 3.8) can avoid displacement of the village but would require agricultural land. The impact of both layouts is compared in Table 3.39.
Table 3.39 Comparison of the Impact for Two Proposed Layouts
Land owner (HH) Resettlement
(HH) Rajnahiya Goithahan Layout (Figure 3.7) 17 51 76
Revised Layout (Figure 3.8) 0 15 149
Required Displacement Area
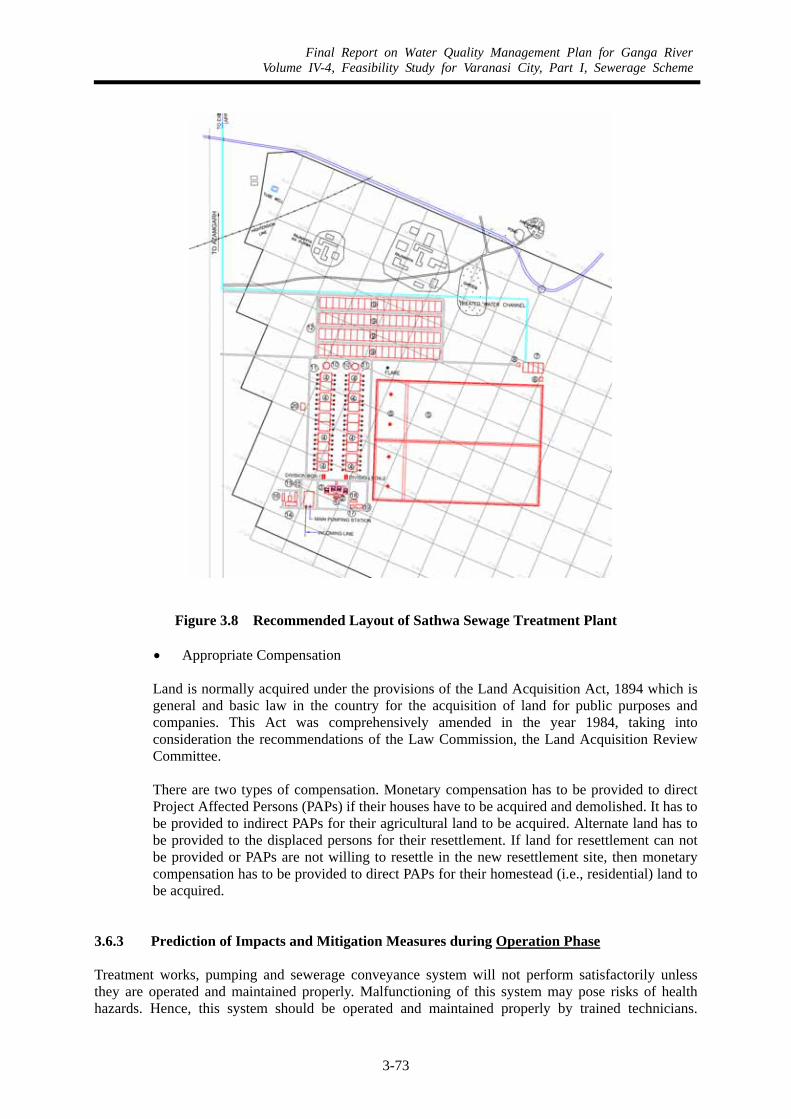
Final Report on Water Quality Management Plan for Ganga RiverVolume IV-4, Feasibility Study for Varanasi City, Part I, Sewerage Scheme
3-73
Figure 3.8 Recommended Layout of Sathwa Sewage Treatment Plant
• Appropriate Compensation
Land is normally acquired under the provisions of the Land Acquisition Act, 1894 which is general and basic law in the country for the acquisition of land for public purposes and companies. This Act was comprehensively amended in the year 1984, taking into consideration the recommendations of the Law Commission, the Land Acquisition Review Committee. There are two types of compensation. Monetary compensation has to be provided to direct Project Affected Persons (PAPs) if their houses have to be acquired and demolished. It has to be provided to indirect PAPs for their agricultural land to be acquired. Alternate land has to be provided to the displaced persons for their resettlement. If land for resettlement can not be provided or PAPs are not willing to resettle in the new resettlement site, then monetary compensation has to be provided to direct PAPs for their homestead (i.e., residential) land to be acquired.
3.6.3 Prediction of Impacts and Mitigation Measures during Operation Phase Treatment works, pumping and sewerage conveyance system will not perform satisfactorily unless they are operated and maintained properly. Malfunctioning of this system may pose risks of health hazards. Hence, this system should be operated and maintained properly by trained technicians.

Final Report on Water Quality Management Plan for Ganga RiverVolume IV-4, Feasibility Study for Varanasi City, Part I, Sewerage Scheme
3-74
Following preventive measures should be adopted:
• Provision of adequate sewer cleaning and evacuating machines • Provision of generator sets at pumping stations • All spare parts should be readily available in case of emergency • Provision of standby units of pumps at each station • Provision of adequate maintenance staff with accessories • Regular training of system staff, skilled technicians and craftsman • Proper operating budgets and attractive salaries
The impacts of sewer lines, pumping stations and STPs are described below with proper mitigation measures. (1) Sewer Lines (Operational Phase)
1) Soil & Water Quality Impacts Blockages in the sewer lines due to inappropriate maintenance may lead to profuse leakage and occasional overflow from manholes. This results in impacts as identified below: • On soil quality by contaminating the same and disturbing the soil stability leading to
settlement • On water supply through intrusion of contaminants into system • On aesthetic environment due to fly, mosquito and odour nuisance. Mitigation Measures and Recommendations In order to avoid above adverse impacts, following precautionary measures are already envisaged in development plan: • Sewer pipes will be laid away from the water supply lines and at a greater depth • Minimum vertical separation from water supply line will be 0.5m and horizontal distance
of 3.0m. • Leakage problem would be localized and will be readily dealt with by practising adequate
maintenance measures like inspection, detection, cleaning and repairing. 2) Sewer Lines Impacts Sewer overflows might occur during operation phase. Mitigation Measures and Recommendations To avoid sewer overflows, following mitigation measures should be adopted: • Regular cleaning of sewers (removal of blockages, debris, rags, etc.) • Proper access arrangement to mechanical and electrical equipment • Routine inspections of sewers for illegal connections and obstructions • Mechanical equipments should be regularly checked for deterioration, wear of critical
parts and security of fixings • Provision of spare parts • Public awareness to prevent the disposal of solid wastes in sewers • Sewer lines should be inspected regularly to detect any malfunctioning, chocking, leakage
and other defects. • Manhole covers should have a minimum 600mm dia. clear opening for entry.
Final Report on Water Quality Management Plan for Ganga RiverVolume IV-4, Feasibility Study for Varanasi City, Part I, Sewerage Scheme
3-75
• It should be checked regularly for soundness and security. • Each time a manhole cover is opened, it should be cleaned, inspected and greased, if
necessary. • Manhole shaft, landings and benching should be inspected for defects such as cracks,
water ingress, corrosion and concrete spilling. • Where surcharging occurs, the manhole shafts should be cleaned down and any build-up
of grease, sewage solids or rags removed. • Trained work gangs should carry out routine operation and maintenance of sewerage
network and rectification works taken up expeditiously.
3) Occupational Health of Workers
Impacts Likely impacts on occupational health of workers during operation phase are due to accidents caused by: • In deep trenching operations • Accumulation of gases in sewers and other confined spaces • Contact with wastewater during repair/maintenance Mitigation Measures and Recommendations The impacts on occupational health of the workers can be avoided by adopting the mitigation measures as given below: • Regular safety education and training for system staff • Workers should be provided with adequate protective clothing, gloves, footwear (safety
boots, gumboots) and safety goggles for handling sewage and its bi-products. • Provision of providing laundry services for the personnel when employed in operation
and maintenance of sewer system and treatment plant • Provision of safety equipment (gas detection equipment, self-contained breathing
apparatus, safety harnesses) • Designing facilities, which provide for worker’s safety (lifting equipment, access
manholes, ladders, walkways, safety around rotating mechanical equipment) • Implementation of effective industrial waste pre-treatment system through enforcement of
adequate regulations • Training of operators in hygiene after handling sewage or working in sewerage system • Training of operators about safety procedures for working in confined places (sewers,
manholes, pump station, wet and dry wells, screw chambers at pumping stations) • Periodic health check-up of workers as they will be exposed to toxic and flammable gases
(e.g. hydrogen sulphide or rotten egg gas, methane and air mixtures) • Public awareness programmes should be conducted to generate awareness regarding
serious hazards of insanitary living conditions, measures and modes for following proper sanitary methods. Such awareness programmes will generate participatory feeling among the public and will benefit the process of maintenance as well as encourage residents to opt for house connections instead of continuing with existing hazardous on-site facilities.
• Proper restriction and legislation should be applied to prevent the entry of unwanted materials along with the sewage from the houses. To ensure it properly, fines, charges, taxes, etc. should levied. In addition, public awareness should also be enhanced by conducting different types of study-awareness programmes.
(2) Pumping Stations (Operational Phase) Impacts
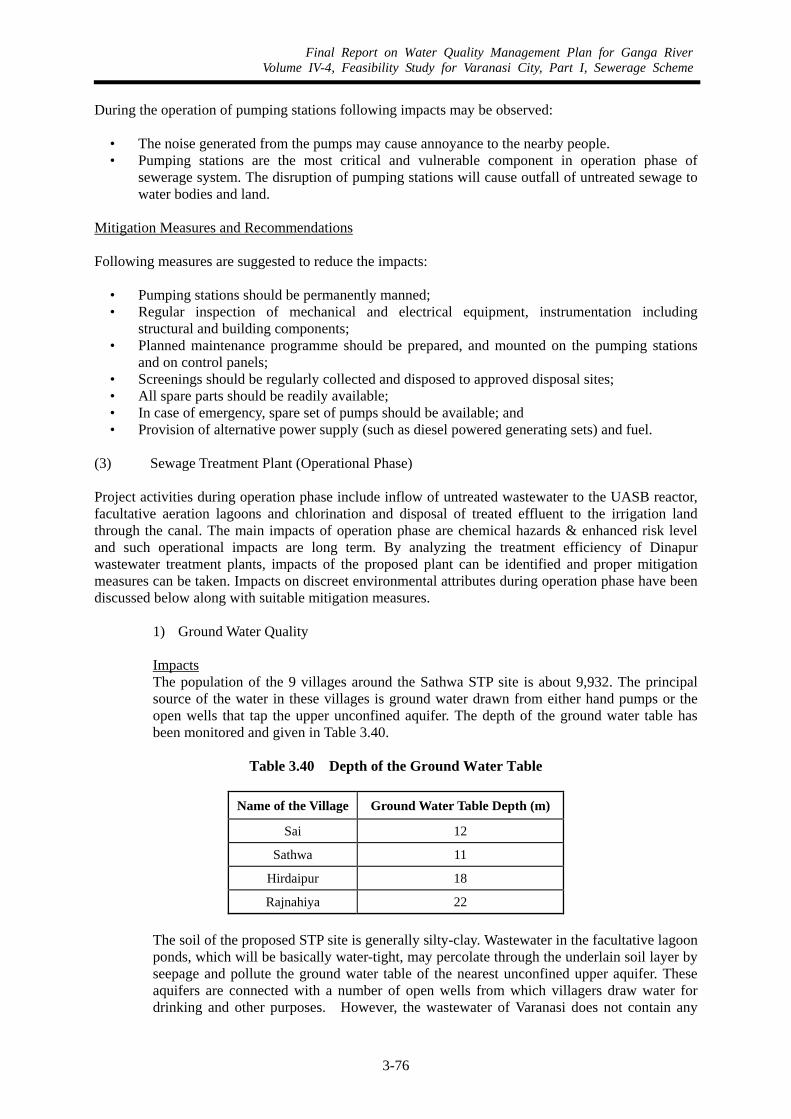
Final Report on Water Quality Management Plan for Ganga RiverVolume IV-4, Feasibility Study for Varanasi City, Part I, Sewerage Scheme
3-76
During the operation of pumping stations following impacts may be observed:
• The noise generated from the pumps may cause annoyance to the nearby people. • Pumping stations are the most critical and vulnerable component in operation phase of
sewerage system. The disruption of pumping stations will cause outfall of untreated sewage to water bodies and land.
Mitigation Measures and Recommendations Following measures are suggested to reduce the impacts:
• Pumping stations should be permanently manned; • Regular inspection of mechanical and electrical equipment, instrumentation including
structural and building components; • Planned maintenance programme should be prepared, and mounted on the pumping stations
and on control panels; • Screenings should be regularly collected and disposed to approved disposal sites; • All spare parts should be readily available; • In case of emergency, spare set of pumps should be available; and • Provision of alternative power supply (such as diesel powered generating sets) and fuel.
(3) Sewage Treatment Plant (Operational Phase) Project activities during operation phase include inflow of untreated wastewater to the UASB reactor, facultative aeration lagoons and chlorination and disposal of treated effluent to the irrigation land through the canal. The main impacts of operation phase are chemical hazards & enhanced risk level and such operational impacts are long term. By analyzing the treatment efficiency of Dinapur wastewater treatment plants, impacts of the proposed plant can be identified and proper mitigation measures can be taken. Impacts on discreet environmental attributes during operation phase have been discussed below along with suitable mitigation measures.
1) Ground Water Quality Impacts The population of the 9 villages around the Sathwa STP site is about 9,932. The principal source of the water in these villages is ground water drawn from either hand pumps or the open wells that tap the upper unconfined aquifer. The depth of the ground water table has been monitored and given in Table 3.40.
Table 3.40 Depth of the Ground Water Table
Name of the Village Ground Water Table Depth (m)
Sai 12
Sathwa 11
Hirdaipur 18
Rajnahiya 22 The soil of the proposed STP site is generally silty-clay. Wastewater in the facultative lagoon ponds, which will be basically water-tight, may percolate through the underlain soil layer by seepage and pollute the ground water table of the nearest unconfined upper aquifer. These aquifers are connected with a number of open wells from which villagers draw water for drinking and other purposes. However, the wastewater of Varanasi does not contain any
Final Report on Water Quality Management Plan for Ganga RiverVolume IV-4, Feasibility Study for Varanasi City, Part I, Sewerage Scheme
3-77
appreciable level of toxic heavy metals (e.g., Hg, Cr, Cd, Pb, As etc.). Therefore, chance of groundwater contamination due to toxic heavy metals is remote. Existing Dinapur STP is not equipped with any treatment process for reducing the number of bacteria such as maturation pond or chlorination. Bacterial contamination in aquifer in the villages surrounding existing Dinapur STP has been reported due to seepage of treated water from irrigation canal. It is proposed that chlorination facility will be installed in Sathwa STP and therefore any bacterial contamination should not occur. In addition, aerated lagoons and treated water channel will be lined with waterproof material to avoid seepage of wastewater from the lagoons or treated water from the channel into groundwater. Mitigation Measures and Recommendations First and foremost, care should be taken to ensure adequate treatment to meet the discharge standards. It has been planned that the aerated lagoons and treated water channel will be lined with waterproof material to avoid seepage of wastewater into the soil and thus prevent contamination of ground water. It has also been planned that chlorination facility will be installed in proposed Sathwa STP and existing Dinapur STP and therefore any bacterial contamination should not occur in the irrigation canal and through land application of treated effluent. If the STP is well functioned and wastewater is appropriately treated, the groundwater in the aquifer has remote possibility of any contamination. Removal of pathogens is the prime objective in treating wastewater for re-use. In addition, the wastewater of Varanasi does not contain any appreciable level of toxic heavy metals (e.g., Hg, Cr, Cd, Pb, As etc.). Therefore, chance of groundwater contamination due to toxic heavy metals is remote. 2) Noise Quality
Impacts There will be no such significant machine/industrial noise during operation of the project. The movement of few cars in the area and blowing of their horns would contribute to the machinery noise. However, neither its sound intensity nor its duration is expected to be large enough to cause significant impact. Residential areas are quite far away. This would imply that no impact of such noise is likely to be felt by the local people. Mitigation Measures and Recommendations There is no such requirement for mitigation for noise environment. 3) Treated Effluent Use
Impacts Over all, the impact of the wastewater treatment on the receiving water bodies will be positive, as no wastewater will be discharged untreated into natural drains any more. The impact may also be highly positive for crop irrigation. The treated effluent from the proposed STP will be discharged to the irrigation land of the adjoining area. This effluent would be rich in phosphates and nitrates. The fertility of the

Final Report on Water Quality Management Plan for Ganga RiverVolume IV-4, Feasibility Study for Varanasi City, Part I, Sewerage Scheme
3-78
agricultural land would increase. This would be a positive impact to the nearby villagers. Quantity of the discharging water The flow characteristics of the irrigation canal and the treated effluent are summarized in the table below. The current flow of the canal is 0.6 m3/sec and the effluent volume discharged from the STP will be 2.3 m3/sec after the project. Thereby, the total flow with the project will be 2.9 m3/sec in the canal. The canal has enough capacity to convey the increased flow since its design capacity is 5.0 m3/sec.
Table 3.41 Canal Design Capacity and STP Effluent Flow
Designed capacity of canal
Present water volume of canal
Effluent volume discharged from STP
Estimated water volume of canal with project
5.0 m3/sec 0.6 m3/sec 2.3 m3/sec (200 mld) 2.9 m3/sec
After the project, the nutrient rich 200 mld effluent can be used for irrigation. This would increase fertile agricultural land by 3,565 ha more as summarized below.
Table 3.42 Cultivated Area Increase With Project
Cultivated area using irrigated water
Cultivated area using non irrigated water Total
Pre- project 930 ha 4,962 ha 5,892 ha Post-project (estimation) 4,495 ha 1,397 ha 5,892 ha
Difference 3,365 ha 3,365 ha 0 ha *Estimation had been made under the condition where every 10ha of cultivated land consumes 0.064m3/sec. (Source: Irrigation Department, Varanasi)
Basically, irrigation water in the canal is used in the dry season and is not used in the wet season. Even in the dry season some fraction of the canal water may not be used. The unused canal water is finally discharged into the Ganga river at about 15 km downstream of the Varanasi city. The effluent quality of the STP will comply with the national standards and thus no impact is foreseen on the river Ganga. In addition, the canal joins the Ganga river at the downstream of the Varanasi city and there is no major city within 100 km after the joining so that no impact would be foreseen.
Quality of the discharging water The volume that will be discharged from the STP is almost 4 times larger than the existing canal flow. Therefore, quality of canal water after the project is implemented will be dominated by the quality of treated water from the STP. So as long as wastewater is treated properly in the STP, the impact for canal is positive for irrigation use. However, since it has been designed for use for agricultural irrigation, the project has to be aware of following impacts that might be brought by the water discharged from the STP.
i) Direct impact of the water If the treated effluent contains large concentration of inorganic salts or the metals, it would eventually lead to stunted growth of the crops that are irrigated using this effluent.
ii) Indirect impact from the soil
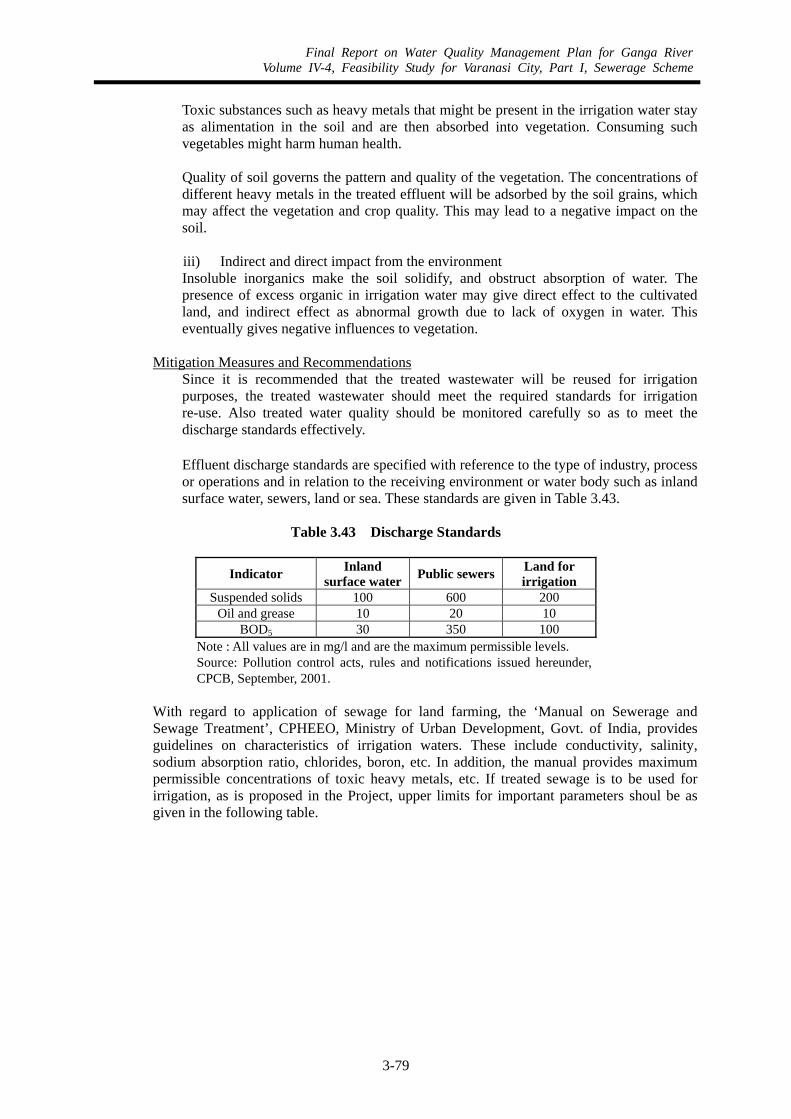
Final Report on Water Quality Management Plan for Ganga RiverVolume IV-4, Feasibility Study for Varanasi City, Part I, Sewerage Scheme
3-79
Toxic substances such as heavy metals that might be present in the irrigation water stay as alimentation in the soil and are then absorbed into vegetation. Consuming such vegetables might harm human health.
Quality of soil governs the pattern and quality of the vegetation. The concentrations of different heavy metals in the treated effluent will be adsorbed by the soil grains, which may affect the vegetation and crop quality. This may lead to a negative impact on the soil.
iii) Indirect and direct impact from the environment Insoluble inorganics make the soil solidify, and obstruct absorption of water. The presence of excess organic in irrigation water may give direct effect to the cultivated land, and indirect effect as abnormal growth due to lack of oxygen in water. This eventually gives negative influences to vegetation.
Mitigation Measures and Recommendations
Since it is recommended that the treated wastewater will be reused for irrigation purposes, the treated wastewater should meet the required standards for irrigation re-use. Also treated water quality should be monitored carefully so as to meet the discharge standards effectively. Effluent discharge standards are specified with reference to the type of industry, process or operations and in relation to the receiving environment or water body such as inland surface water, sewers, land or sea. These standards are given in Table 3.43.
Table 3.43 Discharge Standards
Indicator Inland surface water Public sewers Land for
irrigation Suspended solids 100 600 200
Oil and grease 10 20 10 BOD5 30 350 100
Note : All values are in mg/l and are the maximum permissible levels. Source: Pollution control acts, rules and notifications issued hereunder, CPCB, September, 2001.
With regard to application of sewage for land farming, the ‘Manual on Sewerage and Sewage Treatment’, CPHEEO, Ministry of Urban Development, Govt. of India, provides guidelines on characteristics of irrigation waters. These include conductivity, salinity, sodium absorption ratio, chlorides, boron, etc. In addition, the manual provides maximum permissible concentrations of toxic heavy metals, etc. If treated sewage is to be used for irrigation, as is proposed in the Project, upper limits for important parameters shoul be as given in the following table.

Final Report on Water Quality Management Plan for Ganga RiverVolume IV-4, Feasibility Study for Varanasi City, Part I, Sewerage Scheme
3-80
Table 3.44 Treated Water Quality for Irrigation
Parameter Unit Limits
BOD5 mg/l 100 Suspended Solids mg/l 200 Dissolved Solids mg/l 2100
pH 5.5-9.0 Oil & Grease mg/l 10
Arsenic mg/l 0.2 Boron mg/l 2.0
Cyanide mg/l 0.2 Chloride mg/l 600 Sulphate mg/l 1000
Source : CPCB, Standards for discharge of Industrial /Domestic wastewater
4) Sludge Production and Disposal Impacts The sludge production will be to the tune of several tens t/day from the sewage treatment plant. It will be dried on the sludge drying beds. During the drying process, there will be a nuisance of insects around the sludge drying beds. It can be minimised by spraying insecticides in the area, also by proper maintenance of sludge drying beds, and proper drainage. The wet sludge should be raked often and the dried sludge removed frequently. The dried sludge can be given or sold to farmers as manure if it can be handled properly by them. The value of sludge as an organic fertiliser has long been recognised and this offers reduced fertiliser costs to the farmer. Monitoring of the quality of the sludge is however required, especially the monitoring of the heavy metals. The sludge should also not contain non-degradable materials. Movement of sludge tankers from sewage treatment plant to agricultural land can create traffic problems and give rise to noise and odour nuisance. Mode of transport should be appropriate and routes chosen so as to minimize inconvenience to the public. Odour control is also required. It is preferable to use enclosed tankers for transporting sludge. Besides the use of sludge as fertilizer, the dry sludge can also be disposed of in specified landfill sites. In general the two options are applied. Codisposal of sludge with domestic waste is acceptable. When carrying out the detailed design of the treatment plant, a sludge disposal plan must be prepared whose objectives are: (i) to identify the land where the sludge can be disposed of, (ii) to define the frequency of land application and (iii) the quantity of sludge to be applied each time. The area where the sludge will have to be stored must also be defined. The sludge disposal plan should also take into account the type of crops and the soil characteristics.
Mitigation Measures and Recommendations The sludge from the treatment plant should be disposed of in an environmentally acceptable manner. The sludge should be dewatered in sludge drying beds and the dried sludge be used as fertilizers in the nearby irrigation land since it is biological in nature and has soil quality enhancing properties. Nuisance of insects can be minimized by spraying insecticides on sludge drying beds, also by proper maintenance of sludge drying beds and proper drainage. The following
Final Report on Water Quality Management Plan for Ganga RiverVolume IV-4, Feasibility Study for Varanasi City, Part I, Sewerage Scheme
3-81
precautions should be taken in the treatment, handling and disposal of the sludge:
(i) to rake the wet sludge frequently and remove dried sludge immediately and frequently,
(ii) to facilitate proper drainage to avoid stagnant water leading to mosquito breeding, (iii) to store the dry sludge in a covered place before its distribution to farmers, (iv) to develop a green belt all around treatment plant, especially around sludge drying
beds to reduce odour nuisance, (v) to take care that the operators handling the sludge are properly clothed with gloves
and gum boots and will not handle the sludge with bare hands. Monitoring of the quality of the sludge is required, especially the monitoring of the presence of heavy metals in the sludge. The sludge should not contain non-degradable materials. The effectiveness of the sludge production for agricultural/vegetation use is not constant to any crops. Use of the sludge production in the region must be done with soil observation of its effect to avoid negative effects to crops. After the observation period, recommended method of the use should be established and the local farmer be educated. The paramenters that should be monitored are Zinc, Copper, Total Carbon, Total Nitrogen, Phosphates and pH. Use of the sludge must be done strictly under the continuous monitoring of sludge contents especially with respect to toxic substances. 5) Odour Production Impacts There is a possibility of bad smell in the case of anaerobic UASB and aerated lagoons proposed. However, the impact will be lower since the plant is located outside the residential areas of Varanasi city. Mitigation Measures and Recommendations As stated above, the following mitigation measures should be taken to minimize odour problems although the impact is minimal because the STP is not located in urban area.
(i) to rake the wet sludge frequently and remove dried sludge immediately and frequently (ii) to develop a green belt all around treatment plant, especially around sludge drying beds
to reduce odour nuisance 6) Worker’s and Public Health Impacts Even though the sewage treatment plant will be useful to improve the health of the citizens, it may not be so in regard to the health of the workers who are operating the plant. In the operation phase of the sewage treatment plant, care needs to be taken for the workers’ health. The workers may suffer from diseases like, malaria and respiratory diseases. The impact on their health would be adverse and significant. The workers should be provided with safety equipments for safe handling of the sewage treatment plant - sewage and sludge - and must be instructed in their use. This will reduce the chances of adverse health effects on the workers during plant operations. Adequate medical help should also be provided. Similarly, the farmers will also have to be protected against infections, and to handle the sludge, special equipments should be made available and they should be educated on how to use these equipments.
Final Report on Water Quality Management Plan for Ganga RiverVolume IV-4, Feasibility Study for Varanasi City, Part I, Sewerage Scheme
3-82
Sewage sickness can be encountered in the use of raw or settled sewage but this negative effect is considerably reduced when an appropriate treatment is proposed for irrigation re-use. Mitigation Measures and Recommendations The workers’ health should be monitored with medical check-ups at the time of joining and thereafter annually. In between, in case of any complaints, respiratory ailments, accidental chlorine leakage, etc., medical check-up should be conducted.
All the workers should be trained in first aid practices and emergency medical help should be available round the clock. It is also recommended from the safety point of view that one officer of the managerial cadre is available on duty at all times.
3.6.4 Risk Analysis and Mitigation Plan (1) General The sewerage project comprises of sewer laying, construction of sewage pumping stations and treatment plant and their operation. The risk involved in laying the sewers is mainly for large diameter pipelines, which require lifting by cranes. The risk of mechanical equipment failure and thereby occurrence of accidents cannot be overlooked. Contingency measures/plans shall be prepared for:
(i) sewage treatment plant and pumping stations that could reasonably be expected to cause significant environmental impacts as a consequence of operational disruption (i.e. maintenance, etc. or breakdown);
(ii) accidents which may occur while laying sewers or during construction of the treatment works;
(iii) discharge of sub-standard wastewater into the environment from treatment plant which could cause a significant public health impact, and which therefore requires a continuous system of influent/effluent monitoring to identify potential problems as and when they arise.
In the preparation of the contingency measures: the most likely causes of process disruption/breakdown have been identified; an attempt has been made to estimate their probability of occurrence; the possible resultant environmental adverse impacts are presented; the recommended courses of action to minimise the severity of the impacts has been highlighted; the responsible agency who will act in case of emergencies has been indicated.
The major risks, which can result in breakdowns and disruptions, are described below. (2) Power Supply One of the main reasons for disruption during the operation phase of the treatment plant and pumping stations is energy shortage. It is suggested that standby power generators and fuel are provided to ensure at least minimum services in case of power cuts. (3) Electrical & Mechanical Equipment Disruptions Operational disruption due to E&M equipment can be avoided by spare parts and stand-by provision available at site.
Final Report on Water Quality Management Plan for Ganga RiverVolume IV-4, Feasibility Study for Varanasi City, Part I, Sewerage Scheme
3-83
O&M instructions and manuals should be provided by the contractor of the treatment plant with training to the operation staff for the new plant. 3.7 ENVIRONMENTAL MANAGEMENT PLAN 3.7.1 Environmental Mitigation Plan Environmental Management Plan (EMP) is the key to ensure a safe and clean environment. A plant/project may have taken proper pollution control measures but without a management plan to assure its proper function, the desired results may not be obtained. The present section on Environment Management Plan envisages the management plan, which is going to be adopted for the Project for the proper implementation of mitigation measures to reduce the adverse impacts arising out of the project activities. The following issues have been addressed in the EMP: • Mitigatory measures for abatement of the undesirable impacts caused during the construction and
operation stage • Details of management plan • Institutional set up identified/recommended for implementation of the EMP • Post project environmental monitoring programme to be undertaken after commissioning of the
project • Expenditures on environmental protection measures. 3.7.2 Mitigatory Measures The major impacts due to different project activities and their mitigation measures have been identified in the previous sections. These measures together constitute part of Environmental Management Plan (EMP). The environmental mitigation measures for construction and operation phases have been given below: (1) During Construction The impacts of the construction phase on the environment would be basically of transient nature and are expected to wear out gradually on completion of the construction programme. However, once the construction of the project is completed and its operation started, the operation stage impacts would overlap the impacts due to the construction activities. The impacts in different aspects of environment due to the construction programmes have been elucidated earlier. In order to mitigate such impacts and restrict them within tolerable levels, the following measures shall be adopted:
• Proper and prior planning of approach and access roads, and appropriate sequencing and scheduling of all major construction activities
• Identification of infrastructural supports needed for the construction programme and ensuring their timely availability
• Adoption of appropriate soil conservation programme and its timely implementation at proposed sites
• Dust suppression measures such as regular sprinkling of water around vulnerable areas of the proposed construction sites from tankers or through installation of water sprinklers or any other suitable methods, to control fugitive dust during construction material handling/over hauling activities for proposed treatment plant
• Stringent construction material handling/overhauling procedures • Control on construction wastewater within the construction area through suitable drainage
system with traps for arresting the sediment load for its proposed disposal into the main natural

Final Report on Water Quality Management Plan for Ganga RiverVolume IV-4, Feasibility Study for Varanasi City, Part I, Sewerage Scheme
3-84
drainage system around the site • Implementation of suitable disposal methods of sediment/construction debris in tune with the
local conditions to avoid water logging at construction site • Adequate safety measures complying with the occupational safety manuals to prevent
accidents/hazards to the construction workers • Provision of protective gears such as ear mufflers, etc. for construction personnel exposed to
high noise levels and locating the temporary labour sheds for housing the construction labourers away from the construction site
• Provision of construction camps/housing facilities at designated and demarcated sites for all construction workers with the following amenities to meet requirements of the construction personnel:
a) Adequate potable water supply b) Sanitary facilities such as dry pit latrines c) Solid waste collection and disposal system d) Primary health facilities at construction site e) Electrification and fuel for cooking
• Disposal of construction debris at designated place (2) During Operation The following environmental protection/mitigation measures shall be adopted during the operation stage of the project:
• Proper operation & maintenance of the STPs to adequately treat the wastewater to meet the effluent standards
• Proper disposal at appropriate place of solid wastes arrested in screen chamber of pumping stations & STPs to control pollution due to solid wastes
• Monitoring the waste water and treated wastewater quality • Adequate safety measures complying with the occupational safety manuals to prevent
accidents/hazards to the workers • Providing suitable human management and stable working conditions in order to alleviate
socio-economic unrest • Undertaking all necessary pollution control measures to maintain the discharges within the
prescribed/stipulated limits • Maintaining tree plantations around the pumping stations and the periphery of the sewage
treatment plant. 3.7.3 Environmental Management, Monitoring Plan, and Training (1) Institutional Set Up
1) Key Players for Implementation of EMP Varanasi Nagar Nigam/Jal Sansthan and Uttar Pradesh Jal Nigam (UPJN) would take care of proper operation and maintenance of the proposed treatment plant. Ministry of Environment & Forests (MoEF), and State Pollution Control Board, Govt. of Uttar Pradesh, would help for sorting out various environmental issues arising out of the different project activities. The problems arising out of the construction sites and labour camps are to be controlled by construction contractors. This includes provision of fuel wood to labourers and provision of proper sanitation facilities at the project site.

Final Report on Water Quality Management Plan for Ganga RiverVolume IV-4, Feasibility Study for Varanasi City, Part I, Sewerage Scheme
3-85
The responsibility of environmental management of the project during operation will lie mainly with Environmental Management Cell (EMC) at site, which will act as a coordinator for environmental matters. 2) Environmental Management Cell The responsibility of environmental management of the project during operation would lie mainly with the Environmental Management Cell (EMC) at site, which would act as a coordinator for environmental matters and supervise the proper implementation of the EMP. This cell will act as a nodal agency for various groups at Project and Head Quarters as well as outside agencies like State Pollution Control Board and other Govt. Departments. Functions of EMC:
• Co-ordination with Statutory bodies, various Departments, etc. in the Project activities and with Head Quarters, etc.
• Compliance with Statutory guidelines and Statutory requirements • Obtaining consent letters from the State Pollution Control Board (SPCB) • Post project environmental monitoring in and around the project • Maintenance of environmental database, analysis of environmental data, preparation
of reports, and transmission of reports to Statutory Authorities, Head Quarters, etc. • Interactions for evolving and implementation of modification programmes to
improve the efficiency of pollution control devices/systems. • Environmental appraisal (internal) and environmental audit • Follow-up of compensations • To strengthen the public image in respect of social aspects and maintain good
relationship with community in the vicinity • Organizing environmental trainings, workshops, seminars, etc
A two-member team comprising of a Senior Environmental Scientist of the rank of an Executive Engineer, and a Junior Environmental Scientist of the rank of an Assistant Engineer would operate the cell. The Senior Environmental Scientist will head the EMC as Manager. Senior Environmental Scientist will be responsible for:
• Overall responsibility of proper running of the EMC • Reporting to the Project Director • Environmental assessment and compliance at the project site during construction and
operation stages • Coordination and interaction with SPCB, MoEF and other related Govt.
Departments/Agencies • Procurement of equipment for pollution control & their testing • Water supply and sanitation at the project site • Looking after occupational safety and health aspects in absence of safety officer
Junior Environmental Scientist will be responsible for:
• Testing/monitoring of functions of the pollution control systems • Environmental field monitoring and analysis during construction & operation • Analysis of environmental data and preparation of reports
Regular training programmes will be organised to train up the project staff in various environmental and project related issues. Specialists from various fields of environment, health, and project safety would impart the training. The training would mainly focus on how to handle problem areas.
Final Report on Water Quality Management Plan for Ganga RiverVolume IV-4, Feasibility Study for Varanasi City, Part I, Sewerage Scheme
3-86
The monitoring and analysis of various environmental parameters and safety measures will be carried out as per the guidelines laid down by Government of Uttar Pradesh and Government of India. The EMC, which is part of the project proponent, will regularly monitor the pollution during the construction and operation stages. The State Pollution Control Board (SPCB) will make occasional checks.
(2) Post Project Environmental Monitoring It is imperative that the Project Authorities set up regular monitoring stations to assess the quality of the neighboring environment after the commissioning of the project. An environmental monitoring programme is important as it provides useful information and helps to:
• Verify the predictions on environmental impacts presented in this study, • Assist in detecting the development of any unwanted environmental situation, and thus,
provides opportunities for adopting appropriate control measures, and • Identify the effectiveness of mitigative measures suggested in the EMP.
1) Monitoring Programme After commissioning of the project, post project monitoring of environmental parameters will be carried out at regular intervals. The monitoring programme in different areas of the environment has been based on the findings of the impact assessment studies. The post project monitoring programme including areas, number and locations of monitoring stations, frequency of sampling and parameters to be covered is summarised in Table 3.45 and are elaborated in this section. The monitoring will be the responsibility of EMC. Ambient air quality: Ambient air quality would be monitored for methane and sulphide gases, in order to compare and ensure that the ambient air quality is maintained within the stipulated limits. Effluents: Quality of all effluents from the treatment plant would be monitored on a regular basis and the water quality at the disposal site would be monitored once in a month.

Final Report on Water Quality Management Plan for Ganga RiverVolume IV-4, Feasibility Study for Varanasi City, Part I, Sewerage Scheme
3-87
Table 3.45 Preliminary Post Project Environmental Monitoring Programme
Sr. Parameter Monitoring Location Frequency
1 Air Quality: Methane, Hydrogen sulphide gas
STP at Sathwa and Existing STPs
Three consecutive days in a season for two seasons
2 Effluents: BOD, COD, DO, pH, Heavy metals etc. From effluent discharge points Daily
(Once in a year for heavy metals)
3 Water quality: BOD, COD, DO, Heavy metals, Total coliform, Faecal coliform etc.
At effluent disposal points Daily (Once in a year for heavy metals)
4 Water quality: BOD, COD, DO, Heavy metals, Total coliform, Faecal coliform etc.
In aquifer nearby Sathwa STP and existing STPs Once in a season for two seasons
5 Sludge contents: Heavy metals etc. Sludge Twice in a year
6 Soil quality: Salinity Agricultural land irrigated by effluent from STPs Twice in a year
The post-operational monitoring programme and environmental affairs would be taken care of by a competent person nominated by the Plant Manager. 2) Institutional Set-up for Monitoring
The post operational monitoring programme will be under the supervision of the EMC at the project site. Monitoring can be got carried out by outside recognized laboratories.
(3) Other Related Aspects
1) Compensation The project involves loss of agricultural lands. So proper compensation should be made to the owners of the lands. Compensation for loss of lands during construction of the treatment plant: 100% compensation to be paid for the agricultural & homestead land decided by Competent Authority at the time of construction of the treatment plant. Compensation for demolition of houses during construction of treatment plant (if any): 100% compensation to be paid for houses at the proposed site as decided by Competent Authority at the time of construction of the treatment plant. 2) Legal and Statutory Compliance All the environmental standards/stipulations should be fully complied with. The plant has to obtain yearly Consent from the State Pollution Control Board for liquid and gaseous wastes disposal as per Water (Prevention & Control of Pollution) Act and Air (Prevention & Control of Pollution) Act. It should be supervised that all requirements under these Acts and Rules are met, and if not met, the satisfactory explanations for it are sought. The officer in charge for environmental aspects should prepare these reports. 3) Documentation and Quality Assurance All the monitoring data, environmental and safety & health related, should be stored in systematic manner so that the specific records are easily available whenever required. A quality assurance plan should be developed that includes all reference methods for

Final Report on Water Quality Management Plan for Ganga RiverVolume IV-4, Feasibility Study for Varanasi City, Part I, Sewerage Scheme
3-88
monitoring, relevant analytical techniques, calibration of equipments, standard of reagents, collection and presentation of results, frequency of monitoring, etc. 4) Information Dissemination and Public Relations Everybody nowadays is concerned about environment. It is needed that people should be provided with environmental data related to the plant so that wrong apprehensions can be removed. This requires a well-planned public relations and information dissemination process so that unnecessary public interventions are avoided. This can be done through organizing different programmes with participation from local bodies, encouraging local community in environmental projects (like tree plantation), etc. The Management should be entrusted with all these responsibilities.
(4) Occupational Health & Safety Measures In large projects, where multifarious activities are involved during construction, erection, testing, commissioning, operation & maintenance, the men, materials and machines are the basic inputs. And this may bring several problems for occupational health & safety (OHS). The project planner, therefore, has to properly plan and take the steps to minimize the impacts of accidents to ensure appropriate occupational health & safety. The occupational health problems envisaged in this case in construction stage can mainly be due to noise and accidents. The problems of occupational health, in the operation and maintenance phase are due to accidents. To overcome these hazards following occupation health & safety measures will be undertaken:
• Arrangements will be made to reduce noise levels within limit. • Suitable personnel protective equipment/gears shall be supplied to workers. • First aid facilities will be provided. • Safety training will be provided regularly.
Personnel Protective Equipment: The workers will be given the following suitable personnel protective equipment while working in high noise and hazard prone areas:
1. Industrial safety helmets/Crash helmets 2. Face shield/Welders equipment for eye & face protection 3. Goggles 4. Ear plugs/Ear muffs 5. Gas masks/Breathing apparatus 6. Safety suits 7. Safety belts 8. Hand gloves 9. Gum boots/Safety shoes
Medical Facilities: First aid facilities will be provided to treat the affected people as and when need arises or to shift the injured to the nearby hospitals in case of any trauma. Nearby hospital facilities will also have to be available round the clock for attending emergency arising out of accidents, if any. All working personnel will be medically examined prior to their employment. Safety Officer:

Final Report on Water Quality Management Plan for Ganga RiverVolume IV-4, Feasibility Study for Varanasi City, Part I, Sewerage Scheme
3-89
Every contractor shall employ one safety officer to ensure safety of the workers. The responsibilities of the safety officer shall include identification of the hazardous conditions and unsafe acts of workers and advise on corrective actions, provide safety training to labourers and provide professional expert advice on various issues related to occupational safety & health. The safety officer shuold also see compliance of safety rules/statutory provisions. The contractors will be forced to follow safety rules to ensure safety to all construction workers. (5) Environmental Training The Environmental Monitoring Plan will be successful only if it is implemented by trained and skilled staff. The training of the qualified staff should be necessary not only in day-to-day operation and maintenance of the treatment plants, but also in environmental aspects. National Environmental Engineering Research Institute, NEERI, Nagpur, and Pollution Central Boards conduct training courses for environmental management which will increase the capabilities of the staff in the Environmental Management Cell to execute independent plans for environmental management. The training should include:
1. Basic concepts of pollution control techniques in the various methods of sewage treatment,
2. Operation and maintenance of the sewage treatment plants, 3. Emergency preparedness to handle adverse situations, 4. Principles of wastewater analysis, 5. Other environmental monitoring techniques, 6. Development of green belt and its maintenance, 7. Sewage farming, 8. Communication with farmers and general public.
This training is different from the mandatory training required for operation and maintenance of the sewagewater treatment plants. 3.8 CONCLUSIONS The project will have beneficial impacts in terms of reduction of pollution load in Ganga river in the region with incidental benefits like irrigation by effluent from Sathwa STP, and employment opportunities particularly in the construction stage. Based on the findings of the EIA Study, followings are the possible critical areas for project implementation: • Impact of land acquisition for Sathwa STP site • Impact of operation of STP including reuse of treated water and dried sludge • Impact due to disruption of operation of STPs and PSs (power cut and mechnical and electrical
accident) To properly address these impacts and mitigate and avoid the same, Environmental Management Cell (EMC) shall be set up and a detailed Environmental Management Plan shall be prepared for implementation.

CHAPTER 4
COST ESTIMATION AND IMPLEMENTATION PROGRAMME
Final Report on Water Quality Management Plan for Ganga RiverVolume IV-4, Feasibility Study for Varanasi City, Part I, Sewerage Scheme
4-1
CHAPTER 4 COST ESTIMATION AND IMPLEMENTATION PROGRAMME
4.1 CAPITAL COST ESTIMATION OF THE PRIORITY PROJECTS Cost estimates for various works are worked out on the basis of prevailing Schedule of Rates and market rates. Rates for land acquisition are obtained from Finance and Revenue Department, Govt. of Uttar Pradesh. All the figures are in Rs. Unit prices for the estimate of capital costs are, in principle, derived from the list of prices provided by UPJN. However, prices not provided by UPJN are calculated using Varanasi rates on the basis of Delhi Schedule of Rates taking localities and deflator into account. Furthermore, prices of items such as sewer pipes, reinforcing steel bars, manhole covers and so on that are not found in UPJN Schedule or DSR are obtained by quotation. The following are cost estimation conditions.
1) The rates assumed for major civil works are based on UPJN Schedule of Rates for Varanasi and market rates. • To apply schedule of rates provided by UPJN in principle. • For rates of items not provided by UPJN, to use modified rates based on Delhi Schedule
of Rates. • To use market prices for items not available in (1) and (2).
2) Costing of electrical equipment is based on the price list of standard suppliers. 3) Costing of the pump houses is based on actual quantities worked out from preliminary design. 4) Costing of pumps and motors is based on the price of reputed suppliers, and other facilities
like screens, pipes, valves etc. are based on prevailing market rates. 5) Current market rates have been considered for pipes, reinforcement steel, structural steel and
specialized items like geo-synthetics etc. 6) For STPs based on UASB technology, costs have been calculated on the basis of preliminary
design of process units. 7) Physical contingencies: 5% of capital cost 8) Engineering costs (detailed design (6%) and project management (5%)): 11 % of capital cost 9) Project administration: 5 %, including the cost of "Environment Monitoring Plan", which is
discussed in the section on Environmental Impact Assessment. The capital costs of each component are provided in the relevant Chapters and the abstract of cost estimation is shown in Table 4.1. 4.2 IMPLEMENTATION PROGRAMME In the F/S, a detailed list of the works identified for implementation of the priority projects has been provided. The implementation programme for the priority projects in Varanasi has been prepared considering the following assumptions (Table 4.2).
1) Necessary technical and financial sanctions and inter government agreement (between Japanese Government and Indian Government) shall be finalised within 2005.
2) Process of appointment of Project Management Consultant for the project shall start by August 2005 by NRCD, Ministry of Environment and Forests, Government of India.
3) Appointment of consultants for detailed engineering and preparation of detailed project reports and tender documents for project component shall be completed within 2006.
4) Actual execution of various priority project components shall start from 2007. 5) During execution, various project components shall be executed in parallel. 6) UPJN, Lucknow, will acquire 100 % of the land required for construction of proposed
Final Report on Water Quality Management Plan for Ganga RiverVolume IV-4, Feasibility Study for Varanasi City, Part I, Sewerage Scheme
4-2
sewage treatment plants and pumping stations before the commencement of tendering. 4.3 OPERATION & MAINTENANCE COST ESTIMATION The following is the summary of the basis of preliminary estimation of operation & maintenance (O&M) cost for the proposed sewerage system. (1) Estimation Conditions
1) Sewers and rising mains
• Annual maintenance cost of trunk sewers: @ 0.5% of capital cost (New & Replacement) • Annual maintenance cost of rising mains: @ 0.25% of capital cost • Annual maintenance cost of branch sewers: @ 0.5% of capital cost • Annual operation cost: manpower cost • Manpower cost - As per actual salaries and proposed staff requirement *1 • The capital cost of existing and sanctioned sewers is estimated based on unit cost of
proposed facilities or Master Plan (M/P).
2) Pumping stations
• Power cost (required power) - Rs. 3.25 per unit • Diesel cost (for power cut) - As per market rate • Annual power cost is estimated based on average flow • Maintenance of civil works: @ 1.5% of capital cost of civil works • Maintenance of mechanical & electrical (M&E) works: @ 3% of capital cost of M&E
works • Manpower cost - As per actual salaries and proposed staff requirement *1 • The capital costs of existing and sanctioned PSs are estimated based on unit cost of
proposed facilities or M/P.
3) Treatment plants
• Power cost (required power) - Rs. 3.25 per unit • Gas power generator installed in the STP will be used during power cut • Chemicals – actual cost • Maintenance of civil works @ 1.5% of capital cost of civil works • Maintenance of M&E works @ 3% of capital cost of M&E works • Manpower cost - As per actual salaries and proposed staff requirement *1 • The capital costs of existing and sanctioned STPs are estimated based on unit cost of
proposed facilities or M/P.
Note: *1 The manpower requirement of O&M for sewers, pumping stations and treatment plants for 2015 is proposed in the PART IV of VOLUME IV-4, Institutional Development Programme.
(2) Facilities Considered for O&M Cost Estimation The O&M costs of all facilities including existing, sanctioned and proposed facilities are estimated. (3) Power Supply Conditions The O&M costs in following two cases in terms of power supply conditions are estimated.

Final Report on Water Quality Management Plan for Ganga RiverVolume IV-4, Feasibility Study for Varanasi City, Part I, Sewerage Scheme
4-3
• Operation by power from grid (24 hours a day) • Operation by power from grid (20 hours a day) and diesel (4 hours)
(4) Estimation Results Table 4.3 presents annual O&M costs of all major facilities including existing, sanctioned and proposed facilities for 2015 and the following table summarises annual O&M costs for 2015.
Summary of Annual O&M Costs in 2015 (Varanasi) (1,000 Rs./year)
Facility Case-1 Grid Power Supply
Case-2 Grid Power Supply
Supplemented by Diesel (1) Sewers and Rising Mains 15,825 15,825 (2) Pumping Stations 78,351 138,803 (3) Sewage Treatment Plants 83,205 83,205 Total 177,382 237,834
Note: The O&M cost includes all major existing, sanctioned and proposed facilities.

Con
tinge
ncie
sD
etai
l Des
ign
Supe
rvis
ion
Proj
ect
Adm
inis
trat
ion
5%6%
5%5%
Ass
i Nal
a In
terc
epto
r Se
wer
1) C
onst
ruct
ion
of A
ssi I
nter
cept
or29
6,68
3,00
014
,834
,000
17,8
00,0
0014
,834
,000
14,8
34,0
0035
8,98
5,00
035
8,98
5,00
0
2) C
onst
ruct
ion
of N
akhh
a an
d Sa
mne
Gha
t Int
erce
ptor
28,3
89,0
001,
419,
000
1,70
3,00
01,
419,
000
1,41
9,00
034
,349
,000
34,3
49,0
00
3) C
onst
ruct
ion
of S
econ
dary
Sew
er14
6,70
6,00
07,
335,
000
8,80
2,00
07,
335,
000
7,33
5,00
017
7,51
3,00
017
7,51
3,00
0
Var
una
Riv
er In
terc
epto
r Se
wer
& S
athw
a ST
P Se
wer
0
4) C
onst
ruct
ion
of V
arun
a R
iver
Inte
rcep
tor S
ewer
495,
470,
000
24,7
73,0
0029
,728
,000
24,7
73,0
0024
,773
,000
599,
517,
000
599,
517,
000
5) E
xten
sion
of R
elie
f Tru
nk S
ewer
250,
000,
000
12,5
00,0
0015
,000
,000
12,5
00,0
0012
,500
,000
302,
500,
000
302,
500,
000
6) C
onst
ruct
ion
of S
econ
dary
Sew
er78
,121
,000
3,90
6,00
04,
687,
000
3,90
6,00
03,
906,
000
94,5
26,0
0094
,526
,000
Pum
ping
Sta
tions
0
7) C
onst
ruct
ion
of S
athw
a M
PS22
1,19
7,00
011
,059
,000
13,2
71,0
0011
,059
,000
11,0
59,0
0026
7,64
5,00
026
7,64
5,00
0
8) C
onst
ruct
ion
of C
hauk
agha
t Rig
ht B
ank
SPS
236,
781,
000
11,8
39,0
0014
,206
,000
11,8
39,0
0011
,839
,000
286,
504,
000
12,5
51,0
0029
9,05
5,00
0
9) C
onst
ruct
ion
of C
hauk
agha
t Lef
t Ban
k SP
S45
,015
,000
2,25
0,00
02,
700,
000
2,25
0,00
02,
250,
000
54,4
65,0
004,
967,
000
59,4
32,0
00
10) C
onst
ruct
ion
of N
arok
har N
ala
SPS
51,2
56,0
002,
562,
000
3,07
5,00
02,
562,
000
2,56
2,00
062
,017
,000
3,37
2,00
065
,389
,000
11) C
onst
ruct
ion
of P
ulw
aria
Nal
a SP
S29
,903
,000
1,49
5,00
01,
794,
000
1,49
5,00
01,
495,
000
36,1
82,0
003,
620,
000
39,8
02,0
00
12) C
onst
ruct
ion
of S
arai
ya N
ala
SPS
22,4
78,0
001,
123,
000
1,34
8,00
01,
123,
000
1,12
3,00
027
,195
,000
1,59
2,00
028
,787
,000
Sath
wa
STP
0
13) C
onst
ruct
ion
of S
athw
a ST
P52
2,40
5,00
026
,120
,000
31,3
44,0
0026
,120
,000
26,1
20,0
0063
2,10
9,00
017
2,15
9,00
080
4,26
8,00
014
) Lin
ing
for e
xist
ing
irrig
atio
n ca
nal a
nd tr
eate
d w
ater
chan
nel
135,
800,
000
6,79
0,00
08,
148,
000
6,79
0,00
06,
790,
000
164,
318,
000
164,
318,
000
Old
Tru
nk S
ewer
Reh
abili
tatio
n W
ork
0
15) D
etai
led
Inve
stig
atio
n of
Old
Tru
nk S
ewer
4,31
5,00
021
5,00
025
8,00
021
5,00
021
5,00
05,
218,
000
5,21
8,00
0
16) R
ehab
ilita
tion
Wor
k of
Old
Tru
nk S
ewer
608,
146,
000
30,4
07,0
0036
,488
,000
30,4
07,0
0030
,407
,000
735,
855,
000
735,
855,
000
Gha
t PS
Reh
abili
tatio
n W
orks
0
17) R
ehab
ilita
tion
Wor
k of
Tril
ocha
n G
hat P
S8,
052,
000
402,
000
483,
000
402,
000
402,
000
9,74
1,00
09,
741,
000
18) R
ehab
ilita
tion
Wor
k of
Har
sich
andr
a G
hat P
S4,
959,
000
247,
000
297,
000
247,
000
247,
000
5,99
7,00
05,
997,
000
19) R
ehab
ilita
tion
Wor
k of
Jale
san
Gha
t PS
5,15
3,00
025
7,00
030
9,00
025
7,00
025
7,00
06,
233,
000
6,23
3,00
0
20) R
ehab
ilita
tion
Wor
k of
Dr.
R.P
. Gha
t PS
19,5
06,0
0097
5,00
01,
170,
000
975,
000
975,
000
23,6
01,0
0023
,601
,000
21) R
ehab
ilita
tion
Wor
k of
Man
saro
var G
hat P
S4,
074,
000
203,
000
244,
000
203,
000
203,
000
4,92
7,00
04,
927,
000
Exi
stin
g Se
wag
e T
reat
men
t Ren
ov/R
ehab
. Wor
ks0
22) R
ehab
ilita
tion
Wor
k of
Kon
ia M
PS9,
870,
000
493,
000
592,
000
493,
000
493,
000
11,9
41,0
0011
,941
,000
23) R
ehab
ilita
tion
Wor
k of
Din
apur
STP
29,7
65,0
001,
488,
000
1,78
5,00
01,
488,
000
1,48
8,00
036
,014
,000
36,0
14,0
00
24) R
ehab
ilita
tion
Wor
k of
Bha
gwan
pur S
TP8,
321,
000
416,
000
499,
000
416,
000
416,
000
10,0
68,0
0010
,068
,000
Tot
al3,
262,
365,
000
163,
108,
000
195,
731,
000
163,
108,
000
163,
108,
000
3,94
7,42
0,00
019
8,26
1,00
04,
145,
681,
000
Tab
le 4
.1 S
umm
ary
of E
stim
ated
Sew
erag
e Pr
ojec
t Cos
t
Tot
alPr
ojec
t Cos
t(R
s.)
Lan
d A
cqui
sitio
n(R
s.)T
otal
Cos
t(R
s.)C
apita
l Cos
t(R
s.)
Final Report on Water Quality Management Plan for Ganga River Volume IV-4, Feasibility Study for Varanasi City, Part I, Sewerage Scheme
4-4

Tab
le 4
.2 I
mpl
emen
tatio
n Sc
hedu
le o
f Sew
erag
e Pr
iori
ty P
roje
ct (V
aran
asi)
(Uni
t: R
s.)
Proj
ect
Cap
ital C
ost
Det
aile
dD
esig
nTo
tal P
roje
ctC
ost
2006
2007
2008
2009
2010
2011
Ass
i Nal
a In
terc
epto
r Se
wer
Cap
ital a
nd D
etai
led
Des
ign
Cos
t Sch
edul
e1)
Con
stru
ctio
n of
Ass
i Int
erce
ptor
296,
683,
000
17,8
00,0
0035
8,98
5,00
017
,800
,000
59,3
37,0
0059
,337
,000
59,3
37,0
0089
,005
,000
29,6
67,0
002)
Con
stru
ctio
n of
Nak
hha
and
Sam
ne G
hat I
nter
cept
or28
,389
,000
1,70
3,00
034
,349
,000
1,70
3,00
05,
678,
000
5,67
8,00
05,
678,
000
8,51
7,00
02,
838,
000
3) C
onst
ruct
ion
of S
econ
dary
Sew
er14
6,70
6,00
08,
802,
000
177,
513,
000
8,80
2,00
029
,341
,000
29,3
41,0
0029
,341
,000
58,6
83,0
00V
arun
a R
iver
Inte
rcep
tor
Sew
er &
Sat
hwa
STP
Sew
er4)
Con
stru
ctio
n of
Var
una
Riv
er In
terc
epto
r Sew
er49
5,47
0,00
029
,728
,000
599,
517,
000
29,7
28,0
0099
,094
,000
99,0
94,0
0099
,094
,000
148,
641,
000
49,5
47,0
005)
Ext
ensi
on o
f Rel
ief T
runk
Sew
er25
0,00
0,00
015
,000
,000
302,
500,
000
15,0
00,0
0012
5,00
0,00
012
5,00
0,00
06)
Con
stru
ctio
n of
Sec
onda
ry S
ewer
78,1
21,0
004,
687,
000
94,5
26,0
004,
687,
000
15,6
24,0
0015
,624
,000
15,6
24,0
0031
,249
,000
Pum
ping
Sta
tions
7) C
onst
ruct
ion
of S
athw
a M
PS22
1,19
7,00
013
,271
,000
267,
645,
000
13,2
71,0
0044
,239
,000
44,2
39,0
0044
,239
,000
66,3
59,0
0022
,121
,000
8) C
onst
ruct
ion
of C
hauk
agha
t Rig
ht B
ank
SPS
236,
781,
000
14,2
06,0
0029
9,05
5,00
014
,206
,000
47,3
56,0
0047
,356
,000
47,3
56,0
0071
,034
,000
23,6
79,0
009)
Con
stru
ctio
n of
Cha
ukag
hat L
eft B
ank
SPS
45,0
15,0
002,
700,
000
59,4
32,0
002,
700,
000
9,00
3,00
09,
003,
000
9,00
3,00
013
,505
,000
4,50
1,00
010
) Con
stru
ctio
n of
Nar
okha
r Nal
a SP
S51
,256
,000
3,07
5,00
065
,389
,000
3,07
5,00
010
,251
,000
10,2
51,0
0010
,251
,000
15,3
77,0
005,
126,
000
11) C
onst
ruct
ion
of P
ulw
aria
Nal
a SP
S29
,903
,000
1,79
4,00
039
,802
,000
1,79
4,00
05,
981,
000
5,98
1,00
05,
981,
000
8,97
1,00
02,
989,
000
12) C
onst
ruct
ion
of S
arai
ya N
ala
SPS
22,4
78,0
001,
348,
000
28,7
87,0
001,
348,
000
4,49
6,00
04,
496,
000
4,49
6,00
06,
743,
000
2,24
7,00
0Sa
thw
a ST
P13
) Con
stru
ctio
n of
Sat
hwa
STP
522,
405,
000
31,3
44,0
0080
4,26
8,00
031
,344
,000
104,
481,
000
104,
481,
000
104,
481,
000
156,
722,
000
52,2
40,0
0014
) Lin
ing
for e
xist
ing
irrig
atio
n ca
nal a
nd tr
eate
d w
ater
cha
nnel
135,
800,
000
8,14
8,00
016
4,31
8,00
08,
148,
000
67,9
00,0
0067
,900
,000
Old
Tru
nk S
ewer
Reh
abili
tatio
n W
ork
15) D
etai
led
Inve
stig
atio
n of
Old
Tru
nk S
ewer
4,31
5,00
025
8,00
05,
218,
000
4,57
3,00
016
) Reh
abili
tatio
n W
ork
of O
ld T
runk
Sew
er60
8,14
6,00
036
,488
,000
735,
855,
000
36,4
88,0
0015
2,03
7,00
015
2,03
7,00
015
2,03
7,00
015
2,03
5,00
0G
hat P
S R
ehab
ilita
tion
Wor
ks17
) Reh
abili
tatio
n W
ork
of T
riloc
han
Gha
t PS
8,05
2,00
048
3,00
09,
741,
000
483,
000
4,02
6,00
04,
026,
000
18) R
ehab
ilita
tion
Wor
k of
Har
sich
andr
a G
hat P
S4,
959,
000
297,
000
5,99
7,00
029
7,00
02,
480,
000
2,47
9,00
019
) Reh
abili
tatio
n W
ork
of Ja
lesa
n G
hat P
S5,
153,
000
309,
000
6,23
3,00
030
9,00
02,
577,
000
2,57
6,00
020
) Reh
abili
tatio
n W
ork
of D
r. R
.P. G
hat P
S19
,506
,000
1,17
0,00
023
,601
,000
1,17
0,00
09,
753,
000
9,75
3,00
021
) Reh
abili
tatio
n W
ork
of M
ansa
rova
r Gha
t PS
4,07
4,00
024
4,00
04,
927,
000
244,
000
2,03
7,00
02,
037,
000
Exi
stin
g Se
wag
e Tr
eatm
ent R
enov
/Reh
ab. W
orks
22) R
ehab
ilita
tion
Wor
k of
Kon
ia M
PS9,
870,
000
592,
000
11,9
41,0
0059
2,00
04,
935,
000
4,93
5,00
023
) Reh
abili
tatio
n W
ork
of D
inap
ur S
TP29
,765
,000
1,78
5,00
036
,014
,000
1,78
5,00
014
,883
,000
14,8
82,0
0024
) Reh
abili
tatio
n W
ork
of B
hagw
anpu
r STP
8,32
1,00
049
9,00
010
,068
,000
499,
000
4,16
1,00
04,
160,
000
Tota
l3,
262,
365,
000
195,
731,
000
4,14
5,68
1,00
018
6,55
7,00
079
3,19
4,00
082
4,66
6,00
058
6,91
8,00
078
1,87
4,00
028
4,88
7,00
0
(Uni
t: M
illio
n R
s.)Ite
ms
Tota
l20
0620
0720
0820
0920
0920
10
Cap
ital C
ost
3,26
2.37
4.31
779.
7182
4.67
586.
9278
1.87
284.
89
Det
aile
d D
esig
n19
5.73
182.
2413
.49
0.00
0.00
0.00
0.00
Con
tinge
ncie
s16
3.11
0.22
38.9
941
.23
29.3
439
.09
14.2
4
Supe
rvis
ion
163.
110.
2238
.99
41.2
329
.34
39.0
914
.24
Pr
ojec
tAdm
in16
3.11
0.22
38.9
941
.23
29.3
439
.09
14.2
4
Tota
l Cos
t3,
947.
4318
7.21
910.
1794
8.36
674.
9489
9.14
327.
61
Land
Acq
uisi
tion
198.
2619
8.26
0.00
0.00
0.00
0.00
0.00
Tota
l Pro
ject
Cos
t4,
145.
6938
5.47
910.
1794
8.36
674.
9489
9.14
327.
61
Det
aied
Des
ign
Con
stru
ctio
n C
ost
Final Report on Water Quality Management Plan for Ganga River Volume IV-4, Feasibility Study for Varanasi City, Part I, Sewerage Scheme
4-5
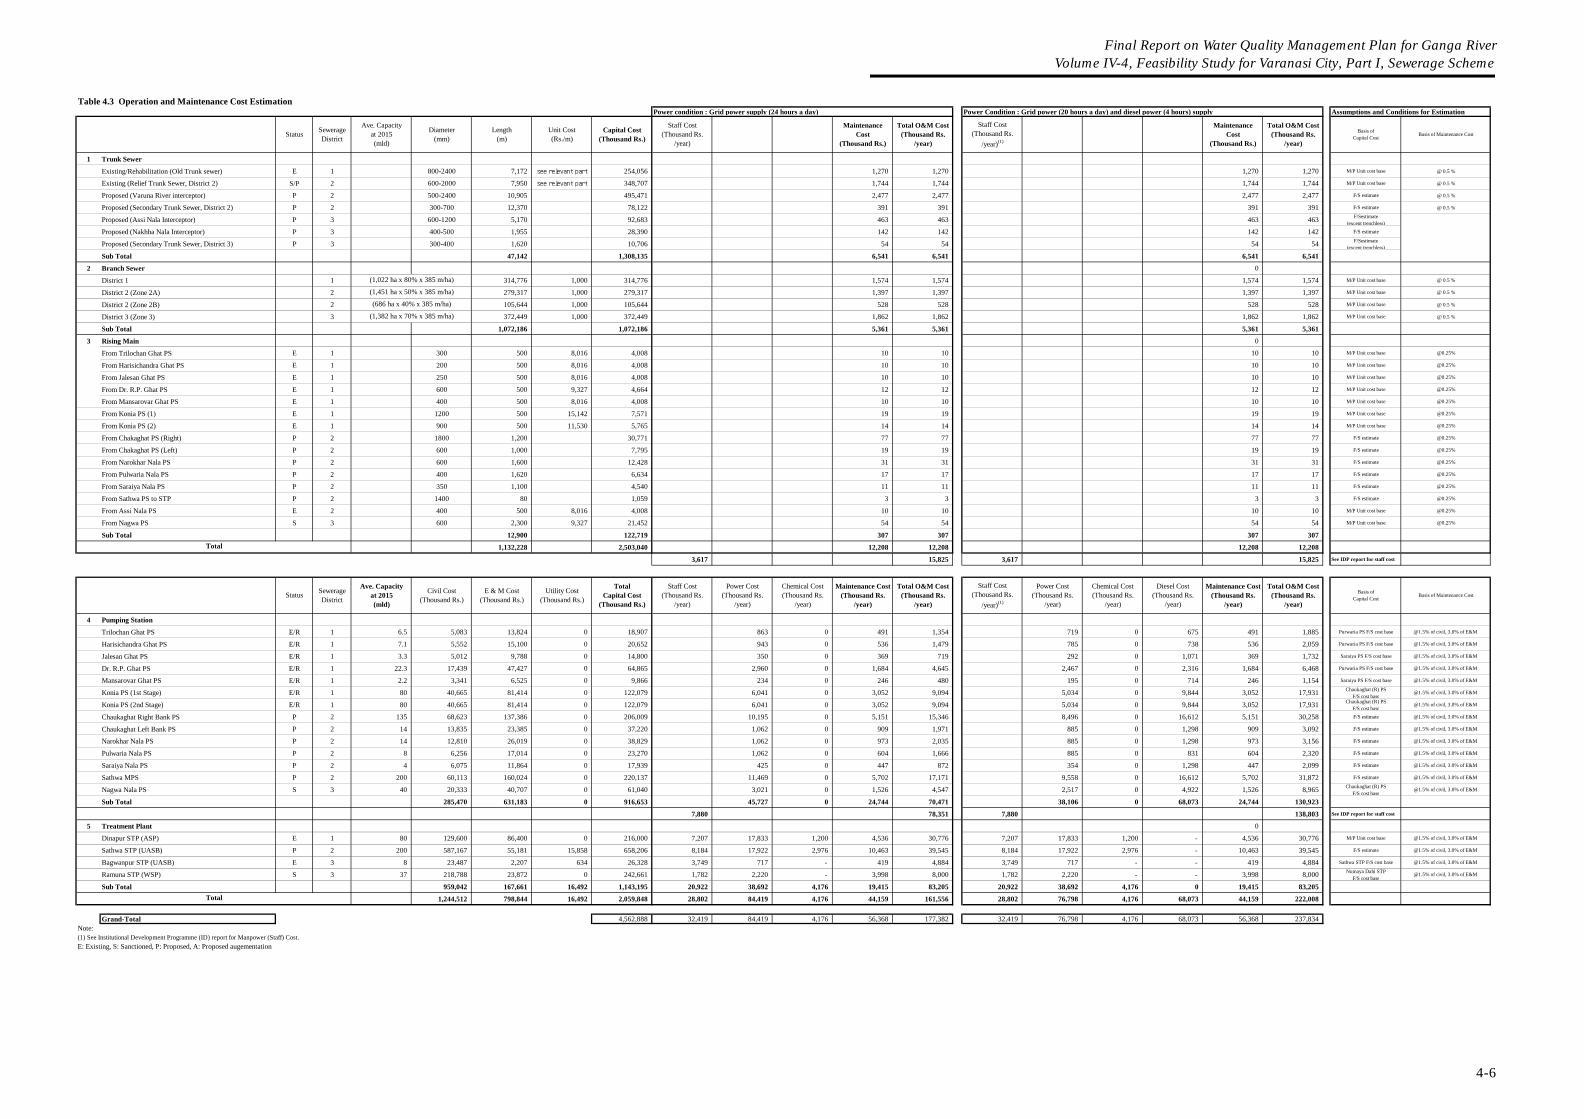
Table 4.3 Operation and Maintenance Cost Estimation Power condition : Grid power supply (24 hours a day) Power Condition : Grid power (20 hours a day) and diesel power (4 hours) supply Assumptions and Conditions for Estimation
1 Trunk Sewer
Existing/Rehabilitation (Old Trunk sewer) E 1 800-2400 7,172 see relevant part 254,056 1,270 1,270 1,270 1,270 M/P Unit cost base @ 0.5 %
Existing (Relief Trunk Sewer, District 2) S/P 2 600-2000 7,950 see relevant part 348,707 1,744 1,744 1,744 1,744 M/P Unit cost base @ 0.5 %
Proposed (Varuna River interceptor) P 2 500-2400 10,905 495,471 2,477 2,477 2,477 2,477 F/S estimate @ 0.5 %
Proposed (Secondary Trunk Sewer, District 2) P 2 300-700 12,370 78,122 391 391 391 391 F/S estimate @ 0.5 %
Proposed (Assi Nala Interceptor) P 3 600-1200 5,170 92,683 463 463 463 463 F/Sestimate(except trenchless)
Proposed (Nakhha Nala Interceptor) P 3 400-500 1,955 28,390 142 142 142 142 F/S estimate
Proposed (Secondary Trunk Sewer, District 3) P 3 300-400 1,620 10,706 54 54 54 54 F/Sestimate(except trenchless)
Sub Total 47,142 1,308,135 6,541 6,541 6,541 6,541
2 Branch Sewer 0
District 1 1 314,776 1,000 314,776 1,574 1,574 1,574 1,574 M/P Unit cost base @ 0.5 %
District 2 (Zone 2A) 2 279,317 1,000 279,317 1,397 1,397 1,397 1,397 M/P Unit cost base @ 0.5 %
District 2 (Zone 2B) 2 105,644 1,000 105,644 528 528 528 528 M/P Unit cost base @ 0.5 %
District 3 (Zone 3) 3 372,449 1,000 372,449 1,862 1,862 1,862 1,862 M/P Unit cost base @ 0.5 %
Sub Total 1,072,186 1,072,186 5,361 5,361 5,361 5,361
3 Rising Main 0
From Trilochan Ghat PS E 1 300 500 8,016 4,008 10 10 10 10 M/P Unit cost base @0.25%
From Harisichandra Ghat PS E 1 200 500 8,016 4,008 10 10 10 10 M/P Unit cost base @0.25%
From Jalesan Ghat PS E 1 250 500 8,016 4,008 10 10 10 10 M/P Unit cost base @0.25%
From Dr. R.P. Ghat PS E 1 600 500 9,327 4,664 12 12 12 12 M/P Unit cost base @0.25%
From Mansarovar Ghat PS E 1 400 500 8,016 4,008 10 10 10 10 M/P Unit cost base @0.25%
From Konia PS (1) E 1 1200 500 15,142 7,571 19 19 19 19 M/P Unit cost base @0.25%
From Konia PS (2) E 1 900 500 11,530 5,765 14 14 14 14 M/P Unit cost base @0.25%
From Chakaghat PS (Right) P 2 1800 1,200 30,771 77 77 77 77 F/S estimate @0.25%
From Chakaghat PS (Left) P 2 600 1,000 7,795 19 19 19 19 F/S estimate @0.25%
From Narokhar Nala PS P 2 600 1,600 12,428 31 31 31 31 F/S estimate @0.25%
From Pulwaria Nala PS P 2 400 1,620 6,634 17 17 17 17 F/S estimate @0.25%
From Saraiya Nala PS P 2 350 1,100 4,540 11 11 11 11 F/S estimate @0.25%
From Sathwa PS to STP P 2 1400 80 1,059 3 3 3 3 F/S estimate @0.25%
From Assi Nala PS E 2 400 500 8,016 4,008 10 10 10 10 M/P Unit cost base @0.25%
From Nagwa PS S 3 600 2,300 9,327 21,452 54 54 54 54 M/P Unit cost base @0.25%
Sub Total 12,900 122,719 307 307 307 307
1,132,228 2,503,040 12,208 12,208 12,208 12,208
3,617 15,825 3,617 15,825 See IDP report for staff cost
4 Pumping Station
Trilochan Ghat PS E/R 1 6.5 5,083 13,824 0 18,907 863 0 491 1,354 719 0 675 491 1,885 Purwaria PS F/S cost base @1.5% of civil, 3.0% of E&M
Harisichandra Ghat PS E/R 1 7.1 5,552 15,100 0 20,652 943 0 536 1,479 785 0 738 536 2,059 Purwaria PS F/S cost base @1.5% of civil, 3.0% of E&M
Jalesan Ghat PS E/R 1 3.3 5,012 9,788 0 14,800 350 0 369 719 292 0 1,071 369 1,732 Saraiya PS F/S cost base @1.5% of civil, 3.0% of E&M
Dr. R.P. Ghat PS E/R 1 22.3 17,439 47,427 0 64,865 2,960 0 1,684 4,645 2,467 0 2,316 1,684 6,468 Purwaria PS F/S cost base @1.5% of civil, 3.0% of E&M
Mansarovar Ghat PS E/R 1 2.2 3,341 6,525 0 9,866 234 0 246 480 195 0 714 246 1,154 Saraiya PS F/S cost base @1.5% of civil, 3.0% of E&M
Konia PS (1st Stage) E/R 1 80 40,665 81,414 0 122,079 6,041 0 3,052 9,094 5,034 0 9,844 3,052 17,931 Chaukaghat (R) PSF/S cost base
@1.5% of civil, 3.0% of E&M
Konia PS (2nd Stage) E/R 1 80 40,665 81,414 0 122,079 6,041 0 3,052 9,094 5,034 0 9,844 3,052 17,931 Chaukaghat (R) PSF/S cost base
@1.5% of civil, 3.0% of E&M
Chaukaghat Right Bank PS P 2 135 68,623 137,386 0 206,009 10,195 0 5,151 15,346 8,496 0 16,612 5,151 30,258 F/S estimate @1.5% of civil, 3.0% of E&M
Chaukaghat Left Bank PS P 2 14 13,835 23,385 0 37,220 1,062 0 909 1,971 885 0 1,298 909 3,092 F/S estimate @1.5% of civil, 3.0% of E&M
Narokhar Nala PS P 2 14 12,810 26,019 0 38,829 1,062 0 973 2,035 885 0 1,298 973 3,156 F/S estimate @1.5% of civil, 3.0% of E&M
Pulwaria Nala PS P 2 8 6,256 17,014 0 23,270 1,062 0 604 1,666 885 0 831 604 2,320 F/S estimate @1.5% of civil, 3.0% of E&M
Saraiya Nala PS P 2 4 6,075 11,864 0 17,939 425 0 447 872 354 0 1,298 447 2,099 F/S estimate @1.5% of civil, 3.0% of E&M
Sathwa MPS P 2 200 60,113 160,024 0 220,137 11,469 0 5,702 17,171 9,558 0 16,612 5,702 31,872 F/S estimate @1.5% of civil, 3.0% of E&M
Nagwa Nala PS S 3 40 20,333 40,707 0 61,040 3,021 0 1,526 4,547 2,517 0 4,922 1,526 8,965 Chaukaghat (R) PSF/S cost base
@1.5% of civil, 3.0% of E&M
Sub Total 285,470 631,183 0 916,653 45,727 0 24,744 70,471 38,106 0 68,073 24,744 130,923
7,880 78,351 7,880 138,803 See IDP report for staff cost
5 Treatment Plant 0
Dinapur STP (ASP) E 1 80 129,600 86,400 0 216,000 7,207 17,833 1,200 4,536 30,776 7,207 17,833 1,200 - 4,536 30,776 M/P Unit cost base @1.5% of civil, 3.0% of E&M
Sathwa STP (UASB) P 2 200 587,167 55,181 15,858 658,206 8,184 17,922 2,976 10,463 39,545 8,184 17,922 2,976 - 10,463 39,545 F/S estimate @1.5% of civil, 3.0% of E&M
Bagwanpur STP (UASB) E 3 8 23,487 2,207 634 26,328 3,749 717 - 419 4,884 3,749 717 - - 419 4,884 Sathwa STP F/S cost base @1.5% of civil, 3.0% of E&M
Ramuna STP (WSP) S 3 37 218,788 23,872 0 242,661 1,782 2,220 - 3,998 8,000 1,782 2,220 - - 3,998 8,000 Numaya Dahi STPF/S cost base
@1.5% of civil, 3.0% of E&M
Sub Total 959,042 167,661 16,492 1,143,195 20,922 38,692 4,176 19,415 83,205 20,922 38,692 4,176 0 19,415 83,205
1,244,512 798,844 16,492 2,059,848 28,802 84,419 4,176 44,159 161,556 28,802 76,798 4,176 68,073 44,159 222,008
Grand-Total 4,562,888 32,419 84,419 4,176 56,368 177,382 32,419 76,798 4,176 68,073 56,368 237,834Note:(1) See Institutional Development Programme (ID) report for Manpower (Staff) Cost. E: Existing, S: Sanctioned, P: Proposed, A: Proposed augementation
Total
Staff Cost(Thousand Rs.
/year)(1)
MaintenanceCost
(Thousand Rs.)
Total O&M Cost(Thousand Rs.
/year)Status Sewerage
District
Ave. Capacityat 2015(mld)
Diameter(mm)
Length(m)
Unit Cost(Rs./m)
Basis ofCapital Cost
Basis of Maintenance Cost
(1,022 ha x 80% x 385 m/ha)
(1,451 ha x 50% x 385 m/ha)
Capital Cost(Thousand Rs.)
Staff Cost(Thousand Rs.
/year)
MaintenanceCost
(Thousand Rs.)
Total O&M Cost(Thousand Rs.
/year)
(1,382 ha x 70% x 385 m/ha)
(686 ha x 40% x 385 m/ha)
Total O&M Cost(Thousand Rs.
/year)
Basis ofCapital Cost
Chemical Cost(Thousand Rs.
/year)
Diesel Cost(Thousand Rs.
/year)
Maintenance Cost(Thousand Rs.
/year)
Total O&M Cost(Thousand Rs.
/year)Basis of Maintenance Cost
Power Cost(Thousand Rs.
/year)
Chemical Cost(Thousand Rs.
/year)
Staff Cost(Thousand Rs.
/year)(1)
Power Cost(Thousand Rs.
/year)
Total
Maintenance Cost(Thousand Rs.
/year)
E & M Cost(Thousand Rs.)
Utility Cost(Thousand Rs.)
TotalCapital Cost
(Thousand Rs.)
Staff Cost(Thousand Rs.
/year)Status Sewerage
District
Ave. Capacityat 2015(mld)
Civil Cost(Thousand Rs.)
Final Report on Water Quality Management Plan for Ganga River Volume IV-4, Feasibility Study for Varanasi City, Part I, Sewerage Scheme
4-6

Appendix A
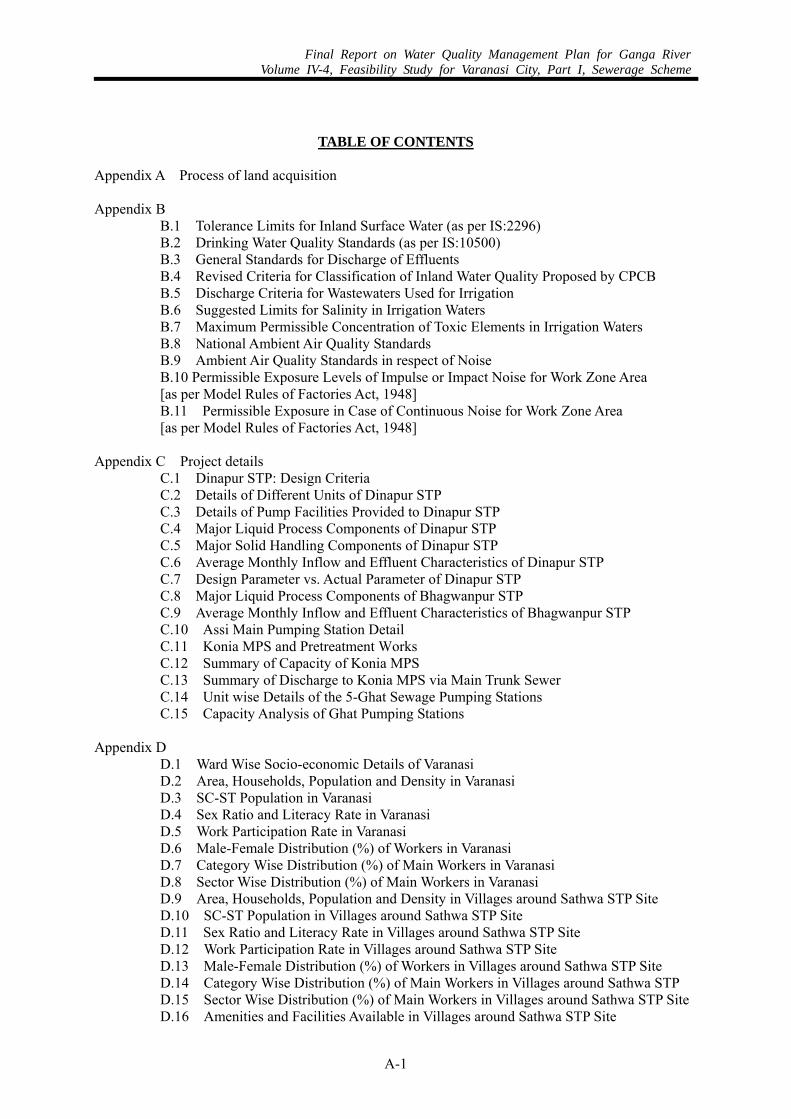
Final Report on Water Quality Management Plan for Ganga RiverVolume IV-4, Feasibility Study for Varanasi City, Part I, Sewerage Scheme
A-1
TABLE OF CONTENTS Appendix A Process of land acquisition
Appendix B
B.1 Tolerance Limits for Inland Surface Water (as per IS:2296) B.2 Drinking Water Quality Standards (as per IS:10500) B.3 General Standards for Discharge of Effluents B.4 Revised Criteria for Classification of Inland Water Quality Proposed by CPCB B.5 Discharge Criteria for Wastewaters Used for Irrigation B.6 Suggested Limits for Salinity in Irrigation Waters B.7 Maximum Permissible Concentration of Toxic Elements in Irrigation Waters B.8 National Ambient Air Quality Standards B.9 Ambient Air Quality Standards in respect of Noise B.10 Permissible Exposure Levels of Impulse or Impact Noise for Work Zone Area [as per Model Rules of Factories Act, 1948] B.11 Permissible Exposure in Case of Continuous Noise for Work Zone Area [as per Model Rules of Factories Act, 1948]
Appendix C Project details C.1 Dinapur STP: Design Criteria C.2 Details of Different Units of Dinapur STP C.3 Details of Pump Facilities Provided to Dinapur STP C.4 Major Liquid Process Components of Dinapur STP C.5 Major Solid Handling Components of Dinapur STP C.6 Average Monthly Inflow and Effluent Characteristics of Dinapur STP C.7 Design Parameter vs. Actual Parameter of Dinapur STP C.8 Major Liquid Process Components of Bhagwanpur STP C.9 Average Monthly Inflow and Effluent Characteristics of Bhagwanpur STP C.10 Assi Main Pumping Station Detail C.11 Konia MPS and Pretreatment Works C.12 Summary of Capacity of Konia MPS C.13 Summary of Discharge to Konia MPS via Main Trunk Sewer C.14 Unit wise Details of the 5-Ghat Sewage Pumping Stations C.15 Capacity Analysis of Ghat Pumping Stations
Appendix D
D.1 Ward Wise Socio-economic Details of Varanasi D.2 Area, Households, Population and Density in Varanasi D.3 SC-ST Population in Varanasi D.4 Sex Ratio and Literacy Rate in Varanasi D.5 Work Participation Rate in Varanasi D.6 Male-Female Distribution (%) of Workers in Varanasi D.7 Category Wise Distribution (%) of Main Workers in Varanasi D.8 Sector Wise Distribution (%) of Main Workers in Varanasi D.9 Area, Households, Population and Density in Villages around Sathwa STP Site D.10 SC-ST Population in Villages around Sathwa STP Site D.11 Sex Ratio and Literacy Rate in Villages around Sathwa STP Site D.12 Work Participation Rate in Villages around Sathwa STP Site D.13 Male-Female Distribution (%) of Workers in Villages around Sathwa STP Site D.14 Category Wise Distribution (%) of Main Workers in Villages around Sathwa STP D.15 Sector Wise Distribution (%) of Main Workers in Villages around Sathwa STP Site D.16 Amenities and Facilities Available in Villages around Sathwa STP Site

Final Report on Water Quality Management Plan for Ganga RiverVolume IV-4, Feasibility Study for Varanasi City, Part I, Sewerage Scheme
A-2
APPENDIX A PROCESS OF LAND ACQUISITION
LAND ACQUISITION ACT Land is normally acquired under the provisions of the Land Acquisition Act, 1894 that is general and basic law in the country for the acquisition of land for public purposes and companies. This Act was comprehensively amended in the year 1984, taking into consideration the recommendations of the Law Commission, the Land Acquisition Review Committee, headed by Justice A. N. Mulla, as well as suggestions from the state governments and other quarters. The Conference of the Revenue Secretaries of States (July 1989) have also made recommendations that all land should be acquired under the provisions of the Land Acquisition Act, 1894 and other laws repugnant thereto should be brought in line with it or repealed altogether. However, these efforts have not met with success and a large number of laws, having different procedures and norms of compensation, continue to operate. In view of the acknowledged superiority of the Land Acquisition Act, 1894 land is acquired under the provisions of this Act. The underlying principle governing the acquisition of land under the Land Acquisition Act, 1894 is that compensation alone is payable in lieu of deprivation. However, there is a provision under Section 31 (3) in the Land Acquisition Act for grant of land in lieu of money compensation. LAND ACQUISITION PROCESS In the table below, relevant sections of the LA Act, 1894 and the relevance of such sections in the land acquisition process has been given.
Table A.1 Summary of Land Acquisition Act, 1894
Relevant Sections
Description Relation with the Project
3 Definition - 4 Publication of preliminary notification
and powers of officers thereupon -
5 Payment for damage Compensation for the damage done to the property during the course of surveying will be paid by the Project
5A Hearing of Objections Will be followed by the Project 6 Declaration that land is required for a
public purpose Declaration will be published in the Official Gazette and in two daily newspapers circulating in the locality where the land is situated of which at least one shall be in the regional language. Project Authority through concerned Collector/District Magistrate (DM) will cause public notice of the substance of the declaration at convenient places in the locality.
7 After declaration, Collector/(DM) to take order for acquisition
Will be followed by the Project
8 Land to be marked out, measured and planned
Will be followed by the Project
9 Notice to persons interested Will be followed by the Project 10 Powers to require and enforce the
making of statements as to names and interests
Will be followed by the Project
11 Enquiry into measurements, value and claims and award by Collector
Project to make use of “The Uttar Pradesh Land Acquisition (Determination of Compensation and Declaration of Award
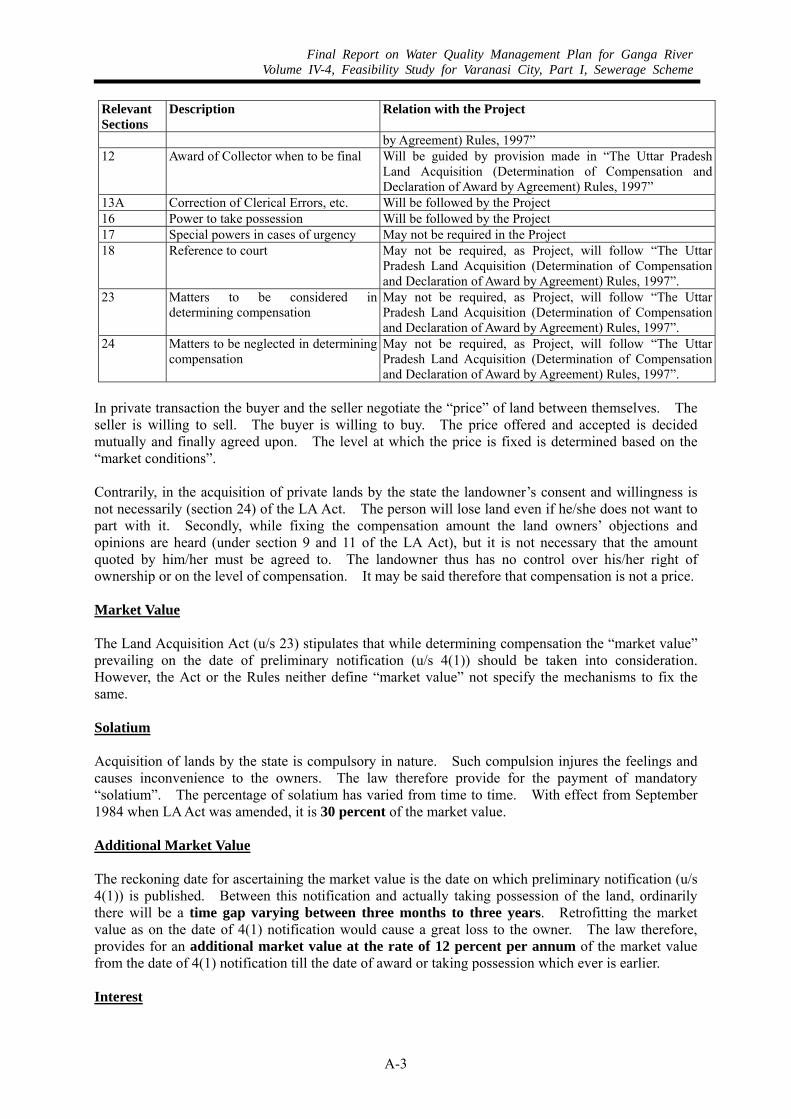
Final Report on Water Quality Management Plan for Ganga RiverVolume IV-4, Feasibility Study for Varanasi City, Part I, Sewerage Scheme
A-3
Relevant Sections
Description Relation with the Project
by Agreement) Rules, 1997” 12 Award of Collector when to be final Will be guided by provision made in “The Uttar Pradesh
Land Acquisition (Determination of Compensation and Declaration of Award by Agreement) Rules, 1997”
13A Correction of Clerical Errors, etc. Will be followed by the Project 16 Power to take possession Will be followed by the Project 17 Special powers in cases of urgency May not be required in the Project 18 Reference to court May not be required, as Project, will follow “The Uttar
Pradesh Land Acquisition (Determination of Compensation and Declaration of Award by Agreement) Rules, 1997”.
23 Matters to be considered in determining compensation
May not be required, as Project, will follow “The Uttar Pradesh Land Acquisition (Determination of Compensation and Declaration of Award by Agreement) Rules, 1997”.
24 Matters to be neglected in determining compensation
May not be required, as Project, will follow “The Uttar Pradesh Land Acquisition (Determination of Compensation and Declaration of Award by Agreement) Rules, 1997”.
In private transaction the buyer and the seller negotiate the “price” of land between themselves. The seller is willing to sell. The buyer is willing to buy. The price offered and accepted is decided mutually and finally agreed upon. The level at which the price is fixed is determined based on the “market conditions”. Contrarily, in the acquisition of private lands by the state the landowner’s consent and willingness is not necessarily (section 24) of the LA Act. The person will lose land even if he/she does not want to part with it. Secondly, while fixing the compensation amount the land owners’ objections and opinions are heard (under section 9 and 11 of the LA Act), but it is not necessary that the amount quoted by him/her must be agreed to. The landowner thus has no control over his/her right of ownership or on the level of compensation. It may be said therefore that compensation is not a price. Market Value The Land Acquisition Act (u/s 23) stipulates that while determining compensation the “market value” prevailing on the date of preliminary notification (u/s 4(1)) should be taken into consideration. However, the Act or the Rules neither define “market value” not specify the mechanisms to fix the same. Solatium Acquisition of lands by the state is compulsory in nature. Such compulsion injures the feelings and causes inconvenience to the owners. The law therefore provide for the payment of mandatory “solatium”. The percentage of solatium has varied from time to time. With effect from September 1984 when LA Act was amended, it is 30 percent of the market value. Additional Market Value The reckoning date for ascertaining the market value is the date on which preliminary notification (u/s 4(1)) is published. Between this notification and actually taking possession of the land, ordinarily there will be a time gap varying between three months to three years. Retrofitting the market value as on the date of 4(1) notification would cause a great loss to the owner. The law therefore, provides for an additional market value at the rate of 12 percent per annum of the market value from the date of 4(1) notification till the date of award or taking possession which ever is earlier. Interest

Final Report on Water Quality Management Plan for Ganga RiverVolume IV-4, Feasibility Study for Varanasi City, Part I, Sewerage Scheme
A-4
In case of delay, the law provides for payment of interest on the compensation. For the first 12 months, the interest at the rate of 9 percent is payable from the date of the award. For delays beyond 12 months from the date of declaration of the award, 15 percent is the rate of interest. METHODS OF CALCULATING COMPENSATION As said earlier, there is no fixed method of calculating compensation in the Act. However, the basic element in deciding the amount of compensation is the market value (u/s 23). Within the framework of law, the courts have interpreted market value as the price that a willing purchaser would pay to a willing seller for a property giving due regard to its existing condition, with all its advantages and potential possibilities. It is however, not easy to precisely determine what should be the most accurate market value of a given property. The market conditions are never constant. The demand and supply factors vary enormously over a period of time and from place to place. The uniqueness of each property, its location, size, quality and possible potentialities need to be considered. With these constraints, different methods determining compensation are in vogue. Some of the methods are discussed here: (1) Sale Statistics Method Land being an immovable property, all its sales and purchases have to be registered. The registered sale prices can be taken as adequate indicator of market value of a given piece of land. Sale prices of those lands, which are comparable in time and quality, are only to be considered. Following steps are involved in calculating compensation according to sales statistics method. Step1: Collect statistics of sales of land/buildings adjacent to ones being acquired in three to four
years preceding 4(1) notification from Registration Department. Step2: Workout average of 3 to 4 years per acre/hectare. Step3: Average Price(AP) + 0.3 AP+0.12AP per annum from the date of 4(1) notification to date of
award to arrive at compensation. Step4: Add damages, if any or incidental, if any. Step5: Calculate interest from date of award at 9% for first 12 months and 15% for the period
thereafter. (2) Capitalisation Method Where reliable information is not available about the prevailing market value of the land, capitalisation method is used to decide compensation. Following steps are involved in calculating compensation according to capitalisation method. Step1: Gross Income - Cost=Net Income Step2: Net Income x Multiplier* = Market Value Step3: Market Value (MV) +30% of MV as solatium + 12% of MV per annum as Additional Market
Value =Compensation Step4: Compensation + Damages / incidental + interest *There are no fixed limits on the choice of the multiplier. It is based on conjectures or precedents. Generally, a multiplier of 10 to 12 is used for valuing non-irrigated land whereas 8 to 10 is deemed sufficient for irrigated lands. For buildings based on net rental income, a multiplier of 15 or 20 is used. In assessing the value of plantation or horticultural crops, generally a multiplier of 10 is acceptable. (3) Expert Assessment Assessment of value of certain horticultural crops, plantation crops, buildings, waterways, bunds, etc. requires special expertise. Professional valuers are used for valuing such immovable properties. Valuers take into account the longevity, health and expected yield levels while assessing income and standard practices along with the age. Experts use certain multipliers to arrive at a capitalized value

Final Report on Water Quality Management Plan for Ganga RiverVolume IV-4, Feasibility Study for Varanasi City, Part I, Sewerage Scheme
A-5
of the assets. The multiplier generally used relates to the remaining period in the longevity of the structures or remaining age of the crops or rental expected. (4) Consent Award Negotiated settlement of compensation stands on a footing different from those of other methods of deciding the market value of the acquired asset. The essential elements are: that the landowners and the collector reach an agreement on the matter to be included in the compensation. that the terms of such agreement form the basis of the award and no further enquiry is necessary that other provisions of the Act do not apply to such awards. The consent of landowner is essential to finalise such awards. Once consent is obtained it cannot be questioned at a later stage. This process comes very close to market mechanism, where in buyers and sellers negotiate the price. It also provides an opportunity to the landowners to participate in the process of determining compensation. (5) Replacement Value It is argued that the compensation awarded for the acquired land and other amenities, buildings, etc. should be adequate to enable purchase of comparable assets elsewhere by the affected people. In this direction, the proponents of rehabilitation emphasise that wherever compensation is not adequate enough to buy replacement lands/buildings, the project authorities must provide other topping up devices to overcome the shortfall. A COMPARATIVE ANALYSIS OF ALL THE METHODS All the five methods of assessing market value of acquired lands may be compared as shown in the table below under following heads:
Proximity to market value Time taken Who uses? Degree of participation of PAPs Equity Frequency of use
TableA.2 Comparison of Different Methods of Assessing Market Value
SN Criteria Sale
Statistics Capitalisation Expert
Assessment Consent Award
Replacement Value
1 Proximity to Market value
Remote Closer Closer Closest Equal to or more
2 Time Taken Shorter Average Average Shortest Longer 3 Who uses? Government Courts
Govt. rarely Courts Govt.
Govt. Govt./Bank Financed
4 Degree of Participation
None Some None Maximum Maximum
5 Equity Somewhat reasonable
Reasonable Reasonable Highly reasonable
Highly reasonable
6 Frequency of use
Most common More Less Less Least common
On all these counts the replacement value method emerges as the best way of compensating landowners. Though it is the least used by the government and takes long time, it is highly equitable as it provides maximum opportunity to the affected people to participate in the acquisition process.

Final Report on Water Quality Management Plan for Ganga RiverVolume IV-4, Feasibility Study for Varanasi City, Part I, Sewerage Scheme
A-6
The compensation thus offered is equal to or greater than the real market value. Consent award could be rated second, while expert assessment and capitalisation method stand close to each other in the third place.

Appendix B

Final Report on Water Quality Management Plan for Ganga RiverVolume IV-4, Feasibility Study for Varanasi City, Part I, Sewerage Scheme
B-1
APPENDIX B
Table B.1 Tolerance Limits for Inland Surface Waters (as per IS:2296)
SN Parameter and Unit Class-A Class-B Class-C Class-D Class-E1. Colour (Hazen Units) 10 300 300 - -2. Odour Unobject - - - -3. Taste Tasteless - - - -4. pH (max) (min:6.5) 8.5 8.5 8.5 8.5 8.55. Conductivity (25oC) (µmhos/cm) - - - 1000 22506. DO (mg/L)(min) 6 5 4 4 -7. BOD (5 days at 20oC) (mg/L) 2 3 3 - -8. Total Coliforms (MPN/100 mL) 50 500 5000 - -9. TDS (mg/L) 500 - 1500 - 210010. Oil and Grease (mg/L) - - 0.1 0.1 -11. Mineral Oil (mg/L) 0.01 - - - -12. Free Carbon Dioxide (mg/L CO2) - - - 6 -13. Free Ammonia (mg/L as N) - - - 1.2 -14. Cyanide (mg/L as CN) 0.05 0.05 0.05 - -15. Phenol (mg/L C6H5OH) 0.002 0.005 0.005 - -16. Total Hardness (mg/L as CaCO3) 300 - - - -17. Chloride (mg/L as Cl) 250 - 600 - 60018. Sulphate (mg/L as SO4) 400 - 400 - 100019. Nitrate (mg/L as NO3) 20 - 50 - -20. Fluoride (mg/L as F) 1.5 1.5 1.5 - -21. Calcium (mg/L as Ca) 80 - - - -22. Magnesium (mg/L as Mg) 24.4 - - - -23. Copper (mg/L as Cu) 1.5 - 1.5 - -24. Iron (mg/L as Fe) 0.3 - 50 - -25. Manganese (mg/L as Mn) 0.5 - - - -26. Zinc (mg/L as Zn) 15 - 15 - -27. Boron (mg/L as B) - - - - 228. Barium (mg/L as Ba) 1 - - - -29. Silver (mg/L as Ag) 0.05 - - - -30. Arsenic (mg/L as As) 0.05 0.2 0.2 - -31. Mercury (mg/L as Hg) 0.001 - - - -32. Lead (mg/L as Pb) 0.1 - 0.1 - -33. Cadmium (mg/L as Cd) 0.01 - 0.01 - -34. Chromium (VI) (mg/L as Cr) 0.05 0.05 0.05 - -35. Selenium (mg/L as Se) 0.01 - 0.05 - -36. Anionic Detergents (mg/L MBAS) 0.2 1 1 - -37. PAH (mg/L) 0.2 - - - -38. Pesticides (µg/L) Absent - - - -39. Insecticides (mg/L) - - Absent - -40. Alpha Emitters (10-6µc/mL) 0.001 0.001 0.001 0.001 0.00141. Beta Emitters (10-6µc/mL) 0.01 0.01 0.01 0.01 0.0142. Percent Sodium (%) - - - - 6043. Sodium Absorption Ratio - - - - 26
Class-A: Drinking water source without conventional treatment but after disinfection. Class-B: Outdoor bathing. Class-C: Drinking water source with conventional treatment followed by disinfection. Class-D: Fish culture and wild life propagation. Class-E: Irrigation, industrial cooling and controlled waste disposal.
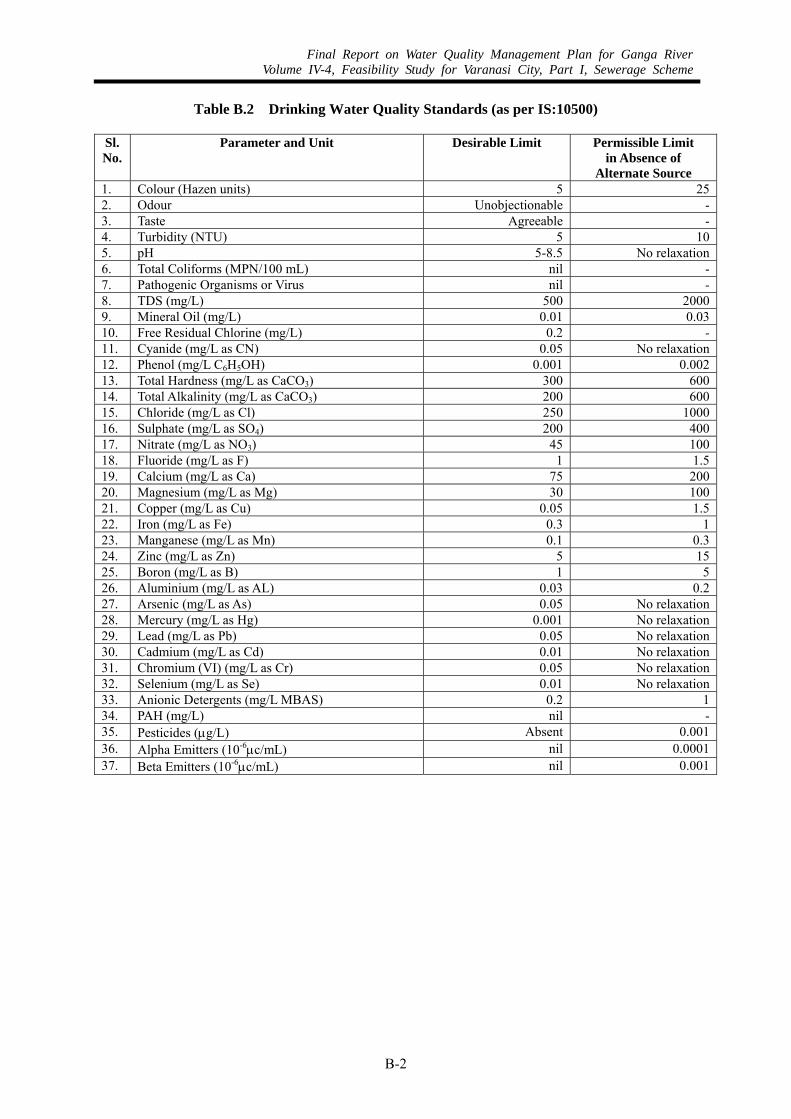
Final Report on Water Quality Management Plan for Ganga RiverVolume IV-4, Feasibility Study for Varanasi City, Part I, Sewerage Scheme
B-2
Table B.2 Drinking Water Quality Standards (as per IS:10500)
Sl. No.
Parameter and Unit Desirable Limit Permissible Limit in Absence of
Alternate Source 1. Colour (Hazen units) 5 252. Odour Unobjectionable -3. Taste Agreeable -4. Turbidity (NTU) 5 105. pH 5-8.5 No relaxation6. Total Coliforms (MPN/100 mL) nil -7. Pathogenic Organisms or Virus nil -8. TDS (mg/L) 500 20009. Mineral Oil (mg/L) 0.01 0.0310. Free Residual Chlorine (mg/L) 0.2 -11. Cyanide (mg/L as CN) 0.05 No relaxation12. Phenol (mg/L C6H5OH) 0.001 0.00213. Total Hardness (mg/L as CaCO3) 300 60014. Total Alkalinity (mg/L as CaCO3) 200 60015. Chloride (mg/L as Cl) 250 100016. Sulphate (mg/L as SO4) 200 40017. Nitrate (mg/L as NO3) 45 10018. Fluoride (mg/L as F) 1 1.519. Calcium (mg/L as Ca) 75 20020. Magnesium (mg/L as Mg) 30 10021. Copper (mg/L as Cu) 0.05 1.522. Iron (mg/L as Fe) 0.3 123. Manganese (mg/L as Mn) 0.1 0.324. Zinc (mg/L as Zn) 5 1525. Boron (mg/L as B) 1 526. Aluminium (mg/L as AL) 0.03 0.227. Arsenic (mg/L as As) 0.05 No relaxation28. Mercury (mg/L as Hg) 0.001 No relaxation29. Lead (mg/L as Pb) 0.05 No relaxation30. Cadmium (mg/L as Cd) 0.01 No relaxation31. Chromium (VI) (mg/L as Cr) 0.05 No relaxation32. Selenium (mg/L as Se) 0.01 No relaxation33. Anionic Detergents (mg/L MBAS) 0.2 134. PAH (mg/L) nil -35. Pesticides (µg/L) Absent 0.00136. Alpha Emitters (10-6µc/mL) nil 0.000137. Beta Emitters (10-6µc/mL) nil 0.001

Final Report on Water Quality Management Plan for Ganga RiverVolume IV-4, Feasibility Study for Varanasi City, Part I, Sewerage Scheme
B-3
TableB.3 General Standards for Discharge of Effluents [as per Environment (Protection) Rules, 1986]
Sl. No.
Parameter and Unit Inland Surface Water
Public Sewers
Land for Irrigation
Marine Coastal Water
1. Temperature (oC) # - - #2. Colour and Odour $ - $ $3. pH 5.5-9.0 5.5-9.0 5.5-9.0 5.5-9.04. BOD (5 days at 20oC) (mg/L) 30 350 100 1005. COD (mg/L) 250 - - 2506. Bio-assay (% 96-hrs Survival) @ @ @ @7. TSS (mg/L) 100 600 200 100*8. SS Particle size (pass IS Sieve) 850 - - &9. Oil and Grease (mg/L) 10 20 10 2010. Total Residual Chlorine (mg/L) 1 - - 111. Nitrate Nitrogen (mg/L as N) 10 - - 2012. Ammonia Nitrogen (mg/L N) 50 50 - 5013. Kjeldahl Nitrogen (mg/L as N) 100 - - 10014. Free Ammonia (mg/L as N) 5 - - 515. Cyanide (mg/L as CN) 0.2 2 0.2 0.216. Phenol (mg/L C6H5OH) 1 5 - 517. Fluoride (mg/L as F) 2 15 - 1518. Sulphide (mg/L as S) 2 - - 519. Dissolved Phosphate (mg/L P) 5 - - -20. Copper (mg/L as Cu) 3 3 - 321. Iron (mg/L as Fe) 3 3 - 322. Manganese (mg/L as Mn) 2 2 - 223. Zinc (mg/L as Zn) 5 15 - 1524. Nickel (mg/L as Ni) 3 3 - 525. Vanadium (mg/L as V) 0.2 0.2 - 0.226. Arsenic (mg/L as As) 0.2 0.2 0.2 0.227. Mercury (mg/L as Hg) 0.01 0.01 - 0.0128. Lead (mg/L as Pb) 0.1 1 - 129. Cadmium (mg/L as Cd) 2 1 - 230. Chromium (VI) (mg/L as Cr) 0.1 2 - 131. Chromium (Total) (mg/L as Cr) 2 2 - 232. Selenium (mg/L as Se) 0.05 0.05 - 0.0533. Alpha Emitters (10-6µc/mL) 0.1 0.1 0.01 0.134. Beta Emitters (10-6µc/mL) 1 1 0.1 1
# Shall not exceed 5oC above the receiving water temperature. $ All efforts should be made to remove colour and unpleasant odour as far as practicable. @ 90% survival of fish after 96 hours in 100% effluent. * For cooling water effluent 10% above TSS of influent. & (a) Floatable solids 3 mm, (b) Settleable solids 850 micron.

Final Report on Water Quality Management Plan for Ganga RiverVolume IV-4, Feasibility Study for Varanasi City, Part I, Sewerage Scheme
B-4
Table B.4 Revised Criteria for Classification of Inland Water Quality Proposed by CPCB
Tier I : Simple parameters Requirement for Waters of Class Sl. No. Parameters A-Excellent B-Desirable C-Acceptable
(i) Sanitary Survey Very clean neighbourhood and catchment
Reasonably clean neighbourhood
Generally clean neighbourhood
(ii) General Appearance No floating matter No floating matter No floating matter (iii) Colour Absolutely Colourless Almost colourless, very
light shade if any No colour of anthropogenic origin
(iv) Smell Odourless Almost odourless No unpleasant odour (v) Transparency >1.0m depth >0.5m to 1.0m depth >0.2m to 0.5m depth (vi) Ecological*
(Presence of Animals) Fish & insects Fish and insects Fish and insects
Note: *Applicable to only surface water Source : Water quality criteria and goals, CPCB, February, 2002
Tier II : Regular monitoring parameters
Requirement for Waters of Class Sl. No. Parameters A-Excellent B-Desirable C-Acceptable (i) pH 7.0 to 8.5 6.5 to 9.0 6.5 to 9.0 (ii) DO (% Saturation) 90 - 110 80 - 120 60 - 140 (iii) BOD, mg/l Below 2 Below 5 Below 8 (iv) EC, pmhos/cm <1000 <2250 <4000 (v) NO2 + NO3) - Nitrogen,
mg/l <5 <10 <15
(vi) Suspended Solid, mg/l <25 <50 <100 (vii) Faecal Coliform,
MPN/100 ml <20 per 100 ml <200 per 100 ml <2000 per 100 ml
(viii) Bio-assay (Zebra Fish) No death in 5 days No death in 3 days No death in 2 days Note: 1) Dissolved Oxygen (DO) not applicable for ground waters 2) Dissolved oxygen in eutrophicated waters should include diurnal variation 3) Suspended solid limit is applicable only during non-monsoon period. 4) Fecal coliform values should meet for 90% times. 5) Static Bio-Assay method may be adopted. Source : Water quality criteria and goals, CPCB, February, 2002

Final Report on Water Quality Management Plan for Ganga RiverVolume IV-4, Feasibility Study for Varanasi City, Part I, Sewerage Scheme
B-5
Tier III : Special parameters (Only in cases of need/apprehensions) Requirement for Waters of Class Sl. No. Parameters A-Excellent B-Desirable C-Acceptable
1 Total Phosphorous <0.1 mg/l <0.2 mg/l <0.3 mg/l 2 T.K.N. <1.0 mg/l <2.0 mg/l <3.0 mg/l 3 Total Ammonia
(NH4 + NH3) - Nitrogen <0.5 mg/l <1.0 mg/l <1.5 mg/l
4 Phenols <2 µg/l <5 µg/l <10 µg/l 5 Surface Active Agents <20 µg/l <100 µg/l <200 µg/l 6 Organo Chlorine Pesticides <0.05µg/l <0.1 µg/l <0.2 µg/l 7 PAH <0.05µg/l <0.1 µg/l <0.2 µg/l 8 PCB and PCT <0.01 µg/l <0.01 µg/l <0.02 µg/l 9 Zinc <100 µg/l <200 µg/l <300 µg/l
10 Nickel <50 µg/l <100 µg/l <200 µg/l 11 Copper <20 µg/l <50 µg/l <100 µg/l 12 Chromium (Total) <20 µg/l <50 µg/l <100 µg/l 13 Arsenic (Total) <20 µg/l <50 µg/l <100 µg/l 14 Lead <20 µg/l <50 µg/l <100 µg/l 15 Cadmium <1.0 µg/l <2.5 µg/l <5.0 µg/l 16 Mercury <0.2 µg/l <0.5 µg/l <1.0 µg/l
Note: Failure to comply with one or more of the above limits shall imply assignment of the next lower class Source : Water quality criteria and goals, CPCB, February, 2002
Table B.5 Discharge Criteria for Wastewaters Used for Irrigation Suggested Values for Major Inorganic Constituents in Water Applied to the Land
Impact on the Land* Problem and Related Consultant No Problem Increasing Problem Service Salinity Conductivity of Irrigation Water Millimhos/cm < 0.75 0.75 - 3.00 > 3.00 Permeability Conductivity of Irrigation Water Millimhos/cm < 0.50 < 0.50 < 0.20
SAR < 6.00 6.00 - 9.00 > 9.00 Specific Ion Toxicity From root absorption Sodium (evaluated by SAR) me/l < 3.00 3.00 - 9.00 > 9.00
Chloride, me/l < 4.00 4.00 - 10.00 > 10.00 Chloride, mg/l < 142.00 142.00 - 355.00 > 355.00 Boron, mg/l < 0.50 0.50 - 2.00 2.00 - 10.00
From foliar absorption (Sprinklers) Sodium, me/l < 3.00 > 3.00 - Sodium, mg/l < 69.00 > 69.00 - Chloride, me/l < 3.00 > 3.00 - Chloride, mg/l < 106.00 > 106.00 -
Miscellaneous - NO3 - N, NH4 - N mg/l for sensitive crops < 5.00 5.00 - 30.00 > 30.00 HCO3 - mg/l (only with overhead sprinklers) < 1.50 1.50 - 8.50 > 8.50 HCO3 - mg/l < 90.00 90.00 - 520.00 > 520.00 pH Normal range 6.5 - 8.4
* : Interpretations are based on possible effects of constituents on crops and/or soils. Suggested values are flexible and should be modified when warranted by local experience or special conditions of crop, soil and method of irrigation
.SAR : Sodium Absorption Ratio. Source : Manual on sewerage and sewage treatment’, CPHEEO, Ministry of Urban Development, Govt. of India, December 1993.
Table B.6 Suggested Limits for Salinity in Irrigation Waters

Final Report on Water Quality Management Plan for Ganga RiverVolume IV-4, Feasibility Study for Varanasi City, Part I, Sewerage Scheme
B-6
Crop Response Total Dissolved Solids
mg/l Electrical Conductivity
mhos/cm No detrimental effects will usually be noticed 500 0.75 Can have detrimental effects on sensitive crops 500 - 1000 0.75 - 1.50 May have adverse effects on many crops 1000 - 2000 1.50 - 3.00 Can be used for salt tolerant plants on permeable soils with careful management practices 2000 - 5000 3.00 - 7.50
Source : Manual on sewerage and sewage treatment’, CPHEEO, Ministry of Urban Development, Govt. of India, December 1993.
Table B.7 Maximum Permissible Concentration of Toxic Elements in Irrigation Waters
Maximum Permissible Concentration (mg/l) Element For water used continuously on all soils For short term use of fine
texture soils Aluminium Al 1.00 20.00 Arsenic As 1.00 10.00 Beryllium Be 0.50 1.00 Boron Be 0.75 2.00 Cadmium Cd 0.01 0.05 Chromium Cr 5.00 20.00 Cobalt Co 0.20 10.00 Copper Cu 0.20 5.00 Fluorine F 0.00 10.00 Lead Pb 5.00 20.00 Lithium Li 5.00 5.00 Manganese Mn 2.00 20.00 Molybdenum Mo 0.01 0.05 Nickel Ni 0.05 2.00 Selenium Se 0.05 2.00 Vanadium V 10.00 10.00 Zinc Zn 5.00 10.00 Source : Manual on sewerage and sewage treatment’, CPHEEO, Ministry of Urban Development, Govt. of India, December 1993.

Final Report on Water Quality Management Plan for Ganga RiverVolume IV-4, Feasibility Study for Varanasi City, Part I, Sewerage Scheme
B-7
Table B.8 National Ambient Air Quality Standards [as per Environment (Protection) Rules, 1986]
Concentration (µg/m3) in Ambient Air Pollutant Time Weighted Average
Industrial Area
Residential, Rural and Other Areas
Sensitive Area
Annual* 80 60 15Sulphur Dioxide (SO2) 24 Hours** 120 80 30Annual* 80 60 15Oxides of Nitrogen (as NO2) 24 Hours** 120 80 30Annual* 360 140 70Suspended Particulate Matter (SPM) 24 Hours** 500 200 100Annual* 120 60 50Respirable Particulate Matter (RPM)
(size less than 10 µm) 24 Hours** 150 100 75Annual* 1 0.75 0.5Lead (Pb) 24 Hours** 1.5 1 0.75Annual* 100 100 100Ammonia
24 Hours** 400 400 4008 Hours** 5000 2000 1000Carbon Monoxide (CO) 1 Hour 10000 4000 2000
* Annual arithmetic mean of minimum 104 measurements in a year taken twice a week 24-hourly at uniform interval. ** 24-hourly/8-hourly values should be met 98% of the time in a year. However, 2% of the time, it may exceed but not on
two consecutive days.
Table B.9 Ambient Air Quality Standards in Respect of Noise [as per Noise Pollution (Regulation and Control) Rules, 2000]
Limits in dB(A) Leq* Area
Code Category of Area
Day Time Night Time A Industrial Area 75 70 B Commercial Area 65 55 C Residential Area 55 45 D Silence Zone 50 40
Notes: 1. Day time shall mean from 6.00 a.m. to 10.00 p.m. 2. Night time shall mean from 10.00 p.m. to 6.00 a.m. 3. Silence zone is defined as an area comprising not less than 100 metres around hospitals,
educational institutions and courts. The silence zones are zones that are declared as such by the competent authority.
4. Mixed categories of areas may be declared as one of the four above-mentioned categories by the competent authority.
* dB(A) Leq denotes the time weighted average of the level of sound in decibels on scale A which is
relatable to human hearing.
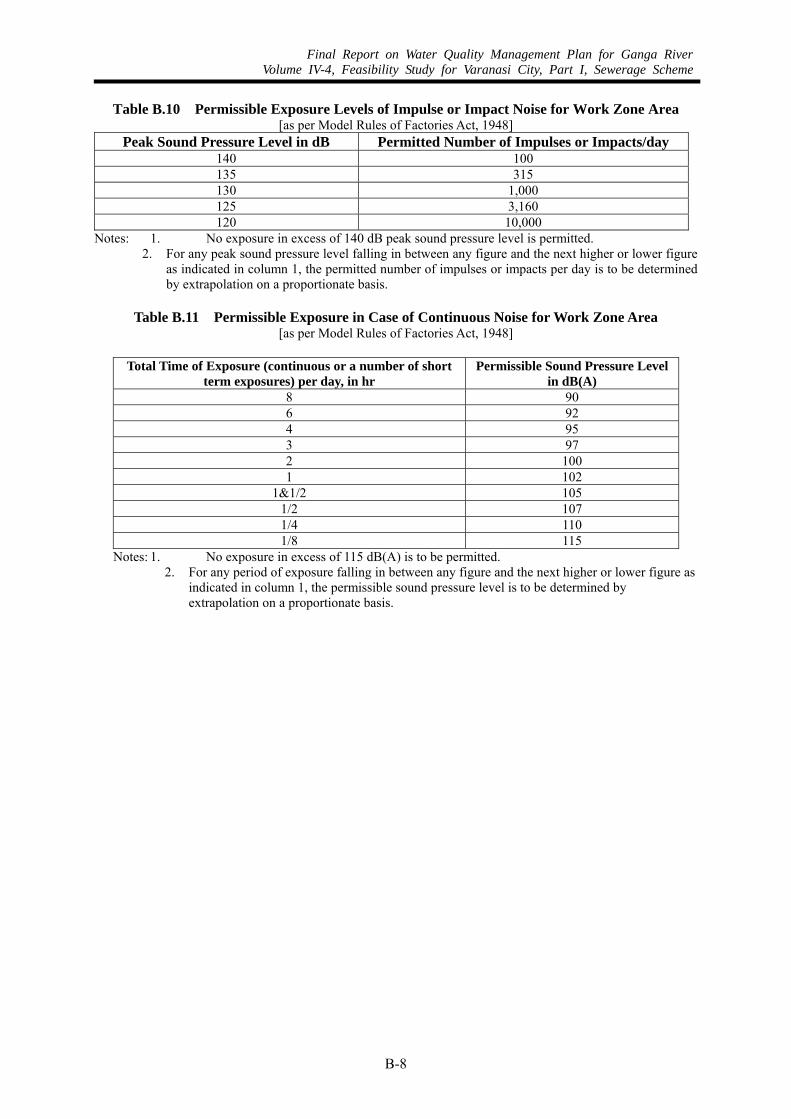
Final Report on Water Quality Management Plan for Ganga RiverVolume IV-4, Feasibility Study for Varanasi City, Part I, Sewerage Scheme
B-8
Table B.10 Permissible Exposure Levels of Impulse or Impact Noise for Work Zone Area [as per Model Rules of Factories Act, 1948]
Peak Sound Pressure Level in dB Permitted Number of Impulses or Impacts/day 140 100 135 315 130 1,000 125 3,160 120 10,000
Notes: 1. No exposure in excess of 140 dB peak sound pressure level is permitted. 2. For any peak sound pressure level falling in between any figure and the next higher or lower figure
as indicated in column 1, the permitted number of impulses or impacts per day is to be determined by extrapolation on a proportionate basis.
Table B.11 Permissible Exposure in Case of Continuous Noise for Work Zone Area
[as per Model Rules of Factories Act, 1948]
Total Time of Exposure (continuous or a number of short term exposures) per day, in hr
Permissible Sound Pressure Level in dB(A)
8 90 6 92 4 95 3 97 2 100 1 102
1&1/2 105 1/2 107 1/4 110 1/8 115
Notes: 1. No exposure in excess of 115 dB(A) is to be permitted. 2. For any period of exposure falling in between any figure and the next higher or lower figure as
indicated in column 1, the permissible sound pressure level is to be determined by extrapolation on a proportionate basis.
Appendix C
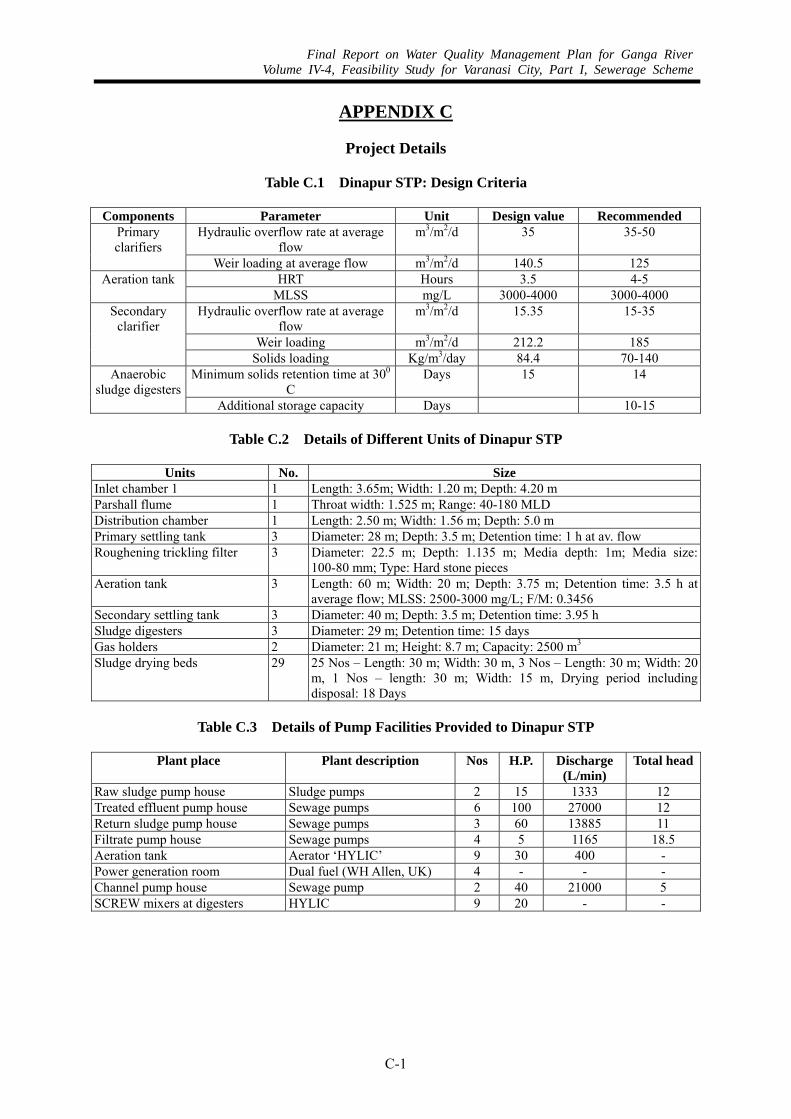
Final Report on Water Quality Management Plan for Ganga RiverVolume IV-4, Feasibility Study for Varanasi City, Part I, Sewerage Scheme
C-1
APPENDIX C
Project Details
Table C.1 Dinapur STP: Design Criteria
Components Parameter Unit Design value Recommended Hydraulic overflow rate at average
flow m3/m2/d 35 35-50 Primary
clarifiers Weir loading at average flow m3/m2/d 140.5 125
HRT Hours 3.5 4-5 Aeration tank MLSS mg/L 3000-4000 3000-4000
Hydraulic overflow rate at average flow
m3/m2/d 15.35 15-35
Weir loading m3/m2/d 212.2 185
Secondary clarifier
Solids loading Kg/m3/day 84.4 70-140 Minimum solids retention time at 300
C Days 15 14 Anaerobic
sludge digesters Additional storage capacity Days 10-15
Table C.2 Details of Different Units of Dinapur STP
Units No. Size
Inlet chamber 1 1 Length: 3.65m; Width: 1.20 m; Depth: 4.20 m Parshall flume 1 Throat width: 1.525 m; Range: 40-180 MLD Distribution chamber 1 Length: 2.50 m; Width: 1.56 m; Depth: 5.0 m Primary settling tank 3 Diameter: 28 m; Depth: 3.5 m; Detention time: 1 h at av. flow Roughening trickling filter 3 Diameter: 22.5 m; Depth: 1.135 m; Media depth: 1m; Media size:
100-80 mm; Type: Hard stone pieces Aeration tank 3 Length: 60 m; Width: 20 m; Depth: 3.75 m; Detention time: 3.5 h at
average flow; MLSS: 2500-3000 mg/L; F/M: 0.3456 Secondary settling tank 3 Diameter: 40 m; Depth: 3.5 m; Detention time: 3.95 h Sludge digesters 3 Diameter: 29 m; Detention time: 15 days Gas holders 2 Diameter: 21 m; Height: 8.7 m; Capacity: 2500 m3 Sludge drying beds 29 25 Nos – Length: 30 m; Width: 30 m, 3 Nos – Length: 30 m; Width: 20
m, 1 Nos – length: 30 m; Width: 15 m, Drying period including disposal: 18 Days
Table C.3 Details of Pump Facilities Provided to Dinapur STP
Plant place Plant description Nos H.P. Discharge
(L/min) Total head
Raw sludge pump house Sludge pumps 2 15 1333 12 Treated effluent pump house Sewage pumps 6 100 27000 12 Return sludge pump house Sewage pumps 3 60 13885 11 Filtrate pump house Sewage pumps 4 5 1165 18.5 Aeration tank Aerator ‘HYLIC’ 9 30 400 - Power generation room Dual fuel (WH Allen, UK) 4 - - - Channel pump house Sewage pump 2 40 21000 5 SCREW mixers at digesters HYLIC 9 20 - -
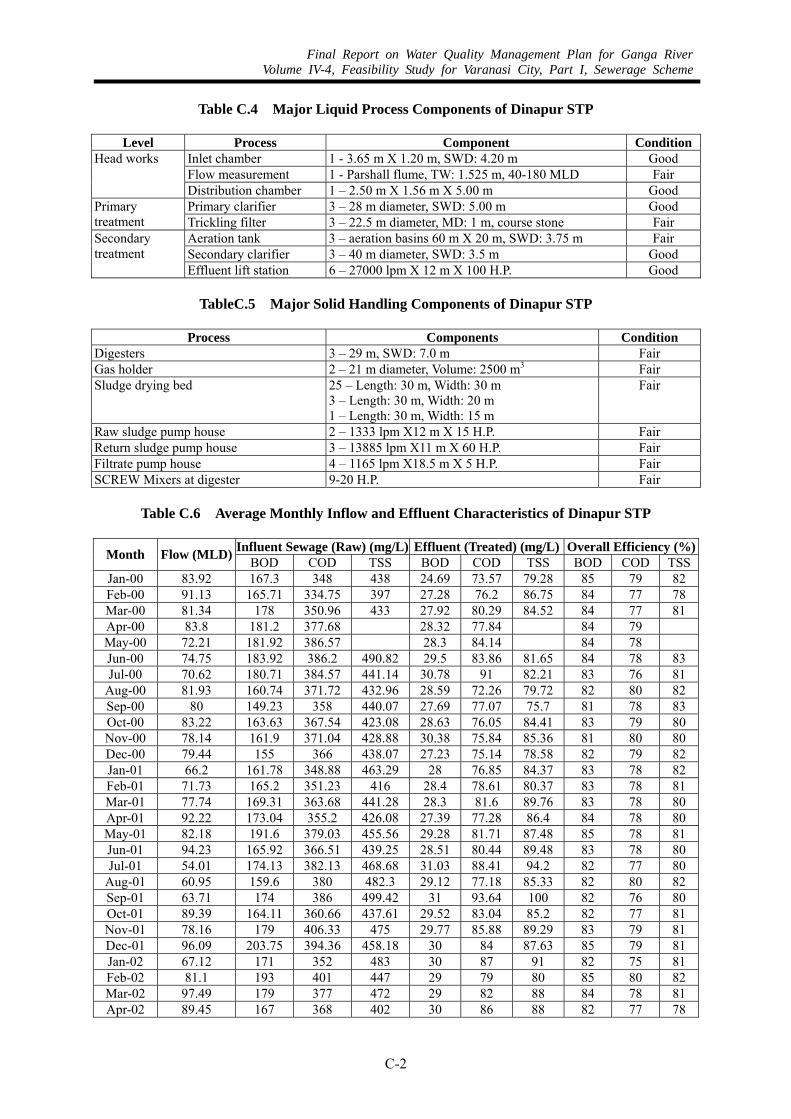
Final Report on Water Quality Management Plan for Ganga RiverVolume IV-4, Feasibility Study for Varanasi City, Part I, Sewerage Scheme
C-2
Table C.4 Major Liquid Process Components of Dinapur STP
Level Process Component ConditionInlet chamber 1 - 3.65 m X 1.20 m, SWD: 4.20 m Good Flow measurement 1 - Parshall flume, TW: 1.525 m, 40-180 MLD Fair
Head works
Distribution chamber 1 – 2.50 m X 1.56 m X 5.00 m Good Primary clarifier 3 – 28 m diameter, SWD: 5.00 m Good Primary
treatment Trickling filter 3 – 22.5 m diameter, MD: 1 m, course stone Fair Aeration tank 3 – aeration basins 60 m X 20 m, SWD: 3.75 m Fair Secondary clarifier 3 – 40 m diameter, SWD: 3.5 m Good
Secondary treatment
Effluent lift station 6 – 27000 lpm X 12 m X 100 H.P. Good
TableC.5 Major Solid Handling Components of Dinapur STP
Process Components Condition Digesters 3 – 29 m, SWD: 7.0 m Fair Gas holder 2 – 21 m diameter, Volume: 2500 m3 Fair Sludge drying bed 25 – Length: 30 m, Width: 30 m
3 – Length: 30 m, Width: 20 m 1 – Length: 30 m, Width: 15 m
Fair
Raw sludge pump house 2 – 1333 lpm X12 m X 15 H.P. Fair Return sludge pump house 3 – 13885 lpm X11 m X 60 H.P. Fair Filtrate pump house 4 – 1165 lpm X18.5 m X 5 H.P. Fair SCREW Mixers at digester 9-20 H.P. Fair
Table C.6 Average Monthly Inflow and Effluent Characteristics of Dinapur STP
Influent Sewage (Raw) (mg/L) Effluent (Treated) (mg/L) Overall Efficiency (%)Month Flow (MLD) BOD COD TSS BOD COD TSS BOD COD TSSJan-00 83.92 167.3 348 438 24.69 73.57 79.28 85 79 82 Feb-00 91.13 165.71 334.75 397 27.28 76.2 86.75 84 77 78 Mar-00 81.34 178 350.96 433 27.92 80.29 84.52 84 77 81 Apr-00 83.8 181.2 377.68 28.32 77.84 84 79 May-00 72.21 181.92 386.57 28.3 84.14 84 78 Jun-00 74.75 183.92 386.2 490.82 29.5 83.86 81.65 84 78 83 Jul-00 70.62 180.71 384.57 441.14 30.78 91 82.21 83 76 81
Aug-00 81.93 160.74 371.72 432.96 28.59 72.26 79.72 82 80 82 Sep-00 80 149.23 358 440.07 27.69 77.07 75.7 81 78 83 Oct-00 83.22 163.63 367.54 423.08 28.63 76.05 84.41 83 79 80 Nov-00 78.14 161.9 371.04 428.88 30.38 75.84 85.36 81 80 80 Dec-00 79.44 155 366 438.07 27.23 75.14 78.58 82 79 82 Jan-01 66.2 161.78 348.88 463.29 28 76.85 84.37 83 78 82 Feb-01 71.73 165.2 351.23 416 28.4 78.61 80.37 83 78 81 Mar-01 77.74 169.31 363.68 441.28 28.3 81.6 89.76 83 78 80 Apr-01 92.22 173.04 355.2 426.08 27.39 77.28 86.4 84 78 80 May-01 82.18 191.6 379.03 455.56 29.28 81.71 87.48 85 78 81 Jun-01 94.23 165.92 366.51 439.25 28.51 80.44 89.48 83 78 80 Jul-01 54.01 174.13 382.13 468.68 31.03 88.41 94.2 82 77 80
Aug-01 60.95 159.6 380 482.3 29.12 77.18 85.33 82 80 82 Sep-01 63.71 174 386 499.42 31 93.64 100 82 76 80 Oct-01 89.39 164.11 360.66 437.61 29.52 83.04 85.2 82 77 81 Nov-01 78.16 179 406.33 475 29.77 85.88 89.29 83 79 81 Dec-01 96.09 203.75 394.36 458.18 30 84 87.63 85 79 81 Jan-02 67.12 171 352 483 30 87 91 82 75 81 Feb-02 81.1 193 401 447 29 79 80 85 80 82 Mar-02 97.49 179 377 472 29 82 88 84 78 81 Apr-02 89.45 167 368 402 30 86 88 82 77 78

Final Report on Water Quality Management Plan for Ganga RiverVolume IV-4, Feasibility Study for Varanasi City, Part I, Sewerage Scheme
C-3
Influent Sewage (Raw) (mg/L) Effluent (Treated) (mg/L) Overall Efficiency (%)Month Flow (MLD) BOD COD TSS BOD COD TSS BOD COD TSSMay-02 79.32 180 366 486 29 88 86 84 76 82 Jun-02 55.49 201 401 468 28 87 86 86 78 82 Jul-02 72.59 178 380 470 28 79 76 84 79 84
Aug-02 87.8 184 380 470 27 84 81.77 85 78 83 AVG 78.67 173.87 371.94 450.81 28.75 81.4 85.15 83 78 81
Table C.7 Design Parameter vs. Actual Parameter of Dinapur STP
Parameter Design Value Actual Value
Peak m3/min 160,000 n.a. Average m3/day 80,000 54,000-98,000
Flow
Minimum m3/min 32,000 n.a. BOD5 (mg/L) 300 149-204 SS (mg/L) 600 397-499
Wastewater Quality
COD (mg/L) 400 335-406 BOD5 (mg/L) 20 25-31 Effluent quality SS (mg/L) 30 73-94
Table C.8 Major Liquid Process Components of Bhagwanpur STP
Level Process Component Condition
Inlet collection chamber 1 – 2.0 m X 1.5 m X 5.0 m Fair Screen chamber 2 – 3.0 m (L) X 0.5 m (W) X 1.0 m (D) Fair Grit chamber 2 – 7.15 m (L) X 2.0 m (W) X 1.3 m (D) Fair
Head works
Flow measurement 1 - Parshall flume, TW: 150 mm, 4-20 MLD Good Primary treatment
Primary clarifier 2 – 14.6 m diameter, SWD: 2.5 m Good
Aeration tank 2 – 15.6 m diameter, SWD: 3.5 m Good Secondary treatment Secondary clarifier 2 – 16.0 m diameter, SWD: 3.5 m Good
Table C.9 Average Monthly Inflow and Effluent Characteristics of Bhagwanpur STP
Influent Sewage (Raw) Effluent (Treated) Overall Efficiency (%) Month
Flow (MLD) BOD COD TSS BOD COD TSS BOD COD TSS
Jan 12.47 98 218 185 22 48 22 78 78 88 Feb 11.42 92 180 176 15 32 17 84 82 90 Mar 10.2 98 176 250 18 65 20 82 63 92 Apr 10.66 92 140 195 18 76 19 80 46 May 11.92 102 173 230 15 52 22 85 70 Jun 12.2 110 196 151 20 41 17 82 79 89 Jul 14.62 96 215 164 14 54 18 85 75 89
Aug 16.72 79 156 158 22 70 16 72 55 90 Sep 15.62 72 150 156 12 36 19 83 76 88 Oct 16 76 184 175 12 52 18 84 72 90 Nov 16.62 97 275 182 16 83 22 84 70 88 Dec 15.75 98 160 178 15 38 20 85 76 89 AVG 13.68 93 179 183 17 54 19 82 70 89

Final Report on Water Quality Management Plan for Ganga RiverVolume IV-4, Feasibility Study for Varanasi City, Part I, Sewerage Scheme
C-4
Table C.10 Assi Main Pumping Station Detail
Capacity 9 MLD Pump House No details Pumping plants 3 Nos 50 H.P. 5000 lpm at 24 m head Diesel generating set 1 No 70 kVA capacity Rising main 400 mm dia, 190 m long PSC rising main from Assi MPS to BHU STP
Table C.11 Konia MPS and Pretreatment Works
Diversion sewer 305 m long 2286 dia brick sewer (old existing) Emergency overflow at Konia high lift
250 m long 2200 mm dia pipe
Screen chamber of 48.33 ft with 2 nos manually cleaned screen Sump of 30 ft diameter with partition wall in between 2 nos pumps of 150 H.P. capacity each with head
Old pump house
1 no pump of 150 H.P. with 2700 lpm discharge at 1.6.6 m head No. of pumps 3 Type Screw type H.P. 215 H.P. each Capacity 1158 lps each Head 8.51 m RPM 29 Make Spans Babcock (Netherlands) Screens 2 nos. mechanically operated, 50 MLD capacity each, Dorr-Oliver make
First stage pumping
Detritor 2 nos. each of 100 MLD capacity with 20% overloading capacity Sump size 32 m X 6 m with partition wall No. of pumps 6 Nos Type Non clog horizontal centrifuge H.P. 3 nos 215 and 3 nos 150 Capacity 740 lps and 420 lps respectively RPM 590 each
Second stage pumping
Make Beacon weir Rising main 1200 mm dia PSC pipe 2.9 km (new); 900 mm dia hume steel pipe 2860 m
long (old) Switch yard Capacity 1600 kVA, transformer 3 nos 1000 kVA each
Table C.12 Summary of Capacity of Konia MPS
Pumping station Installed capacity (lps) Firm capacity (lps) Konia stage 1 – present 3 X 1158 lps = 3474 lps 67% = 2316 Konia stage 2 – present 3 X 420 lps = 1260 lps
3 X 740 lps = 2220 lps 67% = 2320
Konia stage 1 – future 4 X 1158 lps = 4632 lps 75% = 3474 Konia stage 2 – future 3 X 420 lps = 1680 lps
3 X 740 lps = 2960 lps 75% = 3480
Table C.13 Summary of Discharge to Konia MPS via Main Trunk Sewer
Year Parameter
2003 2015 2030 Average flow (MLD) 108 103 93 Peak flow (lps) 2810 2689 2413 Present firm capacity (lps) 2316 2316 2316 Firm capacity with additional pumps (lps)
3474 3474 3474

Final Report on Water Quality Management Plan for Ganga RiverVolume IV-4, Feasibility Study for Varanasi City, Part I, Sewerage Scheme
C-5
Table C.14 Unit wise Details of the 5-Ghat Sewage Pumping Stations
Harischandra Ghat Intermediate Sewage Pumping Station Pump house 6 m dia circular sump cum pump house
Sump floor is 6.5 m below the floor of pump house Pumping plants 1 no. 50 H.P. 5000 lpm at 24.0 m head
1 no. 25 H.P. 2600 lpm at 13.5 m head 1 no. 10 H.P. 1150 lpm at 9.5 m head
Diesel generating set 1 no. of 70 kVA capacity Rising main 200 mm dia C.I. Mansarovar Ghat Intermediate Sewage Pumping Station Pump house 9 m dia circular sump cum pump house
Sump floor is 11.0 m below the floor of pump house Pumping plants 2 nos. 10 H.P. 1300 lpm at 15.0 m head
1 nos. 25 H.P. 2600 lpm at 21.0 m head Diesel generating set 1 no. of 100 kVA capacity Rising main 400 mm dia C.I. R.P. Ghat Intermediate Sewage Pumping Station Pump house 6.1 m internal dia circular sump cum pump house
Sump floor is 18.3 m below the floor of pump house Pumping plants 2 nos. 125 H.P. 15000 lpm at 23.0 m head
2 nos. 75 H.P. 8800 lpm at 22.0 m head Diesel generating set 3 nos. of 160 kVA capacity Rising main 600 mm dia C.I. Jalesan Ghat Intermediate Sewage Pumping Station Pump house 6.1 m internal dia circular sump cum pump house
Sump floor is 16.3 m below the floor of pump house 3.65 m internal dia and 16.45 m deep special manhole
Pumping plants 2 nos. 30 H.P. 3600 lpm at 20.0 m head 2 no. 15 H.P. 1200 lpm at 15.0 m head
Diesel generating set 1 no. of 70 kVA capacity Rising main 250 mm dia C.I. Trilochan Ghat Intermediate Sewage Pumping Station Pump house 6.1 m internal dia circular sump cum pump house
Sump floor is 18.3 m below the floor of pump house 3.65 m internal dia and 18.63 m deep special manhole
Pumping plants 2 nos. 35 H.P. 4100 lpm at 20.5 m head 2 nos. 12 H.P. 1365 lpm at 18.0 m head

Final Report on Water Quality Management Plan for Ganga RiverVolume IV-4, Feasibility Study for Varanasi City, Part I, Sewerage Scheme
C-6
Table C.15 Capacity Analysis of Ghat Pumping Stations
Ghats Capacity of each pumping plant Estimated flow without sewerage improvements (lps) Nos Power Head Dis-char
ge Alow-abl
e at 2003 2015 2030
H.P. (m) (lps) 5/4 lps Avg Peak Reqd Avg Peak Reqd Avg Peak ReqdHarischandra 1 50 24 83.3 116.7 92.6 232 290 82.2 206 258 71.8 179 224Ghat 1 25 13.5 43.3 1 10 9.5 19.2 Total 145.8 Mansarovar 2 10 15 43.3 138.7 29.0 72 90 25.5 65 81 22 56 70Ghat 3 25 21 130.0 Total 173.3 R.P. Ghat 2 125 23 500.0 634.7 289.4 723 904 258.1 644 805 224.5 560 701 2 75 22 293.3 Total 793.3 Jalesan Ghat 2 30 20 120.0 128.0 44 109 136 38.2 97 121 33.6 84 105 2 15 15 40.0 Total 160.0 Trilochan 2 35 20.5 136.7 145.7 84.5 210 262 75.2 187 233 65 162 203Ghat 2 12.5 18 45.5
Total 182.2

Appendix D

Final Report on Water Quality Management Plan for Ganga RiverVolume IV-4, Feasibility Study for Varanasi City, Part I, Sewerage Scheme
D-1
APPENDIX D
Table D.1 Ward Wise Socio-economic Details of Varanasi Population Worker Sl.
No.
Ward
No. Name of Ward Area
(sq. km) No ofHouse
No ofHH Total Male Feml
Sex Ratio
Fam-ily
Size
SC (%)
ST (%)
Lite-rate (%)
Main (%)
Mrg (%)
State : UTTAR PRADESH
Distt : Varanasi Tehsil: Varanasi Town : Lohta C.T.
1 1 Lohta C.T. 2 1324 1348 12394 6651 5743 863 9.2 5 0 33.4 32.3 1.3 Town : Kotwa C.T.
2 1 Kotwa C.T. 2 838 880 9076 4827 4249 880 10.3 6.1 0 35.6 27.7 7.3 Town : Gangapur TA
3 1 Balwanta Nagar 0.2 73 74 699 362 337 931 9.4 0 0 30.5 19.9 04 2 Gandhi Nagar 0.1 73 73 522 269 253 941 7.2 37 0 43.3 18 05 3 Patel Nagar 0.3 79 79 836 441 395 896 10.6 1.4 0 52.8 22.5 06 4 Jawahar Nagar 0.2 65 65 644 327 317 969 9.9 5.1 0 63.2 16.6 0.27 5 Malviya Nagar 0.2 64 65 491 261 230 881 7.6 18.3 0 60.9 25.1 08 6 Azad Nagar 0.2 87 103 724 403 321 797 7 14.1 0 32.7 30.4 1.49 7 Moti Lal Nagar 0.2 36 36 339 187 152 813 9.4 0 0 52.5 27.1 0.3
10 8 Subhas Nagar 0.3 46 46 502 258 244 946 10.9 0 0 21.1 23.3 011 9 Lokmanya Nagar 0.3 82 84 882 451 431 956 10.5 2.7 0 43.2 20.9 0
Town : Varanasi MC 12 1 Bazardiha 3.95 4211 4543 34140 18219 15921 874 7.5 5.5 0 51.4 26 0.313 2 Jolha 2.9 4083 4334 30999 16443 14556 885 7.2 16.9 0.1 50.3 26.9 0.514 3 Assi 4.62 3847 4057 25791 14092 11699 830 6.4 10.6 0 80.9 24.8 0.415 4 Shiwala 1.75 2417 2582 18006 9607 8399 874 7 4.7 0 57.6 25.9 0.116 5 Pandey Haweli 0.87 2603 2708 20215 10644 9571 899 7.5 3.1 0 71.3 26.8 0.117 6 Madanpura 0.53 2138 2211 16702 8856 7846 886 7.6 0.9 0 76.4 29.1 0.418 7 Jangam Badi 0.45 2950 3134 20862 11092 9770 881 6.7 4.8 0 81.8 28.3 019 8 Dashashwamedh 1 1654 1876 11507 6330 5177 818 6.1 0.8 0 81.5 28.2 0.120 9 Garhwali Tola C.K. 0.78 2207 2498 15900 8585 7315 852 6.4 2.8 0 86.3 28 0.421 10 Rajmandir 0.7 1780 2424 14834 7970 6864 861 6.1 2.9 0 83.8 28.3 0.322 11 Kameshar Mahadao 0.67 2156 2224 15092 8182 6910 845 6.8 7.7 0 80.7 27.8 023 12 Bhagatpuri 1.18 3275 3437 24098 13000 11098 854 7 10.9 0 63.4 25.8 0.124 13 Chhittanpura 0.38 3086 3193 26948 14075 12873 915 8.4 2.3 0 46.3 28.7 0.725 14 Madhaymeshawar 0.46 2496 2584 19802 10501 9301 886 7.7 5.3 0 64.3 27.1 0.226 15 Ishawargangi 0.63 2809 2923 20912 11157 9755 874 7.2 3.9 0 72.3 26.4 0.227 16 Sapat_Sagar K. 0.39 2238 2365 18015 9655 8360 866 7.6 4.5 0 73.5 26.6 0.228 17 Piyari Kalan 0.39 2216 2324 17132 9199 7933 862 7.4 3.7 0 71.9 24.7 029 18 Raja Darwaja C.K. 0.37 2137 2253 18939 10139 8800 868 8.4 1.1 0 72.5 26 0.230 19 Kazipur Kalan 0.5 2072 2126 16759 8926 7833 878 7.9 4.5 0 74.9 26 031 20 Mishra Pokhara 1.11 2307 2412 17945 9540 8405 881 7.4 7.2 0 73.1 25.1 0.132 21 Bhelupur 0.86 2773 2817 23275 12519 10756 859 8.3 2.6 0 59.5 26.4 0.833 22 Kamachha 1.2 3541 3708 27055 14584 12471 855 7.3 9.9 0 70.2 27.7 0.134 23 Lahartara 1.75 4791 4949 31406 17274 14132 818 6.3 17.6 0 71.5 24.9 0.235 24 Lallapur kalan 0.9 1829 1981 13763 7394 6369 861 6.9 5.3 0 64 26.1 0.136 25 Pichasmochan 0.82 3516 3796 30117 16205 13912 859 7.9 7.1 0 70.6 25.7 0.537 26 Kazipura Khurd 0.5 2505 2788 21679 11492 10187 886 7.8 4.6 0 65.9 26.8 038 27 Sarai Gobardhan 0.42 2202 2419 19093 10260 8833 861 7.9 4.5 0 78 27.2 0.439 28 Dhoopchandi 1.2 2589 2821 19218 10377 8841 852 6.8 4.5 0 77.6 25.5 0.440 29 Nawapura 0.63 2705 3176 25253 13281 11972 901 8 3.8 0 44.9 29.6 0.941 30 Gopalganj 0.47 1897 2283 21200 11234 9966 887 9.3 1.6 0 41.5 31.9 142 31 Vandhu Kachchibag 4.52 3488 3933 34218 17818 16400 920 8.7 6 0 39.8 28.4 0.943 32 Alaipura 1.13 2928 3387 30448 16223 14225 877 9 5.4 0 36.2 33.1 0.144 33 Kamakgarha 0.49 1936 2448 22652 11932 10720 898 9.3 1.9 0 35.1 30.3 2.645 34 Ghausabad 1.42 2980 3419 26383 14071 12312 875 7.7 9.1 0 52.2 29 0.246 35 Nadesar 1.68 3010 3371 21529 11801 9728 824 6.4 15.7 0 70.3 27.9 0.247 36 Sikraul 4.92 4151 4528 31391 17336 14055 811 6.9 13 0 77.5 24.3 0.348 37 Khajuri 3.52 4144 4595 32671 17783 14888 837 7.1 13.7 0 60.7 24.4 1.249 38 Sarnath 12.29 3684 4277 31689 16780 14909 888 7.4 10.7 0 51.2 26.7 0.350 39 Pandeypur 5.28 4130 4430 33441 18040 15401 854 7.5 13 0 64.3 25.3 0.151 40 Shiopur(Reserve) 6.18 3469 3774 28191 14982 13209 882 7.5 21.5 0 60.5 24.7 0.1
Town : Lahartara OG 52 1 Lahartara O.G. 0.95 451 494 3129 1719 1410 820 6.3 62.3 0 45.8 27.6 1.3
Town : Varanasi Cant. 53 1 Purvottar Rly Colony 0.23 450 455 2510 1443 1067 739 5.5 6.1 0 85.4 27.4 054 2 New Loco Colony 0.11 381 386 2070 1258 812 645 5.4 14.4 0 88.8 31.6 0
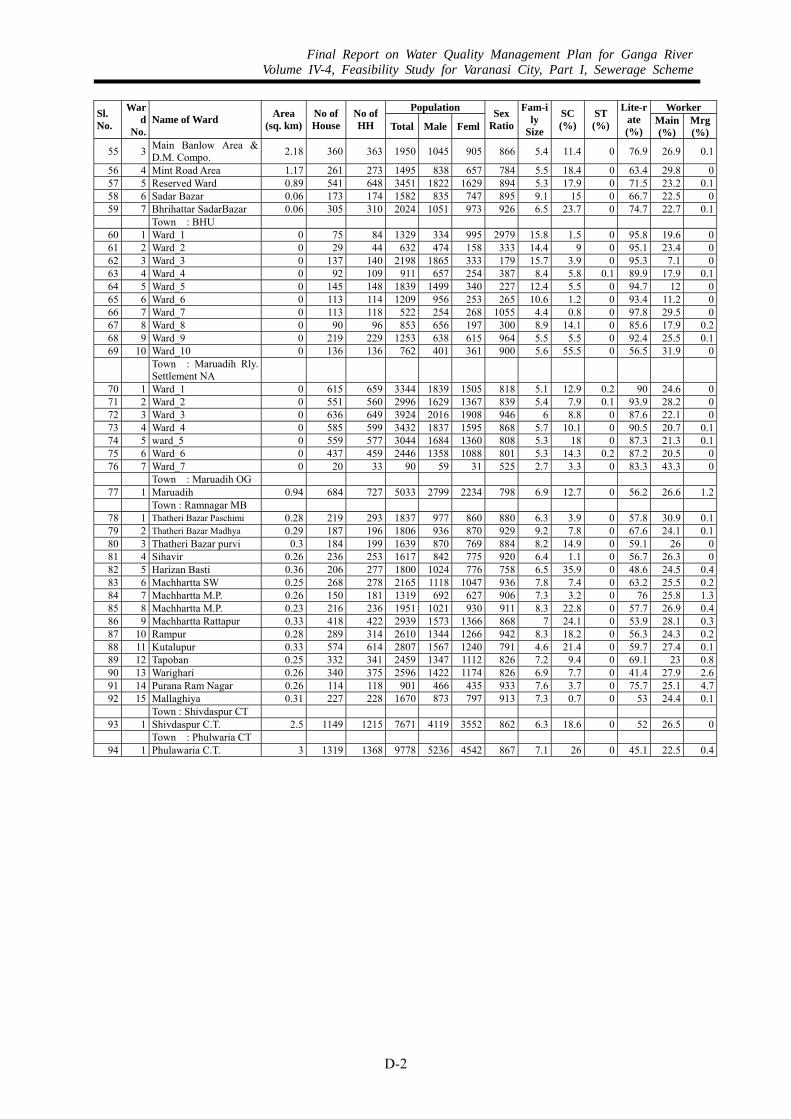
Final Report on Water Quality Management Plan for Ganga RiverVolume IV-4, Feasibility Study for Varanasi City, Part I, Sewerage Scheme
D-2
Population Worker Sl. No.
Ward
No. Name of Ward Area
(sq. km) No ofHouse
No ofHH Total Male Feml
Sex Ratio
Fam-ily
Size
SC (%)
ST (%)
Lite-rate (%)
Main (%)
Mrg (%)
55 3 Main Banlow Area & D.M. Compo. 2.18 360 363 1950 1045 905 866 5.4 11.4 0 76.9 26.9 0.1
56 4 Mint Road Area 1.17 261 273 1495 838 657 784 5.5 18.4 0 63.4 29.8 057 5 Reserved Ward 0.89 541 648 3451 1822 1629 894 5.3 17.9 0 71.5 23.2 0.158 6 Sadar Bazar 0.06 173 174 1582 835 747 895 9.1 15 0 66.7 22.5 059 7 Bhrihattar SadarBazar 0.06 305 310 2024 1051 973 926 6.5 23.7 0 74.7 22.7 0.1
Town : BHU 60 1 Ward_1 0 75 84 1329 334 995 2979 15.8 1.5 0 95.8 19.6 061 2 Ward_2 0 29 44 632 474 158 333 14.4 9 0 95.1 23.4 062 3 Ward_3 0 137 140 2198 1865 333 179 15.7 3.9 0 95.3 7.1 063 4 Ward_4 0 92 109 911 657 254 387 8.4 5.8 0.1 89.9 17.9 0.164 5 Ward_5 0 145 148 1839 1499 340 227 12.4 5.5 0 94.7 12 065 6 Ward_6 0 113 114 1209 956 253 265 10.6 1.2 0 93.4 11.2 066 7 Ward_7 0 113 118 522 254 268 1055 4.4 0.8 0 97.8 29.5 067 8 Ward_8 0 90 96 853 656 197 300 8.9 14.1 0 85.6 17.9 0.268 9 Ward_9 0 219 229 1253 638 615 964 5.5 5.5 0 92.4 25.5 0.169 10 Ward_10 0 136 136 762 401 361 900 5.6 55.5 0 56.5 31.9 0
Town : Maruadih Rly. Settlement NA
70 1 Ward_1 0 615 659 3344 1839 1505 818 5.1 12.9 0.2 90 24.6 071 2 Ward_2 0 551 560 2996 1629 1367 839 5.4 7.9 0.1 93.9 28.2 072 3 Ward_3 0 636 649 3924 2016 1908 946 6 8.8 0 87.6 22.1 073 4 Ward_4 0 585 599 3432 1837 1595 868 5.7 10.1 0 90.5 20.7 0.174 5 ward_5 0 559 577 3044 1684 1360 808 5.3 18 0 87.3 21.3 0.175 6 Ward_6 0 437 459 2446 1358 1088 801 5.3 14.3 0.2 87.2 20.5 076 7 Ward_7 0 20 33 90 59 31 525 2.7 3.3 0 83.3 43.3 0
Town : Maruadih OG 77 1 Maruadih 0.94 684 727 5033 2799 2234 798 6.9 12.7 0 56.2 26.6 1.2
Town : Ramnagar MB 78 1 Thatheri Bazar Paschimi 0.28 219 293 1837 977 860 880 6.3 3.9 0 57.8 30.9 0.179 2 Thatheri Bazar Madhya 0.29 187 196 1806 936 870 929 9.2 7.8 0 67.6 24.1 0.180 3 Thatheri Bazar purvi 0.3 184 199 1639 870 769 884 8.2 14.9 0 59.1 26 081 4 Sihavir 0.26 236 253 1617 842 775 920 6.4 1.1 0 56.7 26.3 082 5 Harizan Basti 0.36 206 277 1800 1024 776 758 6.5 35.9 0 48.6 24.5 0.483 6 Machhartta SW 0.25 268 278 2165 1118 1047 936 7.8 7.4 0 63.2 25.5 0.284 7 Machhartta M.P. 0.26 150 181 1319 692 627 906 7.3 3.2 0 76 25.8 1.385 8 Machhartta M.P. 0.23 216 236 1951 1021 930 911 8.3 22.8 0 57.7 26.9 0.486 9 Machhartta Rattapur 0.33 418 422 2939 1573 1366 868 7 24.1 0 53.9 28.1 0.387 10 Rampur 0.28 289 314 2610 1344 1266 942 8.3 18.2 0 56.3 24.3 0.288 11 Kutalupur 0.33 574 614 2807 1567 1240 791 4.6 21.4 0 59.7 27.4 0.189 12 Tapoban 0.25 332 341 2459 1347 1112 826 7.2 9.4 0 69.1 23 0.890 13 Warighari 0.26 340 375 2596 1422 1174 826 6.9 7.7 0 41.4 27.9 2.691 14 Purana Ram Nagar 0.26 114 118 901 466 435 933 7.6 3.7 0 75.7 25.1 4.792 15 Mallaghiya 0.31 227 228 1670 873 797 913 7.3 0.7 0 53 24.4 0.1
Town : Shivdaspur CT 93 1 Shivdaspur C.T. 2.5 1149 1215 7671 4119 3552 862 6.3 18.6 0 52 26.5 0
Town : Phulwaria CT 94 1 Phulawaria C.T. 3 1319 1368 9778 5236 4542 867 7.1 26 0 45.1 22.5 0.4
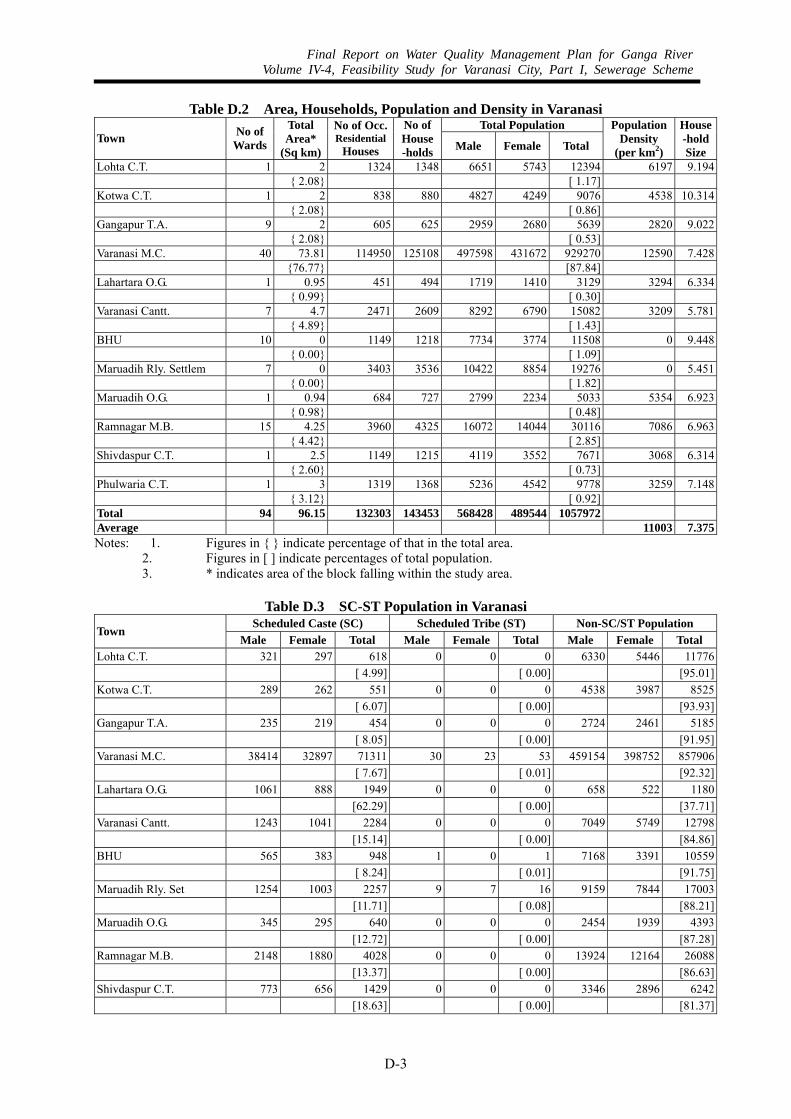
Final Report on Water Quality Management Plan for Ganga RiverVolume IV-4, Feasibility Study for Varanasi City, Part I, Sewerage Scheme
D-3
Table D.2 Area, Households, Population and Density in Varanasi Total Population
Town No of Wards
Total Area*
(Sq km)
No of Occ.Residential
Houses
No ofHouse-holds Male Female Total
PopulationDensity
(per km2)
House-holdSize
Lohta C.T. 1 2 1324 1348 6651 5743 12394 6197 9.194 { 2.08} [ 1.17] Kotwa C.T. 1 2 838 880 4827 4249 9076 4538 10.314 { 2.08} [ 0.86] Gangapur T.A. 9 2 605 625 2959 2680 5639 2820 9.022 { 2.08} [ 0.53] Varanasi M.C. 40 73.81 114950 125108 497598 431672 929270 12590 7.428 {76.77} [87.84] Lahartara O.G. 1 0.95 451 494 1719 1410 3129 3294 6.334 { 0.99} [ 0.30] Varanasi Cantt. 7 4.7 2471 2609 8292 6790 15082 3209 5.781 { 4.89} [ 1.43] BHU 10 0 1149 1218 7734 3774 11508 0 9.448 { 0.00} [ 1.09] Maruadih Rly. Settlem 7 0 3403 3536 10422 8854 19276 0 5.451 { 0.00} [ 1.82] Maruadih O.G. 1 0.94 684 727 2799 2234 5033 5354 6.923 { 0.98} [ 0.48] Ramnagar M.B. 15 4.25 3960 4325 16072 14044 30116 7086 6.963 { 4.42} [ 2.85] Shivdaspur C.T. 1 2.5 1149 1215 4119 3552 7671 3068 6.314 { 2.60} [ 0.73] Phulwaria C.T. 1 3 1319 1368 5236 4542 9778 3259 7.148 { 3.12} [ 0.92] Total 94 96.15 132303 143453 568428 489544 1057972 Average 11003 7.375Notes: 1. Figures in { } indicate percentage of that in the total area.
2. Figures in [ ] indicate percentages of total population. 3. * indicates area of the block falling within the study area.
Table D.3 SC-ST Population in Varanasi
Scheduled Caste (SC) Scheduled Tribe (ST) Non-SC/ST Population Town
Male Female Total Male Female Total Male Female Total Lohta C.T. 321 297 618 0 0 0 6330 5446 11776 [ 4.99] [ 0.00] [95.01]Kotwa C.T. 289 262 551 0 0 0 4538 3987 8525 [ 6.07] [ 0.00] [93.93]Gangapur T.A. 235 219 454 0 0 0 2724 2461 5185 [ 8.05] [ 0.00] [91.95]Varanasi M.C. 38414 32897 71311 30 23 53 459154 398752 857906 [ 7.67] [ 0.01] [92.32]Lahartara O.G. 1061 888 1949 0 0 0 658 522 1180 [62.29] [ 0.00] [37.71]Varanasi Cantt. 1243 1041 2284 0 0 0 7049 5749 12798 [15.14] [ 0.00] [84.86]BHU 565 383 948 1 0 1 7168 3391 10559 [ 8.24] [ 0.01] [91.75]Maruadih Rly. Set 1254 1003 2257 9 7 16 9159 7844 17003 [11.71] [ 0.08] [88.21]Maruadih O.G. 345 295 640 0 0 0 2454 1939 4393 [12.72] [ 0.00] [87.28]Ramnagar M.B. 2148 1880 4028 0 0 0 13924 12164 26088 [13.37] [ 0.00] [86.63]Shivdaspur C.T. 773 656 1429 0 0 0 3346 2896 6242 [18.63] [ 0.00] [81.37]

Final Report on Water Quality Management Plan for Ganga RiverVolume IV-4, Feasibility Study for Varanasi City, Part I, Sewerage Scheme
D-4
Scheduled Caste (SC) Scheduled Tribe (ST) Non-SC/ST Population Town
Male Female Total Male Female Total Male Female Total Phulwaria C.T. 1345 1195 2540 0 0 0 3891 3347 7238 [25.98] [ 0.00] [74.02]Total 47993 41016 89009 40 30 70 520395 448498 968893 [ 8.41] [ 0.01] [91.58]Note: Figures in [ ] indicate percentages of total population.
Table D.4 Sex Ratio and Literacy Rate in Varanasi Population (0-6 Years) Sex Ratio (F/1000 M) Literacy Rate (%6+) Town Male Female Total 0-6Y SC ST Gen. Overall Male Female Overall
Lohta C.T. 1603 1576 3179 983 925 0 860 863 42.75 22.03 33.38 [25.65] {70.2} {29.8}Kotwa C.T. 1228 1174 2402 956 907 0 879 880 46.6 22.73 35.6 [26.47] {70.6} {29.4}Gangapur T.A. 720 654 1374 908 932 0 903 906 58.28 28.63 44.2 [24.37] {69.2} {30.8}Varanasi M.C. 90604 87597 178201 967 856 767 868 868 73.22 52.32 63.64 [19.18] {62.3} {37.7}Lahartara O.G. 335 313 648 934 837 0 793 820 59.97 27.89 45.79 [20.71] {73.1} {26.9}Varanasi Cantt. 1338 1352 2690 1010 837 0 816 819 85.55 64.55 76.33 [17.84] {62.9} {37.1}BHU 287 280 567 976 678 0 473 488 95.43 82.86 91.42 [ 4.93] {71.1} {28.9}Maruadih Rly. Set 1118 930 2048 832 800 778 856 850 96.86 80.64 89.4 [10.62] {58.5} {41.5}Maruadih O.G. 565 504 1069 892 855 0 790 798 68.49 40.4 56.23 [21.24] {68.6} {31.4}Ramnagar M.B. 3047 2960 6007 971 875 0 874 874 69.96 45.08 58.52 [19.95] {64.6} {35.4}Shivdaspur C.T. 904 816 1720 903 849 0 866 862 66.38 35.16 52.02 [22.42] {68.9} {31.1}Phulwaria C.T. 1133 1048 2181 925 888 0 860 867 60.2 27.45 45.14 [22.31] {72.0} {28.0}Total 102882 99204 202086 [19.10] Average 964 855 750 862 861 73.31 51.99 63.58 {62.7} {37.3}Notes: 1. Figures in [ ]) indicate percentages of total population.
2. Figures in { } indicate percentages of total literates.
Table D.5 Work Participation Rate in Varanasi Workers % of Total Population Town No of
Wards Total
Populn Main Marginal Total Non
Workers Main Marginal Non-WkrLohta C.T. 1 12394 3999 158 4157 8237 32.27 1.27 66.46 {96.20} { 3.80} [33.54] Kotwa C.T. 1 9076 2517 667 3184 5892 27.73 7.35 64.92 {79.05} {20.95} [35.08] Gangapur T.A. 9 5639 1264 12 1276 4363 22.42 0.21 77.37 {99.06} { 0.94} [22.63] Varanasi M.C. 40 929270 250900 3703 254603 674667 27 0.4 72.6 {98.55} { 1.45} [27.40] Lahartara O.G. 1 3129 863 42 905 2224 27.58 1.34 71.08 {95.36} { 4.64} [28.92] Varanasi Cantt. 7 15082 3927 6 3933 11149 26.04 0.04 73.92 {99.85} { 0.15} [26.08] BHU 10 11508 1953 4 1957 9551 16.97 0.03 82.99 {99.80} { 0.20} [17.01] Maruadih Rly. Set 7 19276 4430 5 4435 14841 22.98 0.03 76.99 {99.89} { 0.11} [23.01] Maruadih O.G. 1 5033 1339 58 1397 3636 26.6 1.15 72.24
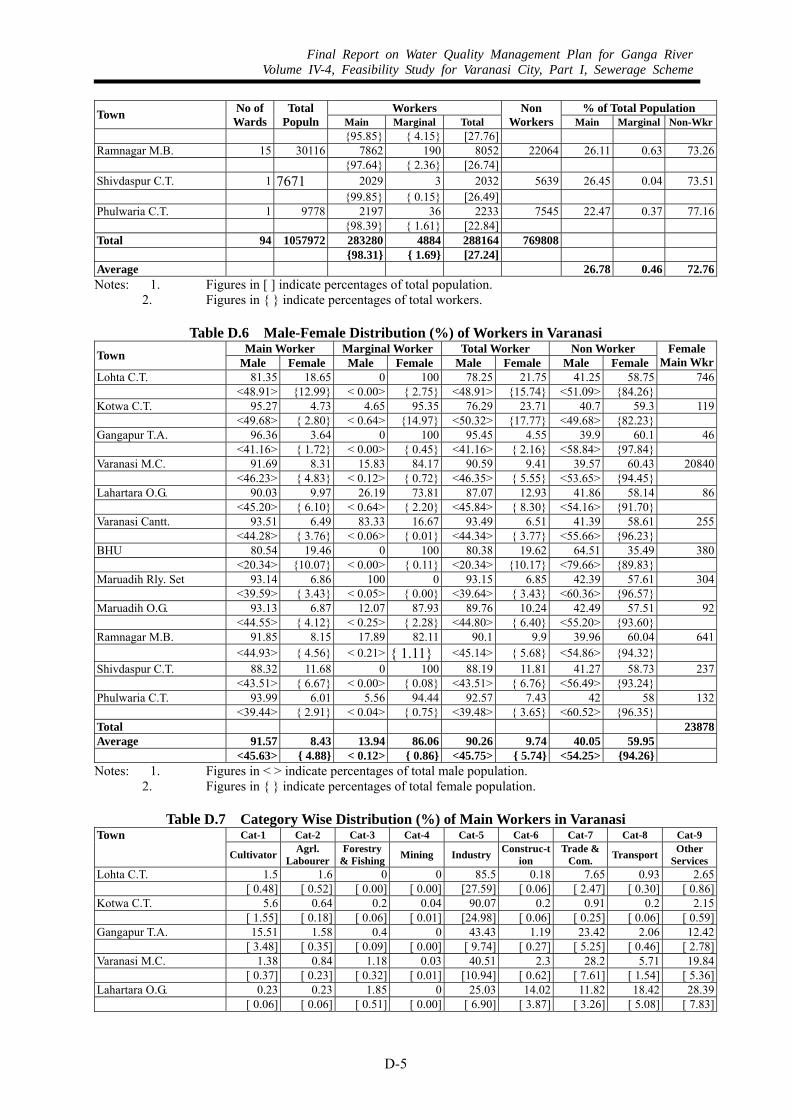
Final Report on Water Quality Management Plan for Ganga RiverVolume IV-4, Feasibility Study for Varanasi City, Part I, Sewerage Scheme
D-5
Workers % of Total Population Town No of Wards
Total Populn Main Marginal Total
Non Workers Main Marginal Non-Wkr
{95.85} { 4.15} [27.76] Ramnagar M.B. 15 30116 7862 190 8052 22064 26.11 0.63 73.26 {97.64} { 2.36} [26.74] Shivdaspur C.T. 1 7671 2029 3 2032 5639 26.45 0.04 73.51 {99.85} { 0.15} [26.49] Phulwaria C.T. 1 9778 2197 36 2233 7545 22.47 0.37 77.16 {98.39} { 1.61} [22.84] Total 94 1057972 283280 4884 288164 769808 {98.31} { 1.69} [27.24] Average 26.78 0.46 72.76Notes: 1. Figures in [ ] indicate percentages of total population.
2. Figures in { } indicate percentages of total workers.
Table D.6 Male-Female Distribution (%) of Workers in Varanasi Main Worker Marginal Worker Total Worker Non Worker Town Male Female Male Female Male Female Male Female
Female Main Wkr
Lohta C.T. 81.35 18.65 0 100 78.25 21.75 41.25 58.75 746 <48.91> {12.99} < 0.00> { 2.75} <48.91> {15.74} <51.09> {84.26}Kotwa C.T. 95.27 4.73 4.65 95.35 76.29 23.71 40.7 59.3 119 <49.68> { 2.80} < 0.64> {14.97} <50.32> {17.77} <49.68> {82.23}Gangapur T.A. 96.36 3.64 0 100 95.45 4.55 39.9 60.1 46 <41.16> { 1.72} < 0.00> { 0.45} <41.16> { 2.16} <58.84> {97.84}Varanasi M.C. 91.69 8.31 15.83 84.17 90.59 9.41 39.57 60.43 20840 <46.23> { 4.83} < 0.12> { 0.72} <46.35> { 5.55} <53.65> {94.45}Lahartara O.G. 90.03 9.97 26.19 73.81 87.07 12.93 41.86 58.14 86 <45.20> { 6.10} < 0.64> { 2.20} <45.84> { 8.30} <54.16> {91.70}Varanasi Cantt. 93.51 6.49 83.33 16.67 93.49 6.51 41.39 58.61 255 <44.28> { 3.76} < 0.06> { 0.01} <44.34> { 3.77} <55.66> {96.23}BHU 80.54 19.46 0 100 80.38 19.62 64.51 35.49 380 <20.34> {10.07} < 0.00> { 0.11} <20.34> {10.17} <79.66> {89.83}Maruadih Rly. Set 93.14 6.86 100 0 93.15 6.85 42.39 57.61 304 <39.59> { 3.43} < 0.05> { 0.00} <39.64> { 3.43} <60.36> {96.57}Maruadih O.G. 93.13 6.87 12.07 87.93 89.76 10.24 42.49 57.51 92 <44.55> { 4.12} < 0.25> { 2.28} <44.80> { 6.40} <55.20> {93.60}Ramnagar M.B. 91.85 8.15 17.89 82.11 90.1 9.9 39.96 60.04 641 <44.93> { 4.56} < 0.21> { 1.11} <45.14> { 5.68} <54.86> {94.32}Shivdaspur C.T. 88.32 11.68 0 100 88.19 11.81 41.27 58.73 237 <43.51> { 6.67} < 0.00> { 0.08} <43.51> { 6.76} <56.49> {93.24}Phulwaria C.T. 93.99 6.01 5.56 94.44 92.57 7.43 42 58 132 <39.44> { 2.91} < 0.04> { 0.75} <39.48> { 3.65} <60.52> {96.35}Total 23878Average 91.57 8.43 13.94 86.06 90.26 9.74 40.05 59.95 <45.63> { 4.88} < 0.12> { 0.86} <45.75> { 5.74} <54.25> {94.26}Notes: 1. Figures in < > indicate percentages of total male population.
2. Figures in { } indicate percentages of total female population.
Table D.7 Category Wise Distribution (%) of Main Workers in Varanasi Town Cat-1 Cat-2 Cat-3 Cat-4 Cat-5 Cat-6 Cat-7 Cat-8 Cat-9
Cultivator Agrl. Labourer
Forestry & Fishing Mining Industry Construc-t
ion Trade &
Com. Transport Other Services
Lohta C.T. 1.5 1.6 0 0 85.5 0.18 7.65 0.93 2.65 [ 0.48] [ 0.52] [ 0.00] [ 0.00] [27.59] [ 0.06] [ 2.47] [ 0.30] [ 0.86]Kotwa C.T. 5.6 0.64 0.2 0.04 90.07 0.2 0.91 0.2 2.15 [ 1.55] [ 0.18] [ 0.06] [ 0.01] [24.98] [ 0.06] [ 0.25] [ 0.06] [ 0.59]Gangapur T.A. 15.51 1.58 0.4 0 43.43 1.19 23.42 2.06 12.42 [ 3.48] [ 0.35] [ 0.09] [ 0.00] [ 9.74] [ 0.27] [ 5.25] [ 0.46] [ 2.78]Varanasi M.C. 1.38 0.84 1.18 0.03 40.51 2.3 28.2 5.71 19.84 [ 0.37] [ 0.23] [ 0.32] [ 0.01] [10.94] [ 0.62] [ 7.61] [ 1.54] [ 5.36]Lahartara O.G. 0.23 0.23 1.85 0 25.03 14.02 11.82 18.42 28.39 [ 0.06] [ 0.06] [ 0.51] [ 0.00] [ 6.90] [ 3.87] [ 3.26] [ 5.08] [ 7.83]

Final Report on Water Quality Management Plan for Ganga RiverVolume IV-4, Feasibility Study for Varanasi City, Part I, Sewerage Scheme
D-6
Town Cat-1 Cat-2 Cat-3 Cat-4 Cat-5 Cat-6 Cat-7 Cat-8 Cat-9
Cultivator Agrl. Labourer
Forestry & Fishing Mining Industry Construc-t
ion Trade &
Com. Transport Other Services
Varanasi Cantt. 0.33 0.41 1.02 0.03 7.08 4.02 13.88 34.28 38.96 [ 0.09] [ 0.11] [ 0.27] [ 0.01] [ 1.84] [ 1.05] [ 3.61] [ 8.92] [10.14]BHU 0 0 0.77 0 1.48 0.46 3.74 0.46 93.09 [ 0.00] [ 0.00] [ 0.13] [ 0.00] [ 0.25] [ 0.08] [ 0.63] [ 0.08] [15.80]Maruadih Rly. Set 0.38 0.07 0.29 0 80.74 1.42 3.91 1.24 11.94 [ 0.09] [ 0.02] [ 0.07] [ 0.00] [18.56] [ 0.33] [ 0.90] [ 0.29] [ 2.74]Maruadih O.G. 6.8 19.42 0.9 0.07 22.48 4.85 26.89 4.78 13.82 [ 1.81] [ 5.17] [ 0.24] [ 0.02] [ 5.98] [ 1.29] [ 7.15] [ 1.27] [ 3.68]Ramnagar M.B. 4.17 2.45 3.18 0.05 31.71 3.08 21.28 5.24 28.83 [ 1.09] [ 0.64] [ 0.83] [ 0.01] [ 8.28] [ 0.80] [ 5.56] [ 1.37] [ 7.53]Shivdaspur C.T. 3.4 0.79 4.29 0.1 25.58 5.13 28.04 9.51 23.16 [ 0.90] [ 0.21] [ 1.13] [ 0.03] [ 6.77] [ 1.36] [ 7.42] [ 2.52] [ 6.13]Phulwaria C.T. 8.06 11.97 1.32 0 18.16 4.64 19.21 14.52 22.12 [ 1.81] [ 2.69] [ 0.30] [ 0.00] [ 4.08] [ 1.04] [ 4.32] [ 3.26] [ 4.97]Average 1.6 1.04 1.21 0.03 40.84 2.35 26.58 5.98 20.35 [ 0.43] [ 0.28] [ 0.32] [ 0.01] [10.94] [ 0.63] [ 7.12] [ 1.60] [ 5.45] <86.20> <85.50> <95.00> <96.51> <90.56> <98.02> <96.75> <98.80> <84.47> {13.80} {14.50} { 5.00} { 3.49} { 9.44} { 1.98} { 3.25} { 1.20} {15.53}Average A 1.51 0.97 1.26 0.03 40.39 2.52 28.09 6.46 18.77(Male) B < 0.69> < 0.44> < 0.57> < 0.01> <18.43> < 1.15> <12.82> < 2.95> < 8.57>Average C 2.63 1.79 0.72 0.01 45.73 0.55 10.24 0.85 37.48(Female) D { 0.13} { 0.09} { 0.04} { 0.00} { 2.23} { 0.03} { 0.50} { 0.04} { 1.83}Cat-1: Cultivators, Cat-2: Agricultural Labourers, Cat-3: Livestock, Forestry, Fishing, Plantation & Allied Activities, Cat-4: Mining & Quarrying, Cat-5: Manufacturing, Processing, Servicing & Repairs in Industry, Cat-6: Construction, Cat-7: Trade & Commerce, Cat-8: Transport, Storage & Communications, Cat-9: Other Services Notes: 1. Figures in [ ] indicate percentages of total population.
2. Figures in < > indicate male percentages in that category. 3. Figures in { } indicate female percentages in that category. 4. A indicates category wise % distribution of male main workers. 5. B indicates percentages of total male population. 6. C indicates category wise % distribution of female main workers. 7 D indicates percentages of total female population.
Table D.8 Sector Wise Distribution (%) of Main Workers in Varanasi
Primary (Cat-1+2+3+4) Secondary (Cat-5+6) Tertiary (Cat-7+8+9) Town Male Female Total Male Female Total Male Female Total Lohta C.T. 2.8 0.3 3.1 68.47 17.2 85.67 10.08 1.15 11.23 < 1.68> { 0.21} [ 1.00] <41.17> {11.98} [27.64] < 6.06> { 0.80} [ 3.62]Kotwa C.T. 6.2 0.28 6.48 85.98 4.29 90.27 3.1 0.16 3.26 < 3.23> { 0.16} [ 1.80] <44.83> { 2.54} [25.03] < 1.62> { 0.09} [ 0.90]Gangapur T.A. 16.93 0.55 17.48 43.12 1.5 44.62 36.31 1.58 37.9 < 7.23> { 0.26} [ 3.92] <18.42> { 0.71} [10.00] <15.51> { 0.75} [ 8.49]Varanasi M.C. 3.02 0.41 3.42 38.92 3.89 42.82 49.75 4.01 53.76 < 1.52> { 0.24} [ 0.92] <19.63> { 2.26} [11.56] <25.09> { 2.33} [14.51]Lahartara O.G. 2.2 0.12 2.32 36.04 3.01 39.05 51.8 6.84 58.63 < 1.11> { 0.07} [ 0.64] <18.09> { 1.84} [10.77] <26.00> { 4.18} [16.17]Varanasi Cantt. 1.53 0.25 1.78 10.92 0.18 11.1 81.05 6.06 87.11 < 0.72> { 0.15} [ 0.46] < 5.17> { 0.10} [ 2.89] <38.39> { 3.51} [22.68]BHU 0.67 0.1 0.77 1.84 0.1 1.95 78.03 19.25 97.29 < 0.17> { 0.05} [ 0.13] < 0.47> { 0.05} [ 0.33] <19.71> { 9.96} [16.51]Maruadih Rly. Set 0.7 0.05 0.74 79.41 2.75 82.17 13.02 4.06 17.09 < 0.30> { 0.02} [ 0.17] <33.76> { 1.38} [18.88] < 5.54> { 2.03} [ 3.93]Maruadih O.G. 26.74 0.45 27.18 26.29 1.05 27.33 40.1 5.38 45.48 <12.79> { 0.27} [ 7.23] <12.58> { 0.63} [ 7.27] <19.19> { 3.22} [12.10]Ramnagar M.B. 8.48 1.37 9.86 32.28 2.51 34.79 51.08 4.27 55.35 < 4.15> { 0.77} [ 2.57] <15.79> { 1.40} [ 9.08] <24.99> { 2.39} [14.45]Shivdaspur C.T. 8.18 0.39 8.58 27.7 3.01 30.7 52.44 8.28 60.72 < 4.03> { 0.23} [ 2.27] <13.64> { 1.72} [ 8.12] <25.83> { 4.73} [16.06]
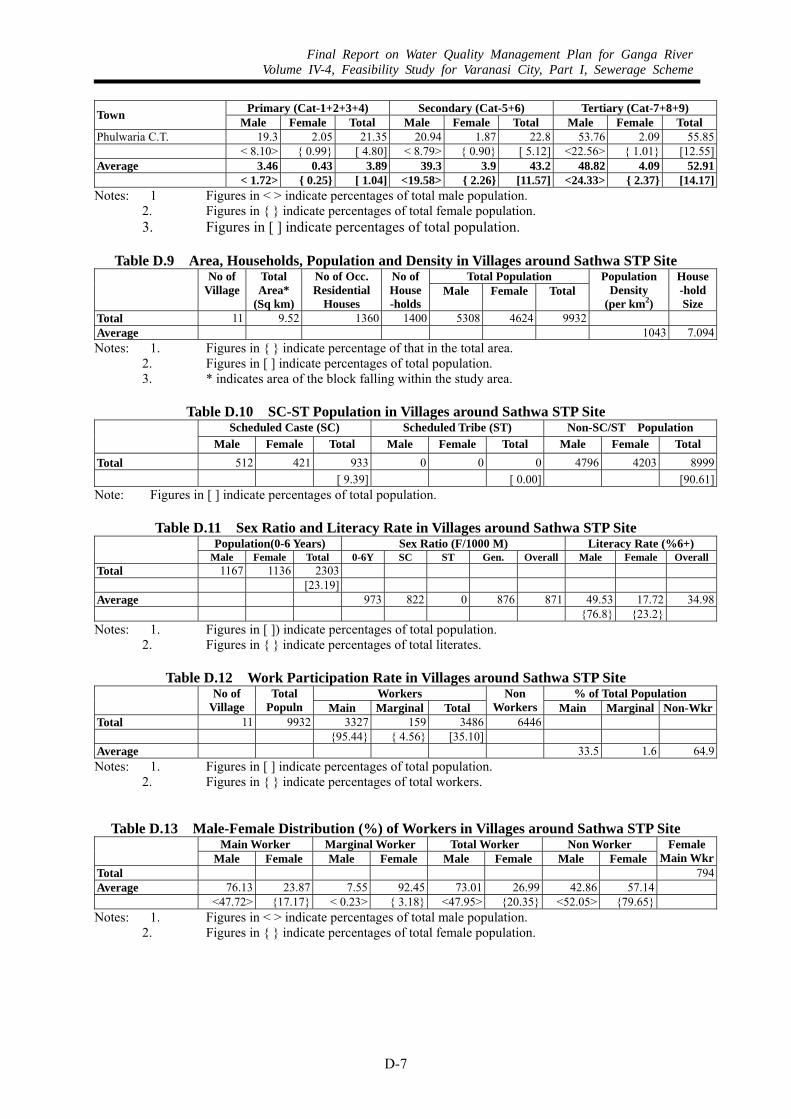
Final Report on Water Quality Management Plan for Ganga RiverVolume IV-4, Feasibility Study for Varanasi City, Part I, Sewerage Scheme
D-7
Primary (Cat-1+2+3+4) Secondary (Cat-5+6) Tertiary (Cat-7+8+9) Town Male Female Total Male Female Total Male Female Total Phulwaria C.T. 19.3 2.05 21.35 20.94 1.87 22.8 53.76 2.09 55.85 < 8.10> { 0.99} [ 4.80] < 8.79> { 0.90} [ 5.12] <22.56> { 1.01} [12.55]Average 3.46 0.43 3.89 39.3 3.9 43.2 48.82 4.09 52.91 < 1.72> { 0.25} [ 1.04] <19.58> { 2.26} [11.57] <24.33> { 2.37} [14.17]Notes: 1 Figures in < > indicate percentages of total male population.
2. Figures in { } indicate percentages of total female population. 3. Figures in [ ] indicate percentages of total population.
Table D.9 Area, Households, Population and Density in Villages around Sathwa STP Site
Total Population No ofVillage
Total Area*
(Sq km)
No of Occ. Residential
Houses
No ofHouse-holds
Male Female Total Population
Density (per km2)
House-holdSize
Total 11 9.52 1360 1400 5308 4624 9932 Average 1043 7.094Notes: 1. Figures in { } indicate percentage of that in the total area.
2. Figures in [ ] indicate percentages of total population. 3. * indicates area of the block falling within the study area.
Table D.10 SC-ST Population in Villages around Sathwa STP Site
Scheduled Caste (SC) Scheduled Tribe (ST) Non-SC/ST Population Male Female Total Male Female Total Male Female Total
Total 512 421 933 0 0 0 4796 4203 8999 [ 9.39] [ 0.00] [90.61]Note: Figures in [ ] indicate percentages of total population.
Table D.11 Sex Ratio and Literacy Rate in Villages around Sathwa STP Site Population(0-6 Years) Sex Ratio (F/1000 M) Literacy Rate (%6+)
Male Female Total 0-6Y SC ST Gen. Overall Male Female OverallTotal 1167 1136 2303 [23.19] Average 973 822 0 876 871 49.53 17.72 34.98 {76.8} {23.2}Notes: 1. Figures in [ ]) indicate percentages of total population.
2. Figures in { } indicate percentages of total literates.
Table D.12 Work Participation Rate in Villages around Sathwa STP Site Workers % of Total Population No of
VillageTotal
Populn Main Marginal Total Non
Workers Main Marginal Non-WkrTotal 11 9932 3327 159 3486 6446 {95.44} { 4.56} [35.10] Average 33.5 1.6 64.9Notes: 1. Figures in [ ] indicate percentages of total population.
2. Figures in { } indicate percentages of total workers.
Table D.13 Male-Female Distribution (%) of Workers in Villages around Sathwa STP Site Main Worker Marginal Worker Total Worker Non Worker
Male Female Male Female Male Female Male Female Female
Main WkrTotal 794Average 76.13 23.87 7.55 92.45 73.01 26.99 42.86 57.14 <47.72> {17.17} < 0.23> { 3.18} <47.95> {20.35} <52.05> {79.65}Notes: 1. Figures in < > indicate percentages of total male population.
2. Figures in { } indicate percentages of total female population.

Final Report on Water Quality Management Plan for Ganga RiverVolume IV-4, Feasibility Study for Varanasi City, Part I, Sewerage Scheme
D-8
Table D.14 Category Wise Distribution (%) of Main Workers in Villages around Sathwa STP Site
Cat-1 Cat-2 Cat-3 Cat-4 Cat-5 Cat-6 Cat-7 Cat-8 Cat-9
Cultivator Agrl. Labourer
Forestry & Fishing
Mining Industry Construction Trade & Com.
Transport Other Services
Average 36.7 29.61 0.69 0 15.54 3.79 3.85 1.41 8.42 [12.29] [ 9.92] [ 0.23] [ 0.00] [ 5.21] [ 1.27] [ 1.29] [ 0.47] [ 2.82] <77.81> <56.85> <95.65> < 0.00> <89.75> <90.48> <94.53> <100.0> <91.07> {22.19} {43.15} { 4.35} { 0.00} {10.25} { 9.52} { 5.47} { 0.00} { 8.93}Average A 37.5 22.11 0.87 0 18.32 4.5 4.78 1.86 10.07(Male) B <17.90> <10.55> < 0.41> < 0.00> < 8.74> < 2.15> < 2.28> < 0.89> < 4.80>Average C 34.13 53.53 0.13 0 6.68 1.51 0.88 0 3.15(Female) D { 5.86} { 9.19} { 0.02} { 0.00} { 1.15} { 0.26} { 0.15} { 0.00} { 0.54}Cat-1: Cultivators, Cat-2: Agricultural Labourers, Cat-3: Livestock, Forestry, Fishing, Plantation & Allied Activities, Cat-4: Mining & Quarrying, Cat-5: Manufacturing, Processing, Servicing & Repairs in Industry, Cat-6: Construction, Cat-7: Trade & Commerce, Cat-8: Transport, Storage & Communications, Cat-9: Other Services Notes: 1. Figures in [ ] indicate percentages of total population.
2. Figures in < > indicate male percentages in that category. 3. Figures in { } indicate female percentages in that category. 4. A indicates category wise % distribution of male main workers. 5. B indicates percentages of total male population. 6. C indicates category wise % distribution of female main workers. 7 D indicates percentages of total female population.
Table D.15 Sector Wise Distribution (%) of Main Workers in Villages around Sathwa STP Site
Primary (Cat-1+2+3+4) Secondary (Cat-5+6) Tertiary (Cat-7+8+9) Male Female Total Male Female Total Male Female Total
Average 46.05 20.95 67 17.37 1.95 19.33 12.71 0.96 13.68 <28.86> {15.07} [22.44] <10.89> { 1.41} [ 6.47] < 7.97> { 0.69} [ 4.58]Notes: 1 Figures in < > indicate percentages of total male population.
2. Figures in { } indicate percentages of total female population. 3. Figures in [ ] indicate percentages of total population.
Table D.16 Amenities and Facilities Available in Villages around Sathwa STP Site
Amenity/Facility Description No of Facility
No of Village
% of Total Villages
Total no of village 11 No of un-inhabited village 0 Educational Facilities: No of village having facility: Within village 6 54.55 Within 5 km 5 45.45 Within 5-10 km 0 0 Beyond 10 km 0 0 No of educational institutions: Primary school 5 Middle school 1 High school 1 Pre-university college 1 Graduate college 0 Adult literacy centre 1 Industrial school 0 Training school 0 Other educational institutions 4 Medical Facilities: No of village having facility: Within village 11 100 Within 5 km 0 0

Final Report on Water Quality Management Plan for Ganga RiverVolume IV-4, Feasibility Study for Varanasi City, Part I, Sewerage Scheme
D-9
Amenity/Facility Description No of Facility
No of Village
% of Total Villages
Within 5-10 km 0 0 Beyond 10 km 0 0 No of medical institutions: Hospital 2 Maternity & child welfare centre 0 Maternity homes 0 Child welfare centre 0 Primary health centre 0 Health centre 0 Primary health sub-centre 2 Dispensary 0 Family planning centre 0 Tuberculosis clinic 0 Nursing home 0 Community health worker 8 Registered private practitioner 0 Subsi. medical practitioner 0 Other medical centre 0 Drinking Water Facilities: No of village having facility: Within village 11 100 Within 5 km 0 0 Within 5-10 km 0 0 Beyond 10 km 0 0 No of village having: Tap water 0 0 Well water 31 281.82 Tank water 0 0 Tube well water 0 0 Hand pump water 7 63.64 River water 0 0 Fountain water 0 0 Canal water 0 0 Lake water 0 0 Spring water 0 0 Nala water 0 0 Other drinking water sources 0 0 Post & Telegraph Facilities: No of village having facility: Within village 1 9.09 Within 5 km 10 90.91 Within 5-10 km 0 0 Beyond 10 km 0 0 No of village having: Post office 1 9.09 Telegraph office 0 0 Post & telegraph office 0 0 Telephone connection 0 0 Market Facilities: No of village having facility: Within village 1 9.09 Within 5 km 7 63.64 Within 5-10 km 3 27.27 Beyond 10 km 0 0 No of village having market on: Monday 0 0 Tuesday 0 0 Wednesday 0 0 Thursday 0 0
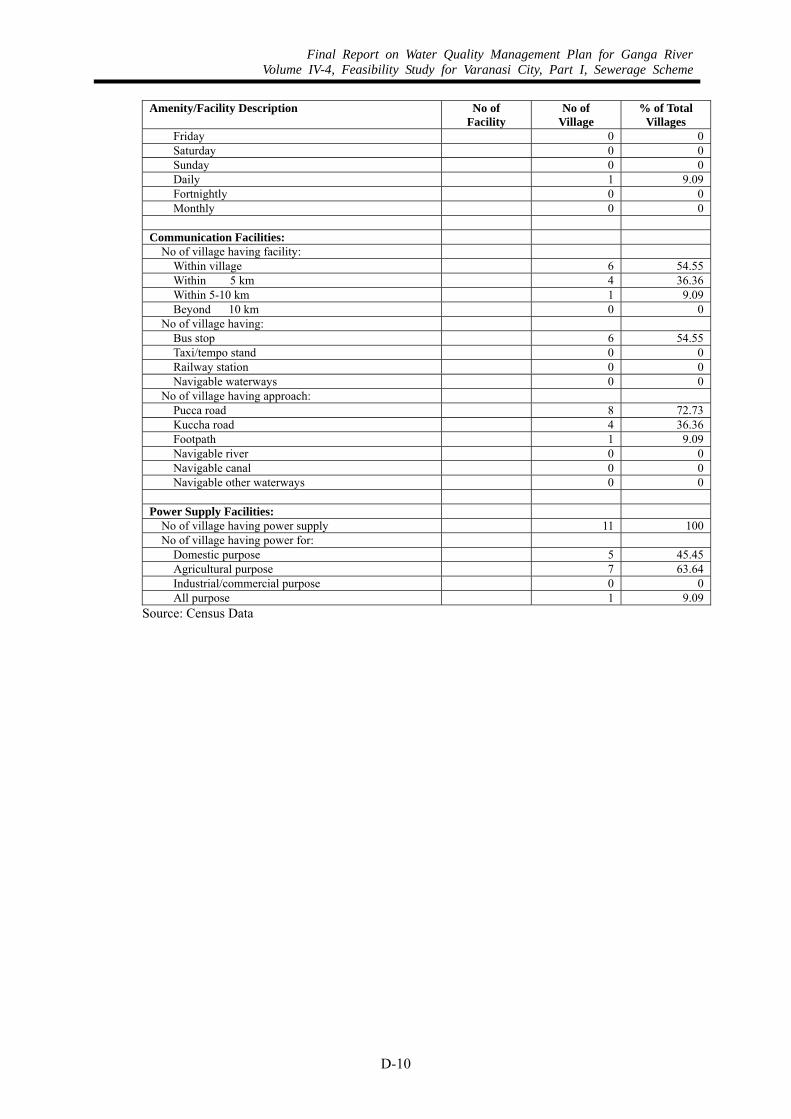
Final Report on Water Quality Management Plan for Ganga RiverVolume IV-4, Feasibility Study for Varanasi City, Part I, Sewerage Scheme
D-10
Amenity/Facility Description No of Facility
No of Village
% of Total Villages
Friday 0 0 Saturday 0 0 Sunday 0 0 Daily 1 9.09 Fortnightly 0 0 Monthly 0 0 Communication Facilities: No of village having facility: Within village 6 54.55 Within 5 km 4 36.36 Within 5-10 km 1 9.09 Beyond 10 km 0 0 No of village having: Bus stop 6 54.55 Taxi/tempo stand 0 0 Railway station 0 0 Navigable waterways 0 0 No of village having approach: Pucca road 8 72.73 Kuccha road 4 36.36 Footpath 1 9.09 Navigable river 0 0 Navigable canal 0 0 Navigable other waterways 0 0 Power Supply Facilities: No of village having power supply 11 100 No of village having power for: Domestic purpose 5 45.45 Agricultural purpose 7 63.64 Industrial/commercial purpose 0 0 All purpose 1 9.09
Source: Census Data