the study on the development of industrial statistics …
TRANSCRIPT

THE STUDY
ON
THE DEVELOPMENT OF INDUSTRIAL
STATISTICS
IN
THE SOCIALIST REPUBLIC OF VIETNAM
FINAL REPORT
(SUMMARY)
AUGUST 2006
JAPAN INTERNATIONAL COOPERATION AGENCY
UNICO INTERNATIONAL CORPORATION HITACHI RESEARCH INSTITUTE
No.
SOCIALIST REPUBLIC OF VIETNAM THE GENERAL STATISTICS OFFICE OF VIETNAM (GSO)
EDJR
06-110

Abbreviation
DSO : District Statistics Office
FDI : Foreign Direct Investment
GDP : Gross Domestic Product
GSO : General Statistics Office
HCMC : Ho Chi Minh City HS : Harmonized Commodity Description and Coding System IIP : Index of Industrial Production
ISIC : International Standard Industrial Classification
JICA : Japan International Cooperation Agency
MOI : Ministry of Industry
MOLISA : Ministry of Labour, War Invalids and Social Affairs
MPI : Ministry of Planning and Investment
MSMIP : Monthly Survey of Major Industrial Products
PMO : Prime Minister Office
PSO : Province Statistics Office
SSI : Institute of Statistical Science
UNDP : United Nations Development Programme
UNIDO : United Nations Industrial Development Organization
VCPC : Vietnamese Central Product Classification
VND : Vietnamese Dong
VSIC : Vietnam Standard Industrial Classification

Exchange Rate:
The exchange rate applied in this report is: USD1=15,900 VND.

S - i
Table of Contents Page
Executive Summary
1. Outline of the Development Plan for Current Production Statistics ........................... S1
2. Outline of the Development Plan for the Index of Industrial Production ................... S6
3. Outline of Action Plans............................................................................................... S8
1. Outline of the Survey and Composition of the Report
1.1 Background of the Study............................................................................................. S1 - 1
1.2 Objectives of the Study ............................................................................................... S1 - 1
1.3 Scope of the Study ...................................................................................................... S1 - 2
1.4 Survey Schedule.......................................................................................................... S1 - 3
1.4.1 Overall Schedule................................................................................................... S1 - 3
1.4.2 Implementation Schedule of Trial Surveys .......................................................... S1 - 3
1.5 Composition of the Report .......................................................................................... S1 - 3
2. Analysis of Current State
2.1 Organization of GSO................................................................................................... S2 - 1
2.2 GSO Annual Budget ................................................................................................... S2 - 4
2.3 Legal Institution for Statistics ..................................................................................... S2 - 4
2.4 Type and Coverage of GSO Statistics......................................................................... S2 - 6
2.5 Dissemination of GSO Statistics ................................................................................. S2 - 7
2.6 Industrial Statistics in Vietnam ................................................................................... S2 - 8
2.7 Monthly Industrial Sample Survey ............................................................................. S2 - 9
2.8 Current State of the GSO’s Monthly Industrial Sample Survey and Major Issues ..... S2 - 13
2.8.1 Major Characteristics of Survey Design and Issues ............................................. S2 - 13
2.8.2 Major Characteristics and Issues Relating to Survey Implementation ................. S2 - 15
2.9 Current Status of Computer Systems at GSO and PSOs and Major Issues................. S2 - 16
2.9.1 Overview of GSO Systems Division .................................................................... S2 - 16
2.9.2 System Configuration of Hardware ...................................................................... S2 - 16
2.9.3 Configuration of Software .................................................................................... S2 - 18

S - ii
2.9.4 Communication Network Architecture................................................................. S2 - 18
2.9.5 IT Centers ............................................................................................................. S2 - 19
2.9.6 Overview of the System in the Industrial and Constructional Statistics Department ........................................................................................................... S2 - 19
2.9.7 Computer System of PSO/DSO............................................................................ S2 - 20
2.10 Problems and Issues Relating to System Development and Operation....................... S2 - 20
2.10.1 Problems Relating to System Development ......................................................... S2 - 20
2.10.2 Problems Relating to System Operation............................................................... S2 - 22
3. Summary, Result and Evaluation of Trial Surveys
3.1 Implementation Summary of Trial Survey.................................................................. S3 - 1
3.1.1 Outline and Purpose of Trial Survey .................................................................... S3 - 1
3.1.2 Survey Target Selection........................................................................................ S3 - 1
3.1.3 Survey System and Methodology......................................................................... S3 - 13
3.1.4 Survey Items and Questionnaires ......................................................................... S3 - 19
3.2 Analysis of Results of Trial Surveys........................................................................... S3 - 22
3.2.1 Collection, Examination and Input ....................................................................... S3 - 22
3.2.2 Publication ............................................................................................................ S3 - 29
3.3 Lessons Learned from the Trial Survey Results ......................................................... S3 - 31
4. Development Plan for Current Production Statistics
4.1 General Outline of the Development Plan for Current Production Statistics.............. S4 - 1
4.1.1 Design Principle ................................................................................................... S4 - 1
4.1.2 Official Name of the Current Production Statistics Survey.................................. S4 - 2
4.1.3 Survey System and Organization.......................................................................... S4 - 2
4.1.4 Survey Items ......................................................................................................... S4 - 9
4.1.5 Form of Questionnaire.......................................................................................... S4 - 10
4.1.6 Methodology for the Current Production Statistics Survey.................................. S4 - 13
4.2 Dissemination.............................................................................................................. S4 - 14
4.2.1 Dissemination Policy............................................................................................ S4 - 14
4.2.2 Dissemination Rules and Procedures.................................................................... S4 - 15
4.2.3 Items to be Disseminated...................................................................................... S4 - 16

S - iii
4.2.4 Dissemination Procedures .................................................................................... S4 - 16
4.3 Development Schedule................................................................................................ S4 - 17
4.3.1 Preparation Period for Formalization (May 2006 - January 2007)....................... S4 - 17
4.3.2 Implementation of the Official Survey - First Year (February 2007 - January 2008) ....................................................................................................... S4 - 18
4.3.3 Implementation of the Official Survey - Second Year (February 2008 and later) ............................................................................................................... S4 - 19
4.4 Operating Budget ........................................................................................................ S4 - 21
5. Fundamental Designing for the Development of the Index of Industrial Production (IIP)
5.1 Index Calculation for Statistics in Vietnam and Major Issues .................................... S5 - 1
5.1.1 Index Calculation for Statistics in Vietnam.......................................................... S5 - 1
5.1.2 Major Issues to be Addressed ............................................................................... S5 - 2
5.2 Index Calculation by New Methodology .................................................................... S5 - 3
5.2.1 New Methodology ................................................................................................ S5 - 3
5.2.2 Index Items ........................................................................................................... S5 - 3
5.2.3 Weight Calculation ............................................................................................... S5 - 3
5.2.4 Data Compilation Flow for Index Calculation ..................................................... S5 - 5
5.2.5 Revision for the Base Period and Commodity Selection...................................... S5 - 5
5.2.6 Notes on Application of New Index ..................................................................... S5 - 7
5.3 Basic Thoughts of System Development .................................................................... S5 - 8
6. Action Plans for Institutionalization of the Current Production Statistics Survey
6.1 Positioning of Action Plans......................................................................................... S6 - 1
6.2 Action Plans ................................................................................................................ S6 - 1
6.2.1 Appointment and Team Organization Plan for the Institutionalization of MSMIP............................................................................................................. S6 - 1
6.2.2 Statistical Reliance Improvement Support Plan ................................................... S6 - 2
6.2.3 Action Plan to develop the “Master Sample” and the MSMIP Establishment List ................................................................................................ S6 - 4
6.2.4 Organization Plan for the Household Enterprise Data Analysis Team................. S6 - 4
6.2.5 Plan for Education and Training Planning for Enumerators and Statistical Analysts ............................................................................................... S6 - 5

S - iv
Tables
Table 1 Comparison of the Proposed Survey System “MSMIP” and the Present Survey System “Monthly Industrial Sample Survey” ......................... S3
Table 2 Items to Calculate Indexes ............................................................................... S7
Table 2-1 Main Statistics Compiled by the GSO ............................................................. S2 - 6
Table 2-2 Number of Enterprises for Monthly Industrial Survey by Enterprise Type..... S2 - 10
Table 2-3 Dissemination Items in the Monthly Industrial Survey ................................... S2 - 13
Table 3-1 Comparison of Trial Surveys 1 and 2 .............................................................. S3 - 1
Table 3-2 Cities and Provinces Covered by Trial Surveys............................................... S3 - 2
Table 3-3 Selected Sectors and Representative Ratio in Country by Output Value......... S3 - 7
Table 3-4 Number of Enterprises (Establishments) Covered by Trial Surveys ............... S3 - 12
Table 3-5 Implementation Period of Trial Surveys .......................................................... S3 - 14
Table 3-6 Main Sectors with Large Amount of Other Products....................................... S3 - 24
Table 3-7 Major Incorrect Classification of Enterprises .................................................. S3 - 25
Table 3-8 Considered Industries for Plural Questionnaire Distribution........................... S3 - 26
Table 3-9 Lessons Learned from Trial Survey Results and Recommendations for Improvement .............................................................................................. S3 - 32
Table 5-1 Items to Calculate Indexes ............................................................................... S5 - 3
Table 5-2 Number of Transaction Occurred During the Trial Surveys............................ S5 - 8
Table 5-3 Number of Expected Transactions ................................................................... S5 - 9
Figures
Figure 1 Concept of Expansion ...................................................................................... S8
Figure 2 Weight Calculation for Commodity................................................................. S8
Figure 2-1 GSO Organization Chart .................................................................................. S2 - 3
Figure 2-2 Breakdown of Vietnamese Enterprises by Form of Ownership in Industry Sector (Output Value Share) in 2004................................................. S2 - 14

S - v
Figure 2-3 Network Configuration of GSO....................................................................... S2 - 17
Figure 3-1 Scoring Structure for Target Manufacturing Sector Selection......................... S3 - 4
Figure 3-2 Selection Flow of Target Sectors for Trial Surveys......................................... S3 - 6
Figure 3-3 Selection Flow of Target Commodities on Trial Survey 2 .............................. S3 - 9
Figure 3-4 Conceptual Diagram of Target Enterprise/Establishment Selection for Trial Surveys .............................................................................................. S3 - 11
Figure 3-5 Implementation Structure for Trial Survey ...................................................... S3 - 13
Figure 3-6 Flow of Trial Survey ........................................................................................ S3 - 14
Figure 3-7 Questionnaire Collection Cycle (Example) ..................................................... S3 - 15
Figure 3-8 Implementation Flow of Trial Survey.............................................................. S3 - 18
Figure 3-9 Questionnaire for Trial Survey (Sample of Trial Survey 2)............................. S3 - 21
Figure 4-1 Questionnaire (Sample).................................................................................... S4 - 11
Questionnaire (Back Sheet) ............................................................................. S4 - 12
Figure 4-2 Development Schedule in the Next Two Years ............................................... S4 - 20
Figure 5-1 Concept of Expansion ...................................................................................... S5 - 4
Figure 5-2 Weight Calculation for Commodity................................................................. S5 - 4
Figure 5-3 Compilation Flow of Index Calculation........................................................... S5 - 5
Figure 5-4 Contents and Schedule of System Development.............................................. S5 - 12

Executive Summary

Executive Summary
S - 1
Executive Summary
1. Outline of the Development Plan for Current Production Statistics
This report proposes the basic development plan for the “current production statistics survey” and “production indexes,” which will be institutionalized for sustainable implementation in the Social Republic of Vietnam. This section presents a general outline of the basic development plan, as follows.
(1) Design Principle
1) The proposed survey is designed to collect numeric data relating to industrial activities on a commodity basis.
2) It makes monthly production activities and trends of Vietnamese industries with sufficient levels of reliability and promptness.
3) It produces current production statistics that are internationally comparable. 4) It tabulates and publishes statistical data at national and local (by administrative unit)
levels. 5) It produces production indexes by using modern statistical techniques that comply with
applicable international standards. 6) It is designed with a view to reducing survey costs and burdens on surveyed subjects
(enterprises/establishments).
(2) Name of the Proposed Survey The current production statistics survey to be implemented under the development plan is
formally called “Monthly Survey of Major Industrial Products (MSMIP).”
(3) Survey Implementation Body As a supreme organization responsible for management of the new statistical survey
system, the MISMIP Supervisory Board will be established. Under the supervision of the board, the GSO’s Industry and Construction Statistics Department will serve as a leading agency responsible for implementation of the survey-related activities by using the GSO’s network of local organizations including the PSOs and the DSOs.
(4) Survey Object
The primary object of the current production statistics survey is establishments (and enterprises) that manufacture commodities listed in the questionnaire used for the survey.
(5) Size of Survey
Number of industries: 75 (with the combined representation rate exceeding 90% of total industry output in Vietnam, of which 8 sectors are in

Executive Summary
S - 2
mining, 64 sectors are in manufacturing, and 3 sectors are in electricity/gas/water)
Number of commodities: 630 (with the combined representation rate exceeding 80% of the subject industry)
Number of establishments: 4,000 - 4,500 (Establishments of enterprises. With the combined representation rate exceeding 75% of the industry’s total output)
Note that household industries may be added to surveyed establishments to meet the local
needs as the result of further analysis on the Pre-survey.
(6) Survey Items The survey covers six items, namely quantity of production, quantity of shipments,
quantity of internal consumption, quantity of ending inventory, value of shipments (based on invoice), and quantity of projected monthly production.
(7) Start of the Survey
The current production statistics survey is scheduled to start in February 2007 (covering January) as the government’s designated (official) survey.
(8) Survey Cycle
Deadline for submission by surveyed establishments: 12th of each month Submission from the PSO to the GSO: 18th of each month Dissemination of preliminary results: 25th of each month
(9) Dissemination Policy 1) Dissemination is made promptly and timely unless statistical reliability is affected. 2) Dissemination is made in such manner to ensure fair treatment of all users. 3) Dissemination is made on a preset date. 4) Dissemination contains analysis and explanation that is appropriate or required for
convenience of users. 5) Dissemination contains explanation on statistical techniques employed, including the
survey and data processing methods. 6) Dissemination is accompanied by organized user service, such as responding to questions.
(10) Dissemination Contents
1) Tabulated data on production, shipment, inventory, and projected production by product (actual number and year-to-year basis).
2) Production index by product (value-added weight, production value weight), shipment index, inventory index, and projected production index.

Executive Summary
S - 3
3) Outline of trend report Utilizing the national-level tabulated data but it is necessary to discuss to disseminate data
by regional basis and by enterprise type in the future.
(11) Dissemination Method 1) Current production statistics on a national level and indexes, both preliminary and finial
results, are published on the GSO’s Web site and by printed reports. 2) National-level data, both preliminary and final results, are published in Vietnamese and
English. 3) The GSO is responsible for dissemination of national and regional statistics (eight
economic divisions) and the PSO publishes provincial and municipal statistics. The following table compares the proposed MSMIP survey and the ongoing Monthly
Industrial Sample Survey conducted by the GSO, and their major differences.
Table 1 Comparison of the Proposed Survey System “MSMIP” and the Present Survey System “Monthly Industrial Sample Survey”
The proposed survey system “MSMIP”
The ongoing survey system for monthly industrial statistics
Major difference
Major objectives
To understand the current state of industrial production by collecting monthly production data on a commodity basis.
To develop production indices with international compatibility
To understand industry trends by collecting production data on 34 key commodities, including the value of production.
The IIP means the ratio of increase/decrease to the previous year’s data.
The new system emphasizes variation of production quantity of a large number of key commodities.
The present system emphasizes the value of production with view to grasping the progress of economic development and the operating status of enterprises.
Target users
Industrial and trade policymakers, manufacturers, consumers, exporters and importers, market researchers, foreign investment organizations, international economics researchers
Organizations supervising central and local state enterprises or FDI enterprises, and central and local government offices
The major user of the present survey system is a group of technocrats responsible for management of industrial production under a centrally planned economy.
The new system will be used by industrial policymakers, researchers and decision

Executive Summary
S - 4
The proposed survey system “MSMIP”
The ongoing survey system for monthly industrial statistics
Major difference
makers who analyze industrial production trends under the transition period to a market economy, and representatives from private sectors.
Questionnaire
The questionnaire consists of a single sheet designed for each of the surveyed sectors, which prints the name of commodities included in each type of industry.
The questionnaire consists of a single sheet designed according to the type of enterprise. The respondent to enter product information freely.
The present questionnaire primarily contains questions on shipment value of enterprise and asks the respondent to enter information freely, resulting in variation of the degree of detail between respondents.
Survey items
1. Items relating to products
(1) Production quantity (2) Shipment quantity (3) Beginning inventory
quantity (4) Internal consumption
quantity (5) Shipment value (6) Projected production
quantity
1. Enterprise name 2. Major business
activities (1) Form of ownership (2) The following data for
the current month, an accumulated total of the current year (from January to the current month), and the ensuing month (estimate):
a. Production (in 1994 constant price) (million dongs)
b. Total turnover (million dongs)
c. Turnover by industry (million dongs)
d. Consumption tax (million dongs)
e. List of manufactured items (code, unit, production quantity)
f. Operating status of enterprises in the surveyed month
The new system will focus on production quantity by commodity as well as beginning inventory.
The new system will collect data of shipment value of each product will be collected.
Comparison of the survey frame and the
selection method
The selection process starts with industrial sectors, in the order of
All of state and FDI enterprises will be surveyed.
The new system will select enterprises that produce major

Executive Summary
S - 5
The proposed survey system “MSMIP”
The ongoing survey system for monthly industrial statistics
Major difference
value added. For each industrial sector, major commodities will be selected.
For each commodity, enterprises will be selected.
In the final stage, around 7,000 enterprises will be selected for the survey.
As for non-state enterprises, the sample survey is carried out (15% on the average).
The total number of enterprises surveyed, including state, FDI and non-state enterprises, is approximately 5,200 (The sample survey covers 1,880 out of 12,535 non-state enterprises the mining and manufacturing sector.)
commodities that are selected for the survey.
The survey frame for the present system consists of state and FDI enterprises (100%) and non-state enterprises (sampled, 15% coverage).
Sample of Household will be selected by GSO’s own decision.
Survey objectives Establishment base Enterprise base To cover production sites
Comparison of survey organizations and
methods
Unified under the organization consisting of GDO, PSOs and DSOs.
State and FDI enterprises are surveyed by the PSOs according to the reporting system and the results are reported to the GSO.
Non-state enterprises selected by sampling are surveyed by the PSO/DSO team, with the average sampling rate of 15%.
The new system conducts the production quantity survey by commodity under a unified organization in order to ensure that target enterprises are surveyed accurately in terms of sector and commodity.
Tabulation, analysis and dissemination
methods
Questionnaires collected are checked at each DSO for any omission or error and are then sent to the PSO, where questionnaires collected from all DSOs under the PSO are assorted. After data input, the data is sent to the GSO by the electronic file format.
The GSO rechecks questionnaires sent from the PSOs and tabulates the results, which are analyzed and
Questionnaires collected from state and FDI enterprises are tabulated at each PSO and the results are sent to the GSO.
Questionnaires completed by non-state enterprises are collected by the DSOs. After preliminary check, they are tabulated to estimate the total figures, which are then sent to the PSO. After the summation and tabulation at each PSO, final data are sent to the
Under the new system, data obtained from completed questionnaires are sent to the GSO in two steps (DSO and PSO), which streamline preliminary reporting and prevent any error or undue manipulation from occurring in the collection process.

Executive Summary
S - 6
The proposed survey system “MSMIP”
The ongoing survey system for monthly industrial statistics
Major difference
published as a preliminary report.
GSO.
Commodity classification used for the summary table for
survey results
Approximately 630 commodities (final goal) according to the international classification standard.
34 major commodities which source of classification is unknown.
The new system relies on the international classification standard to ensure international comparison.
Representation by type of enterprise and
region
While almost all of state and FDI enterprises will be covered by the survey, some non-state enterprises, small enterprises in particular, will not covered as their share of total production is very small.
As for geographical representation, further study and examination is required.
All of state and FDI enterprises are covered.
Non-state enterprises are sampled (15%) uniformly in terms of enterprise size and region, but a relatively small sample size appears to cause a significant error between the estimated and actual figures in some cases.
Examination should be made as to how current production statistics (by commodity) and indices can be used at ministerial levels.
Use of statistics at local level
As the proposed system primarily aims to produce production quantity statistics by commodity covering the entire country, the need for tabulation on a regional basis will be discussed in the future.
Examination should be made as to possibility of region-based production index.
Industrial production statistics are being used by ministries and local governments for administrative purposes.
Production statistics covering 34 commodities are tabulated on a provincial basis.
Possible use of the summary table under the new system will be examined further in the future.
2. Outline of the Preliminary Development Plan for Production Indexes
(1) Index Calculation Method The Laspeyres formula, internationally recognized, is used for calculation of production
indexes in Vietnam.
Laspeyres production index: 10000
0×
∑∑
QP
QP t

Executive Summary
S - 7
(2) Index items
Four basic indicators are selected as indexed items, namely production, shipment, inventory, and project production indexes.
Table 2 Items to Calculate Indexes
Index Items Purpose Representation Weight Production Index (Value-added Weight)
Representation of production or supply trend
VSIC 1 and 2 digit Value added
Production Index (Value of production Weight)
Representation of production trends with comparison to shipment and inventory index
VSIC 1 and 2 digit
Value of production
Shipment Index Representation of demand for products
VSIC 1 and 2 digit Turnover
Inventory Index Representation of inventory level
VSIC 1 and 2 digit
Inventory Value
Projected Production Index Representation of production in the next reference month
VSIC 1 and 2 digit Value added
(3) Weight Calculation
1) Weight at Industry Level The “expansion” method is used to calculate a weighted share of selected industries so
that they can represent the share of unselected industries. The weight at VSIC 4-digit level is determined by allocating the expanded weight at VSIC 2-digit level to the VSIC 4-digit level in order to harness the expanded weight at the VSIC 4-digit level.
The expansion from VSIC 2-digit level to the VSIC 1-digit level, and the allocation of
expanded weight into the VSIC 4-digit level is performed by the following equation. The conceptual view is shown in Figure 1.
Expanded Weight
of Selected Industry (VSIC 2)
= 2) (VSICIndustry Selected the for Weightof Sum1) (VSICIndustry the for Weight
XWeight for the
Selected Industry (VSIC 2)
Weight
of Selected Industry (VSIC 4)
= 4) (VSICIndustry Selected the for Weightof Sum2) (VSICIndustry the for WeightExpanded
XWeight for the
Selected Industry (VSIC 4)

Executive Summary
S - 8
Figure 1 Concept of Expansion
2) Weight at Product Level The process involves: (1) estimation of price by dividing the value of shipments by the
quantity of shipments; (2) estimation of values of production and inventory by multiplying the price to the quantity of production and the quantity of inventory; and (3) application of the product share to the respective VSIC 4-digit data from the Enterprise Census.
Figure 2 Weight Calculation for Commodity
3. Outline of Action Plans
This report contains five action plans that are to be promptly put into action by the GSO’s Industry and Construction Statistics Department for institutionalization of the MSMIP. They are outlined as follows.
Total
(=100)
VSIC 1-digit
VSIC15
VSIC 2-digit
VSIC16 (selected)
VSIC17 (selected)
VSIC18 (selected)
1810 (unselected)
1830 (selected)
VSIC 4-digit
allocation Expansion 1820 (selected)
VSIC1820 (selected) VSIC1830 (selected)
5000000
Mil Dong
Weight for Each
Value at VSIC 4-digit (Enterprise Census)
1000000 Mil Dong (20%)
750000 Mil Dong (15%)750000 Mil Dong (15%)
1250000 Mil Dong (25%)
1250000 Mil Dong (25%)
Value for Each Commodity
Commodity A (20%)
Commodity B (15%) Commodity C (15%)
Commodity D (25%)
Commodity E (25%)

Executive Summary
S - 9
(1) Appointment of the Team Organization Plan for the institutionalization of MSMIP Within the GSO’s Industry and Construction Statistics Department, a team in charge of
startup of the MSMIP will be formally appointed and the preparatory work for the MSMIP will be incorporated into the GSO’s ordinary business. The Preparation Team for MSMIP Institutionalization, as tentatively named, will be organized by five members, namely a team leader and four members in charge of “procedure and budgeting,” “survey planning and design,” “data configuration and system development,” and “local promotion and training.” Then, specific time and budget will be formally allocated to the team for implementation of the preparatory work. Upon institutionalization of the MSMIP (started from 2007), the team will be transformed to the secretariat of the MSMIP Supervisory board.
(2) Statistical Reliance Improvement Support Plan
To ensure reliability of the new survey for current production statistics, the “Statistical Reliance Improvement Support Plan” will be formulated by the Preparation Team for MSMIP Institutionalization, followed by prompt implementation by the GSO. The plan essentially sets forth an implementation guideline for the basic plan proposed in this report and contains the following support programs to supplement the basic plan: ① a program to develop survey plans and designs; ② a program to review and revise survey designs; and ③ an educational and promotional program.
(3) Action Plan to develop the “Master Sample” and the MSMIP Establishment List
Types of establishments contained in the latest list of companies will be rechecked on the basis of the enterprise census survey conducted in March 2005 and will be established as the GSO master samples. The MSMIP establishment list will be made on the basis of the master samples. In this case, data on household enterprises will be treated separately, but they will be added to the MSMIP establishment list by using information in the population group list for the establishment census (to be compiled in the near future) as reference.
(4) Organization Plan for the Household Enterprise Data Analysis Team
Within the GSO Industry and Construction Statistics Department, a team will be organized to thoroughly analyze household data obtained during the pre-survey. In consideration of the department’s manpower and resources, however, it is not realistic to organize an ad-hoc team for implementation of this plan. Instead, the team will be led by members of the Preparation Team for MSMIP Institutionalization, with assistance of the Trade, Services, Prices Statistics Department as required. The team will analyze the survey results and decide on standards and rules for treating household industries (e.g., the form of questionnaire compared to other enterprise types, presence of problems relating to data processing and tabulation), which will then be reflected in the official survey (in 2007 and afterwards). According to circumstances, the team may have to consider the possibility of conducting a survey of small enterprises and micro-enterprises, including households, as separated from the MSMIP.

Executive Summary
S - 10
(5) Plan for Education and Training Planning for Enumerators and Statistical Analysts This proposal consists of the formulation of an education and training plan for enumerators
in areas that will be covered by the pre-survey and the official survey. The plan will be implemented under the leadership of the GSO’s Industry and Construction Statistics Department. In the planning process, the development of the curriculum and selection of instructors will be made by utilizing expertise and experience of staff of the Industry and Construction Statistics Department and PSOs in Hanoi and Ho Chi Minh. Also, the training of statistical analysts will be carried out by using overseas training programs as far as possible.

1. Outline of the Survey and Composition of the Report

1. Outline of the Survey and Composition of the Report
S1 - 1
1. Outline of the Survey and Composition of the Report
This is the summary of the Final Report for “A Study on the Development of Industrial Statistics in the Socialist Republic of Vietnam.” The Study has been conducted since May 2004, in cooperation of the General Statistics Office of Vietnam (hereinafter referred to as “GSO”) as a counterpart over two years.
1.1 Background of the Study
Today, industrial statistics covering industrial production, shipment and inventory, and other related areas are increasingly recognized as essential economic data to understand the current state of business activities, not only for government agencies but also for private businesses, investors, scholars and many other parties. To allow the effective use of statistical data by these users, reliability and promptness are the most important requirements. At the same time, the statistical data must be internationally comparable for users. This is no exception in Vietnam; to achieve the country’s healthy economic expansion, the development of industrial statistics that are based on modern techniques and comply with international standards is one of the national priorities for the statistical development in the country.
To meet these objectives, the Government of Vietnam (hereinafter referred to as “GOV”)
requested the Government of Japan (hereinafter referred to as “GOJ”) to conduct the Study on the Development of Industrial Statistics in Vietnam in September 2003. In response, the GOJ commenced the Study since the end of May 2004 over two years. This study is the development study as well as the project to construct a new institutionalized statistical survey.
1.2 Objectives of the Study
The objectives of the Study are summarized as following four items;
(1) To develop monthly current production statistics with high levels of reliability and promptness, which contribute to economic and industrial policy making as well as corporate management in Vietnam, together with a set of statistical indices that are produced on the basis of such statistics, including a monthly indices of industrial production ;
(2) To make the current production statistics and indices produced and published on a continuous basis under a formal system;
(3) To transfer knowledge and expertise on the statistical survey to the Vietnam counterpart, through the implementation of the present study; and
(4) To encourage future users of statistics to understand the utility and method relating to current production statistics and indices.

1. Outline of the Survey and Composition of the Report
S1 - 2
Furthermore, formalization and continuous implementation of current production statistics and indices developed under the Study are considered to be its strategic goal. To develop “production statistics and indices” with high levels of reliability and promptness, the development of “the list of population” and “primary statistics” is the prerequisite. The major objective of the Study is to establish a system to develop primary statistics, while the development of production indices and the establishment of the publication system will take some time after the end of the Study as they need to be developed to sustainable systems on the basis of proposals made under the Study. For this purpose, this report proposes a preliminary plan for the construction of the statistical system from the development of primary statistics to the establishment of the publication system, together with action plans for the Vietnam side to implement for the purpose of achieving the goals.
1.3 Scope of the Study
To accomplish the above objectives, the study was conducted in five phases, each of which consisted of the following activities.
Outline of Activity Phases
1) Basic Study: To collect and analyze information required for
development of current production statistics and indices. 2) Basic Design: To design the basic system of industrial statistics and
indices that are suitable for local conditions of Vietnam, and to design the details of Trial Surveys (questionnaire , selection of sectors and commodities, method, etc.) to be conducted for verification and other purposes.
3) Trial Survey 1: To plan and support the 1st trial survey in Hanoi and Ho Chi Minh for evaluation of basic system design.
4) Development of Statistical Indices:
To develop industrial production indicesand to provide support for development of a statistical system that will be required in the near future.
5) Trial Survey 2 and formulation of a development plan:
To plan a national-scale current production statistics survey using the developed statistical system, to implement and evaluate it as a trial survey, and to formulate a development plan for the statistical system.
In addition, the present study includes technology transfer (transfer of expertise and
experience), through on-the-job training and seminars/workshops, and activities to promote the understanding of statistical users.

1. Outline of the Survey and Composition of the Report
S1 - 3
1.4 Survey Schedule
1.4.1 Overall Schedule
The present study is conducted for twenty seven months from the end of May 2004 to the end of August 2006. Each of the three study years consists of the following activities (those defined in the development process).
First year (May – December 2004): Basic Study (Phase 1); Basic Design (Phase 2); and Implementation of Trial Survey 1 (Phase 3) Second year (January – December 2005): Implementation of Trial Survey 1 (Phase 3);
Analysis of results of Trial Survey 1 (Phase 3); Design of Trial Survey 2 (Phase 4) Development of statistical indices (Phase 4); and
Implementation of Trial Survey 2 (Phase 5) Third year (January – August 2006): Implementation of Trial Survey 2 (Phase 5);
analysis on results of Pre-Survey (Phase 6); formulation of a formal development plan; and preparation and presentation of a final report
1.4.2 Implementation Schedule of Trial Surveys
As part of the Study, two Trial Surveys were conducted in 2004 and 2005, for the three-month period between November through January each year (the survey period was between October and December). The primary objective of Trial Surveys is to verify the proposed development plan in the following respects:① whether the survey method and materials such as questionnaires and enumerator manuals are suitable for local conditions in Vietnam; ② whether necessary data such as the questionnaire collection rate and the entry rate are available; and ③ whether work standards for examination, input and tabulation are appropriate. Also, they served as a means to promote new current production statistics in the country.
The GSO currently implements the Pre-Survey based on the results of the Trial Surveys for
one year even though the Pre-Survey was not included in the original plan (scope of work).
1.5 Composition of the Report
This Final Report consists of three parts, “Main Report” and “Executive Summary”. “Main Report” is further divided into two parts. Part 1 (from Introduction to Chapter 4) discusses main points of survey results including technology transfer activities. Part 2 (from Chapter 5 through Chapter 7) presents “Preliminary Development Plan for Current Production

1. Outline of the Survey and Composition of the Report
S1 - 4
Statistics,” “Preliminary Development Plan for Industrial Production Indexes,” and “Action Plans for Implementation of the Official Survey,” all of which are proposed on the basis of field surveys and two trial surveys (three months each) conducted as part of the study.
The preliminary plans contain some elements that have been jointly developed with the
GSO in the course of the trial surveys and have been already launched. To formalize the proposed current production statistics survey in Vietnam, procedures to adopt it as the government’s official statistics, which will be taken after the completion of the present development study, is very important. For this reason, this report is prepared with care to include information that is useful or required for such procedures. Finally, “Appendices” of “Main Report” contains the series of manuals - “Enumerator Manual,” “Index Development and Dissemination Technique Manual” and “System Operation Manual,” together with “Industry and Commodity Classification List” that has been made from data obtained up to the second stage of trial survey, and “Industry Sector-Based Questionnaires.”

2. Analysis of Current State

2. Analysis of Current State
S2 - 1
2. Analysis of Current State
2.1 Organization of GSO
At present, the GSO is headquartered in Hanoi and is centrally organized under the three-tier structure consisting of Provincial Statistical Offices (PSOs) that cover provinces and District Statistical Offices (DSOs) that are established in municipalities and supervised by the PSO. In addition, five semi-independent organizations such as the Statistical Information Center are under supervision of the GSO Director General. Generally, the GSO means the entire organization consisting of the PSOs, the DSOs and the five organizations. As of the end of 2005, there are 64 PSOs and 659 DSOs throughout the country, and the GSO employs approximately 5,000 persons. The organization of the GSO headquarters and its duties are shown below (Figure 2-1).
(1) Organization of the GSO headquarters
a. National Accounts Department b. Statistical Methodology Department c. Integral Statistics Department d. Industry and Constructional Statistics Department e. Agricultural, Forestry & Fishing Statistics Department f. Trade, Services & Prices Statistics Department g. Population & Labour Statistics Department h. Social and Environmental Statistics Department i. International Cooperation Department j. Personnel Department k. Planning and Financial Department l. Inspection Department m. Administrative and General Affairs Department
(2) Duties of the GSO headquarters
a) To draw out draft laws and regulations relating to statistics and direct legislation procedures.
b) To submit to the Government or the Prime Minister strategies, plans, long-term plan on statistics as well as important projects.
c) To announce the regulations, standards classification on statistics. d) To conduct surveys, analysis and dissemination of socioeconomic statistics according to
government guidelines. e) To lead cooperation and coordination with government organizations relating to statistics f) To promote improvement and international cooperation of statistical techniques. g) To audit ministries and government organizations engaged in statistical service
2. Analysis of Current State
S2 - 2
h) To management budgets relating to operation and maintenance of the statistical system. The Industry and Construction Statistics Department serves as the counterpart of the
present study.
(3) General profiles of the Industrial and Constructional Statistics Department The department is responsible for industrial statistics. On January 1, 2004, when
constructional statistics were transferred from the Construction, Transportation and Telecommunication Statistics Department to the Industrial Statistics Department, the latter was renamed as Industry and Constructional Statistics Department, which is responsible for statistics relating to the industrial sector
*1 and the construction sector. At present, the
department consists of 17 staff members led by Director Vu Van Tuan and manages three statistics in the industrial sector (annual company statistics, and monthly and annual industrial sample surveys) and the construction trend survey. Also, it provides assistance for the Commercial and Prices Statistics Department in the economic census covering the mining and manufacturing sectors (every five years) and quarterly business surveys. It should be noted, however, that the GSO’s departments including the Industry and Constructional Statistics Department are responsible for planning, technical guidance, analysis and dissemination of statistics in their responsible fields, while surveys are conducted by its local organizations, namely PSOs and DSOs. Staff of the Industry and Constructional Statistics Department includes experts in statistical survey planning and analysis and personnel with system development capability.
*1
Vietnam’s industry classification is based on VSIC that conforms to ISIC, and VSIC two-digit classification treats three areas of mining (C), manufacturing (D), and electricity/gas/water supply (E) as industrial statistics.

2. Analysis of Current State
S2 - 3
Figure 2-1 GSO Organization Chart
(4) Regional Network of GSO The PSOs are established in of 64 provinces and special cities and function as the GSO’s
provincial offices. Under each PSO, there are 659 DSOs throughout the country*2
. They are responsible for all field activities for statistical surveys implemented by the GSO. Statistics conducted by the PSOs and the DSO, together with their activities, are planned by respective departments of the GSO headquarter in Hanoi and the operating budget of each office (including costs relating to field surveys and employees) is compiled and managed by the GSO headquarter.
The number of staff at each PSO is basically determined according to the number of DSOs
in the respective districts (as well as the number of communes and wards under each district), rather than the size of the survey subject, such as local population, the number of enterprises (including households). For instance, Thanh Hoa Province that was covered by Trial Survey
*2
Most of them have been established as a result of merger between statistical departments of local people’s committees and the GSO.
64 PSOs
659 DSOs
National Accounts
Integratedstatistics
Agriculture, Forestryand Fishery statistics
Industry andConstruction statistics
Trade, Services andPrice statistics
Population andLabour statistics
Social and Environmentstatistics
StatisticalMethodology
InternationalCooperation
Organization andPersonnel
FinancePlanning
StatisticalInspection
GSOAdministration
Institute for StatisticalScience (ISS)
Statistical InformaticsCentre (SIC)
Statistical DocumentationCenter (SDC)
Statistial JournalFacts and Figures
GSORegionalOffices
13 Departments 5 Service Units
Director General
Vice DirectorGeneral
Statistical PublishingHouse
Company for Distributionof Statistical forms
IndependentEnterprises
No.1 HanoiNo.2 Ho Chi MinhNo.3 Da Nang
College of Statistics

2. Analysis of Current State
S2 - 4
2 under the present study has 27 districts, the largest number in the country, and thus there are 27 DSOs. They are large in number than the PSOs in Hanoi and Ho Chi Minh City, so that Thanh Hoa PSO has the largest number of employees. Staff members of the PSOs and DSOs effectively serve as enumerators. Each PSO has local units of most departments at the headquarters, which conduct statistical surveys under the direction of the headquarters
*3.
2.2 GSO Annual Budget
GSO’s annual budget on a disbursement basis was 120 billion dongs in 2003, 149 billion dongs in 2004, and 170 billion dongs in 2005. The budget has been steadily increasing mainly due to the increase in labor and other indirect costs, rather than the increase in statistical survey-related cost. The annual budget is roughly divided into fixed expenditures, such as labor costs
*4, and variable expenditures, such as survey and equipment costs. In 2005, the budget for
fixed expenditure was about 100 billion dongs (mostly labor cost) and that for variable expenditures, about 70 billion dongs. Of the total variable expenditure, 36 billion dongs were allotted to survey costs and 34 billion dongs to equipment costs. Also, 300 - 400 million dongs were earmarked as reserves. Request for survey cost is made by each department that is in charge of statistical surveys - accompanying an implementation plan and a budget statement - to the financial department. Then after the annual budget is approved, it is disbursed to each PSO subject to an internal approval at the GSO.
2.3 Legal Institution for Statistics
(1) Government policy for statistics development The government’s basic policy for development of statistics in Vietnam is set forth in
“Direction of Statistics Development in Vietnam Toward 2010” that was issued in the premiere’s resolution (No.141/2001/QD-TTg) dated October 21, 2002. In this resolution, strategic directions of development of the statistical project toward 2010 are stated as follows.
1) Improvement and standardization of statistics in terms of promptness, content, form, and
method for compilation (a) Dissemination of the statistical project to meet the needs of the party, the state, and
other statistical users; the establishment of a transparent and comprehensive mechanism, and the improvement of the GSO’s capacity to ensure provision of statistical information to every user
*3
For instance, industrial statistics surveys are conducted by the PSOs and DSOs under the direction of the Industrial and Constructional Statistics Department.
*4 GSO’s labor cost is paid to staffs of GSO headquarter in Hanoi and regional PSOs and DSOs. Other labor cost for enumerators belonging to communes and wards is paid by regional People’s Committees.

2. Analysis of Current State
S2 - 5
(b) Reaffirmation the significance of periodical socioeconomic reports and monthly reports relating to socioeconomic development plans and treat as formal documents relating to government meetings
2) Improvement of statistical techniques by introducing modern techniques conforming to
international standards (a) Development of internationally comparable statistical standards and indices (b) Expansion of application of the national accounting system (SNA) and reconstruction
of statistical methods (c) Standardization of classifications according to international standards and local
conditions peculiar to Vietnam
3) Improvement of the statistical data collection system (a) Establishment of the registration system for collection of basic information (b) Improvement of the company reporting system (c) Promotion of linkage between the national statistical system and departmental statistics
In June 2003, the Statistical Law was adopted by the National Assembly as the legal
authority of statistical projects and was enacted on January 1, 2004*5
. This law aims to clarify the economic situation, facilitate the drawing up of policies, increase data accuracy, and meet the statistical needs of organizations and individuals. The law is composed of the following eight chapters:
Chapter 1. General Rule Chapter 2. Statistical Information Systems Chapter 3. Statistical Surveys and Statistical Reports Chapter 4. Dissemination and Using Statistical Information Chapter 5. State Statistics Organization Systems Chapter 6. State Management in Statistics Chapter 7. Rewards and Violation Settlements Chapter 8. Implementation Provisions The characteristics of Statistics Law do not differ largely from those of other countries as it
regulates rights and responsibilities of the statistical office. One intriguing characteristics is that there are two types of statistics named, “Statistical Surveys” and “Statistical Report”. As stated in Chapter 3 stated above, “statistical survey” is “a survey decided by the state and is conducted using questionnaires and targeting organizations and individuals”. “Statistical report” is “a report that is to be periodical made by organizations and individuals, using a
*5
Previously, statistical work has been conducted according to the Account-Statistical Law Ordinance of September 1988.

2. Analysis of Current State
S2 - 6
specific form and as required by the state.” Thus, the survey subject is obliged to cooperate in the statistical survey, whereas the statistical report requires the survey subject to make a report directly. In any case, for government-designated statistics, the survey subject is required to submit questionnaires.
2.4 Type and Coverage of GSO Statistics
Table 2-1 lists statistics that are currently compiled and published by the GSO.
Table 2-1 Main Statistics Compiled by the GSO
Department Title Frequency Outline Remarks
1 Population Census Every 10 years Complete enumeration on family budget Covers the whole country
2 Annual Survey of Population Change Annual Sampling survey on family budget Covers the whole country
3 Survey on Migration Quintennial Sampling survey on family budget Covers the whole country
Popu
latio
n an
d La
bour
Sta
tistic
s D
ept.
4 Annual Labour and Employment Survey Annual Sampling survey on family budget
Covers the whole country; conducted jointly with MOLISA
1 Establishment Census Quintennial All establishments excluding agriculture, forestry and fishing Covers the whole country
2
Survey on Wholesale, Retail Trade, Restaurant, Hotel, Tourism, Services in Non-State Enterprises
Annual Wholesale, retail, hotels, restaurants, tourist business, small-scale Household industries such as household enterprises
Covers the whole country
3 Survey on Circulation of Wholesale and Retail Trade
Monthly Wholesale, hotels, restaurants, service industries
Complete enumeration for large enterprises; sampling survey on medium and small enterprises and households
4 Business Tendency Survey Quarterly Large state enterprises, foreign enterprises and
non-state enterprises in 15 cities and provincesSampling survey on 1,570 enterprises
5 Sample Survey on Consumption Price Monthly Sampling survey on enterprises and small
establishments Covers all industries
6 Sample Survey on Production Price Monthly Sampling survey on enterprises and small
establishments Covers all industries
7 Sample Survey on Material Price Quarterly Sampling survey on enterprises Covers all industries
8 Sample Survey on Import-Export Price Quarterly Sampling survey on enterprises Covers all industries
9 Monthly Reporting System Monthly State enterprises and foreign enterprises
engaged in wholesale and retail Covers the whole country
Trad
e, S
ervi
ces &
Pric
es S
tatis
tics D
epar
tmen
t
10 Household Census Annual Sampling survey on households Covers all industries
1 Survey for Calculating Quarter GDP Quarterly Sampling survey on enterprises Covers all industries and the
whole country
2 Survey for Calculating Regional GDP Quarterly Sampling survey on enterprises Covers all industries and the
whole country
SNA
Dep
t.
3 Survey for Input/Output Table Quarterly Sampling survey on enterprises Covers all industries and the
whole country

2. Analysis of Current State
S2 - 7
Department Title Frequency Outline Remarks 1 Enterprise Census Annual Enterprises in all industries Covers the whole country
2 Monthly Industrial Survey Monthly Non-state enterprises and households in the industrial sector Sampling ratio: 3-5%
3 Monthly Reporting System Monthly State enterprises and foreign enterprises in the
industrial sector Complete survey
4 Monthly Reporting System Monthly State enterprises and foreign enterprises in the
construction industry Complete survey Indu
stry
and
C
onst
ruct
iona
l Sta
tistic
s D
ept.
5 Survey on Development Trend of Construction Field
Quarterly Large state enterprises, foreign enterprises and non-state enterprises in 8 cities and provinces Sampling survey
1 Survey on Plated Area, Yield and Production of Farm Products
Annual Sampling survey on small farmers Covers the whole country
2 Animal Husbandry Statistics Survey Annual Sampling survey on households
Survey month: April; covers main farming and livestock provinces
3 Animal Husbandry Statistics Survey Annual Sampling survey on households Survey month: August; covers
the whole country
4 Survey on Planted Area, Yield, Production of Rice Annual Sampling survey on small farmers Covers the whole country
5 Survey on Planted Area, Yield and Production of Perennial Crops
Annual Sampling survey on small farmers Covers the whole country
6
Survey on Area of Water Surface for the Aquaculture, Material Facilities, Production of Aquatic Products
Annual Sampling survey on small farmers Covers the whole country
7 Survey on Non-State Enterprise in Forestry Biennial Sampling survey on non-state enterprises Covers the whole country
8
Survey on Population Households, Labours and Main Material Capacity in Agriculture, Forestry and Fishery Industry
Annual Sampling survey on households and enterprises Covers the whole country
9
Survey on Production Value, Intermediate Cost, Value Added of Agriculture, Forestry and Fishery Industry
Annual Sampling survey on households and enterprises Covers the whole country
Agr
icul
tura
l, Fo
rest
ry a
nd F
ishe
ries S
tatis
tics D
ept.
10 Reporting System Annual State enterprises and foreignn enterprises in agriculture, forestry and fishing Covers the whole country
onm
enta
l an
d So
cial
St
atis
tics
1
Vietnam Living Standards Survey Biennial Sampling survey on family budgets Covers the whole country
Source: The results of hearings from the GSO departments
2.5 Dissemination of GSO Statistics
The above statistics compiled by the GSO are disseminated through mass media and are reported to various government offices and organizations. The PSOs furnish statistical data to local people’s committees, industrial bureaus (local agencies of the Ministry of Industry), planning & investment bureaus (local agencies of the Ministry of Planning and Investment), while the GSO provides data for central government offices, such as the Central People’s

2. Analysis of Current State
S2 - 8
Committee, the MPI, the MOI, and the central bank. The same reporting format is used for all statistical data, regardless of government offices.
On the other hand, the private sector is not in a position to use statistical data published by
the GSO for business purposes because of data restraints, e.g., limited availability of data by industry or commodity in the case of industrial statistics. However, this does not necessarily mean the lack of demand for statistics. In fact, the interview surveys revealed that the majority of companies expected wider dissemination of statistical data.
In this conjunction, the GSO’s online service started at the end of 2004 is expected to
attract a wide range of users. The GSO created a Web site dedicated to the service in October 2004 and steadily adds new contents. Thus, the prospect that the private sector can access to current production statistics and other statistical information that is closely associated with business management will pave the way to wider availability of government statistics as public goods.
2.6 Industrial Statistics in Vietnam
The definition of industrial statistics varies among countries. In Vietnam, it covers “mining”, “manufacturing” and “electricity/gas/ water supply”. The Industrial and Constructional Statistics Department of the GSO is responsible for the statistics of these fields. “Enterprise Census” and “Monthly Industrial Survey” are representative in the industrial statistics.
The “Enterprise Census” is conducted every year since 2001, and covers all enterprises
with five or more employees, such as mining and manufacturing, commercial and service industries. The items are those on the financial statements, such as the number of employees, capital, fixed assets, earnings, profits and investment in construction. The list of enterprises used for distribution of the questionnaire is the one prepared using administrative data, tax office data and past censuses. The census results are published as the “Results of the Enterprise Census,” while the results of the Enterprise Censuses for the past three years were reported in the “Real Situation of Enterprises through the Results of Surveys Conducted in the Said Period.”
The “Monthly Industrial Survey” is, as its name suggests, conducted every month and
covers enterprises engaged in mining, manufacturing, and electricity/gas/water supply, as well as household industries. A complete enumeration is carried out on state enterprises and foreign enterprises, while a sampling is conducted on non-state enterprises and household industries. The main survey items are main business (VSIC four-digit), output at constant

2. Analysis of Current State
S2 - 9
price, turnover, consumption tax paid and products (actual results in the survey month and estimation for the next month).
2.7 Monthly Industrial Sample Survey
(1) Organization Industrial and Constructional Statistics Department, GSO
(2) Purpose
Submission of reports to various ministries, including the Ministry of Industry and Ministry of Planning and Investment (MPI), to the Provincial and Central People’s Committees, etc.
(3) Frequency
Monthly
(4) Scope C: Mining, D: Manufacturing, E: Electricity/Gas/Water Supply in VSIC
(5) Coverage
Nationwide
(6) Statistical unit Enterprises and households. Notes that the unit is “enterprise” but not “establishment”.
(7) Classification of enterprises by industry
The industry whose product accounts for the largest turnover amongst the enterprise’s products defines the enterprise’s industry type.
(8) Enterprise directory
For the Monthly Industrial Survey, the same directory is generally used as the Enterprise Census. However, if data concerning closure or relocation of enterprises is received by the PSO beforehand, the directory is adjusted accordingly.
(9) Compilation method
For the Monthly Industrial Survey, data is acquired from the monthly reports sent from state and foreign enterprises, and from a sample survey of non-state enterprises and households.
Periodic reporting is obligatory for state and foreign enterprises, and the formats to be used for reporting are distributed by each PSO. All state and foreign enterprises fill in this form,

2. Analysis of Current State
S2 - 10
and submit it to each PSO by 12th of every month directly or by post. Accordingly, a complete enumeration of state and foreign enterprises is conducted without the involvement of enumerators.
For non-state enterprises and households, targeted enterprises are sampled, and questionnaires are distributed and collected by DSO staff or People’s Committee staff. In terms of sampling, the enterprises are selected per PSO based on the sampling rate allocated to each province, with an average of 15% of non-state enterprises and 1.5% of households being surveyed (Table 2-2).
Table 2-2 Number of Enterprises for Monthly Industrial Survey
by Enterprise Type
Type All Businesses Industry Output Value
Share Sample Ratio
Enterprises for Monthly Survey
TOTAL *1 72,012 18,198 100% 5,718
Central State 1,898 661 x 100% 661
Local State 2,947 848 29.4%
x 100% 848
FDI 2,641 2,007 43.1% x 100% 2,007
Non-State 64,526 14,682 18.8% x 15% 2,202
Household 2,712,177 755,421 8.7% x 1.5% 11,331 Source: “The real situation of enterprises through the results of surveys conducted in 2001, 2002, 2003” GSO, 2004 *1: Household is not included.
(10) Survey items
1) Survey items for state enterprises Name of Enterprise Main Activities Type of Enterprise Amount for This Month, Cumulative to This Month, Estimation for Next Month * Gross output (by constant price 1994) * Turnover i) Of which: Turnover from selling materials and selling and buying goods without
processing at enterprise ii) Of which: value of selling goods
Value of Renting Fixed Asset including Operator Subsidies of the Government Tax have to paid Products Business Situation of Enterprise in Reported Month

2. Analysis of Current State
S2 - 11
2) Survey items for foreign enterprises Name of Project License Number Address Telephone Number Investment Capital * Legal capital i) Domestic capital
Proportion of land usage rights Proportion of resource usage rights, etc.
ii) Overseas capital Proportion of cash Proportion of facilities, such as machinery
* Borrowed capital Proportion of overseas capital
Labour Available as of the End of Report Month * Proportion of Vietnamese employees * Proportion of foreign employees Value of Imported Goods * Proportion of imports for construction * Proportion of imports for sales and production Turnover * Proportion of turnover derived from exports * Proportion of domestic turnover in US dollars * Proportion of domestic turnover converted from Vietnamese dong to US dollars * Proportion of the export value out of the turnover Tax and Other Obligations to State Budget Foreign Currency Transferred Abroad Main Products
3) Survey items for non-state enterprises
Name of Enterprise Name of Main Activity Type of Enterprise Amount for This Month, Cumulative to This Month, Estimation for Next Month * Gross output (by constant price) * Turnover i) Of which: Industrial Turnover
Consumption tax have to paid Products Business Situation of Enterprise in Reported Month

2. Analysis of Current State
S2 - 12
4) Survey items for Households
Name of Household Address Hamlet (Housing Number) Commune Name District Code Province Code Main Activities Amount for Previous Month, Estimation for This Month * Number of employees * Turnover (without tax) * Added consumption tax Products Business Situation of the Household
(11) Dissemination method
The survey results are published as monthly industrial statistics (He Thong Bieu Mau, Dieu Tra Va Tong Hop Thong Ke Cong Nghip, Thang). Dissemination is not limited to related organizations, but available for everyone. Although the dissemination is open for any individuals/organization, the survey results cannot be purchased at bookstores or viewed on the Internet, and need to be acquired from the General Statistics Office (GSO) or Provincial Statistics Office (PSO) directly.
(12) Dissemination items
The survey results are announced in two formats, namely, “Gross output by constant price (1994 basis)” and “Production Quantity of Main Products”. “Gross output by constant price” is categorized as; (1) Cumulative value from January to the previous month, (2) Estimated value for this month, (3) Cumulative value from January to this month, (4) Year-on-year comparison (index), (5) Year-on-year comparison of the cumulative value from January to this month. The results are announced by enterprise type and by main province. On the other hand, “Production Quantity of Main Products” are categorized as; (1) Cumulative value from January to the previous month, (2) Estimated value for the reported month, (3) Cumulative value from January to the reported month, (4) Year-on-year comparison, (5) Year-on-year comparison of the cumulative value from January to the reported month. The results are announced by main product type. Items disseminated in the monthly industrial statistics are listed as follows.

2. Analysis of Current State
S2 - 13
Table 2-3 Dissemination Items in the Monthly Industrial Survey
Item Coverage Dissemination Style Note
(Each number is referred to the left column)
Gross output by constant price (1994 basis)
All enterprises
(1) Cumulative value from January to the previous month
(2) Estimated value for this month (3) Cumulative value from January to this
month (4) Year-on-year comparison (index) (5) Year-on-year comparison of the
cumulative value from January to this month.
(1), (2), (3), (4), (5) By enterprise type (state, foreign-own, non-state) (1), (2), (3), (4), (5) By main province (15 province/city)
Main Products All enterprises
(1) Cumulative value from January to the previous month,
(2) Estimated value for the reported month,
(3) Cumulative value from January to the reported month,
(4) Year-on-year comparison, (5) Year-on-year comparison of the
cumulative value from January to the reported month
(1), (2), (3), (4), (5) By product type (34 product types), by enterprise type
Source: Monthly Industrial Survey (He Thong Bieu Mau, Dieu Tra Va Tong Hop Tong Ke Cong Nghip)
2.8 Current State of the GSO’s Monthly Industrial Sample Survey and Major Issues
2.8.1 Major Characteristics of Survey Design and Issues
(1) Survey Design Focusing on Enterprise and Region The ongoing monthly sample survey compiles statistics emphasizing enterprises, rather
than establishments. For instance, the turnover in the survey represents the gross turnover of an enterprise, which includes the revenue from wholesales activities, i.e., the purchase and resale of goods. As a result, while it represents business activities of each enterprise (industrial sector), it fails to reflect the current state of production activities accurately.
At the same time, the ongoing survey aims to monitor the current status of regional
economy by administrative division. This can be seen from a strong relationship with local people’s committees that are a main user of government statistics, as well as from the selection of surveyed enterprises, i.e., while the survey covers all state enterprises and foreign companies (FDI), non-state enterprises and household industries, which form the majority in number, are surveyed on a sampled basis. In fact, household enterprises account for approximately 70% of enterprises covered by the monthly survey, suggesting that the government intends to obtain a

2. Analysis of Current State
S2 - 14
broad picture of business activities in a survey area (province or city). Figure 2-2 shows a breakdown of enterprises by form of ownership as percentage share of GDP in 2004.
Figure 2-2 Breakdown of Vietnamese Enterprises by Form of Ownership
in Industry Sector (Output Value Share) in 2004
Source: Statistical Yearbook 2004, GSO
As seen in the figure, households represent approximately 9.3% of GDP, which is expected
to decline as foreign companies and non-state enterprises (in the form of stock company) grow in number in recent years. This indicates that if one wishes to know industry trends focusing on production activities, the survey of state enterprises, foreign companies, and some of non-state enterprises is considered to be sufficient.
(2) Complexity of Data Processing
For the ongoing monthly survey, there are four forms of questionnaire (or four sets of survey items) developed and used according to the enterprise capital type, and respondents are expected to specify their products and their classifications. As for collection, state enterprises and foreign companies are required to submit them under the reporting system, so that no enumerator is required and the rate of collection is nearly 100%. On the other hand, non-state enterprises are surveyed by the DSO staff, while household industries report to the DSO staff or staff of local people’s committees (serving as enumerators). Because of the difference in questionnaire design (survey items) as well as the difference in the collection system, the present survey system is not suitable for accurate tabulation and compilation of enterprise data at a national level, adversely affecting reliability of data as official statistics, while data are processed accurately for each geographical area or type of enterprise.
At present, the PSO produces four types of statistical data from questionnaires collected for
the monthly survey: (1) IIP (in 1994 price); (2) production (net); (3) major products (and production); and (4) sectoral analysis. The IIP is calculated in 1994 price and the GSO admits that it does not meet the present needs due to obsoleteness and inconsistency of data.
Stateenterprises,
37.0%
Non-stateenterprises,
17.7%
Householdenterprises,
9.3%
Foreignenterprises,
36.0%

2. Analysis of Current State
S2 - 15
Production data are not included in the survey results if a respective product does not accompany an appropriate code classification. Also, data reported by households are not included. Thus, the present questionnaire design (survey items) requires additional data processing if data are to be used as reliable statistics.
2.8.2 Major Characteristics and Issues Relating to Survey Implementation
(1) Additional Cost Burdens Relating to the Survey of Household Industries Survey Design Focusing on Enterprise and Region
The ongoing monthly survey sets a deadline for collection from state enterprise and foreign companies on the 12th day of each month. The DSO that is responsible for non-state enterprises is required to submit collected questionnaires to the PSO on the 12th – 14th day of each month (closed on the 8th day). Each PSO then submits provincial (municipal) data to the GSO on the 17th day of each month. As discussed earlier, state enterprise and foreign companies are required to submit the questionnaire in time under the Reporting System, and completed questionnaires are generally submitted by facsimile. On the other hand, non-state enterprises send them by mail or delivery directly to the DSO, while the DSO staff (enumerators) visits some enterprises for collection. And enumerators collect questionnaires from household industries. While the Reporting System is proven to be cost effective as it assures a fairly high rate of collection, collection from households requires substantial time and cost as enumerators have to visit all of them (depending upon the number of enumerators hired). This makes the latter less cost effective than the former. In fact, the survey of household industries takes up the largest part of the monthly survey cost, but the scope of data collection and use is fairly limited. Thus, it is the least cost effective from the standpoint of the survey’s objective, i.e., to obtain data representing current production by industry as a whole.
(2) Limited Dissemination and Need for Expansion of the User Base
The results of the monthly industrial sample survey are compiled into monthly reports by the DSO, the PSO, and the GSO, which are then distributed to central and local people’s committees and other organizations. In addition to the monthly reports, production trends on 34 industrial commodities are made available to the public. Notably, the monthly reports are printed in limited quantities and are not made public. For instance, the Ho Chi Minh PSO prints 300 copies monthly, while other PSOs publish around 50 copies. Clearly, statistical data are accessible by a limited number of organizations and people.
In fact, it is reported that collection of the questionnaire from foreign companies is on the
decline in recent years, despite of the requirement under the Reporting System. This is probably because an increasing number of foreign companies become reluctant to cooperate in the statistical survey as they are unable to obtain any data or feedback. Foreign companies, as well as non-state enterprises, both of which increase in number in Vietnam, are strongly interested in industrial statistics as they find them very useful. As statistical needs in the

2. Analysis of Current State
S2 - 16
private sector are expected increase further with the transformation to a market economy, broader dissemination of survey results will become a major issue from the viewpoint of ensuring wide participation in the statistical survey.
2.9 Current Status of Computer Systems at GSO and PSOs and Major Issues
2.9.1 Overview of GSO Systems Division
The Systems Division of the GSO belongs to the Center of Statistics Informatics. (For its organizational structure, refer to Figure 2-1.) Major functions of the Systems Division are as follows;
1) Integration of computer systems within the GSO 2) Selection, procurement and setting up of the systems 3) Software development 4) Development and implementation of network systems 5) Maintenance and support of hardware and software At present, five full-time staff members work in the Systems Division, and among them,
one is responsible for the maintenance of hardware, and the remaining four persons including the director is engaged in software development.
2.9.2 System Configuration of Hardware
Figure 2-3 shows the entire network system configuration at the GSO. Computer systems at the GSO are configured as a local area network system consisting of 6
servers and 250 client terminals. The six servers supplied by IBM, HP, and Compaq are organized as Web, Proxy, DNS, Mail, DB, File, FTP, and Printer Server respectively. For FY2005, the GSO plans to install 10 additional servers in February 2005. These servers will be used as replacement and upgrading of Web, FTP, File-Network, and DB Server. In addition, one of newly installed servers will be directly connected to the prime minister’s office.
Approximately 250 client terminals under the GSO Net are connected via HUB and
installed in each division of the GSO. Most client terminals are so called “brand products”, which are totally different from the ones assembled using different modules and components produced by different manufactures which is so-called as “Non-brand” products.
As for security measures, the GSO’s systems are also well equipped, including firewalls
and UPSs being connected to servers and client terminals to minimize a risk of system breakdown due to power failure.

S2 - 17
Figu
re 2
-3
Net
wor
k C
onfig
urat
ion
of G
SO
So
urce:
GSO
CIS
CO
SY
ST
EM
S
Route
r
FireW
all
(Ser
ver R
oo
m)
Dep
t.D
ept.
Web
,Pro
xy S
erv
er
DN
S,M
ail S
erv
erIn
tene
tSca
n
Dat
aBas
e S
erv
er
Dat
aBas
e,F
ile,
Prin
ter S
erv
er
Sw
itchin
g H
ub
Wor
kS
tatio
nsW
ork S
tatio
nsW
ork S
tatio
nsLa
ser
Prin
ter
Lase
rP
rinte
rLa
ser
Prin
ter
Inte
rnet
Ser
ver
Ro
om
of
Ha
no
ia
nd
HC
M P
SO
)
Win
do
ws N
TS
QL
Ser
ver
2000
CS
Pro
Fo
xPro
MS
-Off
ice
Dep
t.
Win
do
ws
XP
s &
95
Win
do
ws
XP
s &
95
Win
do
ws
XP
s &
95
App
licat
ion
Ser
ver
CIS
CO
SY
ST
EM
S
Route
r
20 D
epta
rtm
ents
.(G
SO
)
Ser
ver
Ro
om
of
Ha
no
i,H
CM
C, a
nd
Da
na
g IT
Cen
ter)
LA
N
Dia
l-u
p

2. Analysis of Current State
S2 - 18
2.9.3 Configuration of Software
(1) Operating System Windows 2000 advanced server is used as operating system for LAN servers. For
operating systems of client PCs, both Windows XP and Windows 95 are used.
(2) Application Software 1) Development Tool
Visual Basic has been used as a major development tool and all development personnel are using this tool. This is because it is used as a key tool for development of the database storing data, which are incorporated as Enterprise Census or Household Census by Visual FoxPro and are converted to a form supported by SQL Server 2000.
2) Office Tool
The most popular Microsoft’s office tool such as Word, Excel, Access, and Memo pad are used as office tool.
3) Relational Database Software
Major relational database software being used at the GSO is Visual FoxPro. First used by the Industrial and Construction Department, the software is now used in almost all departments of the GSO. Data created from each census compiled by the GSO are encoded by an input screen created by FoxPro and installed as database.
At the same time, both SQL Server 2000 and CSPro are used as relational database
software for server side. The former has been donated by the SIDA and the latter is supplied as free software. These software programs have been used for various applications that fit their features. For example, SQL Server is used for data input and database establishment of each census and used as data transfer tool with IT Center which will be described in the latter part of this section. CSPro is not used very frequently.
2.9.4 Communication Network Architecture
The GSO’s server systems have an external connection via the Internet. Since connectivity to external networks is established through the firewall systems, the security level of the GSO might be considered as high, however individual’s rights to access internet or e-mail is partly restricted. Thus not all of the GSO staff has access to external connection. Server systems of the GSO are also connected with the PSO systems of Hanoi and HCMC PSOs via 144 Kbps leased lines. Also the GSO systems have LAN connection with three IT centers located in Hanoi, HCMC, and Da Nang. The transmission speed to both Hanoi IT Center is 1 Mbps and to HCMC and Da Nang 144Kbps respectively. These network connections systems are called the Cute FTP private circuit line. Also GSO’s File server is connected with the tax

2. Analysis of Current State
S2 - 19
office using a leased circuit line for transmission and establishment of company statistical database which will be described in the latter portion of this section.
The GSO systems have also direct connection access via Cute FTP not only to Hanoi and
HCMC but to all PSOs that are located in 64 locations in the country for transmission of statistical data. Volume of data transmitted varies between locations, however, seven files on the average are transferred between of the GSO and the Hanoi PSI per month and data volume per file per transmission averages 100 Kb.
PSOs and their affiliated DSOs equipped with personal computers have only dial up
connections, and not hosted within the LAN system. Computer systems of DSOs are not well integrated and vary in size and number of staff at each DSO. Incidentally, the number of personal computers installed at each DSO averages 2 units per DSO.
The government of Vietnam is planning the installation of fiber optics cables across the
country by the year 2007. And if it is realized, the GSO-Net covering the entire PSOs/DSOs will be established along with the government implementation plan.
2.9.5 IT Centers
At present, three IT Centers are established in major cities, namely Hanoi, HCMC, and Da Nang. The major objective of IT Centers is to process various statistical data by dividing into three portions of the country, the north, the central, and the south. However, in January 2004, all the centers were consolidated as an affiliated institution of the GSO, these institutions were operated under each PSO as an affiliate to process statistical data of each region. The major purpose of consolidation of the centers was, among other things, to develop application software for statistical analysis tools, R & D of Information Technology, IT education and training targeted to the GSO and PSO staff, and maintenance and support work of GSO’s computer systems. However, an actual order for application development has not issued by the GSO, and the centers are still working on the previous projects including the processing of annual census data, the enumeration of household surveys, and the encoding of such data to the database software of each IT Center. Staffs have been sent to the GSO’s and the PSO’s systems department for maintenance and support of their systems and software. Hanoi IT Center is affiliated with Centre of Statistics Informatics, HCMC IT Center with Centre of Statistics Informatics II, and Da Nang with Centre of Statistics Informatics III Department of GSO.
2.9.6 Overview of the System in the Industrial and Constructional Statistics
Department
17 personal computers are connected to the GSO servers as the client terminals in the Industrial and Constructional Statistics Department. Operating systems of each client terminal

2. Analysis of Current State
S2 - 20
consist of 16 Widows XP, and one Windows 98. Major application software running on these PCs is the Microsoft Office suit. Both FoxPro and Visual FoxPro are used for processing and analysis of current monthly survey. Other application packages specified as an analytic tool for statistics such as SPS is also used.
Three staff members, one engineer and two programmers, are assigned as system personnel. Their major responsibility is to process current monthly survey, and at the same time they are involved in system development. Also they are involved in analysis and publication of the results of the monthly survey which are sent from the PSOs and downloaded to their FTP server computers. At present, one full-time staff member is appointed as personnel in charge of handling the existing monthly survey. His major tasks are to develop programs using FoxPro and analyze the monthly survey data sent by each PSO.
2.9.7 Computer System of PSO/DSO
Status of computer installations at the PSOs and the DSOs varies greatly depending on each PSO and DSO. Likewise the installation status of the DSO also differs its affiliation with which PSO. Three locations of PSO, namely Hanoi and HCMC which are connected through LAN with the GSO, have less system size and grade but have a systems environment similar to that of the GSO systems. Also very similar are operations systems and application software packages. Among 64 PSOs, it is said that only one PSO in the country does not have connectivity with the GSO. Although, PSOs have the rest of connecting with the GSO, PSOs located in the rural region do not have sufficient system environment to connect with the GSO.
The system environment at the DSO also varies depending on to which PSO does this DSO belongs to. For example, HCMC PSO has 24 DSOs under its management, most of them facilitate multiple unit of personal computers. And the Hanoi PSO has 14 DSOs under its management, all DSOs have installed personal computers and connected with Hanoi PSO systems via dial up connections.
At present, the penetration rate of the personal computers at the DSO is only 40% at the national level. It is considered that this will be major obstacles for preparation statistics systems along with the preparation of the computer and communication network infrastructure in the country.
2.10 Problems and Issues Relating to System Development and Operation
2.10.1 Problems Relating to System Development
(1) Unbalanced Situation of Hardware and Software Installation At the GSO, hardware systems are well equipped to meet with the current requirement
among system users. In other words, hardware has well prepared rather than preparation of software to satisfy the capacity of hardware systems. That is hardware that is not efficiently used at this moment. For example, the relational database software, FoxPro, has loss its

2. Analysis of Current State
S2 - 21
popularity that was established earlier. FoxPro is not the mainstream of RDB software at this moment. In addition, FoxPro is actually known more as a development tool rather than relational database software. Therefore, this software might be replacing from the major tool for processing of statistical data. A software development language should also be used properly depending on the objectives of the development, so that it is necessary to consider the use of Web-based languages such as HTML, XML, and network based language such as Java. These should be considered as prerequisites for development of online encoding method of survey results, data transfer to GSO, and use the systems as online analytic tools.
(2) Unification of the Use of Software
Unification and share of server-client type of software is highly desirable, particularly a different relational database software program has been installed in each organization, even within the same department. These cases include the use of SQL Server 2000 and Visual FoxPro in GSO and IT Center, and independent use of Visual FoxPro in the Industrial and Constructional Division at GSO for data processing of the existing monthly industrial survey. The use of Oracle at the Tax Office for creation of enterprise database will be the basis of preparation for population census. However, it entails additional work for IT Centers for conversion and transmission of data to GSO.
(3) Sharing of Database
It is highly desirable to share databases which are developed for the use of enterprise databases as well as for census purposes. These databases should form the population for various kinds of surveys implemented by the GSO. Various databases transferred from the IT Centers to the GSO and the PSOs are updated and used by their own terms, however these data are not feed backed to the IT Centers. And some cases nobody knows where original data exists.
(4) Sharing of Human Resources
Also sharing human resources allocation within the GSO is required as well as the sharing between the GSOs and the IT Centers. It seems that deploying and putting the right person in the right position has not been practiced in terms of the application development as well as software development. For example, only two staff members are engaged in programming of Visual FoxPro in the Industrial and Constructional Statistics Division at GSO. Among them only one staff is engaged in the development process of the monthly survey, creating a relatively heavy workload for him. Other case is that in Hanoi IT Center there are several engineers dealing with SQL Server, however there is no Oracle engineer.

2. Analysis of Current State
S2 - 22
2.10.2 Problems Relating to System Operation
(1) Hardware Operation As discussed earlier, system hardware at the GSO and the PSOs is well developed and
does not present a major problem relating to system operation. In particular, this is because the GSO’s Systems Department and system personnel at the PSOs (mainly sent by IT Centers) handles hardware operation under technical support of manufacturers and sales distributors in the areas of operation and maintenance.
The major issue to be addressed in the future is the need for training of engineers engaged in operation and maintenance of system hardware that is expected to become increasingly complex with system and network expansion.
(2) Software Operation
Software that is used in the standalone operating environment, such as Microsoft Office, is operated smoothly without much problems. On the other hand, engineers and other technical staff need to be trained for operation of relational database software (client/server software), such as SQL server and Oracle, which will be increasingly used in the future. Also, the need for development of relational database software, especially MySQL, will emerge, together with development of application software in the open source environment led by Linux that is becoming the global platform. As it is difficult for the present resources of the GSO and the PSOs to handle these development requirements, and training should be considered in the context of HR training at IT Centers.

3. Summary, Result and Evaluation of Trial Surveys

3. Summary, Result and Evaluation of Trial Surveys
S3 - 1
3. Summary, Result and Evaluation of Trial Surveys
3.1 Implementation Summary of Trial Survey
3.1.1 Outline and Purpose of Trial Survey
The purpose of implementation of the trial survey is to verify a proposed “Preliminary Plan for Current Survey of Industrial Production” - formulated by the JICA study team - for its viability for the full-scale operation by General Statistics Office (GSO). Trial Survey 1 was conducted for tree months during the first year of the study, and so as for Trial Survey 2 based on the result of the basic Survey, for full-scale operation of “Monthly Survey of Major Industrial Products (MSMIP).
Major differences between Trial Surveys 1 and 2 are as follows.
Table 3-1 Comparison of Trial Surveys 1 and 2
Trial Survey 1 Trial Survey 2
No. of Target Sector 40 48
No. of Target Commodity 213 524
Target Business Type Enterprise Establishment
Planned No. of Target
(Final No. of Target) 500(499) 2000 (1927)
Survey Area
3 areas (Ha Noi City, Bac Ninh
Province, and Ho Chi Minh
City)
9 areas (Ha Noi City, Bac Ninh Province,
Vinh Phuc Province, Hai Phong City,
Thanh Hoa Province, Da Nang City, Ho Chi
Minh City, Dong Nai Province, and Binh
Duong Province)
Survey Item
・ Quantity of production
・ Quantity of shipments
・ Quantity of ending
inventory
・ Net turnover
・ Total net turnover
・ Quantity of production
・ Quantity of shipments
・ Quantity of internal consumption
・ Quantity of ending inventory
・ Value of shipments
・ Quantity of projected production for the
ensuing month
3.1.2 Survey Target Selection
The trial survey is the base survey of implementation of a master plan for current production statistics in Vietnam. A full-scale survey covering nationwide could not be implemented because of constraints of time and budget, the trial survey was designed to cover a limited number of survey subjects and a limited survey period in order to obtain information useful for implementation of the master plan. Therefore, the survey populations were set at 500 enterprises for Trial Survey 1 and 2,000 establishments for Trial Survey 2 for three consecutive months (it made narrowing down the number of target sectors and areas).
Selection procedures for surveyed (areas, sectors, and commodities are as follows.

3. Summary, Result and Evaluation of Trial Surveys
S3 - 2
3.1.2.1 Selection of Surveyed Areas
First, the selection of the survey area was considered to achieve maximum results by narrowing down the survey area. Three cities/provinces were selected as areas covered by Trial Survey 1, namely Ha Noi City, Bac Ninh Province, and Ho Chi Minh City.
For Trial Survey 2, a total of nine areas (four cities and five provinces) were selected as survey areas, i.e., adding six new areas that became industrialized to the three areas of Trial Survey 1 as the core area.
Table 3-2 Cities and Provinces Covered by Trial Surveys
No. Area Trial Survey 1 Trial Survey 2
① Ha Noi City Ha Noi City
② Bac Ninh Province Bac Ninh Province
③ - Vinh Phuc Province
④ - Hai Phong City
⑤
North
- Thanh Hoa Province
⑥ Central - Da Nang City
⑦ Ho Chi Minh City Ho Chi Minh City
⑧ - Dong Nai Province
⑨
South
- Binh Duong Province
3.1.2.2 Surveyed Sectors
(1) Basic Concept of Survey Sector Selection In Vietnam, “Vietnam Standard Industrial Classification (VSIC)” is currently used for
industrial classification. This was developed on the basis of “International Standard Industrial Classification (ISIC) version 3.0” established by the United Nations Statistics Division.
Industry in Vietnam is mainly classified to three sectors as “C: Mining and quarrying”, “E: Electricity, gas, and water supply”, and “D: Manufacturing”. Industrial surveys are conducted based on these classifications. The industrial classifications will be applied as integrated industrial statistics for development of the master plan for current production statistics. However, the integrated industrial statistics is the final goal, so that the surveyed sectors are basically narrowed down during the process of development and construction of the production statistics scheme. In particular, discussion with the GSO concluded that the surveyed sectors will be selected from “D: Manufacturing” at a 4-digit level. The surveyed sectors were selected by the following three steps.
The First Step: Prior to the sector selection for the trial surveys, major industries at national level were
analyzed and defined as major and important sectors of Vietnam. These sectors can be

3. Summary, Result and Evaluation of Trial Surveys
S3 - 3
considered as key sectors required to understand the industrial trend of Vietnam and for further analyses.
The Second Step: After defining the major sectors at national level, major industries in each surveyed
city/province were analyzed and selected. The identifying of industrial trend is also important at regional level for the transition process to the current production statistics because it is currently identified on the monthly industrial sample survey as well.
The Third Step: Finally, the sectors for the trial surveys were selected by the method to select main
industries at regional level with major industries at national level as a key element. The six procedures and indicators for the trial surveys as shown below are also applied to
the master plan, and the details are described in the main report. The outline is described in this summary report.
(2) Selection of Major Industrial Sectors (National Level)
Major industrial sectors were selected by using various economic data and final selection was made in overall consideration of the country’s industrial and related policies as well as the level of importance (Figure 3-1). The selection criteria used are summarized as follows.
(a) Value-Added (b) Net turnover and the number of employees by industry sector (c) Top ten items in export statistics (d) Government’s long-term industrial development plan

3. Summary, Result and Evaluation of Trial Surveys
S3 - 4
Figure 3-1 Scoring Structure for Target Manufacturing Sector Selection
Turnover
Value-Added
Number ofEnterprise
NationalLong-term
Plan
Export byHS Code
SectorSelection
2002Share
PerEnterprise
Share
GrowthRate
Share
GrowthRate
1) (a)
1) (b)
1) (c)
1) (b)
2) (a)
Through the above indicators, the JICA study team selected candidate industries in the
entire country (15 sectors). Then, the candidate list was reviewed with the counterpart in the Department of Industry and Construction of the GSO and eight industries were selected as major industries representing the country’s industry. Their share in the manufacturing industry, in terms of value added, is 33.3% as of 2002.
・ 1810 Manufacture of wearing apparel, except fur apparel ・ 2694 Manufacture of cement, lime and plaster ・ 1553 Manufacture of malt liquors and malt ・ 1600 Manufacture of tobacco products ・ 1512 Processing and preserving of fish and fish products ・ 3410 Manufacture of motor vehicles ・ 3591 Manufacture of motorcycles ・ 2101 Manufacture of pulp, paper and paperboard
(3) Sectors Covered by Trial Surveys
The final sector selection for the trial surveys was made by combination of national and regional levels of selection procedures.
A general outline of sector selection is as follows (refer to Figure 3-2). To select surveyed sectors at VSIC 4-digit level with the representative ratio of 80% in output value at national level, on the basis of the output value data by industrial sector (obtained from Enterprise Census of 2003 and 2004) including the major 8 sectors selected

3. Summary, Result and Evaluation of Trial Surveys
S3 - 5
by the JICA study team (Top 37 sectors account for 80.33% of total output value of Vietnam according to the data in 2004.).
As in the case of sector selection at national level, VSIC 4-digit sectors with the representative ratio of 75% in output value in each surveyed city/province (representative ratio differs depending on the situation of each city/province)
Selected sectors at both city/province and national levels were compared and extracted by following adjustments:
Core industrial sectors at city/province level but not important at national level (→ selected)
Industrial sectors not in the top 75% at city/province level but important at national level (→ selected)
As a result, 40 industry sectors were selected for Trial Survey 1. For Trial Survey 2, 48 industry sectors were selected including 39 sectors that were covered by Trial Survey 1 (Table 3-3). One sector that was not selected was ”VSIC2211 Publishing of books, brochures, musical books and other publications” because of its importance at national level declined.

3. Summary, Result and Evaluation of Trial Surveys
S3 - 6
Figure 3-2 Selection Flow of Target Sectors for Trial Surveys
*1: The screening criteria are as follows:1-1 Whether the industry is important industry in the target area or not.1-2 Whether the industry is categorized as "Others" of the particular sector (ex. 1729 or 3699) or not.
*2: If the selected industries are not covering more than 75% of the target area, then additional industries areselected from the list of major industries at national level.
Data from the most recentEnterprise Census
Output Value(National Level)in VSIC 4-digit
LevelPreliminarily Select TargetIndustries based on 80%Coverage of Total Output
Value in Manufacturing Sector
Output Value(Provincial Level) in VSIC 4-digit
level
Preliminary select targetindustries based on 75%
coverage of total output valuein manufacturing sector List of Preliminarily
Selected Industriesat National Level
Comparison
Preliminary selectedindustries in the
city/province
Not selected as a targetindustry
Regionally selectedindustries which are not in
the list of industries atnational level
Add moreindustries toincrease itscoverage formore than
75%*2
Screening*1
Regionally selectedindustries which are in the listof industries at national level
If meets the criteriaIf not meetthe criteria
List of Target Industriesfor Trial Survey
Major Industryin Viet Nam
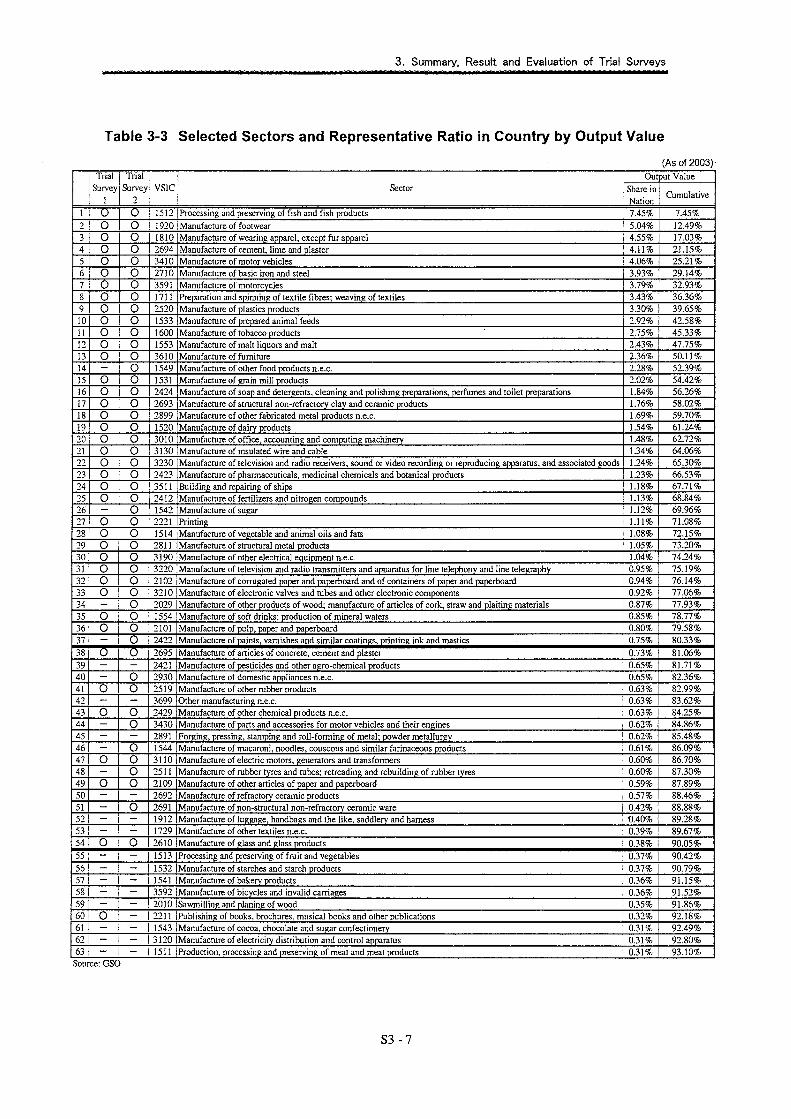
3. Summary, Result and Evaluation of Trial Surveys
S3 - 8
3.1.2.3 Surveyed Commodities
(1) Commodity Selection for Trial Survey 1 Through discussion with the Department of Industry and Construction of GSO
concerning the method for commodity selection for Trial Survey 1, it was decided to include commodities that are comparable on the basis of international standards. For this reason, Trial Survey 1 evaluated and adopted commodities based on the Vietnamese Central Product Classification (VCPC: 5-digit). The following issues were noted for this process.
Aggregate VCPC commodities were further segmented to reflect the existing list. Commodities not produced in Vietnam were erased. Commodities which local production was at the minimum level were erased. Commodities with a long name were recompiled to those with a shorter name. After selection of commodities, its appropriateness was verified by interview surveys of related organizations and enterprises surveyed. As a result, the number of commodities for Trial Survey 1 was set at 213 in 40 industry
sectors.
(2) Commodity Selection for Trial Survey 2 Although nine new sectors were added for Trial Survey 2, the remaining 39 sectors’
commodity composition was same as that for Trial Survey 1. Based on the analytical results of “Other Products” in questionnaires of Trial Survey 1, some important commodities were added to the commodity list of questionnaires for Trial Survey 2 (Figure 3-3 for the selection procedures). As a result, the number of commodities for Trial Survey 2 was increased to 524 in 48 industry sectors (Please refer to “Appendix”). It should be noted that one of the purposes of the trial surveys was to grasp as many commodities produced in Vietnam as possible. In the stage of questionnaire preparation for the basic plan implementation, commodities for which no production was reported for the two trial surveys will be withdrawn from the questionnaires after an analysis of production data of 524 commodities.
(3) Adoption of Units
Unit of measurement for each commodity is adopted on the basis of general production conditions such as weight, capacity, volume, and quantity. Since commodity-based statistical survey was not conducted in Vietnam, the units will be adjusted through the trial surveys and the pre-survey.

3. Summary, Result and Evaluation of Trial Surveys
S3 - 9
Figure 3-3 Selection Flow of Target Commodities on Trial Survey 2
GSO's Industrial Commodity List (“Danh Muc San Pham Cong Nghiep”
in“Ap Dung Trong Dieu Tra Toan
Bo Doanh Nghiep (2003)”)
ISIC 3.0Industrial CommodityList in other country
Hanoi & Bac Ninh: 20 SectorsHo Chi Minh: 20 Sectors
Second Trial Survey
Monthly Survey of Major Industrial Products (MSMIP)
EnterprisesInterviewEnterprises
InterviewEnterpriseInterview
First Trial Survey
List of"Other Products"
with Turnover
List of"Products"
with Turnover
Data Analysis
TurnoverComparison
①
②
③
④ ⑤
⑥
⑦
"Revised"Commodity List
Checking by GSO
Commodity Listby the Result of Trial Survey 1
with Turnover
Commodity Listby the Result of Trial Survey 1(modified list) with Turnover
Check the list whether commodities areactually "main commodity" or not
Check and modify the listinto subdivision
Enterprises &AssociationsConsultation
New Commodity Listfor Trial Survey 2

3. Summary, Result and Evaluation of Trial Surveys
S3 - 10
3.1.2.4 Surveyed Enterprises (Establishments)
(1) Survey Unit The current production survey should preferably be conducted for establishments, but the
GSO’s surveys use enterprises as a survey unit and data on establishments are limited. Thus, it was agreed with the GSO to use enterprises as a survey unit for Trial Survey 1 since the limited time to create an establishment list. On contrary, Trial Survey 2 was conducted based on a new establishment list made by extracting candidate enterprises from a database and checking whether it owns an establishment by PSO.
(2) Surveyed Enterprise (Establishment) Selection
The following data were obtained from the GSO database that reflected the 2003 and 2004 Enterprise Census for the purpose of selecting surveyed enterprises and developing an enterprise list.
Enterprise’s Name VSIC Code (4-digit) Address Tax Code Telephone Number Business Type Code Regional Code (Province, District, Commune) Output Value Based on these data, enterprises covered by Trial Survey 1 were selected by following the
steps from ① to ⑥, and establishments covered by Trial Survey 2 were selected by following the steps of ① to ⑨. The conceptual diagram is as shown in Figure 3-4.

3. Summary, Result and Evaluation of Trial Surveys
S3 - 11
Figure 3-4 Conceptual Diagram of Target Enterprise/Establishment Selection for Trial Surveys
Select enterprises according to the type of ownership, i.e., state, FDI, and non-state enterprises excepting households
① Sort output values of enterprises according to the industry sector by surveyed area ② Calculate the output value share in each sector from the largest share enterprise ③ Set cut-off line as 75% of cumulative total of output value in each sector and
select major enterprises (adjustment applied in each area) ④ Confirmation and adjustment of VSIC rating, business description, and regional
weight on the selected enterprise list ⑤ Final screening by PSO’s most current data (out of business, relocation, etc.) ⑥ Make the establishment list by adding necessary items (such as main product
name) to the screened enterprise list and ascertain actual presence of establishments within each enterprise
⑦ Finalize the establishment list and send it to GSO ⑧ All the lists from 9 PSO are combined and adjust the number of target
establishment up to 2000 for Trial Survey 2 by GSO if necessary
The presence of establishments should be confirmed after selecting target enterprises from the GSO database for Trial Survey 2. Thus the selection criteria were discussed for the process. Basically, an establishment that met the following requirements was selected as a n establishment to be surveyed. Otherwise, the enterprise to which the establishment belonged was selected. ・ Operate in the manufacturing sector (factory) with fixed location, have production and
repairing activities with engagement of people and equipment at least three months per year
・ Have its own self-accounting system (in general, one enterprise owns one establishment (factory). In case that there are more than two establishments and have a self-accounting system, then all such establishments would be targeted) As a result, 500 enterprises were selected for Trial Survey 1 and 1,927 establishments for
Trial Survey 2. The breakdown of surveyed enterprises/establishments by industry sector and by province is as shown in Table 3-4.
Trial Survey 1
Trials Survey 2
Those industrysectors whichare more than
75% of theprovince
Those enterprises(establishments)of which output
value is more thancut-off line
QUALIFIEDESTABLISHMENTS
FOR TRIALSURVEY


3. Summary, Result and Evaluation of Trial Surveys
S3 - 13
3.1.3 Survey System and Methodology
3.1.3.1 Survey Implementation System
The trial surveys were conducted by a local organization under the commissioning of the JICA study team. Several candidate organizations including a private research establishment were compared and evaluated. In the process, it was confirmed that, as the current production statistics survey would be conducted under the leadership of the GSO’s Industrial and Constructional Statistics Department, the GSO’s present survey system should be analyzed and evaluate as part of the development study. In consideration of this factor, it was decided to commission the trial surveys to the Institute of Statistical Science (SSI), an independent but affiliated research organization, which would use the GSO’s statistical survey organization including the PSOs and DSOs (Figure 3-5).
Figure 3-5 Implementation Structure for Trial Survey
PSO
JICAStudyTeam
GSO/SSI
DSO
Support
Consultation
Surveysupervision
Datasubmission
Questionnairedistribution
Questionnairecollection
Questionnairecollection
Enterprises (Establishments)
Surveyorganization
Supportingorganization
Survey implementation
body
Resource dataprovider
3.1.3.2 Implementation Schedule
For Trial Surveys 1 and 2, a reference month was set for a period of three months from October to December 2004 and 2005, respectively. Therefore, a collection period was also three months between November 2004 and January 2005 and between November 2005 and January 2006, respectively.
Because both government offices and enterprises are closed for Tet Holiday (Vietnam’s New Year holiday) from the end of January to the beginning of February for a week, it may be

3. Summary, Result and Evaluation of Trial Surveys
S3 - 14
difficult to conduct survey activities and to obtain the sequence data. For this reason, the survey schedule to complete questionnaire collection was set at the end of January (Table 3-5).
The reference month refers to a calendar month, from the first day of the month until the last day of the month.
Table 3-5 Implementation Period of Trial Surveys
Trial Survey 1 Trial Survey 2
Reference Month Collection Month Reference Month Collection Month
October 2004 ➪ November 2004 October 2005 ➪ November 2005 November 2004 ➪ December 2004 November 2005 ➪ December 2005 December 2004 ➪ January 2005 December 2005 ➪ January 2006
The flow is described in the following sections (Figure 3-6).
Figure 3-6 Flow of Trial Survey
・ Selection of sector, commodity, enterprise (establishment)・ Preparation of various manuals・ Questionniare preparation, etc
・ Enterprise (establishment) seminar・ Enumerator workshop・ Promotion of purpose and meaning of survey, etc
Seminar/WorkshopImplementation
Trial Survey Implementation
First Month
Third Month
Second Month
Distribution
Collection
Examination
Entry
Tabulation
Dissemination
Survey Result Analysis Survey EvaluationPreparation
・ Questionnaire analysis・ Data analysis・ Commodity analysis,
・ Survey method evaluation・ Dissemination method evaluation,
1 Month Cycle
1) 2) 3) 4) 5)
3.1.3.3 Implementation of Trial Surveys
(1) Distribution of Questionnaire The PSO and DSO enumerators started distribution of questionnaires on 21st of the
surveyed month (October 21 in the first month) by visiting enterprises (establishments) in the formal list (Note that questionnaires were distributed each month during the survey period in order to prevent loss, but three sets were delivered at once when so requested by an enterprise.). Upon visit, the enumerator explained the trial survey and its objective, solicited cooperation, and explained entry procedures. Also, the scheduled date to collect the questionnaire was notified.
(2) Collection of Questionnaires
Questionnaires were collected by the PSO or DSO enumerators who visited the surveyed enterprises, while submission by facsimile or e-mail was accepted in exceptional cases. The following rules were set for questionnaire collection.

3. Summary, Result and Evaluation of Trial Surveys
S3 - 15
1) The enumerator checks the completed questionnaire upon receipt to see whether it has been filled out properly and legibly.
2) If a surveyed enterprise (establishment) fails to submit the questionnaire by the specified date, the PSO or DSO enumerator contacts the representative of the enterprise and requests prompt submission, while notifying his or her supervisor of the delay.
3) The reminder is made around two days before the deadline, although each PSO or DSO may set its own date.
4) The third page of the questionnaire (yellow sheet) is retained by the respondent and the first and second pages are collected by the enumerator. The first page is retained by the PSO and the second page by the GSO (See Figure3-7).
Figure 3-7 Questionnaire Collection Cycle (Example)
GSO
DSO
Enterprises(Establishments)
Central State
Local State
FDI
Non-state
Questionnaire (pink)and Data Submission
PSO
~8th ~12th ~18th
Questionnaire(white & pink)Collection
Deadline
Reminder
(3) Examination of Collected Questionnaires As mentioned in the previous section, the enumerator checked the completed questionnaire
according to the examination manual and made necessary correction as required by confirming the enterprise. Then, the collected questionnaire was checked at the PSO or DSO by other enumerator or personnel in charge of data input. The following items were examined.
1) Basic information
Information on the surveyed enterprise (establishment), including the name of the establishment (establishment), address, tax code, form of ownership, telephone number, the name of the contact person, and the surveyed month, which are essential in keeping the enterprise (establishment) list updated and need to be checked for any change.

3. Summary, Result and Evaluation of Trial Surveys
S3 - 16
2) Balance between entries Entries to survey questions on commodity information were checked for any omission
and balance (logic) between key items (production, shipment, internal consumption, inventory, etc.).
3) Unit
Incorrect entries relating to unit of measurement, such as use of an incorrect unit (e.g., “ton” instead of “kg” or omission of “million dong” to indicate the value of shipments)
4) Numeration system
Some items asked the indication of fraction numbers by rounding to the second decimal place and actual entries were checked to see if they comply with the rule. Also, incorrect entries relating to the position or indication of the decimal point (difference between “,” and “.” between local and foreign enterprises) were checked.
5) Other Products
Entry errors relating to other product, e.g., whether a product that is printed in a question section were entered as other product, and an entered other product was matched with industry of a questionnaire, were checked.
The above examination rules will be applied to the official survey.
(4) Data Input (conducted between 14th and 17th of the month following the surveyed month) All questionnaires were collected at each PSO where data input was made, and the DSO
enumerators were not involved in data input. Entries in collected questionnaires (after examination) were input by the PSO staff (data input personnel or enumerator) in the same manner as the ongoing Monthly Industrial Sample Survey. Input data were transmitted to the GSO on a specific date of the surveyed month (17th or 18th in every month). Major features and functions of the data input software and system are summarized as follows (see Chapter 6 for more discussion).
1) Data Processing Software
As a result of discussion between the GSO and the JICA study team, it was decided to adopt Visual FoxPro to develop a data processing system for the trial surveys. Visual FoxPro is a database management software program widely used by the GSO and the PSOs and their staff is familiar with its operation. In particular, the software program is pre-installed with the enterprise list for Trial Survey 1 (including data from the existing corporate census, such as address and telephone number), a commodity list, and province codes, facilitating the data input operator to make a quick search on enterprises. In addition, Visual FoxPro has print and help (showing the data input manual) functions.

3. Summary, Result and Evaluation of Trial Surveys
S3 - 17
2) Automatic Examination on Data Input The data input software is capable of performing automatic error checks. This function
finds errors relating to figures written in the questionnaire at the surveyed enterprise and data input at the PSO. In particular, the software can detect and alert the following anomalies.
1. Inventory balance: When the quantity of production exceeds twice or falls below one half a sum of shipments and inventories
2. Comparison with the previous term: When the quantity of production or shipments in a reference month exceeds three times that in the previous month
3. Price check: When the total shipment price of a product (value of shipments/quantity of shipments) of an establishment exceeds twice that of the same product made by other establishment
4. Blank check: When any item indicating the quantity of production, shipments, inventories, internal consumption or projected production is left blank.
(5) Data Tabulation and Publication (on or before 25th of the month following the surveyed
month) Data sent from each PSO to the GSO were promptly tabulated and analyzed at the
Industrial and Constructional Statistics Department. While Trial Survey 1 did not make publication, Trial Survey 2 made a limited publication to identify problems relating to the publication method if it was used for the official survey. Publication was made on the GSO’s Web site only and the following items were published. - Statistical stables and indexes by industry, commodity and form of ownership on a national
level - Statistical stables and indexes by industry, commodity and form of ownership on a regional
level - Statements explaining the general outline and the trend
One of the important objectives of the trial surveys was to check if the above work cycle is
smoothly executed (Figure3-8).

3. Summary, Result and Evaluation of Trial Surveys
S3 - 18
Figure 3-8 Implementation Flow of Trial Survey
Enterprise (Establishment)
DSO
PSO
GSO
Enumerator
Collection &Confirmation
Chief of Industrial Department
Aggregation
Director of Industrial Department
Submission/Report
Data Entry Operators
Data Input
System Administrator of GSO
Submission/Report
Responsible persons byspecific industry categories
or areas
Data aggregation
Data analysis
JICAStudy Team
Monitoring& Advice
PreliminaryReport
Dissemination
Working GroupDiscussion/Advice
Approval DirectorRevisedReport
DataExamination
DataConfirmation
MasterDatabase
Tabulation
Tabulation by Type of Industrywith an original questionnaire
Monitoring& Advice
Monitoring& Advice
Non-State State&FDI
Enumerator
Collection &Confirmation
& Aggregation
Director of Industrial Department
JICAStudy Team
JICAStudy Team

3. Summary, Result and Evaluation of Trial Surveys
S3 - 19
3.1.4 Survey Items and Questionnaires
3.1.4.1 Survey Items and Definition of Terms
(1) Survey Items for Trial Survey While the ongoing survey is designed to monitor business activities, the current production
survey including Trial Surveys have the primary purpose of grasping the volume of production by commodity. As a result, Trial Surveys focused on the following information.
1) Product-related items
For each commodity, the following information was collected.
(a) Quantity of Production This covers products that have been actually manufactured or processed at a factory
and has passed inspection (excluding repaired, modified or regenerated ones, as well as work-in-progress), including products directly produced by an enterprise using its own materials and products manufactured for other enterprise using other enterprise’s materials
(b) Quantity of Shipments
This item refers to the quantity of products that have been made and shipped actually (including those accepted), not including those made by other enterprise using the surveyed enterprise’s materials or those internally consumed.
(c) Quantity of Internal Consumption
This means the quantity of products that are used, in the subsequent production process at the same factory, as a material or an intermediate product for the manufacture of a new product.
※ This is not asked in Trial Survey 1.
(d) Quantity of Ending Inventory
This means the quantity of a commodity (listed in the questionnaire) manufactured by the surveyed enterprise as of the end of the survey month, excluding products made by other enterprise using the surveyed enterprise’s work-in-process or materials. In particular, the item refers to inventory of the surveyed enterprise’s products kept by the enterprise or stored in a warehouse or other storage place that is rented under the name of the enterprise.
(e) Value of Shipments by Million Dong
The value of shipments is calculated by multiplying the quantity of shipments by the unit price, as indicated in the invoice (not including VAT) and should be indicated in million dong.
※ Trial Survey 1 asked product sales.

3. Summary, Result and Evaluation of Trial Surveys
S3 - 20
(f) Total Net Turnover
This is the total turnover (excluding tax) made by business activities of the surveyed company during the survey period, including product sales, service, fees interest income, royalties (copyright, etc.) and dividends. It is analyzed together with the net turnover to confirm that monetary Figures reported in the questionnaire are correct.
※ This was not the survey item for Trial Survey 2.
(g) Projected Production Quantity for the Ensuing Month
This means the production quantity projected for the month following the surveyed month, as calculated on the basis of quantity of production for the surveyed month.
※ This is not asked in Trial Survey 1.
(h) Remarks
This column is reserved to state a reason for any substantial change in quantity or value of production or other items between the surveyed previous month and the reference month.
2) Enterprise (establishment)-related Items
The questionnaire included questions to ask specific information on each enterprise (establishment), which was partly used to update the corporate database as the address or other information of enterprise (establishment) changes.
Enterprise’s name Tax code Address Form of ownership (state (central and local), foreign, non-state) Name of respondent (usually accountant) Telephone Month surveyed
3) Items relating to Trial Survey 1
The surveys also checked what responding enterprises thought about the survey, n particular, the following information:
Time required for completion (calculation and entry to the questionnaire) Level of difficulty in responding to each question (in particular, inventory information was asked for the first time) Expectation for monthly statistics of current production by commodity (as potential user)

3. Summary, Result and Evaluation of Trial Surveys
S3 - 21
4) Other Items Finally, the questionnaire asked signatures of the respondent and the representative of the
enterprise and the date of entry in order to ensure that they are responsible for their response.
3.1.4.2 Questionnaires for Trial Surveys
(1) Outline of Questionnaire The questionnaire was a single page with double side printing and designed for each
industrial sector, with the front side printing questions and providing a space for response, and the backside showing instructions to the respondent. A total of forty forms for Trial Survey 1 and forty-eight forms were printed and used.
Each questionnaire used three carbon papers to produce copies for the PSO (white), the GSO (pink color), and the responding enterprise (yellow), compared to the previous form that did not use a carbon paper (Figure 3-9).
Front Side On the front side, “questions on the enterprise,” “questions on products,” “questions on
Trial Survey” and “other questions” are printed. The enterprise responds to these questions only (“questions on Trial Survey” was only used for Trial Survey 1).
It also has a commodity column where the commodity name is printed with a space where the respondent can enter products that do not belong to the specified product category. This provides information useful for reviewing the commodity list after completion of Trial Survey.
Back side “Instruction to the respondent” and “detailed description of the commodity” are printed
on the backside of the questionnaire (third page) in order to prevent an error in entry by providing supplemental information on the commodity for which the respondent is expected to report.
Figure 3-9 Questionnaire for Trial Survey (Sample of Trial Survey 2)
Front Back Side

3. Summary, Result and Evaluation of Trial Surveys
S3 - 22
3.2 Analysis of Results of Trial Surveys
3.2.1 Collection, Examination and Input
3.2.1.1 Analysis of Questionnaire Collection Results
Both Trial Surveys 1 and 2 recorded very high final response rates, ranging between 90% and 100% in all the cities and provinces, probably because of the reporting system that is currently applied in Vietnam. However, response rates up to the collection deadline were generally low, with geographical variations.
The low response rates up to the collection deadline seem to come from the following
reasons. - As the trial surveys were conducted in parallel to the Monthly Industrial Sample Survey,
the PSO gave priority to the latter and opted to collect questionnaires for the trial surveys after the ongoing survey, as enumerators were burdened with heavy workloads.
- Foreign enterprises were generally late for submission because their internal approval procedures were delayed or foreign managers did not understand the need for the statistical survey.
- Some PSOs confused the data collection deadline (12th) with the submission deadline (18th).
- There was a difference in response rate between PSOs due to the difference in level of preparation, e.g., a PSO checked carefully the possible submission date before the deadline and recorded a high response rate.
3.2.1.2 Analysis of Questionnaire Examination Results
While examination of collected questionnaires for the trial surveys was conducted by PSO and DSO enumerators, the JICA study team examined and analyzed questionnaire entries. As a result, the following problems were found.
(1) Basic Information
- Tax code was omitted by several respondents. - Also, some questionnaires did not have address or telephone number. - The name of the respondent was also missing.
Omission seems to occur because respondents are requested to write the same information
each month, and some enumerators may accept omission of basic information, as they know respondents well.

3. Summary, Result and Evaluation of Trial Surveys
S3 - 23
(2) Survey Items Many respondents felt that it would be relatively easy to fill out the questionnaire because
survey items were mainly concerned with business accounting. However, the following problems were observed. - A relatively large number of questionnaires did not have inventory data, probably because
it was not consuetude for them to check inventories the end of month, as many enterprises took inventory one or twice per year (Some enterprises seem to have written inaccurate figures, which have led to negative inventories.).
- Similarly, the quantity of projected production was omitted in many questionnaires.
This is because they have not reported the inventory quantity to the statistical office.
(3) Balance between Entries - While “0” was entered for shipment figures, sales were reported. - Many numbers were illegible because of rough handwriting. - Some figures seemed to be incorrect due to confusion about decimal point or notation to
separate the thousands (e.g., the quantity of production was indicated in extremely large figures).
- Omissions in data entry were observed in many questionnaires (e.g., only production data were written).
- Zero was indicated in various ways, including “-“ and “zero.”
In addition, many respondents failed to enter quantities of internal consumption and inventory or indicated “-“, while indicating quantities of production and shipments. Although the instruction emphasized the use of “0” to avoid disturbance with error check work on the seminars, it was not communicated well to a sizable number of respondents.
(4) Unit
There were many questions from surveyed enterprises concerning the unit of indication, because they often used different units for product management or commercial transaction from those specified in the questionnaire. - There were some cases of confusion between “ton” and “kg” and between “1,000 pieces”
and “pieces” (They were found from obviously too high or low unit prices.). - Small enterprises had to use decimal figures under the unit of “ton” or “million VND.”
This was true for commodities that were produced in small quantities. - The value of shipments, which was supposed to be indicated in “Million Dong,” was
sometimes indicated in “Dong” or “Thousand Dong.” - Some respondents used their internal unit by rewriting the unit printed in the questionnaire.
In some cases, the GSO staff converted figures indicated in different units by checking the
conversion method with surveyed enterprises. Also, some enterprises that exported products

3. Summary, Result and Evaluation of Trial Surveys
S3 - 24
indicated sales in U.S. dollar, which were then converted to the dong by the PSO staff. In fact, the PSO is responsible for making such conversion under the ongoing Monthly Industrial Sample Survey.
(5) Numeral System
- Position or indication of decimal point, i.e., use of comma and period, was not unified. - The two-digit rule for indication after the decimal point was not followed and three- or one-
digit was used frequently (Some questionnaires used different decimal points in the same questionnaire.).
(6) Other Products
The share of “Other Products” was 14~18 % in total by value basis even considered the variation by month. The following points are noted regarding the contents of “Other Products.”
1) Commodities that were printed in the questionnaire were included in “Other Products.”
Table 3-5 shows industries that reported more products, which were printed in the questionnaire, as “Other Products.” In particular, there were many cases where respondents did not read the explanation on commodities and their names on the rear side and included products in “Other Products” without thinking much.
Table 3-6 Main Sectors with Large Amount of Other Products
VSIC Products VSIC Products
1544 Noodles 2520 Plastics 1549 Other food 3110 Electric motors/generators 1810 Wearing apparel 3130 Insulated wire & cable 1920 Footwear 3410 Motor vehicles 2029 Other woods 3430 Motor vehicle parts & accessories 2221 Printing 3610 Furniture 2519 Other rubber
2) Many establishments received incorrect questionnaires and inevitably classified their
products in “Other Products.” In many questionnaires, entries were made in the “Other Products” category only, while
no entry was found in the preprinted commodity columns. Analysis of these questionnaires revealed that products included in “Other Products” were often not specified in the respective questionnaires. Clearly, this is the result of distribution of wrong questionnaires. To prevent this, the proper updating of the enterprise (establishment) list and the correct matching between questionnaires and enterprises are required.

3. Summary, Result and Evaluation of Trial Surveys
S3 - 25
3) Other industries As for industries classified as “other industries (designated as “***9” in VSIC 4-digit
classification)”, enterprises (establishments) did not always made commodities printed in the questionnaire because the industry sector covers a vast range of products. As it is very difficult to identify major products for this sector, selection of surveyed industries should be reconsidered.
Thus, a small percentage of establishments make correct entry in compliance with
instructions given at the presentation meeting for surveyed enterprises, although it may partly due to the difference in the entry rules between the ongoing Monthly Industrial Sample Survey and the trial surveys. Thus, careful examination and guidance by the PSO and DSO enumerators is important, although there are other factors involved, such as concurrent implementation with the ongoing Monthly Industrial Sample Survey and entry error due to the lack of experience caused by a short survey period.
(7) Incorrect classification of enterprises
In principle, enterprises are classified according to their main products (commodity showing the highest share in total sales). Analysis of collected questionnaires revealed, however, many cases of mismatching between classification and actual products. Table 3-6 shows industries for which such mismatching were more frequently seen.
Table 3-7 Major Incorrect Classification of Enterprises
Case Improper Classification Proper Classification
A 2693 Structural non-refractory clay & ceramics → 2691 Non-structural & non-refractory ceramics A 2519 Other rubber → 2520 Plastics B 3430 Motor vehicle parts & accessories → 3591 Motorcycles B 1810 Wearing apparel → 3610 Furniture A 2101 Pulp, paper, paperboard → 2102 Corrugated paper A 2109 Other paper → 2101 Pulp, paper, paperboard A 2695 Articles of concrete & cement → 2694 Cement, lime & plaster A 2811 Structural metal → 2899 Other fabricated metal B 2811 Structural metal → 2710 Basic iron
The mismatching cases can roughly be classified into the following two types.
1) Matching at the VSIC two-digit level but mismatching at the four-digit level (Case A) This is the case of an enterprise that already made a product classified in other industry
sector, and production of the product has recently grown and become the enterprise’s major product, resulting in the mismatch. Other case is similar to the above, but the product

3. Summary, Result and Evaluation of Trial Surveys
S3 - 26
classified in other industry did not grow much but was very similar to the original main product, resulting in mix-up and mismatch.
2) Mismatching at the VSIC two-digit level (Case B)
This is the case of a product that uses more or less the same material and quality but which final product is classified in a different way, causing the enterprise to be classified in an incorrect industry sector.
As shown above, there were cases where the present classification has deviated from the
original classification for various reasons. In Vietnam where the industrial landscape changes rapidly and dynamically, many enterprises, especially SMEs, change major products according to the changes in economic conditions, resulting in the mismatch between their industry classification and present product lines. In consideration of these factors, the GSO and the PSOs take a lead in checking and revising classifications of surveyed enterprises on a periodical basis to conduct the monthly survey accordingly.
(8) Distribution of plural forms of questionnaires
Commodities made by some enterprises other than their major products recorded the value of production next to the major products. This was frequently seen among enterprises that produced final products in similar categories, such as food and beverage, textile and apparel, paper products and printing, and transportation equipment and parts, as shown in Table 3-7.
As these cases can lead to a change in major product due to the changes in economic
conditions and other factors, use of two or more forms of questionnaires needs to be considered to maintain and improve data reliability.
Table 3-8 Considered Industries for Plural Questionnaire Distribution
Classification of Main Product Classification for Plural Questionnaires
1533 Animal feeds → 1544 Noodle 1542 Sugar → 2412 Fertilizer 1542 Sugar → 2029 Plank 1553 Malt liquors → 1554 Bottled water 1711 Spinning & textile fabrics → 1810 Wearing apparel 2102 Corrugated paper → 2221 Printing 2221 Printing → 2520 Plastics 3410 Motor vehicles → 3430 Motor vehicle parts & accessories
(9) No-entry item For a certain industry, there were some survey items in the respective questionnaire that do
not require entry (such as inventory and internal consumption). Such items were marked by

3. Summary, Result and Evaluation of Trial Surveys
S3 - 27
diagonal lines to indicate that no entry is necessary. However, analysis of collected questionnaires indicated that enterprises in some industries made entry in the no-entry column or otherwise. This information should be used as the basis of reviewing and modifying questionnaires in the preparation stage for the official survey.
1) Industries for which “internal consumption” should be added to no-entry items because
no entry is made in the collected questionnaires - 2422: Manufacture of paints, varnishes and similar coatings, printing ink and mastics
2) Industries for which “internal consumption” is marked as a no-entry item in the original questionnaire design but some establishments have entered the quantity of internal consumption, necessitating reconsideration of the no-entry treatment
- 1512: Processing and preserving of fish and fish products - 3410: Manufacture of motor vehicles
3.2.1.3 Analysis of Computer Input Results
Data reported in questionnaires collected by each PSO were entered into the PSO’s computer. This section mainly describes and evaluates the results relating to data input, software, and data error
(1) Data Input
- As products included in the “Other Products” column were often accepted for data input without being questioned as to whether they belonged to the commodity list for the survey, the products in this category accounted for sizable portions of the total value for the industry in question.
- Many input errors were related to indication of digit places.
In fact, input errors were often attributable to the country’s traditional way relating to notations to indicate the decimal point and separate the thousands. For instance, “1,234.00” in the widely accepted system of numeration is usually indicated by comma as “1.234,00” in Vietnam and it was often inputted as “1.234” instead of “1234 (numerical representation on the computer).” This type of input error should be carefully checked in the input process, such as comparison with previous month’s data.
(2) Software for Data Input
The software program used for data input generally worked well for the trial surveys, whereas a number of comments were made by PSO staff engaged in data input, with regard to the improvement of user friendliness and ease of use. In particular, after Trial Survey 2 that increased surveyed areas to 9, a variety of opinions were heard from the PSOs that adopted varying input systems.

3. Summary, Result and Evaluation of Trial Surveys
S3 - 28
- Input screen design is similar to the one used for the ongoing survey and thus is easy to use. - It is desirable to have the capability to sort surveyed establishments according to district
and VSIC classification. - As it was difficult to merge multiple data files into a single file, the task was commissioned
to the GSO by sending the files. - When an error occurred, the program was reset to the initial input screen. - For an industry sector, the program refused data input in the “Other Products” column. - As some PSOs use LAN to interconnect PCs, the program should be upgraded to support
data sharing, which will improve usability further.
(3) Data Error By using the automatic error check function of the data input program, the following two
problems were identified. - Error check conducted for the trial surveys revealed two cases of data errors, “quantity of
shipments was indicated as zero while the value of shipments was indicated” and vice versa. - The shipment prices varied between provinces in some cases.
For the trail surveys, the program was set to indicate an error alert when the shipment price
exceeded three times the average price in each province or fell below one third. However, comparison of shipment prices in provinces revealed a significant difference for some commodities. This seems to come from entry or input errors relating to monetary value or unit, and careful examination of questionnaires is required.
3.2.1.4 Analysis of Other Results
For Trial Survey 1, surveys of enterprises were conducted to find the time required for entry, the level of difficulty, and interest in survey results. The results and their analysis are presented below.
(1) Time Required for Entry
As for data collected in October, the average time required for filling out the questionnaire was 9.9 hours for all the establishments. By form of ownership, the average time was 12.6 hours for central state enterprises, 10.3 hours for local state enterprises, 7.9 hours for foreign enterprises, and 10.4 hours for non-state enterprises.
As for the November data, the overall average time for entry was shortened to 9.0 hours.
By form of ownership, the average time was 11.7 hours for central state enterprises, 7.2 hours for local state enterprises, 5.7 hours for foreign enterprises, and 11.2 hours for non-state enterprises.

3. Summary, Result and Evaluation of Trial Surveys
S3 - 29
In the December survey, the overall average time was further reduced to 9.2 hours, 10.1 hours for central state enterprises, 7.1 hours for local state enterprises, 4.7 hours for foreign enterprises, and 10.5 hours for non-state enterprises.
Thus, it was confirmed that the time required for entry shortened steadily over the survey
period as respondents get accustomed to the entry work. Also, the reason that the state enterprises took a lot of time for entry was considered that they had problems in organization such as procedural matter.
(2) Level of difficulty for entry
Most responding enterprises considered the entry work to be “easy” throughout the survey period, i.e., 388 out of 490 enterprises responded in October (79.2%), 395 out of 487 in November (81.1%), and 400 out of 488 in December (82.0%).
Thus, the entry work was recognized as “easy” by an increasing number of enterprises over
the survey period.
(3) Interest in Survey Results Throughout the survey period, most enterprises showed interest in survey results, namely
391 out of 490 enterprises that responded in the October survey (79.8%), followed by a slight decrease in November - 365 out of 487 (75.0%) - and an increase in December, 385 out of 488 (78.9%).
Thus it was confirmed that there was strong interest in survey results and many enterprises
expected to use statistical data in the future.
3.2.2 Publication
3.2.2.1 Publication Method
Trial Survey 2 was designed to build the infrastructure for publication of the official survey and to exercise publication in the index development process. In the official survey stage, it is planned to make publication in the following manner.
1) Current production statistics are published as preliminary and final reports. The former is
published at the end of the survey month and the latter in a specified month each year (not decided yet).
2) For both preliminary and final reports, national level current production statistics and indices are published on the GSO’s Web site and in printed reports.
3) Official publication of current production statistics is stated in the month following the month in which the premier’s decree is issued (scheduled to be around February 2007).

3. Summary, Result and Evaluation of Trial Surveys
S3 - 30
4) The GSO’s Industrial Statistics Department makes monthly releases to the mass media and sends reports to specific organizations (people’s committees and ministries engaged in economic policy making).
5) Both preliminary and final reports are published in Vietnamese and English.
In Trial Survey 2, unofficial publication was made to establish the GSO’s publication techniques and to publish survey results on the Web site and in printed matters on an experimental basis by taking into account the actual progress.
3.2.2.2 Content of Publication
Based on data obtained from survey results, the IIP is developed and published. The content of publication in the official survey is planned as follows.
1) Preliminary and final reports cover approximately 50 key products that are important to
understand the country’s industry trend, which are selected from commodities made by surveyed industries.
2) Publication of the IIP contains production, shipment and inventory indices that are calculated from data on all commodities made by surveyed industries, together with production and project production indices using the weight of the value of production, which are published as reference.
3) The published content includes description and analysis of the industry and other trends, in addition to data and indices.
4) Statistical data, which publication violates confidentiality, are not published. The indices were developed for commodities (industries) covered by Trial Survey 2 with
October 2005 as the base period.
3.2.2.3 Publication Procedures
Publication of the official statistics will follow the following steps. In Trial Survey 2, publication was made as an exercise for the official survey.
1) The GSO’s Industrial and Constructional Statistics Department processes national-scale
statistical data and develops the IIP. 2) Both preliminary and final reports are published after the GSO’s approval. 3) Publication on the GSO’s Web site is made by the department in charge of Web site
maintenance. 4) Reviewing and reshuffling of surveyed industries and commodities to reflect the changes in
industrial activity are made at least every five years.

3. Summary, Result and Evaluation of Trial Surveys
S3 - 31
The above publication procedures will be executed in the official survey. In fact, they were tested during Trial Survey 2 by attaching a special note that survey results are provisional.
3.2.2.4 Web Publication
The content of publication of survey results on the GSO’s Web site under Trial Survey 2 is as follows. The published content is organized as follows (to be upgraded monthly).
1) General outline of the survey 2) Purpose 3) Content 4) Results
The survey results are published in PDF (or Word/Excel) format to allow downloading by
users. The indices published are production index by industry, shipment index, month end inventory index, and production index for commodities that show a significant increase or decrease.
3.3 Lessons Learned from the Trial Survey Results
Based on the results of the trial surveys, major issues to be addressed in designing and implementing the official survey were identified and tabulated in Table 3-8.

S3 - 32
Tabl
e 3-
9 L
esso
ns L
earn
ed fr
om T
rial S
urve
y R
esul
ts a
nd R
ecom
men
datio
ns fo
r Im
prov
emen
t
< S
urve
y m
etho
d >
Item
Is
sue
Less
on le
arne
d R
ecom
men
datio
n
Survey system
In th
e tri
al s
urve
ys, t
he d
eadl
ine
for c
olle
ctio
n of
qu
estio
nnai
res
was
set
on
the
12th
day
of
each
m
onth
. T
he f
inal
res
pons
e ra
te (
whe
n da
ta
wer
e se
nt fr
om P
SO to
GSO
) exc
eede
d fo
r eve
ry
PSO
, but
the
resp
onse
rate
up
to th
e de
adlin
e fe
ll be
low
50%
at s
ome
PSO
s.
In c
onsi
dera
tion
of t
he n
eed
for
mon
thly
pub
licat
ion
and
the
secu
ring
of d
ata
relia
bilit
y, it
is im
pera
tive
to
achi
eve
the
high
res
pons
e ra
te f
or t
he d
eadl
ine.
A
s th
e tri
al s
urve
ys c
over
ed e
nter
pris
es (
esta
blis
hmen
ts)
in h
ighl
y in
dust
rializ
ed a
reas
, in
clud
ing
Ha
Noi
, H
o C
hi M
inh,
and
Bin
h D
uong
Pro
vinc
e, h
eavy
wor
kloa
ds
on e
num
erat
ors
(the
num
ber
of s
urve
yed
ente
rpris
es
per
enum
erat
or)
was
cre
ated
. T
he w
orkl
oad
furth
er
incr
ease
d du
e to
con
curr
ent
impl
emen
tatio
n of
the
on
goin
g st
atis
tical
sur
vey.
It
is e
xpec
ted
to d
ecre
ase
whe
n th
e M
SMIP
rep
lace
s th
e on
goin
g su
rvey
, bu
t ef
fect
ive
mea
sure
s sh
ould
be
take
n to
equ
aliz
e th
e w
orkl
oad
betw
een
enum
erat
ors
and
to e
stab
lish
a sy
stem
to e
nsur
e ea
rly c
olle
ctio
n of
que
stio
nnai
res.
At
pres
ent,
PSO
st
aff
is
resp
onsi
ble
for
colle
ctio
n fr
om s
tate
and
for
eign
ent
erpr
ises.
To
eq
ualiz
e th
e w
orkl
oad,
ho
wev
er,
real
loca
tion
to
DSO
st
aff
(in
char
ge
of
colle
ctio
n fr
om p
rivat
e en
terp
rises
) sh
ould
be
cons
ider
ed
whe
n ne
cess
ary.
Als
o,
enum
erat
ors
shou
ld n
ot r
ely
on th
e vo
lunt
ary
repo
rting
sy
stem
bu
t sh
ould
co
mm
unic
ate
with
res
pond
ents
to
agre
e on
the
col
lect
ion
date
in a
dvan
ce.
Collection
As
the
ques
tionn
aire
req
uire
s si
gnat
ure
of t
he
esta
blis
hmen
t’s p
rinci
pal (
dire
ctor
), it
som
etim
es
take
s tim
e to
obt
ain
his
sign
atur
e ev
en i
f th
e qu
estio
nnai
re
is
fille
d ou
t re
lativ
ely
early
, ca
usin
g a
dela
y in
subm
issi
on.
Subm
issi
on s
houl
d be
spe
eded
up
by a
ccep
ting
the
sign
atur
e of
the
resp
onde
nt (u
sual
ly a
ccou
ntan
t) or
his
su
perv
isor
(chi
ef a
ccou
ntan
t).
Ver
ifica
tion
by th
e su
perv
isor
is im
porta
nt fo
r da
ta r
elia
bilit
y.
It is
ther
efor
e re
com
men
ded
to r
equi
re t
he a
ppro
val
by t
he s
uper
viso
r of
th
e re
spon
dent
, whi
le o
mitt
ing
the
appr
oval
by
the
prin
cipa
l. T
his
shou
ld th
en b
e no
tifie
d to
th
e re
spon
dent
.

S3 - 33
Item
Is
sue
Less
on le
arne
d R
ecom
men
datio
n
Examination En
umer
ator
s of
ten
faile
d to
m
ake
clos
e ex
amin
atio
n at
th
e tim
e of
co
llect
ion
acco
mpa
nied
by
conf
irmat
ion
and
corr
ectio
n on
po
ssib
le
entry
er
rors
, su
ch
as
omis
sion
, in
cons
iste
ncy
betw
een
data
ent
ries
in r
elat
ed
item
s, er
rors
re
latin
g to
un
it an
d nu
mer
ical
sy
stem
, and
incl
usio
n of
mai
n pr
oduc
ts in
“O
ther
Pr
oduc
ts”
due
to
mis
unde
rsta
ndin
g of
th
e co
mm
odity
lis
t an
d cl
assi
ficat
ion.
This
ha
ppen
ed d
espi
te t
he p
re-s
urve
y in
stru
ctio
n an
d w
orks
hop.
Man
y en
umer
ator
s w
ere
busy
in h
andl
ing
two
surv
eys
that
wer
e im
plem
ente
d co
ncur
rent
ly (
the
trial
sur
vey
and
the
ongo
ing
indu
stria
l sam
ple
surv
ey) a
nd d
id n
ot
have
en
ough
tim
e to
pe
rfor
m
clos
e ex
amin
atio
n.
Als
o co
ntrib
uted
w
as
the
use
of
an
exam
inat
ion
man
ual
that
was
diff
eren
t fr
om t
he o
ne u
sed
for
the
ongo
ing
surv
ey.
Th
us,
the
surv
ey
syst
em
and
orga
niza
tion
shou
ld
be
revi
ewed
an
d re
vise
d to
im
prov
e th
e si
tuat
ion.
The
PSO
’s
dire
ctor
sh
ould
in
stru
ct
enum
erat
ors
to
exam
ine
ques
tionn
aire
s ac
cord
ing
to
the
man
ual
and
chec
k qu
estio
nnai
res
colle
cted
an
d ex
amin
ed
by
enum
erat
ors
on a
per
iodi
cal b
asis
and
pro
vide
ad
vice
and
gui
danc
e as
requ
ired.
Ana
lysi
s of
inpu
t dat
a re
veal
s so
me
inpu
t err
ors,
whi
ch w
ere
mos
tly c
ause
d by
mis
unde
rsta
ndin
g of
not
atio
n to
sep
arat
e th
e th
ousa
nds
(inte
rpre
ted
as th
ree
digi
ts h
ighe
r or l
ower
).
Figu
res
ente
red
in q
uest
ionn
aire
s of
ten
used
the
loca
l sy
stem
of n
umer
atio
n to
sep
arat
e th
e th
ousa
nds
(use
of
com
ma
for
deci
mal
poi
nt a
nd p
erio
d fo
r un
it of
th
ousa
nds)
, w
hich
w
as
mis
read
du
ring
inpu
t.
Effe
ctiv
e m
easu
res
are
requ
ired
to p
reve
nt th
is ty
pe o
f in
put e
rror
.
As
the
diff
eren
t ind
icat
ion
mar
ks a
re u
sed
by
diff
eren
t ent
erpr
ises
, it i
s di
ffic
ult t
o pr
omot
e ad
optio
n of
the
sam
e m
etho
d to
all
ente
rpris
es.
In
stea
d, e
num
erat
ors
shou
ld c
heck
dec
imal
po
ints
an
d th
e no
tatio
n to
se
para
te
the
thou
sand
s ca
refu
lly
with
re
spon
dent
s an
d co
rrec
t en
tries
, if
nece
ssar
y,
to
avoi
d m
isun
ders
tand
ing.
Th
e PS
O s
houl
d ta
ke a
le
ad
in
givi
ng
nece
ssar
y in
stru
ctio
n an
d gu
idan
ce to
enu
mer
ator
s.
Data input
In m
any
ques
tionn
aire
s, nu
mbe
rs w
ere
ente
red
for
the
quan
tity
of p
rodu
ctio
n bu
t ot
her
item
s w
ere
omitt
ed o
r m
arke
d by
“-.”
In
thi
s ca
se,
data
inpu
t sof
twar
e in
terp
rete
d th
e en
tries
as z
ero
(nil)
” w
hich
is d
iffic
ult t
o di
stin
guis
h fr
om z
ero
valu
e.
It sh
ould
be
clar
ified
as
to w
heth
er e
ach
zero
ent
ry
repr
esen
ts a
n om
issi
on o
r no
valu
e, in
ord
er to
impr
ove
data
acc
urac
y.
Enum
erat
ors
requ
est e
ntry
to e
very
app
licab
le
item
inc
ludi
ng z
ero
and
chec
k co
mpl
ianc
e at
th
e tim
e of
exa
min
atio
n, a
nd n
o va
lue
shou
ld
be e
nter
ed a
s “0”
in th
e da
taba
se.
Publication
Som
e co
mm
oditi
es
wer
e pr
oduc
ed
by
one
esta
blis
hmen
t, su
ch
as
VSI
C30
00
(off
ice
equi
pmen
t).
Com
mod
ities
th
at
are
mad
e by
on
e or
se
vera
l en
terp
rises
shou
ld b
e ch
ecke
d.
Com
mod
ities
to
be
ad
ded
in
the
MSM
P sh
ould
be
ch
ecke
d fo
r pr
esen
ce
of
com
mod
ities
w
ith
a lim
ited
num
ber
of
man
ufac
ture
rs.
For
the
fut
ure
publ
icat
ion,
th
e m
etho
d fo
r pu
blis
hing
da
ta
on
such
co
mm
oditi
es sh
ould
be
cons
ider
ed.

S3 - 34
< Q
uest
ionn
aire
Des
ign
> Ite
m
Issu
e Le
sson
lear
ned
Rec
omm
enda
tion
Basic information
In m
any
ques
tionn
aire
s, ba
sic
info
rmat
ion
such
as
tax
cod
e, a
ddre
ss,
tele
phon
e nu
mbe
r, an
d na
me
of c
onta
ct p
erso
n w
as o
mitt
ed.
As
thes
e in
form
atio
n is
ess
entia
l fo
r m
aint
enan
ce o
f th
e en
terp
rise
mas
ter l
ist a
nd g
uida
nce
shou
ld b
e m
ade
to p
reve
nt o
mis
sion
or
entry
err
or (
incl
udin
g en
try o
f na
me
or a
ddre
ss o
ther
tha
n th
ose
regi
ster
ed i
n th
e da
taba
se).
Effo
rts
shou
ld
be
mad
e to
en
sure
in
stru
ctio
n/gu
idan
ce
by
enum
erat
ors
to
surv
eyed
ent
erpr
ises
and
car
eful
exa
min
atio
n on
que
stio
nnai
res u
pon
colle
ctio
n.
Man
y re
spon
dent
s se
emed
to
be
co
nfus
ed
beca
use
prev
ious
sur
veys
did
not
ask
ent
ry o
f en
ding
inv
ento
ry,
for
whi
ch “
0” o
r “-
“ w
as
ente
red.
It w
as a
ssum
ed th
at m
any
ente
rpris
es to
ok in
vent
ory
of
prod
ucts
eac
h m
onth
. En
umer
ator
s sh
ould
ex
plai
n im
porta
nce
of
inve
ntor
y m
anag
emen
t to
res
pond
ents
at
the
time
of th
e pr
esen
tatio
n m
eetin
g fo
r su
rvey
ed
ente
rpris
es o
r dis
tribu
tion
of q
uest
ionn
aire
s.
Survey items
For
certa
in i
ndus
tries
, so
me
surv
ey i
tem
s w
ere
mar
ked
by d
iago
nal
lines
to
indi
cate
tha
t no
en
try
was
ne
cess
ary,
su
ch
as
inve
ntor
y an
d in
tern
al c
onsu
mpt
ion,
but
ent
ry w
as m
ade
by
som
e en
terp
rises
. A
lso,
the
re w
ere
item
s fo
r w
hich
all
ente
rpris
es i
n th
e re
spec
tive
indu
stry
di
d no
t ent
er d
ata.
Cro
ssin
g ou
t som
e ite
ms
was
dec
ided
on
the
basi
s of
pr
oduc
tion
activ
ities
of
spec
ific
indu
strie
s, it
was
not
ap
plie
d to
som
e en
terp
rises
or
indu
strie
s be
caus
e of
di
vers
ity
in
prod
uctio
n ac
tivity
th
at
wen
t be
yond
ex
pect
atio
n.
Cle
arly
, th
e m
etho
d an
d cr
iteria
for
se
lect
ing
the
cros
sed-
out i
tem
sho
uld
be r
evie
wed
and
re
vise
d.
Bas
ed o
n th
e re
sults
of
the
trial
sur
veys
, th
e re
view
sh
ould
be
m
ade
and
surv
eys
of
indi
vidu
al
esta
blis
hmen
ts
and
trade
as
soci
atio
ns
shou
ld
be
cond
ucte
d be
fore
m
akin
g re
visi
on.
Als
o, n
ew in
dust
ries
adde
d to
the
list s
houl
d be
sel
ecte
d pr
ior
to th
e st
art
of t
he s
urve
y af
ter
hear
ing
opin
ions
fro
m
esta
blis
hmen
ts a
nd t
rade
ass
ocia
tions
, sub
ject
to
rec
onfir
mat
ion
bein
g co
nduc
ted
arou
nd s
ix
mon
ths
afte
r th
e st
art
of t
he s
urve
y.
Als
o,
any
chan
ge
shou
ld
be
refle
cted
in
th
e qu
estio
nnai
re fo
r th
e ne
w s
urve
y th
at s
tarts
in
Janu
ary
each
yea
r.

S3 - 35
Item
Is
sue
Less
on le
arne
d R
ecom
men
datio
n
Commodities M
any
com
mod
ities
wer
e in
clud
ed in
the
“Oth
er
Prod
ucts
” co
lum
n.
Incl
usio
n in
“O
ther
Pro
duct
s” s
eem
s to
occ
ur d
ue t
o th
e fo
llow
ing
reas
ons.
- In
pre
viou
s su
rvey
s, en
terp
rises
wer
e as
ked
to w
rite
dow
n th
eir p
rodu
cts
and
wer
e no
t acc
usto
med
to s
elec
t an
d m
ark
appl
icab
le c
omm
oditi
es in
the
prin
ted
list.
- Des
crip
tion
of s
ome
com
mod
ities
was
not
spe
cific
or
com
preh
ensi
ve.
- A p
rodu
ct m
ade
by th
e en
terp
rise
was
iden
tical
to th
e on
e in
the
prin
ted
list b
ut th
eir
nam
es w
ere
diff
eren
t, re
sulti
ng in
mis
unde
rsta
ndin
g.
Enum
erat
ors
shou
ld b
e pr
oper
ly t
rain
ed t
o ex
plai
n th
e co
mm
odity
lis
t in
th
e qu
estio
nnai
re
accu
rate
ly
to
surv
eyed
en
terp
rises
. T
his
help
s en
umer
ator
s to
fin
d an
d pr
even
t en
try e
rror
in
the
exam
inat
ion
stag
e.
For
this
pur
pose
, in
stru
ctor
s of
the
G
SO a
nd th
e PS
Os
shou
ld p
rovi
de p
erio
dica
l gu
idan
ce.
In
the
futu
re,
the
com
mod
ity l
ist
shou
ld
be
revi
sed
for
conv
enie
nce
of
resp
onde
nts
conc
urre
ntly
with
the
tim
e fo
r se
lect
ion
and
resh
uffli
ng o
f co
mm
oditi
es b
y an
alyz
ing
resp
onse
s in
the
pas
t on
e ye
ar a
nd
excl
udin
g no
-res
pons
e ite
ms
or d
ivid
ing
a co
mm
odity
to
w
hich
an
ex
cess
ivel
y la
rge
num
ber o
f res
pons
es h
ave
been
mad
e.
In s
ome
ques
tionn
aire
s, en
try w
as m
ade
usin
g a
unit
othe
r th
an t
he o
ne s
peci
fied
and
prin
ted
in
the
ques
tionn
aire
.
The
follo
win
g er
rors
wer
e fo
und.
-
Con
fusi
on b
etw
een
“ton
” an
d “k
g” o
r be
twee
n “1
,000
pi
eces
” an
d “p
iece
s”
(mis
unde
rsta
ndin
g of
nu
mer
atio
n ru
les)
. -
Smal
l en
terp
rises
had
to
use
deci
mal
fig
ures
und
er
the
unit
of “
ton”
or “
mill
ion
VN
D.”
Th
is w
as tr
ue fo
r co
mm
oditi
es th
at w
ere
prod
uced
in sm
all q
uant
ities
. -
Som
e re
spon
dent
s us
ed
thei
r in
tern
al
unit
by
rew
ritin
g th
e un
it pr
inte
d in
the
ques
tionn
aire
. Th
us,
units
tha
t ca
n be
acc
epte
d by
all
resp
onde
nts
shou
ld b
e ag
reed
on.
Rec
onsi
dera
tion
shou
ld b
e m
ade
acco
rdin
g to
ch
arac
teris
tics
of
prod
uctio
n ac
tiviti
es
by
indu
strie
s by
an
alyz
ing
colle
cted
qu
estio
nnai
res
and
data
and
pro
ject
min
imum
un
its f
or s
urve
yed
ente
rpris
es.
Als
o, c
lose
ex
amin
atio
n by
enu
mer
ator
s up
on c
olle
ctio
n w
ill b
e co
nduc
ted.
Unit
The
valu
e of
shi
pmen
ts f
or e
ach
com
mod
ity
shou
ld
be
indi
cate
d in
V
ND
.
But
so
me
ente
rpris
es u
sed
US$
, w
hich
was
con
verte
d by
th
e es
tabl
ishm
ent
or t
he P
SO e
num
erat
ors
by
usin
g th
e ex
chan
ge ra
te o
n its
ow
n ch
oice
.
The
rule
for c
onve
rsio
n (to
be
mad
e by
the
PSO
, etc
.) w
as n
ot n
otifi
ed to
all
ente
rpris
es (e
stab
lishm
ents
) and
en
umer
ator
s.
The
ques
tionn
aire
sho
uld
be r
edes
igne
d to
al
low
en
try
by
curr
ency
of
re
spon
dent
’s
choi
ce,
VN
D
or
US$
, ac
cord
ing
to
the
ente
rpris
e’s
acco
untin
g ru
le, w
hile
the
PSO
is
requ
ired
to m
ake
conv
ersi
on a
t th
e un
iform
ex
chan
ge ra
te.

S3 - 36
Item
Is
sue
Less
on le
arne
d R
ecom
men
datio
n Numeration
system Th
ere
wer
e no
uni
fied
rule
for
num
erat
ion,
i.e
., us
e of
com
ma
and
perio
d, a
nd t
he r
ule
for
num
erat
ion
to s
epar
ate
the
thou
sand
s or
indi
cate
th
e de
cim
al p
oint
, re
sulti
ng i
n en
try o
r in
put
erro
r.
For
figur
es i
nclu
ding
a f
ract
ion,
the
rul
e w
as s
et t
o m
ake
roun
ding
to
the
seco
nd d
ecim
al p
lace
and
was
no
t wid
ely
com
plie
d w
ith.
Uni
t of
ind
icat
ion
may
be
chan
ged
to a
llow
us
e of
w
hole
nu
mbe
rs
by
anal
yzin
g qu
estio
nnai
res
and
data
, whi
le p
ayin
g ca
refu
l at
tent
ion
to th
e qu
antit
y of
pro
duct
ion
for e
ach
com
mod
ity.
A
lso,
en
umer
ator
s w
ill
be
inst
ruct
ed
to
give
pr
oper
gu
idan
ce
for
surv
eyed
ent
erpr
ises
.
Other Products
5% -
25%
of
prod
ucts
sal
es w
ere
clas
sifie
d in
“O
ther
Pro
duct
s,” d
epen
ding
upo
n pr
ovin
ces.
A
m
ajor
re
ason
is
th
at
enum
erat
ors
or
resp
onde
nts
tend
ed to
qui
ckly
cla
ssifi
ed p
rodu
cts
that
wer
e no
t fo
und
in t
he l
ist
(e.g
., th
e sa
me
prod
uct
but
the
nam
e di
ffer
s)
in
“Oth
er
Prod
ucts
” w
ithou
t ch
ecki
ng
the
prin
ted
com
mod
ity l
ist
care
fully
. A
lso,
the
re w
ere
a re
lativ
ely
larg
e nu
mbe
r of c
ases
that
an
inco
rrec
t in
dust
ry c
lass
ifica
tion
led
to t
he a
bsen
ce o
f th
e en
terp
rise’
s pro
duct
in th
e pr
inte
d lis
t.
Enum
erat
ors
and
resp
onde
nts
wer
e no
t acc
usto
med
to
the
com
mod
ity-b
ased
st
atis
tical
su
rvey
.
Als
o,
upda
ting
of i
ndus
try c
lass
ifica
tion
shou
ld b
e m
ade
perio
dica
lly.
Bas
ed o
n th
e re
sults
of q
uest
ionn
aire
ana
lysi
s, gu
idan
ce f
or p
rodu
ct d
escr
iptio
n an
d en
try
proc
edur
es s
houl
d be
repe
ated
ly m
ade
at e
ach
PSO
. A
sys
tem
to e
nsur
e th
e up
datin
g of
the
ente
rpris
e lis
t sh
ould
be
es
tabl
ishe
d in
re
spon
se
to
any
chan
ge
in
indu
stry
cl
assi
ficat
ion.
Design
The
thre
e-pa
ge q
uest
ionn
aire
ofte
n pr
oduc
ed a
n ill
egib
le
copy
on
th
e th
ird
page
w
hen
the
brus
hstro
ke w
as n
ot s
trong
eno
ugh.
A
lso,
it
took
con
side
rabl
e tim
e fo
r pro
per m
anag
emen
t at
the
time
of d
istri
butio
n an
d co
llect
ion.
As
the
thre
e-pa
ge
ques
tionn
aire
w
as
not
used
in
pr
evio
us s
urve
ys,
som
e en
umer
ator
s an
d re
spon
dent
s co
uld
not h
andl
e it
prop
erly
.
Afte
r th
e tri
al s
urve
ys,
the
prev
ious
sin
gle-
page
qu
estio
nnai
re
will
be
us
ed
and
its
colle
ctio
n w
ill b
e m
anag
ed a
t the
PSO
.

S3 - 37
< En
terp
rise
(est
ablis
hmen
t) lis
t >
Item
Is
sue
Less
on le
arne
d R
ecom
men
datio
n Industry classification
Ther
e w
ere
man
y m
ism
atch
es b
etw
een
the
form
of
qu
estio
nnai
re
and
indu
stry
cl
assi
ficat
ion.
So
me
ente
rpris
es
wer
e cl
assi
fied
in
wro
ng
indu
strie
s in
the
GSO
’s e
nter
pris
e lis
t.
In th
e on
goin
g su
rvey
, the
sam
e qu
estio
nnai
re is
use
d fo
r al
l ind
ustri
es, a
nd in
corr
ect c
lass
ifica
tion
does
not
af
fect
en
try
or
colle
ctio
n.
U
nder
th
e M
SMIP
, ho
wev
er, d
iffer
ent f
orm
s w
ill b
e di
strib
uted
acc
ordi
ng
to in
dust
ry c
lass
ifica
tion,
so th
at in
dust
ry c
lass
ifica
tion
shou
ld
be
accu
rate
ly
mad
e an
d re
flect
ed
in
each
qu
estio
nnai
re.
Whe
n th
e lis
t of
sur
veye
d en
terp
rises
for
the
M
SMIP
is
m
ade
from
th
e en
terp
rise
(est
ablis
hmen
t) lis
t in
the
GSO
’s d
atab
ase,
in
dust
ry
clas
sific
atio
n fo
r ea
ch
ente
rpris
e sh
ould
be
conf
irmed
thr
ough
the
PSO
. A
t th
e sa
me
time,
pr
oduc
tion
data
on
ea
ch
ente
rpris
e (p
artic
ular
ly
thos
e cl
assi
fied
in
“Oth
er P
rodu
cts”
) w
ill b
e ch
eck
perio
dica
lly
to
upda
te
indu
stry
cl
assi
ficat
ion.
Als
o,
poss
ibili
ty
to
dist
ribut
e pl
ural
fo
rms
to
ente
rpris
es h
avin
g m
ajor
pro
duct
s cl
assi
fied
in
diff
eren
t in
dust
ries
shou
ld b
e co
nsid
ered
for
fu
ture
im
plem
enta
tion,
in
or
der
to
ensu
re
accu
rate
surv
ey o
f eac
h in
dust
ry.
Plural forms of questionnaire
Com
mod
ities
mad
e by
som
e en
terp
rises
oth
er
than
the
ir m
ajor
pro
duct
s re
cord
ed t
he v
alue
of
prod
uctio
n ne
xt t
o th
e m
ajor
pro
duct
s. T
hese
ca
ses
led
to a
cha
nge
in m
ajor
pro
duct
to re
plac
e co
mm
oditi
es
in
the
orig
inal
in
dust
ry
clas
sific
atio
n re
cord
ed in
the
DSO
’s d
atab
ase.
If o
ne f
orm
is
used
for
eac
h es
tabl
ishm
ent,
data
on
prod
ucts
cla
ssifi
ed in
diff
eren
t ind
ustri
es w
ith s
izab
le
prod
uctio
n ca
nnot
be
obta
ined
. A
lso,
a s
yste
m t
o ef
fect
uate
a p
rom
pt c
hang
e to
a p
rope
r for
m s
houl
d be
es
tabl
ishe
d in
th
e ca
se
whe
n a
prod
uct
of
othe
r in
dust
ry b
ecom
es th
e m
ajor
pro
duct
.
If
the
MSM
IP
uses
on
e fo
rm
for
each
qu
estio
nnai
re, a
sys
tem
to
conf
irm t
he m
ajor
co
mm
odity
per
iodi
cally
and
acc
urat
ely
shou
ld
be e
stab
lishe
d.
Als
o, p
ossi
bilit
y to
dis
tribu
te
plur
al
form
s sh
ould
be
ex
amin
ed,
and
if di
strib
uted
, a
syst
em
to
set
and
exec
ute
sele
ctio
n cr
iteria
(fo
r in
stan
ce, a
n in
dust
ry t
o w
hich
a c
omm
odity
mad
e by
the
ent
erpr
ise
with
a c
erta
in p
erce
ntag
e of
its
tota
l val
ue o
f pr
oduc
tion
belo
ngs)
sh
ould
be
es
tabl
ishe
d.
In
the
com
mod
ity-b
ased
su
rvey
, su
rvey
ed
com
mod
ities
sho
uld
be i
dent
ified
as
far
as
poss
ible
.

S3 - 38
< O
ther
>
Item
Is
sue
Less
on le
arne
d R
ecom
men
datio
n Public education and
promotion Lo
w l
evel
of
reco
gniti
on o
n cu
rren
t pr
oduc
tion
stat
istic
s am
ong
ente
rpris
es
As
the
resu
lts o
f th
e on
goin
g M
onth
ly I
ndus
trial
Sa
mpl
e Su
rvey
ar
e no
t w
idel
y pu
blis
hed,
m
any
ente
rpris
es d
o no
t kno
w a
bout
the
publ
icat
ion.
The
ques
tionn
aire
sur
vey
cond
ucte
d in
Tria
l Su
rvey
1 s
how
s th
at a
ppro
xim
atel
y 79
% o
f su
rvey
ed e
nter
pris
es s
how
ed in
tere
st in
sur
vey
resu
lts.
The
lev
el o
f re
cogn
ition
sho
uld
be
impr
oved
by
adve
rtisi
ng th
e on
goin
g M
onth
ly
Indu
stria
l Sam
ple
Surv
ey a
nd it
s re
sults
on
the
new
spap
ers a
nd o
ther
med
ia.

4. Development Plan for Current Production Statistics

4. Development Plan for Current Production Statistics
S4 - 1
4. Development Plan for Current Production Statistics
4.1 General Outline of the Development Plan for Current Production Statistics
4.1.1 Design Principle
At present, the GSO is conducting the “Monthly Industrial Sample Survey”*1
for the purpose of monitoring economic trends. This is a national-scale statistical survey covering mining, manufacturing, and electricity/gas/water supply sectors, but its primary purpose is to show macroeconomic trends and it does not allow the user to understand production activities in detail, especially at industry and commodity levels. On the other hand, current production statistics that are proposed under the Study have the primary purpose of showing micro-level industry trends and integrated macro-level industry trends with its at micro-level. Therefore, the design principle for “current production statistics” is to establish a new statistical base that allows the understanding of commodity-based production activities and that provides data and information on production activities of Vietnamese industries in an accurate and prompt manner for not only policymakers but individual companies and investors as well, with a ultimate goal to promote industrial development on a national scale.
Meanwhile, there are strong needs for current production statistics for the purpose of
industrial and regional development at regional levels, for they are viewed as a basic source of information that can be used for regional economic analysis and thus becomes a powerful tool for public administration and policymaking to meet the local needs effectively. Generally, the primary purpose of current production statistics is to make data that depict characteristics relating to industry and commodity available to the public. In consideration of the strong needs for regional statistics, however, the development plan for current production statistics in Vietnam envisages system design that takes into account the need for region- or province-level data processing. In particular, the following goals are set as the basic design principles:
(1) To conduct quantitative surveys on a commodity basis; (2) To report monthly production activities and trends of the “Vietnamese industry”
*2
with reliability and promptness; and (3) To compile current production statistics in internationally comparable terms; (4) To tabulate and disseminate statistical data at national and local (administrative
unit) levels;
*1
The GSO’s Monthly Industrial Sample Survey covers all of state enterprises and foreign-affiliated companies (FDIs) and sampled non-state enterprises and “households (household industries).
*2
The definition of “industry” in Vietnam covers the following three sectors under VSIC two-digit classification (equivalent to ISIC’s sub-division), namely “mining and quarrying,” “manufacturing” and “electricity, gas and water supply.” The definition applies to “industry” referred to in this plan.

4. Development Plan for Current Production Statistics
S4 - 2
(5) To develop indices according to applicable international standards and by applying modern calculation techniques; and
(6) To design a statistical system that takes into account the needs for minimization of statistical survey costs and reduction of burdens on survey subjects (establishments).
4.1.2 Official Name of the Current Production Statistics Survey
The current production statistics survey to be implemented under the plan is formally entitled “Monthly Survey of Major Industrial Products (MSMIP).”
4.1.3 Survey System and Organization
4.1.3.1 Implementation Bodies
The current production statistics survey will be conducted by GSO’s Industrial and Construction Statistics Department, with actual field work to be performed GSO’s network of organizations (GSO, PSOs and DSOs), and under supervision of the MSMIP Supervisory Board (tentatively named).
(1) Organization of the MSMIP Supervisory Board
The MSMIP Supervisory Board will consist of six members who are representatives of the following organizations. Each member may designate a person to attend at the board meeting on his or her behalf.
1) Chairman: Director General of General Statistics Office
Vice chairman: Director of Department of Industrial Economy, MPI Vice chairman: Director of Industrial and Construction Statistics Department, GSO Member: Director of Research Department, PMO Member: Director of Planning Department, MOI Member/secretary general: Deputy Director of Industrial and Construction Statistics Department
2) Role of MSMIP Supervisory Board The supervisor board will assume the following duties. It will be convened by the
secretariat under the direction of the chairman for the purpose of fulfilling any of the following duties. i) Planning of statistical surveys, modification of questionnaires, and approval of
amendment to rules and regulations ii) Approval of reviewing and updating of surveyed industry sector, commodities and
establishments

4. Development Plan for Current Production Statistics
S4 - 3
iii) Guidance and recommendation for administration and management relating to statistical surveys
(2) Role of GSO Industrial and Construction Statistics Department, PSOs and DSOs
As explained earlier, the Industrial and Construction Statistics Department will be the lead organization within the GSO and will be responsible for building a statistical system to utilize organizations, staff and resources of the PSOs and the DSOs. The Industrial and Constructional Statistics Department, the PSOs, and the DSOs will assume the following duties.
GSO Industrial and Construction Statistics Department 1) Planning and design of the “current production statistics” survey 2) Development of questionnaires and manuals, and distribution to the PSOs 3) Guidance for PSO and DSO enumerators 4) Supervision of field survey activities 5) Final tabulation and analysis of statistical data 6) Dissemination of statistical data 7) Budget control relating to the current production statistics survey PSOs 1) Presentation and guidance to survey subjects (establishments) in each province 2) Distribution and collection of questionnaires 3) Examination of collected questionnaires 4) Data input to the computer and tabulation 5) Analysis and compilation of province-level data to be published 6) Management of data dissemination at provincial level 7) Work management relating to enumerators DSOs The DSOs will be responsible for, under the direction of the PSO, distribution of
questionnaires to survey subjects (mainly non-state enterprises and households), collection, examination of collected questionnaires, and work management relating to enumerators at municipality and district level. They will submit collected questionnaires to the PSOs by the specified day but will not be engaged in computer input work.
4.1.3.2 Survey Objects
The survey objects of the current production statistics survey will essentially consist of establishments and companies that manufacture commodities specified in questionnaires.

4. Development Plan for Current Production Statistics
S4 - 4
“Establishments” for the purpose of the current production statistics survey mean business establishments that are managed by a specific person (owner) and operate for more than three months and at the same location in Vietnam. They are usually factories (including processing shops).
(1) Cases when a surveyed establishment is unable to report
If a surveyed establishment is unable to make a report by submitting a questionnaire, a company owning or operating the establishment will be requested to do it on behalf of the establishment. This will happen largely in the following cases:
1) When it is very difficult for a surveyed establishment to make such report on survey items
in relation to the management system for the company to which it belongs; or 2) When a specific establishment other than the surveyed one (such as the company’s head
office) is responsible for reporting production data and related survey items relating to all establishments. The form of ownership is not questioned when surveyed companies are selected.
4.1.3.3 Method for Selecting Survey Objects
Survey design will be made by GSO Industry and Construction Statistics Department according to the following principles.
(1) Selection of industry to be surveyed
The MSMIP will cover the Industry Sector defined in Vietnam. Also, surveyed industries will be selected from VSIC four-digit classification. The selection process will start in the pre-survey stage in 2006, on the basis of the following selection criteria, and a final listing of industries for the current production statistics survey will be made by January 2008. The composition of the listing will be properly reviewed by GSO. While the primary selection factor is the out-put value of industry as a whole, it may not be used as criteria for specific industries that are considered by the MSMIP Supervisory Board to require special consideration.
1) Selection criteria for industries to be surveyed
Selection criteria for industries are the out-put value of 20 trillion VND per industry (VSIC four-digit level) with an ultimate coverage rate of over 90% of national production. The standard value will be reviewed every three years, starting in 2008. (Note that the review interval will be formally decided by the MSMIP Supervisory Board.)
Reason for the selection criteria (20 trillion VND per industry (VSIC four-digit level) with an ultimate coverage rate of over 90%)

4. Development Plan for Current Production Statistics
S4 - 5
To grasp production activities accurately at microeconomic levels and develop indices representing macroeconomic trends, the statistical survey does not need to cover every industry sector and commodity. Rather sample surveys are desirable from the viewpoint of efficiency, while reviewing industries and commodities to reflect the change of the times. In the case of the Vietnamese industrial sector, 90% of national industrial production in 2003 are accounted for by 55 out of 128 industries (VSIC four-digit)
*3, and the remaining
10% by 73 industries, each of which is fairly small and represents minimal share of total industrial production. Thus they are not representative industries in the country’s manufacturing sector and their data are not statistically significant in terms of influence on the overall data. Besides, it takes extra cost and manpower to survey all companies in these small industries every month, having negative impacts in terms of cost and benefit. In 2003 data, the industry that ranked 57th from the top accounts for slightly over 90% (90.47%) of total industrial production, while annual sales per industry amount to around 20 trillion VND. For this reason, the selection criteria in the first year of the MSMIP are set at 20 trillion VND in the out-put value and the 90% coverage rate.
2) Reviewing of surveyed industries
The selection criteria and composition of surveyed industries will be reviewed once a year periodically. As the Vietnamese industry, especially the manufacturing sector, changes very rapidly in recent years, efforts should be made to establish statistics that can reflect the changes as close as possible. Foreign-affiliated companies (FDIs) have a profound impact on production trends in Vietnam. With such a perspective, each PSO shall keep close contact with people’s committee to grasp the investment trends. Furthermore, annual production of surveyed industries used as selection criteria is determined on the basis of MSMIP data up to the previous year and the enterprise census data in the previous year.
3) Reviewing of surveyed industries according to ISIC revision
The United Nations Statistics Division reviews and revises Intentional Standard Industrial Classification (ISIC) as needs arise. At present, the reviewing of ISIC Rev.3.1 has been completed and draft ISIC REv.4 is publicized. As VSIC is based on ISIC Rev.3, GSO Department of Standards and Methodology is revising VSIC to reflect changes enacted in ISIC Rev.4. Thus, MSMIP that will be launched in January 2007 will be considered to use VSIC Rev.4.
Based on the above criteria, the number of industries covered by the survey is
expected to be 70 sectors in total including 7 mining sectors, 60 industry sectors,
*3
Under ISIC, there are 127 four-digit industries, and 130 under VSIC, of which 128 industries are reportedly conducting production activities, one way or another, in Vietnam.

4. Development Plan for Current Production Statistics
S4 - 6
and 3 electricity/gas/water sectors in January 2007 and approximately 75sectors in January 2008.
(2) Selection of commodities to be surveyed
Based on the industrial commodity classification made by GSO Industrial and Constructional Statistics Department, commodities covered by the survey will be selected with reference to the latest version of Vietnamese Central Product Classification (VCPC) (five-digit) to facilitate international comparison. Commodities so selected will include finished products – finished consumer goods – and intermediate goods that are distributed in the market. For some industries, it is impossible to cover all commodities produced locally. To compensate for this, composition of commodities for each industry should be designed to account for over 80% of the total value of production by the industry. To be ready for the case when diverse commodities are made by a specific industry, two or more questionnaires will be used for each industry instead of one questionnaire for one industry.
1) Selection criteria for commodities
Selection will be made from VCPC’s five-digit commodities and no quantitative criteria such as production will not be used, because there is a large variation between commodities. Selection will be made according to the following procedures. (a) A list of commodities for each industry is prepared on the basis of JICA’s trial surveys
up to 2005 and the list of commodities prepared for the pre-survey in 2006 (basically covering 48 industries selected for the pre-survey and those to be added in 2007).
(b) For industries to be newly added, classification (also unit) of commodities that are deemed to be major commodities for each of the industries will be made on the basis of VCPC five-digit classification and information obtained from related industries.
VCPC is based on international classification standards and does not necessarily accord
with Vietnam’s actual commodity structure. Also, some commodity names may be too long to be accommodated in the questionnaire. For these reasons, commodity classifications so selected may not agree with VCPC five-digit classifications. Here, care should be taken to reflect the country’s commodity structure effectively and to group commodities in such way to allow surveyed establishments to respond with ease.
(c) In addition to selection of commodities, the unit of production for each commodity is
determined. (d) For industries and commodities to be newly added, final adoption will be made after
trial surveys for the period of one year to check a detailed production status and trend.

4. Development Plan for Current Production Statistics
S4 - 7
(e) For commodities that are formally selected for the statistical survey, their definition and scope of coverage is made into a separate document, which is distributed to enumerators upon approval of the MSMIP Supervisory Board.
(f) For selection of commodities and their units, obtaining relevant information from large
establishments and trade associations is very important and the pre-survey is conducted as required.
2) Reviewing of commodities
Based on the above commodity classification, questionnaires will be designed and trial surveys will be conducted for a specific period (one year) to collect statistical data. Upon the end of the trial period, the commodity classification will be reviewed and finalized for formal questionnaire design. As there is the absence of commodity-based data in Vietnam, the MSMIP is expected to be the first step to collect such data on a full scale. In the future, it is expected to build up a system to allow periodical reshuffling of commodities by establishing quantitative selection criteria on the basis of statistical data obtained by the MSMIP, industry information, and market analysis.
The reviewing of surveyed commodities will be carried out in a similar manner to that of
industries. In particular, drastic changes in economic conditions in recent years are expected to cause emergence of new commodities and a sharp increase in production. To keep abreast of such changes, new commodities will be identified through analysis of enterprise census data in the previous year, MSMIP data, and interviewing of industrial sources, and possibility of adding them to the list will be examined.
3) Adaptation to new VSIC classification
While the periodical reviewing of commodities will be carried out as discussed above, the reshuffling of commodities will also be required due to the reorganization of surveyed industries, which will be necessitated by the MSMIP based on the new VSIC, which will start in 2007. As a result, the commodity list will be revised on the basis of the comparison table for old and new VSIC classifications (or the one for ISIC Rev.3.1 and Rev.4 published by the U.S. Statistics Division). This should be done as promptly as possible after final selection of industries, while the results will be reflected in questionnaires.
Based on the above principle for selection of commodities, the number of
commodities covered by the survey is expected to be 550 at maximum in January 2007 and 630 in January 2008.
(3) Selection of establishments (companies) to be surveyed
Basically, companies to be surveyed must be establishments that manufacture commodities specified in questionnaires. In Vietnam, however, there is no comprehensive list of

4. Development Plan for Current Production Statistics
S4 - 8
establishments that specifies commodities that they produce. Thus, prior to selection of establishments, companies that have establishments need to be selected. The list of establishments is scheduled to be compiled on the basis of the 2007 census of business establishments, but it can be made ready for the MSMIP before the pre-survey is started in 2006. For this reason, the plan assumes that selection of companies is made on the basis of the previous company lists and selection/recommendation by PSOs and DSOs.
At the same time, however, the industry sector in Vietnam (mining, manufacturing,
electricity/gas/water supply) has 18,198 companies (according to the 2004 enterprise census). If households
*4 are added to this, the population size will be too large for monthly surveys.
Thus, while maintaining the purpose of developing current production statistics, it has been decided to select establishments that hold significant share of the respective industry (commodity) as until a certain level of representation is reached. More precisely, companies in each of VSIC four-digit industries will be selected in order of the value of production until the accumulated total production reaches 75% (representation rate), and all companies in the selected industries will be included in the formal survey, i.e., culling by the overall representation rate.
It should be noted, however, that state enterprises (both central and local) and foreign-
affiliated companies will be 100% surveyed in order to maintain statistical continuity from the ongoing monthly industry sample surveys that also cover all of these companies. (Note that, for the representation rate of 75%, all of state enterprises and foreign-affiliated companies would be included.) On the other hand, non-state enterprises and households will be covered so far as they are included in the industries represent 75% of the total.
Then, names, addresses, main products and others of selected companies will be compiled
and tabulated in the MSMIP establishment list stored in the computer and the final list of surveyed establishments will be made.
Based on the above selection criteria, the number of establishments covered by
the survey and that achieves the representation rate of 75% is 4,000 – 4,500 in January 2008 (Whole country base).
Yet, if local needs are to be taken into account, more non-state enterprises and households
should be added. In this case, the final number of surveyed establishments will depend much on how many non-state households and will be included. It is important to decide on the
*4
Households in the mining and manufacturing sectors are said to total around 780,000. For instance, if the sampling rate for the monthly industry sample survey is applied to this case, the sample size will be approximately 12,000 establishments.

4. Development Plan for Current Production Statistics
S4 - 9
overall size by taking into account processing capacity and cost burden of the GSO (including PSOs and DSOs) as well as other relevant factors.
4.1.4 Survey Items
For the purpose of studying production activities on a commodity basis, the following six survey items are selected as they constitute basis elements of current production statistics.
(1) Quantity of production (2) Quantity of shipments (3) Quantity of internal consumption (4) Inventories at the end of month (5) Value of shipments (invoice basis) (6) Quantity of production expected for the following month The necessity of “Total Net Turnover of Enterprise” for every month as a question item will
be discussed and determined with major statistics users based on the result of the Pre-Survey.
(1) Quantity of production This represents quantity of products made by surveyed companies in Vietnam and during
the survey period, including those made under contract manufacturing and processing, and products input or consumed within the same establishment for the purpose of manufacturing other products (not including work-in-process).
(2) Quantity of shipments
This represents quantity of products that are covered by the survey and are actually shipped, during the survey period, by the surveyed subject or from a warehouse or a place of storage rented under the name of the surveyed subject. Note that the following cases should be included in calculation of this survey item.
1) Shipments to other factory of the same company, which makes products that belong to the
same category of commodity 2) Shipments as raw materials to other factory of the same company 3) Shipments as raw materials for contract manufacturing 4) Shipments of contract manufactured products to customers 5) Internal use for sample, gift, exhibition or testing purposes

4. Development Plan for Current Production Statistics
S4 - 10
(3) Quantity of internal consumption Of products made by the survey subject during the survey period (as commodity specified
in the questionnaire), those consumed as raw materials and processing within the establishment are indicated in quantity, except for quantity of international use in (2) 5) above.
(4) Inventories at the end of month
This shows quantity of products (as commodity specified in the questionnaire) made by the survey subject and kept by the survey subject or at a warehouse or a place of storage rented under the name of the surveyed subject, as of the end of the survey month.
(5) Value of shipments
This represents the total value of products shipped by the surveyed establishment (factory) (on an inventory basis) during the survey period. Note that the value of shipments for products that are machined or otherwise processed by the surveyed establishment using raw materials furnished by the customer (thus only the processing charge is paid by the customer) is calculated as if said raw materials were purchased at the market price when they were furnished by the customer.
(6) Quantity of production expected for the following month
This should indicate the quantity of products that are expected to be made in the month following the survey month.
4.1.5 Form of Questionnaire
A questionnaire containing the above survey items will be prepared in a single sheet (A4 size). As shown in the next page, the front side has been revised in comparison to the form used for Trial Survey 2.

4. Development Plan for Current Production Statistics
S4 - 11
Figure 4-1 Questionnaire (Sample)
1-1. Enterprise Name 5. Respondent
1-2. Name of Establishment*
* Case name of the establishment is same as the enterprise name, leave this space blak.
6. Phone number
2. Tax Code
3. Address 7. Reference month of Year 2007
□ □ □ Foreign Investment □ Non - State
I. Information on Products
4-1
4-2
6-1
6-2
II. Total Net Turnover of the Establishment (Million VND): of which Industrial Net Turnover (Million VND):
III. Remarks (Please describe if there were any causes resulting in difference comparing with the previous month)
14. Respondent's Signature 15. Head of Establishment 16. Date signed by the Head of Establishment
Signature Signature Date
7
1000 litresFish sauce of all kinds (except driedfish sauce)
Other Seafood and Aquatic Productsn.e.c Ton
Salted or Dried/Smoked AquaticProducts (e.g. Torn Dried Squid)
Canned Aquatic Products
Ton
Ton
APPLIED TO INDUSTRY: 1512- Manufacture of Processing & Preserving of Fish & Fish Products -
Order UnitName of Products
Central State Local State
4. Type of enterprise(Check one)
Frozen Seafood and Aquatic Products
Chilled Seafood and Aquatic Products
(1)
2
(2)
Dried fish sauce Kg
3
5
6
Other canned fish and seafood
Minced or Pasted Aquatic Products
4 Canned tuna
Ton
Ton
1 Ton
Ton
Fish Sauce
(9)
Value Quantity
8. Production ofreference month
9. Shipment ofreference month
11. Ending Inventoryof reference month
12. Shipment Value ofreference month(Million Dong)
13. ProjectedProduction ofthis Month
Quantity
(4) (5) (7) (8)(3)
PSO sử dụng nội bộ (Tên Điều tra viên)
Cơ sở kinh tếXãHuyệnTỉnh
4-1 4-2 4-3 4-4
QUESTIONNAIRE NO: OD07 - 1512Issued by General Statistics OfficeDeadline: 12th of the Month
For Use of PSO
EnterpriseCommuneDistrictProvince
See backside forinstruction
4-1 4-2
QUESTIONNAIRE FOR TRIAL SURVEY IIMONTHLY SURVEY OF MAJORINDUSTRIAL PRODUCTS
Area Code Direct Number

4. Development Plan for Current Production Statistics
S4 - 12
Back Sheet
INSTRUCTION CONFIDENTIALInformation collected from this surveywill be strictly confidential and will bepublished only in consolidated form.
Description of Products
Commodity 1:Processed seafood preserved by ice or in the refrigerator at 0°C.
Commodity 2:Processed seafood preserved at - 45°C.
Commodity 3:Salted, dried or smoked aquatic products whether or not cooked before or during the salting, drying orsmoking process. It includes smoked roes, anchovies, and shark fin.
Commodity 4-1:Canned tuna.
Commodity 4-2:Other canned fish and seafood.
Commodity 5:Seafood of all kinds preserved after grinding, mincing such as fish paste, shrimp paste, etc.
Commodity 6-1:Dried fish sauce.
Commodity 6-2:Fish sauce of all kinds (except dried fish sauce).
Commodity 7:Other processed seafood and aquatic products such as: well cooked products used as instant foods,sausage, ham, processed seafood for making animal feeds and other processed n.e.c.
Remark:
Please follow the instruction below.
1-1. Name of EnterprisePlease write down the name of enterprise as in business license.
1-2. Name of EstablishmentIn case the target unit is establishment under the enterprise, please write down the name ofestablishment as in Establishment Decision.
2. Tax codePlease write down the 10-digit tax code in case of enterprise and 13-digit tax code in case ofestablishment as granted by tax office.
3. AddressPlease write down address of the establishment (street, commune, district, province/city)
4. Type of EnterprisePlease select the type of enterprise.
5. RespondentPlease write the name of person who filled in this questionnaire.
6. Phone NumberPlease write the telephone number of the respondent (area code, direct number).
7. Reference MonthPlease write the month refered for this questionnaire.
8. Production Quantity of reference monthPlease report the quantity of production for the reference month for each listed products(excluding work-in-process). The item includes products directly produced by establishmentwith its own material. It also includes products that establishment produced for otherestablishments.
9. Shipment Quantity of reference monthPlease report the quantity of shipment for the reference month for each listed products. Theitem only includes quantity of products directly shipped by establishment that are produced inthe establishment and does not include the quantity of products directly shipped byestablishment that are produced by other establishments with survey establishment' s material.Please note shipment quantity does NOT include the internal consumption.
11.Ending Inventory Quantity of reference monthPlease report the quantity of ending inventory at the end of reference month for each listedproducts (excluding work-in-process and products which are produced by otherestablishments by survey establishment's material). The item only includes finished productsthat exits in warehouses or other stockyards owned or rented by the establishment. 12. Shipment value of reference month (Million Dong)Please report shipment value of each listed finished products. The shipment value is theshipment quantity multiplied by the shipment price where the definition of shipment quantity.The shipment value is calculated on the basis of sale invoice (excluding VAT).
13. Projected Production Quantity for the ensuing monthPlease report the quantity of projected production for the next month of reference month foreach listed products. Please refer the explanation for the aboved Item No 8 "ProductionQuantity".
II. Total Net Turnover of the Establishment (Million VND)Please report the total net turnover of the establishment. It is total economic value that theindustrial establishments achieved from thier production and business activities (excludingtax). It includes (1) receipts from selling goods done by the establishment, (2) Rceipts forgoods sold as purchased, (3) receipts for services, (4) Receipts from interest, copyright,dividend.Please report the total net turnover, of which the value from only industrial activities.
III. Remarks (Please describe if there were any causes resulting in differences comparing withthe previous month.)Please describe the specific causes which reflect the main factors of abnormal valuescomparing with the previous month.
14. Respondent's SignaturePlease provide a signature of the respondent.
15.Signature of the Head of EstablishmentPlease provide a signature of the head of establishment.
16. Date signed by the Head of EstablishmentPlease provide the date signed by the head of establishment.
For any inquiries, please contact at: General Statistics Office Room 333, 02 Hoang Van Thu Street, Hanoi Phone: (04) 8463483

4. Development Plan for Current Production Statistics
S4 - 13
4.1.6 Methodology for the Current Production Statistics Survey
4.1.6.1 Questionnaire Distribution Channels
The MSMIP will be conducted using survey networks of PSOs and DSOs, which are GSO’s local offices. In principle, the PSOs will take care of state enterprises, foreign-affiliated companies, and some non-state enterprises, while the DSOs will be responsible for non-state enterprises and households. The DSOs will conduct field work under direct supervision of each PSO.
The questionnaire distribution channels are shown below.
4.1.6.2 Distribution and Collection of Questionnaires
(1) Distribution and collection methods Questionnaires will be distributed by PSO and DSO enumerators twice per year
(December and June), each covering six months from the next month. In the pre-survey stage or in the initial stage of the permanent survey, detailed presentation needs to be made to survey subjects (establishments). In addition, efforts should be made to establish close communication with them, depending on each PSO’s judgment.
Collection of questionnaires will be made in the same manner as done for GSO’s ongoing
monthly industry sample survey. In other words, state enterprises and foreign-affiliated companies bring questionnaires to the PSOs by applying the reporting system. On the other hand, enumerators will visit non-state enterprises and households to collect questionnaires. They can be submitted by facsimile or online, while mail is not acceptable if the present postal situation is considered.
(2) Deadline for submission of questionnaires
The submission deadline will be set on the 11th of each month from the DSO to the PSO and on the 12th from surveyed companies to the PSO. If either date falls on Saturday or
GSO
DSO
Enterpri ses
(Establ i shments )
State
FDI
Non-State
Household
PSO

4. Development Plan for Current Production Statistics
S4 - 14
Sunday, Monday in the following week will become the deadline. Thus, the submission deadline at the PSO will be the 14th at the latest.
4.1.6.3 Handling and Management of Questionnaires
(1) Examination The examination on collected questionnaires will be performed by PSO or DSO
enumerators who have collected them. Key checkpoints include omissions, accuracy of numbers, and the balance between related items. Any error found or doubt raised by an enumerator will be referred to the company for confirmation.
(2) Confirmation and reminding
A company that fails to submit the questionnaire before the deadline will be contacted by the PSO or DSO enumerator for reminding. Reminding should be started at least two days before the deadline, although the exact date may be set by each PSO/DSO.
(3) Data input
Data input from questionnaires that have received the examination will be conducted at each PSO, which collects questionnaires collected and examined by DSOs. Data so inputted at each PSO will be sent to the GSO where data from all over the country are compiled and tabulated. (See Chapter 6 for details of data input activity.)
(4) Management of collected questionnaires
Questionnaires from which data input has been completed will be kept by each PSO for three years.
4.2 Dissemination
4.2.1 Dissemination Policy
Essentially, statistics compiled by government’s statistics bureau are public goods and their dissemination method and content are considered to be very important. In particular, current production statistics that are based on monthly data lose their significance and value if dissemination is delayed, and thus promptness as well as accuracy is highly critical. In other words, they have to be compiled and published in such way to satisfy their users in terms of timeliness, in addition to the dissemination method and content. The plan therefore sets forth the following policy for dissemination of current production statistics.
(1) Dissemination is made promptly unless it adversely affects statistical reliability. (2) Dissemination is made in a fair manner to all users. (3) Dissemination is made on the day fixed and announced in advance.

4. Development Plan for Current Production Statistics
S4 - 15
(4) Dissemination is made separately and independent of opinions of related ministries. (5) Dissemination contains analysis and explanation that is appropriate or required for
convenience of users. (6) Dissemination contains explanation on statistical techniques employed, including the survey
and data processing methods. (7) Dissemination is accompanied by organized user service, such as responding to questions.
Naturally, almost all of the above policies are already practiced or aimed at by statistical
bureaus in most countries, including the GSO. In Vietnam, the Statistics Law enacted in 2003 and the “Guideline for Statistical Development toward 2010” announced in 2002 set forth similar policies. Thus, the dissemination system for current production statistics including indices will be established by putting the above policies into practice as far as possible in the processing of building up the statistical system by 2008.
4.2.2 Dissemination Rules and Procedures
Dissemination will be made according to the following rules and procedures. Specific dates relating to dissemination, as mentioned below, will be determined by the MSMIP Supervisory Board.
(1) Results of the current production statistics survey are published at the end of the month
following the survey month and final results in a specified month each year. (2) Dissemination dates for quick report and definite report are fixed in advance and
dissemination is made on the dates as far as possible. (3) Current production statistics on a national level and indices, both quick and definite reports,
are published on the GSO’s Web site and by printed reports. Also, the gist of final results is published on the GSO’s Web site and detailed data by province form of ownership, company size, and other attributes are published in printing matters.
(4) National-level data, both quick and definite reports, are published in Vietnamese and English.
(5) The GSO is responsible for dissemination of national and regional statistics (eight economic divisions) and the PSO publishes provincial and municipal statistics. Note that the method and content of provincial and municipal statistics is determined through the detailed assessment of the local needs and prior consultation with the GSO. While dissemination is expected to start formally in February 2007 upon an official
announcement of the premiere’s decree on the MSMIP, the GSO is expected to establish the ability to publish the new statistics timely and accurately by gaining experience in informal dissemination during the pre-survey period, provided that such dissemination should be made by specifying that current production statistics so published are in the development stage and do not meet all the requirements for official statistics.

4. Development Plan for Current Production Statistics
S4 - 16
4.2.3 Items to be Disseminated
In light of the fact that statistics are public goods, dissemination covers all survey items, provided that an item - which dissemination violates confidentiality under the Statistics Law - is excluded from the dissemination list. Specific items to be published and related rules are summarized as follows.
(1) Total data on production, shipment, inventory, and production forecast for each commodity
subject to the statistical survey, both quick and definite, constitute basic survey items, provided that data on any commodity that lacks appropriate representative are excluded from the dissemination item.
(2) Based on the survey results, indices relating to production (including forecast), shipment
and inventory are published in both quick and definite reports. The base period is January 2006 for the pre-survey and the annual average for 2006 in 2007 and afterwards when the official survey is scheduled to be conducted. It should be noted, however, that the base period will be determined by the GSO by the end of 2006 after the difference in surveyed industries and commodities between the pre-survey and the official survey, and industries and commodities covered by the official survey will be proposed by the GSO and will be evaluated and approved by the MSMIP Supervisory Board.
(3) For official dissemination, descriptive analysis of major trends as well as numerical data is
presented. (4) From the viewpoint that statistics are public goods, dissemination covers all survey items.
However, any item which is confidentiality may be violated, including the request for non-disclosure by a survey subject, is excluded from dissemination. A final decision is made by the MSMIP Supervisory Board, in due consideration to previous practice and ruling in Vietnam.
(5) In the future, dissemination of detailed data by each of the eight regional blocks, form of
ownership, and size of employment will be considered. (6) Dissemination of results of household enterprise survey to be conducted during the pre-
survey will be decided by the GSO after evaluation of the survey results (statistical data) in terms of accuracy and reliability.
4.2.4 Dissemination Procedures
Just like any other statistics, dissemination of current production statistics should be done after a close examination on their accuracy in order to ensure reliability of government statistics.

4. Development Plan for Current Production Statistics
S4 - 17
For current production statistics, reliability assured by a close examination is as important as promptness. To meet these requirements, the following general rules are set as to dissemination procedures.
(1) Dissemination of both quick and definite reports is made upon approval by the MSMIP
Supervisory Board. Web site dissemination is made by the division in charge of Web site maintenance, also subject to the board’s approval.
(2) Dissemination at provincial and municipal levels is made upon examination by each PSO
and under the supervision of the GSO. Dissemination may be adjusted to meet the local needs under responsibility of the PSO.
(3) In addition of periodical dissemination of quick report (monthly) and definite report
(annually) results, the reviewing and reshuffling of surveyed industries and commodities is carried out as required to reflect dynamic changes in the country’s production activities. Likewise, the calculation basis for indices is reviewed and revised from time to time in order to ensure use of adequate weights.
4.3 Development Schedule
To establish a formal system for current production statistics in the next two years (May 2006 ~ June 2008), its development schedule (work items and time schedule) is presented as follows (see Fig.4-2). The development process is divided into the following three stages, and activities required for each stage will be carried out under the leadership of the GSO’s Industry and Construction Statistics Division.
(1) Preparation period for formalization (May 2006 - January 2007) (2) First year of the official survey (February 2007 - January 2008) (3) Second year of the official survey (February 2008 and after)
4.3.1 Preparation Period for Formalization (May 2006 - January 2007)
This period allows for the formal procedures relating to the MSMIP, including legislation, and preparation for implementation of the official survey, following the completion of the JICA development study. At the same time, the GSO will implement a pre-survey covering selected areas and industries. As the pre-survey will be conducted concurrently with the ongoing Monthly Industrial Sample Survey, the preparation work will create significant workloads for the GSO, especially the Industry and Construction Statistics Division. Thus, it needs to be carefully planned and implemented according to an elaborate schedule.

4. Development Plan for Current Production Statistics
S4 - 18
Major work items (1) Establishment of the secretariat for MSMIP preparation to coordinate activities within
the GSO and at related ministries (2) Procedures for issuance of Prime Minister’s decree (development of a basic
development plan, etc.) (3) Coordination with related ministries for the launching of MSMIP (including the budget
request procedure) (4) Reviewing and selection of surveyed industries and commodities for the official survey (5) Correction and updating of the establishment list for the official survey (6) Redesign of questionnaires for the official survey and revision of manuals (7) Guidance for enumerators and establishment in newly selected areas (8) Construction of the dissemination system (9) Improvement of data analysis capability (through workshops based on the pre-survey
results) To launch the MSMIP in February 2007, the premiere’s decree designating it as official
statistics must be issued by the end of 2006, not to mention the establishment of the system and organization within the GSO and the securing of the necessary budget. Furthermore, the guidance to enumerators and establishments are significantly important in above major work items, and the assurance of sufficient budget and time shall be obtained to accomplish it.
4.3.2 Implementation of the Official Survey - First Year (February 2007 -
January 2008)
The formalization procedure will be completed by the end of 2006 and the MSMIP as official statistics designated by law will be launched in February 2007 (the survey month will start in January 2007). While the MSMIP will replace the ongoing Monthly Industrial Sample Survey, whether the survey will be able to cover all 64 provinces from the beginning depends on the ability to complete the preparation work by the end of 2006. To ensure smooth implementation of the statistical system, the basic development plan as proposed here envisages a staged increase in coverage and an entire coverage of 64 provinces in the second year. As a result, the first year of implementation will require activities relating to formalization, as continued from the preparation period, which are summarized as follows.
Major work items
(1) Establishment of the MSMIP Supervisory Board (2) Educational and promotion activities for potential users (including private enterprises) (3) Reviewing and selection of surveyed industries and commodities for completion of the
MSMIP (4) Correction and updating of the establishment list for completion of the MSMIP (5) Redesign of questionnaires and revision of manuals for completion of the MSMIP

4. Development Plan for Current Production Statistics
S4 - 19
(6) Guidance for enumerators and establishment in newly selected areas (7) Improvement and construction of the dissemination system (8) Improvement of data analysis capability
4.3.3 Implementation of the Official Survey - Second Year (February 2008 and later)
The second year will constitute the final completion stage for the MSMIP. If it is not feasible to cover all 64 provinces in the first year (2007) of the official survey, the second year will aim at perfection of the current production statistics survey. Thus, the most important task in the second year is the establishment of the entire survey process up to dissemination.
Major work items
(1) Educational and promotion activities for potential users (including private enterprises) (2) Reviewing of industries and commodities covered by the MSMIP and completion of the
commodity list for GSO industrial statistics (3) Correction and updating of the establishment list for the MSMIP and preparation of a
master sample list (4) Guidance for enumerators and establishment in newly selected areas (5) Improvement and construction of the dissemination system (6) Improvement of data analysis capability (7) Awareness survey of potential users of current production statistics

Figu
re 4
-2 D
evel
opm
ent S
ched
ule
in th
e N
ext T
wo
Yea
rs
56
78
910
1112
12
34
56
78
910
1112
12
34
56
Pre
para
tory
Per
iod
for I
nstit
utio
naliz
e (M
ay 2
006
- Jan
. 200
7)(1
)E
stab
lishm
ent o
f a p
repa
rato
ry c
omm
ittee
for M
SM
IP, a
nd p
repa
ratio
n(2
)P
rocl
amat
ion
proc
edur
e fo
r dec
isio
n of
the
Prim
e M
inis
ter (
incl
. for
mul
atio
n of
a b
asic
pla
n)
(3)
Coo
rdin
atio
n w
ork
to th
e go
vern
men
t age
ncie
s co
ncer
ned
(incl
. bud
get p
repa
ratio
n)
(4)
Sel
ectio
n of
sur
veye
d in
dust
ries,
com
mod
ity it
ems
for f
ull-s
cale
sur
vey
(5)
Sel
ectio
n of
the
targ
et e
stab
lishm
ent a
nd re
visi
on o
f an
esta
blis
hmen
t lis
t(6
)R
e-de
sign
of q
uest
ionn
aire
s an
d m
anua
ls(7
)G
uida
nce
for e
num
erat
ors
in th
e ne
w ta
rget
are
a(8
)S
yste
m d
evel
opm
ent f
or ta
bula
tion
and
publ
icat
ion
(9)
Dev
elop
men
t of d
ata
anal
ysis
1st Y
ear o
f Ful
l-Sca
le S
urve
y (F
eb. 2
007
- Jan
. 200
8)(1
)E
stab
lishm
ent o
f the
MS
MIP
Exe
cutiv
e C
omm
ittee
(2)
PR
and
enl
ight
enm
ent a
ctiv
ity fo
r sta
tistic
s us
ers
(incl
. FD
I, en
terp
rises
)(3
)S
elec
tion
of s
urve
yed
indu
strie
s, c
omm
odity
item
s fo
r com
plet
ion
of fu
ll-sc
ale
surv
ey
(4)
Sel
ectio
n of
the
targ
et e
stab
lishm
ent a
nd re
visi
on o
f an
esta
blis
hmen
t lis
t (ad
ditio
nal)
(5)
Rev
isio
n of
que
stio
nnai
res
and
man
uals
(6)
Gui
danc
e fo
r enu
mer
ator
s in
the
new
targ
et a
rea
(7)
Sys
tem
impr
ovem
ent f
or ta
bula
tion
and
publ
icat
ion
(8)
Dev
elop
men
t of d
ata
anal
ysis
(hol
ding
of w
orks
hops
at s
ome
PS
Os)
2nd
Yea
r of F
ull-S
cale
Sur
vey
(Feb
. 200
8 - )
(1)
PR
and
enl
ight
enm
ent a
ctiv
ity fo
r sta
tistic
s us
ers
(2)
Fina
lizat
ion
of G
SO
Com
mod
ity L
ist
(3)
Fina
lizat
ion
of G
SO
Mas
ter S
ampl
e Li
st fo
r ind
ustri
al s
urve
y(4
)G
uida
nce
for e
num
erat
ors
in th
e ne
w ta
rget
are
a(5
)S
yste
m im
prov
emen
t for
tabu
latio
n an
d pu
blic
atio
n(6
)Im
prov
emen
t of d
ata
anal
ysis
(7)
Impl
emen
tatio
n of
atti
tude
sur
vey
for M
SM
IP u
sers
2008
Mai
n Ta
sks
2006
2007
S4 - 20
◎
△△
△
◎
△△
△△
△

4. Development Plan for Current Production Statistics
S4 - 21
4.4 Operating Budget
The operating budget for the MSMIP will mainly consist of survey costs covering non-state enterprises and households that are required for management of the survey system, while the existing reporting system will be fully utilized. Also, the budget should allow for costs relating to preparation for formalization up to 2008, startup and full-fledged operation in the first two years, including promotional activities. Based on the above principles, the annual operating budget is established as follows.
(1) Training program for enumerators $15,400 (Including training costs for a total of 400 persons, including facility,
accommodation, transportation and documentation costs) (2) Questionnaire and manuals (printing) $36,500 (Questionnaires: $0.6/sheet x 5,000 sheets x 12 months = $36,000) (Printing of enumerator manual: $1.0 x 500 = $500) (3) Survey management $216,000 ($4.0/questionnaire sheet x 4,500 sheets x 12 months = $216,000) (4) Commissioning to IT Center $9,600 ($800 x 12 months = $9,600) (5) General administration (including educational/promotion activities) $2,000 Total $279,500
The above estimates are based on the assumption that the survey covers 4,500
establishments (questionnaires) per month. As pointed out earlier, the current production survey is designed to collect statistical data on a provincial and municipal basis, in addition to commodity-based data, necessitating an increase in coverage of non-state enterprises and households and thus creating an additional cost accordingly. Secondly, the operating budget includes costs relating to the enumerator training program and educational and promotional activities for current production statistics. Furthermore, the survey management cost includes costs relating to the use of the ongoing reporting system for collection of questionnaires from state enterprises and foreign companies. Thus, it may be reduced in certain cases.
The GSO’s 2006 budget allocates 320 million VND ($201,000) for the Monthly Industrial
Sample Survey that will be replaced with the MSMIP. At present, the survey covers approximately 18,000 establishments (of which 64% are households) each month, which constitutes an estimation basis different from the above. However, if the special factors mentioned earlier are added, the budget allocated to the Monthly Industrial Sample Survey seems to take care of full-scale implementation of the MSMIP effectively. While it takes the form of budget appropriation, the budgeting procedure requires a formal approval as a new program budget. Thus, it is important to review the basic development plan in the first half of 2006 and ensure a prompt coordination on the operating budget with related ministries and organizations.

5. Fundamental Designing for the Development of the Index of Industrial Production (IIP)

5. Fundamental Designing for the Development of the Index of Industrial Production (IIP)
S5 - 1
5. Fundamental Designing for the Development of the Index of Industrial Production (IIP)
5.1 Index Calculation for Statistics in Vietnam and Major Issues
5.1.1 Index Calculation for Statistics in Vietnam
The index calculation in Vietnam is made using the “constant price method”. This method has been implemented since 1961, and modified four times in 1970, 1982, 1989 and 1994. As shown below, the production index currently used in Vietnam is a growth rate of production values expressed in constant price.
Production Index of Vietnam at time t:
10010
0×=
∑∑
−t
tt
QP
QPI ··································································· (1)
where tI = Production Index at time t
0P = Constant price
tQ = Production quantity at time t
1−tQ = Production quantity at time t-1
It should be noted that the production value expressed in constant price is reported by
enterprises surveyed. Thus, the statistics offices at the central and regional levels do not obtain production quantity (Q), but only production value in constant price (∑ tQP0 ).
The production index of Vietnam, as stated above, is a growth rate of production value at
constant price. In principle, it is theoretically identical to the Laspeyres formula shown below because it applies a weight of the base period.
Laspeyres Production Index = 10000
0×
∑∑
QP
QP t
The difference between the standard Laspeyres index and the Vietnamese index is the time
of comparison. That is, the standard Laspeyres index sets the production quantity of the base period at the denominator. On the other hand, the Vietnamese index uses the production quantity of the previous time period as the denominator. This implies that the deduction of 100 from the standard Laspeyres index provides a growth rate between the current and base time periods, while the one of Vietnamese indexes provides a growth rate between the current

5. Fundamental Designing for the Development of the Index of Industrial Production (IIP)
S5 - 2
and previous time periods. If one calculates a factorial of Vietnamese index from the base time to the current time, it is identical to the standard Laspeyres index as shown below.
Factorial of Vietnamese index from the base time to the current time period
= ∑∑
∑∑
∑∑ ×××
−
−
− 00
10
20
10
10
0......
QP
QP
QP
QP
QP
QP
t
t
t
t
= ∑∑
00
0
QP
QP t (Standard Laspeyres Index)
5.1.2 Major Issues to be Addressed
The weakness of the Vietnamese index lies in several issues listed below.
(1) Application of Constant Price in 1994 In the questionnaire, each enterprise is requested to consult with the 1994 Constant Price
Table in order to calculate the production value in constant price. The problem arises because this table has not been updated since 1995. Especially, there are cases that enterprise cannot find new commodities such as IT products to fill out the questionnaire. Thus, there is a possibility that the index cannot accurately reflect the changes in overall production as it may not clearly reflect the production of new commodities.
(2) Lack of Integrity in Constant Price
This entails an extremely complicated process in selection of similar commodities, calculation of weighted average, and reflection of the price in new commodities. This may create a risk of miscalculation of the constant price. Also the constant price for new commodities may deviate among enterprises due to the fact that the selection of similar commodities is separately made by each enterprise even if they calculate the price for the same commodity.
(3) International Comparability
Most countries use 100 as an index in the base year. On the other hand, the Vietnamese index uses 100 for the last month. As the representation style of the Vietnamese index is not very common in other countries, there is a risk of resulting in the misuse of the index, which may sacrifice international comparability.

5. Fundamental Designing for the Development of the Index of Industrial Production (IIP)
S5 - 3
5.2 Index Calculation by New Methodology
5.2.1 New Methodology
In order to address the issues above, it is important to: (1) collect information on production quantity in the survey questionnaire to avoid the issues of constant price; and (2) apply a methodology widely employed among other countries to ensure international comparability. It is also important to keep in mind that the purpose of current Vietnamese index is to get information on industrial activity without considering an effect of price fluctuation. Thus, the new methodology is also expected to fulfill the same role as the current index.
There is a variety of methods in index calculation. The Laspeyres formula, which would
provide international comparability for statistics users, will be applied to the calculation of the Vietnamese index.
Laspeyres Formula: 10000
0×
∑∑
QP
QP t
5.2.2 Index Items
Four basic indicators are selected as indexed items, namely production, shipment, inventory, and project production indexes.
Table 5-1 Items to Calculate Indexes
Index Items Purpose Representation Weight Production Index (Value-added Weight)
Representation of production or supply trend
VSIC 1 and 2 digit Value added
Production Index (Value of production Weight)
Representation of production trends with comparison to shipment and inventory index
VSIC 1 and 2 digit
Value of production
Shipment Index Representation of demand for products
VSIC 1 and 2 digit Turnover
Inventory Index Representation of inventory level
VSIC 1 and 2 digit Inventory Value
Projected Production Index Representation of production in the next reference month
VSIC 1 and 2 digit Value added
5.2.3 Weight Calculation
(1) Weight at Industry Level The “expansion” method is used to calculate a weighted share of selected industries so
that they can represent the share of unselected industries. The weight at VSIC 4-digit level is determined by allocating the expanded weight at VSIC 2-digit level to the VSIC 4-digit level in order to harness the expanded weight at the VSIC 4-digit level.

5. Fundamental Designing for the Development of the Index of Industrial Production (IIP)
S5 - 4
The expansion from VSIC 2-digit level to the VSIC 1-digit level, and the allocation of expanded weight into the VSIC 4-digit level is performed by the following equation. The conceptual view is shown in Figure 5-1.
Expanded Weight
of Selected Industry (VSIC 2)
= 2) (VSICIndustry Selected the for Weightof Sum1) (VSICIndustry the for Weight
XWeight for the
Selected Industry (VSIC 2)
Weight
of Selected Industry (VSIC 4)
= 4) (VSICIndustry Selected the for Weightof Sum2) (VSICIndustry the for WeightExpanded
XWeight for the
Selected Industry (VSIC 4)
Figure 5-1 Concept of Expansion
(2) Weight at Product Level The process involves: (1) estimation of price by dividing the value of shipments by the
quantity of shipments; (2) estimation of values of production and inventory by multiplying the price to the quantity of production and the quantity of inventory; and (3) application of the product share to the respective VSIC 4-digit data from the Enterprise Census.
Figure 5-2 Weight Calculation for Commodity
Total
(=100)
VSIC 1-digit
VSIC15
VSIC 2-digit
VSIC16 (selected)
VSIC17 (selected)
VSIC18 (selected)
1810 (unselected)
1830 (selected)
VSIC 4-digit
allocation Expansion 1820 (selected)
VSIC1820 (selected) VSIC1830 (selected)
5000000
Mil Dong
Weight for Each
Value at VSIC 4-digit (Enterprise Census)
1000000 Mil Dong (20%)
750000 Mil Dong (15%)750000 Mil Dong (15%)
1250000 Mil Dong (25%)
1250000 Mil Dong (25%)
Value for Each Commodity
Commodity A (20%)
Commodity B (15%) Commodity C (15%)
Commodity D (25%)
Commodity E (25%)

5. Fundamental Designing for the Development of the Index of Industrial Production (IIP)
S5 - 5
5.2.4 Data Compilation Flow for Index Calculation
Index calculation follows six steps listed below such as weight calculation, index calculation at commodity level, and index calculation at industry level. Among them, the weight calculation is conducted only once at the time of base revision, while index calculation at commodity and industry levels is conducted every month.
The calculation may apply any computer software such as spreadsheet, database or statistics package. The calculation steps, in any case, should follow the steps mentioned below whatever the type of software applied. The chart below explains the compilation flow of index calculation.
Figure 5-3 Compilation Flow of Index Calculation
5.2.5 Revision for the Base Period and Commodity Selection
(1) Base Period Revision The Laspeyres quantity index applies: 1) weight that represents the industrial structure, 2)
major commodities of industries and 3) price evaluated at the base period. Thus, it is imperative to revise the base period when there is a change in commodity, e.g. emergence of new commodities and new industries, change in commodity prices and etc.
It should be noted that the Laspeyres index would be “biased” if the weight of the base
period differs significantly from the one of the current period. Especially, the Laspeyres index in the phase of economic growth is known to be higher than the one using the weight at the current period. The most typical case is the index with commodities made by mass production.
Step 5: Index Calculation at Commodity Level
Step 1: Calculation of Production Value and Inventory Value by Commodity
Step 3: Weight Calculation at VSIC 4-digit Level
Step 4: Weight Calculation at Commodity Level
Step 6: Index Calculation at VSIC 1-digit, 2-digit and 4-digit Level
Index Calculation at Commodity Level
Weight Calculation (at the time
of base revision)
Index Calculation at Industry Level
Step 2: Weight Calculation at VSIC 2-digit Level

5. Fundamental Designing for the Development of the Index of Industrial Production (IIP)
S5 - 6
In this case, the price is relatively high in the beginning, but it becomes gradually lower due to the volume effect. As a result, the Laspeyres index would have upper bias because the commodity growth is evaluated at a relatively high price. Thus, the revision of weight is essential in the calculation of Laspeyres index.
At the time of revision, it is also quite frequent to reconsider the commodity classification
so as to cover the new commodities in the calculation.
(2) Commodity Selection and Representation Ratio Since monthly statistics requires reliability and timeliness, the index calculation should be
made in efficient and accurate manner. Although it is feasible to cover all commodities in calculation, it would be burdensome to include all commodities as it requires analyzing and compiling numerous commodities under limited number of staff and computer capacity. Thus, covering all commodities in the calculation is not deemed to be very valuable as it does not necessarily increase the accuracy. Instead, covering major commodities would be more valuable as it increases the efficiency with sufficient accuracy.
The commodities would be selected by the order of production value in each industry. More specifically, at the first step, the “representation ratio" shown below is calculated. The representation ratio indicates the ratio of production value of selected commodities to all commodities in the corresponding industry.
∑
∑
=
== N
iii
m
iii
qp
qp
1
1Ratio tionRepresenta
where ip Price of commodity i
iq Production quantity of commodity i
m Number of selected commodities N Number of all commodities One may wish to choose a representation ratio in consideration of manpower availability or
computer capacity. The ratio, however, should be chosen by comparing to the index with using all commodities. That is, it is valuable to calculate the index with the 100% representation ratio and compare to the index with 95%, 90%, and/or 85% representation ratios. Although one may apply statistical tests such as t test or Wilcoxon test, it is important to plot the data and check them visually.

5. Fundamental Designing for the Development of the Index of Industrial Production (IIP)
S5 - 7
One should note it is essential to update the commodity selection so that the selection always matches the industrial structure and covers new commodities in an appropriate manner. As in the case of base period revision, however, too frequent revision of selection would be inefficient due to the limits of statistical office and the availability of data in analyzing the representation ratio. Thus, the revision of selection may be conducted at the time of base period revision. Nonetheless, it should take into account that the index calculation should always consider the relevance of commodity selection in order to calculate accurate index.
5.2.6 Notes on Application of New Index
As explained earlier, the new index has several capabilities such as: (1) the new index solves problems relating to constant price that occurs in the current index, (2) the new index conforms to an international standard that ensures international comparability, and (3) the new index provides a powerful analytical tool to understand industrial activities. On the other hand, there are several conditions required for compiling the new index.
(1) Reliability of Source Data for the Weight
The Laspeyres index is calculated by taking the commodity ratio between the current and base periods multiplied by the weight. In other words, each commodity trend is represented by the index with respect to the size of weight, i.e. the weight represents the impact of each commodity in the entire industry. Thus, it should be noted that reliability of source data for determining the weight is indispensable in calculating the index.
The source data for the weight is obtained from the Enterprise Census. However, this
census has some issues to concern. First, identification of an industry to which each establishment or enterprise belongs may not be accurate especially in case of new industries. Second, the weight by area or by province requires to be “estimated” as the Enterprise Census is composed of enterprise-oriented data (which provide only the consolidated data by enterprise that is not separable by area or by province). Third, the source data for the weight may lack accuracy in some provinces or industries.
Although these issues are not unique in Vietnam, they need to be resolved by enhancing
the quality of compilation procedure. It should be noted that the new index requires reliable source data in order to attain the accuracy.
(2) Application of Annual Average in Quantity
The Trial Surveys conducted in this Study used a single month as a base period, i.e. October 2004 for the First Trial Survey and October 2005 for the Second Trial Survey. A major reason for applying these single months is a relatively short period of a few months, thus not presenting a serious problem when the index is developed on an experimental basis. It should be noted, however, that the application of single month may contain problems

5. Fundamental Designing for the Development of the Index of Industrial Production (IIP)
S5 - 8
especially when the quantity data has seasonal disturbances. As mentioned earlier, the purpose of index calculation is to provide information on the industry trend in accurate and timely manner. Thus, the index should be calculated by using a stable base period, not based on a single month but on an annual average. The Pre-Survey, currently implementing, covers 60 sectors for 12 months. If the reliability of the data will be confirmed, it is recommended to adopt the average of 2006 as a base period.
(3) Application of Seasonal Adjustment
Any time series data contains seasonalities caused by the changes in natural factors such as a climate and social factors such as holidays. Vietnam also has seasonality typically in the climate of wet and dry seasons and the social customs of Tet holidays and etc.. The seasonal adjustment is a statistical methodology that removes seasonality from the time series data. In industrial statistics, there are many commodities contain seasonalities especially in food and electronics products. Thus, the application of seasonal adjustment is very valuable in order to grasp the industrial activity. This seasonal adjustment shall be reflected to the Official Survey based on the specific direction from the results of the Pre-Survey (yearly).
5.3 Basic Thoughts of System Development
(1) Number of Transactions Figure 6-12 shows contents and schedules for system development. First, all data from
Trial Surveys 1 and 2 data will be processed using FoxPro as a database engine. For data processing, it is assumed that the system has an interface function between data input and database establishment/analytic software. Stored data will be handed to any external application software using an export function of FoxPro and used as data for analytical purposes or making an index.
The number of transaction occurred during the Trial Surveys 1 and 2 are shown in Table 5-2.
Table 5-2 Number of Transaction Occurred During the Trial Surveys
Trial surveys/Transactions Trial survey1 Trial survey2 Number of survey provinces 3 9 Number of surveyed sectors 40 48 Number of surveyed commodities 213 524 Number of samples 500 1900+
FoxPro has a full function to process all the transactions shown in the above table. Microsoft Access will be used for data input and SQL Server for database storage during
the pre-survey that will be initiated in February 2006. These stored data will be handed to an

5. Fundamental Designing for the Development of the Index of Industrial Production (IIP)
S5 - 9
external application package such as Microsoft Excel using an export function of SQL Server and used for index creation.
An expected number of transactions that will occur during the pre-survey and the full-scale
official survey are shown in the following table.
Table 5-3 Number of Expected Transactions
Survey/Number of transactions Pre-survey Institutionalized survey
(Tentative) Number of survey provinces 25 64 Number of surveyed sectors 60 65 Number of surveyed commodities 590 530 Number of samples 8500 4,500 +α<20,000
Not only FoxPro but SQL Server 2000 have enough capacity to handle the above indicated
number of transactions.
(2) Basic Concepts of System Development Basic concepts of system development for processing of monthly statistics can be listed as
the followings; *1
1) To adopt currently used software at the GSO as core system for data processing As previously described, relational database software has been used as the database
engine to process the data in the core system. It is therefore suggested that the same software should be used in the future. Since functions of software which acts as the database engine do not vary among product names, it is not really necessary to specify a specific product name. It is because users should not pay so much attention to which software are they really using. However, when the user switches to a new relational database software program, more attention should be paid to data transfer and creation of interface program with the new application software.
2) To use a widely accepted software program and confirm its operability at the PSO/DSO
levels which use old versions The GSO has installed relatively new hardware and software. Particularly personal
computers have been frequently upgraded to the latest model. Then old models are
*1 As already described in section 2.4 of Chapter 2, there will be no need to enhance hardware systems for
development of monthly statistics processing software since the systems itself are well developed at GSO. Therefore, basic thought of software development are described in this section and establishment of hardware system is omitted. It, however, is necessary to improve number of computers and its function at DSO level in regional areas.

5. Fundamental Designing for the Development of the Index of Industrial Production (IIP)
S5 - 10
transferred to both PSOs and DSOs. Therefore, it becomes necessary to get acquainted with old and new models. Also software should be of off-shelf and popular products. Thus personnel who are responsible for system development need to understand the conditions of the environment for PC installation.
3) Systems should be transferred from the pre-survey that will start in February 2006 to the
full-scale survey that will start in January 2007. The data that are stored during Trial Survey 2 and the pre-survey will be used as targeted
data even after the launching of the full-scale official survey. In this case, transfer of data should be smoothly implemented. On the contrary, when these data have not been used, they should be deleted from the database and the establishment of new data should be considered.
4) The system should have enough capacity to process all transactions that occurs during the
pre-survey and official surveys. The umber of transactions to be processed is not discussed here as it was it already
discussed in the previous section.
5) Ease of maintenance and support, and full security function. Since the data obtained throughout the survey include highly confidential information,
unintended disclosure from the GSO or the PSO/DSO should be prevented. It is imperative to set up the security system to prevent an accidental or intentional leakage of data not only from the GSO’s server system but from a personal computer installed at each PSO for data input purposes. Also it is necessary to establish the secure system for periodical maintenance of not only input software and database engine for data storage, but also the interface program software.
Upon creation of the database, most important is maintenance and support of the database
itself. Maintenance includes periodical update, the establishment of the network system, and the management of the security system. To implement these maintenance and support systems, the deployment of permanent staff is required.
6) Continuous use of the same software
Continuous use of the same software during the certain period of time is highly desirable. Particularly, there is less needs of changing software used as database engine unless the number of transactions changes dramatically. Therefore, it is required to consider continuous use of the same software for the time being.
The above policy also applies to software for data input. Basically the input software
should not be changed regardless the changes of number and volume of transactions, and it

5. Fundamental Designing for the Development of the Index of Industrial Production (IIP)
S5 - 11
is sufficient to add minor functions such as the improvement of data input operation and procedure, error checking functions, and the adjustment of color arrangement, etc.
7) To consider the use of open source software in the future
Both FoxPro and QL Server are off-shelf, packaged software programs, but they are relatively costly. Continuous use of these software programs should be taken for granted, while it is necessary to consider use of open source software that has recently been used by a wide range of universities and other research institutions. Use of Linux as operating system and MySQL as relational database software are one of the examples.
8) To consider Web based software development
The most important thing to be considered relating to future system expansion is to promote the development in the web based system environment. This is important to aim at the automation of statistical processing including online distribution and collection of the questionnaire and file transfer of data to the database engine.

S5 - 12
Figu
re 5
-4
Con
tent
s an
d Sc
hedu
le o
f Sys
tem
Dev
elop
men
t
2005
Oct
Nov
Dec
Jan
Feb
Mar
Apr
May
Jun
Jul
Aug
Sep
Oct
Nov
Dec
Jan
Feb
2006
2007
Task
sTr
ial
Surv
ey 2
Pre-
Surv
ey
Mar
Apr
May
Inst
itutio
naliz
edSu
rvey
Num
ber
ofTa
rget
ted
Prov
ince
s9
2564
Num
ber
ofTa
rget
ted
Sam
ples
1900
+8,
500
incl
udin
g ho
useh
olds
Num
ber
ofTa
rget
ted
Com
mod
ities
1900
+
Syst
emDe
velo
pmen
t
MS-
FoxP
roba
sed
inpu
tso
ftwar
e+
MS-
Exce
lA
naly
tic T
ool
MS-
Acc
ess
base
d in
put s
oftw
are
+M
S-SQ
L Se
rver
bas
ed D
atab
ase
Engi
ne +M
S-Ex
cel A
naly
tic T
ool
Softw
are
Deve
lopm
ent
Data
Tra
nsfe
r
Mai
nten
ance
ofSo
ftwar
e+
Hard
war
e
Data
Upd
ates
Tria
l Sur
vey
1 is
om
itted
due
to e
xpira
tion.

6. Action Plans for Institutionalization of the Current Production Statistics Survey

6. Action Plans for Institutionalization of the Current Production Statistics Survey
S6 - 1
6. Action Plans for Institutionalization of the Current Production Statistics Survey
6.1 Positioning of Action Plans
This chapter presents supplementary proposals relating to the GSO’s policies and actions (including infrastructure development) that should be taken to pursue primary objectives of the Study - the “Basic Development Plan for Current Production Statistics” and “Development of Production Indices in Vietnam” as proposed in the report. In other words, action plans are proposed for institutionalization of the MSMIP, which is to be officially implemented in 2007. Note that the action plans are expected to be started promptly after the completion of the Study and to be implemented in the next two years, thus not necessarily addressing various issues that are revealed through the Study and need to be dealt with by the GSO from long-term perspectives.
After the end of this study, JICA plans to support the effort of the GSO by changing their
support formation to the Technical Cooperation Project. Even though, the implementation body of the action is the GSO’s Industrial and Constructional Statistics Department, which will be responsible for implementation of the MSMIP. Thus, the action plans are expected to require actions with the division itself, focusing on institutionalization, implementation, and sustainable management of the MSMIP.
6.2 Action Plans
6.2.1 Appointment and Team Organization Plan for the Institutionalization of MSMIP
Rationale for proposal: To start the MSMIP as official statistics in February 2007, a variety of preparatory
activities need to be conducted in 2006, under the leadership of the GSO’s Industrial and Constructional Statistics Department. The division has been actively involved in the trial surveys, but it has to carry out the preparatory work, together with the ongoing Monthly Industrial Sample Survey and other survey activities, until the MSMIP is institutionalized. Furthermore, the pre-survey for the MSMIP will start this year, creating much more workloads than the two trial surveys. Under these circumstances, the division needs to clearly define the role of staff who is engaged in the preparatory work, while securing sufficient time and budget to facilitate activities.
Proposal outline: Within the GSO’s Industrial and Constructional Statistics Department, a team in charge of
startup of the MSMIP will be formally appointed and the preparatory work for the MSMIP will

6. Action Plans for Institutionalization of the Current Production Statistics Survey
S6 - 2
be incorporated into the GSO’s ordinary business. The Preparation Team for MSMIP Institutionalization, as tentatively named, will be organized by five members, namely a team leader and four members in charge of “procedure and budgeting,” “survey planning and design,” “data configuration and system development,” and “local promotion and training.” Then, specific time and budget will be formally allocated to the team for implementation of the preparatory work. Upon institutionalization of the MSMIP (since 2007), the team will be transformed to the secretariat of the MSMIP Supervisory Board. Unwilling influence may be caused if the Industry and Construction Department supplies personnel in order to set up the full-time MSMIP team. Therefore, essentially, the number of staff of the department shall be increased.
6.2.2 Statistical Reliance Improvement Support Plan
Rationale for proposal: One of problems that have been identified in the course of the Study is a low level of
confidence in present statistics among local users; doubts about statistical data published by the GSO are raised by not only private companies but also government offices and organizations that are main users. Also, it is pointed out that statistics in Vietnam lack international compatibility with other countries due to the differences in classification, standard, and methodology. There are many reasons for the lack of confidence. It is partly due to the misunderstanding or the lack of understanding on the user side. Or it may come from the lack of information disclosure by the GSO concerning the statistical method or deficiency in the publication system itself, not to mention the lack of data reliability. As the current production statistics survey is designed to grasp monthly trends in production activities by industries, especially mining and manufacturing, it must achieve higher levels of accuracy, promptness, and international compatibility than previous statistics. Meeting these requirements will lead to the improvement of public confidence in statistics as a whole.
Proposal outline: To ensure reliability of the new survey for current production statistics, the “Statistical
Reliance Improvement Support Plan” will be formulated by the Preparation Team for MSMIP Institutionalization, followed by prompt implementation by the GSO. The plan essentially sets forth an implementation guideline for the basic plan proposed in this report and contains the following support programs to supplement the basic plan: ① a program to develop survey plans and designs; ② a program to review and revise survey designs; and ③ an educational and promotional program. The plan will set forth basic policy and specific activities for these programs, including specific instructions to the GSO’s Industrial and Constructional Statistics Department and PSO/DSO enumerators. Basic design principles for the three programs are summarized as follows.

6. Action Plans for Institutionalization of the Current Production Statistics Survey
S6 - 3
(1) Program to develop survey plans and designs This program gives an opportunity for the GSO to review the basic development plan
proposed in this report and to revise it in such manner to reflect the actual working environment surrounding the survey. For instance, questionnaire design should take into account convenience of survey subjects (establishments), i.e., survey items should be minimized as far as the survey objective is achieved, and the questionnaire should give due consideration to the ease of understanding about questions and explanations, as well as layout and other considerations to allow the respondent to fill out easily and quickly. To ensure accuracy and promptness, system rules supporting efficient implementation of key activities up to data tabulation should be established and enforced. The GSO should prepare its own survey plan after carefully reviewing the proposal in this report and by taking into account the above requirements. The program output is the “Preliminary Plan for MSMIP Implementation” that will be prepared as the basis of securing the premiere’s decree. If possible, the program will be implemented under technical support of outside experts.
(2) Program to review and revise survey designs
Vietnam’s industry recently undergoes substantial changes due to privatization of local companies and the impacts of foreign investment. In particular, increased foreign investment seems to accelerate production of new products within the country. Meanwhile, international industrial classifications have been revised to reflect the changes in the worldwide industry trend. To keep up with these dynamic changes, the MSMIP design should be accompanied by general rules for systematic and periodical reviewing and replacement of industries and commodities after the official launching of the system (after 2008), together with revision of industry and commodity classifications. Thus the program should contain clear rules for reviewing the current production statistics survey - e.g., who does what and when - with reference to similar cases in other countries.
(3) Educational and promotional program
This program will target surveyed establishments. It is critical to promote a general understanding of surveyed establishments concerning the objective of the MSMP survey and questionnaire design, partly because the MSMIP is newly introduced in the country and partly because high levels of accuracy and promptness must be assured as the official statistics published by the government. The educational and promotional program will be therefore planned to promote a good understanding of surveyed establishments about current production statistics and will be implemented on a regional (block) basis. As useful information has been obtained from implementation of the two trial surveys, the program will be designed to contain more specific details by taking into account lessons learned from the previous experience.

6. Action Plans for Institutionalization of the Current Production Statistics Survey
S6 - 4
For the development and implementation of these programs, it is required to make positive use of the long-term expert by the Technical Cooperation Project from July 2006 and other supports from other donors.
6.2.3 Action Plan to develop the “Master Sample” and the MSMIP
Establishment List
Rationale for proposal: The current production statistics survey treats manufacturing establishments as basic unit of
survey. This will be inherited to the MSMIP. However, the MSMIP will be primarily based on the sample survey to select survey subjects from a population group list, while state enterprises and foreign companies will be subject to the 100% survey. The GSO’s Industrial and Constructional Statistics Department has not made the list of establishments, and the list of companies is maintained as population used for taking annual enterprise census. Between the MSMIP and the enterprise census, while at least state enterprises and foreign companies are more or less the same, but the two lists are never identical because some companies have two or more establishments. For this reason, it is desirable to maintain the Industrial and Constructional Statistics Department’s population group list as master samples. The master samples contain basic information and allows results of the two different statistical surveys (the enterprise census and the MSMIP) to improve accuracy and minimize bias due to non-responses. It is therefore desirable to develop a list of surveyed establishments for the MSMIP on the basis of the master samples.
Proposal outline: Types of establishments contained in the latest list of companies will be rechecked on the
basis of the enterprise census survey conducted in March 2005 and will be established as the master samples. The MSMIP establishment list will be made on the basis of the master samples. In this case, data on household enterprises will be treated separately, but they will be added to the MSMIP establishment list by using information in the population group list for the establishment census (to be compiled in the near future) as reference. If it is difficult to develop the master samples and the establishment list by data processing personnel of the Industrial and Constructional Statistics Department, use of IT Center will be considered. In this case, as confirmation with individual companies and establishments will be partly required in the process of development the master samples or the establishment list, appropriate rules and procedures need to be made in advance.
6.2.4 Organization Plan for the Household Enterprise Data Analysis Team
Rationale for proposal: In the MSMIP pre-survey that is conducted since this February, households (household
industries) have been added as a new survey subject. As discussed earlier, however, inclusion of small business operators (household industries) those are not suitable for the sampling survey.
6. Action Plans for Institutionalization of the Current Production Statistics Survey
S6 - 5
Their share in the total GDP is so small, so that the most of small business operators are excluded from the survey objects of the current production statistics survey. Rather, the statistical survey of household industries is useful for learning the trends in rural economy where they dominate. At the same time, the number of households to be covered by the official survey is expected to exceed 10,000 and thus to surpass a combined total of state enterprises and foreign enterprises, creating significant workloads on data processing. To deal with the situation, the policy for handling household data should be decided prior to the start of the official survey by analyzing responses by households (including the unit of measurement) and their patterns during the pre-survey. Note that no such verification has been made during the trial surveys.
Proposal outline: Within the GSO Industrial and Constructional Statistics Department, a team will be
organized to thoroughly analyze household data obtained during the pre-survey. In consideration of the department’s manpower and resources, however, it is not realistic to organize an ad-hoc team for implementation of this plan. Instead, the team will be led by members of the Preparation Team for MSMIP Institutionalization, with assistance of the Trade, Services, Prices Statistics Department as required. The team will analyze the survey results and decide on standards and rules for treating household industries (e.g., the form of questionnaire compared to other enterprise types, presence of problems relating to data processing and tabulation), which will then be reflected in the official survey (in 2007 and afterwards). According to circumstances, the team may have to consider the possibility of conducing a survey of small enterprises and micro-enterprises, including households, as separated from the MSMIP. (Also, this may be postponed for additional year to analyze data in 2007 and reflect the results in the survey in 2008 and later).
6.2.5 Plan for Education and Training Planning for Enumerators and
Statistical Analysts
Rationale for proposal: To launch a new statistical survey, it is imperative to provide proper education and training
for enumerators. For the current production statistics survey, necessary education and training has been carried out in the form of technology transfer from the study team to the GSO’s Industrial and Constructional Statistics Department and key PSOs in Hanoi and Ho Chi Minh, with expectation that statistical knowledge and techniques will then be disseminated to rural regions. However, it has become apparent in the course of the Study that statistical staffs at the GSO and related organizations need to learn more than statistical techniques, i.e., they need to understand the meaning of the current production statistics survey in the context of market principle, in light of the fact that the Vietnamese economy is in the middle of a major transition period. This entails a major change in mindset of statistical staff. For enumerators who form the front line of statistical survey, it is imperative to understand the difference between the new

6. Action Plans for Institutionalization of the Current Production Statistics Survey
S6 - 6
and old surveys (especially the ongoing Monthly Industrial Sample Survey). Without it, it is impossible to give an accurate explanation on the new survey or examine collected questionnaires. Likewise, data analysts and other statistical technicians who are responsible for development of indices and statistical analysis will face similar problems. Thus, it is difficult to support the MSMIP under old ideas and methods.
Proposal outline: This proposal consists of the formulation of an education and training plan for enumerators
in areas that will be covered by the pre-survey and the official survey. The plan will be implemented under the leadership of the GSO’s Industrial and Constructional Statistics Department. In the planning process, the development of the curriculum and selection of instructors will be made by utilizing expertise and experience of staff of the Industrial and Constructional Statistics Department and preceding PSOs as Hanoi and Ho Chi Minh PSOs. Prompt response and action on the enumerator training is needed to the areas where the pre-survey of the MSMIP has not been implemented up to now. It is appropriate to hold routine workshops by areas in the second half of 2006. The Industrial and Constructional Department will be the main implementation body and carries out adjustments on schedule and budget in the GSO. Also, the training of statistical analysts will be carried out by using overseas training programs as far as possible.