the study of emotion responses when applying scents … · the study of emotion responses when...
TRANSCRIPT

1
The Study of Emotion Responses when Applying Scents to Products
Tseng-Ping Chiu*, Chun-Heng Ho** * Ph.D. Student, National Cheng Kung University Industrial Design Department, [email protected]
** Assistant Professor, National Chung Kung University Industrial Design Department, [email protected]
Abstract: Researchers found scent is an important factor that can create and affect human emotions.
However, only few study focuses on the effect of applying scent to products in Industrial Design or
KANSEI Engineering. Hence, this study will use Pleasure-Arousal-Dominance (PAD) Emotion
Scales to investigate the correlation between product image (visual sensory) and scent (olfactory
sensory). There are two stages of experiment in this research. The first stage focuses on how
visual and olfactory sensory are correlated with emotion separately. In the second stage, we apply
the distinct scent samples to those distinct products found in the previous stage to discuss the multi-
sensory KANSEI values of the products. The results show (1) Visual sensory: there are highly
positive correlations between product character and users’ emotion. (2) Olfactory sensory: the
scents’ characteristic correlated deeply with users’ emotion state. (3) Multi-sensory: the ratings of
products with vivid characters are influenced by congruent odors, while adding appropriate scents
to products without vivid characters would mostly cause positive emotional responses.
Key words: Emotion Response, Industrial Design, KANSEI Engineering, Product Character, Product Scents
1. Introduction Cognitive differences are usually regarded as an important issue in Industrial Design field [1], and the
differences are usually caused by the ways that designers and consumers perceive the world differently.
Meanwhile, designers usually communicate with users through the product characters they designed, and these
characters cause not only the users’ perceptive differences but also emotional changes. Because the product
characters and perceptive differences are all reflections of users’ emotions, understanding emotion is becoming a
critical issue in product design. Lewis, Haviland-Jones, and Barrett suggest emotions can guide and fulfill our life
and make things in our daily life become meaningful, thus people tend to judge their quality of life through the
quality of their personal belongings [2]. On the other hand, since human has five senses, including vision, tactile,
auditory, taste and olfaction, we receive external information through these channels and then cause all kinds of
complex psychological and physical reactions we have. With the advent of the five-sense design, researchers have
shown that KANSEI factors can improve products’ image in Industrial Design [3]. In the meanwhile, researchers
also suggest KANSEI factors can increase consumers’ satisfaction by satisfying their mental needs and making
the product become friendlier to the users.
Within five senses, researcher argues that olfaction can retrieve more vivid impressions about things from our
memory no matter how long ago than memories retrieved from any other senses [4]. In addition, the memory
clues triggered by olfaction are more sensible and emotional than that triggered by other senses [5-7].

2
Additionally, the use of different scents in a store can affect consumers’ emotions and thinking processes [8].
Hence, scent can create and arouse emotions [9] and further enhance product liking [10-12]. Besides, previous
studies in scents and marketing find that a proper scent can drive strong purchase intentions [13]. Moreover,
researchers indicate that ambient odors are also a critical factor that can drive purchase intentions [14]. That is,
ambient odors can improve consumers’ emotion and even increase the rating of the products sold in the store. For
example, during the period of slack sales the popcorn stall in Disney Land will use artificial popcorn essence to
attract customers by the smell [15]. Also, Dunkin Donuts and Starbucks are consciously keeping a fresh coffee
smell in their store [16]. On the other hand, previous study also suggests that emotion can affect sense, cognition,
intention, and behavior [17]. As a result, we can find that scent has a strong correlation between marketing,
consumer behavior, and the retail environment.
In product design, the Mary Biscuit cookie box (Figure 1), designed by Stefano Giovannoni for the
manufacturer Alessi, setup a good example to demonstrate that applying scents onto products can affect the users’
emotion. This cookie box’s cover has a vanilla scent, which will not disappear with the passing of the years.
Besides, products with scents can be found on 3C products as well, such as Hyundai cell phone MP280 marketed
in November 2005 and ASUS laptop F6V Mulit-Color marketed in October 2008. Although there are few cases
that successfully integrate scent into product design on the market, little research is focused on the correlation
between product scents and product characters.
Figure 1. Mary Biscuit cookie box designed by Stefano Giovannoni for Alessi
2. Research Framework The main goal of this research is to find the correlation between scents and product characters and how it
affects users’ emotion. We adopt a modified PAD emotion scales proposed by Schifferstein and Tanudjaja [18] to
decompose the emotion into three scales, i.e. Pleasure, Arousal, and Dominance, and then discuss how scents
combine with product appearance would affect the evaluation of product character through three emotion scales.
The hypothetical model is shown in Figure 2 that the use of scents can change users’ emotions.
Emotion State
Product Character
suggested by literature
unclear link
+/- +/-
+/-
+/-
Hypothetical Model
+/-
+/-
+/-
+/-
Scent
Product Appearance
Pleasure
Arousal
Dominance
Product
Figure 2. The hypothetical model of current research

3
There are two stages of experiment in this research. The first stage focuses on how single sensory, i.e. vision
and olfaction, interacts with PAD emotion scales. Basing on the results from the first stage, these distinct scent
samples were applied onto those distinct products, and then the stimuli were rated with PAD emotion scales again
as the second stage. These two stages are discussed in the following two sections correspondingly.
3. Methodology
3.1 First Stage: Single Sensory and Emotion The first stage focuses on how visual and olfactory sensory are correlated with emotions individually. The goal
is to find out the distinct product samples, with and without vivid characters, for vision and the distinct scent
samples for olfaction.
3.1.1 Product Characters and Emotions 38 participants, age range 20 to 30 years old, took the questionnaire about the correlations between product
characters and emotions online. Participants were not limited to any gender but they must have at least two years
experiences in industrial design, including academic training. The questionnaire used five–point Likert scales to
rate the emotional responses after looking at the selected products’ pictures. The pictures contained the color, form,
and character of the products. However, the logo and label were removed and we did not mention that scents
would be added to the product in a later stage. The examples of stimuli can be found in Table 1 and there were 81
products in total. The results show that there is a linear correlation (r = .797 and p < .001) between positive
emotional responses and vividness of product characters (Figure 3). That is, the more a product has a vivid
character, the more positive emotion people will feel.
Figure 3. The correlation between positive emotional responses and vividness of product characters
Since the correlation between emotional responses and product characters is significant, we divided the product
into two groups, i.e. products with vivid characters and products without vivid characters. Furthermore, in order to
apply scents onto products in the next stage, we start to think about the suitableness of adding scents to some
kinds of products. As previous researchers suggested that conflicts between vision and olfaction would produce
negative emotional response [19], people normally do not expect that tableware would come with any smell. Thus
tableware is excluded from the stimuli. In addition, we think the products should also be simple and easy to
understand so we excluded 3C products as well. Further, we also eliminate those products usually having
particular smells such as cosmetic containers to avoid the stereotype of their scents. After screening out the
unsuitable stimuli, we cluster the products into two categories, i.e. pot-holder, vase. Thus, we have two groups of
4
stimuli and each group has two categories, and we pick two samples for each category of products while one with
a vivid characters but the other without (Table 1).
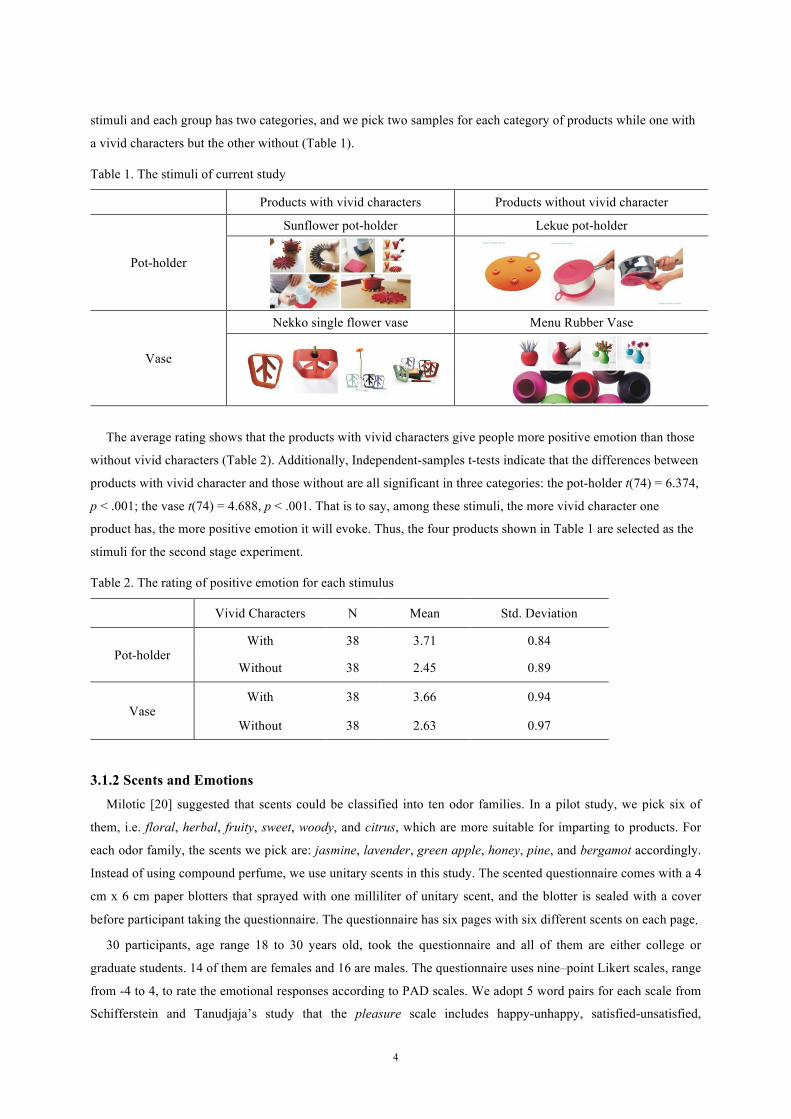
Table 1. The stimuli of current study
Products with vivid characters Products without vivid character
Pot-holder
Sunflower pot-holder Lekue pot-holder
Vase
Nekko single flower vase Menu Rubber Vase
The average rating shows that the products with vivid characters give people more positive emotion than those
without vivid characters (Table 2). Additionally, Independent-samples t-tests indicate that the differences between
products with vivid character and those without are all significant in three categories: the pot-holder t(74) = 6.374,
p < .001; the vase t(74) = 4.688, p < .001. That is to say, among these stimuli, the more vivid character one
product has, the more positive emotion it will evoke. Thus, the four products shown in Table 1 are selected as the
stimuli for the second stage experiment.
Table 2. The rating of positive emotion for each stimulus
Vivid Characters N Mean Std. Deviation
Pot-holder With 38 3.71 0.84
Without 38 2.45 0.89
Vase With 38 3.66 0.94
Without 38 2.63 0.97
3.1.2 Scents and Emotions Milotic [20] suggested that scents could be classified into ten odor families. In a pilot study, we pick six of
them, i.e. floral, herbal, fruity, sweet, woody, and citrus, which are more suitable for imparting to products. For
each odor family, the scents we pick are: jasmine, lavender, green apple, honey, pine, and bergamot accordingly.
Instead of using compound perfume, we use unitary scents in this study. The scented questionnaire comes with a 4
cm x 6 cm paper blotters that sprayed with one milliliter of unitary scent, and the blotter is sealed with a cover
before participant taking the questionnaire. The questionnaire has six pages with six different scents on each page�
30 participants, age range 18 to 30 years old, took the questionnaire and all of them are either college or
graduate students. 14 of them are females and 16 are males. The questionnaire uses nine–point Likert scales, range
from -4 to 4, to rate the emotional responses according to PAD scales. We adopt 5 word pairs for each scale from
Schifferstein and Tanudjaja’s study that the pleasure scale includes happy-unhappy, satisfied-unsatisfied,
5
cheerful-melancholic, hopeful-despairing, and surprised-bored; the arousal scale includes active-relaxed, wild-
lazy, nervous-lethargic, wide awake-sleepy, and stimulated-indifferent; the dominance scale includes powerful-
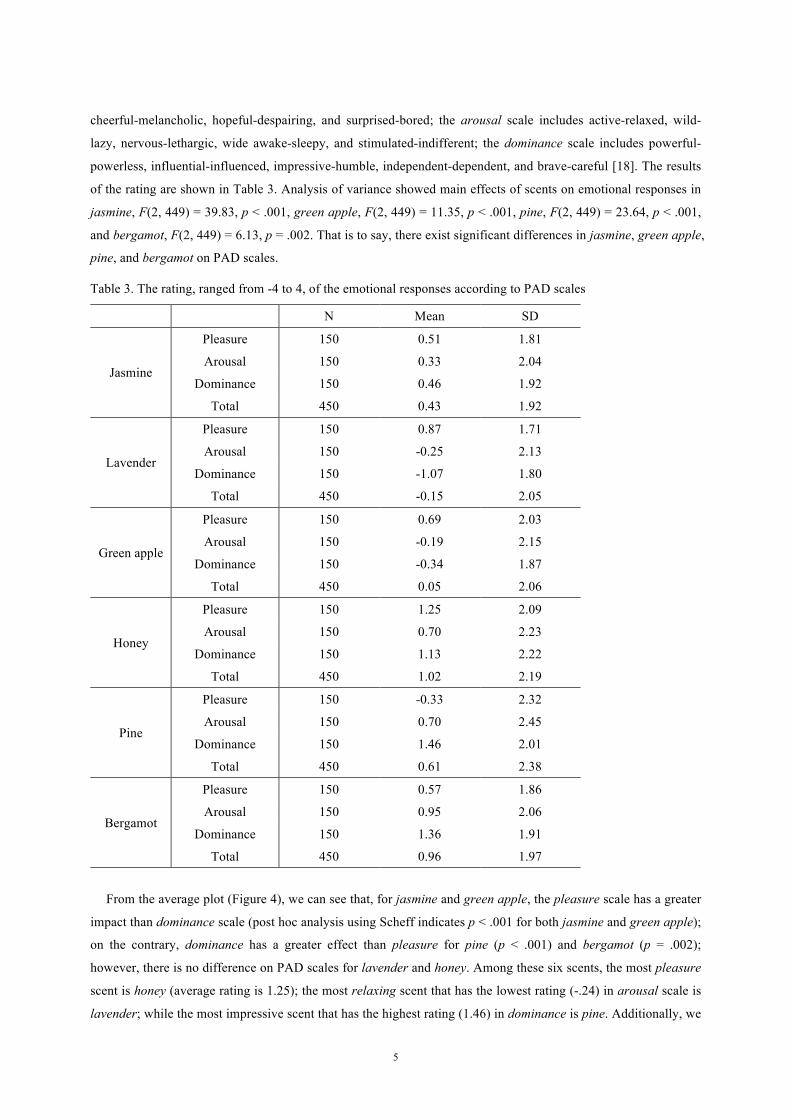
powerless, influential-influenced, impressive-humble, independent-dependent, and brave-careful [18]. The results
of the rating are shown in Table 3. Analysis of variance showed main effects of scents on emotional responses in
jasmine, F(2, 449) = 39.83, p < .001, green apple, F(2, 449) = 11.35, p < .001, pine, F(2, 449) = 23.64, p < .001,
and bergamot, F(2, 449) = 6.13, p = .002. That is to say, there exist significant differences in jasmine, green apple,
pine, and bergamot on PAD scales.
Table 3. The rating, ranged from -4 to 4, of the emotional responses according to PAD scales
N Mean SD
Jasmine
Pleasure 150 0.51 1.81
Arousal 150 0.33 2.04
Dominance 150 0.46 1.92
Total 450 0.43 1.92
Lavender�
Pleasure 150 0.87 1.71
Arousal 150 -0.25 2.13
Dominance 150 -1.07 1.80
Total 450 -0.15 2.05
Green apple
Pleasure 150 0.69 2.03
Arousal 150 -0.19 2.15
Dominance 150 -0.34 1.87
Total 450 0.05 2.06
Honey
Pleasure 150 1.25 2.09
Arousal 150 0.70 2.23
Dominance 150 1.13 2.22
Total 450 1.02 2.19
Pine
Pleasure 150 -0.33 2.32
Arousal 150 0.70 2.45
Dominance 150 1.46 2.01
Total 450 0.61 2.38
Bergamot
Pleasure 150 0.57 1.86
Arousal 150 0.95 2.06
Dominance 150 1.36 1.91
Total 450 0.96 1.97
From the average plot (Figure 4), we can see that, for jasmine and green apple, the pleasure scale has a greater
impact than dominance scale (post hoc analysis using Scheff indicates p < .001 for both jasmine and green apple);
on the contrary, dominance has a greater effect than pleasure for pine (p < .001) and bergamot (p = .002);
however, there is no difference on PAD scales for lavender and honey. Among these six scents, the most pleasure
scent is honey (average rating is 1.25); the most relaxing scent that has the lowest rating (-.24) in arousal scale is
lavender; while the most impressive scent that has the highest rating (1.46) in dominance is pine. Additionally, we

6
select the highest average rated word pair among six scents in each scale as the representative word pair used for
the next stage experiment. The pleasure word pair we choose is happy-unhappy (.77), the arousal word pair is
active-relaxed, and the dominance word pair is impressive-humble.
-2
-1
0
1
2
Pleasure Arousal Dominance
JasmineLavender Green apple Honey Pine Bergamot
Figure 4. The average rating of PAD scales among scents
3.2 Second Stage: Multi-Sensory KANSEI Values According to the results found in the first stage, the six distinct scent samples are imparted to the four distinct
products. In the following, we discuss what combinations can successfully enhance the multi-sensory KANSEI
values of the products based on the rating of PAD scales and two-way ANOVA analysis.
3.2.1 Experiment Design In the experiment group, the six scents (Figure 4) had applied to the four products (Table 1), while the products
in control group do not have any scent. In the experiment, each participant rated the stimuli by comparing the
product with and without scents together. Between each scent, we asked participants to smell coffee beans to
refresh the olfactory. Although the color is not considered as a factor in this study, it is impossible to find the
entire products in exactly the same color. Thus, we asked participants to wear black lens sunglasses to reduce the
effect of color perceptions. In addition, they were not allowed to touch the products during the experiments to
avoid the impact from tactile sense. The participants must have industrial design background and pass a warm up
olfactory test. There are 32 participants, age range 21 to 30 years old, took the experiment about the multi-sensory
KENSEI evaluations. Among them, 14 of them are males and 18 are females. The experiment setting is shown in
Figure 5.
Figure 5. Experiment setting
3.3 The Suitableness of Applying Scents to Products according to their Character
3.3.1 Paired-Samples T-Tests on Product Characters A paired-samples t-test indicate that rating scores were significantly higher for pot-holder (Table 4) with vivid
character (Mean = 3.23, SD = 1.21) than those without (Mean = 2.81, SD = 1.31), t(191) = 3.93, p < .001. For
vase (Table 4) with vivid character (Mean = 3.23, SD = 1.16), the scores were significantly higher than those
7
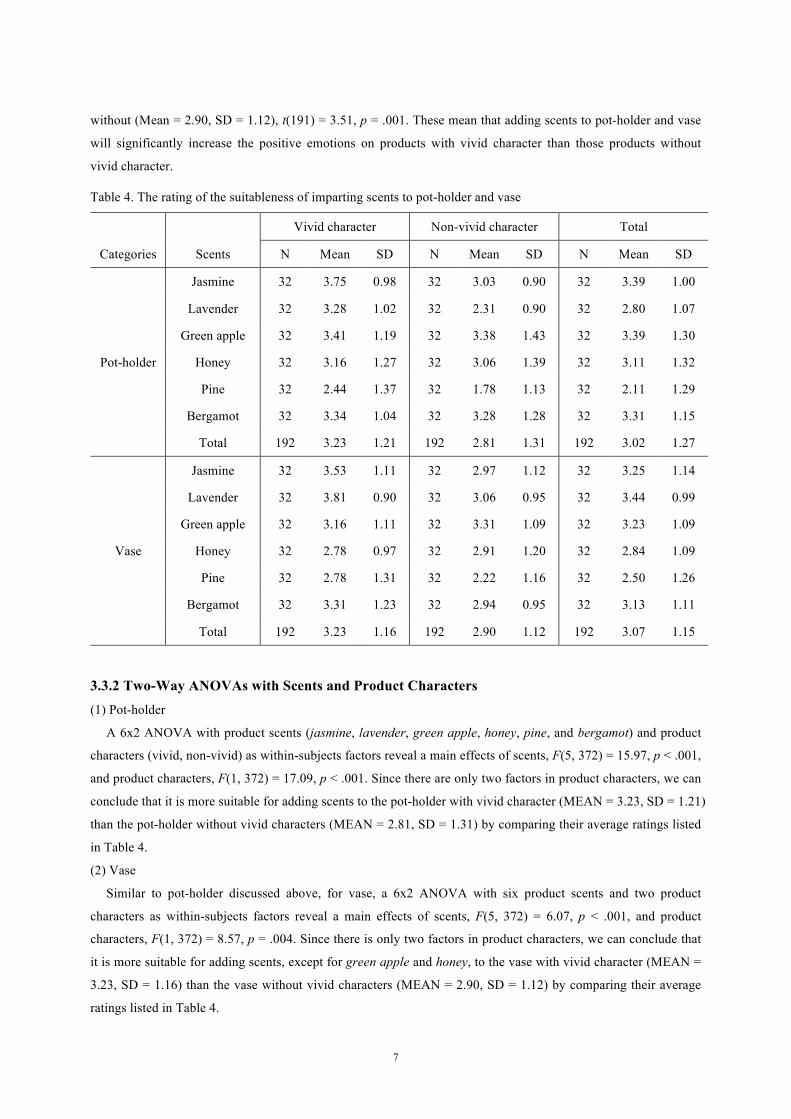
without (Mean = 2.90, SD = 1.12), t(191) = 3.51, p = .001. These mean that adding scents to pot-holder and vase
will significantly increase the positive emotions on products with vivid character than those products without
vivid character.
Table 4. The rating of the suitableness of imparting scents to pot-holder and vase
Vivid character Non-vivid character Total
Categories Scents N Mean SD N Mean SD N Mean SD
Pot-holder
Jasmine 32 3.75 0.98 32 3.03 0.90 32 3.39 1.00
Lavender 32 3.28 1.02 32 2.31 0.90 32 2.80 1.07
Green apple 32 3.41 1.19 32 3.38 1.43 32 3.39 1.30
Honey 32 3.16 1.27 32 3.06 1.39 32 3.11 1.32
Pine 32 2.44 1.37 32 1.78 1.13 32 2.11 1.29
Bergamot 32 3.34 1.04 32 3.28 1.28 32 3.31 1.15
Total 192 3.23 1.21 192 2.81 1.31 192 3.02 1.27
Vase
Jasmine 32 3.53 1.11 32 2.97 1.12 32 3.25 1.14
Lavender 32 3.81 0.90 32 3.06 0.95 32 3.44 0.99
Green apple 32 3.16 1.11 32 3.31 1.09 32 3.23 1.09
Honey 32 2.78 0.97 32 2.91 1.20 32 2.84 1.09
Pine 32 2.78 1.31 32 2.22 1.16 32 2.50 1.26
Bergamot 32 3.31 1.23 32 2.94 0.95 32 3.13 1.11
Total 192 3.23 1.16 192 2.90 1.12 192 3.07 1.15
3.3.2 Two-Way ANOVAs with Scents and Product Characters (1) Pot-holder
A 6x2 ANOVA with product scents (jasmine, lavender, green apple, honey, pine, and bergamot) and product
characters (vivid, non-vivid) as within-subjects factors reveal a main effects of scents, F(5, 372) = 15.97, p < .001,
and product characters, F(1, 372) = 17.09, p < .001. Since there are only two factors in product characters, we can
conclude that it is more suitable for adding scents to the pot-holder with vivid character (MEAN = 3.23, SD = 1.21)
than the pot-holder without vivid characters (MEAN = 2.81, SD = 1.31) by comparing their average ratings listed
in Table 4.
(2) Vase
Similar to pot-holder discussed above, for vase, a 6x2 ANOVA with six product scents and two product
characters as within-subjects factors reveal a main effects of scents, F(5, 372) = 6.07, p < .001, and product
characters, F(1, 372) = 8.57, p = .004. Since there is only two factors in product characters, we can conclude that
it is more suitable for adding scents, except for green apple and honey, to the vase with vivid character (MEAN =
3.23, SD = 1.16) than the vase without vivid characters (MEAN = 2.90, SD = 1.12) by comparing their average
ratings listed in Table 4.
8
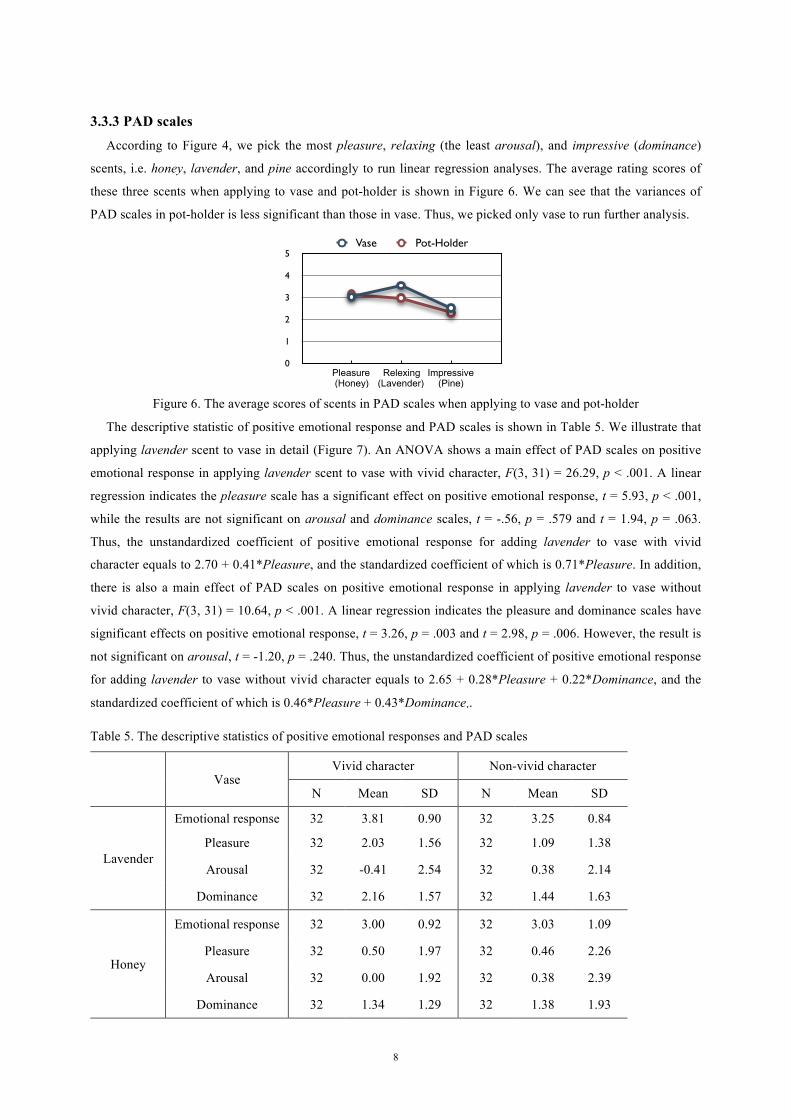
3.3.3 PAD scales According to Figure 4, we pick the most pleasure, relaxing (the least arousal), and impressive (dominance)
scents, i.e. honey, lavender, and pine accordingly to run linear regression analyses. The average rating scores of
these three scents when applying to vase and pot-holder is shown in Figure 6. We can see that the variances of
PAD scales in pot-holder is less significant than those in vase. Thus, we picked only vase to run further analysis.
0
1
2
3
4
5
Pleasure (Honey)
Relexing(Lavender)
Impressive (Pine)
Vase Pot-Holder
Figure 6. The average scores of scents in PAD scales when applying to vase and pot-holder
The descriptive statistic of positive emotional response and PAD scales is shown in Table 5. We illustrate that
applying lavender scent to vase in detail (Figure 7). An ANOVA shows a main effect of PAD scales on positive
emotional response in applying lavender scent to vase with vivid character, F(3, 31) = 26.29, p < .001. A linear
regression indicates the pleasure scale has a significant effect on positive emotional response, t = 5.93, p < .001,
while the results are not significant on arousal and dominance scales, t = -.56, p = .579 and t = 1.94, p = .063.
Thus, the unstandardized coefficient of positive emotional response for adding lavender to vase with vivid
character equals to 2.70 + 0.41*Pleasure, and the standardized coefficient of which is 0.71*Pleasure. In addition,
there is also a main effect of PAD scales on positive emotional response in applying lavender to vase without
vivid character, F(3, 31) = 10.64, p < .001. A linear regression indicates the pleasure and dominance scales have
significant effects on positive emotional response, t = 3.26, p = .003 and t = 2.98, p = .006. However, the result is
not significant on arousal, t = -1.20, p = .240. Thus, the unstandardized coefficient of positive emotional response
for adding lavender to vase without vivid character equals to 2.65 + 0.28*Pleasure + 0.22*Dominance, and the
standardized coefficient of which is 0.46*Pleasure + 0.43*Dominance�.
Table 5. The descriptive statistics of positive emotional responses and PAD scales
Vase Vivid character Non-vivid character
N Mean SD N Mean SD
Lavender
Emotional response 32 3.81 0.90 32 3.25 0.84
Pleasure 32 2.03 1.56 32 1.09 1.38
Arousal 32 -0.41 2.54 32 0.38 2.14
Dominance 32 2.16 1.57 32 1.44 1.63
Honey
Emotional response 32 3.00 0.92 32 3.03 1.09
Pleasure 32 0.50 1.97 32 0.46 2.26
Arousal 32 0.00 1.92 32 0.38 2.39
Dominance 32 1.34 1.29 32 1.38 1.93

9
Pine
Emotional response 32 2.78 1.07 32 2.22 1.13
Pleasure 32 -0.66 2.18 32 -0.75 2.06
Arousal 32 1.63 2.14 32 1.59 1.79
Dominance 32 2.09 1.65 32 1.53 1.85
Character
Visual
Scent
Olfactory
Emotion State
ArousalPositive Emotion
0.71
0.46
0.43
MEAN=3.81
MEAN=3.06
Pleasure
Dominance
Herbal(Lavender)
Vivid
Non-Vivid
Vase
Figure 7. The emotion state affected by adding herbal scent (lavender) to vase
4. Discussion
4.1 Vision and Emotion The results conclude that there is a positive correlation between product character and emotion. Before adding
scents to products, people prefer those products with vivid characters than those products without vivid characters
across all different product categories. This can be explained by Mullen and Johnson’s theory about consumer
behavior [21] that when people perceive a product with vivid character, they will have a strong emotional respond.
4.2 Olfaction and Emotion This research uses PAD scales to evaluate the correlations between the six scents and the emotional responses.
The results indicate that there are complicated correlations between scents and PAD scales, while the positive
emotional responses are affected by the values of PAD scales. Comparing with traditional KANSEI Engineering
researches that rely mainly on pleasure scale to evaluate the positive emotion, we would recommend the
combination of pleasure, arousal, and dominance scales. The PAD scales are especially suitable for multi-sensory
KANSEI engineering study that olfaction is involved. Besides, we find there are strong correlations between
scents and emotions, which is also consistent with Mullen and Johnson’s theory [30] that odor has a strong effect
on cognition and memory so that it has a strong influence on emotion. In addition, according to Lindstorm’s
theory [15] that a series of stimulate, enhances, and bonds will increase the brand loyalty, the use of scents in
product design can not only increase the users’ positive emotion but also build their sensory brand.
4.3 Multi-sensory and Emotion The interaction between vision and olfaction can be discussed according to the vividness of product character.

10
4.3.1 Product with Vivid Character Owing to the strong correlations between vision and emotion, those products with vivid characters already have
high positive emotional responses before adding scents to them. Thus, adding scents to a product with vivid
character is not necessary increase user’s positive emotional responses. This might be a reason why previous study
[22] found olfactory can not contribute to product liking. According to the suitableness of a scent with a particular
product, we also find that adding scents to a product would either enhance or diminish the positive emotional
responses. The result of current study suggests that the suitableness is the key factor for liking. For example, the
sunflower pot-holder (pictures are shown in Table 1) has a vivid character of sunflower, thus the most suitable
scent for it is floral family which creates the highest positive emotional response (Table 4).
Among PAD scales (Figure 7-9), the results suggest pleasure and arousal is mainly determined by both vision
and olfaction, while dominance is primarily affected by olfaction only. Besides, there is no complex interaction
between vision and olfaction in terms of product ratings and emotional responses. Previous study proposes when
interacting with a product, there is usually one sensory modality dominating the situation that it could gather more
information, have more influence, and attract more attention [23]. In this study, people tend to look at and
recognize the product character first to have a preliminary idea about the product. Then add olfaction,
accompanied with vision, to form a final emotional response. This reaction model is shown in Figure 10.
Character
Visual
Scent
Olfactory
Emotion State
Positive Emotion
Visual+Olfactory
Pleasure
Vivid
Non-Vivid
Product Scent
Dominance
Arousal
Olfactory
Visual+Olfactory
Figure 10. The interaction of vision and olfaction for products with vivid character
4.3.2 Product without Vivid Character Products without vivid character are less arousing, in vision, than those with vivid character. When people
sense and recognize the product preliminarily by vision, they will not have a strong emotional response. However,
if we add a suitable scent to these kinds of products, the improvements in positive emotional responses are usually
significant. This means when people perceive a product without vivid character, they tend to judge it intuitively by
its scent that might give them a strong impression. That is to say, people tend to judge the scents by their own
preferences since the product does not have a vivid character that make people to consider the suitableness of it. In
this study, the Menu Rubber Vase does not have a vivid character. When we add a suitable odor to it, e.g. jasmine
or lavender, people will rate the product mainly by olfaction rather than vision and give it a high rating. The
interaction processes are shown in Figure 11. This result is similar to Herz’s argument [5] that olfaction is very
powerful in evoking memory cues that contain more sensibilities and emotions than other senses.

11
Character
Visual
Scent
Olfactory
Positive Emotion
Pleasure
Vivid
Non-Vivid
Product
Dominance
Arousal
Emotion State
Scent
Figure 11. The interaction of vision and olfaction for products without vivid character
The importance of scent has been revealed in the domain of emotion, marketing, brand memory, consumer
behavior and so on in previous studies. However, only few study focuses on the effect of applying scent to
products in Industrial Design or KANSEI Engineering. The importance of olfaction is usually neglected in the
study of sensibility since it does not have a solid measurement scale and the feeling is usually unsubstantial and
hard to describe. However, this study use real products to study the correlation between product character and
scents and we propose two different models for imparting scents to products with or without vivid characters.
Hopefully, this model can provide some guidelines for product designers in considering adding scents to their
designs in the future.
5. References [1] Meyers-Levy, J. and A.M. Tybout. (1989) Schema Congruity as a Basis for Product Evaluation. The Journal
of Consumer Research, 16(1): p. 39-54.
[2] Lewis, M., J.M. Haviland-Jones, and L.F. Barrett. (2008) Handbook of emotions. 3rd ed. New York: Guilford Press. 848.
[3] Nagamachi, M. (2002) Kansei engineering as a powerful consumer-oriented technology for product development. Applied Ergonomics, 33(3): p. 289-294.
[4] Aftel, M., Essence and alchemy: a book of perfume, 1st ed.2001, New York: North Points Press.
[5] Herz, R.S. (1998) Are odors the best cues to memory? A cross-modal comparison of associative memory stimuli., in Olfaction and taste XII: An international symposium (Annals of the New York Academy of Sciences) New York Academy of Sciences.: New York. p. 670-674.
[6] Herz, R.S. and G.C. Cupchik. (1995) The emotional distinctiveness of odor-evoked memories. Chemical Senses, 20: p. 517-528.
[7] Herz, R.S., et al. (2003) Neuroimaging evidence for the emotional potency of odor-evoked memory Neuropsychologia, 42: p. 371-378.
[8] Hirsch, A. (1989) Expert testimony, New York.
[9] Warm, J.S., W.N. Dember, and R. Parasuraman. (1990) Effects of olfactory stimulation on performance and stress in a visual sustained attention task. Journal of the Society of Cosmetic Chemists, 42: p. 199-210.
12
[10] Cox, D.F. (1967) The Sorting Rule Model of the Consumer Product Evaluation Process--In Risk Taking and Information Handling in Consumer Behavior., in Graduate School of Business Administration, Harvard University: Boston. p. 324-369.
[11] Hirsch, A. (1990) Preliminary Results of Olfaction Nike Study. Smell and Taste Treatment and Research Foundation: Chicago.
[12] Laird, D.A. (1932) How the Consumers Estimate Quality by Subconscious Sensory Impressions: With Special Reference to the Role of Smell. Journal of Applied Psychology, p. 241-246.
[13] Wilkie, M. (1995) Scent of a Market. American Demographics, 17(8): p. 40-47.
[14] Chebat, J.-C. and R. Michon. (2003) Impact of ambient odors on mall shoppers' emotions, cognition and spending--A test of competitive causal theories. Journal of Business Research, 56: p. 529-539.
[15] Lindstrom, M. (2005) Brand sense: how to build powerful brands through touch, taste, smell, sight and sound. New York: Simon & Schuster.
[16] Helmsley, S. (1997) Scents and Sensibility. Marketing Week, p. 45-50.
[17] Izard, C.E. (1993) Four systems for emotion activation: Cognitive and noncognitive processes. Psychological Review, 100(1): p. 68-90.
[18] Schifferstein, H.N.J. and I. Tanudjaja. (2004) Visualising fragrances through colours: The mediating role of emotions. Perception, 33(10): p. 1249-1266.
[19] Tubaldi, F., et al. (2008) Effects of Olfactory Stimuli on Arm-Reaching Duration. Chemical Senses, 33(5): p. 433-440.
[20] Milotic, D. (2001) The impact of fragrance on consumer choice. Journal of Consumer Behaviour, 3(2): p. 179-191.
[21] Mullen, B. and C. Johnson. (1990) The Psychology of Consumer Behavior. New Jersey: Lawrence Erlbaum Associates, Inc. 320.
[22] Ludden, G.D.S. and H.N.J. Schifferstein. (2009) Should Mary Smell Like Biscuit? Investigating Scents in Product Design. International Journal of design, 3(3): p. 1-12.
[23] Schifferstein, H.N.J. and M.P.H.D. Cleiren. (2005) Capturing product experiences: a split-modality approach. Acta Psychologica, 118: p. 293-318.