the structure of the catalytic domain of a plant … · x-ray scattering studies demonstrate that...
TRANSCRIPT
The Structure of the Catalytic Domain of a Plant CelluloseSynthase and Its Assembly into DimersC W OPEN
Anna T. Olek,a,1 Catherine Rayon,a,1,2 Lee Makowski,b,c Hyung Rae Kim,d Peter Ciesielski,e John Badger,f
Lake N. Paul,g Subhangi Ghosh,d Daisuke Kihara,d,h Michael Crowley,e Michael E. Himmel,e Jeffrey T. Bolin,d
and Nicholas C. Carpitaa,d,g,3
a Department of Botany and Plant Pathology, Purdue University, West Lafayette, Indiana 47907-2054bDepartment of Bioengineering, Northeastern University, Boston, Massachusetts 02115cDepartment of Chemistry and Chemical Biology, Northeastern University, Boston, Massachusetts 02115dDepartment of Biological Sciences, Purdue University, West Lafayette, Indiana 47907-1971eNational Renewable Energy Laboratory, Biomolecular Science Group, Golden, Colorado 80401-3305f DeltaG Technologies, San Diego, California 92122gBindley Bioscience Center, Purdue University, West Lafayette, Indiana 47907-2057hDepartment of Computer Science, Purdue University, West Lafayette, Indiana 47907-2107
ORCID ID: 0000-0003-0770-314X (N.C.C.)
Cellulose microfibrils are para-crystalline arrays of several dozen linear (1→4)-b-D-glucan chains synthesized at the surface of thecell membrane by large, multimeric complexes of synthase proteins. Recombinant catalytic domains of rice (Oryza sativa) CesA8cellulose synthase form dimers reversibly as the fundamental scaffold units of architecture in the synthase complex. Specificity ofbinding to UDP and UDP-Glc indicates a properly folded protein, and binding kinetics indicate that each monomer independentlysynthesizes single glucan chains of cellulose, i.e., two chains per dimer pair. In contrast to structure modeling predictions, solutionx-ray scattering studies demonstrate that the monomer is a two-domain, elongated structure, with the smaller domain couplingtwo monomers into a dimer. The catalytic core of the monomer is accommodated only near its center, with the plant-specificsequences occupying the small domain and an extension distal to the catalytic domain. This configuration is in stark contrast to thedomain organization obtained in predicted structures of plant CesA. The arrangement of the catalytic domain within the CesAmonomer and dimer provides a foundation for constructing structural models of the synthase complex and defining therelationship between the rosette structure and the cellulose microfibrils they synthesize.
INTRODUCTION
An estimated 23 1011 tons of cellulose are synthesized annually(Lieth, 1975), making it the primary substrate for biofuels andbio-based products. In plants, synthesis of cellulose microfibrilsis performed by a large complex of many synthase (CesA) pro-teins arranged in six-membered hexagonal arrays called “parti-cle rosettes” (Giddings et al., 1980; Mueller and Brown, 1980),with their catalytic domains clustered in 50-nm diameter struc-tures within the cell (Bowling and Brown, 2008). Informationabout the structure of plant CesAs and the synthase complexesthey form is needed to understand the relationship between thestructure of the rosettes, (1→4)-b-D-glucan synthesized by each
CesA, and the structure of the para-crystalline cellulose micro-fibrils extruded by these large complexes.A bacterial gene encoding cellulose synthase was discovered in
Gluconacetobacter xylinus (syn Acetobacter xylinum) (Wong et al.,1990; Saxena et al., 1990), and plant CesAs share homology withfour catalytic sequences of bacterial CesA proteins containing D,DxD, and Q/RxxRW residues essential for substrate binding andcatalysis (Saxena et al., 1995; Pear et al., 1996; Delmer, 1999).The structure of Rhodobacter sphaeroides cellulose synthase(BcsA) provided a basis for modeling of CesA structures fromvascular plants (Morgan et al., 2013). Sethaphong et al. (2013)proposed a complete structure of the catalytic domain of a plantCesA synthase based on ab initio modeling of the BcsA andsimilar synthase structures.In contrast to bacterial synthases, plant synthase complexes
comprise an estimated two to three dozen CesA polypeptides of;110 kD each. Plant CesAs have two regions adjacent to theircatalytic domains not present in bacterial CesAs: the plant-conserved sequence (P-CR) between the first D and the DxDmotif and a domain toward the C terminus of the catalytic do-main originally termed the “hypervariable region” because so fewconsensus sequences were found (Pear et al., 1996). Subsequentwork showed that this region constituted a class-specific region(CSR) for which high similarity across many species was ob-served among subclasses of orthologous isoforms (Vergara and
1 These authors contributed equally to this work.2 Current address: EA 3900-BIOPI, Université de Picardie Jules Verne,80039 Amiens, France.3 Address correspondence to [email protected] author responsible for distribution of materials integral to the findingspresented in this article in accordance with the policy described in theInstructions for Authors (www.plantcell.org) is: Nicholas C. Carpita([email protected]).C Some figures in this article are displayed in color online but in black andwhite in the print edition.W Online version contains Web-only data.OPENArticles can be viewed online without a subscription.www.plantcell.org/cgi/doi/10.1105/tpc.114.126862
The Plant Cell, Vol. 26: 2996–3009, July 2014, www.plantcell.org ã 2014 American Society of Plant Biologists. All rights reserved.

Carpita, 2001). The cytoplasmic region also includes anN-terminal RING-finger or zinc-finger (ZnF) domain implicated ininteractions among CesAs. We found that threading of a rice (Oryzasativa) CesA catalytic domain sequences homologous to theBcsA synthase gave structures in close agreement with those ofSethaphong et al. (2013). However, wide disagreement was foundbetween the ab initio model and our threading with similar gly-cosyl transferases when the plant-specific P-CR and CSR wereincluded. For this reason, a soluble 57-kD catalytic domain of riceCesA8 (Supplemental Figure 1) was expressed recombinantly toobtain structural information about conformation of plant CesAs,to gain an understanding of the biochemical mechanism of syn-thesis, and to determine the possible roles of the P-CR andCSR domains in assembly of the multimeric synthase complex.Size-exclusion chromatography and analytical ultracentrifugation(AUC) showed that the catalytic domains of CesA polypeptidesform dimers as the fundamental units of construction of thesynthase complex. Specificity of binding and saturation stoi-chiometries with UDP and UDP-Glc indicated a properly foldedprotein, and each monomer in the dimer was capable of syn-thesizing a (1→4)-b-D-glucan chain independently.
Small-angle x-ray scattering (SAXS) has become a valuable toolfor generating solution structures of proteins otherwise inherentlydifficult to crystallize or larger than current NMR capabilities(Svergun and Koch, 2003; Hura et al., 2009; Grant et al., 2011;Daily et al., 2012). An advantage of solution scattering is its abilityto characterize protein structures and interactions that exist inmultiple states (Konarev et al., 2003; Williamson et al., 2008; Grantet al., 2011). This makes possible separation of contributions dueto monomers and dimers and estimates of the relative abundancesof distinct species within solutions (Minh and Makowski, 2013).Examples relevant to plants include the extracellular cellulosomescaffolding structures plant cell wall digesting bacteria (Linder andTeeri, 1997; Currie et al., 2013), homo- and heterodimerizationrelated to metal binding detoxifying proteins (Bilecen et al., 2005),pectinases-inhibitor binding interactions (Benedetti et al., 2011),and a plant hormone abscisic acid receptor (Nishimura et al.,2009). SAXS has also been used to study time-resolved structuraldynamics to illustrate differences between active versus inactivestates of proteins and solution properties that differ from their re-spective crystal structures (Lamb et al., 2009; Kezuka et al., 2010).
Solution scattering of the rice CesA catalytic domain providedan image of the monomer as an elongated two-domain structurewith a large central domain and a cap region distal to the small,extended domain that coupled into dimers through the smallerdomains. Docking studies indicated that the catalytic core,modeled on the basis of the BcsA structure without the P-CR andCSR, must reside near the center of a monomer. In contrast to abinitio structural predictions by Sethaphong et al. (2013), we findthat the positions of the P-CR and CSR flank the catalytic domainon opposite sides to one other and implicate the CSR in formationof the CesA dimers. We propose a model for how the P-CR andZn-finger domains couple the CesA dimer scaffold units into theparticles of the rosette complex. Knowledge of this basic unit ofconstruction of the rosette complex provides insights to geneti-cally manipulate the structure and organization of plant cell wallsin a way that will produce improved feedstocks for production ofbiofuels and bioproducts.
RESULTS
Structural Similarity to a Bacterial Cellulose Synthase
Structure predictions of a rice CesA8 (LOC_Os07g10770) catalyticdomain (CatD) monomer and dimer were made using a platform ofalgorithms at LOMETS (Wu and Zhang, 2007), including MUSTER(Wu and Zhang, 2008), FUGUE (Shi et al., 2001), HH-Pred (Södinget al., 2005), SparksX (Yang et al., 2011), Phyre2 (Kelley andSternberg, 2009), MUSCLE (Edgar, 2004), and I-TASSER (Royet al., 2010). Threading with FUGUE provided similar structuralinformation as those obtained with LOMETS or MUSTER. All al-gorithms gave a consensus template BcsA (Protein Data Bank[PDB] ID: 4HG6:A), and the structure versus structure alignmentwas confirmed by TM-Align (Zhang and Skolnick, 2005) and DALIconsensus (Holm and Rosenström, 2010). We used the R.sphaeroides BcsA protein as the threading target, but the riceprotein sequence was truncated to exclude the P-CR andCSR before threading through the cognate bacterial BcsA CatD(Supplemental Figure 2A). Comparison of sequences revealedstrong conservation of the four catalytic motifs essential for bindingto a UDP moiety, the diphosphate of UDP-Glc, and the non-reducing terminal cellobiosyl unit of the b-D-glucan chain that ex-tended into the protein, all of which mapped directly to the catalyticamino acids and other essential motifs integral to the BcsA activesite (Supplemental Figures 2B and 2C and Supplemental Movie 1).The structure presented a general nucleotide binding fold (Rossmannet al., 1974) found in many of the templates (SupplementalTable 1). Local global alignment (Zemla, 2003) displayed 155amino acid residues well coaligned in similarity, mostly in the upperdomain including the first D, DxD, and QxxRWmotifs, giving a rootmean square deviation (RMSD) value of 3.12 Å.To determine the degree of similarity of the BcsA catalytic core
to other structurally related glycosyl transferases (SupplementalTable 1), R. sphaeroides BcsACatD, two catalytic domains ofEscherichia coli chondroitin polymerase, SpsA synthase fromBacillus subtilis, and an SpsA homolog from Bacteroides fragilisthat crystallizes as a dimer were aligned in pairs using tools on theUniProt website (UniProt Consortium, 2013). All pairs showedgood consensus when threaded with FUGUE (Shi et al., 2001;Supplemental Figure 3). The resulting catalytic core sequenceswere then extracted from the PDB coordinates of each glycosyltransferase. All of the TM scores (Zhang and Skolnick, 2005) ex-ceeded 0.5, and the RMSD values between matched Ca atoms inthe paired proteins varied only between 1.8 and 3.5 Å, indicatingthat the catalytic cores of all of these proteins adopted the samevariation of the classical nucleotide binding fold (Figure 1).
Structural Modeling Is Problematic after Inclusion of P-CRand CSR Domains
The rice CatD threaded structure was severely distorted using theBcsA CatD template when the P-CR and CSR sequences wereincluded, regardless of the algorithms used. Of all structure tem-plates surveyed (Supplemental Table 1), the best threaded posi-tional or conformational fit when the P-CR and CSR sequenceswere included was obtained with E. coli chondroitin polymerase(ChondP), a type 2 UDP-GalNAc transferase (Osawa et al., 2009).
Cellulose Synthase 3D Contour Structure 2997

In contrast to the truncated sequence threaded to BcsA, the riceCatD had only 18.4% sequence identity to ChondP when theP-CR and CSR domains were included (Supplemental Figure 4A).The rice CatD and ChondP shared structural and catalytic featuresabsent in the BcsA sequence (Supplemental Figures 4A and 4B),
and the native ChondP dimerizes (Supplemental Figure 4C). However,inclusion of the CSR corrupted the catalytic core structure, indicatingthat this particular model was unlikely to represent the rice CatD.The best fit (30.8% sequence identity to rice CatD) was
obtained when a chimeric model with the BcsA catalytic
Figure 1. Structural Comparisons of the Common Catalytic Core Motifs of Rhodobacter sphaeroides BcsA, E. coli ChondP Nucleotide BindingDomains 1 and 2 (D1 and D2), B. subtilis SpsA Synthase, and B. fragilis SpsA Synthase Homolog.
The catalytic cores of the glycosyl transferases were aligned in pairs with Uniprot (UniProt Consortium, 2013). The secondary structure matching basedon RMSD value calculation and on best equivalent residues of two proteins calculation (TM score) was determined by TM-align (Zhang and Skolnick,2005), and superimposition was visualized with PyMol (DeLano, 2002). R. sphaeroides cellulose synthase catalytic domain (BcsA CatD), E. colichondroitin polymerase (ChondP D1 and D2), B. subtilis SpsA synthase (SpsA), and B. fragilis SpsA like-synthase (Fragilis) are depicted in red, pink,yellow, blue, and green, respectively.
2998 The Plant Cell
domain integrated with sequences of a maize (Zea mays)oxidoreductase corresponding to the rice P-CR and CSR(Supplemental Table 1 and Supplemental Figures 4D and 4E).However, while these models showed good alignment of thecatalytic core of the structure predicted by ab initio modeling(Sethaphong et al., 2013) and our threading results (SupplementalFigure 2C), they varied widely in modeling the P-CR and CSRdomains, giving a large RMSD value of 24.4 Å. Clearly, the posi-tions of the P-CR and CSR could not be unequivocally defined bycomputational modeling alone. For this reason, we began studiesto determine the structure of the plant CesA catalytic domainempirically.
Reversible Dimerization of the Catalytic Domains ofRice CesA8
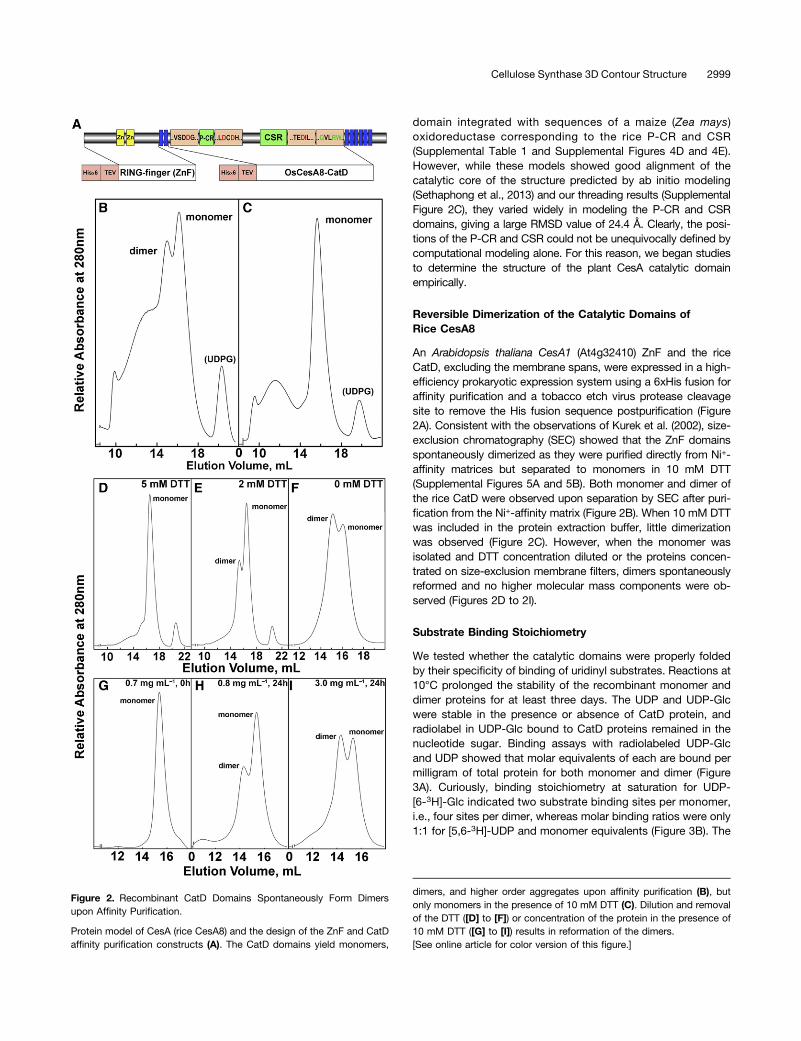
An Arabidopsis thaliana CesA1 (At4g32410) ZnF and the riceCatD, excluding the membrane spans, were expressed in a high-efficiency prokaryotic expression system using a 6xHis fusion foraffinity purification and a tobacco etch virus protease cleavagesite to remove the His fusion sequence postpurification (Figure2A). Consistent with the observations of Kurek et al. (2002), size-exclusion chromatography (SEC) showed that the ZnF domainsspontaneously dimerized as they were purified directly from Ni+-affinity matrices but separated to monomers in 10 mM DTT(Supplemental Figures 5A and 5B). Both monomer and dimer ofthe rice CatD were observed upon separation by SEC after puri-fication from the Ni+-affinity matrix (Figure 2B). When 10 mM DTTwas included in the protein extraction buffer, little dimerizationwas observed (Figure 2C). However, when the monomer wasisolated and DTT concentration diluted or the proteins concen-trated on size-exclusion membrane filters, dimers spontaneouslyreformed and no higher molecular mass components were ob-served (Figures 2D to 2I).
Substrate Binding Stoichiometry
We tested whether the catalytic domains were properly foldedby their specificity of binding of uridinyl substrates. Reactions at10°C prolonged the stability of the recombinant monomer anddimer proteins for at least three days. The UDP and UDP-Glcwere stable in the presence or absence of CatD protein, andradiolabel in UDP-Glc bound to CatD proteins remained in thenucleotide sugar. Binding assays with radiolabeled UDP-Glcand UDP showed that molar equivalents of each are bound permilligram of total protein for both monomer and dimer (Figure3A). Curiously, binding stoichiometry at saturation for UDP-[6-3H]-Glc indicated two substrate binding sites per monomer,i.e., four sites per dimer, whereas molar binding ratios were only1:1 for [5,6-3H]-UDP and monomer equivalents (Figure 3B). The
Figure 2. Recombinant CatD Domains Spontaneously Form Dimersupon Affinity Purification.
Protein model of CesA (rice CesA8) and the design of the ZnF and CatDaffinity purification constructs (A). The CatD domains yield monomers,
dimers, and higher order aggregates upon affinity purification (B), butonly monomers in the presence of 10 mM DTT (C). Dilution and removalof the DTT ([D] to [F]) or concentration of the protein in the presence of10 mM DTT ([G] to [I]) results in reformation of the dimers.[See online article for color version of this figure.]
Cellulose Synthase 3D Contour Structure 2999
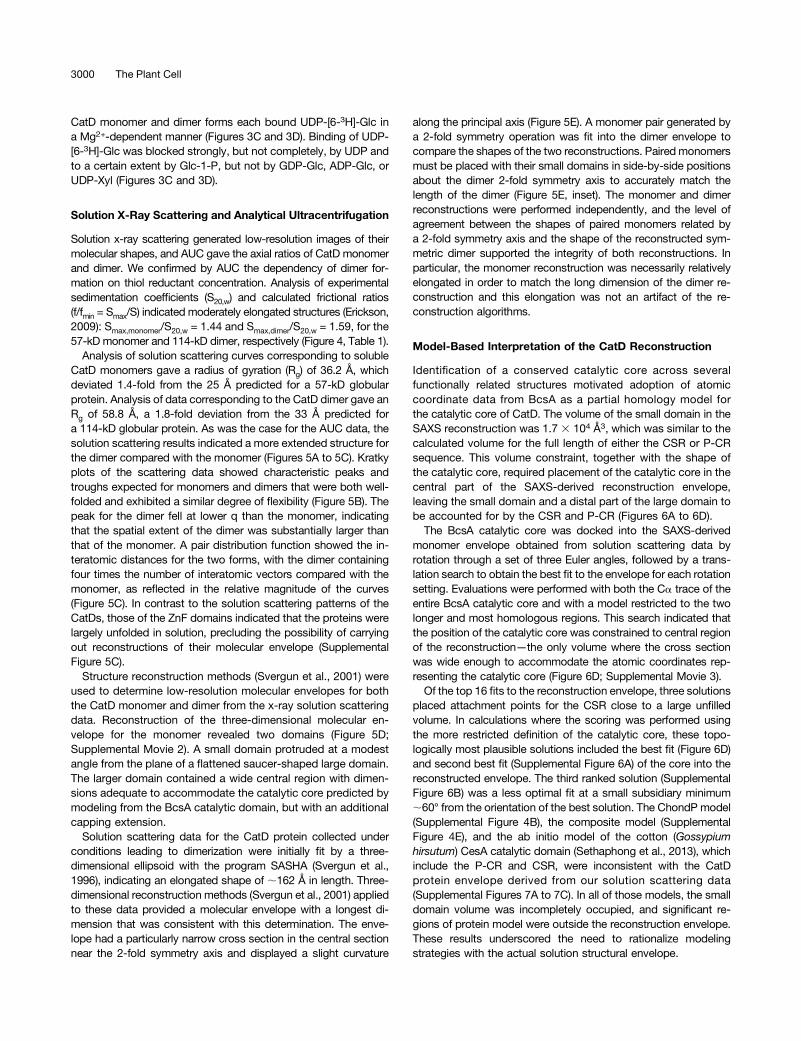
CatD monomer and dimer forms each bound UDP-[6-3H]-Glc ina Mg2+-dependent manner (Figures 3C and 3D). Binding of UDP-[6-3H]-Glc was blocked strongly, but not completely, by UDP andto a certain extent by Glc-1-P, but not by GDP-Glc, ADP-Glc, orUDP-Xyl (Figures 3C and 3D).
Solution X-Ray Scattering and Analytical Ultracentrifugation
Solution x-ray scattering generated low-resolution images of theirmolecular shapes, and AUC gave the axial ratios of CatD monomerand dimer. We confirmed by AUC the dependency of dimer for-mation on thiol reductant concentration. Analysis of experimentalsedimentation coefficients (S20,w) and calculated frictional ratios(f/fmin = Smax/S) indicated moderately elongated structures (Erickson,2009): Smax,monomer/S20,w = 1.44 and Smax,dimer/S20,w = 1.59, for the57-kD monomer and 114-kD dimer, respectively (Figure 4, Table 1).
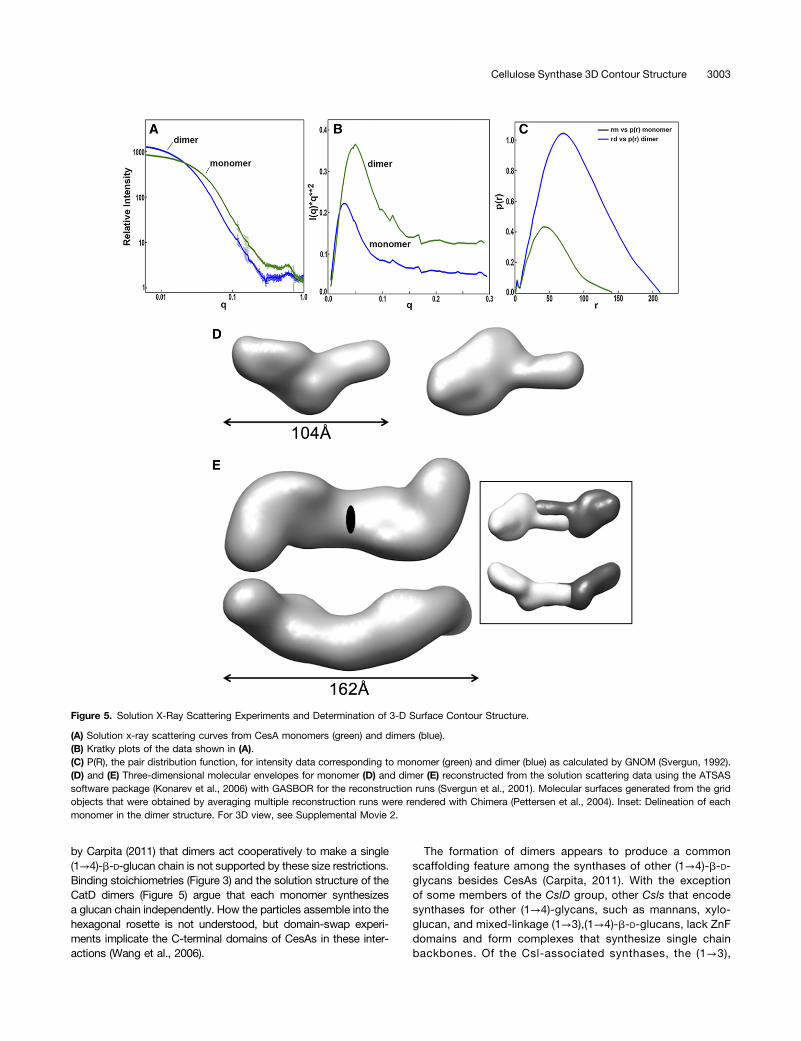
Analysis of solution scattering curves corresponding to solubleCatD monomers gave a radius of gyration (Rg) of 36.2 Å, whichdeviated 1.4-fold from the 25 Å predicted for a 57-kD globularprotein. Analysis of data corresponding to the CatD dimer gave anRg of 58.8 Å, a 1.8-fold deviation from the 33 Å predicted fora 114-kD globular protein. As was the case for the AUC data, thesolution scattering results indicated a more extended structure forthe dimer compared with the monomer (Figures 5A to 5C). Kratkyplots of the scattering data showed characteristic peaks andtroughs expected for monomers and dimers that were both well-folded and exhibited a similar degree of flexibility (Figure 5B). Thepeak for the dimer fell at lower q than the monomer, indicatingthat the spatial extent of the dimer was substantially larger thanthat of the monomer. A pair distribution function showed the in-teratomic distances for the two forms, with the dimer containingfour times the number of interatomic vectors compared with themonomer, as reflected in the relative magnitude of the curves(Figure 5C). In contrast to the solution scattering patterns of theCatDs, those of the ZnF domains indicated that the proteins werelargely unfolded in solution, precluding the possibility of carryingout reconstructions of their molecular envelope (SupplementalFigure 5C).
Structure reconstruction methods (Svergun et al., 2001) wereused to determine low-resolution molecular envelopes for boththe CatD monomer and dimer from the x-ray solution scatteringdata. Reconstruction of the three-dimensional molecular en-velope for the monomer revealed two domains (Figure 5D;Supplemental Movie 2). A small domain protruded at a modestangle from the plane of a flattened saucer-shaped large domain.The larger domain contained a wide central region with dimen-sions adequate to accommodate the catalytic core predicted bymodeling from the BcsA catalytic domain, but with an additionalcapping extension.
Solution scattering data for the CatD protein collected underconditions leading to dimerization were initially fit by a three-dimensional ellipsoid with the program SASHA (Svergun et al.,1996), indicating an elongated shape of ;162 Å in length. Three-dimensional reconstruction methods (Svergun et al., 2001) appliedto these data provided a molecular envelope with a longest di-mension that was consistent with this determination. The enve-lope had a particularly narrow cross section in the central sectionnear the 2-fold symmetry axis and displayed a slight curvature
along the principal axis (Figure 5E). A monomer pair generated bya 2-fold symmetry operation was fit into the dimer envelope tocompare the shapes of the two reconstructions. Paired monomersmust be placed with their small domains in side-by-side positionsabout the dimer 2-fold symmetry axis to accurately match thelength of the dimer (Figure 5E, inset). The monomer and dimerreconstructions were performed independently, and the level ofagreement between the shapes of paired monomers related bya 2-fold symmetry axis and the shape of the reconstructed sym-metric dimer supported the integrity of both reconstructions. Inparticular, the monomer reconstruction was necessarily relativelyelongated in order to match the long dimension of the dimer re-construction and this elongation was not an artifact of the re-construction algorithms.
Model-Based Interpretation of the CatD Reconstruction
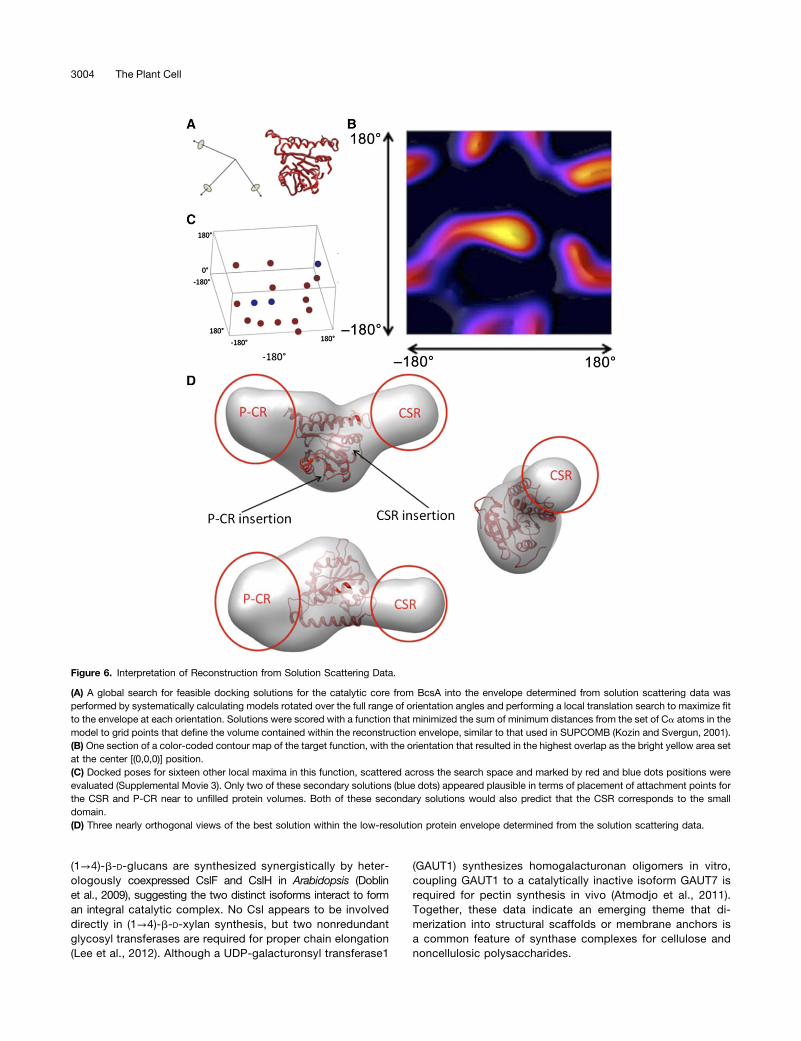
Identification of a conserved catalytic core across severalfunctionally related structures motivated adoption of atomiccoordinate data from BcsA as a partial homology model forthe catalytic core of CatD. The volume of the small domain in theSAXS reconstruction was 1.7 3 104 Å3, which was similar to thecalculated volume for the full length of either the CSR or P-CRsequence. This volume constraint, together with the shape ofthe catalytic core, required placement of the catalytic core in thecentral part of the SAXS-derived reconstruction envelope,leaving the small domain and a distal part of the large domain tobe accounted for by the CSR and P-CR (Figures 6A to 6D).The BcsA catalytic core was docked into the SAXS-derived
monomer envelope obtained from solution scattering data byrotation through a set of three Euler angles, followed by a trans-lation search to obtain the best fit to the envelope for each rotationsetting. Evaluations were performed with both the Ca trace of theentire BcsA catalytic core and with a model restricted to the twolonger and most homologous regions. This search indicated thatthe position of the catalytic core was constrained to central regionof the reconstruction—the only volume where the cross sectionwas wide enough to accommodate the atomic coordinates rep-resenting the catalytic core (Figure 6D; Supplemental Movie 3).Of the top 16 fits to the reconstruction envelope, three solutions
placed attachment points for the CSR close to a large unfilledvolume. In calculations where the scoring was performed usingthe more restricted definition of the catalytic core, these topo-logically most plausible solutions included the best fit (Figure 6D)and second best fit (Supplemental Figure 6A) of the core into thereconstructed envelope. The third ranked solution (SupplementalFigure 6B) was a less optimal fit at a small subsidiary minimum;60° from the orientation of the best solution. The ChondP model(Supplemental Figure 4B), the composite model (SupplementalFigure 4E), and the ab initio model of the cotton (Gossypiumhirsutum) CesA catalytic domain (Sethaphong et al., 2013), whichinclude the P-CR and CSR, were inconsistent with the CatDprotein envelope derived from our solution scattering data(Supplemental Figures 7A to 7C). In all of those models, the smalldomain volume was incompletely occupied, and significant re-gions of protein model were outside the reconstruction envelope.These results underscored the need to rationalize modelingstrategies with the actual solution structural envelope.
3000 The Plant Cell
DISCUSSION
Solving the crystal structure of the BscA cellulose synthase(Morgan et al., 2013) was a seminal advance in understandingthe structure of plant cellulose synthases. The homologous se-quences between the bacterial and plant CesA catalytic domainsare conserved in a variant of the classical nucleotide binding fold(Figure 1; Rossmann et al., 1974). This finding strongly indicatesthat the plant domain of catalysis conforms to this structure.However, when the plant-unique sequences corresponding to theP-CR and CSR are included in modeling algorithms, the signifi-cant differences in structures generated by ab initio modeling(Sethaphong et al., 2013) and our own threading (Supplemental
Figure 4) prompted us to determine empirically how the P-CR andCSR are incorporated in a plant CesA CatD.
The Catalytic Domains of Plant CesAs Dimerize
Our results indicated that fusion of the catalytic domains intodimers constitutes the basic scaffolding unit of construction. Thisfinding is in contrast to all reported studies to date, which proposethat single CesA catalytic units occupy discrete locations withineach particle of the rosette complex. While homodimers of dif-ferent CesA isoforms might be recruited into the synthase com-plex, certain heterodimer combinations of the coexpressedisoforms might be favored over homodimers of the same isoform.
Figure 3. The Monomer and Dimer CatDs Bind Specifically UDP and UDP-Glc.
(A) Example of an incubation of purified monomer and dimer with UDP-[6-3H]-glucose and [5,6-3H]-UDP for up to 3 d at 10°C showing stabilized bindingto both monomer and dimer in a concentration-dependent manner. Binding was near completion after 18 h and stable for the subsequent timemeasured. Radioactivity associated with each was quantified, and nanomoles were determined by ratio of the cpm of UDP-[6-3H]-Glc bound andunbound and the concentration of the UDP-Glc in the reaction mixture.(B) Stoichiometry combined from several binding experiments at concentrations of UDP-Glc up to 120 mM and UDP up to 160 mM. Error bars show SD
of at least three samples.(C) Stoichiometric binding of radiolabeled 2 mM UDP-Glc in the presence or absence of equimolar MgCl2 and competitors at 5 mM.(D) Stoichiometric binding of radiolabeled 20 mM UDP-Glc in the presence or absence of equimolar MgCl2 and UDP at 20 mM or 100 mM withequimolar MgCl2.
Cellulose Synthase 3D Contour Structure 3001

Future work can be done to determine in vitro the relative in-teraction potential of different isoforms of CesA CatDs into dimers.
The best fit of the BcsA CatD into the SAXS-derived envelopeplaces its connection to the membrane-spanning domains lateralto the long axis, with the P-CR and CSR flanking the CatD withinthe cytoplasm. This model also predicts the CSR to fill the smalldomain of the CesA CatD in a position where it will contribute tocoupling of monomers into dimers. The range of flexibility of thisinteraction domain is unknown, so we are unable to predict if thelarge domains fold together and are locked into place by the P-CRdomain, if they exist as flattened structures in vivo, or if mono-mers are free to “saucer” into flattened structures because of theabsence of the trans-membrane domains (Figures 5D and5E). Many of the target proteins that form dimers, includingChondP, give evidence of flexible interaction domains, or “hinges”(Gerstein et al., 1994), that fold the catalytic domains into a tightstructure (Supplemental Table 1). When crystallized as mono-mers, the inherent flexibility often results in the inability to obtainhigh structural resolution in crystallography. Such is the casewith the SpsA synthase, where the interaction domain near theC terminus is unassigned in crystals of monomers (Charnockand Davies, 1999), whereas the B. fragilis homolog crystallizesas a dimer, revealing the structures (Palani et al., 2011).
Proposed Role for Dimers in Particle Rosette Assembly
The formation of dimers of CesA catalytic units demonstrates thatthe organization of plant synthases is different from that of bac-terial systems. Our finding that CesA CatD polypeptides dimerizeto form catalytic units is fully consistent with many studies thatshow that different isoforms interact to form cellulose synthase
complexes (Saxena et al., 2001; Taylor et al., 2004; Taylor, 2008;Guerriero et al., 2010). Close interactions of three distinct CesApolypeptides occur in vivo as imaged by bimolecular fluorescencecomplementation (Desprez et al., 2007). Mutations in any one ofthe three coexpressed isoforms result in impaired cellulose syn-thase activity (Taylor et al., 2004; Taylor, 2008), and lack of oneisoform of CesA prevents incorporation of the other two into theplasma membrane (Gardiner et al., 2003). The principal differ-ences in sequence structures among the different isoforms occurin the CSR (Vergara and Carpita, 2001), the structures we inferfrom SAXS modeling to participate in the dimerization of CesAmonomers (Figures 5D and 5E).Direct evidence for an interaction of different isoforms comes
from copurification of CesAs after solubilization from isolatedmembranes (Taylor et al., 2003; Taylor, 2008; Wang et al., 2008).Consistent with these observations, Triton X-100–soluble micro-somal preparations subjected to native PAGE gave an appar-ent 840-kD complex, whereas null mutants, but not missensemutations, gave smaller 420-kD complexes (Wang et al., 2008).Atanassov et al. (2009) affinity-trapped several isoforms of CesAcorresponding to a hexameric 730-kD complex that, in the pres-ence of DTT, separates into tetrameric, dimeric, and monomericunits, but not odd-numbered oligomers. These data give strongcomplementary evidence that CesA dimers are the fundamentalscaffold unit of construction, with up to three dimers per particle.Kurek et al. (2002) demonstrated that the ZnF domains of CesAcouple in a redox-dependent manner to link CesAs—linkageslikely to couple dimers into the larger complex. On the basisof ab initio structure modeling the catalytic domain structure,Sethaphong et al. (2013) suggested that the monomers form asymmetrical hexamer that involves coupling of the CSR and P-CRregions. However, a symmetrical model does not account for howthe ZnF domains can function to couple the CesAs together. Bycontrast, the SAXS-derived solution structure dimerized throughthe small domains (Figure 5E, inset; Supplemental Movie 1). Thistype of dimerization of the full-length CesAs places the ZnF do-mains on opposite sides of the dimer, providing a means to coupleone or two additional dimers to form one particle of the six-membered particle rosette. Consistent with data of Atanassovet al. (2009) and given the width constraints of a rosette, no morethan a triad of dimers could constitute one particle of the rosette.Given the maximum microfibril size of 36 chains, the suggestion
Figure 4. Determination by Analytical Centrifugation of the Sedimenta-tion Coefficient Distributions of the CesA CatD in the Presence andAbsence of 10 mM DTT.
A c(S) distribution is a representation of a particle’s hydrodynamicproperties, such a diffusion, sedimentation coefficient, buoyant molarmass, and shape (Schuck, 2000). CatD forms a significant amount ofdimer when DTT is not present; however, the distribution shifts to mostlymonomer in the presence of DTT.
Table 1. DTT-Dependent Dimerization as Determined by AnalyticalUltracentrifugation
Species S20,w monomer S20,w dimer Smax Smax/S20,w
CesA8 CatD (+DTT) 3.6 5.6 5.2 1.44 (monomer)CesA8 CatD (–DTT) 3.7 5.2 8.3 1.59 (dimer)
For the calculations of S ratio, the value for S20,w monomer was taken fromthe average of the +DTT and –DTT analytical ultracentrifugation studies.Because of concerns regarding possible reversible equilibria betweenspecies examined in the +DTT experiment, the S20,w dimer value was takenfrom the –DTT experiment. Values for Smax,monomer and Smax,dimer werecalculated using the known molecular masses of 56.8 and 113.6 kD,respectively.
3002 The Plant Cell
by Carpita (2011) that dimers act cooperatively to make a single(1→4)-b-D-glucan chain is not supported by these size restrictions.Binding stoichiometries (Figure 3) and the solution structure of theCatD dimers (Figure 5) argue that each monomer synthesizesa glucan chain independently. How the particles assemble into thehexagonal rosette is not understood, but domain-swap experi-ments implicate the C-terminal domains of CesAs in these inter-actions (Wang et al., 2006).
The formation of dimers appears to produce a commonscaffolding feature among the synthases of other (1→4)-b-D-glycans besides CesAs (Carpita, 2011). With the exceptionof some members of the CslD group, other Csls that encodesynthases for other (1→4)-glycans, such as mannans, xylo-glucan, and mixed-linkage (1→3),(1→4)-b-D-glucans, lack ZnFdomains and form complexes that synthesize single chainbackbones. Of the Csl-associated synthases, the (1→3),
Figure 5. Solution X-Ray Scattering Experiments and Determination of 3-D Surface Contour Structure.
(A) Solution x-ray scattering curves from CesA monomers (green) and dimers (blue).(B) Kratky plots of the data shown in (A).(C) P(R), the pair distribution function, for intensity data corresponding to monomer (green) and dimer (blue) as calculated by GNOM (Svergun, 1992).(D) and (E) Three-dimensional molecular envelopes for monomer (D) and dimer (E) reconstructed from the solution scattering data using the ATSASsoftware package (Konarev et al., 2006) with GASBOR for the reconstruction runs (Svergun et al., 2001). Molecular surfaces generated from the gridobjects that were obtained by averaging multiple reconstruction runs were rendered with Chimera (Pettersen et al., 2004). Inset: Delineation of eachmonomer in the dimer structure. For 3D view, see Supplemental Movie 2.
Cellulose Synthase 3D Contour Structure 3003
(1→4)-b-D-glucans are synthesized synergistically by heter-ologously coexpressed CslF and CslH in Arabidopsis (Doblinet al., 2009), suggesting the two distinct isoforms interact to forman integral catalytic complex. No Csl appears to be involveddirectly in (1→4)-b-D-xylan synthesis, but two nonredundantglycosyl transferases are required for proper chain elongation(Lee et al., 2012). Although a UDP-galacturonsyl transferase1
(GAUT1) synthesizes homogalacturonan oligomers in vitro,coupling GAUT1 to a catalytically inactive isoform GAUT7 isrequired for pectin synthesis in vivo (Atmodjo et al., 2011).Together, these data indicate an emerging theme that di-merization into structural scaffolds or membrane anchors isa common feature of synthase complexes for cellulose andnoncellulosic polysaccharides.
Figure 6. Interpretation of Reconstruction from Solution Scattering Data.
(A) A global search for feasible docking solutions for the catalytic core from BcsA into the envelope determined from solution scattering data wasperformed by systematically calculating models rotated over the full range of orientation angles and performing a local translation search to maximize fitto the envelope at each orientation. Solutions were scored with a function that minimized the sum of minimum distances from the set of Ca atoms in themodel to grid points that define the volume contained within the reconstruction envelope, similar to that used in SUPCOMB (Kozin and Svergun, 2001).(B) One section of a color-coded contour map of the target function, with the orientation that resulted in the highest overlap as the bright yellow area setat the center [(0,0,0)] position.(C) Docked poses for sixteen other local maxima in this function, scattered across the search space and marked by red and blue dots positions wereevaluated (Supplemental Movie 3). Only two of these secondary solutions (blue dots) appeared plausible in terms of placement of attachment points forthe CSR and P-CR near to unfilled protein volumes. Both of these secondary solutions would also predict that the CSR corresponds to the smalldomain.(D) Three nearly orthogonal views of the best solution within the low-resolution protein envelope determined from the solution scattering data.
3004 The Plant Cell

METHODS
3D Structure Prediction and Modeling of the CatD Monomerand Dimer
BcsA (Morgan et al., 2013) and 18 additional templates were selected toquery the full-length rice (Oryza sativa) CatD (containing the P-CR and CSR)based on sequence identity, secondary structure comparison, proteinfamily structure, and good query coverage (Supplemental Table 1). Tertiarystructures were generated with Modeller 9v11 (Sali and Blundell, 1993) andvisualized and labeled with the PyMol software (DeLano, 2002). The ho-mology models of monomer or dimer models threaded with 2Z87 and builtwith Modeller were refined using a modified CABS ab initio modelingprogram (Kolinski, 2004; Koli�nski and Bujnicki, 2005). All the predictedquality models were evaluated by three protein model quality assessmentmethods, TM-align (Zhang and Skolnick, 2005), Protein Quality Predictorserver (Wallner and Elofsson, 2006), ProQ, Model Quality AssessmentServer (McGuffin, 2007), and QMEANscore6 (Benkert et al., 2009). Theprotein quality prediction of CatD was generally improved after refinement.The best model was selected based on the overall structure, the secondarystructure, and position of the important motifs of the catalytic site.
CatD and ZnF Cloning
A pBluescript SKII vector (Stratagene) containing the rice CELLULOSESYNTHASE8 cDNA, OsCesA8 (LOC_Os07g10770, formerly called OsCe-sA13), was used as a template to clone the catalytic site ofOsCesA8 (CatD)using the primer pair 59-TCTACGCTCGAGGTATGACAGAGAAGGTGA-39(forward) and 59-CAAACCGCTCGAGTTACTAAAGACGTCCTCCATAGC-39(reverse). The 1525-bp CatD fragment was ligated into a modifiedpETM11 (EMBL) vector, which contained an N-terminal 6x His-tag anda tobacco etch virus (TEV) protease cleavage site [ENLYF(Q/G)A], thusgenerating a fusion protein HIS-TEV-CatD. The native pETM11 plasmidwasobtained from EMBL (http://www.embl-heidelberg.de). The RING-finger(ZnF) domain consisted of 807-bp fragment spanning fromGlu-2 to Arg-270of AtCesA1 (locus At4g32410) was generated using the primer pair59-TAAACTAGTGAGGCCAGTGC-39 (forward) and 59-TAACTCGAGGCGA-GAAGATGGGATAGG-39 (reverse) and ligated into a modified pETM11vector, generating a fusion protein HIS-TEV-ZnF.
Transformation and Expression of CatD and ZnF Polypeptides
Plasmid constructs were transformed by heat shock into competentEscherichia coli [Rosetta2 (DE3); Novagen]. The 500-mL cultures in Luria-Bertani media were initiated with 5-mL overnight cultures, grown to OD600
of 0.6 to 0.8 (;4 h), and cooled to 16°C, and recombinant protein pro-duction was induced with 0.2 mM isopropyl b-D-1-thiogalactopyranoside(IB02100; IBI Scientific) for 13 h before harvesting.
Isolation and Purification of Protein
Frozen cells suspended in homogenization buffer were burst by sonication.Cell debris was pelleted, and a suspension of Ni+ 6-Fast Flow resin mi-crobeads (GE Healthcare) was added to supernatant liquids. After a 1-hincubation, the suspension was microfuged to collect resins with boundprotein. After washes in low-imidazole buffer, the proteins were eluted in0.5-mL batches a buffer containing 300 mM imidazole. In some experi-ments, the His-tag was excised from CatD by the TEV protease. Proteins in10 mMDTT eluted from the Ni+ column (;0.6 mgmL–1) were digested with30 units of AcTEV protease itself tagged with Hisx6 (Invitrogen) at ambienttemperature for 6 h with gentle rocking. The Hisx6 tag had no influence ondimerization or UDP-Glc binding.
Proteins were separated on a column of Superdex 200, 10/300GL (GEHealthcare). Protein elution was monitored by absorbance at 280 nm, and
0.5-mL fractions were collected. In experiments to reduce DTT, fractions ofprotein from the column in 10mMDTTwere diluted to 5mMDTT and 2mMDTT and concentrated to ;0.5 mg mL–1 and rechromatographed in buffersupplemented with the respective DTT concentrations. For 0 mM DTT,protein was separated by SEC in buffer without DTT. Protein-containingfractions of dimer and monomer were concentrated using Amicon UltraCentrifugal Filters with 30K membranes (Millipore; UFC503024).
UDP-Glc and UDP Binding Assays
UDP-[6-3H]-glucose [20 Ci mmol–1] was from American RadiolabeledChemicals, and [5,6-3H]-UTP [36 Ci mmol–1] was from Perkin-Elmer. Thelabeled UTP was converted to UDP by action of 59-nucleoside kinase(Sigma-Aldrich) with 10 mM ADP and 10 mM MgCl2, and the labelednucleotides were separated by anion-exchange HPLC in a gradient of 8 to1.2M potassium phosphate, pH 7.5. UDP-Glc, UTP, UDP, UDP-Xyl, GDP-glucose, ADP-glucose, and glucose-1-phosphate were from Sigma-Aldrich Chemical Co. Stock solutions of UDP-Glc and other nucleotides andother competitors were made in reaction buffer containing equivalentconcentrations of MgCl2. Stock reaction mixes (200 mL) were initiated byaddition of 50 mL of reaction buffer containing 1.5 to 5.4 mg mL–1 (26.4 to95.1 nmole mL–1) of the 56.8-kD protein. Relative milligrams of proteinwas determined by a bicinchoninic acid assay (Sigma-Aldrich) using BSAas standard. Samples were withdrawn daily and chromatographed bySEC; radioactivity in 0.5-mL fractions representing monomer, dimer, andunbound UDP-Glc or UDPwas determined by liquid scintillation counting.Equilibrium binding was achieved by 2 d reaction, and nanomoles boundwere determined by the ratio of label bound to total label and the reactionconcentration of nucleotide.
Analytical Ultracentrifugation
Sedimentation velocity experiments were conducted using both theBeckman-Coulter XLA and XLI analytical ultracentrifuges. The sampleswere centrifuged at 45,000 rpm using two-sector 1.2-cm path lengthcarbon-filled epon centerpieces. The experiments were run on an An-50 Tirotor at 20°C. The density and relative viscosity were calculated usingSEDNTERP version 1.09, 1.0227 g mL–1, and 0.01081 Poise (http://sednterp.unh.edu/). The partial specific volume (vbar) of the protein wasalso calculated from the protein sequence using SEDNTERP (0.734 mL g–1).The samples were monitored at 655 nm (Rayleigh Interference) with a4-min delay and 150 scans. The c(s) distributions were analyzed usingSEDFIT version 12.43 (Schuck, 2000), with the buffer mismatch model tocompensate for the oxidation of DTT in the cell.
SAXS Data Collection and Processing
SAXS data were collected using the undulator-based beam line X9 at theNational Synchrotron Light Source at Brookhaven National Laboratoryusing two detectors to collect both SAXS andWAXS data simultaneously,to collect scattered intensity in the range of 0.006 < q < 2.0 Å–1 (Allaire andYang, 2011), where q is the momentum transfer [q = 4p sin(Ѳ)/l], 2Ѳ is thescattering angle, and l is the wavelength of the incident x-rays. Data werecollected at an x-ray wavelength of 0.9184 Å. A Photonic Science CCDdetector operated as theWAXS detector and a Mar 165 CCD as the SAXSdetector. The SAXS detector was located 3.4m from the sample. Sampleswere loaded into a 96-well plate and aspirated into the 1.5-mm diameter,thin-walled sample tube using an automated system previously described(Allaire and Yang, 2011). The protein concentration for the sample treatedwith DTT was 4.9mg/mL and 7.1mg/mL for the untreated sample. All datawere collected at 10°C. Preliminary data processing was performed usingthe X9 software package to produce circularly averaged intensity profilescombining data from the two detectors and extending over the entire qrange.
Cellulose Synthase 3D Contour Structure 3005

Analysis of Solution Scattering Patterns
X-ray scattering patterns were checked, manipulated, and plotted foranalysis using programs from the ATSAS suite (Konarev et al., 2006).SASPLOT was used to generate plots of log(I) versus log(q) (Figure 5A)and the I(q).q2 versus q (the Kratky plot) (Figure 5B). The radii of gyration,Rg, corresponding to the data used to reconstruct molecular envelopes,were obtained with GNOM (Svergun, 1992) using standard settings withP(r) constrained to zero at the origin and at rmax.
Separation of Scattering of Dimers from Monomers
WAXS studies were with CatD prepared with and without 10 mM DTT togenerate monomers and dimers, respectively, and each were purifiedsubsequently by SEC. The SEC separations indicated monomer samplespredominated the DTT-treated sample (;85%) and dimers more abun-dant (;88%) in the untreated sample. Respective monomer and dimerfractions from chromatography were pooled and concentrated on spinfilters. WAXS patterns from the two samples were considered to be linearcombinations of WAXS patterns from monomers and dimers with
S ¼ aDþ ð12 aÞMT ¼ bDþ ð12bÞM
where S and T are measured intensity and D and M are intensities from dimersandmonomers, respectively. Assuming that we know a, the proportion of dimerin sample 1, and b, the proportion of dimer in sample 2, these equations can besolved for D and M according to
D ¼ ½Sð12bÞ2Tð12 aÞ�=ða2bÞ andM ¼ ½aT2bS�=ða2bÞ:
However, a and b are unknowns making the problem indeterminant. A strategyfor overcoming this problem is to solve for D and M for all possible combi-nations of a and b and evaluate the physical plausibility of the answers. Inparticular, the zero angle scattering from a dimer will be 4 times the scatteringfrom the monomer and combinations of D and M that do not satisfy thisconstraint can be eliminated from consideration. To determine the values ofa and b consistent with this constraint, two programs, “separate” and “sep-arate-grid,” were written. These programs solved the system of linear equa-tions specified above and evaluated the ratio of D and M as q approached 0.
When this separation was performed for the scattering patterns fromCesA, it was found that a very limited range of solutionswas consistent withthis constraint. The allowed values for a and b were a linear function of oneanother, with the allowed values centered on a = 0.880 and b = 0.145,indicating that dimers made up ;88% of the scattering particles in theuntreated sample, and only ;14.5% of the particles in the treated sample,consistent with the estimation from UV monitoring of SEC. Using deviationfrom the expected ratio of zero angle scattering as a guide, these numberswere accurate to within65% (i.e., a = 0.886 0.05; b = 0.1456 0.05).Withinthe allowed range, use of different values of a and b led to only smallchanges in D and M making possible a good estimate of the scatteringintensity from monomers and from dimers. Visually, the scattering curvescorresponding to D and M are almost indistinguishable from the scatteringcurves measured from untreated and treated samples and, due to thedominating effect of an individual component in each of the two samples,represent only a small quantitative correction to the data.
When this separation was performed for the scattering patterns fromCesA, only a very limited range of solutions were consistent with thisconstraint. The allowed values for a and b were a linear function of oneanother, with the allowed values centered on a = 0.880 and b = 0.145,indicating that dimers made up ;88% of the scattering particles in the“dimer” sample, and only ;14.5% of the particles in the “monomer”sample, consistent with the estimation from UV monitoring of SEC. Usingdeviation from the expected ratio of zero angle scattering as a guide, thesenumbers were accurate to within 65% (i.e., a = 0.88 6 0.05; b = 0.145 6
0.05). Within the allowed range, use of different values of a and b led to only
small changes inD andMmakingpossible a goodestimate of the scatteringintensity from monomers and from dimers. Visually, the scattering curvescorresponding toD andMwere almost indistinguishable from the scatteringcurves measured from untreated and treated samples and, due to thedominating effect of an individual component in each of the two samples,represented only a small quantitative correction to the data.
Reconstruction of Molecular Envelopes
Three-dimensional molecular envelopes for CatD monomers and dimerswere determined using programs from the ATSAS suite (Konarev et al., 2006)for the analysis of solution x-ray scattering data. The reconstruction of theprotein monomer employed data from the DTT-treated sample after cor-rection to remove the minor scattering contribution from the dimer. TheGNOM program (Svergun, 1992) was used to calculate a particle distancedistribution function, P(r) from x-ray scattering data in the range 0.007 < q <1.0 Å21 with rmax = 120 Å. The GASBOR program (Svergun et al., 2001) wasused to generate three-dimensional models of connected beads to fit thisdata, with the number of beads set approximately equal to the number ofamino acids in the CatD construct. To assess the level of uniqueness andaccuracy of these solutions 40 bead models were generated and the finalcorrected x2 values for all of these solutions were in the range 0.96 to 1.10.Additional calculations were performed to show that reducing the value ofrmax in the calculation of P(r) to 100 Å, as would be the case for a morecompact protein, results in significantly poorer x2 scores for the beadmodelsgenerated by GASBOR.
Reconstruction averages were obtained by taking four subsets of 10-bead models and aligning them with DAMSEL and SUPCOMB (Kozin andSvergun, 2001), using the most representative model within each subsetas reference. These averaged reconstructions were transformed into gridobjects with volumes equal to the partial specific volume calculated fromthe CatD amino acid sequence. The grid objects were generated ona cubic 4-Å grid by counting the number of beads within 8Å of each gridpoint and choosing thresholds to give the required partial specific volume.Occupied grid points were represented by pseudo-atoms in PDB formatto allow for convenient manipulation and display in molecular graphicssoftware. Comparisons of the molecular envelopes represented by thesefour grid objects showed reproducible features that included a division ofthe protein volume into a large somewhat flattened domain, with somesuggestion of a central depression, and a distinct small domain.
The molecular envelopes represented by these grid objects werealigned and averaged to create an improved low-resolution image of theprotein for subsequent docking and display with the MIFit, PyMol(DeLano, 2002), and Chimera (Pettersen et al., 2004) molecular graphicsprograms. The reproducibility of the position of the protein surfaces wereon the order of ;1 to 2 grid points (4 to 8 Å) and the average differencesbetween these grid objects, as measured by the NSD score output by theSUPCOMB program, is comparable to this grid spacing.
For the three-dimensional reconstruction of the CatD dimer, scatteringdata in the range 0.022 < q < 1.0 Å21 from the sample untreated with DTTwere used. The particle distance distribution function calculated with theprogram GNOM used rmax = 180 Å, and the bead models obtained with theGASBOR program were generated with P2 symmetry using approximatelythe number of amino acids in the CatD sequence. In this case, 20-beadmodelswere generated and the final reduced x2 values for thesemodelswerein the range 1.21 to 1.32. These bead models were aligned subject to theconstraint that the axes defining the 2-fold symmetry of the models shouldoverlap so as to preserving the twofold symmetry in the aggregate model.Thus, the alignment procedure required only a rotation search about thissymmetry axis together with checks to evaluate inverted and enantiomorphicsolutions. Using the same procedure that was used for the monomer re-construction, the set of 20 aligned bead models was then transformed so asto occupy contiguous points on a cubic grid with a volume set to twice thepartial specific volume estimated from the CatD amino acid sequence.
3006 The Plant Cell

Docking of the Model for the Conserved Catalytic Core into theSolution Scattering Reconstruction
Interactive docking of the chain trace for catalytic core regions of BcsA,identified as homologous to CatD, was performed with the moleculargraphics program, MIFit (http://code.google.com/p/mifit/), and fits werealso scored by a local standalone program incorporating a similar scoringfunction to that used by SUPCOMB (Kozin and Svergun, 2001). The chaintrace atoms used for docking included amino acids 129 to 182, 216 to329, and 333 to 408 from the BcsA coordinates set (PDB ID: 4HG6).Although this catalytic core region contains only ;48% of the totalnumber of amino acids in the CatD construct, the range of feasibledocking models is highly constrained by (1) the shape of the partial modeland (2) the requirement that proximate, unoccupied volumes of the re-construction are available for the introduction atoms corresponding to thesequences of the CSR and the P-CR. In particular, the positions where theCSR sequence joins the catalytic core are well defined in this partialhomology model as between amino acids 329 and 333, indicating thata volume representing a distinct CSR domain in the reconstruction shouldbe available at this position in the docked model.
Accession Numbers
Sequence data from this article can be found in the PDB databases underthe following accession numbers: Rhodobacter sphaeroides BcsACatD(PDB ID:4HG6:A), two catalytic domains of E. coli chondroitin polymerase,ChondP D1 and ChondP D2 (PDB ID:2Z87), Bacillus subtilis SpsA syn-thase (PDB ID:1QGS), and Bacteroides fragilis SpsA homolog (Fragilis;PDB ID:3BCV). A complete list of the target sequences and PDB ac-cession numbers is provided in Supplemental Table 1.
Supplemental Data
The following materials are available in the online version of this article.
Supplemental Figure 1. The Amino Acid Sequence of the Rice (Oryzasativa) CesA8 Catalytic Domain.
Supplemental Figure 2.Modeling Comparisons of the Rice CesA8 CatDand the Rhodobacter sphaeroides BcsA Catalytic Domain (BcsA CatD).
Supplemental Figure 3. Sequence Alignments of Five CatalyticDomains from Structurally Related Glycosyl Transferases.
Supplemental Figure 4. Structure-Based Sequence Alignment andThreaded Structure of the Rice CesA8 CatD and the E. coli ChondroitinPolymerase (ChondP) and a Composite Sequence-Structure Alignmentand Model of the Rice CesA8 CatD with Rhodobacter sphaeroides BcsACatalytic Domain (BcsA CatD) and the P-CR and CSR Domains with Zeamays Oxidoreductase (1B5Q).
Supplemental Figure 5. Recombinant ZnF Domains SpontaneouslyForm Dimers in a Redox-Dependent Manner but Do Not Fold Properly.
Supplemental Figure 6. Alternative Docking Models of the BcsACatalytic Core into the Solution Scattering Envelope.
Supplemental Figure 7. Lack of Fit of CesA Theoretical Models intothe Solution Scattering Envelope.
Supplemental Table 1. Templates Used for Threading.
Supplemental Movie 1. Predicted Structure of the Rice CesA8 CatDThreaded with the Rhodobacter sphaeroides BcsA Catalytic Domain(BcsA CatD).
Supplemental Movie 2. Determination 3D Surface Contour Structurefrom Small-Angle X-Ray Scattering Experiments.
Supplemental Movie 3. Docking Reconstruction of the BcsA CatalyticDomain within the Solution Scattering Envelope.
ACKNOWLEDGMENTS
We thank Robert F. Fischetti (APS, Argonne, IL) for helpful discussions onSAXS acquisition. We thank Marc Allaire (National Synchrotron LightSource, Brookhaven National Laboratory) for help collecting the SAXSdata. We thank Debby Delmer for helpful comments on the nucleotide andnucleotide-sugar binding. This work was supported by the Center forDirect Catalytic Conversion of Biomass to Biofuels (C3Bio), an EnergyFrontier Research Center funded by the U.S. Department of Energy, Officeof Science, Office of Basic Energy Sciences, Award DE-SC0000997. Useof the National Synchrotron Light Source, Brookhaven National Labora-tory, was supported by the U.S. Department of Energy, Office of Science,Office of Basic Energy Sciences, under Contract DE-AC02-98CH10886.SAXS method development was supported by National Science Founda-tion Grant 1158340 to L.M. D.K. acknowledges support from the NationalInstitutes of Health (R01GM097528), the National Science Foundation(IIS1319551, DBI1262189, and IOS1127027), and the National ResearchFoundation of Korea (NRF-2011-220-C00004).
AUTHOR CONTRIBUTIONS
N.C.C. designed the experiments and assisted with substrate bindingexperiments. C.R. designed and cloned the ZnF and CatD domains andperformed initial purifications. A.T.O. constructed additional clones andperformed initial purifications, separations of monomer and dimer forms bySEC, and substrate binding assays. L.M. performed and interpreted SAXSand WAXS experiments. J.B. performed the docking analysis on the SAXSreconstructions. P.C. and M.C. performed surface envelope studies ofSAXS results. H.R.K. and D.K. led studies of protein modeling withC.R. L.N.P. performed and analyzed the AUC experiments. M.E.H. assisted ininterpretations. S.G. and J.T.B. performed early SEC experiments thatrevealed the CatD dimers. All authors assisted in writing the article.
Received April 18, 2014; revised June 8, 2014; accepted June 17, 2014;published July 10, 2014.
REFERENCES
Allaire, M., and Yang, L. (2011). Biomolecular solution x-ray scatteringat the National Synchrotron Light Source. J. Synchrotron Radiat. 18:41–44.
Atanassov, I.I., Pittman, J.K., and Turner, S.R. (2009). Elucidating themechanisms of assembly and subunit interaction of the cellulosesynthase complex of Arabidopsis secondary cell walls. J. Biol. Chem.284: 3833–3841.
Atmodjo, M.A., Sakuragi, Y., Zhu, X., Burrell, A.J., Mohanty, S.S.,Atwood, J.A., III., Orlando, R., Scheller, H.V., and Mohnen, D. (2011).Galacturonosyltransferase (GAUT)1 and GAUT7 are the core of a plant cellwall pectin biosynthetic homogalacturonan:galacturonosyltransferasecomplex. Proc. Natl. Acad. Sci. USA 108: 20225–20230.
Benedetti, M., Leggio, C., Federici, L., De Lorenzo, G., Pavel, N.V., andCervone, F. (2011). Structural resolution of the complex betweena fungal polygalacturonase and a plant polygalacturonase-inhibitingprotein by small-angle X-ray scattering. Plant Physiol. 157: 599–607.
Benkert, P., Künzli, M., and Schwede, T. (2009). QMEAN server forprotein model quality estimation. Nucleic Acids Res. 37: W510–W514.
Bilecen, K., Ozturk, U.H., Duru, A.D., Sutlu, T., Petoukhov, M.V.,Svergun, D.I., Koch, M.H., Sezerman, U.O., Cakmak, I., and Sayers,Z. (2005). Triticum durum metallothionein. Isolation of the gene andstructural characterization of the protein using solution scattering andmolecular modeling. J. Biol. Chem. 280: 13701–13711.
Cellulose Synthase 3D Contour Structure 3007
Bowling, A.J., and Brown, R.M., Jr., (2008). The cytoplasmic domainof the cellulose-synthesizing complex in vascular plants. Protoplasma233: 115–127.
Carpita, N.C. (2011). Update on mechanisms of plant cell wallbiosynthesis: how plants make cellulose and other (1->4)-b-D-glycans. Plant Physiol. 155: 171–184.
Charnock, S.J., and Davies, G.J. (1999). Structure of thenucleotide-diphospho-sugar transferase, SpsA from Bacillussubtilis, in native and nucleotide-complexed forms. Biochemistry38: 6380–6385.
Currie, M.A., Cameron, K., Dias, F.M.V., Spencer, H.L., Bayer, E.A.,Fontes, C.M.G.A., Smith, S.P., and Jia, Z. (2013). Small angleX-ray scattering analysis of Clostridium thermocellum cellulosomeN-terminal complexes reveals a highly dynamic structure. J. Biol.Chem. 288: 7978–7985.
Daily, M.D., Makowski, L., and Phillips, G.N., Jr.,., and Cui, Q.(2012). Large-scale motions in the adenylate kinase solution ensemble:coarse-grained simulations and comparison with solution X-ray scattering.Chem. Phys. 396: 84–91.
DeLano, W.L. (2002). The PyMOL Molecular Graphics System. (SanCarlos, CA: DeLano Scientific).
Delmer, D.P. (1999). Cellulose biosynthesis: exciting times fora difficult field of study. Annu. Rev. Plant Physiol. Plant Mol. Biol.50: 245–276.
Desprez, T., Juraniec, M., Crowell, E.F., Jouy, H., Pochylova, Z.,Parcy, F., Höfte, H., Gonneau, M., and Vernhettes, S. (2007).Organization of cellulose synthase complexes involved in primarycell wall synthesis in Arabidopsis thaliana. Proc. Natl. Acad. Sci.USA 104: 15572–15577.
Doblin, M.S., Pettolino, F.A., Wilson, S.M., Campbell, R., Burton,R.A., Fincher, G.B., Newbigin, E., and Bacic, A. (2009). A barleycellulose synthase-like CSLH gene mediates (1,3;1,4)-b-D-glucansynthesis in transgenic Arabidopsis. Proc. Natl. Acad. Sci. USA 106:5996–6001.
Edgar, R.C. (2004). MUSCLE: multiple sequence alignment with highaccuracy and high throughput. Nucleic Acids Res. 32: 1792–1797.
Erickson, H.P. (2009). Size and shape of protein molecules at thenanometer level determined by sedimentation, gel filtration, andelectron microscopy. Biol. Proced. Online 11: 32–51.
Gardiner, J.C., Taylor, N.G., and Turner, S.R. (2003). Control ofcellulose synthase complex localization in developing xylem. PlantCell 15: 1740–1748.
Gerstein, M., Lesk, A.M., and Chothia, C. (1994). Structural mechanismsfor domain movements in proteins. Biochemistry 33: 6739–6749.
Giddings, T.H., Jr., Brower, D.L., and Staehelin, L.A. (1980).Visualization of particle complexes in the plasma membrane ofMicrasterias denticulata associated with the formation of cellulose fibrilsin primary and secondary cell walls. J. Cell Biol. 84: 327–339.
Grant, T.D., Luft, J.R., Wolfley, J.R., Tsuruta, H., Martel, A.,Montelione, G.T., and Snell, E.H. (2011). Small angle X-ray scattering asa complementary tool for high-throughput structural studies. Biopolymers95: 517–530.
Guerriero, G., Fugelstad, J., and Bulone, V. (2010). What do wereally know about cellulose biosynthesis in higher plants? J. Integr.Plant Biol. 52: 161–175.
Holm, L., and Rosenström, P. (2010). Dali server: conservationmapping in 3D. Nucleic Acids Res. 38: W545–W549.
Hura, G.L., et al. (2009). Robust, high-throughput solution structuralanalyses by small angle X-ray scattering (SAXS). Nat. Methods 6:606–612.
Kelley, L.A., and Sternberg, M.J.E. (2009). Protein structure predictionon the Web: a case study using the Phyre server. Nat. Protoc. 4: 363–371.
Kezuka, Y., Kojima, M., Mizuno, R., Suzuki, K., Watanabe, T., andNonaka, T. (2010). Structure of full-length class I chitinase from ricerevealed by X-ray crystallography and small-angle X-ray scattering.Proteins 78: 2295–2305.
Kolinski, A. (2004). Protein modeling and structure prediction witha reduced representation. Acta Biochim. Pol. 51: 349–371.
Koli�nski, A., and Bujnicki, J.M. (2005). Generalized protein structureprediction based on combination of fold-recognition with de novofolding and evaluation of models. Proteins 61 (suppl. 7): 84–90.
Konarev, P.V., Volkov, V.V., Sokolova, A.V., Koch, M.H.J., andSvergun, D.I. (2003). PRIMUS: a Windows PC-based system forsmall-angle scattering data analysis. J. Appl. Crystallogr. 36: 1277–1282.
Konarev, P.V., Petoukhov, M.V., Volkov, V.V., and Svergun, D.I.(2006). ATSAS 2.1, a program package for small-angle scatteringdata analysis. J. Appl. Crystallogr. 39: 277–286.
Kozin, M.B., and Svergun, D.I. (2001). Automated matching of high- andlow-resolution structural models. J. Appl. Crystallogr. 34: 33–41.
Kurek, I., Kawagoe, Y., Jacob-Wilk, D., Doblin, M., and Delmer, D.(2002). Dimerization of cotton fiber cellulose synthase catalyticsubunits occurs via oxidation of the zinc-binding domains. Proc.Natl. Acad. Sci. USA 99: 11109–11114.
Lamb, J.S., Zoltowski, B.D., Pabit, S.A., Li, L., Crane, B.R., andPollack, L. (2009). Illuminating solution responses of a LOV domainprotein with photocoupled small-angle X-ray scattering. J. Mol. Biol.393: 909–919.
Lee, C., Zhong, R., and Ye, Z.H. (2012). Arabidopsis family GT43members are xylan xylosyltransferases required for the elongationof the xylan backbone. Plant Cell Physiol. 53: 135–143.
Lieth, H. (1975). Primary production of the major vegetation units ofthe world. In Primary Productivity of the Biosphere, H. Lieth andR.H. Whittaker, eds (New York: Springer-Verlag), pp. 203–215.
Linder, M., and Teeri, T.T. (1997). The roles and function of cellulose-binding domains. J. Biotechnol. 57: 15–28.
McGuffin, L.J. (2007). Benchmarking consensus model qualityassessment for protein fold recognition. BMC Bioinformatics 8: 345.
Minh, D.D., and Makowski, L. (2013). Wide-angle X-ray solutionscattering for protein-ligand binding: multivariate curve resolutionwith Bayesian confidence intervals. Biophys. J. 104: 873–883.
Morgan, J.L.W., Strumillo, J., and Zimmer, J. (2013). Crystallographicsnapshot of cellulose synthesis and membrane translocation. Nature493: 181–186.
Mueller, S.C., and Brown, R.M., Jr. (1980). Evidence for an intramembranecomponent associated with a cellulose microfibril-synthesizing complex inhigher plants. J. Cell Biol. 84: 315–326.
Nishimura, N., Hitomi, K., Arvai, A.S., Rambo, R.P., Hitomi, C.,Cutler, S.R., Schroeder, J.I., and Getzoff, E.D. (2009). Structuralmechanism of abscisic acid binding and signaling by dimeric PYR1.Science 326: 1373–1379.
Osawa, T., Sugiura, N., Shimada, H., Hirooka, R., Tsuji, A.,Shirakawa, T., Fukuyama, K., Kimura, M., Kimata, K., andKakuta, Y. (2009). Crystal structure of chondroitin polymerase fromEscherichia coli K4. Biochem. Biophys. Res. Commun. 378: 10–14.
Palani, K., Kumaran, D., Burley, S.K., and Swaminathan, S. (2011).Crystal structure of a putative glycosyltransferase from Bacteroidesfragilis. Protein Data Bank: 3BCV. (http://www.rcsb.org/pdb/explore/explore.do?structureId=3BCV).
Pear, J.R., Kawagoe, Y., Schreckengost, W.E., Delmer, D.P., andStalker, D.M. (1996). Higher plants contain homologs of thebacterial celA genes encoding the catalytic subunit of cellulosesynthase. Proc. Natl. Acad. Sci. USA 93: 12637–12642.
Pettersen, E.F., Goddard, T.D., Huang, C.C., Couch, G.S.,Greenblatt, D.M., Meng, E.C., and Ferrin, T.E. (2004). UCSF
3008 The Plant Cell
Chimera—a visualization system for exploratory research andanalysis. J. Comput. Chem. 25: 1605–1612.
Rossmann, M.G., Moras, D., and Olsen, K.W. (1974). Chemical andbiological evolution of nucleotide-binding protein. Nature 250: 194–199.
Roy, A., Kucukural, A., and Zhang, Y. (2010). I-TASSER: a unifiedplatform for automated protein structure and function prediction.Nat. Protoc. 5: 725–738.
Sali, A., and Blundell, T.L. (1993). Comparative protein modelling bysatisfaction of spatial restraints. J. Mol. Biol. 234: 779–815.
Saxena, I.M., Lin, F.C., and Brown, R.M., Jr.,. (1990). Cloning andsequencing of the cellulose synthase catalytic subunit gene ofAcetobacter xylinum. Plant Mol. Biol. 15: 673–683.
Saxena, I.M., Brown, R.M., Jr., Fevre, M., Geremia, R.A., and Henrissat,B. (1995). Multidomain architecture of b-glycosyl transferases: implicationsfor mechanism of action. J. Bacteriol. 177: 1419–1424.
Saxena, I.M., and Brown, R.M., Jr.,., and Dandekar, T. (2001). Structure-function characterization of cellulose synthase: relationship to otherglycosyltransferases. Phytochemistry 57: 1135–1148.
Schuck, P. (2000). Size-distribution analysis of macromolecules bysedimentation velocity ultracentrifugation and lamm equationmodeling. Biophys. J. 78: 1606–1619.
Sethaphong, L., Haigler, C.H., Kubicki, J.D., Zimmer, J., Bonetta,D., DeBolt, S., and Yingling, Y.G. (2013). Tertiary model of a plantcellulose synthase. Proc. Natl. Acad. Sci. USA 110: 7512–7517.
Shi, J., Blundell, T.L., and Mizuguchi, K. (2001). FUGUE: sequence-structure homology recognition using environment-specific substitutiontables and structure-dependent gap penalties. J. Mol. Biol. 310: 243–257.
Söding, J., Biegert, A., and Lupas, A.N. (2005). The HHpred interactiveserver for protein homology detection and structure prediction. NucleicAcids Res. 33: W244–W248.
Svergun, D.I. (1992). Determination of the regularization parameter inindirect-transform methods using perceptual criteria. J. Appl.Crystallogr. 25: 495–503.
Svergun, D.I., and Koch, M.H.J. (2003). Small-angle scattering studies ofbiological macromolecules in solution. Rep. Prog. Phys. 66: 1735–1782.
Svergun, D.I., Volkov, V.V., Kozin, M.B., and Stuhrmann, H.B. (1996).New developments in direct shape determination from small-anglescattering. 2. Uniqueness. Acta Crystallogr. A 52: 419–426.
Svergun, D.I., Petoukhov, M.V., and Koch, M.H.J. (2001). Determinationof domain structure of proteins from X-ray solution scattering. Biophys. J.80: 2946–2953.
Taylor, N.G. (2008). Cellulose biosynthesis and deposition in higherplants. New Phytol. 178: 239–252.
Taylor, N.G., Howells, R.M., Huttly, A.K., Vickers, K., and Turner,S.R. (2003). Interactions among three distinct CesA proteins essentialfor cellulose synthesis. Proc. Natl. Acad. Sci. USA 100: 1450–1455.
Taylor, N.G., Gardiner, J.C., Whiteman, R., and Turner, S.R. (2004). Cellulosesynthesis in the Arabidopsis secondary cell wall. Cellulose 11: 329–338.
UniProt Consortium (2013). Update on activities at the UniversalProtein Resource (UniProt) in 2013. Nucleic Acids Res. 41: D43–D47.
Vergara, C.E., and Carpita, N.C. (2001). b-D-glycan synthases andthe CesA gene family: lessons to be learned from the mixed-linkage(1→3),(1→4)b-D-glucan synthase. Plant Mol. Biol. 47: 145–160.
Wallner, B., and Elofsson, A. (2006). Identification of correct regionsin protein models using structural, alignment, and consensusinformation. Protein Sci. 15: 900–913.
Wang, J., Howles, P.A., Cork, A.H., Birch, R.J., and Williamson,R.E. (2006). Chimeric proteins suggest that the catalytic and/orC-terminal domains give CesA1 and CesA3 access to their specificsites in the cellulose synthase of primary walls. Plant Physiol. 142:685–695.
Wang, J., Elliott, J.E., and Williamson, R.E. (2008). Features of theprimary wall CESA complex in wild type and cellulose-deficientmutants of Arabidopsis thaliana. J. Exp. Bot. 59: 2627–2637.
Williamson, T.E., Craig, B.A., Kondrashkina, E., Bailey-Kellogg, C.,and Friedman, A.M. (2008). Analysis of self-associating proteins bysingular value decomposition of solution scattering data. Biophys.J. 94: 4906–4923.
Wong, H.C., et al. (1990). Genetic organization of the cellulosesynthase operon in Acetobacter xylinum. Proc. Natl. Acad. Sci. USA87: 8130–8134.
Wu, S., and Zhang, Y. (2007). LOMETS: a local meta-threading-serverfor protein structure prediction. Nucleic Acids Res. 35: 3375–3382.
Wu, S., and Zhang, Y. (2008). MUSTER: Improving protein sequenceprofile-profile alignments by using multiple sources of structureinformation. Proteins 72: 547–556.
Yang, Y., Faraggi, E., Zhao, H., and Zhou, Y. (2011). Improvingprotein fold recognition and template-based modeling by employingprobabilistic-based matching between predicted one-dimensionalstructural properties of query and corresponding native propertiesof templates. Bioinformatics 27: 2076–2082.
Zhang, Y., and Skolnick, J. (2005). TM-align: a protein structurealignment algorithm based on the TM-score. Nucleic Acids Res. 33:2302–2309.
Zemla, A. (2003). LGA: A method for finding 3D similarities in proteinstructures. Nucleic Acids Res. 31: 3370–3374.
Cellulose Synthase 3D Contour Structure 3009

DOI 10.1105/tpc.114.126862; originally published online July 10, 2014; 2014;26;2996-3009Plant Cell
Nicholas C. CarpitaN. Paul, Subhangi Ghosh, Daisuke Kihara, Michael Crowley, Michael E. Himmel, Jeffrey T. Bolin and Anna T. Olek, Catherine Rayon, Lee Makowski, Hyung Rae Kim, Peter Ciesielski, John Badger, Lake
The Structure of the Catalytic Domain of a Plant Cellulose Synthase and Its Assembly into Dimers
This information is current as of August 30, 2018
Supplemental Data /content/suppl/2014/06/17/tpc.114.126862.DC1.html
References /content/26/7/2996.full.html#ref-list-1
This article cites 70 articles, 19 of which can be accessed free at:
Permissions https://www.copyright.com/ccc/openurl.do?sid=pd_hw1532298X&issn=1532298X&WT.mc_id=pd_hw1532298X
eTOCs http://www.plantcell.org/cgi/alerts/ctmain
Sign up for eTOCs at:
CiteTrack Alerts http://www.plantcell.org/cgi/alerts/ctmain
Sign up for CiteTrack Alerts at:
Subscription Information http://www.aspb.org/publications/subscriptions.cfm
is available at:Plant Physiology and The Plant CellSubscription Information for
ADVANCING THE SCIENCE OF PLANT BIOLOGY © American Society of Plant Biologists