the structure of testis angiotensin-converting...
TRANSCRIPT

AMDG
The Structure of Testis Angiotensin-Converting Enzyme (tACE-g13) in Complex with the
Inhibitor RXPA380
ITAI CHITAPI
A minithesis submitted in partial fulfilment of the requirements for the degree of Master
of Science (Structural Biology) at the University of Cape Town
Supervisors
Associate Professors B. T. Sewell and E. D. Sturrock
August 2006

2
KEYWORDS
Active site
Angiotensin-converting enzyme
Glycosylation mutant
Modelling
RXPA380
S2' sub-site
Selectivity
Structure solution
tACE-g13
Tryptophan

3
ABSTRACT The Structure of Testis Angiotensin-Converting Enzyme
(tACE-g13) in Complex with the Inhibitor RXPA380
I. Chitapi
M.Sc. minithesis, Department of Molecular & Cell Biology, University of Cape
Town
Angiotensin-converting enzyme (ACE), a zinc metalloprotease, is a key
regulator of the mammalian renin-angiotensin system (RAS). Primarily, ACE
is a dipeptidyl peptidase which cleaves angiotensin I to produce angiotensin
II, a potent vasoconstrictor. By the same enzymatic mechanism, ACE also
inactivates the vasodilator bradykinin. The main overall effect of these actions
is an increase in blood pressure. Several ACE inhibitors have been developed
as drugs for the treatment of myocardial infarction, hypertension, kidney
failure and heart failure.
There are two major isoforms of ACE, somatic and testis ACE (sACE and
tACE, respectively). Somatic ACE consists of a C- and N-domain, while testis
ACE is essentially identical to the C-domain. Both forms of ACE are heavily
glycosylated, a fact that has complicated the structural determination of the
enzyme. Discovery of the two-domain structure of sACE led to the realisation
that the two domains had different in vivo functions, and that the selective
regulation of these domains by drugs might lead to improved efficacy and
reduced unwanted effects. The side effects of treatment with ACE inhibitors
have included angioedema and cough, and have been attributed to the
accumulation of bradykinin.
There is ample evidence to suggest that the selective inhibition of only the C-
domain may lead to the desired reduction in blood pressure and leave the N-
domain unhindered to continue functioning physiologically (for example,
clearing bradykinin).

4
The three-dimensional structural information on tACE and the N-domain, as
well as other ACE homologues, has allowed both insights into and speculation
about the differences (putative and observed) between the N- and C-domains.
A better understanding of the determinants of domain selectivity is the major
goal of this project. The C-domain-selective inhibitor, RXPA380, is one of the
most C-domain-selective compounds currently available (Ki (C-domain = 3
nM; cf Ki (N-domain) = 10000 nM).
The co-crystallisation of tACE-g13, a fully functional glycosylation mutant of
tACE, with RXPA380 has enabled the determination by X-ray crystallography
of the structure of the tACE-g13–RXPA380 complex, to a resolution of 2.7 Å.
This provides new information on the binding of the carboxybenzyl P2 group.
The set of interactions between the S2' residues and the P2' tryptophan side
chain appears to be, as predicted, the major determinant of the selectivity of
RXPA380, as comparisons with the N-domain suggest. In particular, the
interactions of the indole ring with two valine residues, and of the indole
nitrogen with a water molecule that also has a hydrogen bond to a glutamic
acid appear to be the main stabilising interactions. The in silico modelling of
the tACE–RXPA380 complex gives an inhibitor conformation that, for the most
part, corresponds well to the crystal structure.
The determination of the structure of tACE-g13 complexed with this inhibitor
confirms the utility of the glycosylation mutant as a structural tool in drug-
binding studies. It also provides important insights into the determinants of
selectivity, and thus may aid the design of next-generation inhibitors that are
domain-selective, tight-binding and physiologically applicable.
August 2006

5
DECLARATION
I declare that The Structure of Testis Angiotensin-Converting Enzyme (tACE-
g13) in Complex with the Inhibitor RXPA380 is my own work, that it has not
been submitted for any degree or examination in any other university, and that
all the sources I have used or quoted have been indicated and acknowledged
by complete references.
Itai Chitapi 31 August 2006
Signed:

6
ACKNOWLEDGEMENTS
1. The Carnegie Corporation of New York, the National Research
Foundation, the South African Synchrotron Fund, and the University of
Cape Town funded this work. I thank the many people who facilitated
the financial support from these institutions.
2. The assistance and advice of Dr Hassan Belrhali (BM14-UK, ESRF),
and Dr Jodi Shaulsky (Accelrys, Inc.) are deeply appreciated.
3. I am thankful to my fellow scientists who have made this work possible:
my supervisors Associate Professors Trevor Sewell and Edward
Sturrock; my “co-supervisors” Dr Muhammed Sayed, Dr Aloysius
Nchinda, and Jean Watermeyer; the UCT/UWC Structural Biology
Group (in particular my fellow dudes Serah Kimani, Samuel Kwofie and
Margot Scheffer); the Zinc Metalloprotease Group at UCT; Dr Collet
Dandara.
4. I acknowledge and thank my friends: those who have been through
living with me (Tinashe Makoni, Jonathan Hughes, William Tsolo,
Thamba Tabvuma), and those who have not: Rufaro Dhlembeu, Alice
Makoni, Jason Brickhill, Melanie Murcott, James Wambugu, Mweli
Ndaba, Seike Garny, Malcolm Cocks.
5. I thank those who have provided me with support, inspiration or
encouragement at a point, or from a distance, with or without their
knowledge; and whom I do not recall at this moment.
6. My foremost supporters, my parents, Hope and Hilary Chitapi: I would
be nowhere without you. I thank and bless you both. I am fortunate to
have the smartest, most tolerant and loving siblings in the world.
Fungai, Rudo and Simbarashe – let’s take over the world together!
7. This is the 4-11: You are worthy, our Lord and God, to receive honour
and glory and power, for You created all things, and by Your will they
were created and have their being.

7
TABLE OF CONTENTS Title Page................................................................................................... 1
Keywords ................................................................................................... 2
Abstract...................................................................................................... 3
Declaration................................................................................................. 5
Acknowledgements ................................................................................... 6
Table of Contents ...................................................................................... 7
1. LITERATURE REVIEW........................................................................... 10
1.1. General biochemistry & substrates .................................................. 11
1.1.1. ACE isoforms ............................................................................ 11
1.1.2. Glycosylation............................................................................. 13
1.1.3. Chloride activation .................................................................... 15
1.1.4. ACE substrates ......................................................................... 15
1.1.4.1. Angiotensin ........................................................................ 16
1.1.4.2. Bradykinin .......................................................................... 17
1.1.4.3. N-domain preferred substrates.......................................... 18
1.1.4.4. C-domain preferred substrates.......................................... 19
1.1.4.5. Artificial substrates............................................................. 19
1.1.5. Enzyme mechanism.................................................................. 20
1.2. ACE inhibitors................................................................................... 21
1.3. Three-dimensional structure of Angiotensin-converting enzymes and
related metalloproteases............................................................................. 24
1.3.1. Introduction – metalloproteases................................................ 24
1.3.2. ACE structures – C-domain/tACE............................................. 25
1.3.2.1. Testis ACE (1o8a) and tACE–lisinopril (1o86) .................. 25
1.3.2.2. tACE–captopril (1uzf) & tACE-enalaprilat (1uze) .............. 29
1.3.3. ACE structures – N-domain ...................................................... 30
1.3.4. ACE crystal structures - Homologues....................................... 31
1.3.4.1. AnCE (D. melanogaster).................................................... 31
1.3.4.2. ACE2 (Homo sapiens) ....................................................... 34
1.3.5. In silico modelling structures..................................................... 36
1.3.5.1. Background........................................................................ 36
1.3.5.2. ACE-inhibitor docking and modelling................................. 37

8
1.3.5.3. ACE N-domain docking and modelling.............................. 37
1.3.5.4. C-domain ACE-inhibitor models ........................................ 38
1.4. Rationale of the Study...................................................................... 39
1.4.1. Domain-selective inhibition ....................................................... 39
1.4.2. Structural determinants of selectivity ........................................ 39
1.4.3. Project Aims .............................................................................. 42
2. MATERIALS AND METHODS ................................................................ 43
2.1. Protein expression............................................................................ 44
2.2. Purification by affinity chromatography ............................................ 44
2.3. Enzyme activity assays .................................................................... 44
2.4. Protein concentration ....................................................................... 45
2.5. Crystallisation ................................................................................... 45
2.5.1. General crystallisation conditions ............................................. 45
2.5.2. Initial tACE-g13–RXPA380 co-crystallisation conditions.......... 46
2.5.3. Final tACE-g13–RXPA380 co-crystallisation conditions .......... 46
2.6. Data collection and processing ........................................................ 47
2.6.1. In-house data collection and processing .................................. 47
2.6.2. Synchrotron data collection and processing............................. 48
2.7. Structure refinement......................................................................... 49
2.8. Structure validation and analysis ..................................................... 50
2.9. Modelling: Docking and molecular dynamics of RXPA380 in active
site of tACE ................................................................................................. 51
3. RESULTS AND DISCUSSION................................................................ 53
3.1. Protein expression & purification...................................................... 54
3.2. Crystallisation ................................................................................... 55
3.2.1. Crystallisation of tACE-g3 ......................................................... 55
3.2.2. Initial co-crystallisation of tACE-g13–RXPA380 complex......... 55
3.2.3. Final co-crystallisation of tACE-g13–RXPA380 complex ......... 56
3.3. Data collection and processing ........................................................ 58
3.3.1. In-house data collection and processing .................................. 58
3.3.2. Synchrotron data collection and processing............................. 59
3.4. Structure solution and refinement .................................................... 61
3.5. Structure validation........................................................................... 66
3.6. Structural analysis ............................................................................ 67
9
3.6.1. Overall structure of tACE-g13–RXPA380 complex .................. 67
3.6.2. Glycosylation and chloride binding ........................................... 69
3.6.3. Binding of RXPA380 to tACE-g13 ............................................ 71
3.6.3.1. Overall................................................................................ 71
3.6.3.2. S2 sub-site ......................................................................... 72
3.6.3.3. S1 sub-site ......................................................................... 72
3.6.3.4. S1' sub-site ........................................................................ 73
3.6.3.5. S2' sub-site ........................................................................ 74
3.6.4. tACE-g13–RXPA380 vs ACE N-domain sub-sites ................... 75
3.6.5. Comparison of experimentally determined tACE-RXPA380 and
modelling predictions............................................................................... 78
4. CONCLUSIONS ...................................................................................... 82
4.1. Protein expression, purification and crystallisation .......................... 83
4.2. Data collection, structure solution, refinement and analysis............ 83
4.3. Comparison of modelled tACE-g13–RXPA380 predictions with
experimental structure................................................................................. 84
4.4. Directions for future work ................................................................. 84
5. REFERENCES ........................................................................................ 86

10
1. LITERATURE REVIEW

11
1.1. General biochemistry & substrates
Angiotensin-converting enzyme (ACE) is a vital catalytic component of the
mammalian renin-angiotensin system (RAS), a coordinated hormonal
cascade that controls blood pressure, renal function, and fluid and electrolyte
homeostasis (Skeggs, Jr. et al., 1956; Erdos & Skidgel, 1987; Ehlers &
Riordan, 1989). Briefly, ACE cleaves the oligopeptides angiotensin I (Ang I)
and bradykinin (BK) to produce angiotensin II (Ang II, vasoconstrictor) and
bradykinin1-7 (BK1-7, inactivated vasodilator) (Fig. 1-2). The inhibition of ACE
activity has been known for a long time to result in the alleviation of
hypertension (Erdos & Skidgel, 1987). ACE occurs in most tissues, but is
primarily found in the vascular tissues of lungs and kidneys (Ehlers & Riordan,
1991; Ehlers et al., 1991b). The role of ACE in the RAS, and the interplay
between the local RAS and circulating RAS have been previously reviewed
(Campbell, 1987; Dzau, 1988; Danser et al., 1999).
The gene coding for ACE has two promoter sites (Soubrier et al., 1993). ACE
is a membrane-anchored zinc metalloprotease with two homologous domains,
each containing an active site (Soubrier et al., 1988; Wei et al., 1991). It is a
dipeptidyl peptidase, cleaving the penultimate peptide bond from various
oligopeptide substrates (or their analogues) and releasing a shortened
oligopeptide and a C-terminal dipeptide.
The aim of this review is to describe the basic biochemical and catalytic
properties of ACE, evaluate the insights gained from structural studies of ACE
and related metalloproteases, and propose a line of investigation that will
further the understanding and application of domain-selective ACE inhibitors.
1.1.1. ACE isoforms
The non-vertebrate isoforms of ACE, such as the Drosophila melanogaster
AnCE, generally lack membrane anchors and are therefore soluble (Coates et
al., 2000). There are two major isoforms of mammalian ACE, somatic ACE
(sACE) and testis ACE (tACE). Somatic ACE is found primarily on the luminal

12
surface of vascular endothelial cells, in lung capillary cells, and in the brush
border (epithelium) of kidney tubules, while testis ACE is found in male
germinal cells (Erdos & Skidgel, 1987; Baudin, 2002) (Fig. 1-1). Both isoforms
are expressed from a single ACE gene. Somatic ACE is the full protein with
1306 amino acids (but excluding exon 13), and includes a 29-amino acid N-
terminal signal peptide (Soubrier et al., 1988). On the other hand tACE is
identical to the C-terminal domain of sACE but for its own 31-amino acid N-
terminal signal sequence plus the unique O-glycosylation-rich N-terminal
sequence encoded by exon 13 (Baudin, 2002). Somatic ACE is shed by
proteolysis from the cell membrane into the bloodstream. Testis ACE is
cleaved more efficiently, suggesting some sort of regulatory role for the N-
domain (Sadhukhan et al., 1998; Woodman et al., 2000). The cleavage site is
located at the R627-S628bond (Ehlers et al., 1996; Woodman et al., 2000),
although the identity of the shedding enzyme(s) is unknown.
Figure 1-1. Schematic representation of tACE and sACE isoforms. N-linked glycosylation sites are represented by Y-shaped symbols.
Two further forms of human ACE have been isolated: N-domain ACE from
ileal fluid (Deddish et al., 1994), and N-domain ACE from the urine of mild
hypertensive patients (Casarini et al., 2001). The latter finding, of a 90 kDa
form of N-domain ACE, has also been confirmed in spontaneously
hypertensive rats, and has been considered for use as a possible genetic
marker for hypertension (Bueno et al., 2004). It is proposed that these forms

13
of ACE are produced by proteolytic cleavage after release of the full length
ACE from the membrane (Deddish et al., 1994; Bueno et al., 2004).
Angiotensin-converting enzyme II (ACE2) is a recently discovered
carboxypeptidase that removes only the C-terminal residue from Ang I, giving
angiotensin1-9. It is transcribed from a different gene and has a single catalytic
site (Crackower et al., 2002; Oudit et al., 2003).
1.1.2. Glycosylation
ACE is heavily glycosylated, with up to 30% of the molecular weight of tACE
being due to N-linked and O-linked glycans (Ehlers et al., 1992). O-
glycosylation occurs in the N-terminal region that is unique to tACE, and could
play a role in the binding of sperm to oviduct epithelium during the process of
fertilisation. However, this region is not critical to its structure or enzymatic
function (Ehlers et al., 1992; Kasturi et al., 1994; Baudin et al., 1997).
N-linked glycosylation occurs by means of a highly regulated series of
enzymatic reactions. The N-linkage is between the side-chain amide of an
asparagine residue and the designated C1 of N-acetyl glucosamine, which is
in turn typically linked to a series of other glycan residues. This glycosylation
can only occur at asparagine (N) residues that are found in the “glycosylation
sequon” N-X-S/T, where X is any amino acid except proline (Ronin et al.,
1981).
In mammalian cells, highly diverse chains of N-linked glycans may occur, with
the result that the surfaces of otherwise identical molecules can be highly
heterogeneous. Somatic ACE contains 17 potential N-linked glycosylation
sites, 7 of which are in the C-domain. The C-terminal site is not glycosylated,
while sites 4-6 are partially (i.e. in some instances) glycosylated, and sites 1-3
are fully (i.e. invariably) glycosylated (Yu et al., 1997) (Fig. 1-1).
A minimal level of glycosylation protects the enzyme from intracellular
degradation while targeting it for extracellular secretion, and the
unglycosylated enzyme is rapidly degraded (Kasturi et al., 1994; Baudin et al.,

14
1997). The solubility in extracellular medium may also be dependent on the
presence of sufficient glycans on the surface of the enzyme (Baudin et al.,
1997). Studies using synthetic membranes have also revealed a likely role of
carbohydrates in mediating the dimerisation of ACE (Kost et al., 1998; Kost et
al., 2000).
Most critically to structural studies, the glycosylation of ACE has presented a
major obstacle in the elucidation of its three-dimensional structure (Gordon et
al., 2003; Sturrock et al., 2004). Because glycosylation as a process is not as
strictly controlled as code-directed polypeptide synthesis, there is a high
degree of oligosaccharide heterogeneity amongst molecules at identical
glycosylation sites (Yu et al., 1997). This means that crystallisation, which
requires regular packing of identical structures, is very difficult to achieve to
the standard required for structural analysis using X-ray crystallography. Two
successful approaches to reducing the heterogeneity and aiding crystallisation
have been α-glucosidase I inhibition to produce uniform, truncated N-linked
glycan chains (Yu et al., 1997), and the mutagenesis of some asparagine
residues to glutamine thus preventing N-glycosylation (Gordon et al., 2003).
The tACE-lisinopril structure (identical to the C-domain) solved by means of
the former approach was the first published structure of any ACE isoform, and
revealed that in fact all the putative N-linked glycan chains were at the surface
of the enzyme (Natesh et al., 2003). More recently, the structure of the ACE
N-domain, expressed in the presence of α-glucosidase I inhibitor N-
butyldeoxynojirimycin (NBDNJ), has been reported, revealing similar surface
glycosylation (Corradi et al., 2006). Watermeyer et al. (2006) have solved the
first tACE mutant structure, using a form of tACE (named tACE-g13) in which
all but the first and third glycosylation sites have been removed by
asparagine-to-glutamine mutagenesis. In addition, the structure of Drosophila
analogue AnCE (using baculovirus expression in insect cells) has been
determined with only two of three possible glycosylation sites intact (Kim et
al., 2003), although it is known that AnCE is active even when unglycosylated
(Williams et al., 1996). A third approach, the expression of tACE in insect cells
using Baculovirus infection (Williams et al., 1994) has also yielded protein that
may be amenable to crystallisation for structural studies.

15
1.1.3. Chloride activation
It has long been known that ACE is activated by monovalent anions, in
particular chloride, which is the anion typically found associated with ACE
under physiological conditions (Bunning & Riordan, 1983). The dependence
of ACE on chloride was found to vary with substrate structure, so that, for
example, angiotensin I hydrolysis is more dependent on chloride than is
bradykinin hydrolysis (Shapiro & Riordan, 1984). It has been suggested that
the presence of positively charged residue (K/R) at the C-terminus of a
peptide results in greater independence from chloride. Thus, BK1-7
accumulates in the absence of chloride, whereas in presence of chloride both
BK1-7 and BK1-5 are produced. The dependence of the two domains on
chloride also differs. The C-domain is significantly more dependent on
chloride activation than the N-domain (Jaspard et al., 1993). Ki inhibition
values for three commercial inhibitors of ACE in differing chloride
concentrations (Wei et al., 1992), suggested a chloride-induced
conformational change that occurs in the C-domain (and therefore tACE) but
not in the N-domain (Natesh et al., 2004). pH is also a determining factor in
the chloride activation (Wei et al., 1991; Bersanetti et al., 2004). The 3-
dimensional structure of tACE revealed the locations of two chloride ions
buried in the interior of ACE (Natesh et al., 2003). Their mechanism of
activation of ACE remains elusive, and appears to be indirect as Cl1 and Cl2
are 20.7 Å and 10.4 Å from the catalytic zinc, respectively.
1.1.4. ACE substrates
In the 1950s, ACE was identified as a factor in horse blood that cleaved
angiotensin I to produce the vasoactive angiotensin II (Skeggs, Jr. et al.,
1956), and independently as a bradykinin-inactivating enzyme, kininase
(Erdos & Yang, 1967) (reviewed by Erdos & Skidgel, (1987)). It has since
been found to cleave several other groups of substrates (Sturrock et al.,
2004), which will also be described briefly here.

16
Figure 1-2. Natural ACE substrates and their cleavage sites. p indicates protection by amidation.
1.1.4.1. Angiotensin
Angiotensin I (a decapeptide, sequence DRVYIHPFHL) is the best-known
substrate of ACE. Angiotensin II type I (AT1) receptors (mainly in heart and
vascular smooth muscle cells) are the primary mediators of the vasopressor
effects of angiotensin II which result in the upregulation of systemic blood
pressure (Eriksson et al., 2002; Turner & Hooper, 2002; Baudin, 2002).
Angiotensin II also binds AT2 receptors, which may counter the effects of AT1
receptors, and are also considered responsible for cell proliferation,
differentiation and angiogenesis (Turner & Hooper, 2002). After the discovery
of the two-domain nature of the enzyme (Soubrier et al., 1988; Soubrier et al.,
1993), it was observed that both domains catalyse the cleavage of the F-H

17
peptide bond in angiotensin I, releasing angiotensin II and the C-terminal HL
dipeptide. There is an absolute zinc requirement by both domains, as
indicated by EDTA inhibition, and affinity (indicated by KM values) for
angiotensin I is similar in both domains (Wei et al., 1991). However there are
significant differences in their catalytic rate, chloride activation, and pH
dependency (Wei et al., 1991; Wei et al., 1992; Jaspard et al., 1993).
Cleavage of angiotensin I is more chloride-dependent than that of bradykinin
(Shapiro & Riordan, 1984; Jaspard et al., 1993). Additionally, for angiotensin I
hydrolysis, the N-domain is considerably less dependent on chloride
activation, whereas the C-domain has an absolute requirement for chloride,
and functions optimally at a chloride concentration that is inhibitory to the N-
domain (Wei et al., 1991; Jaspard et al., 1993). Taken together, these
observations indicate that the C-domain is responsible for most of the in vitro
hydrolysis of angiotensin I. Experiments using highly selective inhibitors
against the C- and N-domains have confirmed that this is also the case in vivo
(Georgiadis et al., 2003). Interestingly, it was also found that in vivo there
seems to be a measure of cooperativity between the two domains, since
either an N-domain-specific or a C-domain-specific inhibitor reduced Ang I
hydrolysis to negligible levels, akin to the effect of double inhibition
(Georgiadis et al., 2003). In addition, strong evidence for negative
cooperativity between the domains has also been found in bovine somatic
ACE, although this was with the artificial substrate FA-Phe-Gly-Gly (Binevski
et al., 2003).
1.1.4.2. Bradykinin
Bradykinin (BK) is a nonapeptide (RPPGFSPFR) whose sequential dipeptidyl
hydrolysis by ACE leads to the production of two inactivated peptides: BK1-7
(RPPGFSP) and BK1-5 (RPPGF) (Ehlers & Riordan, 1989). After
carboxypeptidase activity has removed the C-terminal arginine, ACE is able to
cleave the C-terminal tripeptide (SPF) from the octapeptide, thus performing
an endopeptidase function (Erdos & Skidgel, 1987; Baudin, 2002). Jaspard
and colleagues (1993) found that both N- and C-domains catalytically cleave
BK about 10 times faster than Ang I. This was consistent with prior results of

18
Bunning and co-workers (1983). As with angiotensin hydrolysis, the C-domain
was found to be more chloride-dependent, although the extent of BK-
hydrolysis dependence on chloride was less than that of Ang I.
1.1.4.3. N-domain preferred substrates
As soon as the presence of two active sites in ACE was confirmed (Wei et al.,
1991), studies were carried out to investigate the differences in their substrate
selectivity and catalytic efficiency. There were already hints that differences
may exist, based on studies done on well-known substrates as well as
artificial substrates of ACE. Gonadotropin-releasing hormone (GnRH,
sometimes called Luteinising hormone-releasing hormone (LHRH) in older
literature), acts on the pituitary gland to increase the release of gonadotropin
and follicle stimulating hormone. GnRH was found to bind sACE somewhat
inefficiently (KM=167 µM) (Skidgel & Erdos, 1985), but the N-domain
demonstrated greater catalytic activity with this substrate (Jaspard et al.,
1993). ACE releases tripeptides from both the N-terminal and C-terminal
ends. It can also sequentially cleave dipeptides from the C-terminus after
release of the C-terminal tripeptidyl to produce the N-terminal tripeptide
(Skidgel & Erdos, 1985).
N-acetyl-seryl-aspartyl-lysyl-proline (Ac-SDKP) is a natural tetrapeptide
involved in the regulation of haematopoietic stem cell proliferation. It inhibits
the entry of these pluripotent cells into S-phase (DNA replication) and thus
restricts proliferation. It may also be an important endogenous negative
regulator of fibroblast proliferation in the heart, thus reducing fibrosis and
playing a cardioprotective role (Rhaleb et al., 2001). Ac-SDKP is cleaved by
ACE at the D-K bond to release Ac-SD and KP. More specifically, it was found
that the hydrolysis of Ac-SDKP occurs primarily at the N-domain, which is 50
times more catalytically efficient than the C-domain for the substrate
(Rousseau et al., 1995). Captopril is an effective inhibitor of this hydrolysis,
both in vitro (Rousseau et al., 1995) and in vivo (Azizi et al., 1996).
Ang1-7 is a product of Ang I metabolism via several different peptidases, such
as neprilysin (but excluding ACE) (Ferrario & Iyer, 1998). This peptide has

19
been found to play a significant role in the regulation of angiotensin
metabolism, primarily as it competitively inhibits the somatic ACE C-domain.
In addition, Ang1-7 is cleaved by the ACE N-domain to give Ang1-5 (Deddish et
al., 1998).
1.1.4.4. C-domain preferred substrates
Substance P is a neuropeptide with the sequence RPKPQQFFGLMp (Erdos &
Skidgel, 1987). ACE cleaves the C-terminal dipeptide and tripeptide from this
undecapeptide, although the physiological significance of this is unclear. The
C-domain demonstrates four-fold higher catalysis to the tripeptide against
both its production of the dipeptide and the N-domain’s production of the
tripeptide. The C-terminal methionine residue is said to be protected by
amidation (Erdos & Skidgel, 1987). It has been proposed that the presence of
an amide group on the C-terminus of Substance P, GnRH and other
substrates provides leeway for the peptide substrate to “slip”, allowing
cleavage of the C-terminal tripeptide rather than or in addition to the dipeptide
(Kim et al., 2003).
ACE has also been found to cleave other neuropeptides in vitro, such as
neurotensin, as well as several enkephalins (Erdos & Skidgel, 1987).
1.1.4.5. Artificial substrates
A number of artificial substrates have been developed for enzymological
studies of ACE. These tend to be shorter than natural peptide substrates, and
typically contain peptides or peptidomimetic residues linked to a moiety that is
detectable by fluorimetric, radiometric, photometric, or other means for
enzyme assays (Baudin, 2002). They are often commercially available and
easier to acquire than some peptide substrates. These include Z-Phe-His-
Leu, hippuryl-histidyl-leucine (HHL), and furylacryloyl-phenylalanyl-glycyl-
glycine (FA-Phe-Gly-Gly). The latter two demonstrate the pattern of
dependency on chloride shown by Ang I (Baudin, 2002), with an optimal

20
chloride concentration for HHL hydrolysis by the N- and C-domains of 10 and
800 mM respectively (Wei et al., 1991).
In a fascinating study Araujo and colleagues (2000) used fluorescence
resonance energy transfer and several peptide sequences to determine some
of the amino acid preferences of the C- or N-domain, particularly at the P1'
position. With a similar protocol, Bersanetti et al. (2004) have developed a
series of short fluorogenic peptide substrates, one of which (peptide sequence
LFK) has shown (~70-fold) selectivity for the C-domain.
1.1.5. Enzyme mechanism
In both the N- and C-domains of ACE, there is a conserved catalytic
sequence that is characteristic of the gluzincin family of zinc metalloproteases
(Hooper, 1994). The consensus sequence consists of the HEXXH motif, the
two histidines of which coordinate the zinc atom, and a glutamic acid, (24
residues downstream), which is the third zinc-coordinating residue.
The mechanism of action of ACE was thought to mimic that of the prototypical
zinc metalloprotease thermolysin, whose mechanism of action was elucidated
in several studies and summarised by Matthews (Fig. 1-3) (Matthews, 1988).
Briefly, the reaction in ACE proceeds as a fairly typical general-base catalysis.
A water molecule associated to the zinc attacks the carbonyl carbon of the
scissile bond of the substrate. The glutamic acid (E384) of the metalloprotease
signature HEXXH motif acts as the acceptor of a proton from the water. The
negatively charged oxygen resulting from the binding of OH is stabilised by
the zinc, as well as Y523 and a water in this intermediate (in thermolysin these
correspond to a histidine and tyrosine, respectively). As the reaction
proceeds, the E384 releases its proton to the amine nitrogen, thus destabilising
the scissile bond. This bond’s nitrogen atom is stabilised by electrostatic
interactions with the backbone carbonyls of A354 and S355. The consequent
charge repulsion between the new amino terminal and zinc, as well as the
stabilisation of the C-terminal by the same, leads to separation of the
products.

21
Figure 1-3. Catalytic mechanism of tACE, adapted from Matthews (1988).
1.2. ACE inhibitors
The first ACE inhibitors were discovered as bradykinin-potentiating peptides
from the venom of the South American snake Bothrops jararaca, as well as
other venomous snakes (Cushman et al., 1977; Cushman & Ondetti, 1999).
Based on these, a good understanding of the carboxypeptidase A active site,
and some modest computer modelling capabilities, Cushman and co-workers
developed captopril, which became the first clinically-approved inhibitor of
ACE (Cushman et al., 1977; Ondetti et al., 1977). Many different ACE
inhibitors have been designed since then – as of 2002 there were seventeen
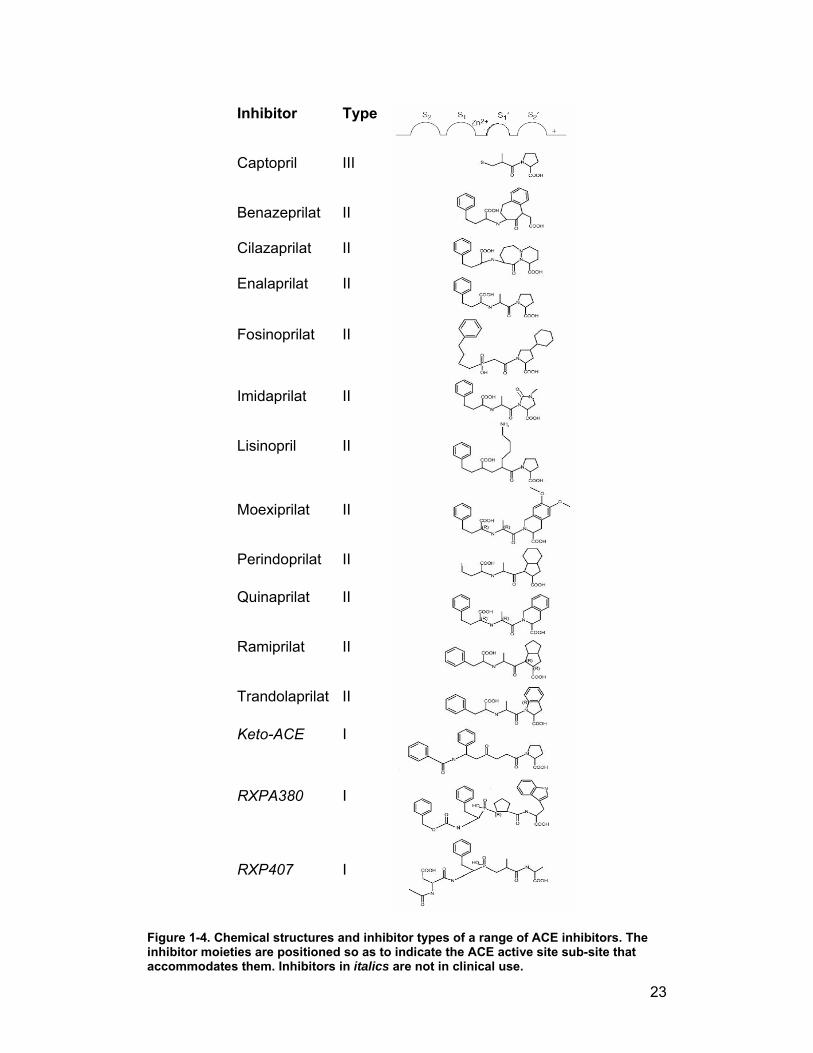
different inhibitors of ACE in clinical use (Zaman et al., 2002). The inhibitors
can be categorised into major types, determined by the number of amino acid
substituent groups. Type I inhibitors have four amino acid (substituent)
groups, designated P2, P1 (on the N-terminal side of the zinc-binding group),
P1' and P2' (C-terminal groups) (Schechter & Berger, 1967). Type II inhibitors
have P1, P1' and P2' groups only, while Type III consist only of the C-terminal
P1' and P2' groups and the zinc binding group (Fig. 1-4). An alternative
classification promotes the chemical character of the zinc-binding motif as the
major criterion for classification. By this means, compounds can be clustered
into six classes (Redelinghuys et al., 2005) –
Sulphydryls – captopril is the prototype member of this group. The
inhibitor’s coordination with the catalytic zinc atom is via a C-terminal –
SH group. These inhibitors are also known as Type III inhibitors, as
they only have P1' and P2' substituents.

22
Ketones – this group of compounds includes both Type I and Type II
molecules. Coordination to the zinc atom is by means of the ketone
functional group.
Carboxylates – as the name suggests, the carboxylate moiety is
responsible for binding to zinc. Many of the clinical inhibitors belong to
this group, and as they tend to be peptides or peptide analogues they
are often delivered to the body as esters to improve bioavailability. This
group includes enalapril and lisinopril, two well-established anti-ACE
drugs.
Hydroxamates – Turbanti and coworkers (Turbanti et al., 1993)
pioneered the development of Type III inhibitors with a new zinc-
binding moiety, the hydroxamic acid functional group. The non-amino
acid nature of the compounds and the stereochemistry potential play a
role in making the hydroxamates an alternative group of interest.
Silanediols – these compounds take advantage of the ability of silicon
to form a stable dialkylsilanediol (Kim & Sieburth, 2004). Since silicon
does not form double bonds except under duress, this form can act as
a stable (unhydrolysable) mimic of the tetrahedral intermediate that
forms during substrate catalysis. In addition, silanediols are neutral at
physiological pH, unlike hydrated carbonyl isosteres (Kim & Sieburth,
2004; Kim et al., 2005).
Phosphinates – this functional group of compounds has been long
known as potent inhibitors of zinc metalloproteases (Yiotakis et al.,
1994). Recently domain-selective Type I inhibitors have been
developed that show nanomolar inhibition constants selectively for one
or other of the domains of ACE (Dive et al., 1999; Junot et al., 2001;
Dive et al., 2004; Georgiadis et al., 2004).
23
Inhibitor Type
Captopril III
Benazeprilat II
Cilazaprilat II
Enalaprilat II
Fosinoprilat II
Imidaprilat II
Lisinopril II
Moexiprilat II
Perindoprilat II
Quinaprilat II
Ramiprilat II
Trandolaprilat II
Keto-ACE I
RXPA380 I
RXP407 I
Figure 1-4. Chemical structures and inhibitor types of a range of ACE inhibitors. The inhibitor moieties are positioned so as to indicate the ACE active site sub-site that accommodates them. Inhibitors in italics are not in clinical use.

24
1.3. Three-dimensional structure of
Angiotensin-converting enzymes and
related metalloproteases
1.3.1. Introduction – metalloproteases
The prototypical metalloproteases for ACE in terms of tertiary structure have
been thermolysin and carboxypeptidase A (Colman et al., 1972; Lipscomb,
1983). The structures of these two metalloproteases have both been known
for over 20 years, and indeed the active site of carboxypeptidase A was used
as a model for ACE in the early days of inhibitor design (Cushman et al.,
1977; Ondetti et al., 1977). Structures of other metalloproteases have been
elucidated. Both leukotriene 4A hydrolase/aminopeptidase (Thunnissen et al.,
2002) and neutral endopeptidase or neprilysin (Oefner et al., 2000) have
catalytic sites that are notably similar to that of tACE.
The structure of neurolysin, a representative of the M3 family of
metallopeptidases, revealed an elliptical protein containing a narrow channel
that limits access to the active site (Brown et al., 2001). This discovery helped
to explain the size range restriction of neurolysin substrates. Like ACE,
neurolysin is able to hydrolyse a range of substrates, but its major
physiological substrate is the important neuropeptide neurotensin
(pELYQNKPRRPYIL), from which the C-terminal tripeptide is cleaved. Apart
from the zinc-binding motif, there is no significant sequence similarity between
neurolysin and ACE; however, the three-dimensional structures of the two
metalloproteases are quite similar (Acharya et al., 2003).
The structure of a carboxypeptidase from the extreme thermophile
Pyrococcus furiosus, was found to bear a striking resemblance to the
neurolysin structure, and therefore to tACE (Arndt et al., 2002). This enzyme
functions optimally at a temperature between 90°C and 100°C, and more
unusual is that it is inactive when zinc is bound to the active site, but shows

25
activity when various other metals, such as cobalt, are bound (Cheng et al.,
1999).
It appears that the overall architecture of the zinc metalloproteases allows for
a variety of conformations and diverse sequences for differing environments
and particular functions, with a premium conservation of the catalytic motif.
1.3.2. ACE structures – C-domain/tACE
Several crystal structures of angiotensin-converting enzyme and its
homologues have been solved recently. The following sections describe these
crystal structures. All the angiotensin-converting enzyme homologues
(truncated to exclude trans-membrane and intracellular domains in the case of
tACE and ACE2) have overall elliptical structures. The active site is contained
within a cavity or groove at or near the centre of the molecule.
1.3.2.1. Testis ACE (1o8a) and tACE–lisinopril (1o86)
Testis ACE was expressed and crystallised in the presence of an α-
glucosidase I inhibitor (Gordon et al., 2003). The three-dimensional structure
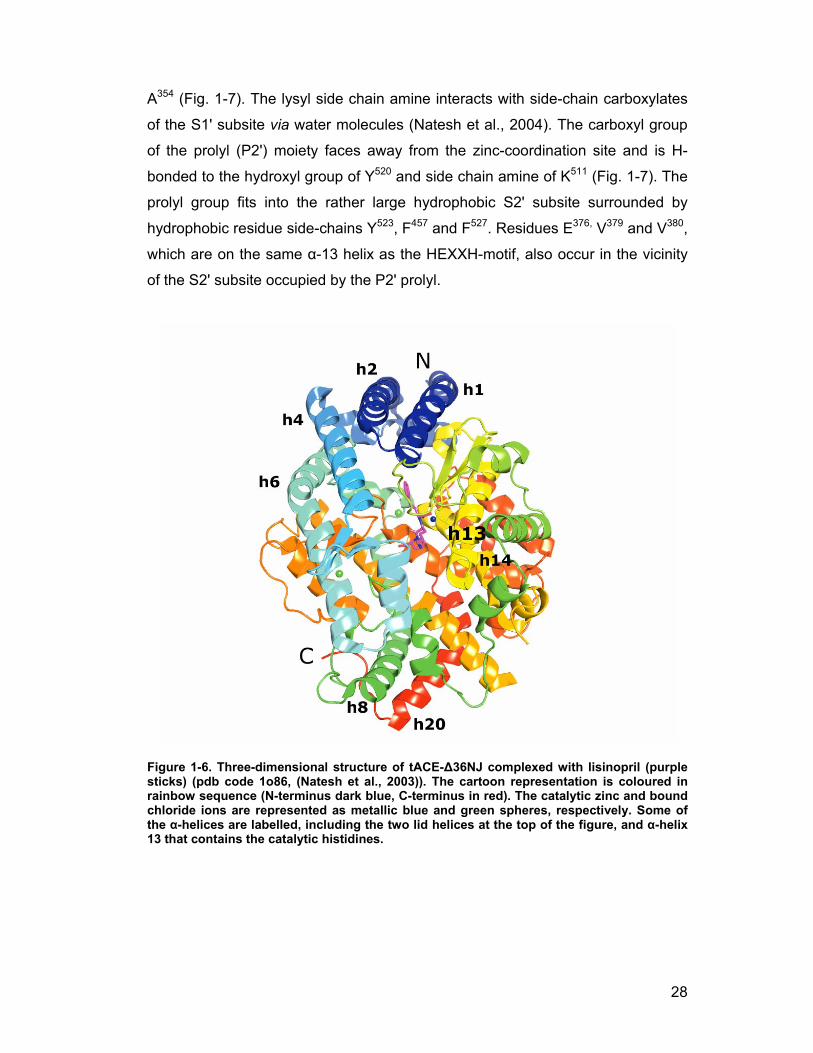
was determined by X-ray diffraction. The molecule is a predominantly helical
structure, with only a few short β-strands interrupting the dominant helices (20
α- and 7 310-helices) that are separated by short loops (Natesh et al., 2003)
(Fig. 1-5, Fig. 1-6). The α-helices 1 and 2 comprise the “top lid” at the N-
terminal end of the molecule, preventing access of large substrates to the
active site (Fig. 1-6). A central groove extending about 30 Å into the molecule
divides it into 2 sub-domains (Natesh et al., 2003).
26
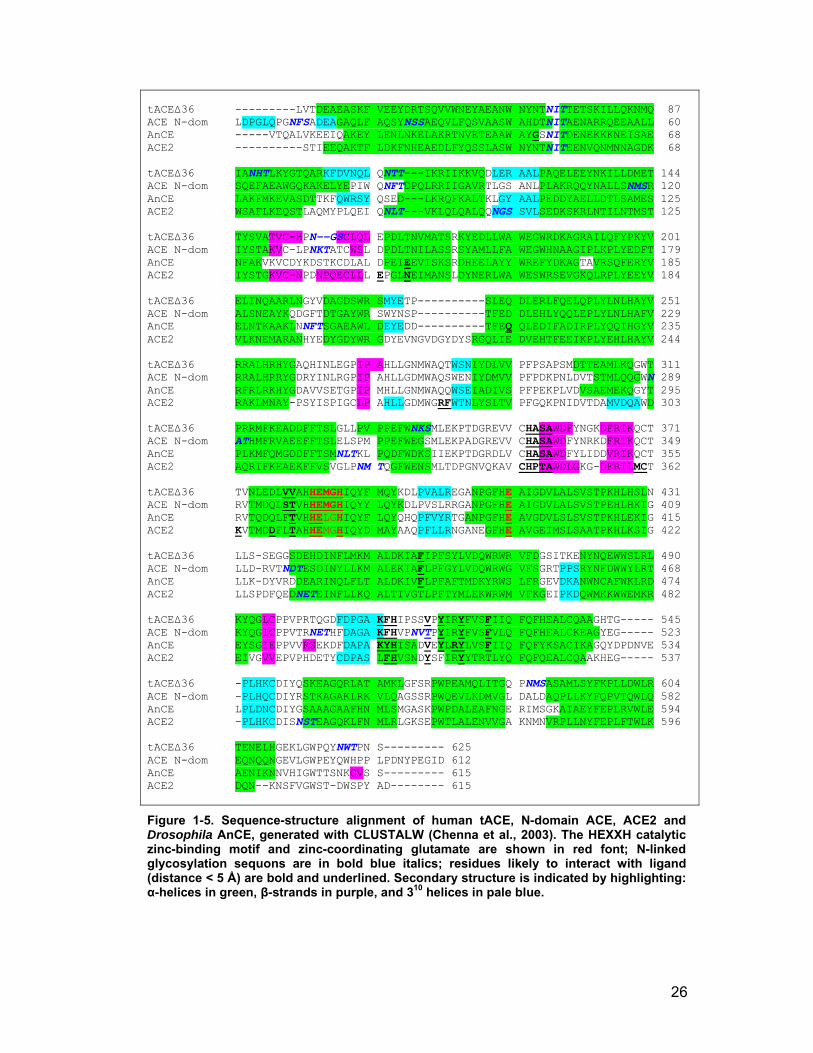
tACE∆36 ---------LVTDEAEASKF VEEYDRTSQVVWNEYAEANW NYNTNITTETSKILLQKNMQ 87 ACE N-dom LDPGLQPGNFSADEAGAQLF AQSYNSSAEQVLFQSVAASW AHDTNITAENARRQEEAALL 60 AnCE -----VTQALVKEEIQAKEY LENLNKELAKRTNVETEAAW AYGSNITDENEKKKNEISAE 68 ACE2 ----------STIEEQAKTF LDKFNHEAEDLFYQSSLASW NYNTNITEENVQNMNNAGDK 68 tACE∆36 IANHTLKYGTQARKFDVNQL QNTT---IKRIIKKVQDLER AALPAQELEEYNKILLDMET 144 ACE N-dom SQEFAEAWGQKAKELYEPIW QNFTDPQLRRIIGAVRTLGS ANLPLAKRQQYNALLSNMSR 120 AnCE LAKFMKEVASDTTKFQWRSY QSED---LKRQFKALTKLGY AALPEDDYAELLDTLSAMES 125 ACE2 WSAFLKEQSTLAQMYPLQEI QNLT---VKLQLQALQQNGS SVLSEDKSKRLNTILNTMST 125 tACE∆36 TYSVATVC-HPN--GSCLQL EPDLTNVMATSRKYEDLLWA WEGWRDKAGRAILQFYPKYV 201 ACE N-dom IYSTAKVC-LPNKTATCWSL DPDLTNILASSRSYAMLLFA WEGWHNAAGIPLKPLYEDFT 179 AnCE NFAKVKVCDYKDSTKCDLAL DPEIEEVISKSRDHEELAYY WREFYDKAGTAVRSQFERYV 185 ACE2 IYSTGKVC-NPDNPQECLLL EPGLNEIMANSLDYNERLWA WESWRSEVGKQLRPLYEEYV 184 tACE∆36 ELINQAARLNGYVDAGDSWR SMYETP----------SLEQ DLERLFQELQPLYLNLHAYV 251 ACE N-dom ALSNEAYKQDGFTDTGAYWR SWYNSP----------TFED DLEHLYQQLEPLYLNLHAFV 229 AnCE ELNTKAAKLNNFTSGAEAWL DEYEDD----------TFEQ QLEDIFADIRPLYQQIHGYV 235 ACE2 VLKNEMARANHYEDYGDYWR GDYEVNGVDGYDYSRGQLIE DVEHTFEEIKPLYEHLHAYV 244 tACE∆36 RRALHRHYGAQHINLEGPIP AHLLGNMWAQTWSNIYDLVV PFPSAPSMDTTEAMLKQGWT 311 ACE N-dom RRALHRRYGDRYINLRGPIP AHLLGDMWAQSWENIYDMVV PFPDKPNLDVTSTMLQQGWN 289 AnCE RFRLRKHYGDAVVSETGPIP MHLLGNMWAQQWSEIADIVS PFPEKPLVDVSAEMEKQGYT 295 ACE2 RAKLMNAY-PSYISPIGCLP AHLLGDMWGRFWTNLYSLTV PFGQKPNIDVTDAMVDQAWD 303 tACE∆36 PRRMFKEADDFFTSLGLLPV PPEFWNKSMLEKPTDGREVV CHASAWDFYNGKDFRIKQCT 371 ACE N-dom ATHMFRVAEEFFTSLELSPM PPEFWEGSMLEKPADGREVV CHASAWDFYNRKDFRIKQCT 349 AnCE PLKMFQMGDDFFTSMNLTKL PQDFWDKSIIEKPTDGRDLV CHASAWDFYLIDDVRIKQCT 355 ACE2 AQRIFKEAEKFFVSVGLPNM TQGFWENSMLTDPGNVQKAV CHPTAWDLGKG-DFRILMCT 362 tACE∆36 TVNLEDLVVAHHEMGHIQYF MQYKDLPVALREGANPGFHE AIGDVLALSVSTPKHLHSLN 431 ACE N-dom RVTMDQLSTVHHEMGHIQYY LQYKDLPVSLRRGANPGFHE AIGDVLALSVSTPEHLHKIG 409 AnCE RVTQDQLFTVHHELGHIQYF LQYQHQPFVYRTGANPGFHE AVGDVLSLSVSTPKHLEKIG 415 ACE2 KVTMDDFLTAHHEMGHIQYD MAYAAQPFLLRNGANEGFHE AVGEIMSLSAATPKHLKSIG 422 tACE∆36 LLS-SEGGSDEHDINFLMKM ALDKIAFIPFSYLVDQWRWR VFDGSITKENYNQEWWSLRL 490 ACE N-dom LLD-RVTNDTESDINYLLKM ALEKIAFLPFGYLVDQWRWG VFSGRTPPSRYNFDWWYLRT 468 AnCE LLK-DYVRDDEARINQLFLT ALDKIVFLPFAFTMDKYRWS LFRGEVDKANWNCAFWKLRD 474 ACE2 LLSPDFQEDNETEINFLLKQ ALTIVGTLPFTYMLEKWRWM VFKGEIPKDQWMKKWWEMKR 482 tACE∆36 KYQGLCPPVPRTQGDFDPGA KFHIPSSVPYIRYFVSFIIQ FQFHEALCQAAGHTG----- 545 ACE N-dom KYQGICPPVTRNETHFDAGA KFHVPNVTPYIRYFVSFVLQ FQFHEALCKEAGYEG----- 523 AnCE EYSGIEPPVVRSEKDFDAPA KYHISADVEYLRYLVSFIIQ FQFYKSACIKAGQYDPDNVE 534 ACE2 EIVGVVEPVPHDETYCDPAS LFHVSNDYSFIRYYTRTLYQ FQFQEALCQAAKHEG----- 537 tACE∆36 -PLHKCDIYQSKEAGQRLAT AMKLGFSRPWPEAMQLITGQ PNMSASAMLSYFKPLLDWLR 604 ACE N-dom -PLHQCDIYRSTKAGAKLRK VLQAGSSRPWQEVLKDMVGL DALDAQPLLKYFQPVTQWLQ 582 AnCE LPLDNCDIYGSAAAGAAFHN MLSMGASKPWPDALEAFNGE RIMSGKAIAEYFEPLRVWLE 594 ACE2 -PLHKCDISNSTEAGQKLFN MLRLGKSEPWTLALENVVGA KNMNVRPLLNYFEPLFTWLK 596 tACE∆36 TENELHGEKLGWPQYNWTPN S--------- 625 ACE N-dom EQNQQNGEVLGWPEYQWHPP LPDNYPEGID 612 AnCE AENIKNNVHIGWTTSNKCVS S--------- 615 ACE2 DQN--KNSFVGWST-DWSPY AD-------- 615
Figure 1-5. Sequence-structure alignment of human tACE, N-domain ACE, ACE2 and Drosophila AnCE, generated with CLUSTALW (Chenna et al., 2003). The HEXXH catalytic zinc-binding motif and zinc-coordinating glutamate are shown in red font; N-linked glycosylation sequons are in bold blue italics; residues likely to interact with ligand (distance < 5 Å) are bold and underlined. Secondary structure is indicated by highlighting: α-helices in green, β-strands in purple, and 310 helices in pale blue.
27
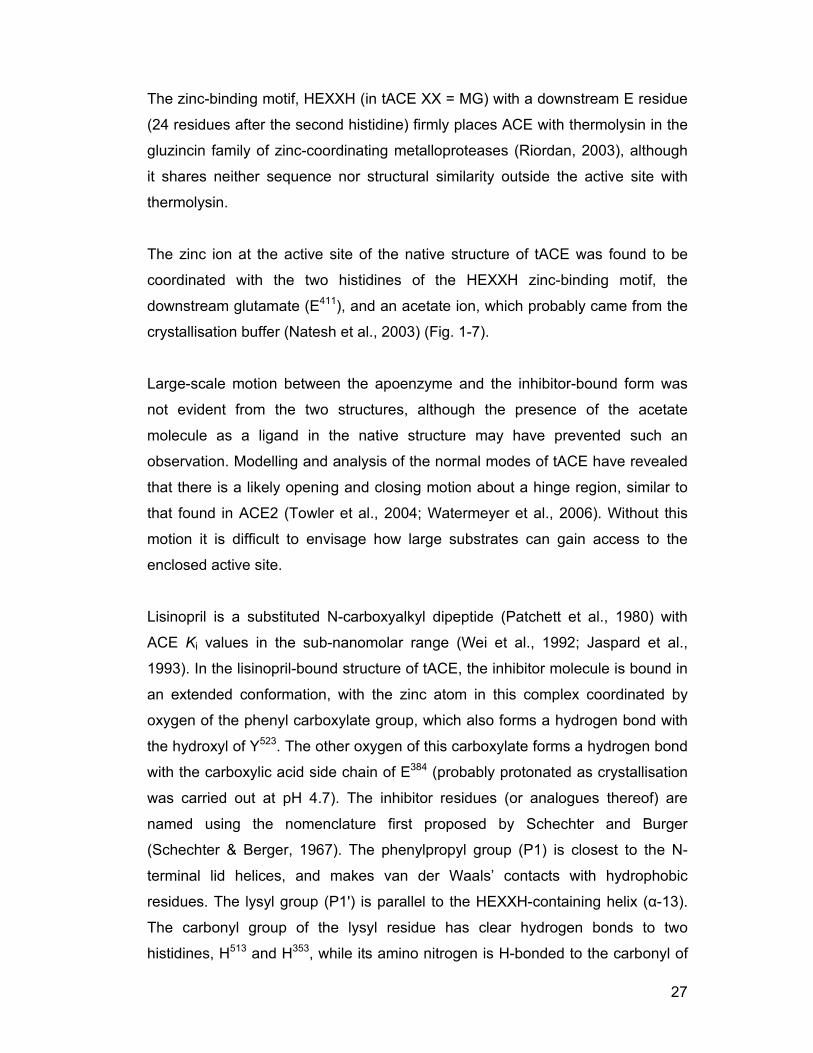
The zinc-binding motif, HEXXH (in tACE XX = MG) with a downstream E residue
(24 residues after the second histidine) firmly places ACE with thermolysin in the
gluzincin family of zinc-coordinating metalloproteases (Riordan, 2003), although
it shares neither sequence nor structural similarity outside the active site with
thermolysin.
The zinc ion at the active site of the native structure of tACE was found to be
coordinated with the two histidines of the HEXXH zinc-binding motif, the
downstream glutamate (E411), and an acetate ion, which probably came from the
crystallisation buffer (Natesh et al., 2003) (Fig. 1-7).
Large-scale motion between the apoenzyme and the inhibitor-bound form was
not evident from the two structures, although the presence of the acetate
molecule as a ligand in the native structure may have prevented such an
observation. Modelling and analysis of the normal modes of tACE have revealed
that there is a likely opening and closing motion about a hinge region, similar to
that found in ACE2 (Towler et al., 2004; Watermeyer et al., 2006). Without this
motion it is difficult to envisage how large substrates can gain access to the
enclosed active site.
Lisinopril is a substituted N-carboxyalkyl dipeptide (Patchett et al., 1980) with
ACE Ki values in the sub-nanomolar range (Wei et al., 1992; Jaspard et al.,
1993). In the lisinopril-bound structure of tACE, the inhibitor molecule is bound in
an extended conformation, with the zinc atom in this complex coordinated by
oxygen of the phenyl carboxylate group, which also forms a hydrogen bond with
the hydroxyl of Y523. The other oxygen of this carboxylate forms a hydrogen bond
with the carboxylic acid side chain of E384 (probably protonated as crystallisation
was carried out at pH 4.7). The inhibitor residues (or analogues thereof) are
named using the nomenclature first proposed by Schechter and Burger
(Schechter & Berger, 1967). The phenylpropyl group (P1) is closest to the N-
terminal lid helices, and makes van der Waals’ contacts with hydrophobic
residues. The lysyl group (P1') is parallel to the HEXXH-containing helix (α-13).
The carbonyl group of the lysyl residue has clear hydrogen bonds to two
histidines, H513 and H353, while its amino nitrogen is H-bonded to the carbonyl of
28
A354 (Fig. 1-7). The lysyl side chain amine interacts with side-chain carboxylates
of the S1' subsite via water molecules (Natesh et al., 2004). The carboxyl group
of the prolyl (P2') moiety faces away from the zinc-coordination site and is H-
bonded to the hydroxyl group of Y520 and side chain amine of K511 (Fig. 1-7). The
prolyl group fits into the rather large hydrophobic S2' subsite surrounded by
hydrophobic residue side-chains Y523, F457 and F527. Residues E376, V379 and V380,
which are on the same α-13 helix as the HEXXH-motif, also occur in the vicinity
of the S2' subsite occupied by the P2' prolyl.
Figure 1-6. Three-dimensional structure of tACE-∆36NJ complexed with lisinopril (purple sticks) (pdb code 1o86, (Natesh et al., 2003)). The cartoon representation is coloured in rainbow sequence (N-terminus dark blue, C-terminus in red). The catalytic zinc and bound chloride ions are represented as metallic blue and green spheres, respectively. Some of the α-helices are labelled, including the two lid helices at the top of the figure, and α-helix 13 that contains the catalytic histidines.

29
1.3.2.2. tACE–captopril (1uzf) & tACE-enalaprilat (1uze)
The structure of the same minimally glycosylated tACE complexed with captopril
has also been determined (Natesh et al., 2004). Captopril (D-3-mercapto-2-
methyl-propanoyl-L-proline) was one of the first inhibitors of angiotensin-
converting enzyme to be approved clinically and commercially marketed as an
antihypertensive drug (Cushman et al., 1977; Ondetti et al., 1977; Cushman &
Ondetti, 1980). It is one of the smaller ACE inhibitors available, occupying only
the zinc-binding site and the S1' and S2' subsites, but it binds very strongly with a
Ki in the nanomolar range (Cushman & Ondetti, 1980) for both domains (Wei et
al., 1992).
Figure 1-7. Alignment of ACE inhibitors lisinopril (orange), enalaprilat (purple) and captopril (blue) (structures from pdb files 1o86, 1uze and 1uzf, respectively). The enalaprilat is just visible as an almost-perfect superimposition on lisinopril. Active site residues and catalytic zinc (sphere) are taken from the native tACE structure (pdb code 1o8a).
The binding of the captopril molecule at the active site occurs via the sulphydryl
and the zinc ion. Since this is not a carboxyl (as in the case of lisinopril), there is
no additional coordination to Y523. As with lisinopril, the carbonyl group of the P1'
30
residue (alanine, in the case of captopril) coordinates with the histidines H353 and
H513. The C-terminal carboxylate has much the same coordination as lisinopril.
Because of its small size, the captopril molecule makes much less use of the
contacts available in the S1' and S2' subsites than inhibitors such as lisinopril,
and trandolaprilat.
Enalaprilat, a compound that is identical to lisinopril on the N-terminal side (i.e. at
the P1 group), has the binding interactions that would be expected of the P1
phenylpropyl, the phenylcarboxylate and the P1' carbonyl groups. Enalaprilat is
also identical to captopril on the C-terminal side (from the alanine side chain in
S1'), and so the same interactions are found.
1.3.3. ACE structures – N-domain
The N-domain of ACE has been found to have different substrate and inhibitor
selectivities and binding characteristics (described in the relevant sections).
Experimental structures of the ACE N-domain – the native form and in complex
with lisinopril – have been recently published (Corradi et al., 2006). Prior to this, a
number of groups attempted to predict the N-domain structure, based on the
structure of tACE (Tzakos et al., 2003; Fernandez et al., 2003) (see modelling
section).
The three-dimensional structure of the N-domain to 3 Å revealed a very similar
overall structure to the C-domain. Consistent with the knowledge that the N-
domain is less chloride-dependent (Wei et al., 1992) only one chloride ion
position was found in the structure, and this site corresponds to that of chloride II
in tACE. The largest N-terminal helices form a lid structure with closely
associated glycan residues, similar to that found in tACE. No conformation
difference was found between the apoenzyme and the liganded form, probably
for the same reason as with tACE – the presence of an acetate molecule in the
native enzyme active site. The differences between the N- and C-domain active
sites were found to be attributable not only to differing residues at corresponding
positions (Table 1), especially in the S1' and S2' sub-sites, but also due to slight
shifts in helical positions and residue side-chain orientations. For example, R350

31
of the N-domain might interfere with the lysyl group of bound lisinopril were it
orientated the same way as the corresponding T372 of tACE. This provides just a
hint that domain selectivity may involve the interplay of several levels of related
determinants, of which predicted conformational fit may be just one.
Table 1. Active site residues that differ between ACE N- and C-domains (Corradi et al., 2006).
S2 tACE/C-domain E403 F391 V518
N-domain R381 Y369 T496
S1 tACE/C-domain V518 S516 E143
N-domain T496 N494 S119
S1' tACE/C-domain E162 N277 S284 E372 N374 E376 D377 V380
N-domain D140 D255 E262 R350 T352 D354 N355 T358
S2' tACE/C-domain T282 S284 E376 V379 V380 D453
N-domain S260 D262 D354 S357 T358 E431
1.3.4. ACE crystal structures - Homologues
1.3.4.1. AnCE (D. melanogaster)
AnCE is a peptidyl dipeptidase with a similar substrate and inhibitor profile to
human ACE. It is understood to have roles in embryogenesis, metamorphosis
and reproduction in Drosophila (Houard et al., 1998; Siviter et al., 2002; Hurst et
al., 2003). It has three confirmed glycosylation sites, and is fully functional when
completely deglycosylated. Moreover, it has been shown that the glycosylation of
the enzyme is relevant to its intracellular protection and stability (Williams et al.,
1996).
Biochemical studies have indicated that AnCE may resemble the C-domain
rather than the N-domain of ACE. For example, the AnCE hydrolysis kinetics of
Ac-SDKP (a predominantly N-domain substrate) resemble those of the C-
domain, and the chloride dependence with Hip-HL as substrate is like that of the
C-domain (Williams et al., 1996). In addition, it appears to play a role in fertility

32
since knocking out the AnCE gene has a negative effect on fertility (Tatei et al.,
1995).
The structure of AnCE, a homologue of ACE found in Drosophila melanogaster,
was published soon after the tACE structure had been solved (Kim et al., 2003).
The structure of AnCE is overall similar to tACE in that it is globular, hydrophobic
and predominantly α-helical. AnCE shares just 42% sequence identity with tACE;
however this figure exceeds 70% in the areas around the active site of the
enzyme (for both tACE and the ACE N-domain) (Fig. 1-5). The catalytic residues,
structure (and presumably mechanism) are conserved between the two enzymes
(Williams et al., 1996; Brew, 2003; Kim et al., 2003).
Figure 1-8. The S1' pocket of ACE. N-domain (green, pdb code 2c6n) and tACE (blue, pdb code 1o86) aligned, with residues differing between domains labelled with appropriate colour. The two aligned lisinopril molecules are shown as thick sticks.

33
The structure of AnCE (Kim et al., 2003) revealed a large internal channel
running along the length of the entire molecule. As in tACE, the channel is
composed of two chambers of unequal size, with the catalytic zinc occurring at
the narrow segment between the two chambers.
The zinc ion in the native state is penta-coordinated to two water molecules, the
conserved histidines H383 and H387 (tACE numbering) and the downstream
glutamate E411 of the HEXXH…E gluzincin motif. By means of hydrogen bonding,
D415 coordinates the zinc indirectly via H383 (Kim et al., 2003). Captopril binds
AnCE with a similar nanomolar Ki to ACE. As with tACE, the sulphydryl group
binds to the zinc atom, completing the distorted tetrahedral geometry with the
active site histidines and glutamate. The carbonyl of the alanyl (P1') residue
coordinates with two other histidines, H353 and H513, as well as with Y523. The
carboxyl group of the P2' proline residue is held by hydrogen bonds and ionic
interactions with Q281, K511 and Y520. All of these are conserved in both domains
of sACE. It has been proposed that this “locking mechanism” restricts ACE to
dipeptidase activity, except in the case of substrates that are amidated at the C-
terminus (Kim et al., 2003). ACE can release the C-terminal tripeptide from such
substrates, for example substance P and GnRH (Erdos & Skidgel, 1987; Ehlers
& Riordan, 1989), suggesting that the peptide substrate slips in the absence of
sufficient bonds to hold the carboxy group firmly in place (Kim et al., 2003).
Lisinopril binds to AnCE with a Ki of 18nM (cf. lisinopril-binding to tACE:
Ki=0.2nM) (Williams et al., 1996; Kim et al., 2003). There is a similar penta-
coordination found in this complex as in the enalaprilat complex, with the two
oxygens of the carboxylic group coordinating zinc with the active site histidines
and glutamate. The phenyl group is extended towards the N-terminal lid of the
enzyme, and interestingly occurs close (3.78 Å) to an arginine residue (which
was expected to be glycine, based on the enzyme sequence). This non-ideal
association may partly explain the reduced lisinopril affinity of AnCE compared to
tACE. The same main chain coordination occurs with lysyl in lisinopril as with
alanyl in enalaprilat. The lysine side chain has water-mediated hydrogen bonds
with T364 and D360, which are V380 and E376 in tACE, and ionic interactions with
34
D360, D146 and E150. These correspond to E376, E162 and T166 in tACE (Fig. 1-5),
and are thus conservative changes.
Interestingly, though V380 is usually considered to play a role in the binding of the
substrate via the S2' pocket, it appears that the side chain may have freedom to
swing round to form part of the S1' pocket (Fig. 1-8).
1.3.4.2. ACE2 (Homo sapiens)
The ACE2 protein is a human homologue of ACE that has been found to play a
crucial role in the regulation of heart function (Crackower et al., 2002; Danilczyk
et al., 2003; Oudit et al., 2003). The ACE2 structure was determined in the
absence and presence of a specific inhibitor, MLN-4760 ((S,S)-2-{1-carboxy-2-[3-
(3,5-dichlorobenzyl)-3H-imidazol4-yl]-ethylamino}-4-methylpentanoic acid)
(Towler et al., 2004). Like the tACE structure, the enzyme can be divided into two
sub-domains between which runs the deep cleft in which the substrate binds. In
the case of ACE2, the substrate binds at the bottom of this cleft – the cleft does
not run through the entire molecule length. The two structures suggested the
occurrence of a significant hinge-bending motion between the two subdomains
on the binding of the inhibitor (or also, presumably, substrate).
The absence of an apparent similar hinge-bending motion between the unbound
and ligand-bound tACE (Natesh et al., 2003) has been suggested to be an
artifact of the experimental conditions of the crystallisation process. The native
structure, determined using tACE with no substrate nor inhibitor, does not have
an unoccupied active site: there appears to be an acetate molecule coordinated
to the zinc, as well as an unknown molecule modelled as an N-carboxyalanine.
These two molecules, bound in an orientation analogous to the inhibitor lisinopril,
can be considered ligands of the native structure, and therefore preventing a true
view of the unbound tACE (Towler et al., 2004).

35
Figure 1-9. Alignment of tACE and ACE2 showing how the S2' site is occluded by R273 in ACE2. The tACE active site surface is shown in white/pale grey, along with some active site residues (lines, white C atoms) and lisinopril (sticks, orange C atoms). ACE2 residues have green C atoms. The clash between R273 and the C-terminal carboxylate of lisinopril indicates clearly why tACE inhibitors are ineffective against ACE2.
The ACE2 and tACE structures are readily superimposable (r.m.s.d. = 1.80 Å)
(Towler et al., 2004). At the active site, many residues are conserved; however,
there are significant differences, some of which can be understood to contribute
to the difference in function and specificity of the enzymes. For example, R273 in
ACE2 stabilises the C-terminal carboxylate of the inhibitor MLN-4760 in the S1'
position. This residue is replaced by a glutamine in tACE (Q281), which also
coordinates the C-terminal carboxylate of substrate or inhibitor (at S2' of the
enzyme). The much greater size of the arginine residue in ACE2 (compared to
glutamine in tACE) means that the potential S2' pocket in ACE2 is occluded, as
shown in superimposition of tACE and ACE2 active sites (Fig. 1-9). This offers a
good explanation for the carboxypeptidase activity of ACE2, as opposed to the

36
peptidyl dipeptidase cleavage by tACE (Crackower et al., 2002; Oudit et al.,
2003). This change in the geometry of the S2' pocket also accounts for the
ineffectiveness of tACE inhibitors against ACE2 (Tipnis et al., 2000; Towler et al.,
2004).
1.3.5. In silico modelling structures
1.3.5.1. Background
Over the past three decades there have been rapid improvements in computer
processing capacity and abilities to map chemical and conformational space.
These have enabled the generation of reasonable models of enzymes and
enzyme-inhibitor complexes based on experimentally determined structures and
prior databases of chemical interactions and parameters.
The conformations of inhibitors at the active site of ACE were predicted nearly
two decades ago using available data from the structures of several known active
inhibitors (Mayer et al., 1987). Recently, it was shown that the active site model
prediction was indeed highly accurate, when compared to the published ACE-
inhibitor complex structures (pdb codes 1o86, 1uze, 1uzf – ACE-lisinopril, -
enalaprilat and -captopril, respectively). It was suggested to be the earliest
example of such validation, and exemplified in support of the methodology of
active site mapping using known active analogues/inhibitors. Active site mapping
is a most useful approach in the absence of three-dimensional structural
information about a protein target. If a set of inhibitors of sufficient chemical
diversity has been characterised, then important geometric parameters of the
active site can be accurately estimated. This is based on the assumption of the
narrow geometric constraints present at active sites, enabling substrates to be
held in particular conformation for catalysis (Kuster & Marshall, 2005).
The development of numerous software applications specific to biological
macromolecules has resulted in the rapid growth and progress of the field of
molecular modelling. CLUSTALW is an example of a program that allows

37
alignment of protein domains with high homology (Chenna et al., 2003) (Fig. 1-5).
Software applications such as MODELER (Sali & Blundell, 1993) or CHARMM
(Brooks et al., 1983), can be used to construct models of the sample protein
based on its sequence and determined similarity to a template. In the case of
docking of small molecules – typically inhibitors – there are many software suites,
such as AutoDock (Goodsell et al., 1996) and ZDOCK (Chen et al., 2003), that
facilitate (amongst other things) the creation, and docking of molecules into
macromolecules, and subsequent refinement of the interaction between them.
1.3.5.2. ACE-inhibitor docking and modelling
Various docking software suites have been employed to support or rationalise
experimentally determined inhibition data, or to motivate for the modification of
well-established inhibitors in order to promote domain selectivity. In this quest the
Accelrys package INSIGHT II (Accelrys, San Diego CA, USA) has been used
successfully in our laboratory in modelling the conformations of various inhibitors
bound to the active sites of ACE (Nchinda et al., 2006a, 2006b). Other groups
have used CHARMM (Brooks et al., 1983) to surmise about the interactions of
the C-domain selective RXPA380 with ACE (Georgiadis et al., 2004) and
MODELER (Sali & Blundell, 1993; Marti-Renom et al., 2000) to achieve results
that have provided molecular insights into the determinants of selectivity in the
binding of a range of current and potential clinical inhibitors of ACE (Tzakos &
Gerothanassis, 2005).
1.3.5.3. ACE N-domain docking and modelling
The model of ACE N-domain bound to lisinopril indicated a similar binding
structure for the two ACE domains (Fernandez et al., 2003). The zinc ion is
penta-coordinated to the conserved active-site histidines and glutamate, as well
as the carboxylate oxygens of the inhibitor or substrate. The glutamate residue
occurring in the active site HEXXH motif (E362, standard N-domain numbering

38
according to Corradi et al. (2006)) plays a role in coordinating the catalytically
important water molecule (water385), as well as the lisinopril carboxylate.
As in the C-domain crystal structures, the P1 phenyl group interacts via aromatic
stacking with the side chain of F490 (corresponding to F512 in tACE). The lysyl
main chain amine binds the carbonyl of an alanine residue; the prolyl side chain
fits easily in the large hydrophobic S2' pocket, while its carboxylate is coordinated
to K489 (K511) and Y498 (Y520). The major differences occur in the binding of the
lysyl side chain, where the D377 and E162 of tACE are replaced by Q355, D354 and
D140 (Fig. 1-8). The distance between lysyl and side chains is greater, so these
interactions are likely water-mediated (Fernandez et al., 2003).
From their structure, Tzakos et al. (2003) also speculated that a series of
significant residue changes in the S1 and particularly S1' pockets may contribute
significantly to the substrate and inhibitor specificities. In addition they found a
more positively charged binding groove for N-domain, based on surface potential
calculations.
1.3.5.4. C-domain ACE-inhibitor models
Although the crystallisation and structure determination of ACE complexed with
three inhibitors has been demonstrated, it has so far proved to be a difficult
procedure to reproduce. It must also be noted that at least 17 ACE inhibitors
have been approved for clinical use (Zaman et al., 2002). Therefore details of the
mode of binding have only been elucidated for a small fraction of commercially
available inhibitors. It is expected that such detailed information would be
particularly useful in the modification of current inhibitors in the quest to obtain
domain-selective inhibitors – it would allow the delineation of the factors to be
exploited in order to attain domain selectivity. Understanding these factors can
guide the design of second-generation domain-selective inhibitors.
With this in mind, Tzakos and Gerothanassis (2005) have determined the binding
modes of a number of ACE inhibitors in complex with both the C-domain and the

39
N-domain (generated using MODELER). The results for the calculated complex
of C-domain ACE and lisinopril agreed well with the experimentally determined
structure, giving credence to the results for the other docked structures.
1.4. Rationale of the Study
1.4.1. Domain-selective inhibition
Most commercially available inhibitors were designed before the discovery of the
two domains, and have turned out to be efficient at inhibiting both domains to
roughly similar extents.
Since the discovery of the two domains of ACE, studies that have strongly
suggested that C-domain inhibition is both necessary and sufficient to produce
an anti-hypertensive effect have encouraged investigations into the development
of C-domain selective inhibitors. For example, Bernstein and others have shown
in mice that the N-domain alone cannot restore low blood pressure to normal
levels (Esther et al., 1997), while the administration of an N-domain specific
inhibitor, RXP407, had little effect on angiotensin hydrolysis by sACE (Dive et al.,
1999; Junot et al., 2001). Furthermore, C-domain-selective inhibition will allow
BK degradation by N-domain, preventing BK accumulation seen in angioedema.
Finally, because BK potentiation via B2 receptor resensitisation is highest when
both domains are inhibited, an inhibitor targeting the C-domain may have a lower
proclivity for excessive BK stimulation (Acharya et al., 2003).
1.4.2. Structural determinants of selectivity
The lysyl side chain of lisinopril makes contact with acidic residues in the S1'
pocket. The S1' pocket does not appear to be of major importance for domain
selectivity, for the following reasons. Lisinopril is roughly equally effective against
both domains. In addition, the S1' residues are moderately conserved between
C- and N-domains: D377Q and E162D. Inhibitors such as RXPA380 have been

40
developed with special consideration given to S2' pocket-based (C-domain)
selectivity (Acharya et al., 2003; Georgiadis et al., 2004). Trandolaprilat, whose
design (before the discovery of the two-domain nature of ACE) was based on
enalaprilat, also has a bulky aromatic group (indole ring) at its P2' position, and
this inhibitor was also found to be moderately C-domain selective (Wei et al.,
1992).
The inhibitor RXP407 demonstrated a 1000-fold selectivity for the N-domain,
while RXPA380 has shown a 3300-fold selectivity for the C-domain (Dive et al.,
1999; Junot et al., 2001; Georgiadis et al., 2003; Georgiadis et al., 2004).
The remarkable selectivity of RXPA380 seems to have its basis in the
interactions with the enzyme that occur in the P2' position, occupied by a
tryptophan residue (Fig. 1-10). Mere replacement of the tryptophan side chain
with a methyl group or pseudo-arginine (to form the analogue Compounds 8 and
11, respectively) reduced selectivity in both cases from 3300-fold to 22-fold, fully
two orders of magnitude. The analogue Compound 9, with methyl groups at both
P1' and P2', despite showing high affinity for ACE, exhibits no selectivity
whatsoever. Furthermore, the carboxybenzyl moiety that occupies the S2 pocket
of the enzyme appears important for binding, but does not seem to play a direct
role in the selectivity of the inhibitor, as modifications of inhibitor structure at the
P1' and P2' positions appear sufficient to eliminate or enhance C-domain
selectivity (Georgiadis et al., 2004).

41
Figure 1-10. Prediction of S2' pocket configuration by Georgiadis et al. Of the 12 residues predicted to be within 5 Å of RXPA380 tryptophan side chain, D415 and F460 are not shown. K511 is shown for clarity(Georgiadis et al., 2004).
Modelling of RXPA380 docked into the active site of tACE-lisinopril structure
(replacing lisinopril) has suggested that the interactions of the tryptophan at P2'
are specifically critical to selectivity. The lysine residue at P1' in lisinopril of the
tACE-lisinopril structure (1o8a) has been found to have unusual phi and psi
angles that are in fact typical for a proline residue. This observation is supported
by the ease with which the pseudo-proline at P1' in RXPA380 is modelled – the
two residues correspond closely. The interactions of the pseudo-proline are with
A354 and H353, which come from a highly conserved region of ACE, and therefore
it appears that these interactions cannot explain domain selectivity.
On the other hand, of twelve residues defined by Georgiadis et al (2004) as
comprising the S2' subsite, five differ between N-domain and tACE [C-domain].

42
The major differences are the replacements of hydrophobic valines V379 and V380
by serine and threonine, respectively, and the conversion of acidic residues –
E376D and D453E. These changes may sterically interrupt the possible H-bond
interaction between the nitrogen of the indole ring of the P2' tryptophan and the
D453 carboxylate in tACE.
1.4.3. Project Aims
Although these findings provide some explanations, further structural data are
required in order to gain definitive insights into the interactions mediating such
selectivity, and these data may even point to mechanisms associated with the
selectivity. There are at least two currently tractable ways to achieve these
insights: co-crystallisation of RXPA380 with tACE or the C-domain of ACE, or
structural determination of a tACE [C-domain] mutant containing N-domain
residues in the key positions, preferably co-crystallised with lisinopril or
RXPA380. We have adopted the former approach, and expect this to shed light
on the factors determining selectivity in the C-domain.
Therefore the aims of this project are:
1. Determination of the conditions that are conducive to the production of
diffraction-quality and -size crystals of minimally glycosylated tACE-
inhibitor complexes;
2. Co-crystallisation of tACE with the C-domain-selective inhibitor RXPA380,
X-ray diffraction data collection, and solution and refinement of the
structure of tACE complexed with RXPA380;
3. Modelling in silico of the tACE–RXPA380 interaction for comparison of the
modelled interactions with those in the crystal structure.

43
2. MATERIALS AND METHODS

44
2.1. Protein expression
Testis ACE (tACE) mutants with reduced glycosylation were previously
produced by site-directed mutagenesis and stably transfected into Chinese
Hamster Ovary (CHO) cells (Gordon et al., 2003). The mutants used in this
work were the tACE-g13 and tACE-g3 mutants, which have only two (1st and
3rd) and one (3rd) glycosylation sequons intact, respectively. CHO cells were
cultured in medium composed of equal amounts of Dulbecco’s Modified Eagle
Medium (DMEM) and Ham’s F12 (Highveld Biological, Lyndhurst, RSA), 2%
foetal calf serum (Gibco BRL, Life Technologies, UK), and 0.02M HEPES as
described previously (Ehlers et al., 1991a). The medium was harvested at ~3
day intervals for 14-16 days after the first induction with ZnCl2. After the first
two passages with 2% FCS medium some of the T150 flasks were exposed to
2% FCS medium containing the α-glucosidase I inhibitor N-
butyldeoxynojirimycin (NBDNJ). The bulk of the medium was stored at -20°C,
with 1 mL aliquots removed in order to carry out ACE activity assays.
2.2. Purification by affinity chromatography
Medium containing tACE-g13 mutant protein was passed over a lisinopril-
Sepharose affinity column at a rate of 1.1 mL/min using a Gilson Minipuls2
pump (Villiers-le-Bel, France). The entire flow-through was retained and
assayed for ACE activity. The column was washed overnight with wash buffer
(20 mM Hepes, pH 7.5 containing 0.3 M NaCl) and eluted with 50 mM sodium
borate (pH 9.5). An in-line spectrometer (D-Star Instruments, VA, USA)
measured absorbance of the eluted fractions at a wavelength of 280 nm.
2.3. Enzyme activity assays
The eluted fractions were pooled and dialysed against 5 mM HEPES pH 7.5
containing protease inhibitor (0.1 mM PMSF, Roche Diag. GmBH, Germany)
for 24-36 hours.

45
The enzyme activity of the dialysate was measured using hippuryl-histidyl
leucine (HHL) as substrate (Friedland & Silverstein, 1976). Briefly, dialysate
aliquots were incubated at 37°C for 15 minutes with the substrate HHL. The
reaction was stopped by placing the tubes on ice and adding 750 µL of 0.28 M
NaOH. 50 µL of 8 mM o-phthaldialdehyde was added, and the sample was
left for 10 min to allow formation of the fluorescent adduct from the reaction
between the o-phthaldialdehyde and the primary amine of the histidyl moiety
of HL that results from ACE activity.
The dialysate (or aliquot of each fraction, or of harvested medium) was diluted
appropriately so that the fluorescence reading would fall within the acceptable
detection range. In the case of the medium activity assays, five- or ten-fold
dilutions were carried out in order to minimise the effect of quenching of the
fluorescence signal due to the presence of many other proteins and other
organic material in the harvested medium samples.
2.4. Protein concentration
A 4mL volume ultracentrifuge tube (Millipore, MA, USA) was washed with
5mM HEPES. The dialysate was placed into the tube over the filter, and
centrifuged at 4500 × g until the desired concentration was reached. The
protein content was determined using a standard Bradford assay (BioRad
Laboratories GmbH, Germany). The concentrated ACE was stored at 4°C. To
check the purity of the concentrated enzyme, between 3 µg and 20 µg of the
sample was electrophoresed on 10% SDS-PAGE.
2.5. Crystallisation
2.5.1. General crystallisation conditions
Crystallisation (or reservoir) buffer was prepared as done previously (Gordon
et al., 2003; Watermeyer et al., 2006). The buffer solution consisted of 15%
polyethylene glycol (PEG) 4000 (Fluka Chemie GmbH, Switzerland), 50 mM
46
hydrated sodium acetate (Merck, Darmstadt, Germany), and 10 µM hydrated
zinc sulphate. The pH of the buffer was adjusted to between 4.4 and 5.0 with
HCl and NaOH using a Beckman pH machine (Beckman, Irvine CA, USA).
The buffer was filter-sterilised (0.22 µm filter) and stored at 4°C.
Typically, drops of volume 4 µL were placed onto each cover slip (2 µL protein
or (protein + inhibitor) mixed into 2 µL reservoir buffer) and inverted over a 1
mL reservoir buffer volume (the hanging drop method). This was optionally
overlaid with 0.5 mL of a 1:1 mixture of silicon:paraffin oils (Hampton
Research, Aliso Viejo CA, USA).
Crystallisation trials were set up at an ambient temperature of 18-21°C in an
attempt to minimise condensation on the cover slips. Plates were placed in a
low-temperature incubator (United Scientific, Cape Town, RSA) at 16°C, atop
three layers of packing foam (~4 cm total thickness) in order to minimise
interference with crystal formation by vibrations of the incubator.
2.5.2. Initial tACE-g13–RXPA380 co-crystallisation conditions
The range of inhibitor concentrations used initially was such that a final (in-
drop) concentration of between 3 nM and 1 µM was used in the crystallisation
trials. The final in-drop protein concentration was either ~0.75 mg/mL or ~1.65
mg/mL, which correspond to approximately 10.5 µM and 23 µM, respectively.
2.5.3. Final tACE-g13–RXPA380 co-crystallisation conditions
Crystals of native tACE-g13 (the original in-drop concentration was 1.65
mg/mL) were dissolved by transferring the cover slip to a well containing only
distilled water. After 24 hours, 1 µL of 0.46 mM RXPA380 was added to the 4
µL, drop. This resulted in an effective concentration of ~0.1 mM of the
inhibitor. The cover slip was then re-transferred to the well containing the
appropriate reservoir buffer, as before.
47
2.6. Data collection and processing
Crystals were visually inspected for quality, and their dimensions were
measured using an in-lens graticule on a stereomicroscope (Leica
Microsystems, Wetzlar, Germany). Images were acquired on a Leica Z16
APO (KLI500 LCD) stereomicroscope connected to a computer, using the
IM500 program (Leica Microsystems, Wetzlar, Germany).
2.6.1. In-house data collection and processing
Preliminary diffraction data from the best crystal produced using the initial co-
crystallisation conditions were collected on the in-house X-ray diffraction
machine at the University of Western Cape, South Africa. The X-ray diffraction
machine consists of a Rigaku RUH3R copper rotating-anode X-ray source
operated at 40 kV, 22 mA; a Rigaku R-axis IV+ image plate camera (Rigaku
MSC, Tokyo, Japan); an X-stream 2000 low-temperature system (Rigaku
MSC, Houston TX, USA); and an AXCO PX50 glass capillary optic with a 0.1
mm focus (Australian X-Ray Capillary Optics, Parkville VIC, Australia).
Images were collected between 0° and 180°, with an oscillation angle of 0.5°
per frame, to make a total of 360 data frames. The exposure time for each
frame was 600 s. The detector-to-crystal distance was set at 100 mm, and
later refined to 102 mm.
The image frames collected were indexed and integrated with Denzo and
scaled and merged with SCALEPACK (Otwinowski & Minor, 1997). Molecular
replacement using EPMR v2.5 (Kissinger et al., 1999) and the structure of
native tACE-g13 (Watermeyer et al., 2006) as starting model was carried out
to obtain an initial model with phases. Data in the resolution range 15 – 4 Å
were used in the evolutionary search procedure.

48
Model refinement was carried out using input scripts (modified as required) of
the Crystallography and NMR System (CNS) v1.1 (Brunger et al., 1998).
2.6.2. Synchrotron data collection and processing
Testis ACE-g13–RXPA380 co-crystals, produced using the final co-
crystallisation conditions, were transported in trays to the European
Synchrotron Radiation Facility (ESRF) at Grenoble, France. The crystals were
observed again under a microscope to ensure that there had been no loss or
damage in transit. The selected crystal was picked and soaked briefly in a
mixture containing 80% reservoir buffer and 20% glycerol, acting as
cryoprotectant. Each crystal was then placed in a special labelled vial
containing liquid nitrogen. Ten of these vials were slotted into a cartridge (or
“puck”) for storing the crystals within the microdiffractometer.
Diffraction data were collected on the BM14-UK beamline at ESRF, using
radiation of wavelength of 1.033 Å with maximum intensity of ~7.5 × 10¹¹
photons. The beam had a focal area of 0.25 mm2. Diffraction images were
recorded on the MARMOSAIC225 charge-coupled detector, and had an area
of 225 mm × 225 mm. Images were collected between 0° and 144° with an
oscillation angle of 1.0° per frame, to make a total of 144 data frames. The
exposure time for each frame was 40 s. The detector distance was set at
193.8 mm.
The image frames collected were indexed, integrated, scaled and merged
with HKL2000 (Otwinowski & Minor, 1997). Molecular replacement using
EPMR v2.5 (Kissinger et al., 1999) was carried out to obtain an initial model
with phases. The structure of native tACE-g13 (Watermeyer et al., 2006) was
used as a starting model. Data in the resolution range 15 – 4 Å were used in
the evolutionary search procedure.

49
2.7. Structure refinement Model refinement was carried out using input scripts (modified as required) of
CNS v1.1 (Brunger et al., 1998). An initial B-factor correction was employed in
each refinement round, with a low-resolution limit of 6.0 Å. A general bulk
solvent correction was also automatically determined and used. Coordinate
minimisation was carried out using a maximum likelihood target with structure
factor amplitudes. A relative weighting for the X-ray term was automatically
determined and applied. An automatic weighting term was also applied during
B-factor minimisation.
Difference Fobs –Fcalc and 2Fobs –Fcalc maps were calculated using coefficients
calculated from sigmaa weighting. A test set of 776 reflections (3.7% of the
total) was excluded from all refinements, and was used to calculate the Rfree
statistic. Inspection of maps and models and model building was all carried
out in O (v10.0) (Jones et al., 1990).
After the first round of refinement, the program Mapman (Kleywegt & Jones,
1996) was used to locate the zinc and chloride ion peaks. These locations
were confirmed by inspection in O. Group B-factors were refined (with each
residue treated as two parts, main chain and side chain). Water molecules
were added gradually to the model with Mapman and generally searching for
peaks above 4σ in the Fobs –Fcalc map. These were confirmed or added to
using the CNS script water_pick.inp, and checked in O, by ensuring that
reasonable hydrogen bond donors and acceptors were available to the
putative waters. In later rounds of refinement some peaks above 3σ and 2.5σ
were also used.
In order to obtain coordinates for the glycan residues, a Cα-alignment of the
model to a complete native tACE-g13 structure was made. Glycan residues at
N72 (g1, one glycan) and N109 (g3, up to five glycans) were then adjusted to fit
the observable difference density. Later on in refinement, the glycan at N72
and one of the outermost glycan residues at N109 (a mannose) were removed

50
because of unclear density and very high B-factors suggesting only partial
occupancy or a high degree of flexibility.
The inhibitor RXPA380 (Georgiadis et al., 2004) was built from the available
chemical structure and stereochemical details using the ProDRG server
(Schuttelkopf & van Aalten, 2004). The server also generated the molecule’s
topology and parameter files for use in CNS, and minimised the structure for
the first manual “docking” into the active site. The minimised structure was
then manually placed into the active site using tools in O. Permitted torsion
angles of the molecule were adjusted in order to fit the electron density as
seen in the difference map.
In subsequent model building the cis- and trans- conformations of the peptide
bonds were checked, although the peptide torsion angles were not altered.
The inhibitor was fitted until no positive peaks above 1.8σ in the Fobs –Fcalc
map remained, and no significant negative density peaks (indicating atoms in
the model not accounted for by the density map) were discernible.
The cycles of refinement were concluded when they resulted in no further
substantial improvements in the map phasing and no further decrease in both
the Rfree and Rcryst.
2.8. Structure validation and analysis The MolProbity server was used to switch asparagine, glutamine and histidine
side chains by 180° where the analysis of nearby contacts and hydrogen
bonding network supported such a switch (Davis et al., 2004).
Ramachandran, rotamer and Cβ plots were also generated and checked.
PROCHECK was used to generate Ramachandran plots and other
stereochemical plots that give indication of the quality of the model
(Laskowski et al., 1993).
Alignments of the ACE-RXPA380 model with previously determined structures
were carried out using PyMOL (DeLano, 2002).
51
The CASTp server was used to calculate the volume of the active site cavity
in tACE-g13–RXPA380 with a probe size of 2.5 Å (Binkowski et al., 2003).
This was compared with the N-domain structure.
2.9. Modelling: Docking and molecular dynamics of RXPA380 in active site of
tACE
Files of the testis ACE complexed with lisinopril (1o86.pdb) and of the N-
domain complexed with lisinopril (2c6n.pdb) were used as the starting points.
These were accessed and processed on a Silicon Graphics (SG) Octane
workstation (Silicon Graphics, Mountain View, CA, USA) using INSIGHT II
version 2000 (Accelrys, San Diego, CA, USA).
Files were prepared for cycles of energy minimisation and dynamics by
appropriate adjustment using the Builder module of INSIGHT II. Atom
hybridisation and potential values were set appropriately. The consistent
valence force field (CVFF, filename cvff.frc) was applied. Because INSIGHT II
is not set up to recognise and incorporate the Zn2+ in its calculations, an
appropriate substitute ion was chosen – Mg2+. In order to fix its position, the
active site cation was bonded to the coordinating histidines, H383 and H387.
The phosphinate inhibitor RXPA380 (Dive et al., 1999; Dive et al., 2004) was
built into the active site with lisinopril as the starting template and using the
INSIGHT II Builder module. Measure functions in the Viewer module were
used to identify probable steric clashes between new inhibitor structures and
the protein. The inhibitor moieties were then manually adjusted so as to be in
as sterically favorable orientations as possible.
The inhibitor and metalloprotease were combined into a single assembly for
the molecular modelling steps. The Discover_3 module was used for all
energy minimisation and molecular dynamics steps. The protocol used was
the following:

52
2000 steps of Polak-Ribiere conjugate gradient minimisation
2000 cycles of molecular dynamics using Velocity-Verlet integration
method (time-step = 1 fs)
Compilation of a history of the configurations at an interval of 10 cycles,
i.e. 200 frames
Determination of average conformation from history trajectory;
3000 steps of Polak-Ribiere conjugate gradient minimisation applied to
this average conformation.
All experiments were carried out at constant volume (NVT), at a constant
temperature of 300 K, with a dielectric constant of 1, and in vacuo. Water
molecules were also excluded. The non-bonded cut-off for molecular
dynamics was 9.5 Å (Nchinda et al., 2006a, 2006b).
The output conformation was written out to a pdb file for further analysis.
Ramachandran plots were drawn using MolProbity (Davis et al., 2004) and
PROCHECK (Laskowski et al., 1993). To aid with evaluation, these were
compared to corresponding analyses of tACE–lisinopril (pdb code 1o86) and
ACE N-domain–lisinopril (2c6n) (for C- and N-domains, respectively). An all-
molecule Cαalignment to the ACE C-domain (1o86) was then carried out and
a r.m.s.d. value was calculated. An active-site alignment, using the 20 active
site residues within 5 Å of lisinopril in the PDB structure, was also carried out
in order to provide a comparable illustration of the inhibitors bound in the
active site. All alignments and molecular figures were generated using PyMOL
(DeLano, 2002).
The key residues surrounding the inhibitor side chain groups at each subsite
were consequently determined.

53
3. RESULTS AND DISCUSSION
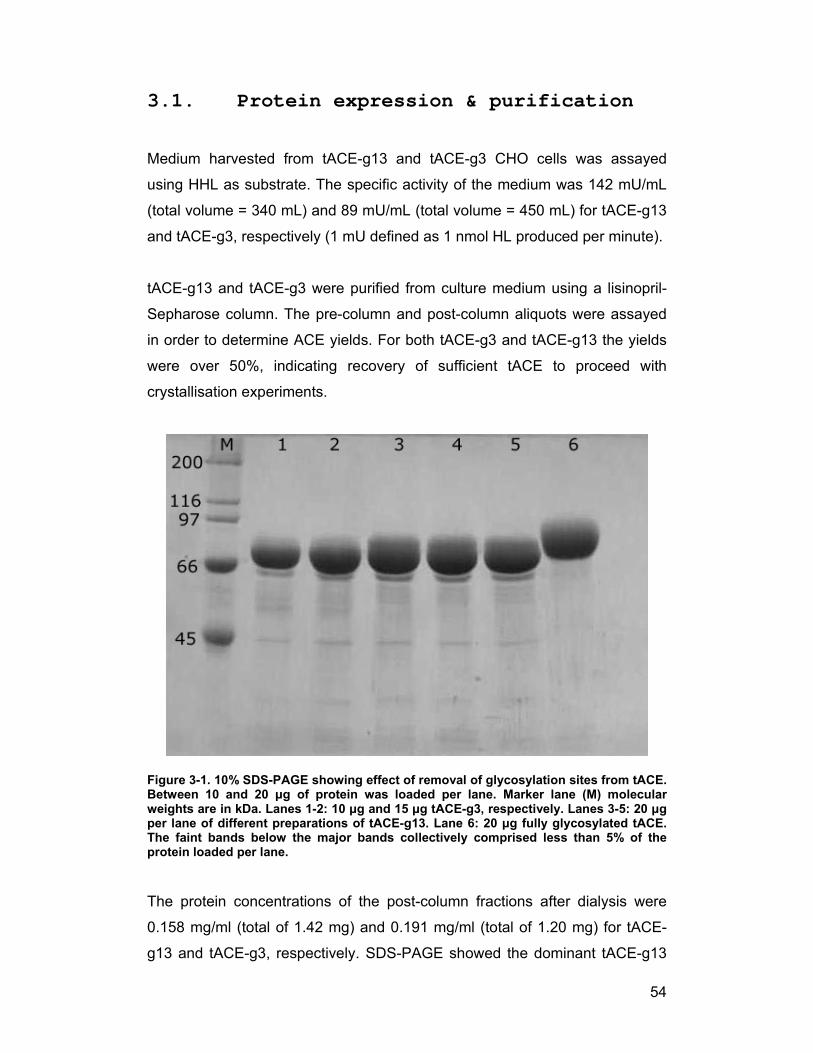
54
3.1. Protein expression & purification
Medium harvested from tACE-g13 and tACE-g3 CHO cells was assayed
using HHL as substrate. The specific activity of the medium was 142 mU/mL
(total volume = 340 mL) and 89 mU/mL (total volume = 450 mL) for tACE-g13
and tACE-g3, respectively (1 mU defined as 1 nmol HL produced per minute).
tACE-g13 and tACE-g3 were purified from culture medium using a lisinopril-
Sepharose column. The pre-column and post-column aliquots were assayed
in order to determine ACE yields. For both tACE-g3 and tACE-g13 the yields
were over 50%, indicating recovery of sufficient tACE to proceed with
crystallisation experiments.
Figure 3-1. 10% SDS-PAGE showing effect of removal of glycosylation sites from tACE. Between 10 and 20 µg of protein was loaded per lane. Marker lane (M) molecular weights are in kDa. Lanes 1-2: 10 µg and 15 µg tACE-g3, respectively. Lanes 3-5: 20 µg per lane of different preparations of tACE-g13. Lane 6: 20 µg fully glycosylated tACE. The faint bands below the major bands collectively comprised less than 5% of the protein loaded per lane.
The protein concentrations of the post-column fractions after dialysis were
0.158 mg/ml (total of 1.42 mg) and 0.191 mg/ml (total of 1.20 mg) for tACE-
g13 and tACE-g3, respectively. SDS-PAGE showed the dominant tACE-g13

55
protein had a molecular weight of 72 kDa (Fig. 3-1, lanes 3-5) which was
slightly lower than the fully gycosylated tACE (Fig. 3-1, lane 6). The tACE-g3
protein bands (Fig. 3-1, lanes 1 & 2) also ran lower than the fully glycosylated
tACE band, indicating similarly reduced glycosylation as expected. Minor
proteins comprised ≤5% of the total protein. The tACE protein recovered in
dialysate after purification gave a final yield of 4.2 mg/L and 2.7 mg/L for
tACE-g13 and tACE-g3, respectively.
3.2. Crystallisation
Initial parameters for crystallisation conditions were obtained from previous
work successfully carried out on tACE-g13 (Gordon et al., 2003; Watermeyer
et al., 2006).
3.2.1. Crystallisation of tACE-g3
Aliquots of tACE-g3 were concentrated to 2.0 mg/mL and 4.2 mg/mL, as
determined by Bradford assays. The final concentration of tACE-g3 in the
drop was 2.1 mg/mL. Clusters of needles, or alternatively, microcrystal
showers were obtained (Fig. 3-2). Seeding was found to be a promising
approach for increasing the size of tACE-g3 crystals; however, these
experiments failed to yield diffraction quality crystals.
3.2.2. Initial co-crystallisation of tACE-g13–RXPA380 complex
Aliquots of tACE-g13 were concentrated to various extents, from 0.5 mg/mL to
6.6 mg/mL, as determined by Bradford assays. Production of native tACE-g13
diffraction-size crystals was achieved with final (i.e., in-drop) protein
concentrations ranging from ~0.25 mg/mL to 3.3 mg/mL. Crystals appeared
gradually between 2 and 7 days after screens were set up. A fine precipitate
was consistently observed to form before any crystals and remained after
crystallisation had occurred.

56
Figure 3-2. Microcrystals of tACE-g3 (1.4mg/mL) together with a considerable amount of precipitate. Scale bar indicates 0.2 mm.
A 1.6 mg/mL final concentration of protein (23 µM) was used for the enzyme-
inhibitor co-crystallisation screens. Inhibitor concentrations varied from 3 nM
(the Ki value for RXPA380) to 1 µM (a 333-fold excess of the inhibitor). The
largest crystals were typically about 0.35 mm × 0.04 mm in the visible
dimensions.
3.2.3. Final co-crystallisation of tACE-g13–RXPA380 complex
The concentration of the inhibitor in the co-incubation was increased. There is
precedent for this approach – the co-crystals of tACE∆36NJ with lisinopril
(~180 µM) and with enalaprilat (10 mM) and captopril (10 mM) used for
structural determination all had excesses of inhibitor at least five orders of
magnitude higher than their inhibition constants (Natesh et al., 2003; Natesh
et al., 2004).

57
Figure 3-3. Re-crystallisation of tACE-g13 crystals in presence of RXPA380. A. tACE-g13 native crystals. B. The crystals had dissolved 48 hours after replacing reservoir buffer with water. C. Within four days of the addition of 460µM RXPA380 and replacement of water with the regular reservoir buffer (15% PEG4000, 50mM Na-acetate, 10µM Zn-sulphate), crystals had re-formed. D. Magnification of quadrant of crystallisation drop (from C). Substantial precipitate is easily observed along with well-formed needle-shaped crystals. (Bottom right is a fibre, probably from clothing)
0.2 mm

58
The concentration of RXPA380 used in the enzyme-inhibitor incubation was
therefore increased to give a final in-drop concentration of 92 µM, which is a
~30700-fold excess relative to the Ki value, and an inhibitor–enzyme molar
ratio of 4:1. This was achieved by dissolution and re-crystallisation of native
protein crystals in the presence of 0.46 mM RXPA380. This approach was
used, rather than using fresh protein sample, as this protein was clearly
amenable to crystallisation. Soaking was not used as it is thought that
substrate/inhibitor access occurs via a conformational change (by hinge
movement) that is both masked and prevented by crystallisation, so that
inhibitor may not have access to the active site after crystallisation (Towler et
al., 2004; Watermeyer et al., 2006). The crystals produced were noticeably
smaller than the original crystals, with dimensions of approximately 0.2 mm ×
0.02 mm for the largest crystals (Fig. 3-3).
3.3. Data collection and processing
3.3.1. In-house data collection and processing
In total 424220 diffraction spots were recorded, and these data were indexed,
integrated, scaled and merged with Denzo and SCALEPACK programs
(Otwinowski & Minor, 1997) to yield 104529 reflections to 2.8 Å. 17739 unique
reflections were obtained, with Rsymm = 26.1%, I/σ = 3.4, mosaicity = 0.68.
The structure was solved using molecular replacement with EPMR v2.5
(Kissinger et al., 1999), with a correlation coefficient of 0.713 and R-value of
0.575. A view of the initial Fourier difference Fobs – Fcalc map gave no
discernible evidence for the presence of the inhibitor bound to the tACE active
site. Therefore structure refinement was discontinued for these data.
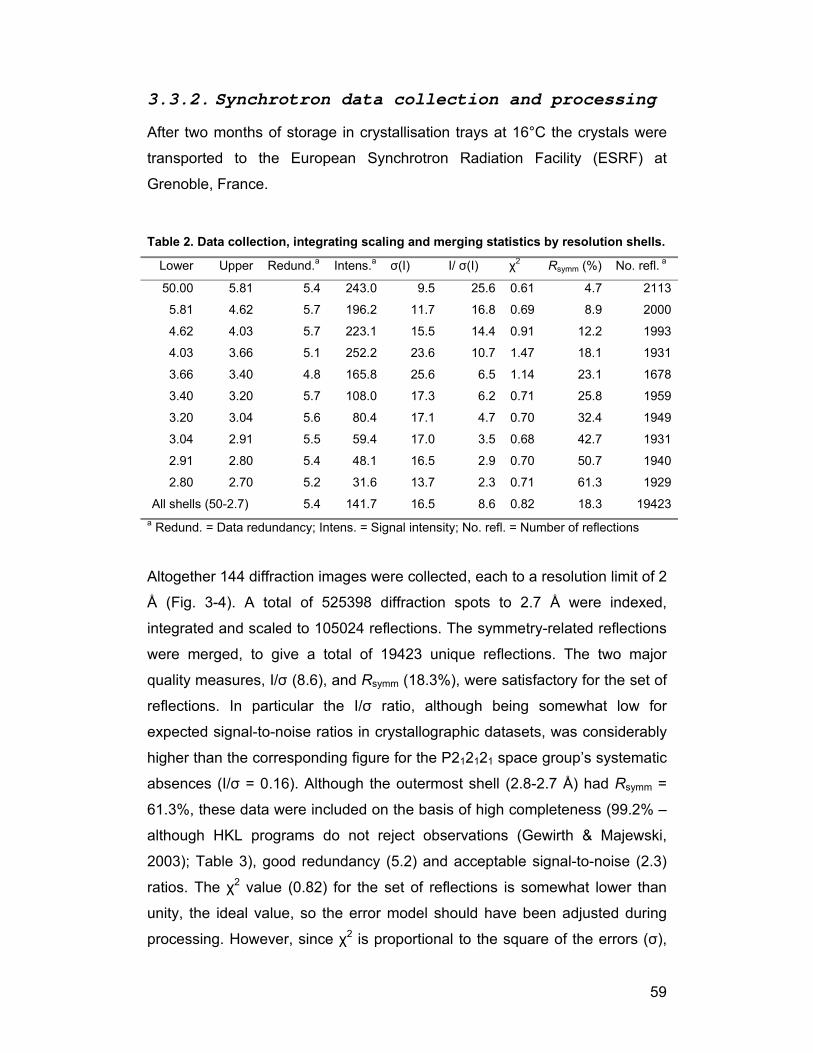
59
3.3.2. Synchrotron data collection and processing
After two months of storage in crystallisation trays at 16°C the crystals were
transported to the European Synchrotron Radiation Facility (ESRF) at
Grenoble, France.
Table 2. Data collection, integrating scaling and merging statistics by resolution shells.
Lower Upper Redund.a Intens.a σ(I) I/ σ(I) χ2 Rsymm (%) No. refl. a
50.00 5.81 5.4 243.0 9.5 25.6 0.61 4.7 2113
5.81 4.62 5.7 196.2 11.7 16.8 0.69 8.9 2000
4.62 4.03 5.7 223.1 15.5 14.4 0.91 12.2 1993
4.03 3.66 5.1 252.2 23.6 10.7 1.47 18.1 1931
3.66 3.40 4.8 165.8 25.6 6.5 1.14 23.1 1678
3.40 3.20 5.7 108.0 17.3 6.2 0.71 25.8 1959
3.20 3.04 5.6 80.4 17.1 4.7 0.70 32.4 1949
3.04 2.91 5.5 59.4 17.0 3.5 0.68 42.7 1931
2.91 2.80 5.4 48.1 16.5 2.9 0.70 50.7 1940
2.80 2.70 5.2 31.6 13.7 2.3 0.71 61.3 1929
All shells (50-2.7) 5.4 141.7 16.5 8.6 0.82 18.3 19423a Redund. = Data redundancy; Intens. = Signal intensity; No. refl. = Number of reflections
Altogether 144 diffraction images were collected, each to a resolution limit of 2
Å (Fig. 3-4). A total of 525398 diffraction spots to 2.7 Å were indexed,
integrated and scaled to 105024 reflections. The symmetry-related reflections
were merged, to give a total of 19423 unique reflections. The two major
quality measures, I/σ (8.6), and Rsymm (18.3%), were satisfactory for the set of
reflections. In particular the I/σ ratio, although being somewhat low for
expected signal-to-noise ratios in crystallographic datasets, was considerably
higher than the corresponding figure for the P212121 space group’s systematic
absences (I/σ = 0.16). Although the outermost shell (2.8-2.7 Å) had Rsymm =
61.3%, these data were included on the basis of high completeness (99.2% –
although HKL programs do not reject observations (Gewirth & Majewski,
2003); Table 3), good redundancy (5.2) and acceptable signal-to-noise (2.3)
ratios. The χ2 value (0.82) for the set of reflections is somewhat lower than
unity, the ideal value, so the error model should have been adjusted during
processing. However, since χ2 is proportional to the square of the errors (σ),

60
even a deviation of 20% from 1.0 for χ2 represents just a 10% adjustment in σ,
which is acceptable (Gewirth & Majewski, 2003). The data collection statistics
by resolution shells are shown in Table 2.
Figure 3-4. Diffraction image collected for tACE-g13–RXPA380 co-crystals at BM14-UK, ESRF.
The dark rings are due to ice and perhaps frost on the surface of the crystals
(Glaeser et al., 2000). Due to the particularly dark innermost ring, the
reflections collected in the range 3.6-3.4 Å were fewer, and so the redundancy
of that shell was lower than all the other shells (4.8 vs average 5.4; Table 2).
However, this redundancy still indicated the collection of sufficient data in the
shell for data collection and subsequent structure solution.

61
Table 3. Crystallographic data statistics. Values in parentheses refer to the last shell (2.80–2.70 Å).
Diffraction data Value
Unit cell (lengths in Å, angles in °) a=59.89, b=85.15, c=135.32; α=90,
β=90, γ=90
Space Group P212121
Mosaicity 0.42
Resolution range 50-2.7 Å
Total No. of reflections 105024
No. of unique reflections 19423
Completeness a (%) 98.2 (99.2)
Redundancy 5.4 (5.2)
I/σ 8.6 (2.3)
Rsymm (%) 18.3 (61.3)
χ2 0.82 (0.71)
aCompleteness data from HKL2000 include those reflections (2044, i.e. 10.4%) which were
subsequently found to have <I> ≤ 0. Taking these data into account, the final completeness
figures were overall = 89.6%, outer shell = 81.3%.
3.4. Structure solution and refinement
Molecular replacement using EPMR v2.5 (Kissinger et al., 1999) and a native
tACE-g13 structure (Watermeyer et al., 2006) as a starting model yielded a
solution after just 2 cycles. The correlation coefficient was 0.693, with only
one molecule in the asymmetric unit.
The first B-factor correction was in effect the initial assignment of B-factors to
the atoms, and this resulted in a significant decrease in the R-factors (Fig. 3-
6).
After the first round of refinement (comprising a given number of cycles of
conjugate gradient minimisation with maximum likelihood targets – see Fig. 3-

62
6), the active site zinc and 2 chloride ions were located and added to the
model. The sites of these ions were found at over 5σ in the Fobs – Fcalc Fourier
difference maps. Further model building and refinement led to the addition of
the glycan residues at N72 and N109. Throughout the model building the glycan
chain at N72 did not visibly extend beyond the first N-acetyl glucosamine
linked to the asparagine, and eventually even this was removed from the
model. At N109, however, several residues were visible, and most of these
were retained in the final model. Waters were also gradually added as
refinement proceeded. Most of these were added after inspection of the active
site and subsequent modelling of the inhibitor.
A 2Fobs – Fcalc composite omit map was calculated in order to reduce model
bias. However, this was found to be so similar to the 2Fobs – Fcalc that it gave
essentially the same information, and so its use was discontinued.
Figure 3-5. Stereo representation of active site of model with Fourier difference (Fobs – Fcalc) map contoured at 2.5σ level, before modelling of the inhibitor. The zinc atom is shown as a sphere.
After several rounds of refinement, the Fobs – Fcalc map of the active site was
examined at 2.5σ (Figs. 3-5, 3-6). This clearly indicated continuous density,
suggesting a molecule coordinated to the zinc in an orientation similar to
lisinopril and other inhibitors. A crude alignment of a model of the RXPA380-
tACE complex (Fig. 3-17) with the present model and electron density map
63
showed that the RXPA380 molecule could account completely for the as yet
unassigned density.
RXPA380 was successfully built with the correct stereochemistry and
minimised using the ProDRG server (Schuttelkopf & van Aalten, 2004). This
first structure was placed into the active site of the tACE-g13 model and
adjusted, primarily by altering permitted torsion angles appropriately. Density
for the pseudo-proline and the C-terminal tryptophan residue (particularly its
side chain indole ring) could be seen very clearly between the zinc-
coordinating region (occupied by the phosphinyl group) and the known C-
terminus-coordinating residues K511, Q281 and Y520. On the other side (the pre-
scissile bond side) the relative positions of phenyl ring and the carboxybenzyl
group were easily distinguished by size, and fitted accordingly. After a round
of refinement the overall position of the inhibitor was in accordance with the
2Fobs – Fcalc electron density, although the C-terminus (particularly the
tryptophan indole ring) required further attention.
Once the inhibitor model was built into the active site in a conformation that
satisfied the constraints of the torsion bonds and the electron density, a final
check of the model was carried out, with the addition of further water
molecules and the modification of glycan residues and the side chains of
other residues. In total 109 water molecules were included. A last round of
restrained refinement saw the Rcryst and Rfree values drop to 23.69% and
27.97%, respectively (Fig. 3-6). This improvement in phasing did not lead to
any significant alterations in the density maps to allow further improvement of
the model, particularly at the glycan chains or the active site. The residues
435-438 in a flexible loop and 618-623 at the C-terminus, for which
continuous density could not be determined, even for the main chains, were
truncated from the final model. This truncation resulted in slight increases in
Rcryst to 23.70% and Rfree to 28.17%, since these residues were accounting for
the observed data, however insufficiently. The data refinement statistics are
shown in Table 4.

64
Table 4. Refinement statistics.
Parameter Value
Resolution range (outer shell) 50.0-2.7 Å (2.8-2.7 Å)
Rcryst (outer shell) % 23.7 (36.6)
Rfree (outer shell) % 28.2 (40.3)
No. of protein atoms 4736
No. of solvent atoms 103
No. of inhibitor atoms 44
RMS deviations from ideality
Bond lengths 0.009 Å
Bond angles 1.5°
Dihedral angles 20.9°
Improper angles 1.1°
Estimated coordinate error 0.37 Å
B-factors (Å2)
Overall mean B-factor 29.6
Protein main chain B-factor 29.8
Protein side chain B-factor 31.3
Solvent atoms 21.2
Inhibitor atoms 23.2
Zinc atom 13.9
Chloride atoms (CL1, CL2) 12.4, 18.4
Ramachandran analysis
Residues in favoured regions (%) 533 (93.5)
Residues in allowed regions (%) 36 (6.3)
Residues in disallowed regions (%) 1 (0.2)
Rcryst = Σh {|Fobs| – |Fcalc|} / Σh |Fobs|, where Fobs and Fcalc are the observed and
calculated structure factor amplitudes of the reflection h.
Rfree = Σh {|Fobs| – |Fcalc|} / Σh |Fobs|, where Fobs and Fcalc are as above, for a test set of
3.7% of the reflections that were unused in refinement.

65
Step Action
1 B-factor correction
2 10× restrained refinement
3 Ions added; Group B-factor refinement
4 Model-build, 12× restrained refinement
5 Waters in, model-build, 20× restrained refinement
6 Model inspection, 32× restrained refinement, 8× B-factor refinement
7 Waters added, 4× restrained refinement, 7× B-factor refinement
8 Inhibitor added; 12× restrained refinement
9 Inhibitor position improved; 16× restrained refinement, 6× B-factor refinement
10 Inhibitor tryptophan positioned; 24× restrained refinement
11 Waters in, 2 glycans out; 29× restrained refinement
12 H, N, Q flips, rotamer outliers adjusted; 13× restrained refinement, 3× B-factor refinement
13 Waters in, g1 glycan out, model inspection; 27× restrained refinement, 5× B-factor refinement
14 Disordered regions (434-437, 618-623) removed
Figure 3-6. Progression of R-factors with model building and refinement, with appended table outlining refinement action.
Rvalues with refinement
20
25
30
35
40
45
0 1 2 3 4 5 6 7 8 9 10 11 12 13 14
step
R (%
)
20
25
30
35
40
45
RfreeRcryst

66
The side chains of three N, nine Q and three H amino acid residues were
“flipped” by the MolProbity server (Davis et al., 2004), in order to improve the
probable hydrogen-bonding network of the molecule. These flipped N
residues did not include N72 or N109, as these are the sites of glycosylation,
and have fixed side chain orientations.
Table 5. Comparison of unit cell dimensions of tACE structures determined to date.
Structure (pdb code) a (Å) b (Å) c (Å) Unit cell volume (Å3)
Native tACE (1o8a) 56.62 85.06 133.79 644345.8
tACE–lisinopril (1o86) 56.47 84.90 133.99 642388.7
tACE–captopril (1uzf) 56.65 84.90 133.50 642079.6
tACE–enalaprilat (1uze) 56.72 85.35 133.73 647393.9
tACE-g13 a 59.81 84.90 135.99 690539.4
tACE-g13–RXPA380 59.89 85.15 135.32 690060.2 aJ.M. Watermeyer (2004).
3.5. Structure validation
MolProbity Cβ and rotamer plot checks revealed no structural anomalies
requiring urgent attention (Davis et al., 2004). Ramachandran plots and other
analyses indicated satisfactory geometry. A few outliers flagged in the
MolProbity-generated Ramachandran plot were checked and adjusted
accordingly. These included A354, whose carbonyl oxygen has been shown to
coordinate the lysyl amine nitrogen in the tACE-lisinopril complex (Natesh et
al., 2003).
The final structure (after the truncations) was not minimised because the
changes to which the penultimate model was subjected were collectively
minor, and the Rfree value, in remaining constant or increasing with more
cycles of minimisation, indicated that over-refinement was a distinct
possibility.

67
Final Ramachandran plots from MolProbity (Davis et al., 2004) and
PROCHECK (Laskowski et al., 1993) for this final adjusted model indicated
that almost all residues had satisfactory phi and psi angles (Fig. 3-7, Table 4).
The only non-glycine exception was A129, which is marginally an outlier,
according to MolProbity. This can be attributed to the fact that this residue
follows a proline in sequence, and occurs effectively at the junction between
loop and α-helix 4.
Figure 3-7. Ramachandran plots. Left: PROCHECK Ramachandran plot of final model. Only a few glycine residues (represented by triangles), are to be found in the disallowed regions, shown in white. Right: MolProbity Ramachandran plot of final model, excluding glycine and proline residues.
3.6. Structural analysis
3.6.1. Overall structure of tACE-g13–RXPA380 complex
Like other tACE structures, the present structure reveals a predominantly
helical protein, elliptical in shape and containing a buried active site between
two sub-domains. The tACE-g13 unit cell is marginally larger than the
tACE∆36NJ, from the dimensions of both the native structure and this ligand-
bound structure (Table 5).

68
Figure 3-8. Stereo view of final modelled position of RXPA380 (purple carbons, phosphorus in orange) in tACE-g13 active site and its fit with experimental density map. The catalytic triad (H383, H387, E411) is shown in green lines. The zinc ion and a C-terminal carboxylate-coordinating water are shown as metallic blue and red spheres, respectively. Density map is 2Fobs – Fcalc contoured at 1.3σ.
Both domains contribute residues to the active site (Natesh et al., 2003). The
alignment of tACE-g13–RXPA380 with the other structures reveals almost no
difference between them (r.m.s.d. values = 0.24 Å [tACE–lisinopril], 0.26 Å
[tACE–enalaprilat], 0.26 Å [tACE –captopril]; Fig. 3-9; Fig. 3-14).
Figure 3-9. Stereo diagram of all-Cα alignment of tACE–inhibitor complexes: tACE∆36NJ–enalapril (1uze, purple), tACE∆36NJ–captopril (1uzf, blue), tACE∆36NJ–lisinopril (1o86, yellow) and tACE-g13–RXPA380 (green). Inhibitors are shown as sticks in corresponding colours. The zinc and chloride ions are shown as purple and hot pink spheres, respectively.

69
3.6.2. Glycosylation and chloride binding
Testis ACE-g13 has intact glycosylation sequons only at N72 (g1) and N109
(g3). As with the previously determined native tACE-g13, the extent of
glycosylation that can be correlated with continuous electron density from
difference or omit maps is greater at N109 (Fig. 3-10). In this case, no density
could be interpreted even for the ring portion of the first N-acetyl glucosamine
residue linked to N72.
Figure 3-10. Glycosylation of tACE-g13–RXPA380 at N109, residues shown as sticks. Density map is 2Fobs – Fcalc at 1.2σ. The penultimate residue (mannose), for which sufficient difference density could not be discerned, is rendered as lines.
The glycosylation at N109 appears to be more extensive than that which
occurs at N72 in tACE-g13 (Watermeyer et al., 2006), at least with respect to
those glycan residues whose occupancy is sufficiently high and temperature

70
factors sufficiently low to allow their incorporation into the model. The N72
glycosylation site has been shown to occupy a larger water channel than that
taken up by N109, which could explain the greater degree of order observed at
the N109 site. This sole glycosylation site, along with the rest of the tACE
surface, is sufficient for intermolecular contacts that facilitate crystallisation
(Watermeyer et al., 2006).
Figure 3-11. Chloride binding sites of tACE-g13–RXPA380. A. Cl1 site with water channel. The tryptophan residues making up the hydrophobic shell are shown as lines (except the chloride ligand W485). 2Fobs – Fcalc density maps are contoured at 1.2σ.
The chloride sites (Fig. 3-11) were easily discernible, as they were located
(together with the zinc ion) as peaks above 5σ in a Fourier difference map.
The B-factors were refined to 12.4 Å2 and 18.4 Å2 for Cl1 and Cl2,
respectively. The binding site of Cl1 occurs within a hydrophobic shell of four
tryptophan residues (W182, 279, 485, 486), one of which (W485) is also a chloride
ligand. In addition, two arginine residues, R186 and R489, coordinate the
chloride from 3.2 Å and 3.4 Å, respectively. The fourth ligand, a water
71
molecule, could not be located with certainty at this resolution, although there
is a water molecule 5 Å away that seems to form the end of a system of water
residues leading to the channel.
At Cl2, the three ligands of the anion were side chains of R522 (Nε atom) and
Y224 (Oη atom). The presence of a water channel from the milieu into the Cl2
site has been postulated by Tzakos and colleagues (2003), but strong
evidence for this was not observed at the site.
3.6.3. Binding of RXPA380 to tACE-g13
3.6.3.1. Overall
RXPA380 has been shown to bind to the C-domain of ACE with a Ki of 3 nM,
comparable with the most tightly binding inhibitors of ACE (Wei et al., 1992;
Georgiadis et al., 2004). This inhibitor binds to tACE-g13 in an extended
conformation with its central phosphinate group coordinated to the catalytic
zinc (Fig. 3-8). Three residues, K511, Q281 and Y520, coordinate and stabilise
the C-terminal carboxylate from 2.6, 3.0 and 3.8 Å, respectively. A water
molecule, wat11, appears to be coordinated to both oxygens of the
carboxylate. The zinc atom is penta-coordinated (T5, trigonal bipyramidal
configuration) to the catalytic triad and the two phosphinyl oxygens (Fig. 3-
12). The two phosphinyl oxygen–zinc bonds are distinctly different in length,
at 2.56 Å (Zn–OAT) and 1.84 Å (Zn–OBL), as is the case with other
phosphinate-metalloprotease complexes. In the bidentate coordination one of
the bonds is usually longer than the other, on average 2.54 Å and 2.14 Å in
the case of carboxypeptidase A- and leucine aminopeptidase-phosphonate
complexes (Kim & Lipscomb, 1990; Strater & Lipscomb, 1995; Alberts et al.,
1998). Stromelysin-3, or matrix metalloprotease 11, also has unequal
bidentate coordination phosphinate bonds in its complex with a phosphinic
inhibitor (means of 2.89 Å and 2.33 Å for the two P–O bonds in the six
molecules of the asymmetric unit) (Gall et al., 2001). A general feature of the
binding site of RXPA380 to tACE-g13 is the considerable space between sub-
site residues and the inhibitor. Only 12 atoms (from 8 amino acid residues,
and including zinc and a water) are found within 3 Å of any inhibitor atoms.

72
This is comparable with 10 atoms (of 6 amino acids, plus three waters and
zinc) within 3 Å of lisinopril in 1o86, despite the fact that RXPA380 (44 non-H
atoms) is a considerably larger molecule than lisinopril (29 non-H atoms).
Figure 3-12. Stereo view of catalytic zinc penta-coordination in the active site of tACE-g13 complexed with RXPA380. Distances between zinc and coordinating atoms shown in Ångströms.
3.6.3.2. S2 sub-site
Positioning of an inhibitor sub-group at the S2 position has not been
previously observed in tACE–inhibitor complexes, as the inhibitors were all
Type II or Type III inhibitors (Fig. 1-4). The benzene ring has hydrophobic
interactions with H410 and F391, the only side chains that are within 4 Å of it
(Fig. 3-13). A hydrogen bond between the amine nitrogen of A356 and the
carbonyl oxygen of the Cbz group (2.46 Å) likely prevents any flexible motion
of the Cbz moiety, keeping it fixed in the side pocket (Fig. 3-13).
3.6.3.3. S1 sub-site
The hydrophobic phenyl ring in the P1 position interacts with the Cβ of S355
proximally, and with F512 and V518 distal to the P2 and zinc-binding groups.
Nothing else in the S1 pocket is close enough to make significant interactions
with the ring. All of the previously determined ACE-inhibitor complexes (with
the exception of tACE–captopril, 1uzf) have this phenyl ring, also referred to

73
as a phenylpropyl group, and it occurs in essentially the same orientation in all
of them (Fig. 1-7, 3-14).
Figure 3-13. S2 and S1 residues of tACE-g13–RXPA380. Residue side chains (except A354, S355 and A356) have been omitted for clarity.
3.6.3.4. S1' sub-site
This sub-site is occupied by a pseudo-proline moiety, i.e. a proline with the
amine nitrogen substituted by a carbon, described as the Cε carbon. This
carbon is in the R stereo-configuration, in contrast with the adjacent Cα
carbon, which is S, as would be expected in proline. An alignment of active
site residues from 1o86 and the tACE-g13 – RXPA380 complex confirms the
prediction that the R-configuration of the Cε carbon, together with the essential
S-configuration at the P1' Cα (Cushman et al., 1977), allows the prolyl ring to
adopt the same directional conformation as the lysyl chain in tACE–lisinopril
(Georgiadis et al., 2004) (Fig. 3-14). Notably, the carbonyl oxygen of A354 is
marginally displaced away from the inhibitor (relative to the corresponding C–
O bond in tACE–lisinopril), probably due to the presence of a carbon atom
(Cε) in place of the H-bond donor. In tACE–lisinopril this carbonyl oxygen
forms a hydrogen bond with the main chain N.

74
Figure 3-14. Stereo view of Cα alignment of tACE∆36NJ–lisinopril (yellow) and tACE-g13–RXPA380 (purple, r.m.s.d. = 0.24 Å) produces substantial correspondence between inhibitor residues. Enalapril and captopril are essentially fully superimposable over lisinopril. The overlapping zinc cations are shown in mauve (that of tACE-g13–RXPA380 is lighter in shade).
3.6.3.5. S2' sub-site
The S2' pocket of tACE-g13–RXPA380 complex is a large binding pocket
(Fig. 3-15). There are 10 residues within 5 Å of the tryptophan side chain
(Table 6). In addition, there are two water molecules, wat11 that is
coordinated to the C-terminal carboxylate, and wat13, which mediates the
interaction between the tryptophan Nε and the E376 side chain.
Figure 3-15. Stereo view of tACE-g13 S2' pocket containing RXPA380 tryptophan residue. The 10 amino acid residues within 5 Å of the P2' tryptophan as well as E376 and D453 are shown in ball-and-stick notation. Water molecules are shown as maroon spheres. Selected distances (in Å) between the tryptophan and tACE-g13 residues are labelled.
75
D453, whose side chain is further than 6 Å from RXPA380, forms a hydrogen
bond with a water molecule in the upper recesses of the S2' pocket; this
interaction is likely to keep the side chain in an angled conformation, away
from the P2' tryptophan.
3.6.4. tACE-g13–RXPA380 vs ACE N-domain sub-sites
A Cα alignment (544 atoms, r.m.s.d. = 0.77 Å) of tACEg-13–RXPA380 and the
ACE N-domain complexed with lisinopril (pdb code 2c6n, A chain) allows a
comparison of the sub-sites of the two domains (Fig. 3-16).
The major difference in the S2 pocket is the presence of tyrosine in place of
F391 of tACE. This may provide opportunity for a weak (due to length: 3.57 Å)
hydrogen bond between the tyrosine hydroxyl and carboxy group of Cbz. At
P1 the slight shift of the phenylpropyl ring is consistent with the presence of a
polar threonine residue in place of V518 (Fig. 3-16). Both these substitutions
are consistent with the selectivity of the N-domain for RXP407, which has a N-
terminal aspartate residue.
The differences between N- and C-domain S1' pockets have been described
previously (Natesh et al., 2003; Corradi et al., 2006). One noteworthy point is
that the alignment of the A chain of N-domain–lisinopril reveals particularly
close contact between the carbonyl oxygen of A332 (equivalent to A354 in
tACE) and the Cδ of the pseudo-proline (2.0 Å; cf. 2.9 Å in tACE-g13–
RXPA380). In the lisinopril complexes this oxygen forms a hydrogen bond
contact with the lysyl amine nitrogen. The variance in length of this H-bond
between the domains (2.6 Å N-domain–lisinopril vs 2.9 Å tACE–lisinopril),
together with the clash already mentioned, suggest that there may be
conformational restraints on the N-domain that prevent it from easily
accommodating the constrained pseudo-proline.

76
The S2' pocket comparisons reveal several differences. The replacement of
V379 and V380 with S357 and T358 in the N-domain increases the polar nature of
the pocket, and reduces the possibility of stabilising van der Waals’
interactions with the indole ring. D453 in the C-domain is replaced by a
glutamate, whose side chain faces away from the P2' residue, precluding any
bonding to the inhibitor via a water molecule. An even clearer instance of
reorientation occurs at the site of another conservative substitution. In tACE
wat13 is H-bonded to both E376 and the indole nitrogen. This connectivity is
not possible in N-domain due to replacement of the E by D354. Not only is this
side chain shorter than that of glutamate, but it also faces into the protein, well
away from the inhibitor. (It must be noted, however, that both chains of the N-
domain structure contained no modelled water residues in the region of the
P2' pocket, most likely due to lower resolution of 3.0 Å) Taken together, these
changes allow the S2' pocket to be considered as the major determinant sub-
site in the difference in binding affinity of RXPA380 to the C- and N-domains.
Analysis of the internal pockets in tACE-g13–RXPA380 and the N-domain–
lisinopril structure (pdb code 2c6n, A chain) uncovers substantial differences
in the overall conformation of the S1' and S2' pockets. CASTp analysis
(Binkowski et al., 2003) revealed that the N-domain S1' and S2' pockets are
effectively contiguous when probed with a 2.5 Å-radius probe, forming a large
cavity of volume 1152 Å3. By contrast, although the pocket comprising the
tACE-g13 S2' residues also incorporates a number of the S1' residues, at 857
Å3 this pocket is much smaller than that found in the N-domain. This
difference in volumes and the substitution of S2' C-domain residues by
smaller residues in the N-domain (T282S, V379S, V380T, E376D), together point
to the availability of fewer residues in the N-domain for interaction with the
inhibitor.
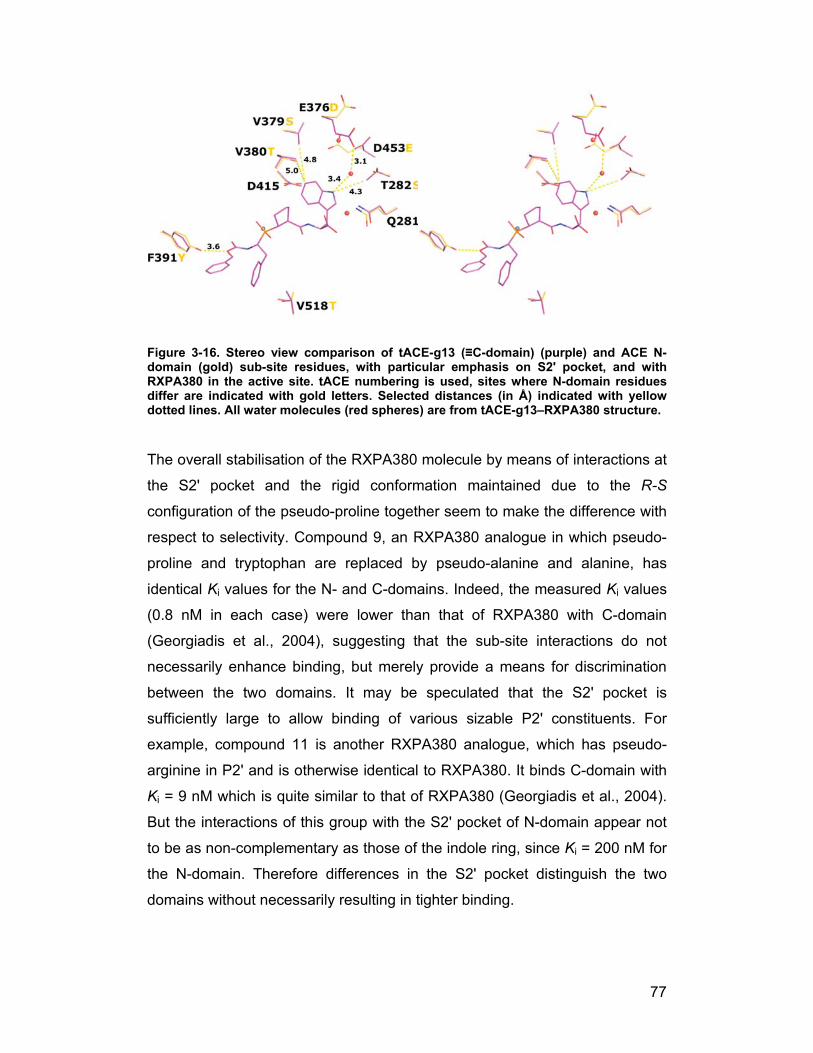
77
Figure 3-16. Stereo view comparison of tACE-g13 (≡C-domain) (purple) and ACE N-domain (gold) sub-site residues, with particular emphasis on S2' pocket, and with RXPA380 in the active site. tACE numbering is used, sites where N-domain residues differ are indicated with gold letters. Selected distances (in Å) indicated with yellow dotted lines. All water molecules (red spheres) are from tACE-g13–RXPA380 structure.
The overall stabilisation of the RXPA380 molecule by means of interactions at
the S2' pocket and the rigid conformation maintained due to the R-S
configuration of the pseudo-proline together seem to make the difference with
respect to selectivity. Compound 9, an RXPA380 analogue in which pseudo-
proline and tryptophan are replaced by pseudo-alanine and alanine, has
identical Ki values for the N- and C-domains. Indeed, the measured Ki values
(0.8 nM in each case) were lower than that of RXPA380 with C-domain
(Georgiadis et al., 2004), suggesting that the sub-site interactions do not
necessarily enhance binding, but merely provide a means for discrimination
between the two domains. It may be speculated that the S2' pocket is
sufficiently large to allow binding of various sizable P2' constituents. For
example, compound 11 is another RXPA380 analogue, which has pseudo-
arginine in P2' and is otherwise identical to RXPA380. It binds C-domain with
Ki = 9 nM which is quite similar to that of RXPA380 (Georgiadis et al., 2004).
But the interactions of this group with the S2' pocket of N-domain appear not
to be as non-complementary as those of the indole ring, since Ki = 200 nM for
the N-domain. Therefore differences in the S2' pocket distinguish the two
domains without necessarily resulting in tighter binding.

78
3.6.5. Comparison of experimentally determined
tACE-RXPA380 and modelling predictions
In light of the difficulties faced in terms of obtaining co-crystals of tACE-g13
and RXPA380, the in silico docking and modelling of tACE and RXPA380 was
undertaken concurrently. In the event of the successful co-crystallisation of
the complex and subsequent structure solution and refinement, it is
worthwhile to compare the experimental structure with the structure predicted
from in silico modelling.
The energy-minimised tACE–RXPA380 molecular model (RXPA380MM) was
found to have more residues found in the generously allowed/outlier regions
of the Ramachandran plot. This was not considered to be a serious mark
against drawing conclusions about the possible binding of inhibitors at the
active site of the models. The minimisation algorithm allows the free
movement of atoms to attain the most overall energetically stable state, and
no constraint was imposed on phi and psi angles during the iterative
minimisations. Nevertheless, the Ramachandran plot of the residues of the
active site (residues wholly or partially within 5 Å of the inhibitor) was
preferentially examined carefully in order to ensure that no gross distortions of
the active site region were overlooked.
The Cα alignment of tACE-g13–RXPA380 and RXPA380MM revealed an
r.m.s.d. of 1.55 Å. Alignment of residues within 5 Å of the tACE-g13–
RXPA380 gave an r.m.s.d. of 1.15 Å. Immediately evident in this alignment
was the general correspondence of all atoms with the clear exception of the
inhibitor’s P2 Cbz group. The pseudo-proline rings were also not so well
aligned, especially at the Cε carbon. The P2' tryptophan side chain and the P1
phenylpropyl group aligned particularly well. The all-inhibitor alignment
(r.m.s.d. = 1.07 Å) and the same alignment excluding the Cbz group beyond
the amine nitrogen (r.m.s.d. = 0.61 Å) indicate the level of similarity between
the predicted orientation and that of the experimental structure (Fig. 3-17).

79
Table 6. Predictions of tACE–RXPA380 conformation at S2’ pocket compared with experimentally determined structure. Distances of 12 residues (in bold) predicted to be within 5 Å of RXPA380 (Georgiadis et al., 2004). Tryptophan – S2' side chain distances are measured in current modelled structure (RXPA380MM) and experimental structure (tACE-g13–RXPA380). Additional residues within 5 Å are included. Shortest inter-atomic distance between residue and tryptophan side chain is given in Ångströms.
Residues a RXPA380MM prediction tACE-g13–RXPA380
Q281 3.5 Nε2 – Cδ1 3.1 Nε2 – Cδ1
T282 3.5 Cγ2 – Nε1 4.3 Cγ2 – Nε1
E376 6.5 Oε2 – Nε1 6.1 Oε2 – Nε1
V379 4.3 Cγ1 – Cζ2 4.8 Cγ1 – Cη2
V380 4.1 Cγ2 – Cζ2 4.8 Cγ2 – Cζ2
D415 4. 7 Oδ2 – Cζ3 3.7 Oδ1 – Cζ3
D453 5.3 Oδ1 – Cζ2 6.2 Oδ2 – Nε1
F457 3.1 Cζ – Cβ 3.5 Cζ – Cβ
F460 6.5 Cε2 – Cδ1 6.5 Cε2 – Cβ
Y520 3.8 Oη – Cβ 3.3 Oη – Cβ
Y523 3.8 Cδ2 – Cβ 3.7 Cδ2 – Cβ
F527 3.9 Cζ – Cη2 4.5 Cε1 – Cε3
H383 3.8 Cγ – Cζ3 3.7 Cγ – Cζ3
Wat11 – 4.5 O – Cδ1
Wat13 – 3.4 O – Nε1
a residues in bold are S2' residues from Georgiadis et al. (2004). In each column the first-
named atom is from the residue side chain, and the second atom is of the RXPA380
tryptophan residue. The italicised residues are those more than 5 Å from the RXPA380
tryptophan.
Equally significant are the discrepancies between the positions of important
residues in the P2' pocket. The prediction underestimates the distances
between valines 379 and 380 and the tryptophan residue by 0.5 and 0.7 Å,
respectively (Table 6). The predicted positions of T282, F457, and F527 also
collectively reduce the volume of the P2' pocket (Fig. 3-17, Table 6).

80
Figure 3-17. Stereoscopic view of alignment of Insight II-generated tACE–RXPA380 model (orange) and experimentally determined tACE-g13–RXPA380 (purple). 32 inhibitor atoms (the Cbz group was excluded) were aligned with r.m.s.d. = 0.61 Å. All water molecules (red spheres) are from the tACE-g13–RXPA380 structure.
The consistent valence force field (CVFF) has its limitations with regard to its
applicability to systems with bonded metals. It is a classical force field, and
has been parameterised for amino acids, proteins and small molecules. As
described in Materials and Methods, this force field is not parameterised to
recognise zinc and therefore the solution around this was to use magnesium
instead. However, the parameters assigned to the metal as a result are
automatically generated, and thus not fully appropriate. The extensible
systematic force field (ESFF) is a more appropriate force field to use, as it
both recognises zinc explicitly and relies on atomic parameters that are
combined with empirically derived rules, which are used to generate force
field parameters.
Another criticism of the RXPA380MM lies in the method of generation of an
average structure. The use of an average conformation may result in a highly
distorted starting model for minimisation, and ultimately a distorted final
model, particularly if the minimisation is not allowed to go on to convergence
(as was the case) (Dr Jodi Shaulsky, personal communication).

81
These criticisms aside, the model-generated structure bore substantial
similarity to the experimentally determined structure. The previously unseen
P2 group is the notable exception, as it was not in the correct position. It
appears that the orientation of this group may have been much closer to that
of the tACE-g13–RXPA380 complex if the methylphenyl group had been
attached to the other oxygen of the carboxy group during the building of the
inhibitor. (But there was no obvious reason to choose one oxygen over the
other.) Put another way, it may be that the modelling allows too much
flexibility in this region where it appears that the spatial constraints imposed
by the protein are reduced. The crystal structure B-factors of the inhibitor
atoms (all below 30 Å2) give no evidence of such a reduction, and therefore
do not support much flexibility for the P2 group.
In any case, optimisation of the protocol, particularly in terms of the use of the
best force field, ESFF, may allow for the confident generation of more putative
ACE–inhibitor complexes that give insight to domain-selective binding without
the difficulties attendant to co-crystallisation.

82
4. CONCLUSIONS

83
4.1. Protein expression, purification
and crystallisation
The expression and purification of the glycosylation mutant tACE-g13 has
proved to be a solid foundation upon which to extend structural investigations
of angiotensin-converting enzyme in our laboratory. Completed and ongoing
work has seen the stable expression of tACE-g13 in Chinese hamster ovary
cells, the crystallisation and structure determination of native tACE-g13
(Gordon et al., 2003; Watermeyer et al., 2006), and now the co-crystallisation
of tACE-g13 with the potent C-domain-selective inhibitor RXPA380. The co-
crystallisation conditions were essentially identical to those for native enzyme
crystallisation, with the addition of a 4-fold molar excess of inhibitor yielding
co-crystals.
4.2. Data collection, structure
solution, refinement and analysis
The successful use of the protein crystallography beamline BM14-UK at the
ESRF in Grenoble, France, is a milestone for South African structural biology.
The structure of tACE-g13–RXPA380 has been solved to 2.7 Å resolution by
molecular replacement, and refined in CNS.
The structure of tACE-g13–RXPA380 represents the structure determination
of an ACE–type I inhibitor complex; that is, of an inhibitor with a P2
constituent group. All published structure complexes are of ACE with type II or
type III inhibitors. This P2 group occupies a large pocket and interacts
hydrophobically with nearby residues.
The P1 phenylpropyl group and P1' pseudoproline groups are in close
alignment to the corresponding P1 phenylpropyl and P1' lysyl groups of the
tACE–lisinopril complex.

84
The P2' group has been considered the determinant of C-domain selectivity.
The interactions revealed by the three-dimensional structure firmly support
this hypothesis, particularly in view of the interactions of hydrophobic V379 and
V380 with the tryptophan indole ring, and of the water molecule that is H-
bonded to both the indole nitrogen and E376. The shorter aspartate residue in
the N-domain replaces this glutamate, and so the interaction is in all likelihood
lost.
4.3. Comparison of modelled tACE-g13–
RXPA380 predictions with experimental
structure
The modelling of the interaction between tACE and RXPA380 provided an
opportunity to assess the quality of the predicted model with respect to the
experimentally determined structure. The INSIGHT II-generated model agreed
well with the experimental structure, with the explainable exception of the P2
group. It appears that the inversion of the carboxyl moiety of the P2 group
could not be corrected during the INSIGHT II dynamics run.
Thus the structure has revealed a binding mode very similar to predictions
made by the synthetic chemists responsible for RXPA380 (Georgiadis et al.,
2004), and in modelling experiments carried out locally. These results suggest
that one can look with confidence upon modelling predictions, although there
were a number of methodological issues to consider. The appropriate choice
of force field was the most important of these.
4.4. Directions for future work
Now that the hypothesis that the S2' pocket interactions are the major driver
of selectivity has been confirmed, it remains to be seen just how the
RXPA380 molecule interacts with the N-domain. In conjunction with such

85
putative crystallographic work, it would also be useful to attempt co-
crystallisation of the N- and C-domains with the other phosphinate inhibitors
synthesised by Dive and colleagues (Dive et al., 1999; Dive et al., 2004;
Georgiadis et al., 2004). The data they have already collected on inhibition,
together with the current study, point to the likelihood that although C-domain
selectivity can be gained or lost by a P2' change alone, the selective binding
of an inhibitor is due to subtler cumulative effects at the binding site and
possibly beyond that. The dynamic aspects of enzyme catalysis have
historically proven difficult to elucidate. For example, nuclear magnetic
resonance spectroscopy studies (Galanis et al., 2003) have not yet provided a
view of the entire enzyme in solution (the progress is reviewed by Spyroulias
et al. (2004)). In addition, although normal-mode analysis work has suggested
a mechanism by which the enzyme may open to allow in substrate or inhibitor
(Watermeyer et al., 2006), the accessibility of the active site has not been
systematically examined, and this may play a more important role than is yet
understood.
Another useful direction to explore is the kinetic and structural
characterisation of tACE-g13 active site mutants, particularly at the S1' and
S2' sub-sites. This work is ongoing in our laboratory, and may bring some
insight into the individual contributions of residues to the selectivity.
The modelling protocol has proved to be useful, although it is not yet optimal.
After optimisation of the protocol the modelling and analysis of binding for
other phosphinate inhibitors is also likely to suggest ways in which to enhance
C-domain selectivity.

86
5. REFERENCES

87
List of References
Acharya KR, Sturrock ED, Riordan JF, Ehlers MR. 2003. Ace revisited: a new
target for structure-based drug design. Nat Rev Drug Discov 2:891-902.
Alberts IL, Nadassy K, Wodak SJ. 1998. Analysis of zinc binding sites in protein
crystal structures. Protein Sci 7:1700-1716.
Araujo MC, Melo RL, Cesari MH, Juliano MA, Juliano L, Carmona AK. 2000.
Peptidase specificity characterization of C- and N-terminal catalytic sites of
angiotensin I-converting enzyme. Biochemistry 39:8519-8525.
Arndt JW, Hao B, Ramakrishnan V, Cheng T, Chan SI, Chan MK. 2002. Crystal
structure of a novel carboxypeptidase from the hyperthermophilic
archaeon Pyrococcus furiosus. Structure (Camb ) 10:215-224.
Azizi M, Rousseau A, Ezan E, Guyene TT, Michelet S, Grognet JM, Lenfant M,
Corvol P, Menard J. 1996. Acute angiotensin-converting enzyme inhibition
increases the plasma level of the natural stem cell regulator N-acetyl-
seryl-aspartyl-lysyl-proline. J Clin Invest 97:839-844.
Baudin B. 2002. New aspects on angiotensin-converting enzyme: from gene to
disease. Clin Chem Lab Med 40:256-265.
Baudin B, Alves N, Pilon A, Beneteau-Burnat B, Giboudeau J. 1997. Structural and
biological roles of glycosylations in pulmonary angiotensin I-converting
enzyme. Glycobiology 7:565-570.
Bersanetti PA, Andrade MC, Casarini DE, Juliano MA, Nchinda AT, Sturrock ED,
Juliano L, Carmona AK. 2004. Positional-scanning combinatorial libraries of
fluorescence resonance energy transfer peptides for defining substrate
specificity of the angiotensin I-converting enzyme and development of
selective C-domain substrates. Biochemistry 43:15729-15736.
Binevski PV, Sizova EA, Pozdnev VF, Kost OA. 2003. Evidence for the negative
cooperativity of the two active sites within bovine somatic angiotensin-
converting enzyme. FEBS Lett 550:84-88.
88
Binkowski TA, Naghibzadeh S, Liang J. 2003. CASTp: Computed Atlas of Surface
Topography of proteins. Nucleic Acids Res 31:3352-3355.
Brew K. 2003. Structure of human ACE gives new insights into inhibitor binding
and design. Trends Pharmacol Sci 24:391-394.
Brooks BR, Bruccoleri RE, Olafson BD, States DJ, Swaminathan S, Karplus M.
1983. CHARMM: A Program for Macromolecular Energy, Minimization, and
Dynamics Calculations. J Comput Chem 4:187-217.
Brown CK, Madauss K, Lian W, Beck MR, Tolbert WD, Rodgers DW. 2001.
Structure of neurolysin reveals a deep channel that limits substrate
access. Proc Natl Acad Sci U S A 98:3127-3132.
Brunger AT, Adams PD, Clore GM, DeLano WL, Gros P, Grosse-Kunstleve RW,
Jiang JS, Kuszewski J, Nilges M, Pannu NS, Read RJ, Rice LM, Simonson T,
Warren GL. 1998. Crystallography & NMR system: A new software suite
for macromolecular structure determination. Acta Crystallogr D Biol
Crystallogr 54:905-921.
Bueno V, Palos M, Ronchi FA, Andrade MC, Ginoza M, Casarini DE. 2004. N-
Domain angiotensin I-converting enzyme expression in renal artery of
Wistar, Wistar Kyoto, and spontaneously hypertensive rats. Transplant
Proc 36:1001-1003.
Bunning P, Holmquist B, Riordan JF. 1983. Substrate specificity and kinetic
characteristics of angiotensin converting enzyme. Biochemistry 22:103-
110.
Bunning P, Riordan JF. 1983. Activation of angiotensin converting enzyme by
monovalent anions. Biochemistry 22:110-116.
Campbell DJ. 1987. Circulating and tissue angiotensin systems. J Clin Invest
79:1-6.
Casarini DE, Plavinik FL, Zanella MT, Marson O, Krieger JE, Hirata IY, Stella RC.
2001. Angiotensin converting enzymes from human urine of mild
hypertensive untreated patients resemble the N-terminal fragment of
human angiotensin I-converting enzyme. Int J Biochem Cell Biol 33:75-85.
Chen R, Li L, Weng Z. 2003. ZDOCK: an initial-stage protein-docking algorithm.
Proteins 52:80-87.
89
Cheng TC, Ramakrishnan V, Chan SI. 1999. Purification and characterization of a
cobalt-activated carboxypeptidase from the hyperthermophilic archaeon
Pyrococcus furiosus. Protein Sci 8:2474-2486.
Chenna R, Sugawara H, Koike T, Lopez R, Gibson TJ, Higgins DG, Thompson JD.
2003. Multiple sequence alignment with the Clustal series of programs.
Nucleic Acids Res 31:3497-3500.
Coates D, Isaac RE, Cotton J, Siviter R, Williams TA, Shirras A, Corvol P, Dive V.
2000. Functional conservation of the active sites of human and Drosophila
angiotensin I-converting enzyme. Biochemistry 39:8963-8969.
Colman PM, Jansonius JN, Matthews BW. 1972. The structure of thermolysin: an
electron density map at 2-3 A resolution. J Mol Biol 70:701-724.
Corradi HR, Schwager SL, Nchinda AT, Sturrock ED, Acharya KR. 2006. Crystal
structure of the N domain of human somatic angiotensin I-converting
enzyme provides a structural basis for domain-specific inhibitor design. J
Mol Biol 357:964-974.
Crackower MA, Sarao R, Oudit GY, Yagil C, Kozieradzki I, Scanga SE, Oliveira-
dos-Santos AJ, da Costa J, Zhang L, Pei Y, Scholey J, Ferrario CM,
Manoukian AS, Chappell MC, Backx PH, Yagil Y, Penninger JM. 2002.
Angiotensin-converting enzyme 2 is an essential regulator of heart
function. Nature 417:822-828.
Cushman DW, Cheung HS, Sabo EF, Ondetti MA. 1977. Design of potent
competitive inhibitors of angiotensin-converting enzyme. Carboxyalkanoyl
and mercaptoalkanoyl amino acids. Biochemistry 16:5484-5491.
Cushman DW, Ondetti MA. 1980. Inhibitors of angiotensin-converting enzyme for
treatment of hypertension. Biochem Pharmacol 29:1871-1877.
Cushman DW, Ondetti MA. 1999. Design of angiotensin converting enzyme
inhibitors. Nat Med 5:1110-1113.
Danilczyk U, Eriksson U, Crackower MA, Penninger JM. 2003. A story of two ACEs.
J Mol Med 81:227-234.
Danser AH, Saris JJ, Schuijt MP, van Kats JP. 1999. Is there a local renin-
angiotensin system in the heart? Cardiovasc Res 44:252-265.
90
Davis IW, Murray LW, Richardson JS, Richardson DC. 2004. MOLPROBITY:
structure validation and all-atom contact analysis for nucleic acids and
their complexes. Nucleic Acids Res 32:W615-W619.
Deddish PA, Marcic B, Jackman HL, Wang HZ, Skidgel RA, Erdos EG. 1998. N-
domain-specific substrate and C-domain inhibitors of angiotensin-
converting enzyme: angiotensin-(1-7) and keto-ACE. Hypertension
31:912-917.
Deddish PA, Wang J, Michel B, Morris PW, Davidson NO, Skidgel RA, Erdos EG.
1994. Naturally occurring active N-domain of human angiotensin I-
converting enzyme. Proc Natl Acad Sci U S A 91:7807-7811.
DeLano WL. 2002. The PyMOL Molecular Graphics System. DeLano Scientific, San
Carlos CA, USA. http://www.pymol.org.
Dive V, Cotton J, Yiotakis A, Michaud A, Vassiliou S, Jiracek J, Vazeux G, Chauvet
MT, Cuniasse P, Corvol P. 1999. RXP 407, a phosphinic peptide, is a potent
inhibitor of angiotensin I converting enzyme able to differentiate between
its two active sites. Proc Natl Acad Sci U S A 96:4330-4335.
Dive V, Georgiadis D, Matziari M, Makaritis A, Beau F, Cuniasse P, Yiotakis A.
2004. Phosphinic peptides as zinc metalloproteinase inhibitors. Cell Mol
Life Sci 61:2010-2019.
Dzau VJ. 1988. Circulating versus local renin-angiotensin system in
cardiovascular homeostasis. Circulation 77:I4-13.
Ehlers MR, Chen YN, Riordan JF. 1991a. Purification and characterization of
recombinant human testis angiotensin-converting enzyme expressed in
Chinese hamster ovary cells. Protein Expr Purif 2:1-9.
Ehlers MR, Chen YN, Riordan JF. 1992. The unique N-terminal sequence of testis
angiotensin-converting enzyme is heavily O-glycosylated and unessential
for activity or stability. Biochem Biophys Res Commun 183:199-205.
Ehlers MR, Riordan JF. 1989. Angiotensin-converting enzyme: new concepts
concerning its biological role. Biochemistry 28:5311-5318.
Ehlers MR, Riordan JF. 1991. Angiotensin-converting enzyme: zinc- and inhibitor-
binding stoichiometries of the somatic and testis isozymes. Biochemistry
30:7118-7126.

91
Ehlers MR, Schwager SL, Scholle RR, Manji GA, Brandt WF, Riordan JF. 1996.
Proteolytic release of membrane-bound angiotensin-converting enzyme:
role of the juxtamembrane stalk sequence. Biochemistry 35:9549-9559.
Ehlers MRW, Chen YN, Riordan JF. 1991b. Purification and characterization of
recombinant human testis angiotensin-converting enzyme expressed in
chinese hamster ovary cells. Protein Expression and Purification 2:1-9.
Erdos EG, Skidgel RA. 1987. The angiotensin I-converting enzyme. Lab Invest
56:345-348.
Erdos EG, Yang HY. 1967. An enzyme in microsomal fraction of kidney that
inactivates bradykinin. Life Sci 6:569-574.
Eriksson U, Danilczyk U, Penninger JM. 2002. Just the beginning: novel functions
for angiotensin-converting enzymes. Curr Biol 12:R745-R752.
Esther CR, Marino EM, Howard TE, Machaud A, Corvol P, Capecchi MR, Bernstein
KE. 1997. The critical role of tissue angiotensin-converting enzyme as
revealed by gene targeting in mice. J Clin Invest 99:2375-2385.
Fernandez JH, Hayashi MA, Camargo AC, Neshich G. 2003. Structural basis of the
lisinopril-binding specificity in N- and C-domains of human somatic ACE.
Biochem Biophys Res Commun 308:219-226.
Ferrario CM, Iyer SN. 1998. Angiotensin-(1-7): a bioactive fragment of the renin-
angiotensin system. Regulatory Peptides 78:13-18.
Friedland J, Silverstein E. 1976. A sensitive fluorimetric assay for serum
angiotensin-converting enzyme. Am J Clin Pathol 66:416-424.
Galanis AS, Spyroulias GA, Pierattelli R, Tzakos A, Troganis A, Gerothanassis IP,
Pairas G, Manessi-Zoupa E, Cordopatis P. 2003. Zinc binding in peptide
models of angiotensin-I converting enzyme active sites studied through
1H-NMR and chemical shift perturbation mapping. Biopolymers 69:244-
252.
Gall AL, Ruff M, Kannan R, Cuniasse P, Yiotakis A, Dive V, Rio MC, Basset P,
Moras D. 2001. Crystal structure of the stromelysin-3 (MMP-11) catalytic
domain complexed with a phosphinic inhibitor mimicking the transition-
state. J Mol Biol 307:577-586.

92
Georgiadis D, Beau F, Czarny B, Cotton J, Yiotakis A, Dive V. 2003. Roles of the
two active sites of somatic angiotensin-converting enzyme in the cleavage
of angiotensin I and bradykinin: insights from selective inhibitors. Circ Res
93:148-154.
Georgiadis D, Cuniasse P, Cotton J, Yiotakis A, Dive V. 2004. Structural
determinants of RXPA380, a potent and highly selective inhibitor of the
angiotensin-converting enzyme C-domain. Biochemistry 43:8048-8054.
Gewirth D, Majewski W. 2003. The SCALEPACK Manual, p. 88-96. In The HKL
Manual.
Glaeser R, Facciotti M, Walian P, Rouhani S, Holton J, MacDowell A, Celestre R,
Cambie D, Padmore H. 2000. Characterization of conditions required for X-
Ray diffraction experiments with protein microcrystals. Biophys J 78:3178-
3185.
Goodsell DS, Morris GM, Olson AJ. 1996. Automated docking of flexible ligands:
applications of AutoDock. J Mol Recognit 9:1-5.
Gordon K, Redelinghuys P, Schwager SL, Ehlers MR, Papageorgiou AC, Natesh R,
Acharya KR, Sturrock ED. 2003. Deglycosylation, processing and
crystallization of human testis angiotensin-converting enzyme. Biochem J
371:437-442.
Hooper NM. 1994. Families of zinc metalloproteases. FEBS Lett 354:1-6.
Houard X, Williams TA, Michaud A, Dani P, Isaac RE, Shirras AD, Coates D, Corvol
P. 1998. The Drosophila melanogaster-related angiotensin-I-converting
enzymes Acer and Ance--distinct enzymic characteristics and alternative
expression during pupal development. Eur J Biochem 257:599-606.
Hurst D, Rylett CM, Isaac RE, Shirras AD. 2003. The drosophila angiotensin-
converting enzyme homologue Ance is required for spermiogenesis. Dev
Biol 254:238-247.
Jaspard E, Wei L, Alhenc-Gelas F. 1993. Differences in the properties and
enzymatic specificities of the two active sites of angiotensin I-converting
enzyme (kininase II). Studies with bradykinin and other natural peptides. J
Biol Chem 268:9496-9503.

93
Jones TA, Bergdoll M, Kjeldgaard M. 1990. O: A macromolecular modeling
environment. In: Crystallographic and Modeling Methods in Molecular
Design. Eds.: C. Bugg & S. Ealick. 189-195.
Junot C, Gonzales MF, Ezan E, Cotton J, Vazeux G, Michaud A, Azizi M, Vassiliou
S, Yiotakis A, Corvol P, Dive V. 2001. RXP 407, a selective inhibitor of the
N-domain of angiotensin I-converting enzyme, blocks in vivo the
degradation of hemoregulatory peptide acetyl-Ser-Asp-Lys-Pro with no
effect on angiotensin I hydrolysis. J Pharmacol Exp Ther 297:606-611.
Kasturi S, Jabbar MA, Sen GC, Sen I. 1994. Role of glycosylation in the
biosynthesis and activity of rabbit testicular angiotensin-converting
enzyme. Biochemistry 33:6228-6234.
Kim H, Lipscomb WN. 1990. Crystal structure of the complex of carboxypeptidase
A with a strongly bound phosphonate in a new crystalline form:
comparison with structures of other complexes. Biochemistry 29:5546-
5555.
Kim HM, Shin DR, Yoo OJ, Lee H, Lee JO. 2003. Crystal structure of Drosophila
angiotensin I-converting enzyme bound to captopril and lisinopril. FEBS
Lett 538:65-70.
Kim J, Hewitt G, Carroll P, Sieburth SM. 2005. Silanediol inhibitors of angiotensin-
converting enzyme. Synthesis and evaluation of four diastereomers of
Phe[Si]Ala dipeptide analogues. J Org Chem 70:5781-5789.
Kim J, Sieburth SM. 2004. A silanediol inhibitor of the metalloprotease
thermolysin: synthesis and comparison with a phosphinic acid inhibitor. J
Org Chem 69:3008-3014.
Kissinger CR, Gehlhaar DK, Fogel DB. 1999. Rapid automated molecular
replacement by evolutionary search. Acta Crystallogr D Biol Crystallogr
55:484-491.
Kleywegt GJ, Jones TA. 1996. xdlMAPMAN and xdlDATAMAN - programs for
reformatting, analysis and manipulation of biomacromolecular electron-
density maps and reflection data sets. Acta Crystallogr D Biol Crystallogr
52:826-828.

94
Kost OA, Bovin NV, Chemodanova EE, Nasonov VV, Orth TA. 2000. New feature
of angiotensin-converting enzyme: carbohydrate-recognizing domain. J
Mol Recognit 13:360-369.
Kost OA, Orth TA, Nikolskaya II, Nametkin SN, Levashov AV. 1998.
Carbohydrates regulate the dimerization of angiotensin-converting
enzyme. Biochem Mol Biol Int 44:535-542.
Kuster DJ, Marshall GR. 2005. Validated ligand mapping of ACE active site. J
Comput Aided Mol Des 19:609-615.
Laskowski RA, MacArthur MW, Moss DS, Thornton JM. 1993. PROCHECK: a
program to check the stereochemical quality of protein structures. J Appl
Cryst 26:283-291.
Lipscomb WN. 1983. Structure and Catalysis of Enzymes. Annual Review of
Biochemistry 52:17-34.
Marti-Renom MA, Stuart AC, Fiser A, Sanchez R, Melo F, Sali A. 2000.
Comparative protein structure modeling of genes and genomes. Annu Rev
Biophys Biomol Struct 29:291-325.:291-325.
Matthews BW. 1988. Structural Basis of the Action of Thermolysin and Related
Zinc Peptidases. Acc Chem Res 21:333-340.
Mayer D, Naylor CB, Motoc I, Marshall GR. 1987. A unique geometry of the active
site of angiotensin-converting enzyme consistent with structure-activity
studies. J Comput Aided Mol Des 1:3-16.
Natesh R, Schwager SL, Evans HR, Sturrock ED, Acharya KR. 2004. Structural
details on the binding of antihypertensive drugs captopril and enalaprilat
to human testicular angiotensin I-converting enzyme. Biochemistry
43:8718-8724.
Natesh R, Schwager SL, Sturrock ED, Acharya KR. 2003. Crystal structure of the
human angiotensin-converting enzyme-lisinopril complex. Nature
421:551-554.
Nchinda AT, Chibale K, Redelinghuys P, Sturrock ED. 2006a. Synthesis and
molecular modeling of a lisinopril-tryptophan analogue inhibitor of
angiotensin I-converting enzyme. Bioorg Med Chem Lett 16(17):4616-
4619.

95
Nchinda AT, Chibale K, Redelinghuys P, Sturrock ED. 2006b. Synthesis of novel
keto-ACE analogues as domain-selective angiotensin I-converting enzyme
inhibitors. Bioorg Med Chem Lett 16(17):4612-4615.
Oefner C, Arcy A, Hennig M, Winkler FK, Dale GE. 2000. Structure of human
neutral endopeptidase (neprilysin) complexed with phosphoramidon.
Journal of Molecular Biology 296:341-349.
Ondetti MA, Rubin B, Cushman DW. 1977. Design of specific inhibitors of
angiotensin-converting enzyme: new class of orally active
antihypertensive agents. Science 196:441-444.
Otwinowski Z, Minor W. 1997. Processing of X-ray Diffraction Data Collected in
Oscillation Mode. Methods Enzymol 276:307-326.
Oudit GY, Crackower MA, Backx PH, Penninger JM. 2003. The role of ACE2 in
cardiovascular physiology. Trends Cardiovasc Med 13:93-101.
Patchett AA, Harris E, Tristram EW, Wyvratt MJ, Wu MT, Taub D, Peterson ER,
Ikeler TJ, ten Broeke J, Payne LG, Ondeyka DL, Thorsett ED, Greenlee WJ,
Lohr NS, Hoffsommer RD, Joshua H, Ruyle WV, Rothrock JW, Aster SD,
Maycock AL, Robinson FM, Hirschmann R, Sweet CS, Ulm EH, Gross DM,
Vassil TC, Stone CA. 1980. A new class of angiotensin-converting enzyme
inhibitors. Nature 288:280-283.
Redelinghuys P, Nchinda AT, Sturrock ED. 2005. Development of domain-
selective Angiotensin I-converting enzyme inhibitors. Ann N Y Acad Sci
1056:160-175.
Rhaleb NE, Peng H, Harding P, Tayeh M, LaPointe MC, Carretero OA. 2001. Effect
of N-acetyl-seryl-aspartyl-lysyl-proline on DNA and collagen synthesis in
rat cardiac fibroblasts. Hypertension 37:827-832.
Riordan JF. 2003. Angiotensin-I-converting enzyme and its relatives. Genome Biol
4:225.
Ronin C, Granier C, Caseti C, Bouchilloux S, Van Rietschoten J. 1981. Synthetic
substrates for thyroid oligosaccharide transferase. Effects of peptide chain
length and modifications in the Asn-Xaa-Thr-region. Eur J Biochem
118:159-164.

96
Rousseau A, Michaud A, Chauvet MT, Lenfant M, Corvol P. 1995. The
hemoregulatory peptide N-acetyl-Ser-Asp-Lys-Pro is a natural and specific
substrate of the N-terminal active site of human angiotensin-converting
enzyme. J Biol Chem 270:3656-3661.
Sadhukhan R, Sen GC, Ramchandran R, Sen I. 1998. The distal ectodomain of
angiotensin-converting enzyme regulates its cleavage-secretion from the
cell surface. Proc Natl Acad Sci U S A 95:138-143.
Sali A, Blundell TL. 1993. Comparative protein modelling by satisfaction of spatial
restraints. J Mol Biol 234:779-815.
Schechter I, Berger A. 1967. On the size of the active site in proteases. I. Papain.
Biochem Biophys Res Commun 27:157-162.
Schuttelkopf AW, van Aalten DM. 2004. PRODRG: a tool for high-throughput
crystallography of protein-ligand complexes. Acta Crystallogr D Biol
Crystallogr 60:1355-1363.
Shapiro R, Riordan JF. 1984. Inhibition of angiotensin converting enzyme:
dependence on chloride. Biochemistry 23:5234-5240.
Siviter RJ, Taylor CA, Cottam DM, Denton A, Dani MP, Milner MJ, Shirras AD,
Isaac RE. 2002. Ance, a Drosophila angiotensin-converting enzyme
homologue, is expressed in imaginal cells during metamorphosis and is
regulated by the steroid, 20-hydroxyecdysone. Biochem J 367:187-193.
Skeggs LT, Jr., Kahn JR, Shumway NP. 1956. The preparation and function of the
hypertensin-converting enzyme. J Exp Med 103:295-299.
Skidgel RA, Erdos EG. 1985. Novel activity of human angiotensin I converting
enzyme: release of the NH2- and COOH-terminal tripeptides from the
luteinizing hormone-releasing hormone. Proc Natl Acad Sci U S A 82:1025-
1029.
Soubrier F, Alhenc-Gelas F, Hubert C, Allegrini J, John M, Tregear G, Corvol P.
1988. Two putative active centers in human angiotensin I-converting
enzyme revealed by molecular cloning. Proc Natl Acad Sci U S A 85:9386-
9390.

97
Soubrier F, Wei L, Hubert C, Clauser E, Alhenc-Gelas F, Corvol P. 1993. Molecular
biology of the angiotensin I converting enzyme: II. Structure-function.
Gene polymorphism and clinical implications. J Hypertens 11:599-604.
Spyroulias GA, Galanis AS, Pairas G, Manessi-Zoupa E, Cordopatis P. 2004.
Structural features of angiotensin-I converting enzyme catalytic sites:
conformational studies in solution, homology models and comparison with
other zinc metallopeptidases. Curr Top Med Chem 4:403-429.
Strater N, Lipscomb WN. 1995. Transition state analogue L-leucinephosphonic
acid bound to bovine lens leucine aminopeptidase: X-ray structure at 1.65
A resolution in a new crystal form. Biochemistry 34:9200-9210.
Sturrock ED, Natesh R, van Rooyen JM, Acharya KR. 2004. Structure of
angiotensin I-converting enzyme. Cell Mol Life Sci 61:2677-2686.
Tatei K, Cai H, Ip YT, Levine M. 1995. Race: a Drosophila homologue of the
angiotensin converting enzyme. Mech Dev 51:157-168.
Thunnissen MMGM, Andersson B, Samuelsson B, Wong CH, Haeggstrom JZ. 2002.
Crystal structures of leukotriene A4 hydrolase in complex with captopril
and two competitive tight-binding inhibitors. FASEB J 16:1648-1650.
Tipnis SR, Hooper NM, Hyde R, Karran E, Christie G, Turner AJ. 2000. A human
homolog of angiotensin-converting enzyme. Cloning and functional
expression as a captopril-insensitive carboxypeptidase. J Biol Chem
275:33238-33243.
Towler P, Staker B, Prasad SG, Menon S, Tang J, Parsons T, Ryan D, Fisher M,
Williams D, Dales NA, Patane MA, Pantoliano MW. 2004. ACE2 X-ray
structures reveal a large hinge-bending motion important for inhibitor
binding and catalysis. J Biol Chem 279:17996-18007.
Turbanti L, Cerbai G, Di Bugno C, Giorgi R, Garzelli G, Criscuoli M, Renzetti AR,
Subissi A, Bramanti G, DePriest SA. 1993. 1,2-Cyclomethylenecarboxylic
monoamide hydroxamic derivatives. A novel class of non-amino acid
angiotensin converting enzyme inhibitors. J Med Chem 36:699-707.
Turner AJ, Hooper NM. 2002. The angiotensin-converting enzyme gene family:
genomics and pharmacology. Trends Pharmacol Sci 23:177-183.

98
Tzakos AG, Galanis AS, Spyroulias GA, Cordopatis P, Manessi-Zoupa E,
Gerothanassis IP. 2003. Structure-function discrimination of the N- and C-
catalytic domains of human angiotensin-converting enzyme: implications
for Cl- activation and peptide hydrolysis mechanisms. Protein Eng 16:993-
1003.
Tzakos AG, Gerothanassis IP. 2005. Domain-selective ligand-binding modes and
atomic level pharmacophore refinement in angiotensin I converting
enzyme (ACE) inhibitors. Chembiochem 6:1089-1103.
Watermeyer JM. 2004. Human testis angiotensin-converting enzyme: Crystal
structure of a glycosylation mutant and investigation of a putative hinge
mechanism by normal mode analysis. M.Sc. thesis. University of Western
Cape, South Africa.
Watermeyer JM, Sewell BT, Schwager S, Natesh R, Corradi HR, Acharya KR,
Sturrock ED. 2006. Structure of testis ACE glycosylation mutants and
evidence for conserved domain movement. Biochemistry 45:12654-12663.
Wei L, Alhenc-Gelas F, Corvol P, Clauser E. 1991. The two homologous domains
of human angiotensin I-converting enzyme are both catalytically active. J
Biol Chem 266:9002-9008.
Wei L, Clauser E, Alhenc-Gelas F, Corvol P. 1992. The two homologous domains
of human angiotensin I-converting enzyme interact differently with
competitive inhibitors. J Biol Chem 267:13398-13405.
Williams TA, Corvol P, Soubrier F, Clauser E. 1994. A recombinant form of
angiotensin converting enzyme expressed from baculovirus-infected insect
cells. Biochimie 76:312-314.
Williams TA, Michaud A, Houard X, Chauvet MT, Soubrier F, Corvol P. 1996.
Drosophila melanogaster angiotensin I-converting enzyme expressed in
Pichia pastoris resembles the C domain of the mammalian homologue and
does not require glycosylation for secretion and enzymic activity. Biochem
J 318 ( Pt 1):125-131.
Woodman ZL, Oppong SY, Cook S, Hooper NM, Schwager SL, Brandt WF, Ehlers
MR, Sturrock ED. 2000. Shedding of somatic angiotensin-converting
enzyme (ACE) is inefficient compared with testis ACE despite cleavage at
identical stalk sites. Biochem J 347 Pt 3:711-718.

99
Yiotakis A, Lecoq A, Nicolaou A, Labadie J, Dive V. 1994. Phosphinic peptide
analogues as potent inhibitors of Corynebacterium rathayii bacterial
collagenase. Biochem J 303 (Pt 1):323-327.
Yu XC, Sturrock ED, Wu Z, Biemann K, Ehlers MR, Riordan JF. 1997. Identification
of N-linked glycosylation sites in human testis angiotensin-converting
enzyme and expression of an active deglycosylated form. J Biol Chem
272:3511-3519.
Zaman MA, Oparil S, Calhoun DA. 2002. Drugs targeting the renin-angiotensin-
aldosterone system. Nat Rev Drug Discov 1:621-636.
AMDG