the strategic marketing institute€¦ · the strategic marketing institute. 2 table of contents...
TRANSCRIPT
1
Rapid Opportunity Assessment: Major Field Crops
William A. Knudson and H. Christopher Peterson
The Hale Group, Technical and Market Advisors
March 2005
The Strategic Marketing Institute

2
Table of Contents
Page No.
How to Use this Rapid Opportunity Assessment……………………………………….. 4
Executive Summary…………………………………………………………………….. 7
Introduction…………………………………………………………………………….. 13
Economic and Demographic Factors Affecting the Agri-Food System……………….. 14
The Demand Drivers Affecting the Agri-Food System…………………………….….. 21
Wheat
Background…………………………………………………………………….. 33
Cake…………………………………………………………………………….. 37
Cookies………………………………………………………………………… 42
Crackers………………………………………………………………………… 46
Bread……………………………………………………………………………. 50
Cereal…………………………………………………………………………… 54
Cereal Bars……………………………………………………………………… 57
Corn
Background…………………………………………………………………….. 61
Feed……………………………………………………………………………. 65
Cereal………………………………………………………………………….. 66
Cereal Bars…………………………………………………………………….. 69
Cooking Oil……………………………………………………………………. 73
Corn Syrup……………………………………………………………………… 77
Snack Products………………………………………………………………….. 80

3
Table of Contents (cont.)
Page No.
Soybeans
Background…………………………………………………………………… 84
Feed…………………………………………………………………………... 87
Food Products………………………………………………………………… 88
Soymilk………………………………….……………………………………. 92
Cooking Oil……………………………..…………………………………….. 95
Edamame……………………………………………………………………... 100
Fuel and Industrial Uses……………………………………………………………… 103
Conclusion……………………………………………………………………………. 109
References……………………………...…………………………………………….. 111

4
How to Use this Rapid Opportunity Assessment
If you are reading this assessment, then there is a strong probability that you are
interested in understanding and seeking out high-value products and businesses. This is
to say, you are seeking differentiated or niche products and not commodities. Business
success and profitability with differentiated or niche products typically rely on three
success factors: (1) a unique idea for a product or service, or a unique process to
produce, deliver, or market a product or service, (2) the entrepreneurial skill and drive to
commercialize the idea, and (3) a sound business or product development plan to bring
the product to market.
This rapid opportunity assessment gives insights into where potentially
successful and profitable unique product ideas may be found in today’s marketplace.
The assessment points the direction toward likely uniqueness in two ways. First, critical
customer trends are highlighted: wellness, indulgence, convenience, value and ethnicity.
In addition, demographics are presented to support these trends. Any unique product idea
today must address one or more of the five trends or the key demographics in some
significant way. Second, product categories are then analyzed to determine which have
greater or lesser potential to capitalize on the trends and demographics. Profitable
business and product ideas will be those that are more unique, more likely to fit the trends
and more likely to fit the product categories with the greatest potential.
What this assessment does not do is present profit or detailed sales estimates for
a particular product or business. At the specific product level, prices, costs, and the
market volumes for these high value products are not necessarily known. If they are
known, the information is likely proprietary. Profit and sales estimates for unique

5
products can only arise from the additional work typically done in a business or product
development plan. Feasibility studies to determine profitability are often complex and
rely on specific and well defined product ideas. In addition, they analyze the set of
current and likely competitors for that product or service, a defensible competitive
strategy, estimates of total capital required to be successful, and an assessment of the
major risks involved in the proposed venture. All of these factors must be done for the
specific opportunity under consideration. If this assessment provided information on
specific products claiming to be unique, such a claim would not likely be true because the
idea would be well known and the profit potential has probably already been tapped by
others.
If you are an agricultural producer or other business person elsewhere in the
agri-food system, you can use this assessment in one of two ways. First, if you have a
specific product idea in mind, you can use the analysis in this assessment to confirm or
test the potential of that idea in regard to (1) whether it goes with or against the five
trends and demographics driving consumer demand today, and (2) whether it fits in a
product category that has broad, selective, or limited potential. Ideas that go against
trend or arise from a more limited category are not necessarily ideas to avoid. These
ideas need considerably more care to define whether customers see the value in the
product.
If you do not have a specific product idea but would like to create one, then the
second way to use this assessment is to learn about key market trends and product
categories. Product or business innovations that are on-trend or fall into the broader
opportunity categories are good places to spend time developing a unique product or

6
attribute or unique method of production, marketing, or delivery. The process of idea
creation is not an easy one, but there are ways to take on this task. For example, you can
ask yourself what is missing from existing products or businesses in the market. You
could also visit with potential customers and ask what they like or dislike about current
market offerings. Your creativity is central to discovering the specific idea.
If you are a policy maker, economic developer, industry association executive or
faculty member interested in these markets, you can also use the assessment in your
work. You may be asked to support business efforts in developing or commercializing
new products or businesses. Policy changes, industry-wide strategies, product-based
research or infrastructure development are some of the many supporting activities that
may be critical to allowing agri-food firms to convert opportunities into profitable
businesses or products. This assessment suggests potential areas for judging where your
support might be most beneficial. Again, greater potential for success arises from
product ideas that go with the trends and fall into the broader opportunity categories. If
an idea that is seeking support falls outside the trends or in the narrower opportunity
categories, you should scrutinize that idea more heavily as opposed to just saying no to
the idea.
In summary, this rapid opportunity assessment identifies the potential for business
and product success across broad product and attribute categories, and thus the
assessment provides a basis for sound planning. The assessment has been thoroughly
researched based on relevant public and private information sources. This assessment
can help you start the business or product development process, but it is not an end in
itself.
7
Executive Summary
Wheat, corn and soybeans are the major field crops grown in Michigan, Ohio and
Wisconsin. They account for most of the acreage dedicated to agricultural production
and much of the farm income generated. Wheat is primarily used for food purposes; the
soft wheat varieties grown in the three state area are particularly well suited for specialty
wheat products. Corn and soybeans have a wide range of uses: feed, food, fuel and
industrial markets use corn and soybeans. This rapid opportunity assessment will analyze
all these markets.
There are several important economic and demographic forces that are affecting
the dairy industry. The economic force is the slow but steady rising affluence of
American society. The demographic factors are an aging population, smaller households,
and an increase in ethnic diversity.
These factors in turn have created a set of five demand drivers. Smaller
households, an aging population, and a more affluent society have increased the demand
for products that are convenient for the consumer. Another impact of an aging
population is an increased interest in foods that promote wellness. More ethnic diversity
has increased the demand for authentic foods with foreign tastes and flavors. The interest
in ethnic foods is one aspect of the third demand driver of indulgence. Indulgence is a
broad category that covers many product attributes and characteristics. Products that
appeal to indulgence are those designed to meet the consumer’s deeply felt desires as
opposed to their needs. The final demand driver is value, for many consumers price is
still an important consideration. Products that appeal to value will remain important in
the agri-food system.

8
This rapid opportunity assessment analyzes the demand drivers of convenience,
ethnicity, indulgence, value, and wellness with the product forms used for wheat corn and
soybeans. An important consideration when analyzing wheat, corn and soybeans is that
these commodities are inputs in the production of final consumer products. To a great
extent, the demand for the raw product is dependent or derived from the demand for the
final products. The intersection of product form and demand driver can be seen as a
market. The product form-demand driver for tables for wheat, corn and soybeans is
shown below.
Demand Driver/Product Form Matrix (Wheat)Product Form Convenience Ethnicity Indulgence Value WellnessCakes/Pastries Selective Selective Broad Limited LimitedCookies Limited Selective Broad Limited LimitedCrackers Limited Limited Selective Limited SelectiveBread Limited Selective Broad Limited BroadCereal Limited Selective Selective Limited SelectiveCereal Bars Selective Selective Broad Limited Broad
Demand Driver/Product Form Matrix (Corn)Product Form Convenience Ethnicity Indulgence Value WellnessFeed Limited Limited Limited Limited LimitedCereal Limited Selective Broad Limited BroadCereal Bars Selective Selective Broad Limited BroadCooking Oil Limited Limited Limited Limited SelectiveSweetner Limited Limited Limited Limited LimitedSnack Products Selective Selective Broad Limited Selective

9
Demand Driver/Product Form Matrix (Soybeans)Product Form Convenience Ethnicity Indulgence Value WellnessFeed Limited Limited Limited Limited LimitedFood Products Selective Selective Selective Selective BroadSoymilk Limited Broad Broad Limited BroadCooking Oil Limited Limited Limited Limited SelectiveEdamame Limited Limited Limited Limited Limited
Corn and soybeans are also used for industrial and fuel purposes. These markets
are very different than the food and feed markets outlined in the matrix, the primary
demand driver in these markets is value. Nonetheless, the industrial and fuel markets are
of growing importance and are analyzed in the rapid opportunity assessment.
Some markets show more potential than others. Markets with limited potential
are those where new innovations are less likely to be successful. New innovations in
these markets would be working against the overall trends. Markets with selective
potential have some possibilities for some success; the overall trends are neither positive
nor negative for innovation. Markets with broad potential have the highest probably for
successful innovation; the demand drivers are inclined to accept new products and supply
chain introductions. However, it should be noted introducing a product where the
opportunities are limited is not necessarily doomed to failure and introducing a product
where the opportunities are broad is not a guaranteed success.
There is one major challenge facing farmers and firms in the field crop sector if
they are interested in capturing some of the opportunities outlined below. In order to take
full advantage of market opportunities farmers and firms may need to work
collaboratively. Farmers and firms will have to work together to develop supply chains
that allow them to develop products consumers want. Wheat, corn and soybeans are
commodities and inputs into consumer products. They must be altered in some way to

10
create consumer products. Whether by cooperatives, contracts, mergers, strategic
alliances or by other methods, group action will likely be needed to develop and market
consumer products that obtain higher prices. An individual entrepreneur will find it very
difficult to enter some of these markets even through the overall demand drivers are
positive
Wheat
Of the three crops analyzed in this report, wheat is the only one primarily used as
an input into food products. Given the size of some of the firms in the industries and the
maturity of most of the markets, the ability to develop products that appeal to the demand
driver of value is very limited. Overall products that appeal to the demand driver of
indulgence show the most potential. The wheat varieties grown in Michigan, Ohio and
Wisconsin are well suited to production of cakes and other snack and dessert items. Of
particular interest are artisan breads, this market would allow smaller firms to occupy a
niche while appealing offering products that a core group of consumers are very
interested in.
Another way to develop products is combine indulgence with other demand
drivers. Two demand drivers that show some degree of promise are ethnicity and
wellness. The whole grain movement is gaining steam due to health reasons, and wheat
based products that appeal to ethnic groups such as Hispanics could be developed.
Corn and wheat are used in cereals and cereal bars. The cereal bar market is
growing rapidly and shows additional potential for expansion. However, this industry
and the cereal industry are dominated by large firms. The barriers to entering these
markets are extremely high.

11
Corn and Soybeans
Feed remains the most important use for corn and soybeans. Feed is a
commodity, and therefore price is the most important consideration. A positive trend for
the feed industry is the strong demand for animal protein. This will bolster the demand
for feed. Another possible market for feed is organic, organic feed needs to be fed to
animals whose products are certified organic as this market grows the demand for organic
feed will also increase.
The cooking oil and corn syrup industries are also mature industries with
little potential for growth. As is the case with feed, cooking oil and corn syrup and
basically commodities, as such, value is the overriding concern for consumers. This
limits the opportunities for entrepreneurs and others interested in these markets.
Overall there are some possible opportunities in the corn snack markets.
This includes tortilla chips and other corn based snack items. It is likely that products
that appeal directly to ethnicity have not been fully exploited. The same holds true for
products that appeal to indulgence and wellness. To be successful however, a firm will
have to develop niche markets that appeal to a small group of consumers. Competing
directly against Frito-Lay is not likely to be an effective strategy.
The market for soymilk and other soybean based foods is increasing rapidly.
These products appeal to wellness as well as other demand drivers. Products that provide
wellness and taste stand a good chance of being accepted by consumers. Many of these
markets are developing which provides opportunities for firms that enter the market in
the near future. This opportunity may not exist for very long however as large food

12
processors and manufacturers are increasingly interested in the soybean based food and
beverage market.
There is a great deal of interest in the energy and industrial markets.
However, as is the case with food oil and feed industries, fuel and industrial products
tend to be commodities. As such, value becomes the main demand driver. Furthermore,
there are some serious issues with the ethanol and biodiesel market. Currently, the
capacity to produce biodiesel is greater than the demand. This may soon be the case with
ethanol as well as additional capacity is added in that industry.
For the most part, the industrial markets are still developing. Corn and soybean
products can be used for a wide range of products including, but not limited to, plastics,
solvents, soaps, ink, etc. These products have many advantages including
biodegradeability, ease of handling, low impact on the environment, etc. However, cost
remains an issue for many of these products.

13
RAPID OPPORTUNITY ASSESSMENT: MAJOR FIELD CROPS
Introduction This rapid opportunity assessment will analyze various opportunities for three
major field crops: wheat, soybeans and corn. In the case of wheat the focus will be on
food uses. Soybeans and corn have multiple uses. The majority of corn and soybeans are
used to feed livestock. However, some corn and soybeans are used for human food.
Corn and soybeans products also have applications for energy and industrial use. To give
a complete picture, the market for nonfood uses will also be considered as a separate
section at the end of this report.
This assessment will discuss the economic and demographic forces affecting the
agri-food system including the demand drivers affecting the agri-food system. Wheat,
soybeans and corn will be discussed in turn. This assessment will identify the relative
potential for products in different markets and how they interact with the major demand
drivers.
There is one major challenge facing farmers and firms in the field crop sector if
they are interested in capturing some of the opportunities outlined below. In order to take
full advantage of market opportunities farmers and firms may need to work
collaboratively. Farmers and firms will have to work together to develop supply chains
that allow them to develop products consumers want. Wheat, corn and soybeans are
commodities and inputs into consumer products. They must be altered in some way to
create consumer products. Whether by cooperatives, contracts, mergers, strategic
alliances or by other methods, group action will likely be needed to develop and market
consumer products that obtain higher prices.

14
Economic and Demographic Forces Affecting the Agri-Food System Introduction One economic force and three demographic forces are critically affecting the agri-
food system. The economic force is the slow but steady growing affluence of U.S.
society. More and more U.S. households now have increasing amounts of discretionary
income. The three demographic forces are smaller households, an aging population, and
a more ethnically diverse population. While these demographic forces are distinct, they
often reinforce their impacts on the agri-food system. This is particularly true for smaller
households and the aging population.
These societal changes have led to the development of several drivers in food
demand. These demand drivers are as follows: an increased demand for wellness, an
increased interest in ethnic foods, indulgence as an attribute, and an increased demand for
convenience. Another attribute of food products, value, is not a new trend but remains
an important consideration for many consumers. These trends will be discussed below in
further details
Each of the economic and demographic forces will be discussed in turn. Then the
relationship between the forces and the demand drives will be addressed. This will
include further analysis and definition of the demand drivers.
Increase in Income
Over time, most households in the U.S. have seen their incomes increase. This
has allowed them to increase their purchases. Table 1 shows the growth in incomes from
1970 to 2000. Of particular importance is the growth in the number of households that
earn more than $75,000 a year. It is at this level that many households begin to have
15
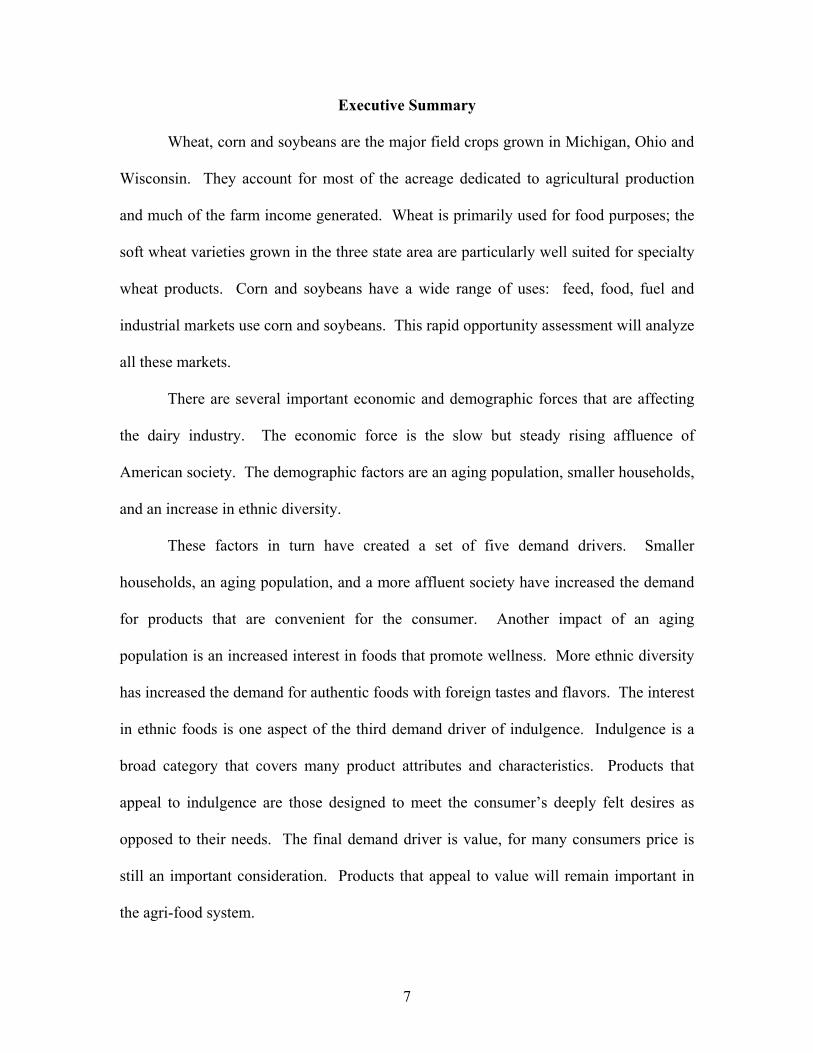
discretionary income to spend. The growth in the number of these households has been
referred to as the emergence of mass affluence (Nunes, Johnson and Breene, p. 96).
Table 1: Distribution of Income 1970-2000 (Percent of Households)
Year Under $5,000
$5,000 to
$9,999
$10,000 to
$14,999
$15,000 to
$24,999
$25,000 to
$34,999
$35,000 to
$49,999$50,000 to
$74,999$75,000 to
$99,999$100,000 and over
2000 2.9 6.1 7.0 13.4 12.5 15.5 18.9 10.4 13.41990 3.2 7.7 7.5 14.1 13.7 17.2 18.8 9.1 8.71980 3.1 8.9 8.2 15.5 14.0 18.9 18.7 7.5 5.21970 4.8 8.7 7.6 15.2 16.3 21.0 17.6 5.4 3.4
Source: U.S. Census Bureau
These figures have been adjusted for inflation using the Consumer Price Index (CPI) and
are in terms of 2000 dollars.
In 2000, those households that earned $75,000 or more per year made up 23.8
percent of all households. That figure was only 8.8 percent in 1970. The number of
households earning more than $100,000 a year increased by almost 400 percent from
1970 to 2000, and increased by 54 percent from 1990 to 2000. Conversely, households
earning less than $15,000 a year accounted for 21 percent of all households in 1970 and
16 percent of all households in 2000. This trend can also be seen in the increase in
median income. Median income was $33,746 in 1970 (in 2000 dollars), and was $42,148
in 2000; an increase of almost 25 percent (U.S. Census Bureau, Money Income in the
United States: 2000, p. 17). Clearly there has been a consistent increase in the level of
disposable income over the past thirty years. This allows more and more consumers to
purchase goods and services that have luxury attributes.

16
While it is true that affluence has been increasing over time, it is also true that
many households have modest incomes. There is still a large market available for firms
and products that focus on value.
Smaller Households
While household incomes have increased the size of households has declined
somewhat. This reinforces the trend for more discretionary income. Smaller households
mean there are fewer household members who have needs to be met, and more income
available for discretionary purchases.
The trend for smaller households has been consistent and will likely continue in
the future. Table two gives the average size of households in the U.S. from 1970 to 2000.
Table 2: Average Size of Household: 1970-2000Year Persons Per Household1970 3.141980 2.761990 2.63
2000* 2.59
* estimateSource: U.S. Census Bureau
Since 1970, the size of the average household has declined by more than 17.5 percent.
The average household size is projected to be 2.53 in 2010 (Day, p. 10). While the rate
of decline is slowing down, the trend for smaller families will continue.
Smaller households have impacted the agri-food system in a number of ways.
Smaller more affluent households have more discretionary income to spend in any way
they please. It may be the case that smaller households will place more emphasis on
convenience; it may be easier to justify time and effort spent on cooking for larger
families than for smaller families. Smaller families also imply that a higher percentage of
17
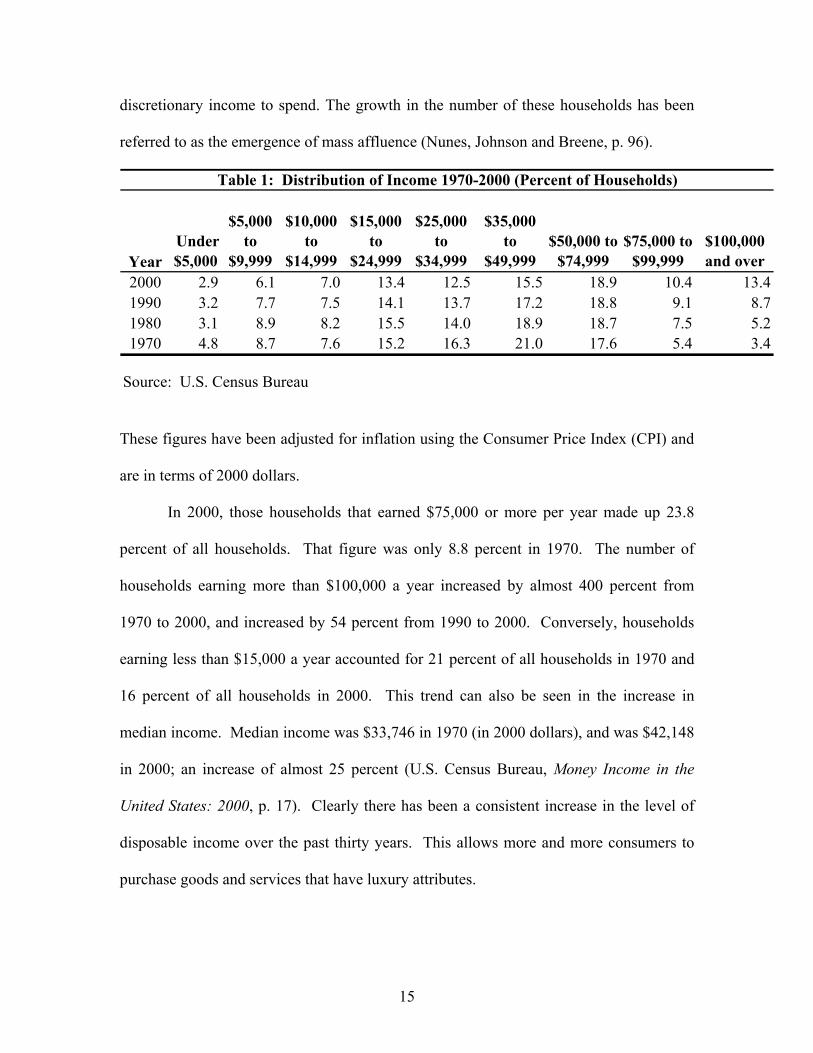
family members are working. This is reinforced by labor participation rates. Figure 3
shows the overall labor participation rates, those for men and those for women from 1970
to 2000.
Table 3: Labor Participation Rates Total and by Sex: 1970-2000Year Total Men Women1970 57.5 76.2 40.81980 59.2 72.0 47.71990 62.8 72.0 54.32000 64.8 71.9 57.5
Source: Bueau of Labor Statistics
Table 3 shows that the labor force participation rates for men have been steady since
1980. The increase in the total labor participation rate is completely due to women
entering the labor force. More people working means less time for other activities such
as cooking. Households are more likely to substitute eating away from home and easy to
make meals for traditional home cooked meals.
An Aging Population
Another demographic change affecting the U.S. agri-food system is the fact that
the U.S. population is aging. At the beginning of the 20th Century only 4.1 percent of the
population was aged 65 or older (Hobbs and Stoops, p. A-19). The trend towards an
older population is outlined in table 4.

18
Table 4: Percentage of the Population 65 Years and Older: 1970-2000Year Percentage of the Population 65 Years and Older1970 9.91980 11.31990 12.62000 12.4
2010* 13.22020* 16.5
* Estimate
Source: U.S. Census Bureau
While the percentage of the population aged 65 and older declined in relative terms from
1990 to 2000, it actually increased in total numbers. In 2000, there were 34,991,753
persons 65 or older (Hobbs and Stoops, p. A-17), an increase of 12 percent over 1990.
The increase in the level of immigration (which tends to be younger people), has
moderated the relative increase in age. Nonetheless the number of older residents of the
U.S. is increasing.
Furthermore, it is expected to increase in the future. A large population cohort
(the baby boomers) will soon be adding to the numbers of persons over 65. Table 4
shows the middle series estimate for the number of persons 65 and older in 2010 and
2020. It is estimated that the number of person 65 and older will account for 16.5 percent
of the population in 2020. If this is the case, one person in 6 in the U.S. will be in this
age group.
A potential market of 35 million people, and expected to increase is large. Older
residents have different nutritional issues than younger members of society. Wellness
will be an issue for some of these consumers. Convenience and packaging designed for
single serve meals will also be important for a large number of older consumers. Some
19
older consumers are on limited and fixed incomes. Consumers in this situation will be
value conscious.
Ethnic Diversity
The U.S. is becoming more ethnically diverse. Partially this is due to higher
birthrates among some ethnic groups, but to a great extent the increased diversity is due
to increased immigration from other countries. Two of the major areas of growth are in
the number of Asian and Hispanic residents. Of the 33.5 million foreign born persons
living in America 17.9 million are from Latin America (including the Caribbean) and 8.4
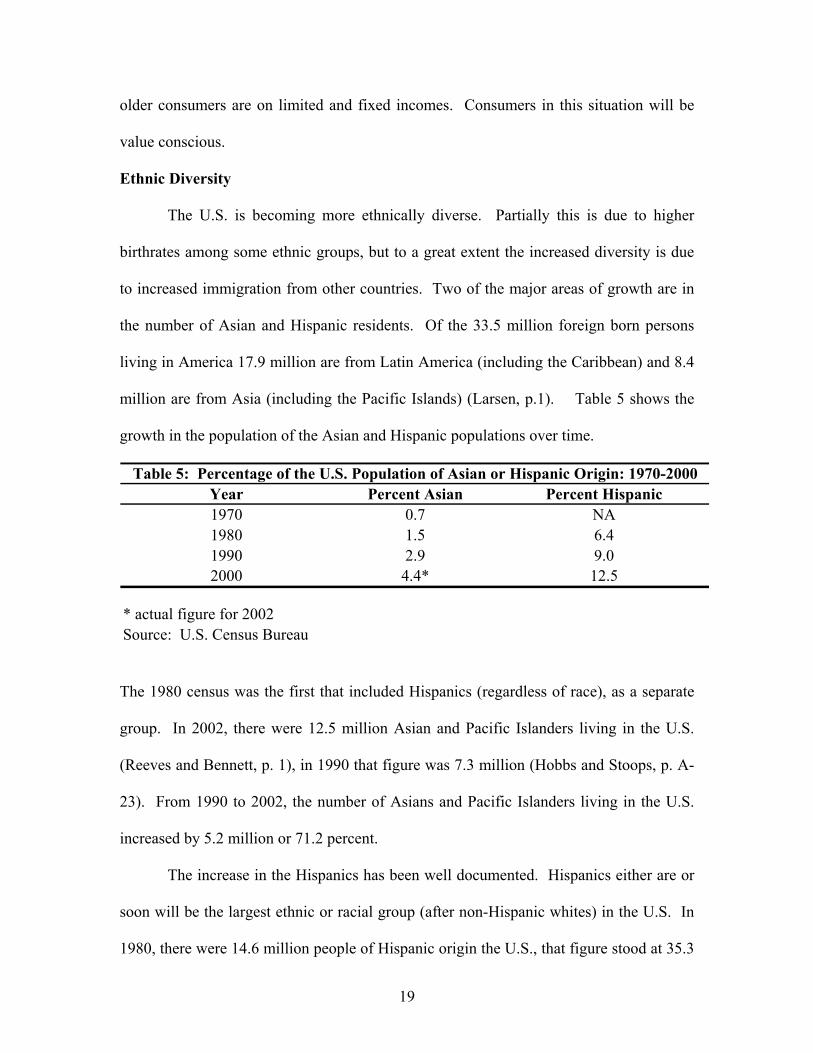
million are from Asia (including the Pacific Islands) (Larsen, p.1). Table 5 shows the
growth in the population of the Asian and Hispanic populations over time.
Table 5: Percentage of the U.S. Population of Asian or Hispanic Origin: 1970-2000Year Percent Asian Percent Hispanic1970 0.7 NA1980 1.5 6.41990 2.9 9.02000 4.4* 12.5
* actual figure for 2002Source: U.S. Census Bureau
The 1980 census was the first that included Hispanics (regardless of race), as a separate
group. In 2002, there were 12.5 million Asian and Pacific Islanders living in the U.S.
(Reeves and Bennett, p. 1), in 1990 that figure was 7.3 million (Hobbs and Stoops, p. A-
23). From 1990 to 2002, the number of Asians and Pacific Islanders living in the U.S.
increased by 5.2 million or 71.2 percent.
The increase in the Hispanics has been well documented. Hispanics either are or
soon will be the largest ethnic or racial group (after non-Hispanic whites) in the U.S. In
1980, there were 14.6 million people of Hispanic origin the U.S., that figure stood at 35.3

20
million in 2000 (Hobbs and Stoops, p. A-37); the number of Hispanics increased by
141.2 percent in 20 years. It is expected that there will be 43.7 million Hispanics in
2010, which is estimated to be 14.6 percent of the population. While this growth is spread
throughout the country, it is concentrated in the Southwest.
However, it is important to note that this level of aggregation does not tell the
whole story. The tastes and preferences of many Indians are different than those of many
Chinese. The same is true in the Hispanic community; the tastes and preferences of
Puerto Ricans and Cubans are going to be different than those of Mexicans and
Guatemalans. This creates a number of opportunities for firms interested in meeting the
needs of these groups of consumers.
The most obvious impact the increased diversity of U.S. society has on the agri-
food industry is in the market driver of ethnicity. This impact is felt to two ways; first the
immigrants will likely want authentic food from their native societies. This desire may
decline in second and succeeding generations. It may be the case that the desire for
convenience may drive the market for ethnic foods towards massed produced
homogenized products, similar to what has happened with much of Italian and Chinese
food, and perhaps what is currently happening with Mexican food. However, it should be
noted that many members of these groups have limited incomes. This is particularly true
of immigrants and those with a Hispanic background. Value will continue to be an
important attribute for many of these consumers.
The other ethnic trend is for increased consumption of foreign influenced foods
by other ethnic and racial groups. The desire to try something different and to diversify
their menu choices has also increased the demand for ethnic and ethnically influenced

21
foods. For example, many customers at Mexican and Thai restaurants are not Mexicans
and Thais respectively.
The Demand Drivers Affecting the Agri-Food System
There has been some discussion of the demand drivers affecting the food system
in the section on economics and demographics but these drivers have not been analyzed
in detail. The demand drivers of wellness, ethnicity, convenience, indulgence, and value
will be discussed in turn. Much of the information on these demand drivers was the
result of discussions between researchers at Michigan State University and the Hale
Group.
Wellness
There are several aspects to wellness. One aspect is the desire for food products
that do not cause harm as a result of pathogens and carcinogens. Examples are foods that
are free of e-coli, hepatitis A and other pathogens that cause food poisoning. BSE
remains a concern for some consumers. Pesticide residues remain a concern for some,
not for their impact on the environment as much as its safety in food products. The
growth in the organic market is driven more by the desire to consume safe foods as it is
by environmental concerns (Mintel, Organic Foods and Beverages, p. 11).
Obesity is a major health issue facing U.S. society. Table 6 shows the percentage
of Americans 18 and over who are overweight or obese.

22
Table 6: Percentage of Overweight and Obsese Adults 1994 - 2002Year Percent Overweight Percent Obese1994 35.4 14.41996 35.4 16.81998 36.3 18.32000 36.7 20.92002 37.0 22.1
Source: Mintel
In 2002, 59.1 percent of the population was either overweight or obese. It is anticipated
that the figures are even worse for 2004. This epidemic now includes children.
According to the Centers for Disease Control, 15.6 percent of people between the ages of
6 and 19 are overweight (Mintel, Sugar and Sweeteners, p.11). The number of
overweight and obese people has become a major health policy issue. Foods that address
this issue may find a market provided that taste is not sacrificed.
Another aspect of wellness is avoidance of foods that contribute to chronic
diseases and conditions such as hypertension, and heart disease. Many of these diseases
are a result of obesity. The interest in low carbohydrate foods are an example of this
consumer trend, as are foods and beverages that are promoted as being low in fat and
calories. It is likely that once trans fatty acids are added to food labels there will be a
movement away from foods that possess this characteristic.
The interest in wellness appears to be a global phenomenon. The Mintel Group’s
Global New Product Database (gnpd) tracks new product introductions throughout the
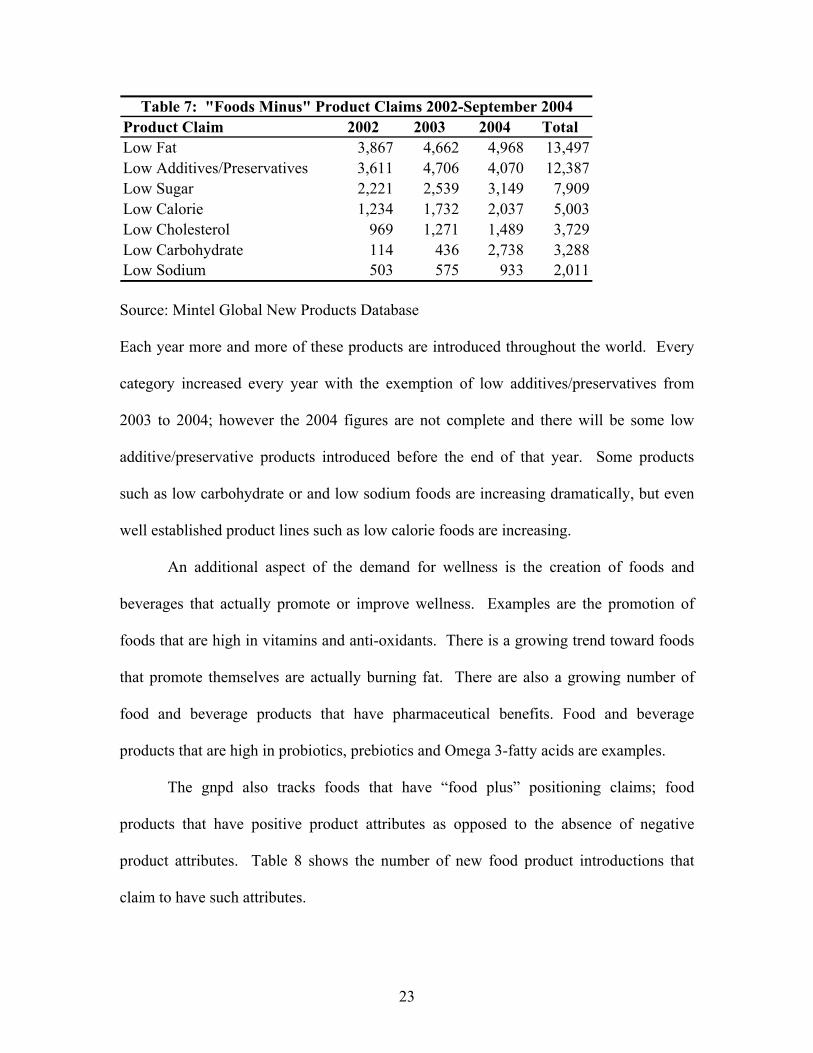
world. Table 7 shows the new product introductions with what the gnpd refers to as
“foods minus” claims; new food products that claim to have little or none of a negative
product attributes.
23
Table 7: "Foods Minus" Product Claims 2002-September 2004Product Claim 2002 2003 2004 TotalLow Fat 3,867 4,662 4,968 13,497Low Additives/Preservatives 3,611 4,706 4,070 12,387Low Sugar 2,221 2,539 3,149 7,909Low Calorie 1,234 1,732 2,037 5,003Low Cholesterol 969 1,271 1,489 3,729Low Carbohydrate 114 436 2,738 3,288Low Sodium 503 575 933 2,011
Source: Mintel Global New Products Database
Each year more and more of these products are introduced throughout the world. Every
category increased every year with the exemption of low additives/preservatives from
2003 to 2004; however the 2004 figures are not complete and there will be some low
additive/preservative products introduced before the end of that year. Some products
such as low carbohydrate or and low sodium foods are increasing dramatically, but even
well established product lines such as low calorie foods are increasing.
An additional aspect of the demand for wellness is the creation of foods and
beverages that actually promote or improve wellness. Examples are the promotion of
foods that are high in vitamins and anti-oxidants. There is a growing trend toward foods
that promote themselves are actually burning fat. There are also a growing number of
food and beverage products that have pharmaceutical benefits. Food and beverage
products that are high in probiotics, prebiotics and Omega 3-fatty acids are examples.
The gnpd also tracks foods that have “food plus” positioning claims; food
products that have positive product attributes as opposed to the absence of negative
product attributes. Table 8 shows the number of new food product introductions that
claim to have such attributes.

24
Table 8: "Food Plus" Positioning Claims 2002-September 2004Product Claim 2002 2003 2004 TotalVitamin/Mineral Fortified 4,599 4,846 4,238 13,683All Natural 2,233 2,985 3,136 8,354Organic 2,661 2,681 2,016 7,358Vegetarian 1,774 1,982 1,912 5,668Added Calcium 1,315 1,231 989 3,535Added Fiber 690 677 545 1,912Diabetic 153 302 583 1,038
Source: Mintel Global New Products Database
As is the case for table 7, the figures for 2004 are not for the full year. There has been an
explosion of food items geared for people with diabetes. There has also been an increase
in the number of food items that claim to be all natural. However, the “food plus” market
does not seem to be as well developed as the “food minus” market. One implication of
this is that there may be more room for growth and new product development in the area
of “food plus” products.
There are a number of economic and demographic factors that have made
wellness a demand driver. An older and more sedentary population is more interested in
food and beverage items that either improve health or do not adversely affect health.
Chronic problems such as diabetes and osteoporosis are also driving the demand for
products that are low in sugar and carbohydrates as well and the demand for food and
beverages with added calcium. Some consumers now have the income to afford to pay
for products that impact health in a positive way.
Ethnicity
Ethnic products can be defined as those that have food and beverage traits that
appeal to specific ethnic groups. This driver has two sub-categories: foods with an

25
authentic appeal to the ethnic group itself; and foods marketed to the wider U.S.
population that has been influenced by ethnic tastes and ingredients.
Obviously, a major source of this demand driver is the growing ethnic diversity of
the U.S. This has impacted the demand for number of ethnic foods and markets. Food
retailing firms that are geared towards Asian products have become common. Restaurant
establishments that specialize in Indian, Thai, and Middle Eastern cuisines are also
becoming more common.
The influence of ethnic food will likely become more widespread. Americanized
versions of foreign foods have developed. This has happened with Italian food, and may
be happening with Mexican food. These foods will be a combination of foreign and
American tastes. Flavors typically thought of foreign, such as curry, might work their
way into foods traditionally thought of as American.
Another major factor influencing the ethnicity is increasing affluence. This has
allowed some members of society to travel widely and experience different cultures. It
has also allowed increased experimentation with foreign foods, particularly in a
restaurant setting. Most foreign restaurants depend on the patronage of other ethnic
groups to stay in business.
Ethnic foods appeal to some consumers’ sense of adventure. These consumers
are looking for new flavors, tastes and food experiences. In this respect, the ethnic food
driver is very similar to the indulgence driver.
Indulgence
Indulgence is a broad category that covers many product attributes and
characteristics. Products that appeal to indulgence are those designed to meet the

26
consumer’s deeply felt desires as opposed to their needs. However, these desires also
may include the consumer’s belief system and other very important aspects of the
consumer’s life. Indulgence in this sense does not necessarily mean unimportant or
frivolous, but rather food and beverage items need to possess characteristics above and
beyond the simple ability to maintain life or to provide minimum quality at a minimum
price.
As a result, indulgence can cover a wide range of products. One such
characteristic is luxury. Examples include beer from a microbrewery, expensive wines
and chocolates, gourmet coffees and cheeses. According to a survey, 45 percent of the
respondents stated they enjoyed eating foreign foods (Mintel, Edible Fats and Oils, p.11).
Another aspect of indulgence is cooking as a hobby, cooking gourmet meals as a lifestyle
choice. According to one survey, 20 percent of respondents like to cook for fun and 49
percent “really enjoy” cooking (Mintel, Edible Fats and Oils, p.11). For some cooking
and preparing food is a basis for social connectedness, an opportunity to interact with
others. Fine dining at a restaurant is another example of using luxury appealing to the
sense of indulgence. The experience of the food and atmosphere meeting the desire of
the consumer is the primary indulgence attribute. This includes the desire to experience
new foods, tastes and varieties.
Emotional connectedness is also an attribute of indulgence. Some foods appeal to
a consumer’s sense of nostalgia. The phrase “comfort food” points this out. Meat loaf
and homemade chocolate chip cookies are examples of foods that appeal to emotional
connectedness.

27
Another aspect of indulgence foods is its ability to reflect the values of
consumers. Examples of this are dairy and meat products from animals raised in a
manner perceived as being humane, such as free range chicken and milk from cows that
are not treated with hormones. Consumers who purchase organic foods or foods grown
in the area they live primarily because of their minimal effects on the environment are
another example. Increasing ethnicity is also reflected in the values of consumers. A
growing Muslim population will increase the demand for foods processed in a manner
that conforms to Muslim dietary laws.
The primary source of the growth of indulgence products is rising affluence,
although this demand driver also interacts somewhat with the wellness driver. A
consumer may buy fewer candy bars to keep the weight off but the candy bars he or she
buys are more expensive, and are of higher quality or more exciting taste and variety.
Affluent, less price conscious consumers will look for products that satisfy more than
their needs, they will look for products that enhance their lifestyle, their values and their
beliefs. Smaller households also allow consumers with few or no children to experiment
and seek out experiences.
A secondary source of the growth of indulgence is an aging population.
Households with the income and the time are better able to pursue hobbies and develop
new interests. This includes new experiences with food and beverages.
Convenience
Of all the demand drivers shaping the agri-food system convenience may be the
most important. Convenience can be defined as anything that makes life easier for the
consumer such as: prepared foods that can be consumed “on the run” or at home; hand

28
held foods that enable the consumer to do something else while eating such as driving;
partially prepared foods that reduce or eliminate preparation time e.g. instant oatmeal,
precut salads; foods in packaging that makes consumption easier such as microwavable
popcorn, Lunchables, and single serve yogurts; or bundling of products such as
Hamburger Helper, frozen dinners etc.
Several factors have led to the demand for convenience. Smaller families
increase the per person time and effort cost of cooking. It also makes packaging for
smaller households more important. More women in the workforce and daily commutes
also reduce the amount of time many households have for food preparation. The work
week of many households has increased also reducing the time available for preparing
meals.
For many households that earn $75,000 or more, time has become more valuable
than money. As a result, these households are willing to pay a price premium for foods
that are convenient. Additional packaging, ease of use etc. in exchange for a higher price
is considered a good trade-off for these consumers.
While time is one important aspect of convenience it is not the only one. Another
important aspect of convenience is ease of preparation. Pre-cut salads are an example.
Another example is the growth of foods that can be prepared in one dish, such as
premixed crock pot dishes. These meals are very easy to prepare but may actually take
several hours to cook. However, there is little oversight or thought involved in the actual
cooking of the meal.

29
Another consideration of convenience is the development of meal solutions.
Packaged or pre-prepared food items that provide an entire meal. Meal solutions not only
save time and effort, but also reduce time shopping and planning meals.
Value
The final demand driver is the best understood. Food and beverages that meet the
consumer’s needs at the lowest price fulfill the consumer’s preference for value. Price
coupled with a basic level of performance is the hallmark of value.
There are a number of examples that appeal to value. Private label brands that
sell at a price discount are an example, as are canned fruits and vegetables. Certain
restaurant chains that sell pre-made standardized products are another example.
While perhaps less exciting than the other demand drivers, value will continue to
be important with many consumers. The 76.2 percent of households that earn less than
$75,000 will likely remain price conscious for many, if not most products. This is
particularly true for those households that earn less than $50,000 which is still more than
50 percent of all households. Immigrants with limited incomes may also be value
oriented. In some respects this limits the ability to charge price premiums for ethnic
foods.
An aging population may also place more emphasis on value. Many retired
people have fixed incomes. Policy issues such as rising health care and the future
viability of Social Security may also affect the purchasing choices of older consumers,
and may force consumers to become more price sensitive.
30
Implications for Firms in the Agri-Food System
The number of drivers has increased the opportunities for firms in the agri-food
system. Controlling costs will continue to be the most important aspect for firms
interested in providing products that offer value to consumers. To be successful
providing value, a firm will need to be the low cost producer.
Costs are less important in providing products that address the other drivers.
Increased ethnicity will increase the demand for authentic foreign foods and foods that
are influenced by foreign flavors and characteristics. This increases the range of products
that can be offered to consumers, and creates additional markets available to firms in the
agri-food industry. This transcends beyond the Mexican market and includes markets
such as the Indian and Middle Eastern market.
Convenience remains a very important demand driver. More affluent households
facing time constraints place a higher value on foods that are easy to prepare and can be
consumed on while doing something else. Smaller households increase the demand for
packaging that reflects servings for one or two individuals. This demand driver is well
understood, but opportunities remain.
Wellness is a driver that presents a great deal of potential for firms willing to meet
this driver. An aging and affluent society is becoming more interested in healthy foods,
both those foods that are free of “bads” such as fat and sodium and have more “goods”
such as antioxidants and vitamins and other attributes. This demand driver also has a
great deal of potential in the area of nutraceuticals and other functional foods. In many
ways, the wellness market is just developing as the science and consumer awareness

31
continues to grow. This is an area that may have a great deal of potential for firms and
new product introductions.
Of all the demand drivers, indulgence perhaps provides the most options for firms
in the agri-food sector. Indulgence covers many submarkets including luxury, social
interaction, and environmental and religious concerns to name a few. Also there are
many consumer segments that agri-food firms may wish to pursue. Insofar as indulgence
appeals to the most deeply held preferences and beliefs of these consumers the potential
to obtain price premiums may be the highest.
One way firms in the agri-food industry can capture higher profits is by
developing products and markets that address one or more of these drivers. Examples
include prepared ethnic foods that would appeal to ethnicity, convenience and perhaps
indulgence. Another would be prepared organic foods in single serve containers; this
would appeal to wellness and convenience while taking into account smaller household
size. Products that appeal to a number of drivers simultaneously have a great deal of
potential.
The Demand Drivers and the Feed Market
As previously mentioned, wheat, corn and soybeans are commodities; inputs in
the production of food products. In the case of corn and soybeans, this is complicated
further by the fact that most corn and soybeans are used for feed. This means that to a
great extent the demand for corn and soybeans is related to the demand for meat and
dairy products. Fortunately, the demand drivers for many types of meat products are
positive.
32
It is estimated that per capita meat consumption will reach an all time high of 224
pounds a year in 2005 (Southard, p. 14). This represents an increase of 4.9 percent
increase over 2001. Per capital chicken consumption is estimated to be 86.7 pounds, beef
consumption is estimated to be 65.9 pounds, and pork is estimated to be 52.0 pounds.
Chicken consumption continues to increase the fastest while beef and pork production are
expected to increase slightly from 2004 levels. The demand for many dairy products is
strong, particularly for developing markets such as smoothies and yogurt drinks.
However, the number of dairy cows is expected to decline from 9.1 million in 2003 to 8.9
million in 2005 (Southard, p. 16), a decline of 2.2 percent. Increases in output per cow
will more than offset the reduction in the number of cows.
Demand Drivers and Fuel and Industrial Products
There has been increased interest in the use of soybeans and corn for industrial
and fuel products. Corn is used for ethanol production and soybeans are used for
biodiesel production. The production of both ethanol and biodiesel is increasing for a
number of reasons. A major demand driver for ethanol and biodiesel production is
government subsidies. At current prices ethanol and biodiesel are not competitive with
petroleum based fuels. However, the interest in rural development, energy independence,
and a cleaner environment has led to government policies designed to foster the
development of the ethanol and biodiesel industries. Further developments in processing
and ethanol and biodiesel yields from corn and soybeans could also make these products
more competitive on a cost basis with petroleum based products. On the other hand, a
reduction or elimination of the government subsidies could destroy these industries.

33
Corn and soybeans also have a wide range of industrial uses. These include
plastics, soaps, lubricants, inks and a wide range of other products. Insofar as these
products are biodegradable disposal is less of an issue. The toxicity of these products is
also very low. As a result, these bio-based industrial products have advantages to the
environment. However, to gain more widespread acceptance, these products must also be
cost competitive with the products they compete against. Value is a major demand
driver for industrial products, and firms that purchase such products will favor the low
cost source.
Wheat
Background
The highest and best use for wheat is human consumption. In the U.S. low
quality wheat can be used for animal feed (Beuerlein, p.1). Production of wheat in
Michigan, Ohio and Wisconsin is shown in Table 9. More than 95 percent of the wheat
produced in the Michigan and Ohio is
Table 9: Wheat Production Michigan, Ohio, Wisconsin 1999-2003Michigan Ohio Wisconsin
Year Acres PlantedProduction (Bushels) Acres Planted
Production (Bushels)
Acres Planted Winter Wheat
Production Winter Wheat
(Bushels)Acres Planted Spring Wheat
Production Spring Wheat
(Bushels)1999 560,000 37,950,000 1,050,000 72,100,000 125,000 7,200,000 8,000 280,0002000 530,000 36,000,000 1,120,000 79,920,000 140,000 8,370,000 9,000 360,0002001 520,000 32,640,000 950,000 60,300,000 170,000 10,400,000 8,000 308,0002002 450,000 29,480,000 860,000 50,220,000 200,000 11,285,000 8,000 231,0002003 680,000 44,880,000 1,060,000 68,000,000 205,000 12,075,000 7,000 225,000
Source: National Agricultural Statistics Service

34
either Soft Red Winter or Winter White. These varieties are used for specialty bakery
products such as cakes, pastries, crackers, etc. (Beuerlein, p. 1). The vast majority of
wheat produced in Wisconsin is also winter wheat, but there is a small amount of spring
wheat production in the state.
Since these types of wheat are used for specific products, only the following
products will be analyzed: cakes and pastries, cookies, crackers, cereal, cereal bars and
bread. For purposes of this report cakes include snack cakes, cupcakes and brownies and
other types of pastries; cookies include fudge covered cookies, fruit cookies, shortbread
cookies and biscotti (a long thin, crisp cookie); crackers include saltines, graham, cheese
crackers (such as Ritz), and grain based products (such as wheat thins). Cereal refers to
breakfast cereals and cereal bars includes ready to eat bars that are made of wheat and
other grains. Bread includes traditional bread varieties, specialty, tortillas, dinner rolls,
croissants and English muffins. Another bread group that shows some a great deal of
growth potential are artisan breads, these are bread products made by hand with little, if
any, in the way of additives or preservatives. It should be noted, given the types of wheat
grown in the three state region, that some of these products may not be able to be
produced with soft wheat varieties.
The preceding discussion allows for an analysis of selected wheat products by
product form and demand driver. The intersection of product form and demand driver
can be seen as a market. Some markets show more potential than others. Markets with
limited potential are those where new innovations are less likely to be successful. New
innovations would be working against the overall trends; the innovation would have to be
superior in order to be successful. Markets with selective potential have some

35
possibilities for some success; the overall trends are neither positive nor negative for
innovation. Markets with broad potential have the highest probability for successful
innovation; the demand drivers are inclined to accept new products and supply chain
innovation.
Table 10 shows the relationship between product form and the demand drivers.
Table 10: Demand Driver/Product Form Matrix (Wheat)Product Form Convenience Ethnicity Indulgence Value WellnessCakes/Pastries Selective Selective Broad Limited LimitedCookies Limited Selective Broad Limited LimitedCrackers Limited Limited Selective Limited SelectiveBread Limited Selective Broad Limited BroadCereal Limited Selective Selective Limited SelectiveCereal Bars Selective Selective Broad Limited Broad
Table 10 shows that there are some areas that show promise, particularly with respect to
offering products that appeal to indulgence. Products that address more than one of these
demand drivers have the greatest odds of success. Given the maturity of some of these
industries, the size of the firms involved, and the difficulty of obtaining retail space,
focusing on value has the least probability of success.
Table 11 outlines the size of certain consumer industries that are dependent on
wheat in 2003, and the percentage change from 2002.

36
Table 11: Size and Growth Rates for Selected Wheat Based Products 2003Retail Mass Merchandise Food Service* Industrial* Total
ProductSales
(millions)
Growth Rate
(percent)Sales
(millions)
Growth Rate
(percent)Sales
(millions)
Growth Rate
(percent)Sales
(millions)
Growth Rate
(percent)Bread $14,900.0 0.7 $7,400.0 17.3 $23,200.0 1.1 $107.5 0.5 $45,607.5Cake $4,300.0 4.4 $43.0 -11.3 $1,350.0 3.2 NA NA $5,693.0Cereal $6,170.0 -0.1 $1,200.0 6.6 $420.0 1.9 NA NA $7,790.0Cereal Bars $2,100.0 12.7 $173.0 25.6 $314.0 9.0 NA NA $2,587.0Cookies $5,947.0 -2.9 $767.0 -2.9 $1,007.0 2.5 NA NA $7,721.0Crackers $3,500.0 2.6 $148.0 2.4 $49.3 -1.0 NA NA $3,697.3Total $36,917.0 $9,731.0 $26,340.3 NA NA*Estimate
As can be seen from these figures, most sales occur in a traditional supermarket setting
(the primary source of retail sales), although mass merchandisers are an increasing
purveyor of some types of products particularly, bread and cereal. Cereals and cereal
products include all types of products, not just wheat based products. As can be seen in
table 11 most of these markets are growing slowly with the exception of cereal bars.
While these markets are mature, there have been some product introductions.
Table 12, shows the number of cake, cookie and cracker introductions from 2002 through
the first quarter of 2004. These are worldwide introduction of products.
Table12: New Product Introductions 2002-2004
Product 2002 2003
First Quarter
2004 TotalCakes/Pastries 1,486 1,496 464 3,446Cookies 2,512 2,985 972 6,469Crackers 624 833 241 1,698 Bread 194 192 NA 386Cereal 113 163* NA 276Cereal Bars 312 400 475** 1,187
* For the first 10 months of 2003** For the first 11 months of 2004
Source: Mintel

37
This table needs to be interpreted carefully. These figures only include new products and
line extensions; they do not include new packaging or products that are flagged as “new
and improved”. It is safe to say that true product innovation in terms of a revolutionary
product or distribution technique is very rate. Most of these new product introductions
are in terms of additional flavors, and line extensions of existing products. Most
innovations in these industries are evolutionary not revolutionary in nature.
However, table 11 does present some interesting information. Cookies and
related products are by far and away have the most new product introductions. Crackers
and related products lag behind. Cookies are very convenient and can also be eaten in
small quantities. In fact many cookie manufacturers sell and package cookies
individually. Crackers are a traditional and well established food product. It may be the
case that manufacturers see less need for introductions. Cake and pastries are somewhere
in between cookies and crackers in terms of new product development. Bread and
breakfast cereals are mature well established markets and are staple products the rate of
innovation in these markets at the retail level at least, lag the other products. Cereal bars
which include both breakfast items and snack items show a growing rate of product
introduction.
Cake
Background
This sector is growing. From 1998 to 2003 sales in this category of food product
grew at an annual rate of 5.8 percent (Mintel, Cakes, p.1). Retail sales of cakes were $4.3
billion in 2003. It is estimated that retail sales will reach almost $6 billion by 2008 an
increase of 35 percent from 2003 (Mintel, Cakes, p.62). Much of this growth was in the

38
area of cakes provided by in store bakeries. In store bakeries now account for more than
half of retail cake sales (Mintel, Cakes, p.1). Retail sales of cupcakes and brownies are
flat (Mintel, Cakes, p. 22).
According to a survey conducted by Mintel, one-third of those surveyed bought a
ready to eat dessert in the previous month (Mintel, Cakes, p.7). Of these consumers, one
third purchased custom made desserts (Mintel, Cakes, p.7). Snack cakes were
particularly popular with households that had children (Mintel, Cakes, p.7).
The vast majority of cake and related products are distributed through
supermarkets and wholesale clubs such as Sam’s Club. It is estimated that 99 percent of
retail sales are through these channels (Mintel, Cakes, p.40). Cracking this market
channel presents a challenge but there may be other market channels such as specialty
stores, and convenience stores to investigate.
The cake industry is not concentrated, but it is very competitive. The largest firm,
Interstate Bakeries Company (Hostess) had a market share of 15.9 percent. However, the
firm is currently in Chapter 11 bankruptcy. Private label brands account for 34.0 percent
of all sales, and other firms (besides the top 4 firms) account for 23.0 percent (Mintel,
Cakes, p. 26). There does seem to be potential for firms that are interested in cake and
related products. In order to take advantage of this, potential firms may need to develop
alternative market channels, such as direct sales, or sales to specialty stores or
convenience stores.
Convenience – Selective
There does appear to be opportunities for cake products in the area of
convenience. Smaller households have created a need for single serving products. Single

39
serve cakes are more profitable than a typically sized cake (Mintel, Cakes, p.41). Also,
many consumers are too busy, uninterested, or lack the skills to do their own baking.
There are increased offering of single serve products (Mintel, Cakes, p.17). Generating
products that appeal to both convenience and indulgence could be very successful.
One group to target is males, particularly younger males. Young men tend to be
impulse buyers and snackers. They also tend to buy single serving packaging, and make
purchases from convenience stores (Mintel, Cakes, p. 38). Men also tend to purchase
ready-make cakes; women are more likely to custom order their cake products (Mintel,
Cakes, p.51).
While there are opportunities for innovations that address the demand driver of
convenience there remain the difficulties of developing new market channels and
distribution systems. Overall there appears to be selective opportunities for firms
interested in addressing the demand driver of convenience.
Ethnicity – Selective
Black households are most likely to consume snack cake products; 70 percent of
black households use dry cake mixes and 72 percent buy snack cakes. Across all
products Asians are least likely to consume these products; 41 percent use dry cake mixes
and buy snack cakes. Hispanics consume less than whites and blacks but more than
Asians; 43 percent use dry cake mixes, and 50 percent buy snack cakes (Mintel, Cakes,
p.55). However, if new products featuring textures and flavors preferred by Hispanics
and Asians were introduced, the market in ethnic cakes and dessert products could
increase. The fact that products designed specifically for ethnic consumers is probably

40
underserved creates selective opportunities for firms interested in creating products to
address this demand driver.
Indulgence – Broad
The fact that one-third of those surveyed who bought these types of desserts
purchased a custom-made product shows that there is a good potential for products that
appeal to indulgence. Taste is a major factor in cake purchases (Mintel, Cakes, p.17).
Another trend is an increased interest in retro desserts such as Moon Pies that appeal to
childhood memories for aging baby boomers (Mintel, Cakes, p.13).
New flavors such as combining chocolate with herbs or spices are also becoming
increasingly popular (Mintel, Cakes, p. 14). People also appear to be willing to pay extra
for cake products that appeal to indulgence. (Mintel, Cakes, p.14). It appears that while
total consumption of cake products is flat or increasing slightly, total consumer spending
is increasing. Consumers may be substituting quantity for quality and are willing to
spend more for a product that appeals to indulgence.
It should also be noted that consumers in this product category are interested in
new products, especially those that provide a premium experience. An example of this is
the growing number of private label offerings that focus on premium packaging, and
more sophisticated ingredients (Mintel, Cakes, p. 35). Most of the major firms in the
industry have focused on value. There are opportunities for firms that provide products
with higher quality ingredients and attributes.
One fact contributing to indulgence is the fact that most consumers see the
purchase of cakes and pies as a special occasion purchase. According to a survey, 76
percent of respondents purchased such products for a special occasion only 16 percent eat

41
these products on a regular basis (Mintel, Cakes, p.53). Since these purchases tend to be
consumed in a social or celebration setting, there is an incentive to desire a higher quality
product.
Due to the factors outlined above the opportunities of creating products that
appeal to the market driver of indulgence are broad.
Value – Limited
The market for cake and related products is well established. Also in store
bakeries are continuing to become more popular. As a result competing on price will be
very difficult. The opportunities in this area are limited.
Wellness – Selective
Cake products are not considered a food that promotes wellness. However, there
are number of products that are being introduced to address health issues. Of the 61 new
cake products introduced in the first quarter of 2004, 20 were low carbohydrate products
(Mintel, Cakes, p.9). The interest in low carbohydrate products creates an opportunity
for cake manufacturers. However, it remains to be seen if the trend for low carb diets is a
permanent trend or just a fad. It should be noted that per capita consumption of flour has
declined from 147 pounds in 1997 to 137 in 2002 (Mintel, Cakes, p.9); a decline of 6.8
percent. Low carbohydrate and sugar free products will likely appeal to older consumers,
a growing part of the population (Mintel, Cakes, p.60).
Another way to promote wellness in this market is to offer products that contain
no trans fatty acids. According to the University of Iowa trans fatty acids are linked to
obesity, heart disease, diabetes, high cholesterol levels and sudden cardiac death (About,
p.1). Among the most common trans fatty acids are hydrogenated or partially

42
hydrogenated oils. The Food and Drug Administration (FDA) will require trans fatty
acids to be on all food labels by January 1, 2006 (Mintel, Cakes, p.61). This creates an
opportunity for manufacturers to provide products that do not contain trans fatty acids.
Another way to appeal to wellness is to fortify cake products. This could be used
in products geared toward children. Parents may be less worried about giving children
cake products if those products have additional vitamins and minerals (Mintel, Cakes,
p.16).
While cakes and related products are not normally considered health food, there
are selective opportunities in generating products that appeal to wellness.
Cookies
Background
Unlike cake and related products, the outlook for cookies is less optimistic. For
the purposes of this study, cookies are considered packaged cookies that are ready for
consumption. The interest in low carbohydrate diets, the concern about childhood
obesity and smaller households are putting negative pressure on the cookie market
(Mintel, Cookies, p.1). Children are major consumers of cookies, and a decline in the
number of children will depress the market. It is estimated that the cookie market will
decline by 16 percent in real terms through 2009 (Mintel, Cookies, p.9).
Another reason for the decline is the fact that a major cookie manufacturer,
Parmalat, is in bankruptcy. Paramlat is the manufacturer of Archway and Mother’s
cookies (Mintel, Cookies, p.35). However, the firm has decided to divest itself of its
bakery units (Mintel, Cookies, p.36).
43
However, most people do eat cookies. In 2000 81 percent of households surveyed
eat cookies. This figure declined to 79 percent in 2003 (Mintel, Cookies, p.58). Children
are particularly heavy cookie consumers with 97 percent of those surveyed between the
ages of 6 and 11 stating that they eat cookies (Mintel, Cookies, p.87).
Large firms are important players in the standard cookie market. Kraft controls
41.1 percent of this market and Kellogg is second with a market share of 16.2 percent
(Mintel, Cookies, p.35). Kellogg and Kraft are also major firms in the health oriented
cookie sector. Pepperidge farm is the dominant brand in the premium cookie category
with a market share of 76.9 percent in 2003 (Mintel, Cookies, p.37).
Convenience - Limited
Cookies by definition are a convenient food. They are a handheld food and can
be consumed while doing a number of things such as driving, walking, etc. However,
most cookie products are sold in packages that have multiple numbers of cookies. Given
the declining size of households the market for single serve cookies may be increasing.
Single serve packaging also ties in well with the demand driver of indulgence, allowing
yourself an occasional treat without buying an entire package. Older consumers, who are
more likely to live by themselves, also are major purchasers of premium cookies (Mintel,
Cookies, p.76).
The fact that cookies are by their very nature convenient and innovations that
focus on convenience are not highly likely, limits the opportunities to appeal to this
market driver.

44
Ethnicity - Selective
There is some potential for cookies targeted at ethnic consumers. For example
U.S. imports of cookies from Mexico, Brazil and Columbia have increased (Mintel,
Cookies, p.31). At least some of these cookies are targeted to the growing Hispanic
market. Hispanic cookie brands increased their retail sales by 58.4 percent from 2001 to
2003 (Mintel, Cookies, p.36). Cookies tend to be equally popular with all ethnic groups
(Mintel, Cookies, p.59).
However, the type of cookies preferred does vary by ethnic group. For example,
fudge covered cookies are favored by whites and white vanilla cookies are favored by
blacks and Hispanics. Hispanics also prefer cookies that have fruit. (Mintel, Cookies,
p.63). This creates an opportunity for wheat producers and processors that are interested
in working with fruit producers and processors. This has implications for producers of
cherries, blueberries and apples.
The growing ethnic market and their differing tastes create selective opportunities
for farmers and firms interested in developing cookie products to appeal to this demand
driver.
Indulgence - Broad
While the overall cookie market is not in good shape the market for high quality
cookies is strong. These high quality cookies appeal primarily to adults. These types of
cookies also carry premium prices (Mintel, Cookies, p.7). Examples of products that
appeal to indulgence are coffee flavored cookies, French vanilla cookies, and Irish Cream
cookies (Mintel, Cookies, p.18). Pepperidge Farm, a company that only provides
45
premium cookies marketed to adults is now the third largest cookie manufacturer (Mintel,
Cookies, p.21).
While Pepperidge Farm dominates the market there may be potential for small
firms to find a niche market in local areas. A locally produced cookie would be fresher
than a cookie made in a factory some distance away from the market.
The strong demand for premium products means that the opportunities for firms
interested in developing products that address the demand driver of indulgence is broad.
Value - Limited
Given the size of the firms in the standard cookie market competing on price
would be extremely difficult. Premium cookies command a premium price. A firm may
be able to undercut the competition in the premium market provided that the quality
remains high. Gaining access to traditional distribution channels may be difficult. Direct
sales or sales through specialty retailers may have more promise. Given the overall
decline in cookie sales and the maturity of the market, the opportunities for developing
products that address the demand driver of value are limited.
Wellness - Selective
As is the case with cake and related products, cookies are not generally
considered a health food. However, sales of health oriented cookies increased by 6
percent from 2001-2003 (Mintel, Cookies p.38). Obesity is an increasing concern. From
1997 to 2003, the number of overweight or obese people increased from 19.4 percent to
24.0 percent (Mintel, Cookies, p.12). The rates of increase were even greater for
children. From 1976 to 2000, the number of overweight 6 to 11 year olds increased from

46
6.1 percent to 15.3 percent and the number of overweight 12 to 18 year olds increased
from 4.7 percent to 15.3 percent (Mintel, Cookies, p.14).
However, there are potential opportunities for cookie products that appeal to
wellness. Two potential product attributes are low carbohydrate and low trans fatty acids
cookies (Mintel, Cookies, p.7). Kellogg has begun the process of eliminating Trans Fatty
Acids from its cookies and reducing the level of carbohydrates in its products (Mintel,
Cookies, p.41). Sugar free cookies are another way to use wellness to increase sales,
particularly among diabetics.
Organic and minimally processed products seem to be of some interest as well.
Globally, about 10 percent of cookie product introductions were organic, natural, or no
preservatives/additives. Of this amount, 50 percent were introduced in the North
American market (Mintel, Cookies, p. 116). This presents another opportunity for cookie
manufacturers.
Another option is prebiotic cookie products. These products aid digestive health
by stimulating the growth of beneficial bacteria in the gut (Mintel, Cookies, p.117). This
also creates a market opportunity that currently is not being exploited to its full potential
in the U.S. Overall the opportunities of developing products that address the demand
driver of wellness are selective.
Crackers
Background
The cracker market is mature, but is growing slowly (Mintel, Crackers, p.1).
Almost 90 percent of households in the U.S. purchase crackers (Mintel, Crackers, p.7).
For the purposes of this report crackers include saltines, flavored and unflavored
47
crackers, butter crackers (such as Ritz crackers), filled crackers, breadsticks, and water
crackers. There are many substitutes for crackers; these include potato chips, cookies,
and other snack products. Wheat and cheese flavored crackers have the largest market
share (Mintel, Crackers, p.4) in dollar terms, but saltines are the most widely consumed
form of cracker (Mintel, Crackers, 51).
Retail sales of crackers are dominated by supermarkets which account for more
than 94 percent of all sales (Mintel, Crackers, p.5). Kraft/Nabisco and Kellogg are the
largest manufacturers of crackers as they are in cookies. These two companies accounted
for almost 74 percent of all cracker sales in 2002 (Mintel, Crackers, p.17). Private label
and small cracker producers experienced a decline in market share from 2000 to 2002;
the private label market share declined from 7.4 to 7.3 percent, and the combined market
share for small cracker manufacturers declined from 7.5 percent to 7.0 percent (Mintel,
Crackers, p.17). Entering this market may be difficult unless a firm has a product or
supply chain alteration that is truly innovative. One market that is not concentrated is
breadsticks. However, overall sales in this product category declined from 2000 to 2002
(Mintel, Crackers, p.28), perhaps as a result of the increased interest in low carbohydrate
diets.
Convenience - Limited
By definition crackers are a convenient food. They are a handheld food and can
be eaten with a number of other food items such as cheese and deli meats. Improving the
convenience of crackers will be difficult. One potential is to create more single serve
cracker products or smaller packaging that appeals to smaller households. Many

48
consumers report that their crackers go stale before the box is finished (Mintel, Crackers,
p.15). Improved packaging could address this issue and create a potential market.
Overall however, given the maturity of the market and the domination of the firms
involved, the opportunities appealing to the demand driver of convenience is limited.
Ethnicity - Limited
There are some differences among ethnic groups with the respect of cracker
consumption. Asians are less likely to eat saltines and graham crackers and more likely
to eat cheese and butter crackers; 61 percent of Asians surveyed eat saltines and 35
percent eat graham crackers. Conversely, 35 percent of Asians eat cheese flavored
crackers, and 24 percent eat butter flavored crackers (Mintel, Crackers, p. 53). Blacks
are less likely to eat saltines and more likely to graham crackers; 71 percent of blacks
surveyed eat saltines, but 61 percent eat graham crackers. Hispanics generally eat less of
all types of crackers with the exception of saltines (Mintel, Crackers, p.53).
New and different flavors of crackers could be developed to meet different taste
preferences of different ethnic groups. This appears to be particularly true for products
geared towards Asian consumers. However, given the maturity of the market and the fact
that some ethnic groups are not large consumers of cracker products, the potential of
developing products to address the demand driver of ethnicity is limited.
Indulgence - Selective
There is some potential to appealing to indulgence. Pepperidge Farms offers
several varieties of its Goldfish crackers in different sized packages. The firm also
attempts to marry indulgence with wellness by baking its crackers (as opposed to frying)

49
and by using real cheese ingredients (Mintel, Crackers, p.19). Kraft is also advertising its
use of real cheese in its cracker products (Mintel, Crackers, p. 31).
Indulgence is a key driver in the food system and has the widest range of possible
ways to appeal to this demand driver. However, some varieties of crackers, such as
saltines are likely to be what are known as inferior goods, as income increases the
demand declines all other things equal. Overall, the opportunities of appealing to this
demand driver are selective.
Value – Limited
There might be some potential to offer a low cost product in the category of
breadsticks. However, the overall market is very mature and dominated by large firms.
The potential to develop products that appeal to the demand driver of value is limited.
Wellness - Selective
According to a survey, 67 percent of respondents considered crackers to be a
health snack (Mintel, Crackers, p.5). Cracker producers could improve on this by
reducing or eliminating trans fatty acids in cracker products. A challenge facing cracker
products is the current interest in low carbohydrate diets.
Cracker consumption is highest among those 55 years or older (Mintel, Crackers,
p.49). Products that appeal to the health concerns of this age group (low fat, low
cholesterol, etc.) may be profitable.
Another group to appeal to is women. Women tend to be more interested in
crackers that are low in fat and baked crackers (Mintel, Crackers, p.59). This creates a
potential market for a product that appeals to wellness especially if the product could also
provide enhanced convenience or indulgence attributes.

50
Given that many people consider crackers to be a healthy snack item the
opportunities of appealing to this demand driver is selective despite the maturity of the
market and the dominance of some of the firms in the industry.
Bread
Background
Few things are more of a household staple than bread, 100 percent of households
with children eat some type of bread and 99 percent of households without children eat
some type of bread (Mintel, Bread, p. 11). Despite the maturity of the bread market and
threats from low carbohydrate diets, sales are steadily increasing. From 1998 to 2003
bread sales increased 18 percent in nominal terms and 4 percent in real terms (Mintel,
Bread, p.5). Furthermore, it is estimated that bread sales will increase by 22 percent from
2004-2008, from a $16.1 billion industry to a $19.5 billion industry (Mintel Bread, p. 73).
The bread market is mature and highly diversified (Mintel, Bread, p.6). All other
things constant, a mature market is more difficult to enter, manufacturers and distribution
channels are well established. Nonetheless, no firm has a market share greater than 10
percent (Mintel, Bread, p.7). However, diversification implies that there are market
niches that can be exploited.
Most of the bread purchased is from supermarkets, 84 percent of the bread
purchased is from supermarkets (Mintel, Bread, p.8). In store bakeries are becoming
more and more common in supermarkets. From 1992 to 2002 the number of in store
bakeries increased by 37.8 percent, and were in 31,770 supermarkets (Mintel, Bread,
p.15). However, mass merchandisers are also an important outlet for bread. It is
estimated that Wal-Mart accounts for 10 percent of all bread sales (Mintel, Bread, p. 8).

51
Specialty bread firms such as Panera and the Great Harvest Bread Company are a small,
but growing part of the bread market.
A difficult problem facing wheat growers in Michigan, Ohio and Wisconsin is the
fact that the wheat varieties grown in these states are not well suited to bread production.
This fact may be impossible to overcome for firms interested in taking advantage of
opportunities in the bread market. Another issue is the fact that bread buyers tend to be
loyal; more than 80 percent of white and whole wheat bread users surveyed indicated
some type of brand loyalty. However, there is less brand loyalty for specialty breads
(Mintel, Bread, p.57).
Convenience – Limited
Bread is a naturally convenient product. It can be eaten right out of the package,
used for sandwiches, toast or other easy to prepare items. One way to appeal to
convenience is by offering smaller loaf sizes geared toward one and two person
households. Overall there are limited opportunities in developing products to meet the
demand driver of convenience.
Ethnicity - Selective
An entire bread category, tortillas, is a result of the growing influence of Hispanic
tastes in the food industry. The tortilla market is also affected by children; according to a
survey 61 percent of households with children purchased tortillas in the past month as
opposed to only 35 percent of households without children (Mintel, Bread, p.5). It is
likely that the tortilla will become an established part of the American diet with the
passage of time.

52
The tortilla market is one of the fastest growing areas of the bread market. From
2001 to 2003, sales rose from $2.3 billion to $2.4 billion, an increase of 5.0 percent
(Mintel, Bread, p.20). Wheat is the preferred type of tortilla consumed, according to a
survey, 83 percent of those surveyed consumed wheat tortillas and 59 percent consumed
corn tortillas (Mintel, Bread, p.24). Flavored tortillas have not been a particularly
successful product introduction (Mintel, Bread, p.24).
Bread is a product used by all ethnic groups. However, given the growth of the
tortilla market, there appears to be selective opportunities of appealing to the demand
driver of ethnicity.
Indulgence – Broad
One of the fastest growing sectors of the bread market is the specialty/artisan
market. Sales of these types of breads increased from $1.5 billion in 2001 to $1.7 billion
in 2003, an increase of 18.1 percent (Mintel, Bread, p.20). Some consumers are “trading
up” to breads that have more sophisticated tastes and textures. This market also provides
the most opportunities for wheat producers in Michigan, Ohio and Wisconsin who do not
produce typical wheat varieties that are used for bread.
Consumers interested in artisan bread products are interested in uniqueness and
are will to pay a higher price (Mintel, Bread, p.26). The structure of the bread industry
also creates opportunities for firms interested in meeting the needs of a small local
market. Freshness is very important to bread consumers and as a result the supply system
for bread is more regional and local than most other shelf stable food products (Mintel,
Bread, p. 29).

53
Another way to appeal to the demand driver of indulgence is by offering products
that have flavors derived from international foods. Examples would be bread products
that are similar to those in Mediterranean and Asian countries (Mintel, Bread, p. 72).
Value – Limited
Bread is a staple product that is also mature with well defined distribution
channels. The ability to charge a lower price than established firms is difficult. This
limits the opportunity of developing products that appeal to this demand driver.
Wellness – Broad
There are many ways to appeal to the demand driver of wellness. Consumers are
used to purchasing fortified bread products. Traditionally, this has included vitamins and
minerals. Another way of appealing to wellness is by offering bread products that use
organic flours and are considered natural (Mintel, Bread, p. 5). The recent federal
nutrition guidelines also can be used to develop bread products that appeal to wellness.
The guidelines promote consumption of whole grain products and whole grain bread fits
in well with the guidelines. Whole grains are defined as “foods made from the entire
grain seed, usually called the kernel, which consists of the bran, germ, and endosperm. If
the kernel has been cracked, crushed, or flaked, it must retain nearly the same relative
proportions of bran, germ, and endosperm as the original grain in order to be called
whole grain” (DGAC, p.69). A suggested number of grain servings (equal to one slice
of bread) are 7 to 8 for a person on a 2,000 calorie a day diet (DGAC, p.51). It is also
very likely that products that appeal to wellness could also appeal to indulgence through
fresh artisan bread products.

54
Another way to appeal to the demand driver of wellness is by offering products
that appeal to people with special dietary needs. An example of this would be offering
bread products that are low in sugar or sugar free gear toward those consumers that have
diabetes (Mintel, Bread, p.13). Given these factors, the opportunities for developing
products that appeal to the demand driver of wellness is broad.
Cereal
Background
The breakfast cereal market is a mature market dominated by a few large firms.
Kellogg, General Mills, Quaker Oats and Post control more than 83 percent of the market
(Mintel, Breakfast Cereal, 31). This level of concentration limits the ability for a small
firm to enter this industry. From 1998 to 2003, the market grew from $8.5 billion to $9.0
billion. This translates to an annual increase of 1 percent per year (Mintel, Breakfast
Cereal, p. 1), considerably less than the rate of inflation.
Most households consume cereal, 95 percent of those surveyed indicated that
someone in their household consumed cereal (Mintel, Breakfast Cereal, p. 52). Fully 98
percent of children and 89 percent of teenagers surveyed eat cereal, but 10 percent of
consumers never or seldom eat breakfast and another 17 percent only eat breakfast once
or twice a week (Mintel, Breakfast Cereal, p.9). Furthermore, the number of children is
expected to decline in the future.
The vast majority of cereal is sold through supermarkets which account for
roughly 80 percent of all sales. Cereals tends to be organized by manufacturer which
increases the amount of control over the market the manufacturers possess (Mintel,
Breakfast Cereal, p.49). Mass merchandisers such as Wal-Mart account for 15.4 percent

55
of all retail sales (Mintel, Breakfast Cereal, p.6). Health food stores account for only 3.5
percent of all sales (Mintel, Breakfast Cereal, p.6), but its share is also growing. Health
food stores represent one market distribution system that a small firm may be able to use
to its benefit.
Convenience – Limited
While cereal is easy to make, it is not easy to transport or consume in a car. This
limits the convenience factor. Packaging designs are being developed and introduced
that make cereal easy to eat while driving or at work. Single serve packaging has long
been a staple in this industry. Overall, there are limited opportunities in developing
products that appeal to the demand driver of convenience.
Ethnicity – Selective
Hispanics and blacks are above average consumers of cereal and they also tend to
have larger household size on average further increasing the demand for cereal (Mintel,
Breakfast Cereal, p.4). These figures are borne out by the amount of cereal consumed
per week; 49 percent of black households and 48 percent of Hispanic households eat 15
or more bowls of cereal per week (Mintel, Breakfast Cereal, p. 57). However, breakfast
may be the most traditional meal of the day (Mintel, Breakfast Cereal, p.9), creating both
an opportunity and a challenge. While some consumers may be resistant to change, new
products aimed at ethnic consumers may find success.
There are also differences among ethnic groups with respect to cereal
consumption, 75 percent of white households consume low sugar cereal and only 52
percent of these households consume high sugar cereal. These figures are different for
Black, Asian, and Hispanic households; 71 percent of Black households consume low
56
sugar and high sugar cereals; 70 percent of Asian households consume low sugar cereals
and 60 percent consume high sugar cereals; 74 percent of Hispanic households consume
low sugar cereals and 65 percent consume high sugar cereals (Mintel, Breakfast Cereal,
p.55).
Given the increased growth of ethnic groups that are above average consumers of
cereal creates selective opportunities in developing new products that appeal to this
demand driver.
Indulgence – Selective
One way to appeal to the demand driver of indulgence is through developing
products that appeal to consumers that have not found a cereal they like. According to a
survey, 20 percent of men and 15 percent of women have not found a cereal they really
like (Mintel, Breakfast Cereal, p.68). For example a cereal that is more filling might
appeal to men. The fact that there appears to be a group of consumers that would like a
greater variety or mix of flavors and ingredients indicates that there are selective
opportunities for cereal products that appeal to the demand driver of indulgence.
Value – Limited
The cereal market is dominated by large firms. The low cost products tend to be
offered by private store labels. As a result, the ability for a firms or product to appeal to
the demand driver of value is limited.
Wellness – Selective
Cereal has long been associated with health. It has traditionally used vitamin and
mineral fortifications to improve the health benefits of eating the product (Mintel,
Breakfast Cereal, p.11). While children are the largest consumers of cereal, persons over
57
the age of 45 are the second largest consumers. Older consumers are more likely to be
interested in cereal products that promote health. Whole grain cereals would be one way
to address the demand driver of wellness. Products that are high in fiber and also taste
good could also appeal to older consumers.
Another way to address this concern is through offering products that are sold and
supported by health food stores. This creates a separate distribution system that smaller
firms may be able to exploit. Overall, there are selective opportunities for products that
appeal to the demand driver of wellness.
Cereal Bars
Background
Cereal bars are a product category that has shown solid growth over the past few
years. Estimated retail sales in 2004 were $2.2 billion, up from $1.2 billion in 1999.
However, it should be noted that the rate of growth has trailed off from 2002 (Mintel,
Cereal Bars, p.5). It has been forecasted that the cereal bar market will increase by 53
percent from 2004 to 2009 and will be a $3.6 billion industry. A major determinate of
cereal bar consumption is the presence of children in the home; 69 percent of households
with children under 18 consume cereal bars compared to 46 percent of households
without children (Mintel, Cereal Bars, p.56). Most of the people who consume cereal
bars consume less than one per day, there may be opportunities to increase the level of
consumption for those consumers that already eat cereal bars (Mintel, Cereal Bars, p.63).
Cereal bars are used for a number of purposes. Some are marketed as a dietary
supplement, others as a breakfast food, and others as a snack item. Consumers purchase
cereal bars for a number of reasons as well, 42 percent of consumers cite cereal bars as an

58
energy boost as the reason for eating the bars and 37 percent of consumers use cereal bars
as a meal replacement (Mintel, Cereal Bars, p.8). This range of products presents
opportunities for farmers and firms interested in this type of product. However, as is the
case with bread, the types of wheat produced in Michigan, Ohio and Wisconsin may limit
the ability to take advantage of these opportunities.
Where cereal bars are purchased also creates opportunities. Supermarkets
account for 65 percent of cereal bar sales (Mintel, Cereal Bars, p.7), mass merchandisers
and convenience stores play a larger role in cereal bar sales than in most other food
products. Furthermore, cereal bars are located in 4 to 6 locations within an average
supermarket (Mintel, Cereal Bars, p.7), which also increases marketing opportunities for
cereal bar manufacturers.
Despite the many positive aspects of the cereal bar market, there is one major
downside for entrepreneurs interested in this industry. The industry is maturing rapidly
and is increasingly dominated by large firms such as Kellogg, Nestle, and others. The top
three firms, Kellogg, Pepsi/Quaker Oats and General Mills accounted for more than 49
percent of all sales (Mintel, Cereal Bars, p.28). This will make it difficult, but not
impossible for a smaller firm to enter this market (Mintel, Cereal Bars, p.13).
Convenience – Selective
Cereal bars are an extremely convenient food. They can be eaten while driving
and doing a number of other things. They are often marketed and used as a breakfast
food, acting as a substitute for traditional breakfast items. They are also purchased as a
snack item. Sales through convenience stores now account for 12 percent of all cereal
bar sales; this is greater than most other food items.

59
Cereal bars generally come in single serve packages. This also adds to the
convenience factor and helps explain the growth of this type of product. While the
convenience factor of cereal bars helps explain their growing popularity; it may be
difficult to create additional opportunities that focus solely on convenience, therefore
there are selective opportunities in developing products that appeal to this demand driver.
Ethnicity – Selective
Whites, Blacks and Asians are each equally likely to eat nutritional snacks.
However, Hispanics are somewhat more likely to each such snacks; 50 percent of
Hispanics eat such snacks compared to approximately 45 percent for the other ethnic
groups (Mintel, Cereal Bars, p.54).
Cereal bar flavors do not seem to be geared towards some ethnic markets. Many
flavors are geared towards the snack market (chocolate, peanut butter, etc). Tropical fruit
flavors such as orange, banana and lemon, might create new markets. Overall, there are
selective opportunities of developing products that appeal to the demand driver of
ethnicity.
Indulgence – Broad
There is a positive relationship between income and the consumption of
nutritional snacks such as cereal bars; 49 percent of those earning more than $75,000 a
year consume nutritional snacks, compared to 40 percent of those earning less than
$25,000. As is the case with ethnicity, there are likely to be opportunities to develop
flavors that appeal to adults. Also, there are opportunities for products that appeal to
convenience, indulgence and wellness.

60
Overall, there are broad opportunities for products that appeal to the demand
driver of indulgence.
Value – Limited
Given the fact that many large firms with well established production and
distribution practices are established in the cereal bar industry, the opportunities of
appealing to the demand driver of value is limited.
Wellness – Broad
Cereal bars have many attributes that could promote wellness. Many of these bars
are low in fat; other bars are formulated in a way that minimizes carbohydrates. Both of
these attributes make cereal bars a natural product for dieters. It has been estimated that
38 percent of U.S. adults were trying to lose weight in 2000 (Mintel, Cereal Bars, p. 15).
Clearly there is a large potential market for a product that tastes good, provides important
nutrients and can help consumers lose weight.
There are also a wide range of outlets for cereal bars that focus on wellness. In
addition to traditional outlets, health food stores, gyms, drug stores and others could also
be outlets for cereal bars.
This is reflected in the sales figures. While the overall cereal bar category
increased by 25 percent between 2002 and 2004, the health bar segment increased 39
percent (Mintel, Cereal Bars, p.22).
Another opportunity is developing products geared towards older consumers.
Products that are high in fiber or have other attributes could appeal to older consumers.
The fact that cereal bars are convenient and are single serve could also be used to market
to older consumers.

61
Overall, there are broad opportunities for developing products that appeal to the
demand driver of wellness.
Summary
Two major barriers exist that make developing wheat products and markets
difficult. The first is the fact that the types of wheat grown in Michigan, Ohio, and
Wisconsin have traditionally been used to manufacture highly processed products, such
as cakes, crackers and related items. It may be impossible to enter markets such as bread
or cereal bars.
The second major barrier is the difficulty of competing against established firms.
Some of the largest food firms in the world are heavily involved in wheat based products.
Unless a group of farmers or a processor is interested in meeting the needs of a very
narrowly defined market, it will be difficult to compete against these large firms.
Cooperatives, partnerships, strategic alliances and other methods of business organization
are one way to address this issue.
The greatest opportunity in respect to wheat products appears to be in the areas of
wellness and indulgence. Whole grain wheat products could be used to appeal to both of
these demand drivers. Appealing to indulgence is a particularly good strategy for firms
interested in targeting a product to a small group of consumers. The opportunities with
respect to value are the most limited.
Corn
Background
Corn is a very important crop in Michigan, Ohio and Wisconsin. More acres are
devoted to corn production than any other crop. Table 12 shows the acres harvested,

62
production and price of corn for grain from 1999 to 2003. Approximately 90 percent of
the corn grown in the state of Michigan is for grain and 10 percent is silage (Michigan
Department of Agriculture, p.23). Wisconsin produces more silage as a result of the
large number of dairy cows in that state.
Table 12: Corn for Grain Production, Michigan, Ohio, Wisconsin 1999-2003Michigan Ohio Wisconsin
Year Acres Planted Production (Bushels) Acres Planted Production (Bushels) Acres Planted Production (Bushels)1999 2,200,000 253,500,000 3,450,000 403,200,000 3,600,000 407,550,0002000 2,200,000 241,800,000 3,550,000 485,100,000 3,500,000 363,000,0002001 2,200,000 199,500,000 3,400,000 437,460,000 3,400,000 330,200,0002002 2,250,000 234,000,000 3,250,000 264,330,000 3,650,000 391,500,0002003 2,250,000 259,840,000 3,300,000 478,920,000 3,750,000 367,650,000
Source: National Agricultural Statistics Service
Corn can be used for a wide variety of products. It can be used for human
consumption, as animal feed, as a cooking ingredient in the form of cooking oil, as a
substitute for gasoline in the form of ethanol, a substitute for sugar in the form of corn
syrup, and for various industrial uses such as plastics. A great deal of corn is exported
providing valuable foreign exchange earnings for the U.S. economy. Table 13 gives the
supply and utilization balance for corn in the U.S. from September 2003 through August
of 2004.

63
Table 13: U.S. Corn 2003-04 Balance SheetSupply Million BushelsBeginning Stocks 1,087Production 10,114Imports 14Total Supply 11,215UtlilizationFood, Seed, Industrial 2,577Feed and Residual 5,783Exports 1,897Total Utilization 10,257
Ending Stocks 958
Source: Baker and Allen
Over the past few years there has been a major increase in the use of corn in the food,
seed, and industrial area. This is primarily due to an increase in ethanol production.
Most corn is used for animal feed. The demand for corn for feed is a derived demand;
that is it is a function of the demand for meat and dairy products. In percentage terms,
the amount of corn exported has declined. This is due to increased foreign competition
and an increase in domestic use of corn.
The study will consider the use of corn for the following purposes: feed, fuel
(ethanol), cooking oil, sweetner, industrial uses, breakfast cereal, cereal bars, and snacks.
Corn for human consumption as a vegetable such as sweet corn is covered in the
Vegetable Rapid Opportunity Assessment. Table 14 gives the opportunity matrix for
most of these products. The assessment for fuel and industrial uses will be discussed
separately. The markets for fuel and industrial products are fundamentally different from
the market for food items.
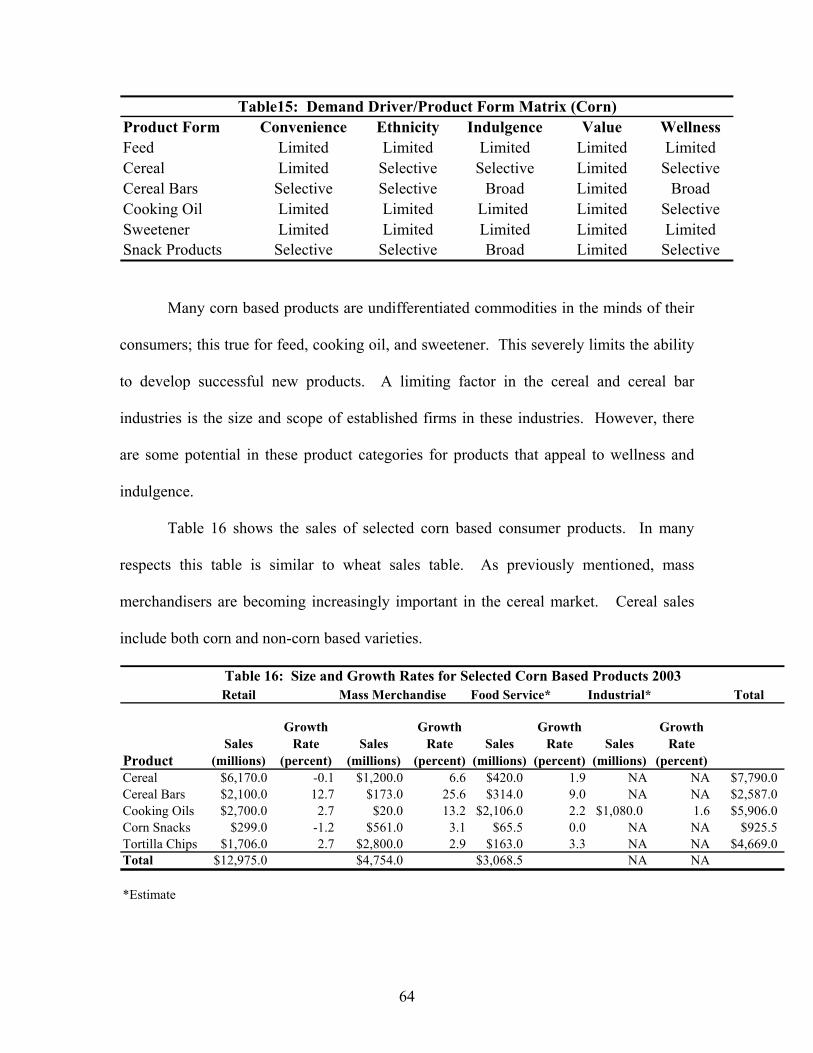
64
Table15: Demand Driver/Product Form Matrix (Corn)Product Form Convenience Ethnicity Indulgence Value WellnessFeed Limited Limited Limited Limited LimitedCereal Limited Selective Selective Limited SelectiveCereal Bars Selective Selective Broad Limited BroadCooking Oil Limited Limited Limited Limited SelectiveSweetener Limited Limited Limited Limited LimitedSnack Products Selective Selective Broad Limited Selective
Many corn based products are undifferentiated commodities in the minds of their
consumers; this true for feed, cooking oil, and sweetener. This severely limits the ability
to develop successful new products. A limiting factor in the cereal and cereal bar
industries is the size and scope of established firms in these industries. However, there
are some potential in these product categories for products that appeal to wellness and
indulgence.
Table 16 shows the sales of selected corn based consumer products. In many
respects this table is similar to wheat sales table. As previously mentioned, mass
merchandisers are becoming increasingly important in the cereal market. Cereal sales
include both corn and non-corn based varieties.
Table 16: Size and Growth Rates for Selected Corn Based Products 2003Retail Mass Merchandise Food Service* Industrial* Total
ProductSales
(millions)
Growth Rate
(percent)Sales
(millions)
Growth Rate
(percent)Sales
(millions)
Growth Rate
(percent)Sales
(millions)
Growth Rate
(percent)Cereal $6,170.0 -0.1 $1,200.0 6.6 $420.0 1.9 NA NA $7,790.0Cereal Bars $2,100.0 12.7 $173.0 25.6 $314.0 9.0 NA NA $2,587.0Cooking Oils $2,700.0 2.7 $20.0 13.2 $2,106.0 2.2 $1,080.0 1.6 $5,906.0Corn Snacks $299.0 -1.2 $561.0 3.1 $65.5 0.0 NA NA $925.5Tortilla Chips $1,706.0 2.7 $2,800.0 2.9 $163.0 3.3 NA NA $4,669.0Total $12,975.0 $4,754.0 $3,068.5 NA NA
*Estimate
65
Most corn snacks and tortilla chips are purchased through convenience stores. A major
market for the corn industry is the vegetable cooking oil, a $5.9 billion market including
all oils both corn and non-corn based.
Feed
Corn used for feed is a commodity. A purchaser of feed will choose the lowest
cost source that meets the needs of the needs of the purchaser. The demand for corn as
feed is dependent on the demand for dairy and meat products. The greater the demand
for dairy and meat products, the greater the demand for corn as feed. It appears that the
demand for feed will remain strong in the near future. As table 13 shows, well over half
the corn grown the U.S. is used for feed.
As the Dairy Rapid Opportunity Assessment points out, there are several demand
drivers that point to an increased demand and utilization of milk products. In order to
increase milk output the amount of corn consumed by dairy cows will increase. If the
current trend for larger and larger dairy farms increases so will the demand for purchased
feed. Many large dairy farms specialize only in milking and managing cattle and do not
grow any of their own feed, which they can often purchase for less than their cost of
production. If this becomes the standard, less and less corn will be grown on dairy farms
and more will be grown by farmers than specialize in corn and silage production.
The meat market is also showing signs of increased demand and production which
will, in turn, increase the demand for corn. Table 17 shows per capita consumption of
meat products in the U.S from 1997 to 2002. It should be noted that per capita meat
consumption is expected to reach an all time high in 2005.

66
Table 17: Per Capita Meat Consumption 1997-2002 (lbs.)Product 1997 1998 1999 2000 2001 2002Beef 62.7 63.6 64.4 64.5 62.9 64.5Chicken 49.5 49.8 52.9 53.2 53.9 56.8Pork 44.8 48.2 49.4 47.7 46.7 48.2Turkey 13.6 13.9 13.8 13.7 13.7 14.0Lamb 0.9 0.9 0.9 0.9 0.9 0.9Total 171.5 176.4 181.4 180 178.1 184.4
Source: Mintel
The interest in low carbohydrate diets has increased the demand for animal protein. From
1997 to 2002, per capita consumption of meat products has increased from 171.5 pounds
in 1997 to 184.4 pounds in 2002 an increase of 7.5 percent. The typical American
consumes 8 ounces of animal protein a day. After a long decline, the demand for beef
appears to be increasing. The demand for chicken remains strong and the consumption of
pork has also increased.
One way to differentiate the demand for corn as feed is to raise organic corn.
This corn would be fed to organic livestock producers. This is one way to appeal to the
demand driver of wellness. However, overall purchasers of feed will be driven by the
need to minimize their costs. As a result, value remains the most important demand
driver in this industry. This limits the opportunities in the feed industry.
Cereal
Background
The breakfast cereal market is a mature market dominated by a few large firms.
Kellogg, General Mills, Quaker Oats and Post control more than 83 percent of the market
(Mintel, Breakfast Cereal, 31). This level of concentration limits the ability for a small
firm to enter this industry. From 1998 to 2003, the market grew from $8.5 billion to $9.0

67
billion. This translates to an annual increase of 1 percent per year (Mintel, Breakfast
Cereal, p. 1), considerably less than the rate of inflation.
Most households consume cereal, 95 percent of those surveyed indicated that
someone in their household consumed cereal (Mintel, Breakfast Cereal, p. 52). Fully 98
percent of children and 89 percent of teenagers surveyed eat cereal, but 10 percent of
consumers never or seldom eat breakfast and another 17 percent only eat breakfast once
or twice a week (Mintel, Breakfast Cereal, p.9). Furthermore, the number of children is
expected to decline in the future.
The vast majority of cereal is sold through supermarkets which account for 82.5
percent of all sales. Cereals tends to be organized by manufacturer which increases the
amount of control over the market the manufacturers possess (Mintel, Breakfast Cereal,
p.49). Mass merchandisers such as Wal-Mart account for 12.9 percent of all retail sales
(Mintel, Breakfast Cereal, p.6). Health food stores account for only 3.5 percent of all
sales (Mintel, Breakfast Cereal, p.6), but its share is also growing. Health food stores
represent one market distribution system that a small firm may be able to use to its
benefit.
Convenience – Limited
While cereal is easy to prepare, it is not easy to transport or consume in a car.
This limits the convenience factor. Packaging designs are being developed and
introduced that make cereal easy to eat while driving or at work. Single serve packages
have long been a staple in this market. Overall, there are limited opportunities of
developing products that appeal to the demand driver of convenience.

68
Ethnicity – Selective
Hispanics and blacks are above average consumers of cereal and they also tend to
have larger households further increasing the demand for cereal (Mintel, Breakfast
Cereal, p.4). These figures are borne out by the amount of cereal consumed per week; 49
percent of black households and 48 percent of Hispanic households eat 15 or more bowls
of cereal per week (Mintel, Breakfast Cereal, p. 57). However, breakfast may be the
most traditional meal of the day (Mintel, Breakfast Cereal, p.9), creating both an
opportunity and a challenge. While some consumers may be resistant to change, new
products aimed at ethnic consumers may find success.
There are also differences among ethnic groups with respect to cereal
consumption, 75 percent of white households consume low sugar cereal and only 52
percent of these households consume high sugar cereal. These figures are different for
Black, Asian, and Hispanic households; 71 percent of Black households consume low
sugar and high sugar cereals; 70 percent of Asian households consume low sugar cereals
and 60 percent consume high sugar cereals; 74 percent of Hispanic households consume
low sugar cereals and 65 percent consume high sugar cereals (Mintel, Breakfast Cereal,
p.55).
Indulgence – Selective
One way to appeal to the demand driver of indulgence is through developing
products that appeal to consumers that have not found a cereal they like. According to a
survey, 20 percent of men and 15 percent of women have not found a cereal they really
like (Mintel, Breakfast Cereal, p.68). For example a cereal that is more filling might
appeal to men. The fact that there appears to be a group of consumers that would like a
69
greater variety or mix of flavors and ingredients indicates that there are selective
opportunities for cereal products that appeal to the demand driver of indulgence.
Value – Limited
The cereal market is dominated by large firms. The low cost products tend to be
offered by private store labels. As a result, the ability for a firms or product to appeal to
the demand driver of value is limited.
Wellness – Selective
Cereal has long been associated with health. It has traditionally used vitamin and
mineral fortifications to improve the health benefits of eating the product (Mintel,
Breakfast Cereal, p.11). While children are the largest consumers of cereal, persons over
the age of 45 are the second largest consumers. Older consumers are more likely to be
interested in cereal products that promote health. Whole grain cereals would be one way
to address the demand driver of wellness. Products that are high in fiber and also taste
good could also appeal to older consumers.
Another way to address this concern is through offering products that are sold and
supported by health food stores. This creates a separate distribution system that smaller
firms may be able to exploit. Overall, there are selective opportunities for products that
appeal to the demand driver of wellness.
Cereal Bars
Background
Cereal bars are a product category that has shown solid growth over the past few
years. Estimated retail sales in 2004 were $2.2 billion, up from $1.2 billion in 1999.
However, it should be noted that the rate of growth has trailed off from 2002 (Mintel,

70
Cereal Bars, p.5). It has been forecasted that the cereal bar market will increase by 53
percent from 2004 to 2009 and will be a $3.6 billion industry. A major determinate of
cereal bar consumption is the presence of children in the home; 69 percent of households
with children under 18 consume cereal bars compared to 46 percent of households
without children (Mintel, Cereal Bars, p.56). Most of the people who consume cereal
bars consume less than one per day, there may be opportunities to increase the level of
consumption for those consumers that already eat cereal bars (Mintel, Cereal Bars, p.63).
Cereal bars are used for a number of purposes. Some are marketed as a dietary
supplement, others as a breakfast food, and others as a snack item. Consumers purchase
cereal bars for a number of reasons as well, 42 percent of consumers cite cereal bars as an
energy boost as the reason for eating the bars and 37 percent of consumers use cereal bars
as a meal replacement (Mintel, Cereal Bars, p.8). This range of products presents
opportunities for farmers and firms interested in this type of product.
Where cereal bars are purchased also creates opportunities. Supermarkets
account for 65 percent of cereal bar sales (Mintel, Cereal Bars, p.7), mass merchandisers
and convenience stores play a larger role in cereal bar sales than in most other food
products. Furthermore, cereal bars are located in 4 to 6 locations within an average
supermarket (Mintel, Cereal Bars, p.7), which also increases marketing opportunities for
cereal bar manufacturers.
Despite the many positive aspects of the cereal bar market, there is one major
downside for entrepreneurs interested in this industry. The industry is maturing rapidly
and is increasingly dominated by large firms such as Kellogg, Nestle, and others. The top
three firms, Kellogg, Pepsi/Quaker Oats and General Mills accounted for more than 49

71
percent of all sales (Mintel, Cereal Bars, p.28). This will make it difficult, but not
impossible for a smaller firm to enter this market (Mintel, Cereal Bars, p.13).
Convenience – Selective
Cereal bars are an extremely convenient food. They can be eaten while driving
and doing a number of other things. They are often marketed and used as a breakfast
food, acting as a substitute for traditional breakfast items. They are also purchased as a
snack item. Sales through convenience stores now account for 12 percent of all cereal
bar sales; this is greater than most other food items.
Cereal bars generally come in single serve packages. This also adds to the
convenience factor and helps explain the growth of this type of product. While the
convenience factor of cereal bars helps explain their growing popularity; it may be
difficult to create additional opportunities that focus solely on convenience, therefore
there are selective opportunities in developing products that appeal to this demand driver.
Ethnicity – Selective
Whites, Blacks and Asians are each equally likely to eat nutritional snacks.
However, Hispanics are somewhat more likely to each such snacks; 50 percent of
Hispanics eat such snacks compared to approximately 45 percent for the other ethnic
groups (Mintel, Cereal Bars, p.54).
Cereal bar flavors do not seem to be geared towards some ethnic markets. Many
flavors are geared towards the snack market (chocolate, peanut butter, etc). Tropical fruit
flavors such as orange, banana and lemon, might create new markets. Overall, there are
selective opportunities of developing products that appeal to the demand driver of
ethnicity.
72
Indulgence – Broad
There is a positive relationship between income and the consumption of
nutritional snacks such as cereal bars; 49 percent of those earning more than $75,000 a
year consume nutritional snacks, compared to 40 percent of those earning less than
$25,000. As is the case with ethnicity, there are likely to be opportunities to develop
flavors that appeal to adults. Also, there are opportunities for products that appeal to
convenience, indulgence and wellness.
Overall, there are broad opportunities for products that appeal to the demand
driver of indulgence.
Value – Limited
Given the fact that many large firms with well established production and
distribution practices are established in the cereal bar industry, the opportunities of
appealing to the demand driver of value is limited.
Wellness – Broad
Cereal bars have many attributes that could promote wellness. Many of these bars
are low in fat; other bars are formulated in a way that minimizes carbohydrates. Both of
these attributes make cereal bars a natural product for dieters. It has been estimated that
38 percent of U.S. adults were trying to lose weight in 2000 (Mintel, Cereal Bars, p. 15).
Clearly there is a large potential market for a product that tastes good, provides important
nutrients and can help consumers lose weight.
There are also a wide range of outlets for cereal bars that focus on wellness. In
addition to traditional outlets, health food stores, gyms, drug stores and others could also
be outlets for cereal bars.
73
This is reflected in the sales figures. While the overall cereal bar category
increased by 25 percent between 2002 and 2004, the health bar segment increased 39
percent (Mintel, Cereal Bars, p.22).
Another opportunity is developing products geared towards older consumers.
Products that are high in fiber or have other attributes could appeal to older consumers.
The fact that cereal bars are convenient and are single serve could also be used to market
to older consumers.
Overall, there are broad opportunities for developing products that appeal to the
demand driver of wellness.
Cooking Oil
Background
Unlike feed or fuel, corn based cooking oil is a consumer product. As such it can
be treated in a manner similar to the wheat products previously analyzed. However, the
opportunities in this industry are limited. Most consumers see cooking oil as a
commodity and are price sensitive (Mintel, Edible Fats and Oils p.21). For purposes of
this report cooking oil will be defined as cooking and salad oil, olive oil and vegetable
shortening. This accounts for the entire industry including close substitutes for corn oil
such as canola oil and olive oil.
The cooking oil industry is mature, sales of cooking oil in real terms has been flat
1998 to 2003. This trend is expected to continue. Mintel estimates that sales of cooking
and salad oil will decline by 10 percent from 2003 to 2008 (Mintel, Edible Fats and Oils,
p.76). This implies that the overall opportunities in this industry are limited. The number

74
of new product introductions may be symptomatic of this. Table 17 gives the number of
new products introduced into North America from 2001 through the first half of 2003.
Table 17: New Oil Product Introductions 2001 - 2003 (North America)
Year New Product Introductions2001 1302002 111
2003* 67Total 308* First six months of 2003Source: Mintel
This is not a product category that has seen a great deal of new product introductions.
Many of these are likely to be in the rapidly increasing olive oil sector.
Retail sales of cooking and salad oils were $1.02 billion in 2003, and olive oil
sales were $424 in the same year (Mintel, Edible Fats and Oils, p.19). Almost 99 percent
of retail sales are through grocery stores (Mintel, Edible Fats and Oils, p.40). According
to a survey, 93 percent of households use cooking and salad oil (Mintel, Edible Fats and
Oils, p.7). Some of the firms in the edible fats and oils industry are quite large and
include, Unilever, Kraft Foods and ConAgra. Producing at a low cost is important in this
industry.
One trend working against oil consumption is the aging population. Consumption
declines with age. This is likely due to the fact that older households tend to be smaller,
and that many older people are less likely to cook. Concerns about health may also lead
to less consumption in older households (Mintel, Edible Fats and Oils p.47).
Convenience – Limited
The trend for convenience is working against cooking oil. According to one
survey, 40 percent of respondents stated that no one in the household cooked from

75
scratch in the 90 days preceding the survey (Mintel, Edible Fats and Oils, p.6). The
decline in cooking skills and time to prepare meals mean less oil will be consumed at
home. Smaller household sizes also imply that their will be an increased demand for
cooking oil in smaller sizes.
The increase in eating away from home also implies that more cooking oil will be
used in restaurants and other non-home food outlets. However, these outlets will be very
price sensitive. Overall the opportunities to appeal to the demand driver of convenience
are limited.
Ethnicity – Limited
The growing number of Hispanics and Asians will increase the demand for
cooking oil. All ethnic groups besides whites consume above average amounts of
cooking oil (Mintel, Edible Fats and Oils, p.7). Black and Hispanic households use the
most oil and the widest variety of oils (Mintel, Edible Fats and Oils, p.7). These
households are particularly high consumers of vegetable oil (Mintel, Edible Fats and
Oils, p. 55).
Asians use less nonstick cooking sprays (such as PAM) and shortening, and use
more non traditional oils such as sesame and peanut oils. Much Asian cooking relies
heavily on the use of oils (Mintel, Edible Fats and Oils, p.45). Asian and Black
households are also more likely to use oil for deep frying (Mintel, Fats and Oils, p.60).
While the increase in the number of Asians and Hispanics is limiting the overall
decline in cooking oil demand, given the maturity of the industry the ability to appeal to
this demand driver is limited.

76
Indulgence – Limited
As is the case with many products there is an increased interest in different
flavors. Oils that have different flavors and seasonings may find a market. This may also
allow a specialty manufacturer to enter a market that is not being served by one of the
large cooking oil manufacturers.
One way to increase the demand for specialty oils is to offer recipes with their
product or by bundling smaller packages of multiple flavored oils (Mintel, Edible Fats
and Oils, p.53). However, this is probably more true for alternative oils such as olive oil.
All things considered, the ability to develop products and markets that appeal to the
demand driver of indulgence is limited.
Value – Limited
In many respects cooking oil has become a commodity. Given the maturity of the
market and the size of some of the firms involved, the ability of developing products and
markets that appeal to the demand driver of value is limited.
Wellness – Selective
The interest in eating healthy has affected the cooking oil market. According to
one survey 67 percent of consumers have changed their fat and oil consumption for
health reasons. Furthermore, consumers also are increasingly reading nutritional labels
and understand the difference between “good” and “bad” fats (Mintel, Edible Fats and
Oils, p.7).
The interest in cooking with healthy oils works against corn oil. Olive oil,
grapeseed oil, and sunflower oil all sell at higher prices than traditional vegetable oil
(Mintel, Edible Fats and Oils, p.6). Olive oil demand is increasing at the expense of
77
other oils. Corn oil processing will need to change in the face of the upcoming regulation
requiring trans fatty acids labeling. Apparently, this is currently being undertaken by
cooking oil manufacturers. For example all Wesson oils, including corn oil, have no
trans fatty acids per serving (Mintel, Edible Fats and Oils, p.37). However, canola oils
are already advertising the fact that they are naturally free of trans fatty acids.
However, there is one positive trend that can be used with corn oil. There is an
increasing interest in organic oils (Mintel, Edible Fats and Oils, p.7). There may also be
a market for oils that improve health, such as oils that reduce LDL or “bad” cholesterol
(Mintel, Edible Fats and Oils, p.82).
While the overall market for cooking oil is declining there appears to be selective
opportunities for new products and market innovation that appeal to the demand driver of
wellness. Consumers appear to be receptive to new products that are healthier than
existing cooking oil products.
Corn Syrup
Background
As is the case with cooking oil, corn syrup is also a consumer product. It is also
used in a wide range of products as a sugar substitute. It is used in a wide range of
manufactured candy products, and is the primary sweetener used in soft drinks. Corn
syrup is basically a commodity, i.e. consumers and industrial users are primarily
concerned with price.
In some respects the market for corn syrup is an artificial market. The demand
and utilization of sugar would increase, and the price of sugar would be lower if there
was no domestic sugar program. Domestic production allotments, import quotas, and

78
support prices keep the domestic price of sugar above what it would otherwise be. As a
result, consumers and especially industrial users have substituted corn syrup for sugar.
One reason the sugar program remains in its current form is that it not only enhances the
income of sugar producers it also provides an additional market for corn producers and
enhances their income as well.
Mintel expects a decline in sugar and nonsugar sweeteners sales with the
exception of Splenda, a natural sugar substitute (Mintel, Sugar and Sweetener, p.1).
Excepting Splenda, sales of sugars and sweeteners declined by 5 percent in nominal
terms between 1999 and 2004, and 16 percent in real terms (Mintel, Sugar and Sweetner,
p. 7).
Virtually all the corn syrup sold at the retail level is through supermarkets. The
primary use of corn syrup is as a sweetener in manufactured food products.
Convenience – Limited
A major reason for the decline in sweetener sales is the decline in home cooking.
While this means less corn syrup purchased for home use, it may mean that the
substitution of corn syrup for sugar will continue for ready-to-eat food. Even food items
produced at home are more and more likely to come from prepared mixes (Mintel, Sugar
and Sweetener, p.10). However, from a food manufacturer perspective corn syrup is a
commodity input in production. The implication of this is that the opportunities of
developing products and markets that appeal to the demand driver of convenience are
limited.

79
Ethnicity – Limited
The trend towards a more ethnically diverse society works against corn syrup,
especially for at home consumption. Asian and Hispanic households are less likely to use
sugar substitutes than white or black households (Mintel, Sugar and Sweetener, p.39).
Asians also use far less sugar than other types of households (Mintel, Sugar and
Sweetener, p.41). The implication for this is that the opportunities for corn syrup
products appealing to the demand driver of ethnicity are limited.
Indulgence – Limited
Corn syrup is not considered a luxury product. It sells at a discount relative to
sugar. The opportunities for corn syrup products that appeal to the demand driver of
indulgence are limited.
Value – Limited
Corn syrup is a commodity most often used as an input in manufactured food
products. To a great degree the price for corn syrup is determined by the price for sugar.
The opportunities of developing products and markets to address the demand driver of
value are limited.
Wellness – Limited
The interest in low carbohydrate diets has adversely affected the sweetener
market. Corn syrup has the same negative connotations as sugar. In fact the health
effects of consuming corn syrup may be worse than sugar. As a result, the opportunities
of developing corn syrup productions appealing to the demand driver of wellness are
limited.
80
Snack Products
Background
This report will focus on corn snack products such as corn chips, nacho chips, and
health products that have corn as an ingredient. Overall, the salty snack market is $21.1
billion industry, which is showing slow but steady growth slightly larger than the rate of
inflation (Mintel, Salty Snacks, p.5). Tortilla chips and corn chips represent 23 and 4
percent respectively of this market (Mintel, Salty Snacks, p.20). Retail sales of tortilla
chips were $4.8 billion in 2003 (Mintel, Salty Snacks, p.22). The market share of corn
snacks is declining (Mintel, Salty Snacks, p.20); retail sales were $843 million in 2003
(Mintel, Salty Snacks, p.27). Corn based snacks are widely consumed with 79 percent of
all households and 90 percent of households with children purchasing corn chips, tortilla
chips and cheese snacks (Mintel, Salty Snacks, p.10).
The size of the market for tortilla chips is projected to increase from $4.8 billion
in 2003, to $5.9 billion in 2008, an increase of 24 percent (Mintel, Salty Snacks, p.90).
Sales of corn snacks are projected to increase from $843 million in 2003 to $919 million
in 2008, an increase of 9 percent which is likely less than rate of inflation during this time
period (Mintel, Salty Snacks, p.93).
However, the manufacturing side of the industry is dominated by Frito-Lay which
controls more than 50 percent of the market and has several brands such as Doritos that
are market leaders. Frito-Lay is completely dominant in the tortilla chip and corn snack
market with 79.2 percent of all retail sales of tortillas and 82.4 percent of corn snacks in
2003 (Mintel, Salty Snacks, p.32). No market outlet dominates the retail sector however;
supermarkets are the leaders with 49 percent or $10.2 billion in sales (Mintel, Salty

81
Snacks, p.7). Mass merchandisers have also become a major outlet of snack products
accounting for 18 percent of the total; Wal-Mart alone is estimated to be 15 percent of the
total snack food market (Mintel, Salty Snacks, p.7). Other sources of distribution are
convenience stores and vending machines (Mintel, Salty Snacks, p.8). Convenience
stores are a major outlet for tortilla chip sales.
Convenience – Selective
Most snack foods are inherently convenient; consumers can eat these foods with
their fingers. However, single serve packaging, and easy opening containers and
becoming more common (Mintel, Salty Snacks, p.17). As a result, there are selective
opportunities for products that appeal to the demand driver of convenience.
Ethnicity – Selective
The market for ethnically based snack products is growing. Flavors that are based
on Mexican, Mediterranean and Caribbean cuisines are becoming more popular (Mintel,
Salty Snacks, p.17). Whites and Hispanics are most likely to consume tortilla and corn
chips with 80 percent of those surveyed consuming these products. Blacks and Asians
are somewhat less likely to consume these products with 76 and 72 percent surveyed
consuming these products respectively (Mintel, Salty Snacks, p.64).
Overall, there are selective opportunities for products that appeal to the demand
driver of ethnicity.
Indulgence – Broad
There are a number of taste attributes that could be used to appeal to the demand
driver of indulgence. One example of this is guacamole chips. Such a product has been
introduced by Doritos (Mintel, Salty Snacks, p.11). Another product could be salsa
82
flavored corn chips, such a product would appeal to both indulgence and convenience as
consumers would no longer have to dip their chips. Chipotle is another ingredient that
could be introduced into corn chips. Another example of the flavors used is Kettle Foods
tortilla chips that have flavors such as Sesame Rye with Caraway, Sweet Brown Rice &
Black Bean and Five Grain Yellow Corn (Mintel, Salty Snacks, p.17).
There are broad opportunities for products that appeal to the demand driver of
indulgence.
Value – Limited
Given the size and market penetration of the largest firm in the industry, the
ability to develop products that appeal to the demand driver of value is limited.
Wellness – Selective
Snack products that target health appear to have the most potential for growth
(Mintel, Salty Snacks, p.1). Examples of snack products that could appeal to wellness are
products that are organic or all natural, low calorie or low fat, low sodium, low
carbohydrate and no trans fat (Mintel, Salty Snacks, p. 6). However, to be successful
these products will still have to taste good (Mintel, Salty Snacks, p.6).
Older consumers are less likely to consume tortilla chips and corn chips. Only 62
percent of those surveyed who 65 years old or older consume these products (Mintel,
Salty Snacks, p.63). This might be particularly true for those products that are low in
sodium. If the health attributes of these products could be enhanced, the amount eaten by
older consumers might increase.
Overall, the opportunity for developing products that appeal to the demand driver
of wellness is selective.

83
Summary
Corn is a commodity that is used for a wide rang of food products. Corn is also a
major commodity produced in Michigan, Ohio and Wisconsin. Strong demand for
animal protein will lead to a strong demand for feed. However, the opportunities for corn
syrup and oil products are severely limited. The demand drivers are working the corn
syrup and cooking oil industries.
There are some product opportunities for cereal, cereal bars and corn snack
products; especially those products that appeal to the demand drivers of indulgence and
wellness. However, many of these industries are dominated by large firms that exhibit
economies of scale and possess efficient distribution systems. In order to effectively
introduce products into these markets entrepreneurs will likely have to do one of two
things, develop partnerships with existing firms or target a very narrow market segment.
There may also be some ability to introduce innovative products in the corn snack
and tortilla chip markets. Adding new flavors and other attributes could expand demand
for these products. However, the problems of addressing economies of scale and
obtaining access to retailers remains.

84
Soybeans
Background
Soybeans are also a very important crop in Michigan, Ohio and Wisconsin. Many
farmers who grow corn also grow soybeans. Table 18 shows the acres planted and
production of soybeans in Michigan, Ohio and Wisconsin from 1999 through 2003.
Table 20: Soybean Production, Michigan, Ohio, Wisconsin 1999-2003Michigan Ohio Wisconsin
YearAcres
PlantedProduction (Bushels)
Acres Planted
Production (Bushels)
Acres Planted
Production (Bushels)
1999 1,950,000 77,600,000 4,600,000 162,000,000 1,350,000 59,800,0002000 2,050,000 73,080,000 4,450,000 186,480,000 1,550,000 60,000,0002001 2,150,000 63,900,000 4,600,000 187,780,000 1,600,000 58,090,0002002 2,050,000 78,540,000 4,750,000 151,040,000 1,540,000 66,880,0002003 2,000,000 53,730,000 4,300,000 164,780,000 1,720,000 46,760,000
Source: National Agricultural Statistics Service
Like corn, soybeans can be used for a wide variety of products. Table 19 shows
the estimated supply and utilization of soybeans in the U.S. in from September 2003
through August 2004.

85
Table 21: U.S. Soybean 2003-04 Balance SheetSupply Million BushelsBeginning Stocks 178Production 2,454Imports 6Total Supply 2,638UtlilizationCrush 1,530Seed, Feed Residual 111Exports 884Total Utilization 2,525
Ending Stocks 113
Source: Ash and Dohlman
Soybeans that are crushed generate soybean meal and soybean oil. The vast majority of
soybean meal is used for feed, especially for hogs, poultry and aquaculture production.
As is the case with corn, the demand for soybean meal is dependent on the demand for
feed. Soybean oil is used for a wide range of industrial and food products, including
soaps, lubricants, and ink among other products.
While not a large market in the U.S., soybeans are used for human consumption
as a vegetable. These soybeans are often referred to as edamame. There does appear to
be an opportunity for exports in this market. However, to take advantage of this market,
changes in production and marketing practices will be necessary. Soybeans are also used
in the production of cooking oils as well.
Another growing market for soybeans is as a processed food. This includes
everything from soymilk, to tofu, to meat alternatives. With the exception of soymilk,
most of these markets are small, but are growing. Furthermore, there appears to be
growing acceptance of these products.

86
There is also a growing market for soybeans products as inputs for industrial
purposes and as a fuel. Soybeans can be processed into biodiesel. Biodiesel can be used
in diesel powered vehicles up to 100 percent biodiesel. However, given the current cost
structure, the most common fuel blends are 2 percent biodiesel, 5 percent biodiesel and
20 percent biodiesel. The recently passed federal energy bill creates incentives to
increase the consumption of biodiesel. Since fuel and industrial uses of soybeans do not
fit the product matrix, these uses will be discussed at the end of the report.
Table 22 gives the demand driver/product form matrix for soybeans.
Table 22: Demand Driver/Product Form Matrix (Soybeans)Product Form Convenience Ethnicity Indulgence Value WellnessFeed Limited Limited Limited Limited LimitedFood Products Selective Selective Selective Selective BroadSoymilk Limited Broad Broad Limited BroadCooking Oil Limited Limited Limited Limited SelectiveEdamame Selective Limited Limited Limited Selective
The soybean matrix is very similar to the corn matrix. This is not surprising considering
that they operate in the same markets and are grown in the same area. In fact corn and
soybeans are often grown as part of a farmer’s crop rotation. Feed and cooking oil are
commodities; as such, cost considerations are paramount. This limits the opportunities
for new products or innovations in these industries. Soybeans have many attributes that
promote health. As a result, consumer oriented products that are geared toward this
demand driver likely have a higher probability of success.
Table 23 outlines the size of the market for selected soybean based consumer
markets in 2003 including the percentage change from 2002.
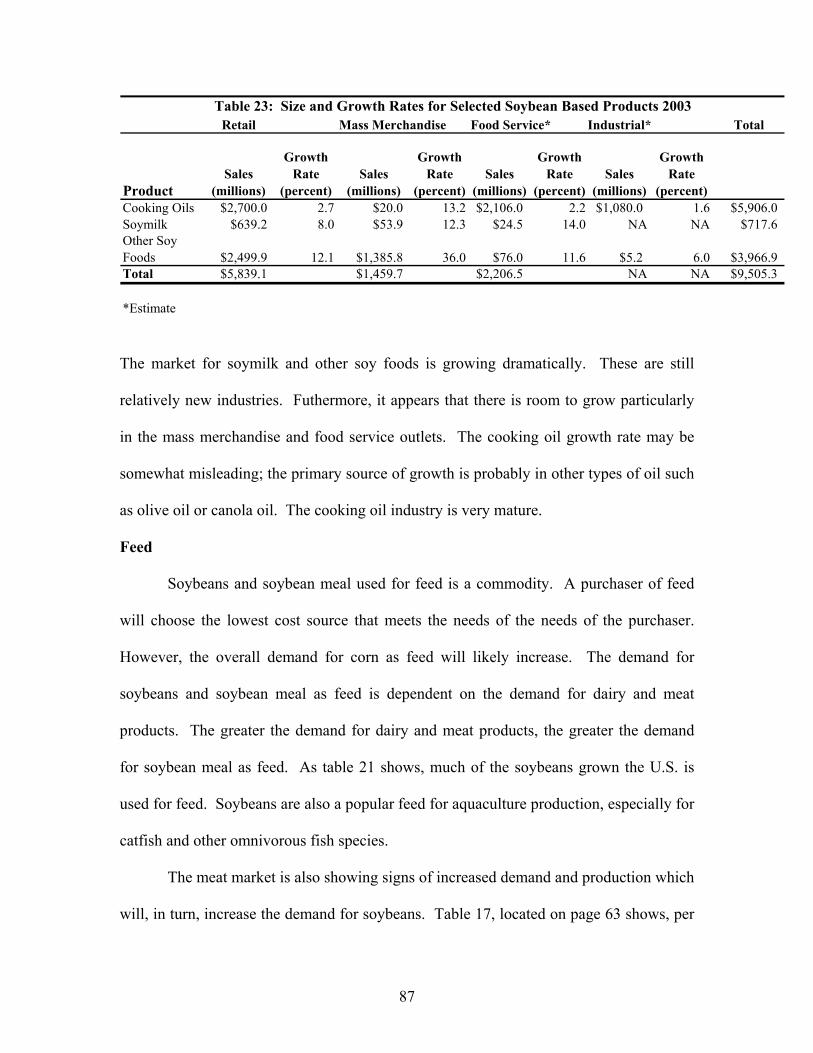
87
Table 23: Size and Growth Rates for Selected Soybean Based Products 2003Retail Mass Merchandise Food Service* Industrial* Total
ProductSales
(millions)
Growth Rate
(percent)Sales
(millions)
Growth Rate
(percent)Sales
(millions)
Growth Rate
(percent)Sales
(millions)
Growth Rate
(percent)Cooking Oils $2,700.0 2.7 $20.0 13.2 $2,106.0 2.2 $1,080.0 1.6 $5,906.0Soymilk $639.2 8.0 $53.9 12.3 $24.5 14.0 NA NA $717.6Other Soy Foods $2,499.9 12.1 $1,385.8 36.0 $76.0 11.6 $5.2 6.0 $3,966.9Total $5,839.1 $1,459.7 $2,206.5 NA NA $9,505.3
*Estimate
The market for soymilk and other soy foods is growing dramatically. These are still
relatively new industries. Futhermore, it appears that there is room to grow particularly
in the mass merchandise and food service outlets. The cooking oil growth rate may be
somewhat misleading; the primary source of growth is probably in other types of oil such
as olive oil or canola oil. The cooking oil industry is very mature.
Feed
Soybeans and soybean meal used for feed is a commodity. A purchaser of feed
will choose the lowest cost source that meets the needs of the needs of the purchaser.
However, the overall demand for corn as feed will likely increase. The demand for
soybeans and soybean meal as feed is dependent on the demand for dairy and meat
products. The greater the demand for dairy and meat products, the greater the demand
for soybean meal as feed. As table 21 shows, much of the soybeans grown the U.S. is
used for feed. Soybeans are also a popular feed for aquaculture production, especially for
catfish and other omnivorous fish species.
The meat market is also showing signs of increased demand and production which
will, in turn, increase the demand for soybeans. Table 17, located on page 63 shows, per

88
capita consumption of selected meat products in the U.S from 1997 to 2002 has
increased. The interest in low carbohydrate diets has increased the demand for animal
protein. From 1997 to 2002, per capita consumption of meat products has increased by
12.9 pounds or 7.5 percent. The typical American consumes 8 ounces of animal protein a
day, excluding fish. After a long decline, the demand for beef appears to be increasing.
The demand for chicken remains strong and the consumption of pork has also increased.
One way to differentiate the demand for soybeans as feed is to raise organic
soybeans. The soybean meal would be used by organic livestock producers. This is one
way to appeal to the demand driver of wellness. However, overall purchasers of feed will
be driven by the need to minimize their costs. As a result, value remains the most
important demand driver in this industry. This limits the opportunities in the feed
industry.
Food Products
Background
There is an ever expanding array of soy based food products available to
consumers. The size of the industry also is growing. Sales of soy foods (except dairy)
were estimated to be $1.4 billion; an increase of 16.8 percent from 2002 (Mintel, Soy-
Based Food and Drink, p.25). In addition to traditional soy products such as meat
alternatives soy based soups, energy bars, cheese and other products are being developed
and sold (Mintel, Soy-Based Food and Drink, p.7). There has been a great deal of new
product introductions in the soy food category. In 2002 there were 17,707 new product
introductions; that figure rose to 23,242 in 2004, an increase of 31.3 percent (Mintel, Soy-
Based Food and Drink, p.18).

89
However, there are some threats to the continued growth of the soy food products
category. Milk and meat producers have been successful in introducing organic and
natural products that appeal to the same consumer segment that soy food products appeal
to (Mintel, Soy-Based Food and Drink, p.8). Only 27 percent of consumers surveyed
stated that they are likely to buy soy-based versions of popular foods; a three percent
reduction from 2002 (Mintel, Soy-Based Food and Drink, p.9). The trend for soy food
products is troubling.
Another threat facing entrepreneurs interested in the soy food market is the
increased interest in this market by large food manufacturers such as Kellogg and Kraft
(Mintel, Soy-Based Food and Drink, p.8). Currently, there does appear to be ample
opportunities for small firms, but that may not be the case in the future.
Distribution also appears to be moving away from health food stores towards
supermarkets and mass merchandisers. Only 10.6 percent of retail sales are accounted
for by natural food stores (Mintel, Soy-Based Food and Drink, p.9).
Convenience – Selective
In order for soy based foods to become more popular they must be just as easy to
consume as traditional food items. The energy bar and gel market shows a great deal of
potential. Sales of soy based energy bars and gels were estimated to be $741.6 million in
2004, an increase of 41 percent from 2001 (Mintel, Soy-Based Food and Drink, p.26).
These products are an example of linking convenience and wellness into one product.
Another convenient way to consume soybean based products is through breakfast
cereal. Sales of ready to eat soy based breakfast cereals were estimated to be $201.5
million in 2004, an increase of 88 percent from 2001 (Mintel, Soy-Based Food and

90
Drink, p. 29). However, this developing market has already drawn the attention of some
large cereal manufacturers.
Another way to add convenience to soy food products is through cooking classes.
For example, Lund Food Holdings in Minnesota has been holding lessons (Mintel, Soy-
Based Food and Drink, p.52). Many consumers are not aware of soy food products and
education may be necessary to expand the market.
Overall, there are selective opportunities for soy food products that appeal to the
demand driver of convenience.
Ethnicity – Selective
According to a survey 25 percent of whites, 35 percent of Blacks and 29 percent
of Hispanics are likely to buy soy-based food products (Mintel, Soy-Based Food and
Drink, p.61). Asians are probably also more likely to consume soy foods given the role it
plays in Japanese and Chinese cooking. A growing number of Asian and Hispanic
consumers create selective opportunities for soy food products.
It should also be noted that women consistently consume more soy food products
than men. According to a survey, 30 percent of female respondents are likely to buy soy-
based products compared to 23 percent of males (Mintel, Soy-Based Food and Drink,
p.60). Expanding product offerings to women may be the easiest way to expand the
market.
Indulgence – Selective
There does appear to be opportunities in appealing to the demand driver of
indulgence. Consumption of most soy-based foods increases with educational attainment
(Mintel, Soy-Based Food and Drink, p.70). However, there is a perception that soy-based

91
foods do not taste good. If good tasting foods can generated there is potential. In order
to do so however soybeans will have to be developed that have little or no taste.
Currently, research is underway to achieve this goal (Mintel, Soy-Based Food and Drink,
p.81).
Overall, there are selective opportunities for soy food products that appeal to the
demand driver of indulgence.
Value – Selective
Many soy products are substitutes for other food items such a meat and pasta
products. Furthermore, the price of soybeans is quite low. Raw material costs are not
overly burdensome. Firms that can develop products or take advantage of economies of
scale may be able to offer low cost soy based alternatives to food products. This fact
creates selective opportunities for soy food products that appeal to the demand driver of
value.
Wellness – Broad
Soy food products are well positioned to take advantage of an aging population.
Soy products are allowed by the FDA to claim that they reduce cholesterol (Mintel, Soy-
Based Food and Drink, p.6), which is considered to be a major cause of cardiovascular
disease. No fewer than 80 percent of those surveyed who are likely to buy soy based
food items do so because they are perceived to be healthy products (Mintel, Soy-Based
Food and Drink, p.10). Another way to capture consumers interested in wellness is to
provide organic soy food products.
92
An aging population and an interest in heart health create broad opportunities for
soy food products that appeal to the demand driver of wellness, provided that consumers
are made aware of these products and products that taste good are developed.
Soymilk
Background
Milk from soybeans is often considered a small market. However, this is not the
case. It is a large and growing market. Nationwide, retail sales of soymilk are in the $800
million dollar range; roughly the size of the Michigan dairy industry. From 1997 to 2002
the growth in the size of the soymilk industry accounted for 30 percent of all the increase
in total milk sales (Mintel, Milk, p.15). As of April 2003, there were 8 brands of soymilk
distributed nationwide and the Organic Trade Association (OTA) believes that soymilk
sales will increase by 61 percent per year between 2003 through 2005 (Mintel, Milk,
p.15) . This is despite the fact that soymilk prices are roughly twice as high as dairy
milk prices (Mintel, Milk, p.15).
However, the size of the market is somewhat small. Only 7 percent of those
surveyed in 2002 reported drinking soymilk (Mintel, Milk, p.47). This could imply that
the market has room to grow, particularly if the population of people who are lactose
intolerant increases relative to the rest of the population. Some of the largest firms in the
dairy industry are involved in soymilk. This includes Dean’s Foods.
Convenience - Selective
Soymilk does have one convenience attribute that dairy milk generally does not
have; soymilk is shelf stable, which allows consumers to take it anywhere. Shelf stable
products would also appeal to retailers who would not have to bear the cost of
93
refrigeration. However, this advantage has not been exploited by the soymilk industry in
terms of advertising or promotion. This may be due to the fact their consumers may be
unwilling to purchase milk and milk replacement products anywhere other than the
refrigerated dairy case.
Most soymilk is sold in half gallon or gallon containers. This does not enhance
the convenience of the product. An increase in single serve soymilk products, especially
flavored single serve soymilk products could help expand the market. Single serve
flavored products would appeal to convenience stores and expand the ability to sell
soymilk in vending machines and other nontraditional outlets.
Overall there are selective opportunities in the soymilk industry of appealing to
the demand driver of convenience, particularly in the area of single serve packaging.
Ethnicity -Broad
The development of a more ethnically diverse America enhances the potential
expansion of the soymilk industry. It has been estimated that 50 to 75 percent of adult
Asians, Native Americans, blacks, Arab Americans, Jews and people of Mediterranean
decent are lactose intolerant (Mintel, Milk, p.14). Soymilk could be used to address this
problem. Asians are particularly large consumers of soymilk, 15 percent of Asian
consumers surveyed consume soymilk (Mintel, Milk, p.49).
Ethnic tastes differ somewhat from those of white Americans, yet there are few
flavored soy milk products available. Expanding the number of flavored products would
increase the appeal of soymilk to various ethnic groups.

94
A growing group of consumers that are lactose intolerant and familiar with
soymilk creates broad opportunities in the industry in appealing to the demand driver of
ethnicity.
Indulgence - Broad
Soymilk appeals to the demand driver of indulgence in several ways. A few
consumers are pure vegetarians, who do not use any animal based products. Soymilk
addresses this concern. Some consumers are also opposed to the use of hormones in milk
cows and are opposed to large scale dairy farms; consuming soymilk also addresses these
issues. Much of the indulgence characteristics of soymilk are social and ideological in
nature.
However, there are also taste and flavor characteristics that could appeal to
indulgence. Some consumers are interested in soymilk because they are lactose
intolerant or for the social reasons listed above, but are still interested in different flavors,
tastes and textures. Expanding the range of flavors and products could allow soymilk to
appeal to indulgence.
Currently, in terms of flavors, textures and social concerns, the ability to appeal to
the demand driver of indulgence has been underserved. This creates broad opportunities
with respect to this demand driver.
Value - Selective
As previously noted, the retail price of soymilk is twice that of dairy milk.
Clearly there are a group of consumers willing to pay a price premium for soymilk.
There may be an opportunity to offer the product at a lower price and thereby increase
market share and market penetration. However, in order to do so, the soymilk processor

95
will need to take advantage of economies of scale. This likely would require some type
of group activity among soybean producers such as forming a cooperative or entering
into an alliance with another firm. It would also require competing with some very large
firms already involved in the industry.
As a result of the factors listed above, there are selective opportunities of
appealing to the demand driver of value in the soymilk industry.
Wellness - Broad
One way to appeal to the demand driver of wellness is to appeal to women
consumers. Women are more likely than men to drink organic and soymilk (Mintel,
Milk, p.61). Soymilk is also naturally low in cholesterol and could appeal to older
consumers worried about their health. Expanding the fortifications of soymilk products
in terms of additional vitamins and minerals could also be used as a way to appeal to the
demand driver of wellness.
Overall, the ability to appeal to the demand driver of wellness in the soymilk
industry is broad.
Cooking Oil
Background
Unlike feed or biodiesel soybean based cooking oil is a consumer product. As
such it can be treated in a manner similar to corn oil products previously analyzed.
However, the opportunities in this industry are limited. Most consumers see cooking oil
as a commodity and are price sensitive (Mintel, Edible Fats and Oils p.21). For purposes
of this report cooking oil will be defined as cooking and salad oil, olive oil and vegetable
shortening.

96
The cooking oil industry is mature, sales of cooking oil in real terms has been flat
1998 to 2003. This trend is expected to continue. Mintel estimates that sales of cooking
and salad oil will decline by 10 percent from 2003 to 2008 (Mintel, Edible Fats and Oils,
p.76). This implies that the overall opportunities in this industry are limited. The number
of new product introductions may be symptomatic of this. Table 24 gives the number of
new products introduced into North America from 2001 through the first half of 2003.
Table 24: New Oil Product Introductions 2001 - 2003 (North America)
Year New Product Introductions2001 1302002 111
2003* 67Total 308* First six months of 2003Source: Mintel
This is not a product category that has seen a great deal of new product introductions.
Many of these are likely to be in the rapidly increasing olive oil sector.
Retail sales of cooking and salad oils were $1.02 billion in 2003, and olive oil
sales were $424 in the same year (Mintel, Edible Fats and Oils, p.19). Almost 99 percent
of retail sales are through grocery stores (Mintel, Edible Fats and Oils, p.40). According
to a survey, 93 percent of households use cooking and salad oil (Mintel, Edible Fats and
Oils, p.7). Some of the firms in the edible fats and oils industry are quite large and
include, Unilever, Kraft Foods and ConAgra. Producing at a low cost is important in this
industry.
One trend working against oil consumption is the aging population. Consumption
declines with age. This is likely due to the fact that older households tend to be smaller,

97
and that many older people are less likely to cook. Concerns about health may also lead
to less consumption in older households (Mintel, Edible Fats and Oils p.47).
Convenience – Limited
The trend for convenience is working against cooking oil. According to one
survey 40 percent of respondents stated that no one in the household cooked from scratch
in the 90 days preceding the survey (Mintel, Edible Fats and Oils, p.6). The decline in
cooking skills and time to prepare meals mean less oil will be consumed at home. Smaller
household sizes also imply that their will be an increased demand for cooking oil in
smaller sizes.
The increase in eating away from home also implies that more cooking oil will be
used in restaurants and other non-home food outlets. However, these outlets will be very
price sensitive. Overall the opportunities to appeal to the demand driver of convenience
are limited.
Ethnicity – Limited
The growing number of Hispanics and Asians will increase the demand for
cooking oil. All ethnic groups besides whites consume above average amounts of
cooking oil (Mintel, Edible Fats and Oils, p.7). Black and Hispanic households use the
most oil and the widest variety of oils (Mintel, Edible Fats and Oils, p.7). These
households are particularly high consumers of vegetable oil (Mintel, Edible Fats and
Oils, p. 55).
Asians use less nonstick cooking sprays (such as PAM) and shortening, and use
more non traditional oils such as sesame and peanut oils. Soybean oil products are
something many Asian consumers are used to using. Much Asian cooking relies heavily
98
on the use of oils (Mintel, Edible Fats and Oils, p.45). Asian and Black households are
also more likely to use oil for deep frying (Mintel, Fats and Oils, p.60).
While the increase in the number of Asians and Hispanics is limiting the overall
decline demand in cooking oil demand, given the maturity of the industry the ability to
appeal to the demand driver is limited.
Indulgence – Limited
As is the case with many products there is an increased interest in different
flavors. Oils that have different flavors and seasonings may find a market. This may also
allow a specialty manufacturer to enter a market that is not being served by one of the
large cooking oil manufacturers.
One way to increase the demand for specialty oils is to offer recipes with their
product or by bundling smaller packages of multiple flavored oils (Mintel, Edible Fats
and Oils, p.53). However, all things considered, the ability to develop products and
markets that appeal to the demand driver of indulgence is limited.
Value – Limited
In many respects cooking oil has become a commodity. Given the maturity of the
market and the size of some of the firms involved, the ability of developing products and
markets that appeal to the demand driver of value is limited.
Wellness – Selective
The interest in eating healthy as affected the cooking oil market. According to
one survey 67 percent of consumers have changed their fat and oil consumption for
health reasons. Furthermore, consumers also are increasingly reading nutritional labels

99
and understand the difference between “good” and “bad” fats (Mintel, Edible Fats and
Oils, p.7).
The interest in cooking with healthy oils works may work in favor of soybean
based oils with their low levels of saturated fats. However, there is a great deal of
competition. Olive oil, grapeseed oil, and sunflower oil all sell at higher prices than
traditional vegetable oil (Mintel, Edible Fats and Oils, p.6). Olive oil demand is
increasing at the expense of other oils. Soybean oil processing may need to change in the
face of the upcoming regulation requiring trans fatty acids labeling. Apparently, this is
currently being undertaken by cooking oil manufacturers. For example all Wesson oils,
including soybean based oil, have no trans fatty acids (Mintel, Edible Fats and Oils,
p.37). However, canola oils are already advertising the fact that they are naturally free of
trans fatty acids.
However, there is one positive trend that can be used with soybean oil. There is
an increasing interest in organic oils (Mintel, Edible Fats and Oils, p.7). There may also
be a market for oils that improve health, such as oils that reduce LDL or “bad”
cholesterol (Mintel, Edible Fats and Oils, p.82).
While the overall market for cooking oil is declining there appears to be selective
opportunities for new products and market innovation that appeal to the demand driver of
wellness. Consumers appear to be receptive to new products that are healthier than
existing cooking oil products.

100
Edamame
Background
Edamame (eh-dah-mah-may, sometimes spelled endamame), is a name of the
family of soybean varieties that are used for vegetable production for human
consumption. The primary market of edamame is Asia, but there appears to be a growing
market in the U.S., particularly as a substitute for Lima Beans (Konovsky et al. p.5), and
as a snack food.
Edamame is used for a wide variety of products including salads, soups, stir fry or
stews (Ag Answers, p.1). In the U.S., edamame is found mostly in health food stores and
stores that specialize in Asian products. In 2002, the domestic price of edamame
approached 4 dollars a pound. Most of the edamame consumed in the U.S. was imported
from Taiwan (Bryant, p.1). Given the ability of U.S. producers to efficiently grow
soybeans, it should be possible to meet the needs of this market domestically and
possibly exports edamame soybeans overseas.
However, it should be noted that this is not a large market. It has been estimated
that it would only take 32,000 acres of edamame production to meet the entire U.S.
market (Johnson et al, p.3). In order to meet this market it may be necessary for farmers
and entrepreneurs to identify individual buyers and develop close relationships. If a large
number of producers enter the edamame market, the price is likely to collapse. This
market is very different from most traditional soybean markets.
Convenience – Selective
Edamame’s primary use is as a snack food particularly in Asia. As a snack, pods
are cooked in salted water and the seeds are pushed from the pods directly into the mouth
101
(Konovsky et al, p.1). The convenience of this product could be improved by taking the
beans out of the pod, much in the same way that peanuts are often sold shelled. There
are selective opportunities for appealing to this demand driver.
Ethnicity – Limited
The primary market for this product is Japan. While it is not impossible to enter
this market it would be difficult. For example only biotech free soybeans are likely to be
accepted into this market. Also, there is a difference in preferences between Japanese
and U.S. consumers. U.S. consumers prefer a more mature bean that has a buttery taste,
whereas the Japanese consumers tend to prefer a less mature, sweeter tasting bean
(Johnson et al, p.5). Producers will have to determine which market segment to
concentrate on.
While a growing Asian population is positive for the edamame market, overall
opportunities are limited.
Indulgence – Limited
Most Americans do not see fried soybeans as a snack food, and are unlikely to
move towards this product as a snack item, unless indulgence can be complemented with
the health benefits of consuming soybean products. Edamame is not likely to appeal to
the demand driver of indulgence.
Value – Selective
Currently, much of the edamame consumed in major markets such as Japan is
imported. The U.S. is also an importer of edamame. The U.S. has an inherent
competitive advantage over many of the current exporters of this product such as Taiwan.
If the proper marketing arrangements could be made, and if the proper varieties,

102
including non genetically modified (GMOs) varieties are grown there is an opportunity to
expand production and market share of edamame for U.S. producers. It should be noted
that this product sells at a substantial premium over non edamame soybeans.
However, edamame soybeans are a commodity, and the lowest cost source will
have an advantage. Overall, there are selective opportunities of appealing to the demand
driver of value in the edamame industry.
Wellness – Selective
Soybeans are considered healthy. However, the traditional use of edamame as a
fried, salted, snack food may offset the health attributes of consuming soybeans in this
form. Other uses of edamame such as stir fry and as a salad ingredient may appeal to
wellness. Overall, there are selective opportunities of edamame appealing to the demand
driver of wellness.
Summary
Soybeans are a major crop for producers in Michigan, Ohio and Wisconsin. They
can also be used for a wide range of products. The greatest potentials appear to be in the
areas of wellness and ethnicity. The increase in the number of people who are lactose
intolerant will increase the demand for soy based dairy products. The fact that soybeans
are naturally low in fat and can reduce cholesterol can be used to develop and market a
wide range of soy food products.
However, the market for some soybean products is not conducive to new product
developments. The opportunities in cooking oil and feed are very limited and will be
driven by cost factors. The market for edamame is also small. Farmers and processors
interested in this market need to identify buyers in order to ensure success.

103
Fuel and Industrial Uses
Background
Corn and soybean products have a number of non food uses. Corn, and a number
of other agricultural commodities, can be used to produce ethanol, a common fuel
additive. Ethanol is growing in popularity as a result of government subsidies, the
increased cost of petroleum and the fact that ethanol can be used as a fuel oxygenate.
Corn products can also be used for a number of industrial uses such as plastics.
Soybeans can also be used for a number of different purposes. Soybeans can be
blended with diesel fuel in virtually any combination to create biodiesel. The market for
biodiesel is also growing, although production currently is greater than consumption. As
is the case with corn, soybeans have a number of industrial uses as well, including but not
limited to, solvents, oils, plastics, and other products.
Ethanol
Several factors have led to a large increase in ethanol production and utilization.
Ethanol is a substitute gasoline additive for methyl tertiary-butyl ether (MTBE) which
has been banned in many states. Rising oil costs have also increased the demand for
ethanol. It has been estimated that production of corn based ethanol could reach 5 billion
gallons a year by 2006 (Brasher, December 12, p.1). Another source of the demand for
ethanol is subsidies. The federal government subsidizes ethanol at 54 cents a gallon. This
helps ethanol compete with gasoline on a cost basis. Table 25 shows the rapid increase in
ethanol production in the U.S., production has almost tripled from 1997 to 2004.

104
Table 25: U.S. Ethanol Production 1997-2004
YearEthanol Production
(Billion Gallons)1997 1.31998 1.41999 1.52000 1.62001 1.82002 2.12003 2.82004 3.4
Source: Brasher (December 12)
From 1997 to 2000 ethanol production increased by 100 million gallons a year. Since
then, the rate of increase in capacity has accelerated. Improved conversion of corn to
ethanol may also aid in the development of this industry, although reducing the amount
of corn needed for ethanol production. The size of ethanol plants is also increasing
allowing these plants to take advantage of economies of scale.
It appears that ethanol plants have been successful in raising the price of corn. It
has been estimated that ethanol plants increase the price of corn by 5 to 10 cents a bushel
in the area that where the plant is located (Brasher, December 12, p.1). However, if the
plant is to be successful, the plant should be able to generate its own profits or a least
generate losses equal to or less than the increase in the price of corn if the plant is owned
by farmers.
Most plants are located in the corn belt and northern plains. There are few plants
east of Michigan and Ohio. This creates some potential for one or two additional plants
in the Michigan, and perhaps additional plants in Ohio and Wisconsin as well. However,
to be successful, an ethanol plant should take advantage of the latest technology and
economies of scale. Also, many ethanol plants are following a business model of

105
locating plants near large feedlots. Ethanol byproducts are used for feed. If an ethanol
plant is to minimize costs and maximize profits, it needs a market or the feed byproduct.
Locating ethanol plants near large feedlots also minimizes transportation costs.
Michigan’s relative lack of large feedlot operations puts the state in a relative
disadvantage compared to other states such as Nebraska and South Dakota.
There are also several threats to the sustainability of ethanol. The first is the
potential for a decline in the price of oil. Crude oil prices have already declined from
their highs in the summer of 2004. Undiscovered oil supplies in places such as Russia
could put further downward price pressure on oil, thereby putting downward pressure on
ethanol prices. Another threat is international competition. Ethanol can be produced
from a number of sources. Cargill has announced that it will start importing ethanol
made from sugar in Central American countries into the U.S. It is estimated that ethanol
can be produced for 50 cents a gallon in Brazil (Brasher, June 27), one half the cost of
production in the U.S. Ethanol is a bulk commodity, and if it becomes a global
commodity, ethanol producers in the U.S. will face the same global pressures that are
faced by other products that are traded internationally.
As with the case of corn for feed, ethanol is a commodity based industry. As
such, the fundamental driver is value. The demand for ethanol is a function of subsidies
and government regulation. However, buyers will look for the lowest cost source of
ethanol to fulfill their needs or government requirements. As such, corn producers
interested in ethanol must insure that they can produce it at a very low cost, and have a
market for their feed byproduct. The plant also has to be integrated into a fuel
distribution system. A well established supply chain needs to exist or be created if the

106
plant is to be successful. If a plant can be built and operated at a low cost there are
selective opportunities for ethanol producers; otherwise the opportunities in this industry
are limited.
Biodiesel
Biodiesel is a fuel replacement for petroleum-based diesel fuel. The primary
sources of biodiesel are soybean oil and used restaurant grease although other vegetable
oils such as canola and sunflower oils can also be used. In the production of biodiesel,
soybean oil is converted to fuel and glycerin. The glycerin is used for a number of
industrial products. There is a great deal of interest in biodiesel production. From
October 2002 through September 2003 the biodiesel industry in the U.S. produced 25
million gallons. It is estimated that from October 2003 through September 2004, output
will be 30 million gallons. Total potential capacity is approximately 150 million gallons
per year, but production could double over the next year as a result of new biodiesel
plants going into production (National Biodiesel Board, p.1). From 2000 to 2002, U.S.
diesel fuel consumption averaged 44.76 billion gallons. Replacing only two percent of
this consumption would consume 6.58 billion pounds of soybean oil which is about one
third of all soybean oil production (Michigan Soybean Promotion Committee, p. 2). The
widespread adoption of biodiesel has the potential to drive up the demand for soybeans
and increase the price of the crop.
There are two primary potential drivers for the increased demand for biodiesel:
value and wellness. To improve the competitiveness of biodiesel a federal excise tax
incentive has been created. The tax credit for vegetable oils is one cent for each percent
of biodiesel in the blend. For example a blend with 2 percent biodiesel would have a 2
107
cents tax credit and a 20 percent biodiesel blend would have a 20 cents tax credit. A 20
cent credit would make the price of the biodiesel blend competitive with regular diesel
fuel.
Using biodiesel also counts as an alternative fuel for other federal programs. An
amendment to the Energy Policy Act of 1992 allows biodiesel to count as an alternative
fuel for federal, state and public utilities that are required to purchase alternative fuel
vehicles. (Michigan Soybean Promotion Committee, p.8). It may be the case that the use
of biodiesel is the low cost way to meet this requirement. The Environmental Protection
Agency (EPA), enacted rules in 2000 that require sulfur levels in diesel engines to be
reduced in 2006 for on road vehicles and off road engines in 2007 and reduced further in
2010 (Michigan Soybean Promotion Commission, p.8). Biodiesel contains no sulfur and
therefore may be the low cost method of achieving the new standards.
Biodiesel also has attributes that appeal to wellness. Biodiesel fumes do not have
the same adverse effects on some individuals that regular diesel fumes have. This fact is
appealing to some school districts and firms that use diesel engines stationary diesel
engines that are in close proximity to workers. One thing that is appealing with respect to
biodiesel is the ability to sell to fleets. A biodiesel processor could have the ability to sell
all of its output to one or two buyers. This makes developing markets and identifying
buyers relatively easy.
Despite the many positive aspects of biodiesel demand, there are several
concerns. The biggest concern is that the supply of biodiesel is increasing faster than the
demand. Biodiesel advocates need to spend more time increasing the demand and
developing markets for biodiesel and less time expanding biodiesel capacity. Another

108
issue is cost. Blends less than 20 percent biodiesel are not cost competitive with regular
diesel. However, pending federal requirements may lead to a major shift to biodiesel.
One thing facing the future of biodiesel is the fact that it will remain a
commodity. That is, buyers of biodiesel will also search for the lowest cost source of
biodiesel. Therefore biodiesel producers and processors will need to use the best
technology and take advantage of economies of scale to compete successfully.
Industrial Uses
There are number of potential industrial uses for corn and soybean products. This
includes, but is not limited to, plastics, pharmaceutical sugar substitutes, ink, solvents,
cleaners and other products that are currently being produced with petroleum based
products. This market is still developing but shows some degree of promise.
Corn and soybean based industrial products do have several advantages. The
most important advantage is that many are biodegradable. Firms and consumers that are
interested in a clean environment or using products that are recyclable will find this
attribute alluring. This can be seen as appealing to the demand driver of indulgence, as
more and more people place a higher value on a clean environment. Insofar as these
products are safer for human use than other products, the products could also appeal to
the demand driver of wellness.
Corn and soybean based industrial products also can be used as a substitute for
imported petroleum. Should the price of petroleum continue to be high by historical
standards, corn based industrial products may be substituted for petroleum based
products. This attribute appeals to the demand driver of value. Nonetheless, corn and
soybean based industrial products need to be produced at the lowest possible costs.

109
Industrial buyers of these products are going to only purchase from the low cost suppliers
of these products.
In order to meet the challenges and opportunities of the industrial market corn
producers, initial handlers and processors will have to adjust their operating practices.
This may include growing corn and soybean varieties that meet the specifications of the
industrial user. Another thing to consider is the fact that the marketing chain for
industrial products is very different than the traditional agricultural marketing chain.
This may require a different delivery system and different inventory control than the
typical agricultural marketing chain.
Conclusion
Wheat, corn and soybeans are the dominant field crops produced in Michigan,
Ohio and Wisconsin. Economic and demographic changes have created several
fundamental demand drivers. There are several products that show promise. These tend
to be high value products that appeal primarily to the demand drivers of ethnicity, and
wellness. There are some opportunities for products that appeal to the demand drivers of
indulgence, particularly in some wheat based products such as cakes and artisan breads.
There are also some opportunities that appeal to convenience and to a lesser extent value.
A major issue facing producers, processors and entrepreneurs is the need to
develop alternative marketing arrangements. To take full advantage of some of these
opportunities, those involved in these industries will have to move away from a
traditional commodity based arrangements and move towards a more coordinated
product, based supply chain. Examples include forming cooperatives, entering into
strategic alliances and alternative contracts. It would be very difficult for an individual

110
wheat, corn or soybean producer to develop a unique product, and supply the entire
market by him or herself.
The supply chain for industrial and energy products is also different from
traditional agricultural supply chains. The users of these products are primarily driven by
price; value is the preeminent demand driver for industrial and energy consumers. As a
result corn and soybean producers interested in these markets need to be low cost
providers of these products.

111
References
About. Why You Should Avoid Trans Fatty Acids. University of Iowa Health
Center. http://diabetes.about.com/cs/newswirea/blntransfats903_p.htm.
Ag Answers. “Edible Soybean Could give New Meaning to “Soymeal””.
http://www.agriculture.purdue/aganswers/2001_Edible_Soybeans.
Ash, M. and E. Dohlman. Oil Crops Outlook, United States Department of
Agriculture OCS-04k. Washington, Economic Research Service, United States
Department of Agriculture, 2004.
Baker, A. and E. Allen. Feed Outlook, United States Department of Agriculture
FDS04j. Washington, Economic Research Service, United States Department of
Agriculture, 2004.
Beuerlein, J. Classes and Uses of Wheat, Extension Fact Sheet AGF -146-01.
Columbus: The Ohio State University Extension.
Brasher, P. Cargill’s Plan Exploits Ethanol Loophole. Des Moines Register, June
27, 2004.
_______. Ethanol Business Booming. Des Moines Register, December 12, 2004.
Bryant, D. “Watch Central Coast Market Signals”. Western Farm Press, March
15, 2002.
Day, J.C. Population Projections of the United States by Age, Sex Race and
Hispanic Origin: 1995 to 2050, U.S. Bureau of the Census, Current Population Reports,
P25-1130, U.S. Government Printing Office, Washington, DC, 1996.
112
Dietary Guidelines Advisory Committee (DGAC). Dietary Guidelines of
Americans 2005. Washington, Department of Health and Human Services and United
States Department of Agriculture, 2005.
Hobbs, F. and N. Stoops. U.S. Census Bureau, Census 2000 Special Reports,
Series CENSR-4, Demographic Trends in the 20th Century, U.S. Government Printing
Office, Washington, DC, 2002.
Johnson, D., S Wang, and A. Suzuki. “Edamame: A Vegetable Soybean for
Colorado”. http://www.hort.purdue/edu/newcrop/proceeding1999/v4-385.html.
Konovsky, J.T., T.A. Lumpkin and D. McClary. “Edamame: The Vegetable
Soybean”. http://www.stratsoy.uiuc.edu/~stratroy/misc/edamame.html.
Larsen, L.J. The Foreign Born Population in the United States: 2003. Current
Population Reports, P20-551, U.S. Census Bureau, Washington, DC, 2004.
Michigan Department of Agriculture. Michigan Agricultural Statistics 2003-
2004. Lansing, Michigan Department of Agriculture, 2004.
Michigan Soybean Promotion Committee. Biodiesel Use in Michigan: A
Technical Economic and Environmental Analysis. Michigan Soybean Promotion
Committee, Frankenmuth, 2004.
Mintel. Bread. Mintel, Chicago, 2004.
_____. Breakfast Cereal. Chicago, 2003.
_____. Cakes. Mintel, Chicago, 2004.
_____. Cereal Bars. Mintel, Chicago, 2004.
_____. Cookies. Mintel, Chicago, 2004.
_____. Crackers. Mintel, Chicago, 2003.

113
_____. Edible Fats and Oils. Mintel, Chicago, 2004.
_____. Milk. Mintel, Chicago, 2003.
_____. Organic Foods and Beverages. Mintel, Chicago, 2004.
_____. Salty Snacks. Mintel, Chicago, 2004.
_____. Soy-Based Food and Drink. Mintel, Chicago, 2004.
_____. Sugar and Sweeteners. Mintel, Chicago, 2004.
National Biodiesel Board. Tax Incentive Fact Sheet.
Nunes, P.F., B .A. Johnson and R.T.S. Breene. Selling to the Moneyed Masses,
Harvard Business Review, Volume 82, No.7/8 (94-104).
Reeves, T. and C. Bennett. The Asian and Pacific Islander Population in the
United States: March 2002, Current Population Reports, P20-540, U.S. Census Bureau,
Washington, DC, 2003.
Southard, L. Livestock, Dairy and Poultry Outlook, U.S. Department of
Agriculture, LDP-M-125. Washington, Economic Research Service, U.S. Department of
Agriculture, 2004.
U.S. Census Bureau, Current Population Reports, P60-213, Money Income in the
United States: 2000, U.S. Government Printing Office, Washington, DC, 2001.

114