the statements and information care about the future also...
TRANSCRIPT


In this presentation we make forward-looking statements that are subject to risks and uncertainties.
Such statements are based on beliefs and assumptions of our management and information to which theCompany currently has access. Forward-looking statements include information regarding our intent, beliefor current expectations, as well as those of the Board of Directors and Officers of the Company.
The statements and information care about the future also include information of possible or presumedoperating results, as well as statements preceded by, followed by or include the words "believes", "may","will", "continue" "expects", "anticipates", "intends", "plans", "estimates" or similar expressions. Thestatements and information about the future are not guarantees of performance. They involve risks,uncertainties and assumptions because they are relate to future events and therefore depend oncircumstances that may or may not occur. Future results and the creation of value for shareholders maydiffer from those expressed or suggested by forward looking statements. Many of the factors that willdetermine these results and values are beyond of our capacity or ability to control or predict.
2
Disclaimer

Agenda
1.
2.
3.
4.
5.
Corporate Profile
Strategy
Real Estate Market
Operational Performance
Financial Performance
3

1
CorporateProfile
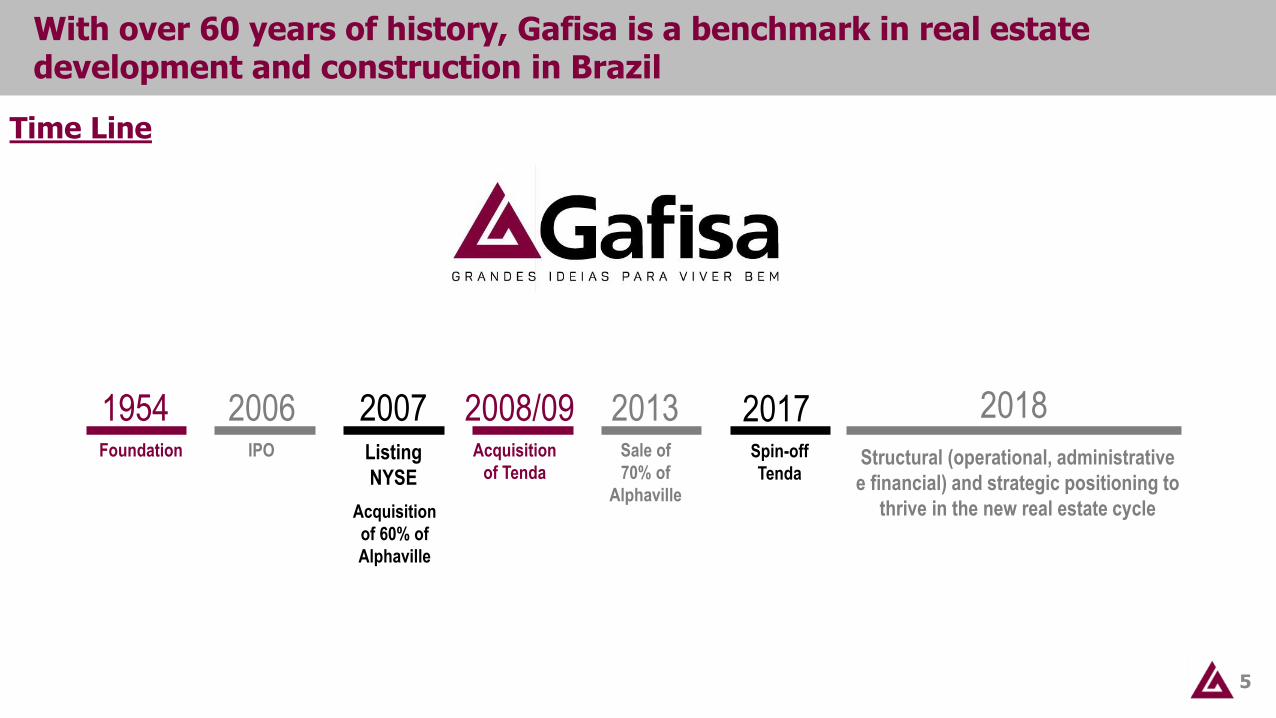
With over 60 years of history, Gafisa is a benchmark in real estate development and construction in Brazil
5
Time Line
1954Foundation
2006IPO
2007Listing
NYSE
2008/09 2013Sale of
70% of
Alphaville
Acquisition
of Tenda
Acquisition
of 60% of
Alphaville
Structural (operational, administrative
e financial) and strategic positioning to
thrive in the new real estate cycle
20182017Spin-off
Tenda

Gafisa focus its activities in the middle and upper-middle class segments, in the states of São Paulo and Rio de Janeiro
6
Corporate Profile
Approx. 2,700 employees (including own and third parties)
30% interest in Alphaville
Segments
Moov – units priced between R$350k-R$500k
Line – units priced between R$500k-R$2MM
Regions
São Paulo
Rio de Janeiro
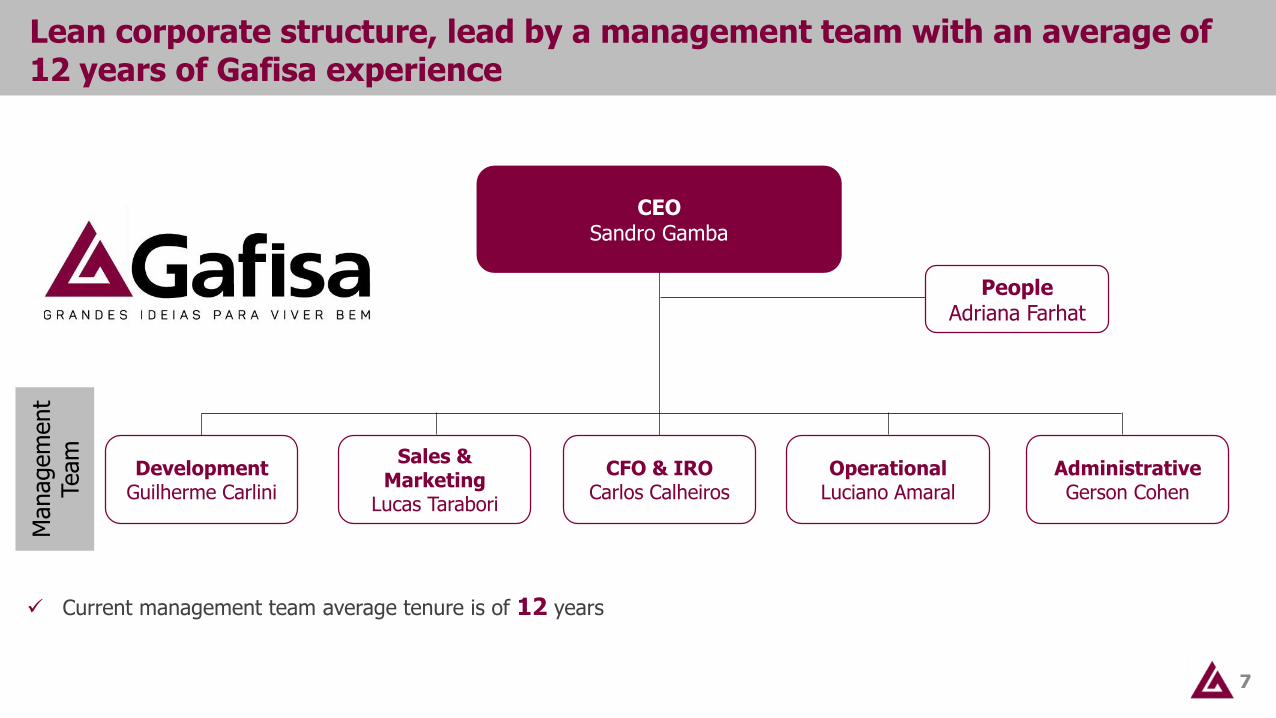
Lean corporate structure, lead by a management team with an average of 12 years of Gafisa experience
7
CEOSandro Gamba
PeopleAdriana Farhat
DevelopmentGuilherme Carlini
Sales & Marketing
Lucas Tarabori
CFO & IROCarlos Calheiros
OperationalLuciano Amaral
AdministrativeGerson Cohen
7
Managem
ent
Team
✓ Current management team average tenure is of 12 years

Strategy
2

Gafisa’s strategy for the next cycle is based on 4 pillars of competitive advantages
9
Corporate Governance Constructive Method
Sales Model Brand Strength
Gafisa Strategy
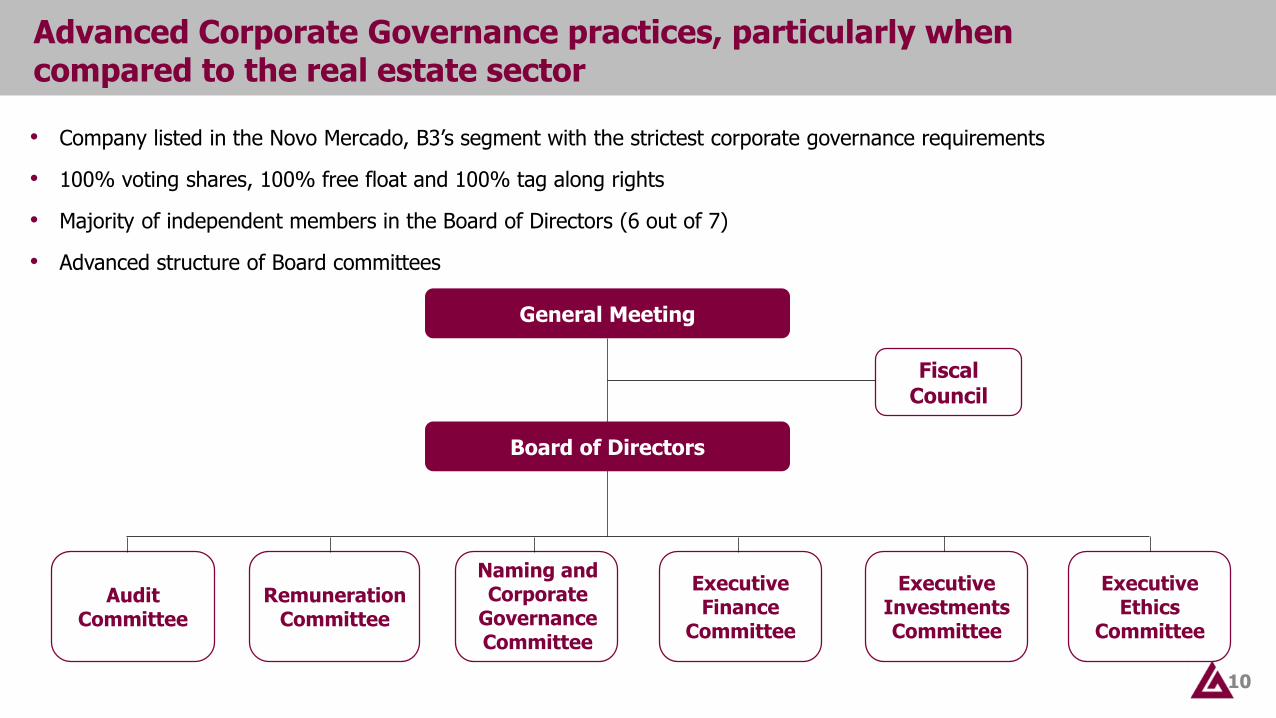
Advanced Corporate Governance practices, particularly when compared to the real estate sector
10
• Company listed in the Novo Mercado, B3’s segment with the strictest corporate governance requirements
• 100% voting shares, 100% free float and 100% tag along rights
• Majority of independent members in the Board of Directors (6 out of 7)
• Advanced structure of Board committees
General Meeting
Board of Directors
Fiscal Council
Naming and Corporate
Governance Committee
Audit Committee
Remuneration Committee
Executive Finance
Committee
Executive Investments Committee
Executive Ethics
Committee

11
Gafisa uses an innovative process in its Moov line, which reduces the cycles in its construction method
✓ Cost Reduction
✓ Term Reduction
Industrialization
✓ Reduction of the activities cycle✓ 70% of cycles with up to 5 suppliers
Benefits
✓ Productivity gains✓ Eased planning and control
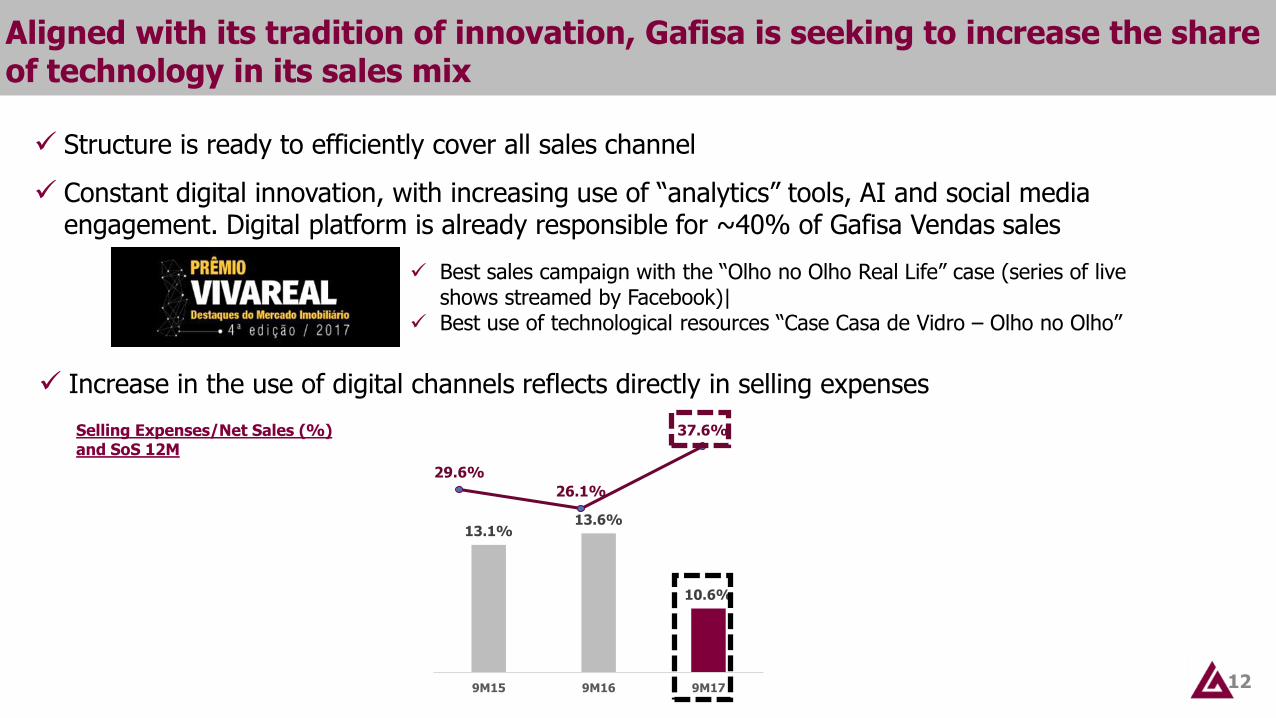
Aligned with its tradition of innovation, Gafisa is seeking to increase the share of technology in its sales mix
12
✓ Structure is ready to efficiently cover all sales channel
✓ Constant digital innovation, with increasing use of “analytics” tools, AI and social media engagement. Digital platform is already responsible for ~40% of Gafisa Vendas sales
✓ Best sales campaign with the “Olho no Olho Real Life” case (series of live shows streamed by Facebook)|
✓ Best use of technological resources “Case Casa de Vidro – Olho no Olho”
✓ Increase in the use of digital channels reflects directly in selling expenses
13.1%13.6%
10.6%
9M15 9M16 9M17
Selling Expenses/Net Sales (%) and SoS 12M
29.6%
26.1%
37.6%
13
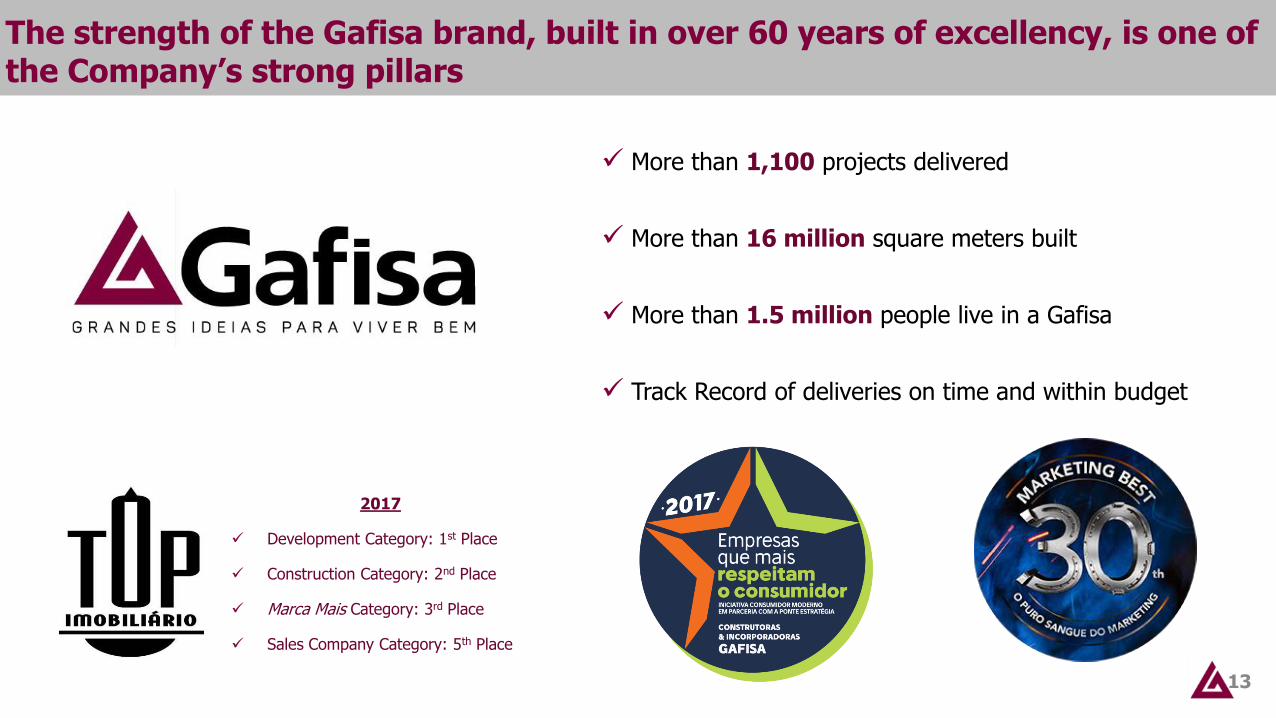
✓ More than 1,100 projects delivered
✓ More than 16 million square meters built
✓ More than 1.5 million people live in a Gafisa
✓ Track Record of deliveries on time and within budget
2017
✓ Development Category: 1st Place
✓ Construction Category: 2nd Place
✓ Marca Mais Category: 3rd Place
✓ Sales Company Category: 5th Place
The strength of the Gafisa brand, built in over 60 years of excellency, is one of the Company’s strong pillars

Real EstateMarket
3
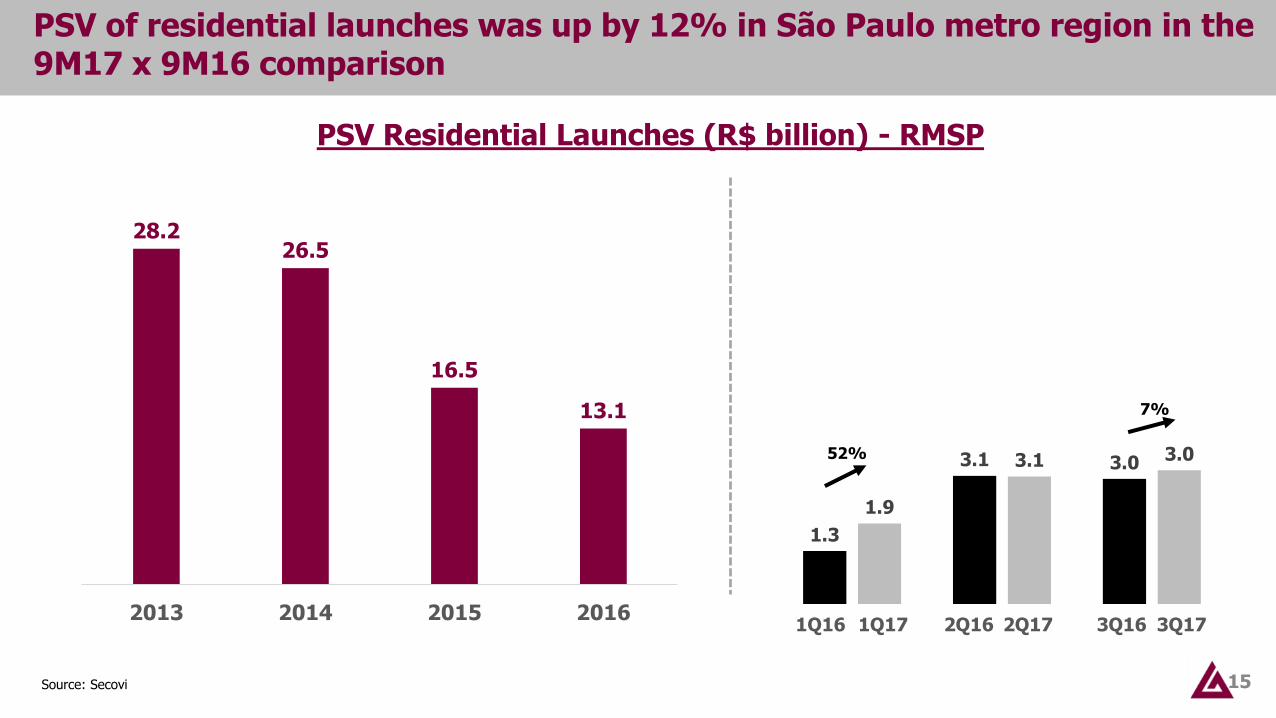
PSV of residential launches was up by 12% in São Paulo metro region in the 9M17 x 9M16 comparison
15
28.226.5
16.5
13.1
2013 2014 2015 2016
PSV Residential Launches (R$ billion) - RMSP
1.3
3.1 3.0
1.9
3.1 3.052%
7%
1Q16 1Q17 2Q16 2Q17 3Q16 3Q17
Source: Secovi
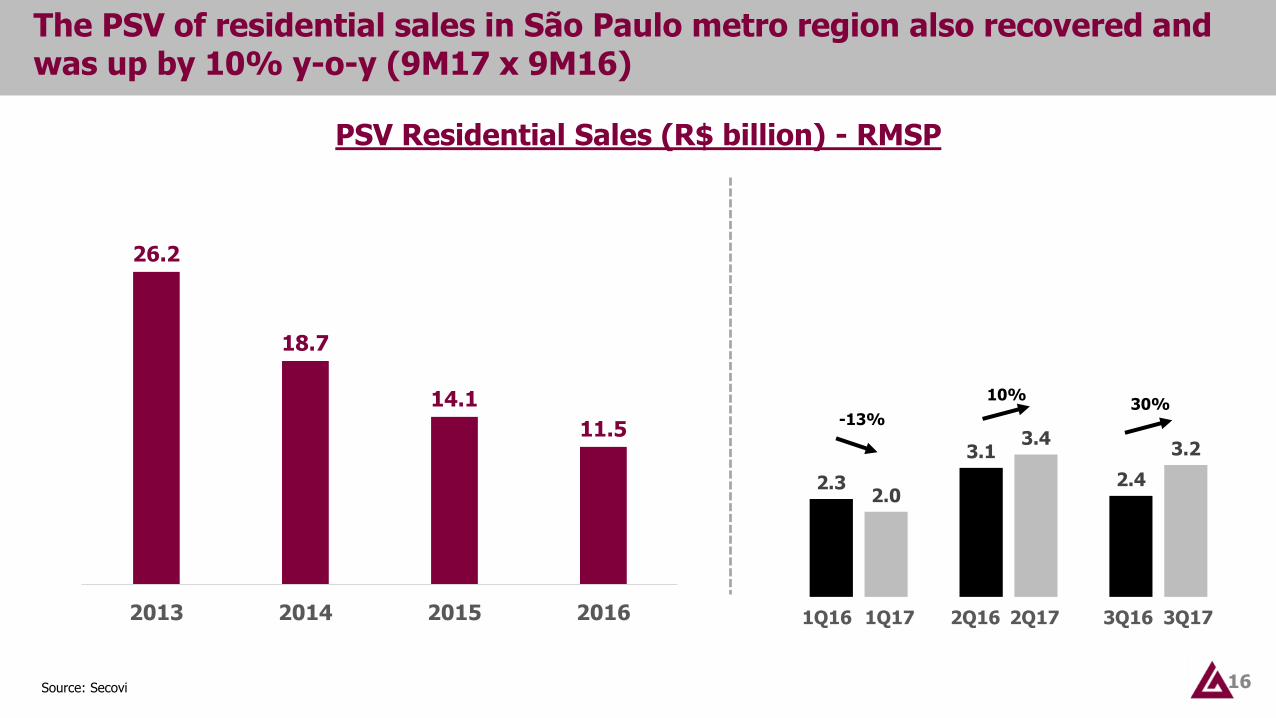
The PSV of residential sales in São Paulo metro region also recovered and was up by 10% y-o-y (9M17 x 9M16)
16
PSV Residential Sales (R$ billion) - RMSP
26.2
18.7
14.1
11.5
2013 2014 2015 2016
2.3
3.1
2.42.0
3.43.2
-13%
10%30%
Source: Secovi
1Q16 1Q17 2Q16 2Q17 3Q16 3Q17

17
jul/1020,047
mai/1545,331
dez/1635,857
set/1728,844
0
10.000
20.000
30.000
40.000
50.000
jan/10 mai/10 set/10 jan/11 mai/11 set/11 jan/12 mai/12 set/12 jan/13 mai/13 set/13 jan/14 mai/14 set/14 jan/15 mai/15 set/15 jan/16 mai/16 set/16 jan/17 mai/17 set/17
Residential inventory presented a downward trend, with a reduction of launches in the last years and sales recovery (RMSP)
-20%
Inventory (Units) - RMSP
Source: Secovi

OperationalPerformance
4
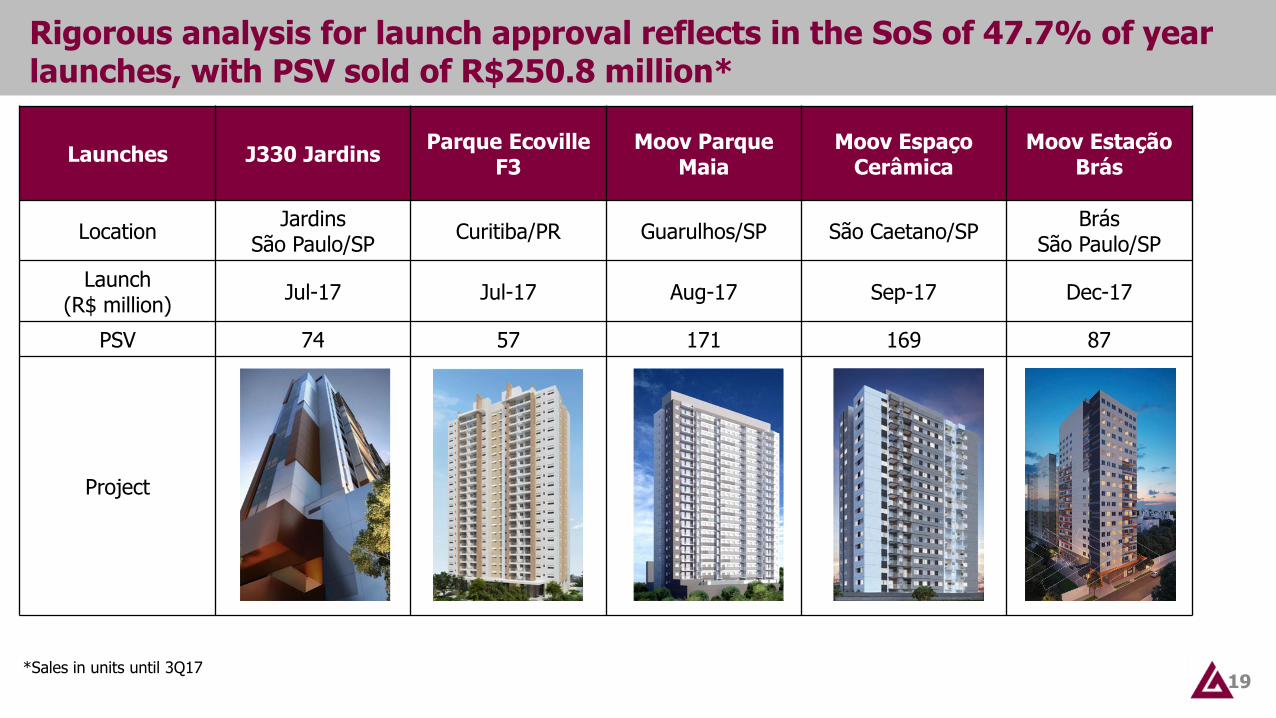
Rigorous analysis for launch approval reflects in the SoS of 47.7% of year launches, with PSV sold of R$250.8 million*
19
Launches J330 JardinsParque Ecoville
F3Moov Parque
MaiaMoov Espaço
CerâmicaMoov Estação
Brás
LocationJardins
São Paulo/SPCuritiba/PR Guarulhos/SP São Caetano/SP
BrásSão Paulo/SP
Launch (R$ million)
Jul-17 Jul-17 Aug-17 Sep-17 Dec-17
PSV 74 57 171 169 87
Project
*Sales in units until 3Q17

27.9 27.7%29.6%
31.1%
28.9%
26.5% 26.1%
31.5%
34.5%
36.8%37.6%
Focus in sales of inventory in 1H17, with most of the launches in the 3Q17. PSV at the same levels as in 2013.
20
180
242 248 245
67
130
258
356
117 127
354
1T15 2T15 3T15 4T15 1T16 2T16 3T16 4T16 1T17 2T17 3T17
8.0%10.5% 11.0% 10.8%
3.3%6.3%
11.5%
16.8%
6.7%7.9%
18.3%
Net Sales (R$MM) and PSV Net Sales Breakdown 9M17
62.4%
37.6%
Net Sales Quarterly PSV PSV 12M
Inventory
Launches
R$598 MM
1Q15 2Q15 2Q171Q174Q163Q162Q161Q164Q153Q15 3Q17
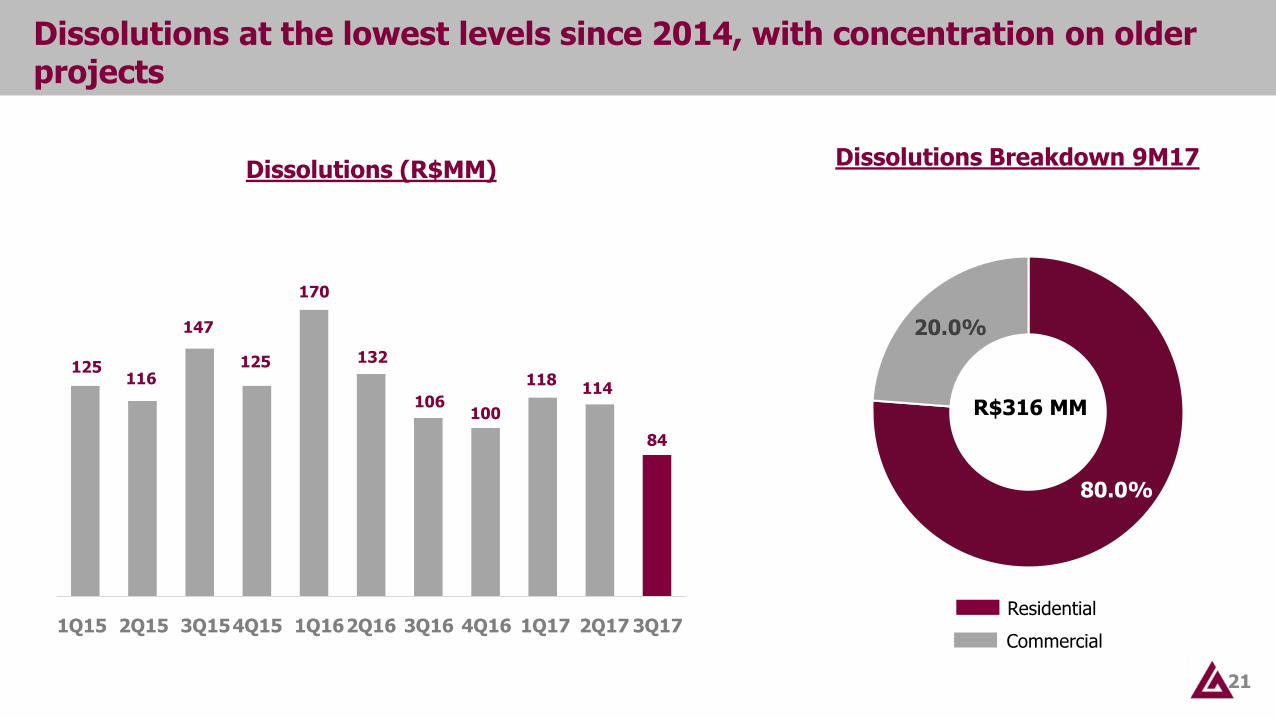
Dissolutions at the lowest levels since 2014, with concentration on older projects
21
125116
147
125
170
132
106100
118114
84
1T15 2T15 3T15 4T15 1T16 2T16 3T16 4T16 1T17 2T17 3T17
Dissolutions (R$MM)Dissolutions Breakdown 9M17
R$316 MM
80.0%
20.0%
Residential
Commercial1Q15 2Q15 2Q171Q174Q163Q162Q161Q164Q153Q15 3Q17
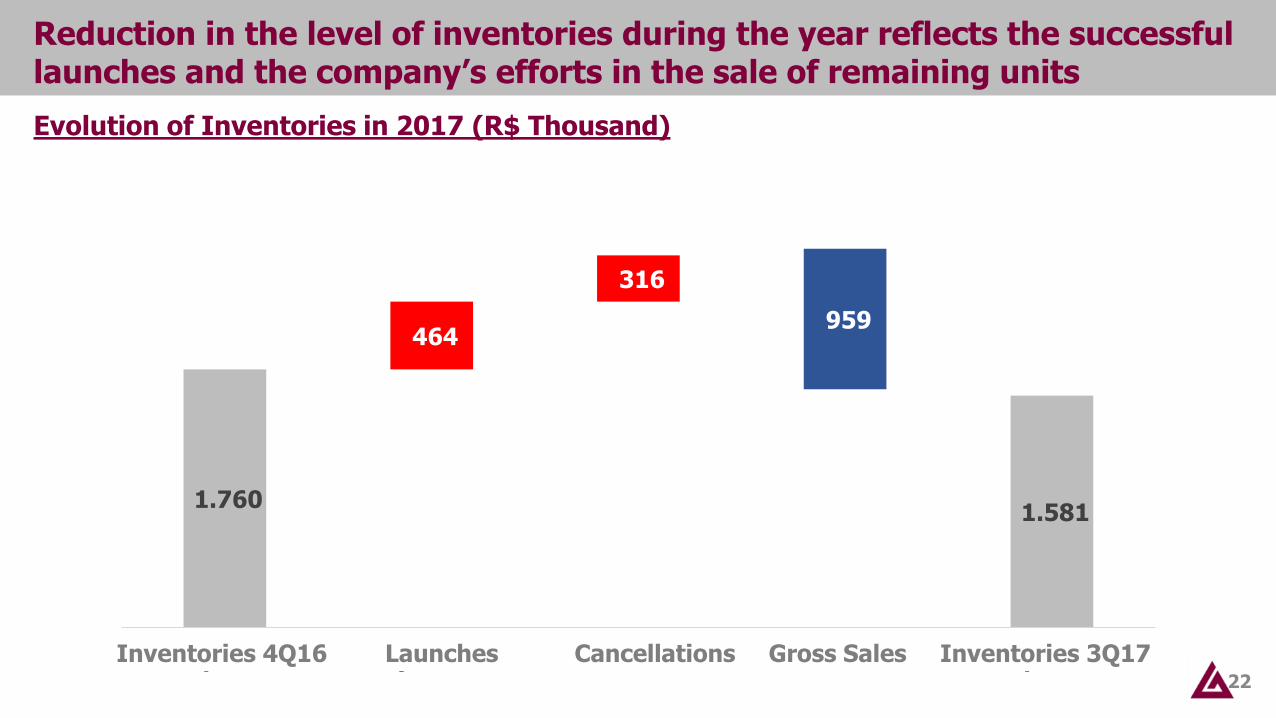
Reduction in the level of inventories during the year reflects the successful launches and the company’s efforts in the sale of remaining units
22
Evolution of Inventories in 2017 (R$ Thousand)
1.760 1.581
464
316
959
Estoque 4T16 Lançamentos Distratos Vendas Brutas Estoques 3T17Inventories 4Q16 Launches Cancellations Gross Sales Inventories 3Q17

Despite the high level, the residential inventory is performing well. Commercial still presents low SoS.
23
Inventory Breakdown (R$ thousand) – Region and Category
1,103
97 77 134 170
-
São Paulo Rio de Janeiro Outros Mercados
Residencial Comercial*
*97% of commercial inventory is comprised of concluded projects
Inventory by work status (PSV)
32%
68%
Concluído Em obras/Não iniciado
Concluded Inventory by Category (PSV)
42%
58%
Residencial Comercial
Comercial Invetory by Geography (PSV)
44%
56%
São Paulo Rio de Janeiro
R$1,581 MM R$507 MM R$304 MM
*Inventory concentrated in 1 project (SAO)** Inventory concentrated on two projects (Americas and
Target)
Total Inventory - R$1.581 MM
Other
Residential Commercial*
Finished Not Finished Residential Commercial*
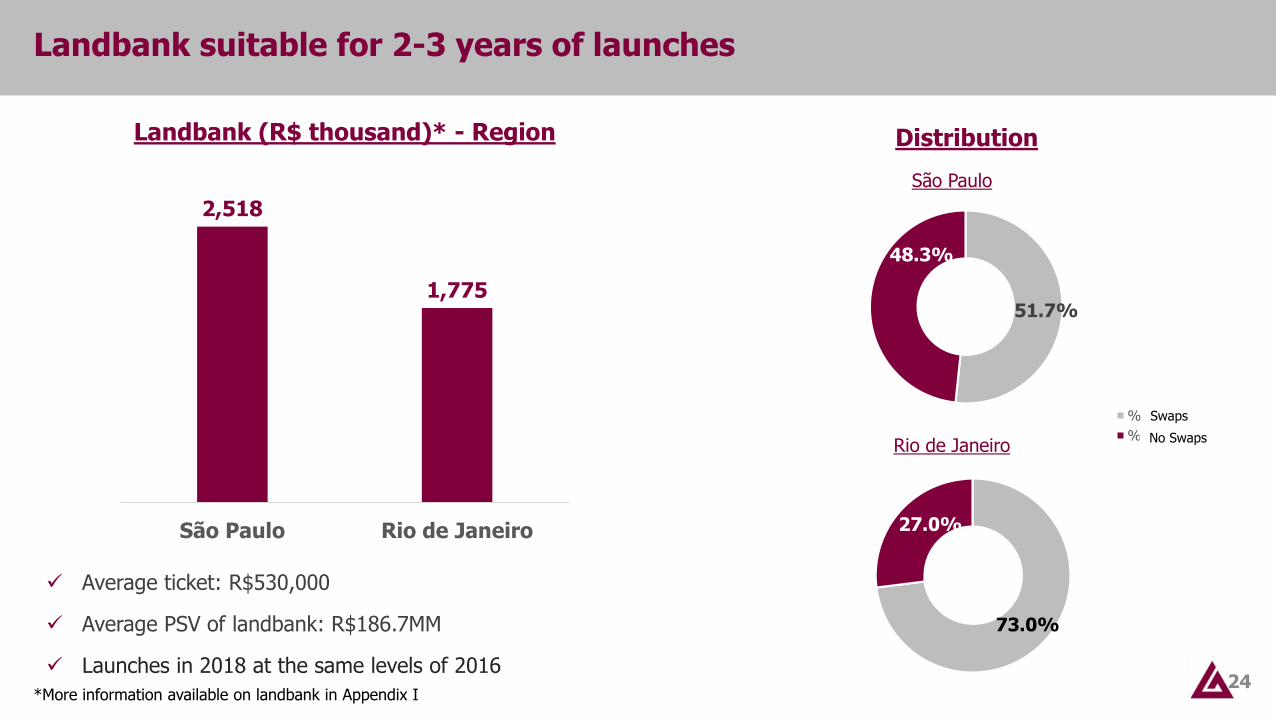
Landbank suitable for 2-3 years of launches
24
Landbank (R$ thousand)* - Region Distribution
São Paulo
Rio de Janeiro
2,518
1,775
São Paulo Rio de Janeiro
51.7%
48.3%
% Permuta
% Sem Permuta
73.0%
27.0%
*More information available on landbank in Appendix I
✓ Average ticket: R$530,000
✓ Average PSV of landbank: R$186.7MM
✓ Launches in 2018 at the same levels of 2016
Swaps
No Swaps
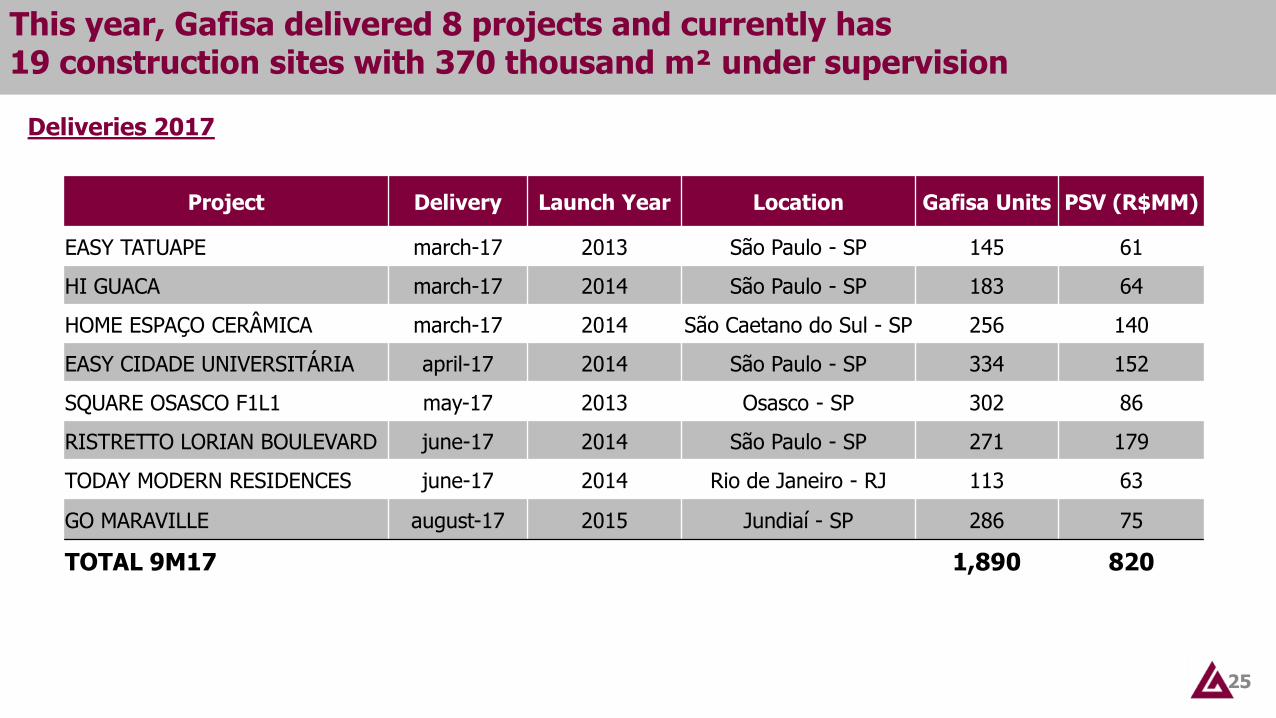
This year, Gafisa delivered 8 projects and currently has 19 construction sites with 370 thousand m² under supervision
25
Deliveries 2017
Project Delivery Launch Year Location Gafisa Units PSV (R$MM)
EASY TATUAPE march-17 2013 São Paulo - SP 145 61
HI GUACA march-17 2014 São Paulo - SP 183 64
HOME ESPAÇO CERÂMICA march-17 2014 São Caetano do Sul - SP 256 140
EASY CIDADE UNIVERSITÁRIA april-17 2014 São Paulo - SP 334 152
SQUARE OSASCO F1L1 may-17 2013 Osasco - SP 302 86
RISTRETTO LORIAN BOULEVARD june-17 2014 São Paulo - SP 271 179
TODAY MODERN RESIDENCES june-17 2014 Rio de Janeiro - RJ 113 63
GO MARAVILLE august-17 2015 Jundiaí - SP 286 75
TOTAL 9M17 1,890 820

Financial Performance
5
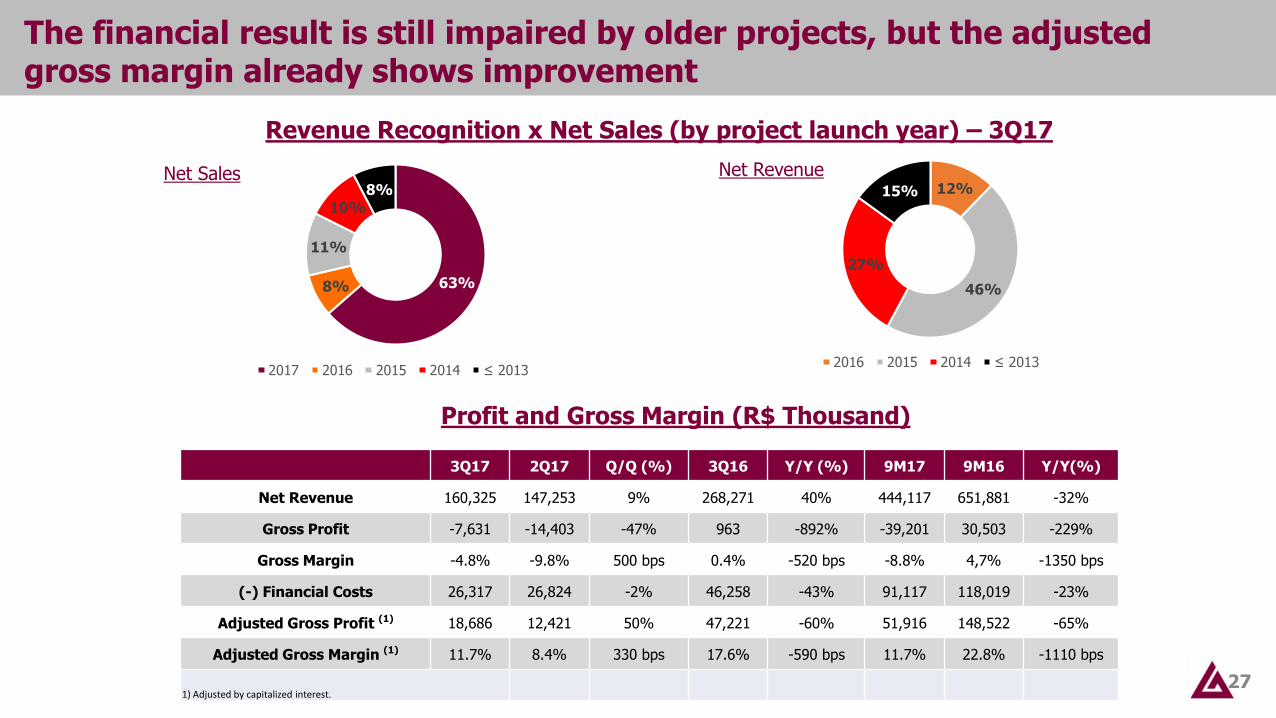
The financial result is still impaired by older projects, but the adjusted gross margin already shows improvement
27
Revenue Recognition x Net Sales (by project launch year) – 3Q17
Profit and Gross Margin (R$ Thousand)
3Q17 2Q17 Q/Q (%) 3Q16 Y/Y (%) 9M17 9M16 Y/Y(%)
Net Revenue 160,325 147,253 9% 268,271 40% 444,117 651,881 -32%
Gross Profit -7,631 -14,403 -47% 963 -892% -39,201 30,503 -229%
Gross Margin -4.8% -9.8% 500 bps 0.4% -520 bps -8.8% 4,7% -1350 bps
(-) Financial Costs 26,317 26,824 -2% 46,258 -43% 91,117 118,019 -23%
Adjusted Gross Profit (1) 18,686 12,421 50% 47,221 -60% 51,916 148,522 -65%
Adjusted Gross Margin (1) 11.7% 8.4% 330 bps 17.6% -590 bps 11.7% 22.8% -1110 bps
1) Adjusted by capitalized interest.
12%
46%
27%
15%
2016 2015 2014 ≤ 2013
63%8%
11%
10%
8%
2017 2016 2015 2014 ≤ 2013
Net Sales Net Revenue
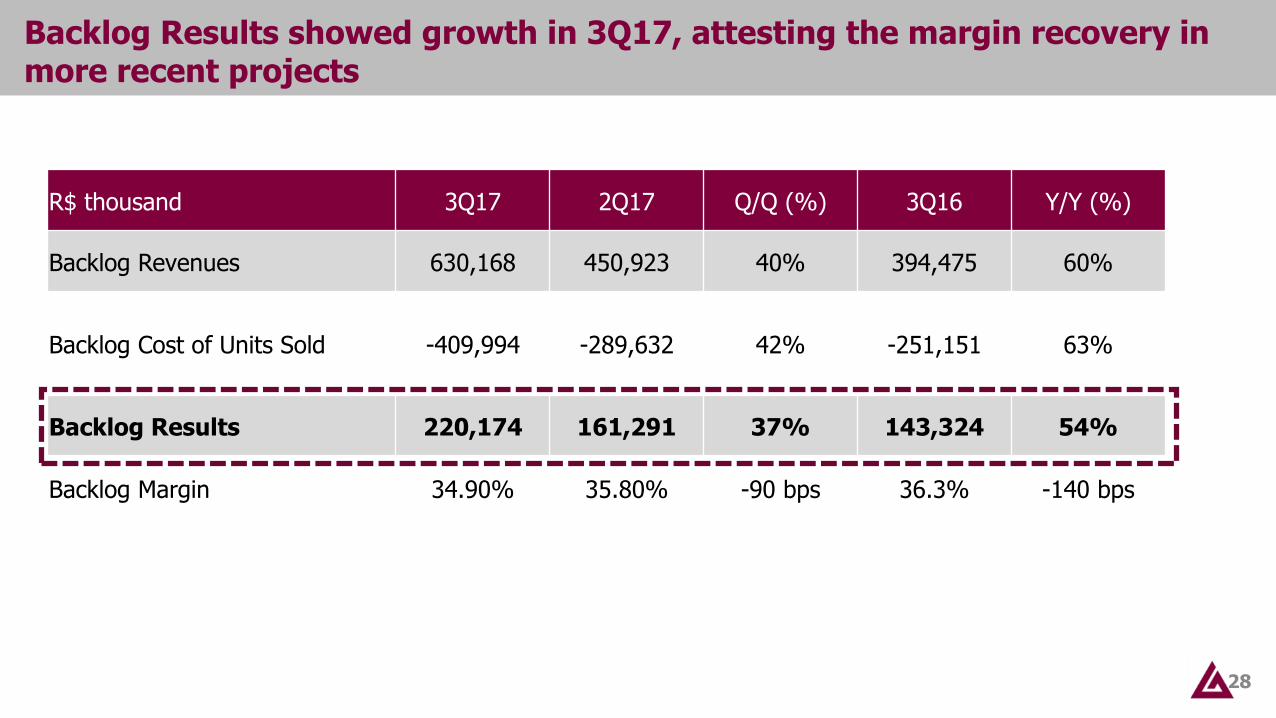
Backlog Results showed growth in 3Q17, attesting the margin recovery in more recent projects
28
R$ thousand 3Q17 2Q17 Q/Q (%) 3Q16 Y/Y (%)
Backlog Revenues 630,168 450,923 40% 394,475 60%
Backlog Cost of Units Sold -409,994 -289,632 42% -251,151 63%
Backlog Results 220,174 161,291 37% 143,324 54%
Backlog Margin 34.90% 35.80% -90 bps 36.3% -140 bps

G&A reduction, with an ongoing search for efficiency gains, is reflected in the Company’s results
29
80
74
69
9M15 9M16 9M17
SG&A Evolution (R$ MM)
8%
7%

Reduction carried out in mainly all SG&A lines
30
3Q16 3Q17 Chg (%) 9M16 9M17 Chg (%)
Salaries and Charges 9,583 7,081 -26% 26.473 25.877 -2%
Benefits to Employees 1,025 704 -31% 3.196 2.480 -22%
Travel and Utilities 107 67 -37% 463 245 -47%
Rent and Condominium Fees 1,759 1,584 -10% 6.158 4.399 -29%
IT 3,832 1,656 -57% 11.668 9.621 -18%
Stock Options 2,317 1,195 -48% 5.506 2.898 -47%
Provision for Profit Sharing 6,250 1,037 -83% 12.500 9.395 -25%
Other 93 204 119% 434 584 35%
Third Party Services* 2,579 7,913 207% 7.672 13.049 70%
TOTAL 27,545 21,441 -22% 74.070 68.548 -7%
*Expense related to Tenda’s Spin Off

Tenda’s capital reduction and payment of the FGTS debentures in 4Q17
31
✓ During 4Q17, we paid the FGTS debentures in the amount of R$158 million using the funds received from the payment related to Tenda’s capital reduction
✓ Cost of debt at the end of 3Q17 was 13.23% per year
✓ In 3Q17, leverage (Net Debt/Shareholder’s Equity) was 87.1%. Disregarding Project Financing, it was 12.7%
Gross Debt Evolution (R$ MM)
1,907
1,6921,589
1,3271,219
2015 2016 1T17 2T17 3T17
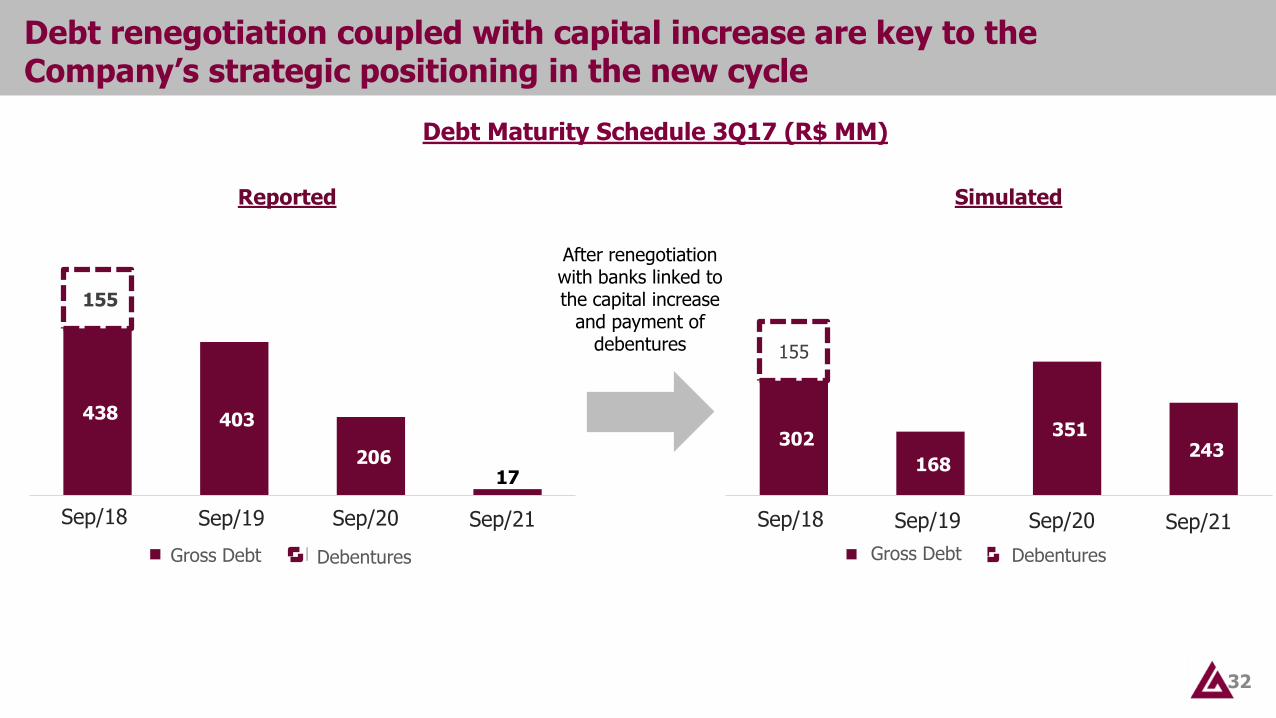
Debt renegotiation coupled with capital increase are key to the Company’s strategic positioning in the new cycle
32
Debt Maturity Schedule 3Q17 (R$ MM)
Reported Simulated
After renegotiation with banks linked to the capital increase
and payment of debentures
438 403
206 17
155
Até Set/18 Até Set/19 Até Set/20 Até Set/21
Dívida Bruta Debêntures - FGTS
302
168
351 243
155
Até Set/18 Até Set/19 Até Set/20 Até Set/21
Dívida Bruta Debêntures - FGTS
Sep/18 Sep/19 Sep/20 Sep/21 Sep/18 Sep/19 Sep/20 Sep/21
Gross Debt Debentures Gross Debt Debentures

Appendix
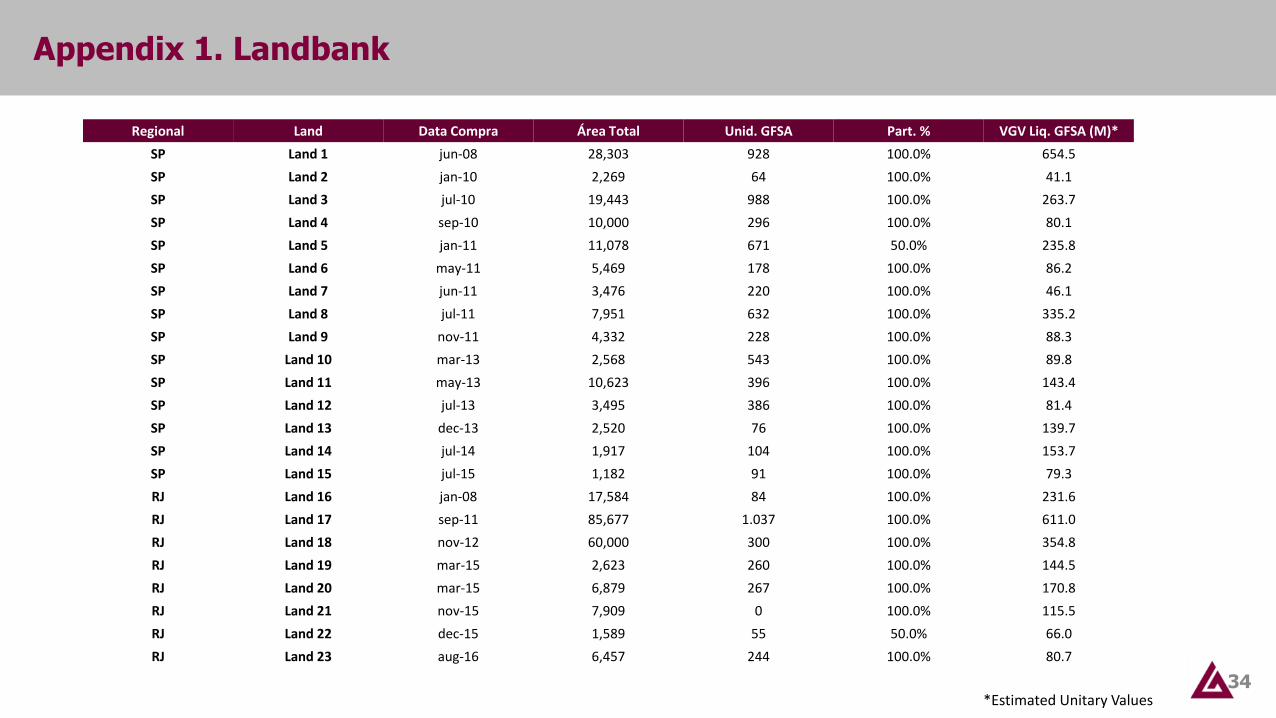
Appendix 1. Landbank
34
Regional Land Data Compra Área Total Unid. GFSA Part. % VGV Liq. GFSA (M)*
SP Land 1 jun-08 28,303 928 100.0% 654.5
SP Land 2 jan-10 2,269 64 100.0% 41.1
SP Land 3 jul-10 19,443 988 100.0% 263.7
SP Land 4 sep-10 10,000 296 100.0% 80.1
SP Land 5 jan-11 11,078 671 50.0% 235.8
SP Land 6 may-11 5,469 178 100.0% 86.2
SP Land 7 jun-11 3,476 220 100.0% 46.1
SP Land 8 jul-11 7,951 632 100.0% 335.2
SP Land 9 nov-11 4,332 228 100.0% 88.3
SP Land 10 mar-13 2,568 543 100.0% 89.8
SP Land 11 may-13 10,623 396 100.0% 143.4
SP Land 12 jul-13 3,495 386 100.0% 81.4
SP Land 13 dec-13 2,520 76 100.0% 139.7
SP Land 14 jul-14 1,917 104 100.0% 153.7
SP Land 15 jul-15 1,182 91 100.0% 79.3
RJ Land 16 jan-08 17,584 84 100.0% 231.6
RJ Land 17 sep-11 85,677 1.037 100.0% 611.0
RJ Land 18 nov-12 60,000 300 100.0% 354.8
RJ Land 19 mar-15 2,623 260 100.0% 144.5
RJ Land 20 mar-15 6,879 267 100.0% 170.8
RJ Land 21 nov-15 7,909 0 100.0% 115.5
RJ Land 22 dec-15 1,589 55 50.0% 66.0
RJ Land 23 aug-16 6,457 244 100.0% 80.7
*Estimated Unitary Values