the state ownership report 2015 - equinor.com · the contact details of the ministries that manage...
TRANSCRIPT

THE STATE OWNERSHIP REPORT 2015

Contents
Cover photo: © Johan Wildhagen. The photo is provided by Norges sjømatråd AS.
The Minister’s introduction 3Scope and key figures 5Central matters for the state as owner 9Return and financial values 13Key figures describing financial performance 19Corporate governance 25Raising the standard for efficient and transparent state ownership 36
Category 1 – Commercial objectivesAmbita AS 42Baneservice AS 43Entra ASA 44Flytoget AS 45Mesta AS 46SAS AB 47Veterinærmedisinsk Oppdragssenter AS 48
Category 2 – Commercial objectives and objective of maintaining head office functions in NorwayAker Kværner Holding AS 52DNB ASA 53Kongsberg Gruppen ASA 54Nammo AS 55Norsk Hydro ASA 56Statoil ASA 57Telenor ASA 58Yara International ASA 59
Category 3 – Commercial and other specifically defined objectivesAerospace Industrial Maintenance Norway SF 62Argentum Fondsinvesteringer AS 63Eksportfinans ASA 64Electronic Chart Centre AS 65GIEK Kredittforsikring AS 66Investinor AS 67Kommunalbanken AS 68NSB AS 69Posten Norge AS 70Statkraft AS 71
Category 4 – Sector policy objectivesAndøya Space Center AS 74Avinor AS 75Bjørnøen AS 76Carte Blanche AS 77AS Den Nationale Scene 78Den Norske Opera & Ballett AS 79Eksportkreditt Norge AS 80Enova SF 81Gassco AS 82Gassnova SF 83Graminor AS 84Innovasjon Norge 85Kimen Såvarelaboratoriet AS 86Kings Bay AS 87Nationaltheatret AS 88Nofima AS 89Nordisk Institutt for Odontologiske Materialer AS 90Norfund 91
Norges sjømatråd AS 92Norsk Helsenett SF 93Norsk rikskringkasting AS 94Norsk Tipping AS 95NSD – Norsk senter for forskningsdata AS 96Nye Veier AS 97Petoro AS 98Rogaland Teater AS 99Simula Research Laboratory AS 100Siva – Selskapet for Industrivekst SF 101Space Norway AS 102Statnett SF 103Statskog SF 104Staur Gård AS 105Store Norske Spitsbergen Kulkompani AS 106Talent Norge AS 107Trøndelag Teater AS 108UNINETT AS 109Universitetssenteret på Svalbard AS 110AS Vinmonopolet 111
Regional health authoritiesHelse Midt-Norge RHF 114Helse Nord RHF 115Helse Sør-Øst RHF 116Helse Vest RHF 117
Other companies 118Owner-appointed / shareholder-elected board members at 31 March 2016 120Contact details 124Comments and definitions 125

3
Monica MælandMinister of Trade and Industry
© H
ans Jørgen Brun
The Minister’s introduction
Eleven ministries manage the state’s di-rect ownership in 70 companies. In the 2015 State Ownership Report, the Minis-try of Trade, Industry and Fisheries pro-vides an overview and presentation of all the companies in which the state has an ownership interest, with emphasis on the companies’ development last year. Trans-parency regarding the state’s exercise of its ownership and the companies’ opera-tions is a fundamental pillar of state own-ership. This year we have included a chap-ter on the state’s corporate governance, in part to provide more detailed insight into how the state as an owner exercises its ownership in practice.
The overarching goal of state owner-ship is value creation. The objective for companies in which the state’s ownership has commercial objectives is to achieve the highest possible return on invested capital over time. For companies where the state’s ownership has primarily secto-ral policy objectives, the ambition is that these defined objectives are achieved as efficiently as possible.
The value of the state’s assets in its com-mercial shareholdings was estimated to NOK 644 billion at year-end 2015, down NOK 16.7 billion from the previous year. Much of the decline is due to the fact that the state is heavily invested in industries that had a challenging year. Mainland GDP growth was 1.0% in 2015, which is the low-est rate since the financial crisis in 2009. Much of the decline is linked to the signifi-cant drop in demand from the oil industry.
Lower demand from the petroleum sector implies that the Norwegian econo-my is facing a challenging restructuring process. However, Norway is in a strong position with high employment, relatively low unemployment and a highly educated population that is accustomed to thinking outside the box and embracing the oppor-tunities that change can afford. Several of the companies with state ownership have demonstrated a great ability to adapt their business in line with developments in so-ciety. It is perhaps more important now than ever that the companies develop skills and improve operations, in order to play a construtive part in the restructur-ing of the Norwegian economy so that to-tal value creation increases.
As an owner, the state constantly strives to contribute to the companies’ value crea-tion by managing its ownership construc-
tively. The state’s ownership policy is speci-fied in the white paper Report no. 27 to the Storting (2013–2014) Diverse and value-creating ownership, including the state’s principles for good corporate governance and the state’s expectations of the compa-nies. The state’s ownership is excercised to enhance value creation by promoting ap-propriate board composition, good corpo-rate governance, an effective capital struc-ture and suitable dividends, that sustaina-bility and corporate social responsibility are integrated into the business, and trans-parency and good reporting.
The state’s conduct as an owner has great importance for the public’s, inves-tors’ and other stakeholders’ confidence in the Norwegian companies with state own-ership and the Norwegian capital market. State ownership shall be exercised profes-sionally and predictably within the frame-work of corporate law and shall be based on generally accepted principles of corpo-rate governance. Consequentially, the state must respect the division of roles between the owner, the board and the management. It is an important principle that state own-ership shall not imply advantages nor dis-advantages for companies.
The board of directors and the CEO are responsible for the management of the company. Perhaps the state’s most impor-tant task as an owner is to promote good and competent boards that exercise their influence in the best interest of companies and owners. The state as an owner sets clear expectations to the board through the white paper on ownership policy. These ex-pectations are followed up in our regular ownership dialogue with the companies.
Over the past year there have been sev-eral cases concerning companies with state ownership with regards to their work on corporate social responsibility, corporate governance and compliance with laws, regulations and their own guidelines. As an owner the state empha-size that companies with state ownership strive for good corporate governance and work systematically and strategically with corporate social responsibility issues. Managing such matters well helps protect the state’s shareholder value and can con-tribute to ethically correct coduct.
The unfortunate issues that have been reported during 2015 and 2016 date back a few years and have been of varying na-tures. These incidents have nevertheless
raised questions about the state’s man-agement of its ownership interests. In my opinion, these cases do not provide a ba-sis for amending the fundamental frame-work for the state’s exercise of its owner-ship. The principles of a clear division of roles, both between the state’s various roles and between the owners, the board and the management should be upheld. Also challenging issues ought to be man-aged within the established framework that now has legitimacy among the com-panies’ stakeholders and which the Stor-ting (Parliament) endorses unanimously. This has been an advantage for Norwe-gian state ownership.
The ownership dialogue is the main tool for following up the state’s expectations in various areas. In its capacity as an owner, the state seeks to ask relevant questions in order understand how the companies man-age corporate governance and corporate social responsibility, both in general and in relevant specific cases. The state wants to ascertain whether the corporate systems and measures are effective, how any devia-tions were able to occur and how lessons learned are incorporated in relevant areas. In addition, there is an ambition for the state to continually raise the standard as a responsible owner including developing and improving the follow-up of the compa-nies. Despite the negative image that has developed over the past year, my impres-sion is that most companies are working systematically and well with designing sys-tems and measures to raise the standard for good corporate governance and im-prove the work on corporate social respon-sibility.
I hope you will find this report informa-tive and useful.

4
Kongsberg Gruppen is an international, knowledge-based group that delivers high-technology systems and solutions to customers in the offshore industry, the oil and gas industry, merchant fleet and defence and space.
5
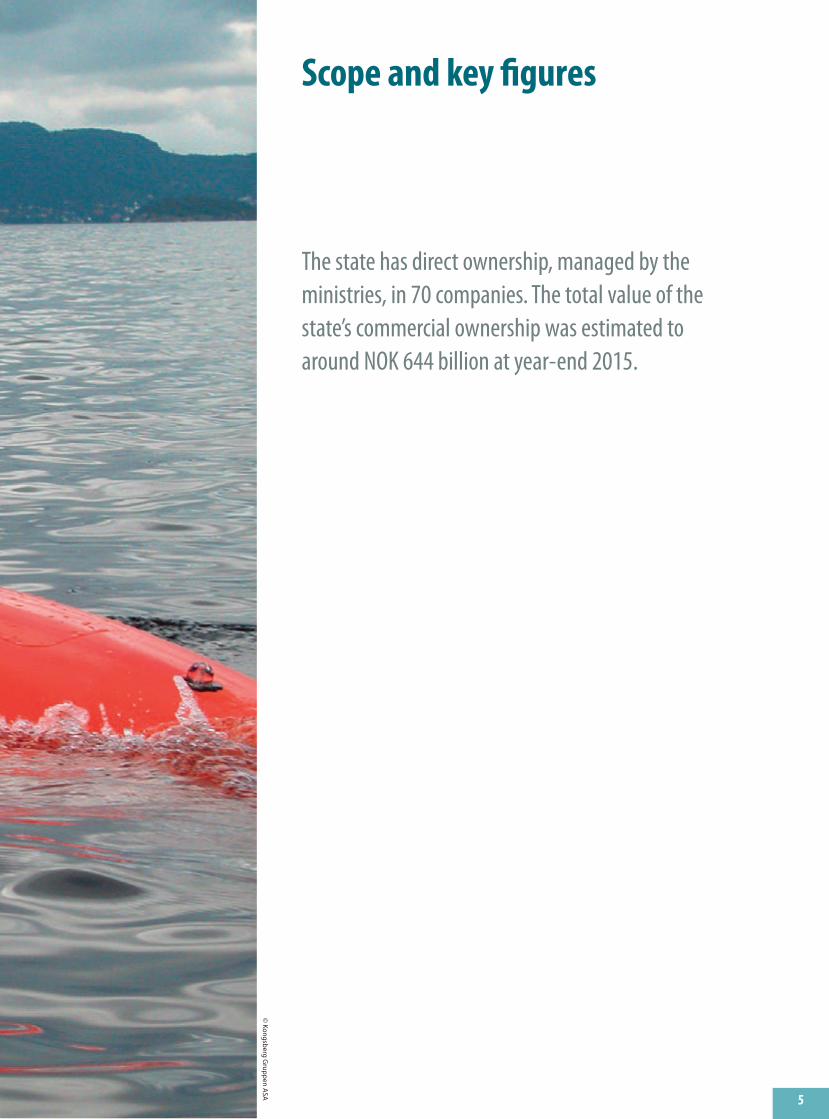
Scope and key figures
The state has direct ownership, managed by the ministries, in 70 companies. The total value of the state’s commercial ownership was estimated to around NOK 644 billion at year-end 2015.
© Kongsberg G
ruppen ASA

6
Ministry of FinanceFolketrygdfondet (special-legislation company) 100 % Not categorised
Ministry of Defence Aerospace Industrial Maintenance Norway SF 100 % 3
Ministry of Health and Care Services Helse Midt-Norge RHF 100 % 4Helse Nord RHF 100 % 4Helse Sør-Øst RHF 100 % 4Helse Vest RHF 100 % 4Nordisk Institutt for Odontologiske Materialer AS1 49 % 4Norsk Helsenett SF 100 % 4AS Vinmonopolet (special-legislation company) 100 % 4
Ministry of Local Government and Modernisation Kommunalbanken AS 100 % 3
Ministry of Culture Carte Blanche AS 70 % 4AS Den Nationale Scene 66.67 % 4Den Norske Opera & Ballett AS 100 % 4Filmparken AS 77.6 % 4Nationaltheatret AS 100 % 4Norsk rikskringkasting AS 100 % 4Norsk Tipping AS (special-legislation company) 100 % 4Rogaland Teater AS 66.67 % 4Rosenkrantzgate 10 AS 3.07 % Not categorisedTalent Norge AS 33.33 % 4Trøndelag Teater AS 66.67 % 4
Ministry of Education and Research NSD – Norsk senter for forskningsdata AS 100 % 4Simula Research Laboratory AS 100 % 4UNINETT AS 100 % 4Universitetssenteret på Svalbard AS 100 % 4
Ministry of Agriculture and Food Graminor AS2 28.2 % 4Kimen Såvarelaboratoriet AS2 51 % 4Statskog SF 100 % 4Staur gård AS2 100 % 4
1 The Ministry of Health and Care Services is intending to inform the Storting about the categorisation of this company in Proposition no. 1 to the Storting (2016–2017).
2 The Ministry of Agriculture and Food is intending to inform the Storting about the categorisation of this company in Proposition no. 1 to the Storting (2016–2017).
The Ministry of Trade, Industry and Fisheries Ambita AS 100 % 1Aker Kværner Holding AS 30 % 2Andøya Space Center AS 90 % 4Argentum Fondsinvesteringer AS 100 % 3Baneservice AS 100 % 1Bjørnøen AS 100 % 4DNB ASA 34 % 2Eksportfinans ASA 15 % 3Eksportkreditt Norge AS 100 % 4Electronic Chart Centre AS 100 % 3Entra ASA 49.73 % 1Flytoget AS 100 % 1GIEK Kredittforsikring AS 100 % 3Innovasjon Norge (special-legislation company) 51 % 4Investinor AS 100 % 3Kings Bay AS 100 % 4Kongsberg Gruppen ASA 50.001 % 2Mesta AS 100 % 1Nammo AS 50 % 2Nofima AS 56.84 % 4Norges sjømatråd AS 100 % 4Norsk Hydro ASA 34.26 % 2SAS AB 14.29 % 1Siva – Selskapet for Industrivekst SF 100 % 4Space Norway AS 100 % 4Statkraft SF 100 % 3Store Norske Spitsbergen Kulkompani AS 100 % 4Telenor ASA 53.97 % 2Veterinærmedisinsk Oppdragssenter AS 34 % 1Yara International ASA 36.21 % 2
Ministry of Petroleum and Energy Enova SF 100 % 4Gassco AS 100 % 4Gassnova SF 100 % 4Petoro AS 100 % 4Statnett SF 100 % 4Statoil ASA 67 % 2
Ministry of Transport and Communications Avinor AS 100 % 4NSB AS 100 % 3Nye Veier AS 100 % 4Posten Norge AS 100 % 3
Ministry of Foreign Affairs Norfund (special-legislation company) 100 % 4
The state’s direct ownershipThe state’s direct ownership includes companies in which the state’s ownership interest is managed directly by the minis-tries. The table below contains a list of the 70 companies, distributed according to the ministry that manages the state’s own-ership interests. All the companies are presented in the 2015 State Ownership Re-port, and figures are reported for 67 com-panies.
The Ministry of Trade, Industry and Fisheries has the largest portfolio and manages the state’s ownership interests in 30 companies. The Ministry of Culture manages the state’s ownership interests in eleven companies, the Ministry of Health and Care Services in seven, and the Ministry of Petroleum and Energy in six companies. The Ministry of Education and Research, the Ministry of Agriculture and Food and the Ministry of Transport
and Communications each manage the state’s ownership interests in four compa-nies. The Ministry of Finance, the Minis-try of Defence, the Ministry of Local Gov-ernment and Modernisation and the Min-istry of Foreign Affairs each manage the state’s ownership interest in one compa-ny. The contact details of the ministries that manage the state’s ownership inter-ests in companies are provided on page 124.
Overview of the state’s direct ownership by ministryMinistry Shareholding Category Ministry Shareholding Category

7
Diagram 2: Number of employees at state-owned companies at year-end 2015, in total 280 2295
Diagram 1: Share of the value of the state’s shareholding on Oslo Stock Exchange at year-end 2015, in total NOK 523 billion4
3 The figures are defined on page 125.
4 Does not include the value of underlying listed companies in Aker Kværner Holding.
5 Does not include employees in underlying companies in Aker Kværner Holding.
Antall ansatte i selskaper med statlig eierandel, totalt 280 233
Other companies 24.0 %
Helse Sør-Øst RHA
21.3 %
Telenor 12.5 %
Statoil 7.7 %
Helse Vest RHA 7.6 %
Posten Norge 7.1 %
Helse Nord RHA 4.8 %
Norsk Hydro 4.7 %
Yara International
4.6 %
Helse Midt-Norge RHA 5.7 %
Andel av verdiene av statens eierandel på Oslo Børs ved utgangen av 2015, totalt 523,2 mrd. kroner
Statoil 50.5 %
Telenor 23.0 %
DNB 11.6 %
Yara 7.3 %
Norsk Hydro 4.5 %
Kongsberg Gruppen
1.7 %
Entra 1.2 % SAS
0.2 %
Categorisation of the companies The companies is divided into four catego-ries depending on the objective of the state’s ownership:
1. Commercial objectives2. Commercial objectives and objective of maintaining head office functions in Norway3. Commercial objectives and other spe- cifically defined objectives4. Sectoral policy objectives
The main purpose of the state’s com-mercial ownership (the companies in cate-gories 1–3) is to achieve the highest possi-ble return on invested capital over time. For companies in category 2, the state has added an objective of maintaining the com-pany’s head office and associated head of-fice functions in Norway. For companies in category 3, the state has commercial objec-tives and other societal reasons for state ownership than maintaining the head office in Norway. One example of this kind of spe-cific objective is to contribute to the profit-able and responsible management of Nor-wegian natural resources (Statkraft). The objective of state ownership in each com-pany is specified in the white paper Report
no. 27 to the Storting (2013–2014) Diverse and value-creating ownership. There are 25 companies in categories 1–3. In connection with Proposition no. 52 to the Storting (2015–2016), Store Norske Spitsbergen Kul- kompani was moved from category 3 to category 4 in the spring of 2016.
The ownership interests in 20 out of the 25 companies in which the state’s ownership has commercial objectives are managed by the Ownership Department of the Ministry of Trade, Industry and Fisheries. The state’s ownership interests in other companies in which the state’s ownership has commercial objectives is managed by the Ministry of Defence (Aerospace Industrial Maintenance Norway), the Ministry of Local Government and Modernisation (Kommunalbanken), the Ministry of Petroleum and Energy (Stat-oil) and the Ministry of Transport and Com-munications (NSB and Posten).
State ownership in the companies in cat-egory 4 generally have sectoral policy objec-tives. The state’s ownership interests in these companies are usually managed by the ministries that are responsible for secto-ral policy in the relevant area. An example of sectoral policy objectives that are achieved through state ownership is control of the sale of alcoholic beverages (Vinmonopolet).
As the owner, it is important to the state that the sectoral policy objectives are achieved as efficiently as possible. The companies’ de-gree of commercial orientation varies. For example, the broadcasting company Norsk rikskringkasting operates in a competitive market, while Vinmonopolet has exclusive rights to retail sale of alcoholic beverages exceeding 4.7% alcohol by volume.
Main figuresThe table below summarises a number of key figures for the companies. The figures are defined on page 125. Figures for previ-ous years are available atwww.eierberetningen.no.
At year-end 2015 the value of the state’s direct ownership of shares listed on the Oslo Stock Exchange (Oslo Børs) was NOK 523 billion, down from NOK 543 billion in 2014. Statoil accounts for 50.5% of this value. Tel-enor and DNB come next, with 23% and 11.6% respectively (see diagram 1). The com-panies employed 280,229 people in 2015, in-cluding employees who work abroad. The regional health authorities alone account for 110,403 people or 39.4% of the employees. The Helse Sør-Øst RHF has most employ-ees, followed by Telenor and Statoil (see dia-gram 2).
Key figures 20153
NOK millions Listed companies Unlisted companies in categories 1–3 Companies in category 4 Total
Value of the state’s shareholding 523 224 120 959 – 644 183Weighted return in 2015 1.3 % – – –Profit for the year after tax and minority interests 5 078 1 124 11 037 17 239Weighted return on equity -1.6 % 3.4 % – –Dividend to the state 26 669 2 084 1 144 29 898The state’s sales proceeds 127 – – 127Capital contributions / share purchases – -1 000 -1 480 -2 480

8
Norsk Tipping has the exclusive right to offer a range of money games in Norway. The company shall operate gambling in a socially acceptable form under public control, aimed at preventing negative consequences of gambling activities.

9
Central matters for the state as owner
This chapter presents matters of a special character or particular significance that the state as an owner has dealt with in 2015 and up until 31 March 2016. These will typically be capital contributions, purchases and sales of shares, relevant white papers, changes in the sectoral policy guidelines for the companies, etc.
©
Norsk Tipping A
S

10
January–March 2015Talent Norge AS was established with three owners in January 2015: the state, represented by the Ministry of Culture, Sparebankstiftelsen DNB and Cultiva – Kristiansand Kommunes Energiverksstif-telse. Talent Norge was established to pro-mote greater dispersion of power in and broader financing of arts and culture and to foster a professional cultural sector of an international standard. The aim is to help more talents advance within their field than the current structure allows and to strengthen public–private partnerships. During the course of 2015 Talent Norge initiated eleven talent development pro-grammes in all genres and secured NOK 51.7 million in private co-financing.
As a follow-up to the 2014 evaluation of the Norwegian Seafood Council, the Minis-try of Trade, Industry and Fisheries sub-mitted a proposal for amendments to the Regulations relating to the export of fish and fish products (the Fish Export Regula-tions) and the Regulations relating to coor-dinated collection of taxes on fish exports for consultation in February 2015. On 17 April, in part on the basis of the comments and feedback from the bodies consulted, the Ministry of Trade, Industry and Fisher-ies amended Regulation no. 157 of 22 March 1991 relating to export of fish and fish products. The amendments pertained to the composition of the board and the process for board elections in the company to streamline them with the Norwegian state’s principles for good corporate gov-ernance (cf. the white paper Report no. 27 to the Storting (2013–2014) Diverse and value-creating ownership). In part on the basis of the consultation process, the gov-ernment decided to reduce the tax from 0.75% to 0.6% for salmon and trout and pe-lagic fish. The amendments entered into force on 1 January 2016. The purpose of lowering the tax rate is to reduce the Nor-wegian Seafood Council’s revenues, which increase as seafood exports appreciate.
April–June 2015The Ministry of Transport and Communi-cations presented the new Postal Services Act to the Storting in spring 2015 (cf. Proposition no. 109 L (2014–2015) Act re-lating to postal services (Postal Services Act). The Act came into force on 1 January 2016, with the exception of a few individu-al provisions. The new Act represents a change in the regulation of postal services in Norway whereby Posten Norge AS will lose its exclusive right to distribute mail weighing less than 50 grams, thereby opening the market to free competition. Previously the state ensured that every-one in Norway had access to basic mail services through provisions in Posten Norge’s licence. Under the new Act, statu-tory services will be secured through agreements with providers of postal ser-vices. In 2016 the Ministry of Transport
and Communications will enter into an agreement on the distribution of subscrip-tion newspapers on Saturdays. This agree-ment will be awarded on the basis of an open competition.
In May 2015 the Ministry of Trade, In-dustry and Fisheries presented a proposi-tion to the Storting to strengthen the li-quidity of the Store Norske Spitsbergen Kulkompani AS group (SNSK) by NOK 500 million (cf. Proposition no. 118 S (2014–2015) Amendments to the 2015 na-tional budget under the Ministry of Trade, Industry and Fisheries (Store Norske Spitsbergen Kulkompani AS – estates and mining)). The Storting adopted the Minis-try’s proposal on 11 June 2015 (cf. the con-sideration of Recommendation no. 343 S (2014–2015)). The state bought land and infrastructure from the SNSK group for NOK 295 million and provided SNSK with a subordinated loan of NOK 205 million. The funds were intended to help finance minimum operations in the wholly-owned subsidiary Store Norske Spitsbergen Grubekompani AS, which undertakes coal mining activities, in 2015 and 2016. To give the state as an owner greater flexibil-ity in its handling of the further develop-ment of the SNSK group, the state bought out the remaining shareholders of SNSK, who owned 0.06% of the shares.
The Ministry of Transport and Com-munications presented its proposed framework for Nye Veier AS’s operations to the Storting in the white paper Report no. 25 to the Storting (2014–2015) On the right road – Reforms in the road sector. The Storting considered the report on 15 June 2015 (cf. Recommendation no. 362 S (2014–2014)). The white paper provided an overview of the company’s tasks and start-up portfolio, as well as models for fi-nancing and governance. In Proposition no. 1 S (2015–2016) the Ministry of Trans-port and Communications proposed that in 2016 the Ministry would be able to bind the state to future budget commitments and sign contracts with Nye Veier. In Prop-osition no. 1 S, Supplement no. 2 (2015–2016) the Ministry of Transport and Com-munications presented a proposal to in-crease the share capital in Nye Veier in connection with the transition to an oper-ating company on 1 January 2016. The two propositions were treated in Recommen-dation no. 13 S (2015–2016) and the Stort-ing’s decision of 15 December 2015. The capital increase was approved at an ex-traordinary general meeting on 18 De-cember 2015. After recapitalisation, the company had equity of NOK 611 million at the end of 2015.
On 15 June 2015 the Storting author-ised the government to proceed with work on reforming the railway sector (cf. the white paper Report no. 27 to the Storting (2014–2015) On the Right Track. Reform of the railway sector and Recommenda-tion no. 386 S (2014–2015)). The objective
of the railway reform is a railway sector that is more customer oriented and effi-cient. The reform entails: a restructuring of NSB AS where passenger rolling stock, ROM Eiendom AS, Mantena AS and func-tions related to sales and ticketing are moved out of the company in order to cre-ate equal conditions of competition and low barriers of entry in upcoming tenders for passenger rail transport; a gradual tender-ing of passenger rail transport; and the dis-continuation of the Norwegian National Rail Administration and the establishment of a Railway Directorate and a state-owned rail infrastructure company.
In June 2015 the Ministry of Culture presented the white paper Report no. 38 to the Storting (2014–2015) Open and in-formed, on public service broadcasting and media diversification. The white pa-per contains a broad review of Norsk riks-kringkasting (NRK)’s activities, including an assessment of the company’s public service remit and the conditions for com-petition with commercial players. The Storting considered the report on 1 March 2016, and a broad political majority supported the main lines of the govern-ment’s proposal. At the same time a major-ity of the Storting asked the government to propose a new mandate for NRK, meas-ures to ensure that NRK and the licence payers are afforded greater predictability through management signals every four years, and to present proposals for future funding by the end of 2016. In autumn 2015 the government appointed an expert group to examine the various alternatives for public funding of NRK. The group will submit its report on 1 July 2016.
On 19 June 2015 the Ministry of For-eign Affairs presented the white paper Re-port no. 35 to the Storting (2014–2015) Working together – Private sector devel-opment in Norwegian development coop-eration. The white paper, which among others addresses Norfund, looks at how Norwegian aid shall promote private sec-tor investment, job creation and poverty reduction in developing countries. The goal is that aid shall act as a catalyst to a greater degree, by triggering other forms of capital, and promote local economic de-velopment through the ripple effects of private sector investments. In the white paper the government indicated that it wants to increase its efforts to ensure bet-ter framework conditions, transfer of knowledge and skills, and establish new systems for collaboration with the private sector.
October–December 2015In November the EFTA Surveillance Au-thority (ESA) decided to close the com-plaint case against Norway regarding lot-teries. ESA launched legal proceedings against the Norwegian state in January 2014 following a complaint from a private lottery operator, which claimed that the
11
Norwegian rules for granting licences to private lotteries were unclear. This case could have had widespread implications for Norsk Tipping AS’s regulatory frame-work.
In autumn 2015 the Ministry of Trans-port and Communications proposed that the Storting allow Avinor AS’s wholly owned subsidiary Avinor Flysikring AS to provide consulting services in other coun-tries (cf. Proposition no. 19 to the Storting (2015–2016) Amendments to the 2015 na-tional budget under the Ministry of Trans-port and Communications). The Storting adopted this proposal on 14 December 2015 (cf. the consideration of Recommen-dation no. 132 S (2015–2016)). Allowing consultancy activities abroad will provide Avinor Flysikring with new market oppor-tunities and will help build expertise within the company in areas such as remote and virtual towers and airspace organisation.
It was decided in the Royal Decrees dated 11 and 18 December 2015 that the responsibility for the management of the state’s ownership of Baneservice AS and Veterinærmedisinsk Oppdragssenter AS will be transferred to the Ministry of Trade, Industry and Fisheries on 1 January 2016, from the Ministry of Transport and Com-munications and the Ministry of Agricul-ture and Food respectively. The objective of the state’s ownership in these compa-nies is purely commercial. The transfers were made on the basis that there are no special considerations in favour of other solutions than the general rule that owner-ship of commercial companies ought to be managed by the central ownership unit, which is under the Ministry of Trade, In-dustry and Fisheries.
January–March 2016In February 2016 the Ministry of Trade, Industry and Fisheries presented a propo-sition to the Storting on the future frame-work for Store Norske Spitsbergen Kulkom-pani AS (SNSK), (cf. Proposition no. 52 S (2015–2016) Amendments to the 2015 na-tional budget under the Ministry of Trade, Industry and Fisheries (Store Norske Spitsbergen Kulkompani AS – framework for coal mining operations)). The Storting adopted the Ministry’s proposal on 5 April 2015 (cf. the consideration of Recommen-dation no. 214 S (2015–2016)). This means that in its capacity as an owner the state will inject capital to facilitate a break in op-erations in Svea and Lunckefjell for up to three years and that operations in Mine 7 in Longyearbyen are continued and ex-panded to two shifts, in line with the board’s recommendation. The state is in-jecting NOK 112 million in new equity into SNSK. In addition, a subordinated loan from the state to SNSK of NOK 205 mil-lion, plus interest, will be converted into equity in SNSK. To better reflect the dif-ferent objectives of the state’s ownership of SNSK, the categorisation of the state’s
ownership of the company was changed from category 3 – commercial and other specifically defined objectives, to category 4 – sectoral policy objectives.
On 4 March 2016 the Ministry of Trade, Industry and Fisheries presented a pro-posal to the Storting on amendments to the Act relating to Innovasjon Norge (cf. Proposition no. 66 L (2015–2016) Amend-ments to the Act relating to Innovasjon Norge (responsibilities and management)). The bill contains proposed amendments to the special legislation for Innovasjon Norge with a view to providing better guidelines for the management of the company. The amendments mean that In-novasjon Norge can adapt the expertise and work at the various district offices around Norway to the different regions’ individual needs. The Ministry proposes the repeal of the provision that the com-pany shall have regional boards. This will enable the company to introduce decision-making structures that best ensure effi-cient workflow and good customer ser-vice. Furthermore, the Ministry proposes that the company be made more account-able for its own commitments in line with the general rule for sectoral policy compa-nies. This will enable the company to be run more in line with general principles of corporate law, with clear lines of responsi-bility between the various bodies in the company. The bill comes in response to the Storting’s resolutions nos. 463, 464, 465, 466, 467 and 468 of 19 January 2016.
On 18 March 2016 the Ministry of De-fence presented to the Storting the draft resolution and bill Proposition no. 79 LS (2015–2016) Act relating to privatisation of Aerospace Industrial Maintenance Norway SF and resolution on changes in the state’s ownership share. The bill contains a pro-posal that the state-owned enterprise Aer-ospace Industrial Maintenance Norway SF be converted to a limited liability com-pany. In addition, the Ministry requested authorisation from the Storting for the state to wholly or partly reduce its share-holding in the limited liability company when deemed appropriate. The Ministry’s intention with this proposal was to further
strengthen the company as a commercial operator and change the objective of the state’s ownership in a more commercial direction. In addition, the Ministry wanted to ensure good framework conditions for flexible, commercial operation by the company having been given the opportu-nity to seek private capital and adapt the ownership structure to what best serves the company in the long run. The bill and draft resolution are currently being con-sidered in the Storting and are expected to be discussed during the course of spring 2016.
Buy-back of sharesIn combination with the distribution of dividends, the company’s purchase of own shares for cancellation (buy-back) can be an effective mean of achieving a suitable capital structure. It may also contribute to a competitive direct return. In companies with state ownership, buy-back of own shares for cancellation should not result in a change in the state’s shareholding. In re-cent years, therefore, the state has en-tered into agreements for proportional re-demption of shares for cancellation in con-nection with the establishment of such buy-back programmes. This approach al-lows the state’s shareholding to remain unchanged. These buy-back agreements fall within the framework that the Storting has granted the government for the man-agement of the state’s ownership. The agreements guarantee the state a redemp-tion price corresponding to the price for which other shareholders have been will-ing to sell.
The state, through the Ministry of Trade, Industry and Fisheries and the Ministry of Petroleum and Energy, has signed buy-back agreements with DNB, Statoil, Telenor and Yara International. In connection with these agreements, in 2015 the state received NOK 127 million as payment for the redemption of shares in Yara International. Some 414,406 shares were redeemed from the state, and the date of the buyback was 9 July 2015.
© Posten Norge AS

12
© Kongsberg G
ruppen ASA
Kongsberg Gruppen had the second highest return among the listed companies in 2015, at 25.4%.

13
Return and financial values
At the end of 2015 the value of the state’s direct ownership of shares listed on the Oslo Stock Exchange (Oslo Børs) was NOK 523 billion. On the same date, the state’s share of the book value of unlisted companies in which the state’s ownership has commercial objectives amounted to NOK 121 billion. The total estimated value of the state’s assets in the 25 companies in categories 1–3 was thus NOK 644 billion.

14
The Norwegian and the international economyGDP growth for mainland Norway was 1.0% in 2015, down from 2.3% in 2014. The development in 2015 is the weakest since the financial crisis in 2009. A key factor is the signifi-cant drop in demand from the petroleum industry. The de-cline is due to lower oil prices and the oil companies’ need to reduce their costs.
Norges Bank has adopted an expansionary monetary policy to counteract the decline in activity in the Norwegian economy. Combined with the fall in oil prices, the expan-sionary monetary policy has resulted in a weakening of the Norwegian krone, improving the cost competitiveness of Norwegian exporters and activities that compete with im-ports. This has led to higher exports, lower imports and in-creased activity. High public spending has also helped cush-ion the downturn in the Norwegian economy.
The decline in petroleum-related industries was reflected in the overall employment figures towards the end of last year, but the annual average was nevertheless an increase of 0.6%. The unemployment rate, as measured by Statistics Norway’s Labour Force Survey, has risen gradually since spring 2014. In 2015 the overall unemployment rate was 4.4%. Annual wage growth in 2015 was estimated at 2.8%.1
Inflation measured by the consumer price index (CPI) was 2.1% in 2015, corresponding to real wage growth of 0.7%. This is the lowest real wage growth since the late 1980s.
Growth in global GDP in 2015 has been provisionally es-timated at 3.1%, down from 3.4% in 2014.2 Growth in emerg-ing economies, which accounts for about 70% of global growth, slowed down for the fifth consecutive year. Growth in industrial countries rose, but remains modest.2 Three key trends will probably affect global economic growth going forwards: the gradual decline in the Chinese economy and the transition from investments and manufacturing to con-sumption and services; lower prices for energy and other commodities; and a gradual tightening of the monetary pol-icy in the USA.2
Economic growth among Norway’s main trading part-ners³ rose to 2.2% in 2015, compared with growth of 2.0% in 2014.2 Several eurozone countries are struggling with weak growth in both production and employment, and GDP in the eurozone is still below the pre-crisis level. Economic devel-opments in the USA were impacted by lower petroleum in-vestments and a stronger dollar, but there was nevertheless an upswing in 2015 as a whole. Sweden had strong growth in 2015, and the upturn is broad-based.
The stock market in Norway and internationallyThe main index of the Oslo Stock Exchange rose by 5.9% in 2015, marking the fourth consecutive year of growth. Much of the increase was in sectors like consumables, including seafood, and consumer goods. Low oil prices and a further 36% drop in the oil price (North Sea Brent Crude) in 2015 slowed developments and dragged energy companies down.
The Oslo Stock Exchange performed relatively well by international standards. In the USA the S&P 500 and the Dow Jones indices fell by 0.7% and 2.2% respectively. The OMX Stockholm index, which represents the Nordic mar-kets (Denmark, Sweden, Finland and Iceland), fell by 1.5% in 2015, while the FTSE 100 index in London fell by 4.4%. The German DAX index and the Japanese Nikkei 225 index both rose by more than 9%.
Share price performance4 for listed companies and the Oslo Stock Exchange main index
1 The Norwegian Technical Calculation Committee for Wage Settlements.2 The International Monetary Fund (IMF), World Economic Outlook January 2016.3 The eurozone, Sweden, USA, UK, Denmark, China, South Korea, Poland, Russia and Japan.
50
75
100
125
150
175
2011 2012 2013 2014 2015 2016
Norsk Hydro ASA OSEBX
50
75
100
125
150
175
2011 2012 2013 2014 2015 2016
Kongsberg Gruppen ASA OSEBX
50
75
100
125
150
175
200
2011 2012 2013 2014 2015 2016
DNB ASA OSEBX
50
75
100
125
150
2014 2015 2016
Entra ASA OSEBX
50
75
100
125
150
175
2011 2012 2013 2014 2015 2016
Norsk Hydro ASA OSEBX
50
75
100
125
150
175
2011 2012 2013 2014 2015 2016
Kongsberg Gruppen ASA OSEBX
50
75
100
125
150
175
200
2011 2012 2013 2014 2015 2016
DNB ASA OSEBX
50
75
100
125
150
2014 2015 2016
Entra ASA OSEBX
50
75
100
125
150
175
2011 2012 2013 2014 2015 2016
Norsk Hydro ASA OSEBX
50
75
100
125
150
175
2011 2012 2013 2014 2015 2016
Kongsberg Gruppen ASA OSEBX
50
75
100
125
150
175
200
2011 2012 2013 2014 2015 2016
DNB ASA OSEBX
50
75
100
125
150
2014 2015 2016
Entra ASA OSEBX
50
75
100
125
150
175
2011 2012 2013 2014 2015 2016
Norsk Hydro ASA OSEBX
50
75
100
125
150
175
2011 2012 2013 2014 2015 2016
Kongsberg Gruppen ASA OSEBX
50
75
100
125
150
175
200
2011 2012 2013 2014 2015 2016
DNB ASA OSEBX
50
75
100
125
150
2014 2015 2016
Entra ASA OSEBX

15
Return for listed companiesReturn is the total sum of the change in the market value of a company’s equity and direct returns in the form of dividends and payment in the event of buy-back of shares.
The state has direct ownership of eight companies listed on Oslo Stock Exchange. The value-adjusted return for these com-panies, including reinvested dividends, was 1.3% in 2015, com-pared with 5.6% the previous year. The return is weighted with the value of the state’s shareholding at the end of 2015, and since Statoil accounts for about half of the total value of the state’s as-sets on the stock exchange, Statoil has a considerable influence on the weighted total return.
The graphs on pages 14 and 15 show the share price perfor-mance, including reinvested dividends for each company, com-pared with the developments for Oslo Stock Exchange’s main share index (the OSEBX index). The timeseries runs from 1 January 2011 to 31 March 2016, with the exception of Entra, where the timeseries runs from its listing date in 2014. Both the share prices and the OSEBX index are indexed from the start date of the series.
SAS had the highest return in 2015, at 60.5%, followed by Kongsberg Gruppen at 25.4%, Yara International at 18.6%, Tele-nor at 2.2% and DNB at 1.9%. Statoil, Entra and Norsk Hydro had negative returns of -0.8%, -3.8% and -19.7% respectively.
Taking the past five years as a whole, i.e. the period between 1 January 2011 and 31 December 2015, Telenor has had the high-est average annual return at 14.5%. Next comes DNB at 9.3%, Yara International at 6%, Kongsberg Gruppen at 5.7%, Statoil at 2.8% and SAS at 1.6%. Norsk Hydro has had a negative average annual return of -2.5% for the past five years. In the same period the OS-EBX index has had an average annual return of 6.1%.
Value of the state’s shareholdingThere are several ways of measuring the value of a company. For listed companies, the market value of the company’s shares is used, while book equity less minority interests is used for the unlisted companies in categories 1–3.5 The tables on pages 16 and 17 show the estimated value of each company for 2015 and 2014. No estimate is made of the value of the companies where the main objective of the state’s ownership is not commercial (category 4).
The value of the state’s shares on Oslo Stock Exchange was NOK 523 billion at year-end 2015, down NOK 19.7 billion from the previous year. Statoil was a major contributor to the reduction in the value of the combined holdings of NOK 16 billion. The holdings in Norsk Hydro, Telenor, Entra and DNB decreased in value by NOK 6.6 billion, NOK 2.6 billion, NOK 0.5 billion and NOK 0.5 billion respectively. Yara International, Kongsberg Gruppen and SAS contributed positively with increases of NOK 4.8 billion, NOK 1.3 billion and NOK 0.5 billion respectively.
The state’s share of the book value of the unlisted companies in categories 1–3 was NOK 121 billion at the end of 2015, up NOK 2.9 billion from the previous year.
The total estimated value of the state’s assets in the 25 compa-nies in categories 1–3 was NOK 644 billion, down NOK 16.7 bil-lion from the previous year.
DividendsThe state will receive NOK 29.9 billion in dividends for the 2015 financial year, which is NOK 5.7 billion less than the previous year. Statkraft, which paid out NOK 6 billion in dividends for 2014, is not paying a dividend for 2015. Statoil is paying dividends of NOK 15.4 billion, unchanged from last year.
Share price performance4 for listed companies and the Oslo Stock Exchange main index
4 Share price performance including reinvested dividends (source: FactSet).5 The value of the state’s ownership interest in Aker Kværner Holding was calculated using the market prices
for Akastor, Aker Solutions and Kværner, and the state’s indirect ownership interest in these companies.
50
75
100
125
150
175
YaraInternational ASA
OSEBX
50
75
100
125
150
175
2011 2012 2013 2014 2015 2016
Statoil ASA
OSEBX
0
25
50
75
100
125
150
175
2011 2012 2013 2014 2015 2016
SAS AB
OSEBX
50
75
100
125
150
175
200
225
Telenor ASA
OSEBX
2011 2012 2013 2014 2015 2016
2011 2012 2013 2014 2015 2016 50
75
100
125
150
175
YaraInternational ASA
OSEBX
50
75
100
125
150
175
2011 2012 2013 2014 2015 2016
Statoil ASA
OSEBX
0
25
50
75
100
125
150
175
2011 2012 2013 2014 2015 2016
SAS AB
OSEBX
50
75
100
125
150
175
200
225
Telenor ASA
OSEBX
2011 2012 2013 2014 2015 2016
2011 2012 2013 2014 2015 2016 50
75
100
125
150
175
YaraInternational ASA
OSEBX
50
75
100
125
150
175
2011 2012 2013 2014 2015 2016
Statoil ASA
OSEBX
0
25
50
75
100
125
150
175
2011 2012 2013 2014 2015 2016
SAS AB
OSEBX
50
75
100
125
150
175
200
225
Telenor ASA
OSEBX
2011 2012 2013 2014 2015 2016
2011 2012 2013 2014 2015 2016
50
75
100
125
150
175
YaraInternational ASA
OSEBX
50
75
100
125
150
175
2011 2012 2013 2014 2015 2016
Statoil ASA
OSEBX
0
25
50
75
100
125
150
175
2011 2012 2013 2014 2015 2016
SAS AB
OSEBX
50
75
100
125
150
175
200
225
Telenor ASA
OSEBX
2011 2012 2013 2014 2015 2016
2011 2012 2013 2014 2015 2016

16
Return and financial values 20151
NOK million Market value of equity2
State’s shareholding
Value ofthe state’s
shareholding2
Dividend to the state for the 2015 financial year3
State’s sales proceeds, capital contribution
and share purches4Return Direct return
Average annual return past five years
Listed companies
DNB ASA 178 842 34 % 60 806 2 492 0 1.9 % 3.5 % 9.3 %Entra ASA 13 091 49.73 % 6 510 274 0 -3.8 % 3.5 % –Kongsberg Gruppen ASA 17 400 50.001 % 8 700 255 0 25.4 % 6.4 % 5.7 %Norsk Hydro ASA 68 546 34.26 % 23 485 699 0 -19.7 % 3.0 % -2.5 %SAS AB 8 028 14.29 % 1 147 0 0 60.5 % 0.0 % 1.6 %Statoil ASA 394 436 67 % 264 272 15 382 0 -0.8 % 5.8 % 2.8 %Telenor ASA 222 666 53.97 % 120 162 6 078 0 2.2 % 4.9 % 14.5 %Yara International ASA 105 329 36.21 % 38 141 1 489 127 18.6 % 3.4 % 6.0 %Total listed companies5 1 008 338 523 224 26 669 127 1.3 %
NOK millionBook equity
less minorityinterests
State’s shareholding Book value of state’s shareholding6
Dividend to the state for the 2015 financial year
State’s sales proceeds, capital contributions and share purchase4
Unlisted companies in categories 1–3
Ambita AS 91 100 % 91 3 0Baneservice AS 164 100 % 164 8 0Flytoget AS 802 100 % 802 181 0Mesta AS 1 003 100 % 1 003 300 0Veterinærmedisinsk Oppdragssenter AS 40 34 % 14 22 0
Aker Kværner Holding AS 5 579 30 % 1 674 0 0Nammo AS 2 329 50 % 1 165 55 0
Aerospace Industrial Maintenance Norway SF 408 100 % 408 0 0Argentum Fondsinvesteringer AS 7 955 100 % 7 955 500 0Eksportfinans ASA 7 409 15 % 1 111 0 0Electronic Chart Centre AS 10 100 % 10 3 0GIEK Kredittforsikring AS 63 100 % 63 0 0Investinor AS 2 011 100 % 2 041 0 0Kommunalbanken AS 12 202 100 % 12 202 417 -1 000NSB AS 9 835 100 % 9 835 595 0Posten Norge AS 5 928 100 % 5 928 0 0Statkraft SF 76 524 100 % 76 524 0 0Total unlisted companies in categories 1–3 132 353 120 959 2 084 -1 000
Total all companies in categories 1–3 1 140 691 644 183 28 754 -873
NOK million Dividend to the state for the 2015 financial year
State’s sales proceeds, capital contributions and share purchase4
Companies in category 47
Avinor AS 500 0Innovasjon Norge 217 0Norfund 0 -1 480Statnett SF 357 0Statskog SF 11 0AS Vinmonopolet 59 0Total companies in category 4 1 144 -1 480
Total all companies 29 898 -2 353
1 The key figures are defined on page 125. 2 At 31 December 2015.3 For Statoil, which pays dividends on a quarterly basis, the figure is paid dividends.4 Sales proceeds are shown as positive figures; capital contributions and share purchases are shown
as negative. 5 The return is weighted with the value of the state’s shareholding at 31 December 2015.6 The state’s share of book equity less minority interests. The value of the state’s ownership interest in
Aker Kværner Holding was calculated using the market prices for Akastor, Aker Solutions and Kværner at 31 December 2015 and the state’s indirect ownership interest in these companies on the same date.
7 Companies in category 4 without dividends, sales proceeds, contributions and share purchases are not included in the table.

17
Return and financial values 20141
NOK million Market value of equity2
State’s shareholding
Value ofthe state’s
shareholding2
Dividend to the state for the 2014 financial year
State’s sales proceeds, capital contributions and share purchase3
Return Direct return Average
annual return past five years
Listed companies
DNB ASA 180 308 34 % 61 305 2 104 0 4.7 % 2.4 % 15.4 %Entra ASA4 14 056 49.89 % 7 013 879 3 284 14.2 % – –Kongsberg Gruppen ASA 14 760 50.001 % 7 380 555 0 0.0 % 4.3 % 10.1 %Norsk Hydro ASA 87 808 34.26 % 30 084 699 0 60.5 % 1.8 % 1.1 %SAS AB 4 790 14.29 % 684 0 0 -7.9 % 0.0 % -21.4 %Statoil ASA5 418 351 67 % 280 295 15 382 0 -5.2 % 8.1 % 3.0 %Telenor ASA 227 471 53.97 % 122 755 5 916 1 048 9.9 % 4.6 % 18.3 %Yara International ASA 92 205 36.21 % 33 389 1 297 211 32.6 % 3.0 % 8.1 %Total listed companies6 1 039 748 542 905 26 832 4 543 5.6 %
NOK millionBook equity
less minorityinterests
State’s shareholding Book value of state’s shareholding7
Dividend for the state for the 2014 financial year
State’s sales proceeds, capital contributions and share purchase3
Unlisted companies in categories 1–3
Ambita AS 76 100 % 76 26 0Baneservice AS 125 100 % 125 0 0Flytoget AS 754 100 % 754 129 0Mesta AS 918 100 % 918 150 0Veterinærmedisinsk Oppdragssenter AS 83 34 % 28 8 0
Aker Kværner Holding AS 7 720 30 % 2 385 69 0Nammo AS 2 069 50 % 1 035 47 0
Aerospace Industrial Maintenance Norway SF 394 100 % 394 0 0Argentum Fondsinvesteringer AS 7 804 100 % 7 804 250 0Eksportfinans ASA 7 760 15 % 1 164 0 0Electronic Chart Centre AS 11 100 % 11 0 0GIEK Kredittforsikring AS 54 100 % 54 0 0Investinor AS 1 949 100 % 1 949 0 0Kommunalbanken AS 8 336 100 % 8 336 0 0NSB AS 8 406 100 % 8 406 753 0Posten Norge AS 6 206 100 % 6 206 300 0Statkraft SF 77 963 100 % 77 963 6 007 -5 000Store Norske Spitsbergen Kulkompani AS 415 99.94 % 415 0 0Total unlisted companies in categories 1–3 131 043 118 022 7 739 -5 000
Total all companies in categories 1–3 1 170 791 660 927 34 571 -457
NOK million Dividend to the state for the 2014 financial year
State’s sales proceeds, capital contributions and share purchase3
Companies in category 48
Avinor AS 500 0Innovasjon Norge 25 0Norfund 0 -1 230Statnett SF 321 0Statskog SF 52 0AS Vinmonopolet 106 0Total companies in category 4 1 004 -1 230
Total all companies 35 574 -1 687
1 The key figures are defined on page 125. 2 At 31 December 2014. 3 Sales proceeds are shown as positive figures; capital contributions and share purchases are shown
as negative.4 Dividends to the state for 2014 include NOK 650 million in additional dividends, which were decided
and disbursed in 2014 in connection with the listing.5 Statoil introduced quarterly disbursement of dividends in 2014. The figures for dividends in 2014 have
been calculated by multiplying outstanding shares with NOK 1.8 for four quarters. However the dividends disbursed in 2014 were NOK 10.6 (NOK 7 for all of 2013, and NOK 1.8 for the first and second quarters of 2014).
6 The return is weighted with the value of the state’s shareholding at 31 December 2014.7 The state’s share of book equity less minority interests. The value of the state’s ownership interest in
Aker Kværner Holding was calculated using the market prices for Akastor, Aker Solutions and Kværner at 31 December 2014 and the state’s indirect ownership interest in these companies on the same date.
8 Companies in category 4 without dividends, sales proceeds, contributions and share purchases are not included in the table.

18
DNB’s profit in 2015 after taxes and minority interests was NOK 24.8 billion.

19
Key figures describing financial performance
The state as an owner emphasizes the companies’ financial performance. In this chapter several key financial variables are commented, with emphasis on the state’s commercial ownership (the companies in categories 1–3). For the companies in category 4, procurements by and subsidies from the state as a sectoral policy instrument are commented.
© Stig B. Fiksdal

20
Profit performance The table above shows some key financial figures for companies where the state’s ownership has commercial objectives (cate- gories 1–3). The combined total profit for the year after tax and minority interests for these companies was NOK 6.2 billion in 2015, a decline of NOK 52.2 billion from the previous year. The NOK 59.4 billion decline in Statoil’s profit from NOK 21.9 billion in 2014 to NOK -37.5 billion in 2015 accounted for much of the overall decline. Excluding Statoil, the combined profit for the year rose from NOK 36.5 billion to NOK 43.7 billion, representing growth in profits of 19.7%.
The greatest contributors to total prof-its for 2015 among the listed companies are DNB, Telenor and Yara International. Below is a presentation of the financial re-sults of the listed companies.
DNB recorded profits of NOK 24.8 bil-lion for 2015, an increase of NOK 4.1 bil-
lion from the previous year. The improved profit performance mainly reflected an increase in net interest income and net other operating income and a reduction in costs. DNB increased its common equity Tier 1 capital by NOK 20.8 billion from the end of 2014 to the end of 2015. DNB is well capitalised, but will continue to build capi-tal organically in order to meet the statu-tory requirements.
Entra returned a profit of NOK 2.6 bil-lion for 2015, compared with NOK 1 bil-lion the previous year. The company had operating revenues of NOK 2 billion, roughly unchanged from 2014. The profit from property management was NOK 1.4 billion, up slightly from 2014.
Kongsberg Gruppen had a profit of NOK 0.7 billion in 2015, compared with NOK 0.9 billion the previous year. Revenue in-creased by 2.5% compared with 2014 to NOK 17 billion in 2015. The board decided to write down goodwill and intangible as-
sets at Kongsberg Oil & Gas Technologies by NOK 300 million at the end of 2015. This had a negative impact on the compa-ny’s 2015 profit.
Norsk Hydro had a profit of NOK 2 bil-lion in 2015, compared with NOK 0.8 bil-lion the previous year. The negative ef-fects of lower realised aluminium prices and product premiums were more than offset by the positive currency effects of a stronger US dollar and ongoing improve-ment work, resulting in a higher profit for the company in 2015. Operating revenues increased by 12% compared with 2014 to NOK 88 billion in 2015.
SAS had an annual profit of NOK 0.9 bil-lion for the period November 2014 to Oc-tober 2015 (the company’s financial year), compared with a loss of NOK -0.7 billion for the same period the previous year. The improvement was mainly driven by growth in passenger revenues, cost savings and lower fuel costs.
Group accounting figures 2015 – companies in categories 1–31
NOK million State’s shareholding Operating revenues Operating profit/loss2 Profit for the year after tax and minority interests Capital employed Balance sheet total
Listed companiesDNB ASA 34 % 53 993 31 858 24 762 – 2 598 530Entra ASA 49.73 % 1 999 3 239 2 648 28 559 33 619Kongsberg Gruppen ASA 50.001 % 17 032 944 747 6 993 19 121
Norsk Hydro ASA 34.26 % 88 155 7 746 2 020 86 860 122 544SAS AB 14.29 % 37 477 1 334 904 15 938 30 287Statoil ASA 67 % 482 800 14 900 -37 500 765 700 966 700Telenor ASA 53.97 % 128 175 22 761 3 414 139 555 204 909Yara International ASA 36.21 % 111 897 14 104 8 083 90 818 118 863Total listed companies 921 528 96 886 5 078 1 134 423 4 094 573
Unlisted companies in categories 1–3
Ambita AS 100 % 322 52 38 91 160Baneservice AS 100 % 663 56 46 365 371Flytoget AS 100 % 960 232 181 802 1 393Mesta AS 100 % 4 078 440 335 1 012 2 262Veterinærmedisinsk Oppdragssenter AS 34 % 562 23 96 48 188
Aker Kværner Holding AS 30 % 0 -2 -2 127 5 577 5 579Nammo AS 50 % 3 783 284 217 3 122 4 641
Aerospace Industrial Maintenance Norway SF 100 % 579 23 14 408 675Argentum Fondsinvesteringer AS 100 % 488 420 401 7 957 8 001Eksportfinans ASA 15 % -406 -548 -376 – 65 142Electronic Chart Centre AS 100 % 25 -1 1 10 19GIEK Kredittforsikring AS 100 % 62 6 9 – 493Investinor AS 100 % 120 55 60 2 011 2 041Kommunalbanken AS 100 % 1 612 2 583 1 870 – 449 361NSB AS 100 % 15 372 2 098 2 149 21 759 28 836Posten Norge AS 100 % 25 074 -6 -62 8 933 16 097Statkraft SF 100 % 20 089 3 848 -1 727 129 562 173 839Total unlisted companies in categories 1–3 73 383 9 564 1 124 181 657 759 099
Total all companies in categories 1–3 994 911 106 405 6 202 1 316 080 4 853 672
1 The key figures are defined on page 125.2 For GIEK Kredittforsikring, profit / loss from technical accounts before provisions for security is used.

21
Statoil had a result of NOK -37.5 billion in 2015, compared with NOK 21.9 billion the previous year. The operating profit was NOK 14.9 billion, down by 86.4% from 2014. The decline in the profit was due to lower prices for oil and gas and substantial write-downs, mainly related to onshore ac-tivities in North America.
Telenor had a profit of NOK 3.4 billion in 2015, compared with NOK 9.1 billion the previous year. The profit was nega-tively affected by write-downs totalling NOK 2.1 billion related to operations in Denmark and NOK 5.4 billion related to the shareholding in VimpelCom. Operat-ing revenues increased by 15% to NOK 128 billion in 2015. The increase was largely due to currency gains and good revenue growth in several markets, par-ticularly from operations in Myanmar. This was partially offset by tougher mar-ket conditions in Thailand, Denmark and Malaysia.
Yara International achieved an annual profit of NOK 8.1 billion in 2015, up 6% from the previous year. The most impor-tant reasons for the improvement in the results are lower gas prices in Europe and the stronger US dollar.
The combined result for the unlisted companies in categories 1–3 was a profit of NOK 1.1 billion for 2015, compared with a loss of NOK -2.5 billion the previous year. The combined operating profit was NOK 9.6 billion, while combined operating rev-enues amounted to NOK 73.4 billion. Be-low is a brief presentation of the financial results of these companies.
Ambita had a profit of NOK 37.6 million in 2015, compared with NOK 14.6 million the previous year. The reason for the ex-traordinarily high profit for 2015 was the transition from a defined benefit to a de-fined contribution pension scheme. The company had revenue of NOK 322 million in 2015, an increase of 12.2% from the pre-
vious year. The growth was largely driven by the strong housing market. In 2015 Ambita became a group, and some of the growth is from Edok AS.
Baneservice had a profit of NOK 45.7 million in 2015, compared with NOK 24.6 million the previous year. The improve-ment is due to good profitability in the en-tire project portfolio and better use of the company’s machine capacity as a result of higher production volumes and a longer working season.
Flytoget had a profit of NOK 181 million in 2015, which is slightly lower than the previous year. Competition in the market has increased significantly, and the com-pany’s market share has declined by 1.1 percentage points.
Mesta returned a profit of NOK 335 mil-lion in 2015, up from NOK 225 million the previous year. The profit is affected by gains from property sales.
Group accounting figures 2015 – companies in categories 1–31
NOK million Cash flow operations Dividend percentage Average dividend percentage last five years Equity ratio2 Return on equity Average return on equity
last five years
Listed companiesDNB ASA -43 092 30 % 27 % 15 % 15 % 13 %Entra ASA 849 21 % 35 % 40 % 22 % 11 %Kongsberg Gruppen ASA -1 087 68 % 56 % 32 % 12 % 19 %Norsk Hydro ASA 14 373 101 % 119 % 65 % 3 % 2 %SAS AB 2 870 0 % 0 % 21 % 17 % -1 %Statoil ASA 109 000 – 69 % 37 % -10 % 12 %Telenor ASA 37 107 330 % 134 % 31 % 6 % 10 %Yara International ASA 14 631 51 % 37 % 64 % 12 % 18 %Weighted average listed companies -1.6 %
Unlisted companies in categories 1–3Ambita AS 23 9 % 47 % 60 % 45 % 22 %Baneservice AS 117 18 % – 44 % 32 % -2 %Flytoget AS 291 100 % 119 % 58 % 23 % 17 %Mesta AS 88 90 % 96 % 44 % 35 % 22 %Veterinærmedisinsk Oppdragssenter AS 49 66 % 101 % 21 % 156 % 69 %
Aker Kværner Holding AS 245 0 % – 100 % – –Nammo AS 26 50 % 50 % 51 % 10 % 16 %
Aerospace Industrial Maintenance Norway SF 11 0 % 0 % 60 % 4 % 4 %Argentum Fondsinvesteringer AS 750 125 % 57 % 99 % 5 % 10 %Eksportfinans ASA 16 205 0 % 0 % 36 % -5 % 0 %Electronic Chart Centre AS – 273 % 489 % 53 % 11 % 3 %GIEK Kredittforsikring AS -40 0 % 0 % 26 % 15 % –Investinor AS -172 0 % 0 % 99 % 3 % -3 %Kommunalbanken AS -7 302 22 % 17 % 12 % 18 % 17 %NSB AS 2 233 28 % 38 % 34 % 24 % 14 %Posten Norge AS 1 213 0 % 65 % 37 % -1 % 6 %Statkraft SF 8 669 0 % 207 % 49 % -2 % 2 %
Weighted average for unlisted companies in categories 1–3 3.4 %
Weighted average for all companies in categories 1–3 -0.5 %
1 The key figures are defined on page 125. 2 Tier 1 capital ratio is used for DNB, Eksportfinans, Investinor and Kommunalbanken.
Capital ratio is used for GIEK Kredittforsikring.

22
Veterinærmedisinsk Oppdragssenter achieved an annual profit of NOK 95.9 million in 2015, up from NOK 29.6 million the preced-ing year. The increase in profits is related to proceeds from the sale of two subsidiaries in 2015. Revenue increased from NOK 548 mil-lion in 2014 to NOK 562 million in 2015.
Aker Kværner Holding’s revenues con-sist of dividends from Akastor, Aker Solu-tions and Kværner, as well as limited inter-est income. Aker Kværner Holding’s re-sult was a loss of NOK -2.1 billion in 2015, compared with NOK -4.7 billion the previ-ous year. This is due to the company hav-ing written down shares in Akastor, Aker Solutions and Kværner worth NOK 2.4 bil-lion. The write-down largely reflects the decline in value in oil-related shares on Oslo Stock Exchange in 2015.
Nammo had a profit of NOK 217 million in 2015, compared with NOK 189 million the previous year. Revenue in 2015 in-creased by 1.8% from the previous year to NOK 3,783 million, and the weaker Nor-wegian krone resulted in growth in the consolidated figures.
Aerospace Industrial Maintenance Nor-way posted a profit of NOK 14.1 million in 2015, compared with NOK 51.6 million the previous year. The result for 2014 was impacted by recognition of changes in the pension obligations in the Norwegian Public Service Pension Fund.
Argentum Fondsinvesteringer achieved a group profit of NOK 401 million in 2015, compared with NOK 773 million the previ-ous year. The net profit from the invest-ments in private equity funds totalled NOK 470 million.
Eksportfinans posted a result of NOK -376 million in 2015, compared with NOK -4,273 million the previous year. The nega-tive figures are primarily due to the rever-sal of previous unrealised gains on the company’s own debt.
Electronic Chart Centre had an annual profit of NOK 1.2 million in 2015, com-pared with NOK -3.6 million the previous year. The company has had a period of in-vestment for future growth, with emphasis on new business opportunities and estab-lishment in different user environments.
GIEK Kredittforsikring achieved an an-nual profit of NOK 9 million in 2015, com-pared with NOK 4.3 million the previous year. It was a challenging year for the com-pany as many of its customers no longer had access to key markets like Russia and Ukraine.
Investinor had a profit of NOK 60 mil-lion in 2015, compared with NOK -103 mil-lion the previous year. The operating rev-enues amounted to NOK 120 million, com-pared with NOK -68.6 million the previous year. The improvement was due to higher gains on the sale of shareholdings and a
stronger positive net change in the market value of the investment portfolio.
Kommunalbanken had a profit of NOK 1,870 million in 2015, compared with NOK 491 million the previous year. Net interest income was stable and on par with 2014. The profit was affected by the reversal of unrealised losses of NOK -734 million in 2014 to gains of NOK 1,116 million in 2015.
NSB posted a profit of NOK 2,149 mil-lion in 2015, compared with NOK 1,505 million the previous year. This is the group’s highest profit ever. The improve-ment is primarily attributable to strong operating profit in the passenger train op-erations, mainly due to growth in the num-ber of passenger journeys, improved prof-its in bus and freight operations due to cost efficiencies, and considerable profits related to the development and sale of property.
Posten Norge posted a result of NOK -62 million in 2015, down from NOK 447 mil-lion the previous year. The result is strong-ly affected by the decline in activity in the oil sector, weaker market conditions in Norway, and a drift towards services with lower margins. For several years the group has realised significant cost effi-ciencies as a result of rationalisation pro-grammes in both the postal and the logis-tics segments. It has nevertheless proven difficult to fully compensate for declining volumes of mail.
Statkraft reported a loss of NOK -1,727 million in 2015, compared with a profit of NOK 3,758 million the previous year. Write-downs and negative currency ef-fects related to financial items of NOK -2.3 billion affected the group’s results. The company’s operating profit in 2015 was weakened by the low Nordic power prices, which were at their lowest level in 15 years.
Dividend percentageDividend percentage is the proportion of the company’s profit that is paid to the shareholders as a dividend. The remain-ing part of the profit is retained by the company and added to book equity. The owners’ direct return may take the form of a dividend or buy-back of shares. Of the listed companies, only SAS is not paying a dividend for the 2015 financial year. Of the unlisted companies in categories 1–3, Argentum Fondsinvesteringer, Electronic Chart Centre, Flytoget, Mesta, Nammo and Veterinærmedisinsk Oppdragssenter paid dividends of 40% or more of the profit for the year after tax and minority inter-ests.
To illustrate the companies’ ability to yield a direct return over time, the table on page 21 indicates the average dividend percentage for the past five years. This is
calculated as the sum of all the dividends divided by the sum of the year’s profit af-ter tax and minority interests. During this period, the listed companies, excluding SAS, had a dividend percentage with an average that varies between 30% and 134% of the profit for the year. In the past five year period, Aker Kværner Holding and Baneservice have paid dividends of NOK 1,868 million and NOK 8.3 million respec-tively, but both had an aggregate loss after tax and minority interests. The average dividend percentage during the period therefore gives little meaning for these companies.
Return on equityReturn on equity is a measurement of how efficient the resources are use in a company compared to book value. Re-turn on equity indicates the owner’s re-turn on this part of the capital and is measured as the profit for the year after tax and minority interests, divided by the value of the average book equity. As shown in the table on page 21, some com-panies have had a negative rate of return in recent years.
For the state, which is a long-term own-er, it is also relevant to look at the compa-nies’ return over time. The average annu-al return on equity for the past five years was over 15% at Ambita, Flytoget, Kom-munalbanken, Kongsberg Gruppen, Mes-ta, Nammo, Veterinærmedisinsk Opp-dragssenter and Yara International. Ba-neservice, Investinor and SAS have had a negative average return on equity in the period.
Procurements by and subsidies from the state as a sectoral policy instrumentSeveral of the companies in categories 3 and 4 perform tasks that are not commer-cially profitable. In order to achieve the sectoral policy objectives of the state’s ownership of these companies, the state may partly regulate access to the market and pricing (e.g. Statnett and Vinmono-polet), partly procure specific services or service levels (e.g. NSB) and partly fi-nance all or part of the business through direct allocations in the national budget (e.g. the regional health authorities, Kings Bay and Petoro). Public procurements are often used for companies that compete in a market, but are also used to purchase health services from the regional health authorities. This accounts for most of the regional health authorities’ revenues. Fi-nancing through state allocations mostly takes place among companies that do not compete in a market, while competition and prices are mostly regulated by official monopoly enterprises.
The scope of financing through public budgets varies significantly among the

23
Group accounting figures 2015 – Companies in category 41
NOK million State’s shareholding Operating revenues Operating profit/lossProfit for the
year after tax and minority interests
Book equity less minority interests Balance sheet total Procurements by/
subsidies from the state
Companies in category 4
Andøya Space Center AS 90 % 119 21 17 86 148 32Avinor AS 100 % 11 989 3 232 2 499 14 832 38 785 0Bjørnøen AS 100 % 0 0 0 4 4 0Carte Blanche AS 70 % 40 2 2 7 18 26AS Den Nationale Scene 66.67 % 141 7 7 36 70 115Den Norske Opera & Ballett AS 100 % 743 -67 -67 -66 173 590Eksportkreditt Norge AS 100 % 102 0 1 45 84 100Enova SF 100 % 118 4 5 14 37 0Gassco AS 100 % 0 0 -1 14 1 267 3Gassnova SF 100 % 104 2 3 39 103 77Graminor AS 28.2 % 64 1 2 72 96 22Innovasjon Norge 51 % 1 231 263 263 1 513 23 565 1 058Kimen Såvarelaboratoriet AS 51 % 11 -1 -1 11 13 3Kings Bay AS 100 % 55 -3 -2 13 25 19Nationaltheatret AS 100 % 258 6 6 38 123 189Nofima AS 56.84 % 545 21 22 102 262 97Nordisk Institutt for Odontologiske Materialer AS 49 % 32 3 3 11 18 19Norfund 100 % 274 168 458 15 521 15 521 21Norges sjømatråd AS 100 % 544 84 84 439 552 0Norsk Helsenett SF 100 % 366 4 7 122 237 120Norsk rikskringkasting AS 100 % 5 593 -250 -183 1 086 3 142 0Norsk Tipping AS 100 % 29 770 4 427 4 485 214 5 234 0NSD – Norsk senter for forskningsdata AS 100 % 66 2 3 33 79 37Nye Veier AS 100 % 0 -47 -47 611 691 0Petoro AS 100 % 286 3 5 23 217 285Rogaland Teater AS 66.67 % 108 8 7 51 117 59Simula Research Laboratory AS 100 % 191 17 16 47 87 58Siva – Selskapet for Industrivekst SF 100 % 387 81 89 981 3 021 156Space Norway AS 100 % 46 -17 61 406 665 0Statnett SF 100 % 5 906 1 714 1 103 13 564 45 547 0Statskog SF 100 % 353 62 25 1 708 1 974 17Staur gård AS 100 % 10 0 -1 1 5 0Store Norske Spitsbergen Kulkompani AS 100 % 885 -434 -766 -315 1 037 0Talent Norge AS 33.33 % 30 0 0 0 23 30Trøndelag Teater AS 66.67 % 121 2 2 26 47 68UNINETT AS 100 % 297 78 81 233 340 82Universitetssenteret på Svalbard AS 100 % 144 -5 -5 16 80 122AS Vinmonopolet 100 % 12 806 140 117 553 3 723 0Total 73 734 8 301 3 406
Regional health authorites Helse Midt-Norge RHA 100 % 21 080 445 393 8 448 19 659 19 473
Helse Nord RHA 100 % 17 209 575 617 9 627 16 358 16 200Helse Sør-Øst RHA 100 % 78 925 1 077 1 046 32 506 62 120 72 424Helse Vest RHA 100 % 27 724 611 680 13 315 21 957 26 150Total 144 938 2 736 134 247
companies. In 2015 the companies re-ceived a combined total of NOK 141 billion from procurement of services by and di-rect allocations from the state.1 The financ-ing of health services accounts for most of
this, at a total of NOK 134 billion, up from NOK 119 billion the previous year. This figure can be broken down into NOK 19.5 billion for Helse Midt-Norge RHF, NOK 16.2 billion for Helse Nord RHF, NOK 72.4 billion for Helse Sør-Øst RHF and NOK 26.2 billion for Helse Vest RHF.
As shown in the table on page 23, state allocations also represent a significant por-tion of the operating revenues of, among others, Den Nationale Scene, Den Norske Opera & Ballett, Eksportkreditt Norge, Gassnova, Innovasjon Norge, Petoro and the University Centre in Svalbard.
1 The amount consists of NOK 3.1 billion for NSB, NOK 0.4 billion for Posten Norge and NOK 138 billion for the companies in category 4.
1 The key figures are defined on page 125.

24
© N
orsk Hydro A
SA
Based in Norway, Norsk Hydro has 13,000 employees involved in activities in more than 50 countries on all continents.
25
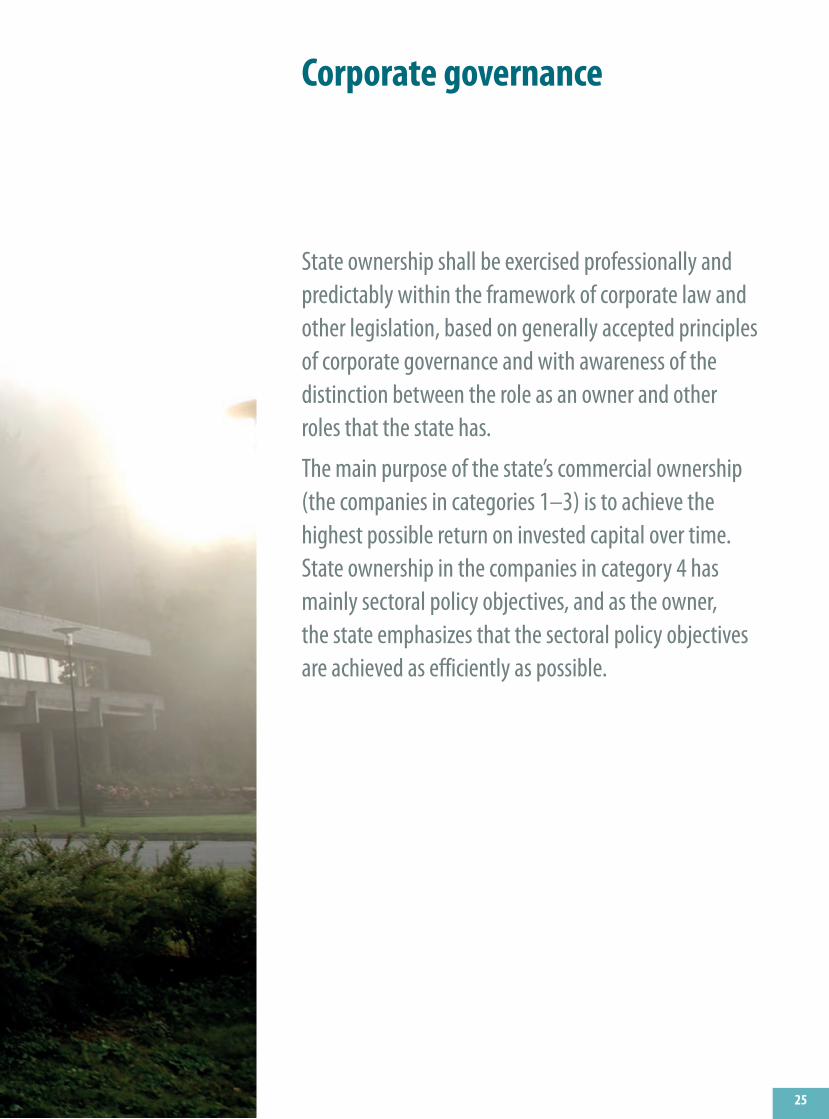
Corporate governance
State ownership shall be exercised professionally and predictably within the framework of corporate law and other legislation, based on generally accepted principles of corporate governance and with awareness of the distinction between the role as an owner and other roles that the state has.
The main purpose of the state’s commercial ownership (the companies in categories 1–3) is to achieve the highest possible return on invested capital over time. State ownership in the companies in category 4 has mainly sectoral policy objectives, and as the owner, the state emphasizes that the sectoral policy objectives are achieved as efficiently as possible.

26
© Harald Pettersen/Statoil ASA
Aspect of ownership Principles Expectations
Appropriate board composition
The composition of the board shall be characterised by competence, capacity and diversity and shall reflect the distinctive characteristics of each company (principle 6).
The board should adopt a plan for its own work, work actively to develop its own competencies and evaluate its own activities (principle 8).
The board should act as a sparring partner for the management and contribute beyond its super- visory role. The board should contribute to the company’s strategic planning, risk management, talent development and follow up the company’s work with corporate social responsibility.
The board should work systematically and appropriately and put an adequate amount of work into the office. The board should develop its own work and evaluate its activities and competencies on an annual basis. The state as an owner assesses the board’s performance and makes changes to the board on the basis of this assessment. Remuneration of the members of the board shall contribute to the board having the right quality of expertise and reflect the board’s responsibilities and workload, and be moderate.
Good corporate governance
Ownership decisions and resolutions shall be made at the general meeting (principle 3).
The board assumes executive responsibil-ity for administration of the company, including performing an independent supervisory function vis-à-vis the company’s management on behalf of the owners (principle 7).
The board is responsible for elaborating explicit objectives and strategies for the company within the constraints of its articles of association; the state sets performance targets for each company (principle 4).
Compensation and incentive schemes shall promote value creation within the companies and be generally regarded as reasonable (principle 9).
Matters that require the owners’ approval must be treated at the general meeting.
The board shall organise the business, hire the CEO and oversee the company’s operations. The board shall also ensure the strategic leadership and manage the company on the basis of the owners’ interests within the limits set at the general meeting. The board should be a resource, a discussion partner and a support for the company’s management. At the same time the board must monitor the management’s work and must therefore have an independent role.
The board is expected to draw up clear objectives and strategies for the company within the framework of the articles of association, manage company resources optimally and determine the company’s risk profile. The board ought to report on this so that the owners can monitor goal achievement and hold the board accountable for this. For companies where the state’s ownership has commercial objectives, the state as an owner sets expectations with respect to returns and dividends. In companies where the state’s ownership has sectoral policy objectives, the state as owner will strive to develop clear performance expectations and performance indicators.
Personnel policy should be characterised by inclusivity and diversity. The board should make sure the company has strategies and measures to promote equality and diversity in the company, including how the best expertise can be used in the company and measures to ensure more female senior executives.
Remuneration of senior executives should be competitive, but not wage leading. In addition, remuneration should be linked to the company’s goals.
Effective capital structure and suitable dividends
The capital structure of the company shall be appropriate given the objective and situation of the company (principle 5).
The company should have an appropriate capital structure that paves the way for long-term value creation, efficient goal achievement and lowest cost of capital. The board has overall responsibility for this.
The main purpose of the state’s commercial ownership is to achieve the highest possible return on invested capital over time. The state as an owner sets clear expectations for the companies regarding returns and dividends and expects the companies in categories 1–3 to deliver market return.
Sustainability and corpo- rate social responsibility integrated into the business
The company shall work systematically to safeguard its corporate social responsibil-ity (principle 10).
The state as an owner has general expectations related to corporate social responsibility and specific expectations within climate and the environment, human rights, employee rights, and transparency and corruption. The board is responsible for assessing how the expectations can best be followed up and that they are operationalised and reported on appropriately. Work on sustainability and corporate social responsibility shall support the shareholder value.
Transparency and good reporting
There shall be transparency in the state’s exercise of its ownership and the company’s operations (principle 2).
All shareholders shall be treated equally. (principle 1).
The state expects that companies with state ownership are open about important matters related to the business. Access to relevant and timely information enables stakeholders to evaluate the companies’ operations on an ongoing basis and is a key prerequisite for good exercise of ownership.
Companies that are wholly owned by the state and that are not “small enterprises” should strive to be as open as listed companies. All companies that are wholly owned by the state should follow the Norwegian Code of Practice for Corporate Governance where appropriate.
The companies should treat all shareholders equally, for example when it comes to disclosure of information. The board should ensure that the company has a high degree of transparency towards all shareholders.
Exercise of ownership that contributes to value creation
VisionValuesGoals
Business modelStrategy
Capital and resources
Exercise of ownershipThe state’s exercise of its ownership shall help create value by following up the state’s objectives for its ownership. As other owners, the state emphasizes that companies are run by a compentent man-agement aligned with its owners objec-tives, that the govenance structure is ap-propriate, that strategies and incentives reinforce the objectives, that the manage-ment deploys the capital effectively, that operations are sustainable, and that there is transparency about the company’s op-erations. To operationalize these objec-tives, the state’s exercise of its ownership is arranged such that it will contribute to:
1. Appropriate board composition2. Good corporate governance3. Effective capital structure and suitable dividends4. Sustainability and corporate social responsibility integrated into the business5. Transparency and good reporting
The board of directors and the execu-tives are responsible for ensuring that the company is managed on the basis of the owners’ interests. The state as an owner ex-ercises its authority as an owner through the general meeting / company meeting and works constantly to improve the exer-cise of ownership in all the five areas. The state’s voting at general meetings and com-pany engagement is based on the Norwe-gian state’s ten principles for good corpo-rate governance in addition to other explic-itly defined expectations. The illustration on page 27 provides a simplified represen-tation of the framework that form how own-ership is excersised. The table illustrate the link between general ownership issues and the state’s principles and expectations.
The following pages provide an account of what the state as an owner does to con-tribute to the companies’ value creation. This is not an exhaustive description, but provides a closer insight into the state’s exercise of ownership. See the white pa-per Report no. 27 to the Storting (2013–2014) Diverse and value-creating owner-ship for a complete description of the state’s ownership policy.
Aspect of ownership Principles Expectations
Appropriate board composition
The composition of the board shall be characterised by competence, capacity and diversity and shall reflect the distinctive characteristics of each company (principle 6).
The board should adopt a plan for its own work, work actively to develop its own competencies and evaluate its own activities (principle 8).
The board should act as a sparring partner for the management and contribute beyond its super- visory role. The board should contribute to the company’s strategic planning, risk management, talent development and follow up the company’s work with corporate social responsibility.
The board should work systematically and appropriately and put an adequate amount of work into the office. The board should develop its own work and evaluate its activities and competencies on an annual basis. The state as an owner assesses the board’s performance and makes changes to the board on the basis of this assessment. Remuneration of the members of the board shall contribute to the board having the right quality of expertise and reflect the board’s responsibilities and workload, and be moderate.
Good corporate governance
Ownership decisions and resolutions shall be made at the general meeting (principle 3).
The board assumes executive responsibil-ity for administration of the company, including performing an independent supervisory function vis-à-vis the company’s management on behalf of the owners (principle 7).
The board is responsible for elaborating explicit objectives and strategies for the company within the constraints of its articles of association; the state sets performance targets for each company (principle 4).
Compensation and incentive schemes shall promote value creation within the companies and be generally regarded as reasonable (principle 9).
Matters that require the owners’ approval must be treated at the general meeting.
The board shall organise the business, hire the CEO and oversee the company’s operations. The board shall also ensure the strategic leadership and manage the company on the basis of the owners’ interests within the limits set at the general meeting. The board should be a resource, a discussion partner and a support for the company’s management. At the same time the board must monitor the management’s work and must therefore have an independent role.
The board is expected to draw up clear objectives and strategies for the company within the framework of the articles of association, manage company resources optimally and determine the company’s risk profile. The board ought to report on this so that the owners can monitor goal achievement and hold the board accountable for this. For companies where the state’s ownership has commercial objectives, the state as an owner sets expectations with respect to returns and dividends. In companies where the state’s ownership has sectoral policy objectives, the state as owner will strive to develop clear performance expectations and performance indicators.
Personnel policy should be characterised by inclusivity and diversity. The board should make sure the company has strategies and measures to promote equality and diversity in the company, including how the best expertise can be used in the company and measures to ensure more female senior executives.
Remuneration of senior executives should be competitive, but not wage leading. In addition, remuneration should be linked to the company’s goals.
Effective capital structure and suitable dividends
The capital structure of the company shall be appropriate given the objective and situation of the company (principle 5).
The company should have an appropriate capital structure that paves the way for long-term value creation, efficient goal achievement and lowest cost of capital. The board has overall responsibility for this.
The main purpose of the state’s commercial ownership is to achieve the highest possible return on invested capital over time. The state as an owner sets clear expectations for the companies regarding returns and dividends and expects the companies in categories 1–3 to deliver market return.
Sustainability and corpo- rate social responsibility integrated into the business
The company shall work systematically to safeguard its corporate social responsibil-ity (principle 10).
The state as an owner has general expectations related to corporate social responsibility and specific expectations within climate and the environment, human rights, employee rights, and transparency and corruption. The board is responsible for assessing how the expectations can best be followed up and that they are operationalised and reported on appropriately. Work on sustainability and corporate social responsibility shall support the shareholder value.
Transparency and good reporting
There shall be transparency in the state’s exercise of its ownership and the company’s operations (principle 2).
All shareholders shall be treated equally. (principle 1).
The state expects that companies with state ownership are open about important matters related to the business. Access to relevant and timely information enables stakeholders to evaluate the companies’ operations on an ongoing basis and is a key prerequisite for good exercise of ownership.
Companies that are wholly owned by the state and that are not “small enterprises” should strive to be as open as listed companies. All companies that are wholly owned by the state should follow the Norwegian Code of Practice for Corporate Governance where appropriate.
The companies should treat all shareholders equally, for example when it comes to disclosure of information. The board should ensure that the company has a high degree of transparency towards all shareholders.
Exercise of ownership that contributes to value creation
VisionValuesGoals
Business modelStrategy
Capital and resources
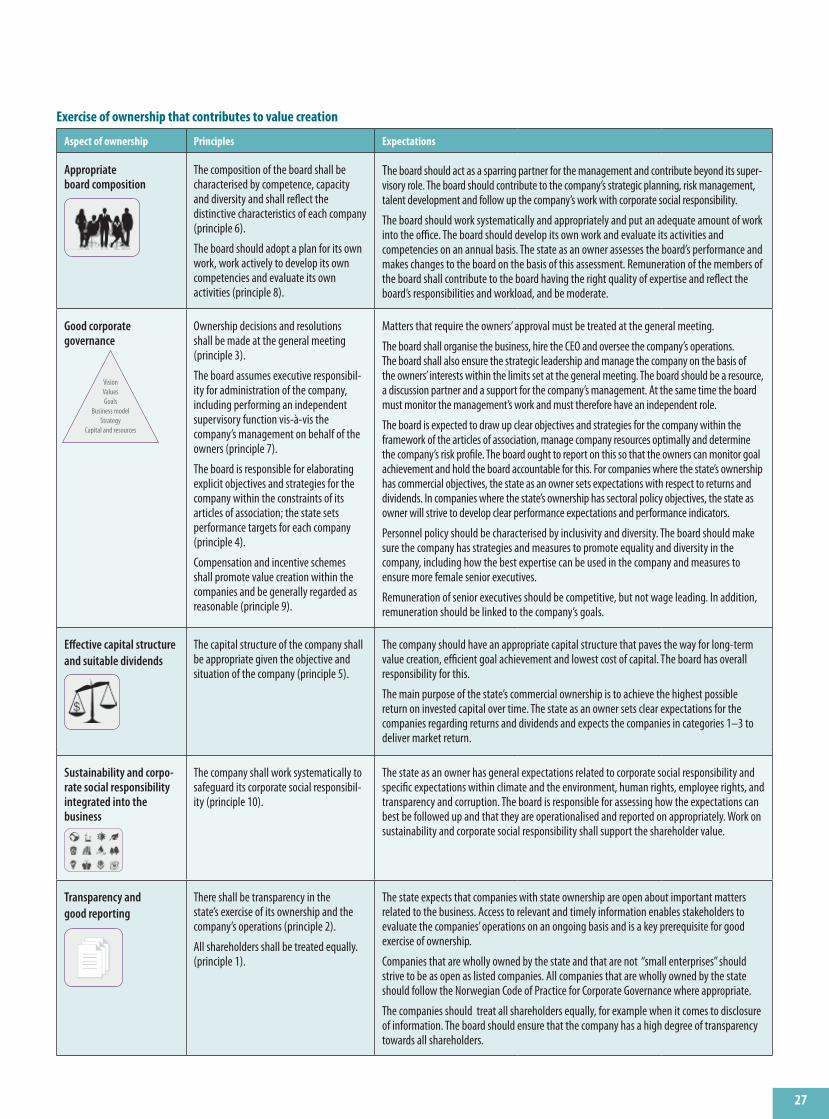
27
Aspect of ownership Principles Expectations
Appropriate board composition
The composition of the board shall be characterised by competence, capacity and diversity and shall reflect the distinctive characteristics of each company (principle 6).
The board should adopt a plan for its own work, work actively to develop its own competencies and evaluate its own activities (principle 8).
The board should act as a sparring partner for the management and contribute beyond its super- visory role. The board should contribute to the company’s strategic planning, risk management, talent development and follow up the company’s work with corporate social responsibility.
The board should work systematically and appropriately and put an adequate amount of work into the office. The board should develop its own work and evaluate its activities and competencies on an annual basis. The state as an owner assesses the board’s performance and makes changes to the board on the basis of this assessment. Remuneration of the members of the board shall contribute to the board having the right quality of expertise and reflect the board’s responsibilities and workload, and be moderate.
Good corporate governance
Ownership decisions and resolutions shall be made at the general meeting (principle 3).
The board assumes executive responsibil-ity for administration of the company, including performing an independent supervisory function vis-à-vis the company’s management on behalf of the owners (principle 7).
The board is responsible for elaborating explicit objectives and strategies for the company within the constraints of its articles of association; the state sets performance targets for each company (principle 4).
Compensation and incentive schemes shall promote value creation within the companies and be generally regarded as reasonable (principle 9).
Matters that require the owners’ approval must be treated at the general meeting.
The board shall organise the business, hire the CEO and oversee the company’s operations. The board shall also ensure the strategic leadership and manage the company on the basis of the owners’ interests within the limits set at the general meeting. The board should be a resource, a discussion partner and a support for the company’s management. At the same time the board must monitor the management’s work and must therefore have an independent role.
The board is expected to draw up clear objectives and strategies for the company within the framework of the articles of association, manage company resources optimally and determine the company’s risk profile. The board ought to report on this so that the owners can monitor goal achievement and hold the board accountable for this. For companies where the state’s ownership has commercial objectives, the state as an owner sets expectations with respect to returns and dividends. In companies where the state’s ownership has sectoral policy objectives, the state as owner will strive to develop clear performance expectations and performance indicators.
Personnel policy should be characterised by inclusivity and diversity. The board should make sure the company has strategies and measures to promote equality and diversity in the company, including how the best expertise can be used in the company and measures to ensure more female senior executives.
Remuneration of senior executives should be competitive, but not wage leading. In addition, remuneration should be linked to the company’s goals.
Effective capital structure and suitable dividends
The capital structure of the company shall be appropriate given the objective and situation of the company (principle 5).
The company should have an appropriate capital structure that paves the way for long-term value creation, efficient goal achievement and lowest cost of capital. The board has overall responsibility for this.
The main purpose of the state’s commercial ownership is to achieve the highest possible return on invested capital over time. The state as an owner sets clear expectations for the companies regarding returns and dividends and expects the companies in categories 1–3 to deliver market return.
Sustainability and corpo- rate social responsibility integrated into the business
The company shall work systematically to safeguard its corporate social responsibil-ity (principle 10).
The state as an owner has general expectations related to corporate social responsibility and specific expectations within climate and the environment, human rights, employee rights, and transparency and corruption. The board is responsible for assessing how the expectations can best be followed up and that they are operationalised and reported on appropriately. Work on sustainability and corporate social responsibility shall support the shareholder value.
Transparency and good reporting
There shall be transparency in the state’s exercise of its ownership and the company’s operations (principle 2).
All shareholders shall be treated equally. (principle 1).
The state expects that companies with state ownership are open about important matters related to the business. Access to relevant and timely information enables stakeholders to evaluate the companies’ operations on an ongoing basis and is a key prerequisite for good exercise of ownership.
Companies that are wholly owned by the state and that are not “small enterprises” should strive to be as open as listed companies. All companies that are wholly owned by the state should follow the Norwegian Code of Practice for Corporate Governance where appropriate.
The companies should treat all shareholders equally, for example when it comes to disclosure of information. The board should ensure that the company has a high degree of transparency towards all shareholders.
Exercise of ownership that contributes to value creation
VisionValuesGoals
Business modelStrategy
Capital and resources

28
Appropriate board composition One of the most important tasks of the state as an owner is to contribute to well-structured, competent boards. The goal is that as a whole the board (of each compa-ny) possesses the relevant expertise and experience appropriate to the company’s operations, opportunities and challenges and to the objectives of the state’s owner-ship. To this end the state emphasizes that the board has a broad spectrum of compe-tencies and experience and that the board members have sufficient capacity to per-form their duties (cf. the state’s principles for good corporate governance).1
Competence is the decisive criterion when the state seeks candidates for board positions, and this implies that the candi-dates have relevant experience and back-ground as well as personal aptitude. Using the required basic competencies as its starting point, the state will help ensure that each board represents a relevant diver-sity. The state strives for an equal gender board representation and has an ambition to increase female board chairs in compa-nies with state ownership. It is also an ob-jective to avoid that the same candidates are represented on too many boards of the companies with state ownership.
In 2015 the state as an owner recruited 61 new board members in 32 companies.
The board recruitment is a structured process taking place throughout the year, where the state as owner assess aspects as the board’s composition, work method, competencies, effort, target performance and contribution to value creation, and if there are need for changes. In this process the ministries managing the state’s owner-ship conduct annual meetings with all the owner-appointed board members in com-panies wholly owned by the state. The min-istries also strive to meet with representa-tives elected by the employees. In the listed companies that have a nomination commit-tee, it is the committee that conduct the meetings with the board members.
The assessment of the company’s busi-ness, the opportunities and challenges and other factors that may influence the board composition in the coming term form the ba-sis for a competence description for each board. The competence description is the mandate for the the board recruitment and what the state use in its search for new board members. Several hundred candidates are identified and assessed each year. The minis-tries, or the nomination committees, conduct interviews and draft recommendations before the board elections at the general meeting.
In 2015 the Ministry of Trade, Industry and Fisheries organised a seminar for board chairs and an own seminar for new board members in companies with state ownership. The seminars purpose is to cre-ate an arena for exchange of experience on good board practice and to increase know-ledge about the state as an owner.
The table on pages 30 and 31 shows the gender distribution on boards in compa-nies with state ownership. The average proportion of women on boards was 46% at 31 March 2016, up from 44% last year. The proportion of women among the owner-ap-pointed / shareholder-elected board mem-bers was 47%, the same as last year. The proportion of women among the board chairs was 43%, (292 of 67), up from 38% last year (25 of 65).
The remuneration of board members is determined by the general meeting or corporate assembly. The remuneration should reflect the board’s responsibilities, its competence, the time spent and the complexity of the business. The state em-phasizes market practice in the relevant industry, wage growth in Norway and comparisons with similar companies. At the same time the remuneration shall be moderate.
The table on page 29 shows the remu-neration of the chair of the board, the dep-uty chair and the members, as well as the total board remuneration in the compa-nies with state ownership.
Good corporate governanceCorporate governance comprises the frame-works which the company operates within, how decisions are made in the company, the basis for the governance of the company, and how its resources are managed.
Follow-up of the companies’ corporate governance is a key element in the state’s exercise of its ownership. As an owner, the state exercises its authority as a sharehold-er at the general meeting and has no au-thority in the company outside the general meeting. Within the framework of corpo-rate and securities legislation and princi-ples for good corporate governance, the ministries have regular meetings with the company’s management and the board as a central part of the follow-up.3 At these meet-ings, the state may, like other sharehold-ers, raise any matter that the companies ought to consider in connection with their operations. The opinions expressed by the state are input to the company’s manage-ment and board. This may be in quarterly meetings, annual meetings to discuss cor-porate social responsibility, or meetings re-garding specific issues. The topics raised at meetings may include a review of financial performance, communication of the state’s expectations with respect to returns and dividends, information and discussion about strategic matters, and issues related to corporate social responsibility.
Pay and incentive systems are central to corporate governance because they af-
fect the company’s ability to achieve its goals. The state emphasizes companies’ pay and incentive systems, and this may be a topic in the ownership dialogue. The board’s report on executive remuneration is discussed as a separate issue at the gen-eral meeting / company meeting of most companies with state ownership. The ta-ble on page 32 presents the total remuner-ation4 paid to the CEOs of companies with state ownership broken down into fixed pay, variable pay in the form of long-term incentive schemes and bonuses, other re-muneration and pension costs in 2015.
The following topics are typically ad-dressed in the ownership dialogue:
– What are the company’s main objec-tives, financial and other, and how are they measured and managed?
– How does the company gain insight into the indicators, parameters and stakeholders that have the greatest im-pact on value creation in the company?
– What measures does the company take to achieve its goals?
– How does the board follow up the com-pany’s defined strategy?
– How does the company work on man-aging its resources – financial, physical and human capital (including diversity and talent development)?
– Does the company have a strategy or es-tablished measures or goals to get more female managers and senior executives?
– If the management has variable remu-neration: how will the board ensure align-ment between the criteria for bonuses and the company’s goals and targets?
In addition to the dialogue that the state has with each individual company, the Ministry of Trade, Industry and Fisheries occasionally arranges meetings with all the companies in the Ministry’s portfolio. In August 2015 the Minister of Trade and Industry held a meeting with the company chairs in its portfolio to discuss the com-panies’ efforts for diversity and gender equality. The purpose was to meet the boards, communicate the state’s expecta-tions in this field, discuss the board’s role and work, and to facilitate experience sharing among the companies.
The table on pages 30 and 31 shows the gender distribution among senior execu-tives in companies with state ownership. At the end of 2015, the average proportion of women in group management positions at the companies was 32%. The average proportion of women at the level below group management and the total for both levels was 35% and 33% respectively. The proportion of women among chief execu-tives was 21%, (145 of 67), up from 20% the previous year (13 of 65).
1 See section 8.2 of the white paper Report no. 27 to the Storting (2013–2014).
4 The figures are based on the companies’ annual accounts.5 At the end of 2015, the following companies had a female CEO: Baneservice,
Flytoget, GIEK Kredittforsikring, Kommunalbanken, Den Nationale Scene, Graminor, Innovasjon Norge, Kimen Såvarelaboratoriet, Nationaltheatret, Nye Veier, Petoro, Store Norske Spitsbergen Kulkompani, Talent Norge and Helse Sør-Øst RHF.
2 At 31 March 2016, the following companies had female board chairs: Ambita, Entra, Flytoget, DNB, Telenor, Electronic Chart Centre, GIEK Kredittforsikring, Kommunalbanken, Bjørnøen, Den Nationale Scene, Den Norske Opera & Bal-lett, Eksportkreditt Norge, Kings Bay, Nationaltheatret, Norfund, Norwegian Seafood Council, Norsk Helsenett, Norsk Tipping, Petoro, Rogaland Teater, Simula Research Laboratory, Siva – Selskapet for Industrivekst, Staur gård, Store Norske Spitsbergen Kulkompani, UNINETT, University Centre in Svalbard, Vinmonopolet, Helse Nord RHF and Helse Sør-Øst RHF.
3 It is up to the board to decide the company’s attendance, including whether the board shall be represented (cf. section 13 of the Norwegian Code of Practice for Corporate Governance).

29
Remuneration to the board and auditor for 2015
NOK thousands Chair1 Deputy chair1 Board member1 Total board fees2 Total remuneration
to the auditionStatutory audit as a percentage
of total remuneration to the auditor
Listed companiesDNB ASA 500 320 316 3 211 45 724 62 %Entra ASA 422 212 212 1 890 4 359 60 %Kongsberg Gruppen ASA 432 233 218 2 253 16 681 56 %Norsk Hydro ASA 600 376 329 4 595 27 000 93 %SAS AB3 410 242 207 2 610 8 507 78 %Statoil ASA 743 474 379 5 950 63 000 78 %Telenor ASA 588 340 294 5 000 69 900 52 %Yara International ASA 515 340 297 3 161 45 288 88 %
Unlisted companies in categories 1–3Ambita AS 246 123 123 939 489 45 %Baneservice AS 385 232 193 1 791 618 78 %Flytoget AS 254 139 126 1 185 424 65 %Mesta AS 380 – 195 2 066 1 856 56 %Veterinærmedisinsk Oppdragssenter AS 75 55 55 300 192 80 %Aker Kværner Holding AS 200 133 133 855 31 100 %Nammo AS 290 250 163 1 533 7 157 64 %Aerospace Industrial Maintenance Norway SF 300 200 150 1 055 1 062 97 %Argentum Fondsinvesteringer AS 310 170 158 974 310 92 %Eksportfinans ASA 361 289 248 2 004 3 800 55 %Electronic Chart Centre AS 165 97 86 321 123 51 %GIEK Kredittforsikring AS 250 150 150 1 288 350 62 %Investinor AS 230 144 144 873 487 93 %Kommunalbanken AS 290 150 140 1 913 2 004 55 %NSB AS 416 252 207 2 029 5 736 78 %Posten Norge AS 416 252 207 2 471 11 749 75 %Statkraft SF 484 341 281 3 154 27 672 71 %
Companies in category 4Andøya Space Center AS 103 34 34 290 349 62 %Avinor AS 416 252 207 2 490 2 136 48 %Bjørnøen AS 27 10 10 78 21 62 %Carte Blanche AS 64 33 –4 221 126 82 %AS Den Nationale Scene 105 60 –4 231 185 79 %Den Norske Opera & Ballett AS 165 120 –4 527 315 86 %Eksportkreditt Norge AS 309 – 186 1 297 299 84 %Enova SF 380 228 193 1 106 203 30 %Gassco AS 379 241 193 1 781 1 013 100 %Gassnova SF 380 228 193 1 155 293 21 %Graminor AS 70 35 35 280 85 92 %Innovasjon Norge 289 173 144 1 637 1 098 59 %Kimen Såvarelaboratoriet AS 42 21 21 126 36 100 %Kings Bay AS 155 93 93 456 144 65 %Nationaltheatret AS 123 65 –4 377 235 87 %Nofima AS 124 47 47 802 683 35 %Nordisk Institutt for Odontologiske Materialer AS 70 – 5 152 95 74 %Norfund 185 – 100 727 1 044 49 %Norges sjømatråd AS 150 110 75 840 82 100 %Norsk Helsenett SF 255 165 133 959 167 66 %Norsk rikskringkasting AS 247 146 108 1 037 1 064 56 %Norsk Tipping AS 232 149 127 1 224 583 97 %NSD – Norsk senter for forskningsdata AS 85 – 43 340 127 65 %Nye Veier AS 1 289 40 38 %Petoro AS 390 252 204 1 737 3 200 13 %Rogaland Teater AS 68 33 –4 175 152 82 %Simula Research Laboratory AS 85 – 43 461 265 66 %Siva – Selskapet for Industrivekst SF 214 150 135 1 174 444 85 %Space Norway AS 134 – 80 416 281 60 %Statnett SF 404 266 215 2 445 2 018 67 %Statskog SF 173 116 93 754 636 55 %Staur gård AS 60 30 30 200 30 100 %Store Norske Spitsbergen Kulkompani AS 303 165 152 1 364 755 83 %Talent Norge AS 150 – 75 525 30 100 %Trøndelag Teater AS 86 45 –4 166 163 85 %UNINETT AS 85 – 43 349 262 52 %Universitetssenteret på Svalbard AS 85 47 43 525 169 64 %AS Vinmonopolet 240 160 130 1 358 822 86 %
Regional health authoritesHelse Midt-Norge RHA 235 157 114 1 211 1 670 91 %Helse Nord RHA 235 157 114 1 256 3 203 46 %Helse Sør-Øst RHA 335 228 126 1 717 20 892 28 %Helse Vest RHA 235 157 114 1 263 7 355 40 %
1 Remuneration of the chair, deputy chair and board members as approved at the annual general meeting / corporate assembly or by the board of representatives in 2015.
2 Total remuneration of board members is the ordinary remuneration that has been paid and remuneration for work on committees under the board, as stated in the companies’ annual reports for 2015.
3 The amounts for SAS are in Norwegian kroner. The exchange rate used is the average NOK / SEK exchange rate for 2015 of 94.52.
4 The board members are remunerated per board meeting or per hour and do not have a fixed fee.
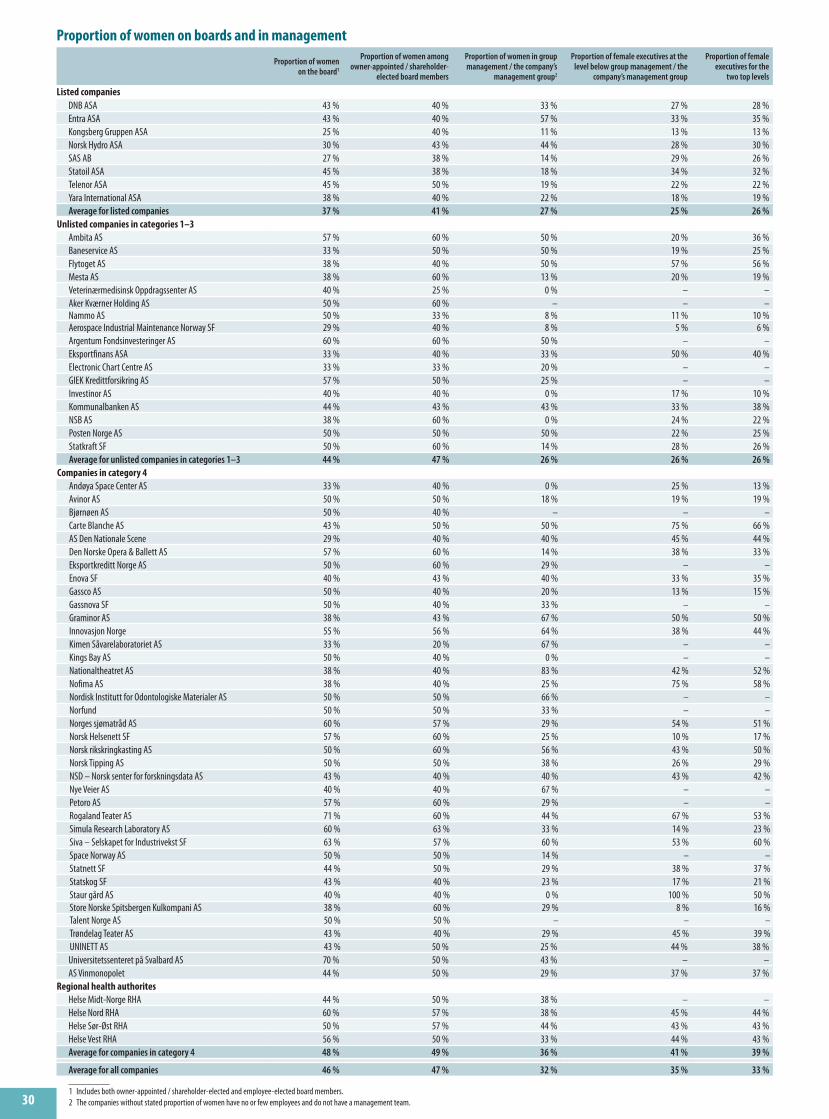
30
Proportion of women on boards and in managementProportion of women
on the board1
Proportion of women among owner-appointed / shareholder-
elected board members
Proportion of women in group management / the company’s
management group2
Proportion of female executives at the level below group management / the
company’s management group
Proportion of female executives for the
two top levels
Listed companiesDNB ASA 43 % 40 % 33 % 27 % 28 %Entra ASA 43 % 40 % 57 % 33 % 35 %Kongsberg Gruppen ASA 25 % 40 % 11 % 13 % 13 %Norsk Hydro ASA 30 % 43 % 44 % 28 % 30 %SAS AB 27 % 38 % 14 % 29 % 26 %Statoil ASA 45 % 38 % 18 % 34 % 32 %Telenor ASA 45 % 50 % 19 % 22 % 22 %Yara International ASA 38 % 40 % 22 % 18 % 19 %Average for listed companies 37 % 41 % 27 % 25 % 26 %
Unlisted companies in categories 1–3Ambita AS 57 % 60 % 50 % 20 % 36 %Baneservice AS 33 % 50 % 50 % 19 % 25 %Flytoget AS 38 % 40 % 50 % 57 % 56 %Mesta AS 38 % 60 % 13 % 20 % 19 %Veterinærmedisinsk Oppdragssenter AS 40 % 25 % 0 % – –Aker Kværner Holding AS 50 % 60 % – – –Nammo AS 50 % 33 % 8 % 11 % 10 %Aerospace Industrial Maintenance Norway SF 29 % 40 % 8 % 5 % 6 %Argentum Fondsinvesteringer AS 60 % 60 % 50 % – –Eksportfinans ASA 33 % 40 % 33 % 50 % 40 %Electronic Chart Centre AS 33 % 33 % 20 % – –GIEK Kredittforsikring AS 57 % 50 % 25 % – –Investinor AS 40 % 40 % 0 % 17 % 10 %Kommunalbanken AS 44 % 43 % 43 % 33 % 38 %NSB AS 38 % 60 % 0 % 24 % 22 %Posten Norge AS 50 % 50 % 50 % 22 % 25 %Statkraft SF 50 % 60 % 14 % 28 % 26 %Average for unlisted companies in categories 1–3 44 % 47 % 26 % 26 % 26 %
Companies in category 4Andøya Space Center AS 33 % 40 % 0 % 25 % 13 %Avinor AS 50 % 50 % 18 % 19 % 19 %Bjørnøen AS 50 % 40 % – – –Carte Blanche AS 43 % 50 % 50 % 75 % 66 %AS Den Nationale Scene 29 % 40 % 40 % 45 % 44 %Den Norske Opera & Ballett AS 57 % 60 % 14 % 38 % 33 %Eksportkreditt Norge AS 50 % 60 % 29 % – –Enova SF 40 % 43 % 40 % 33 % 35 %Gassco AS 50 % 40 % 20 % 13 % 15 %Gassnova SF 50 % 40 % 33 % – –Graminor AS 38 % 43 % 67 % 50 % 50 %Innovasjon Norge 55 % 56 % 64 % 38 % 44 %Kimen Såvarelaboratoriet AS 33 % 20 % 67 % – –Kings Bay AS 50 % 40 % 0 % – –Nationaltheatret AS 38 % 40 % 83 % 42 % 52 %Nofima AS 38 % 40 % 25 % 75 % 58 %Nordisk Institutt for Odontologiske Materialer AS 50 % 50 % 66 % – –Norfund 50 % 50 % 33 % – –Norges sjømatråd AS 60 % 57 % 29 % 54 % 51 %Norsk Helsenett SF 57 % 60 % 25 % 10 % 17 %Norsk rikskringkasting AS 50 % 60 % 56 % 43 % 50 %Norsk Tipping AS 50 % 50 % 38 % 26 % 29 %NSD – Norsk senter for forskningsdata AS 43 % 40 % 40 % 43 % 42 %Nye Veier AS 40 % 40 % 67 % – –Petoro AS 57 % 60 % 29 % – –Rogaland Teater AS 71 % 60 % 44 % 67 % 53 %Simula Research Laboratory AS 60 % 63 % 33 % 14 % 23 %Siva – Selskapet for Industrivekst SF 63 % 57 % 60 % 53 % 60 %Space Norway AS 50 % 50 % 14 % – –Statnett SF 44 % 50 % 29 % 38 % 37 %Statskog SF 43 % 40 % 23 % 17 % 21 %Staur gård AS 40 % 40 % 0 % 100 % 50 %Store Norske Spitsbergen Kulkompani AS 38 % 60 % 29 % 8 % 16 %Talent Norge AS 50 % 50 % – – –Trøndelag Teater AS 43 % 40 % 29 % 45 % 39 %UNINETT AS 43 % 50 % 25 % 44 % 38 %Universitetssenteret på Svalbard AS 70 % 50 % 43 % – –AS Vinmonopolet 44 % 50 % 29 % 37 % 37 %
Regional health authoritesHelse Midt-Norge RHA 44 % 50 % 38 % – –Helse Nord RHA 60 % 57 % 38 % 45 % 44 %Helse Sør-Øst RHA 50 % 57 % 44 % 43 % 43 %Helse Vest RHA 56 % 50 % 33 % 44 % 43 %Average for companies in category 4 48 % 49 % 36 % 41 % 39 %
Average for all companies 46 % 47 % 32 % 35 % 33 %
1 Includes both owner-appointed / shareholder-elected and employee-elected board members.2 The companies without stated proportion of women have no or few employees and do not have a management team.

31
Gender distribution on the boards at 31 March 2016
Women 46 %
Men 54 %
Gender distribution among chairs at 31 March 2016
Women43 %
Men 57 %
Gender distribution among owner-appointed / shareholder-elected board members at 31 March 2016
Women47 %
Men 53 %
0 %
5 %
10 %
15 %
20 %
25 %
30 %
35 %
40 %
45 %
50 %
2008 2009 2010 2011 2012 2013 2014 2015 2016
Gender distribution on the boards at 31 March 2008–2016
Gjennomsnittlig kvinneandel i styrer, totalt Gjennomsnittlig kvinneandel blant eieroppnevnte/aksjonærvalgte styremedlemmer Andel kvinner blant styreledere
Average proportionof women on the boards
Average proportionof women amongowner-appointed/shareholder-electedboard members
Proportion of women among chairs
Gender distribution on the boards at 31 March 2016
Women 46 %
Men 54 %
Gender distribution among chairs at 31 March 2016
Women43 %
Men 57 %
Gender distribution in group management /the company’s management group at year-end 2015
Women 32 %
Men 68 %
Gender distribution among owner-appointed / shareholder-elected board members at 31 March 2016
Women47 %
Men 53 %
0 %
5 %
10 %
15 %
20 %
25 %
30 %
35 %
40 %
45 %
50 %
2008 2009 2010 2011 2012 2013 2014 2015 2016
Gender distribution on the boards at 31 March 2008–2016
Gjennomsnittlig kvinneandel i styrer, totalt Gjennomsnittlig kvinneandel blant eieroppnevnte/aksjonærvalgte styremedlemmer Andel kvinner blant styreledere
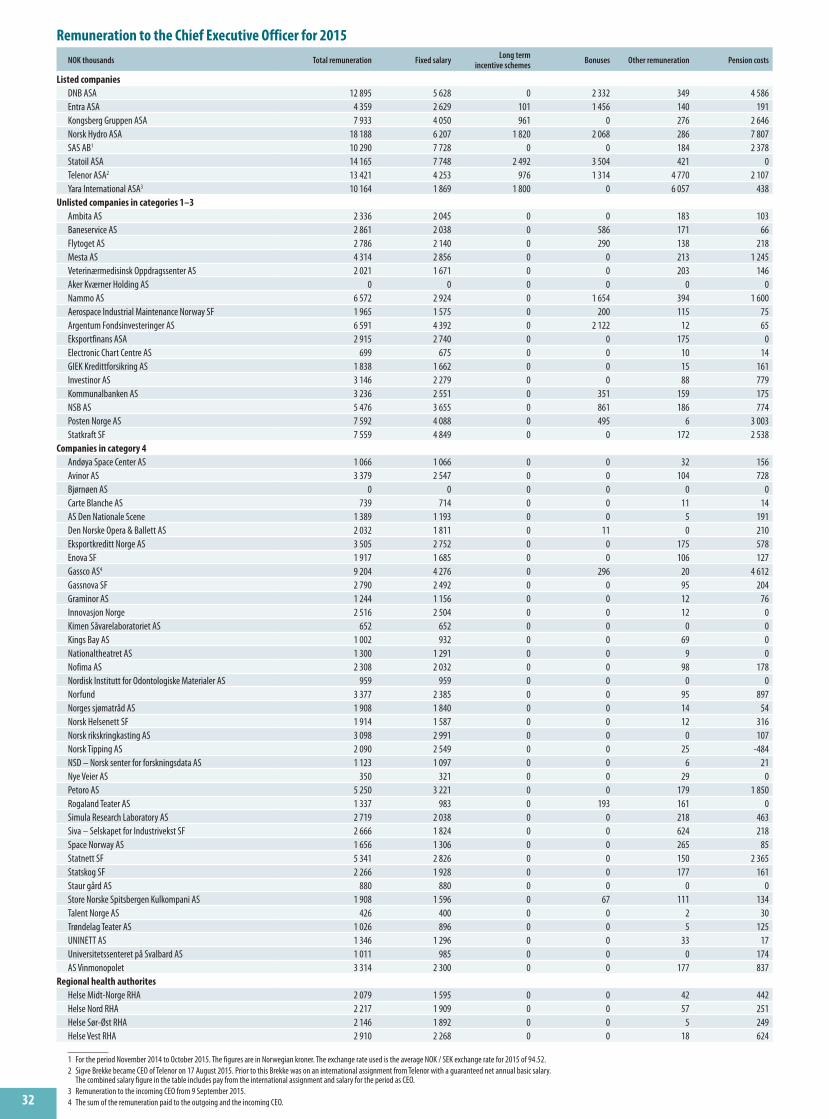
32
Remuneration to the Chief Executive Officer for 2015NOK thousands Total remuneration Fixed salary Long term
incentive schemes Bonuses Other remuneration Pension costs
Listed companiesDNB ASA 12 895 5 628 0 2 332 349 4 586Entra ASA 4 359 2 629 101 1 456 140 191Kongsberg Gruppen ASA 7 933 4 050 961 0 276 2 646Norsk Hydro ASA 18 188 6 207 1 820 2 068 286 7 807SAS AB1 10 290 7 728 0 0 184 2 378Statoil ASA 14 165 7 748 2 492 3 504 421 0Telenor ASA2 13 421 4 253 976 1 314 4 770 2 107Yara International ASA3 10 164 1 869 1 800 0 6 057 438
Unlisted companies in categories 1–3Ambita AS 2 336 2 045 0 0 183 103Baneservice AS 2 861 2 038 0 586 171 66Flytoget AS 2 786 2 140 0 290 138 218Mesta AS 4 314 2 856 0 0 213 1 245Veterinærmedisinsk Oppdragssenter AS 2 021 1 671 0 0 203 146Aker Kværner Holding AS 0 0 0 0 0 0Nammo AS 6 572 2 924 0 1 654 394 1 600Aerospace Industrial Maintenance Norway SF 1 965 1 575 0 200 115 75Argentum Fondsinvesteringer AS 6 591 4 392 0 2 122 12 65Eksportfinans ASA 2 915 2 740 0 0 175 0Electronic Chart Centre AS 699 675 0 0 10 14GIEK Kredittforsikring AS 1 838 1 662 0 0 15 161Investinor AS 3 146 2 279 0 0 88 779Kommunalbanken AS 3 236 2 551 0 351 159 175NSB AS 5 476 3 655 0 861 186 774Posten Norge AS 7 592 4 088 0 495 6 3 003Statkraft SF 7 559 4 849 0 0 172 2 538
Companies in category 4Andøya Space Center AS 1 066 1 066 0 0 32 156Avinor AS 3 379 2 547 0 0 104 728Bjørnøen AS 0 0 0 0 0 0Carte Blanche AS 739 714 0 0 11 14AS Den Nationale Scene 1 389 1 193 0 0 5 191Den Norske Opera & Ballett AS 2 032 1 811 0 11 0 210Eksportkreditt Norge AS 3 505 2 752 0 0 175 578Enova SF 1 917 1 685 0 0 106 127Gassco AS4 9 204 4 276 0 296 20 4 612Gassnova SF 2 790 2 492 0 0 95 204Graminor AS 1 244 1 156 0 0 12 76Innovasjon Norge 2 516 2 504 0 0 12 0Kimen Såvarelaboratoriet AS 652 652 0 0 0 0Kings Bay AS 1 002 932 0 0 69 0Nationaltheatret AS 1 300 1 291 0 0 9 0Nofima AS 2 308 2 032 0 0 98 178Nordisk Institutt for Odontologiske Materialer AS 959 959 0 0 0 0Norfund 3 377 2 385 0 0 95 897Norges sjømatråd AS 1 908 1 840 0 0 14 54Norsk Helsenett SF 1 914 1 587 0 0 12 316Norsk rikskringkasting AS 3 098 2 991 0 0 0 107Norsk Tipping AS 2 090 2 549 0 0 25 -484NSD – Norsk senter for forskningsdata AS 1 123 1 097 0 0 6 21Nye Veier AS 350 321 0 0 29 0Petoro AS 5 250 3 221 0 0 179 1 850Rogaland Teater AS 1 337 983 0 193 161 0Simula Research Laboratory AS 2 719 2 038 0 0 218 463Siva – Selskapet for Industrivekst SF 2 666 1 824 0 0 624 218Space Norway AS 1 656 1 306 0 0 265 85Statnett SF 5 341 2 826 0 0 150 2 365Statskog SF 2 266 1 928 0 0 177 161Staur gård AS 880 880 0 0 0 0Store Norske Spitsbergen Kulkompani AS 1 908 1 596 0 67 111 134Talent Norge AS 426 400 0 0 2 30Trøndelag Teater AS 1 026 896 0 0 5 125UNINETT AS 1 346 1 296 0 0 33 17Universitetssenteret på Svalbard AS 1 011 985 0 0 0 174AS Vinmonopolet 3 314 2 300 0 0 177 837
Regional health authoritesHelse Midt-Norge RHA 2 079 1 595 0 0 42 442Helse Nord RHA 2 217 1 909 0 0 57 251Helse Sør-Øst RHA 2 146 1 892 0 0 5 249Helse Vest RHA 2 910 2 268 0 0 18 624
1 For the period November 2014 to October 2015. The figures are in Norwegian kroner. The exchange rate used is the average NOK / SEK exchange rate for 2015 of 94.52.2 Sigve Brekke became CEO of Telenor on 17 August 2015. Prior to this Brekke was on an international assignment from Telenor with a guaranteed net annual basic salary.
The combined salary figure in the table includes pay from the international assignment and salary for the period as CEO.3 Remuneration to the incoming CEO from 9 September 2015. 4 The sum of the remuneration paid to the outgoing and the incoming CEO.

33
1 For listed companies, the market value of equity is used, while for unlisted companies total assets is used.2 The financing structure of financial institutions is not directly comparable with that of other companies.
It is therefore not relevant to include the figures for non-current interest-bearing liabilities for financial institutions.3 Tier 1 capital ratio is used for DNB, Eksportfinans, Investinor and Kommunalbanken. Capital ratio is used for GIEK Kredittforsikring.4 For Statoil, which pays dividends on a quarterly basis, the figure is paid dividends.5 Statoil posted a loss after tax and minority interests in 2015, meaning that the dividend percentage is irrelevant.
Capitalisation and dividend 2015 – companies in categories 1–3
NOK millionMarket value of equity/
total assets (statement of financial position total)1
Book equity Non-current interest- bearing liabilities2 Equity ratio Return on equity3 Dividend for the
2015 financial year4 Dividend percentage5
Listed companiesDNB ASA 178 842 190 078 – 15 % 15 % 7 330 30 %Entra ASA 13 091 13 354 12 083 40 % 22 % 551 21 %Kongsberg Gruppen ASA 17 400 6 127 866 32 % 12 % 510 68 %
Norsk Hydro ASA 68 546 79 329 3 969 65 % 3 % 2 042 101 %SAS AB 8 028 6 343 8 101 21 % 17 % 0 0 %Statoil ASA 394 436 355 100 275 300 37 % -10 % 22 958 –Telenor ASA 222 666 63 127 63 802 31 % 6 % 11 261 330 %Yara International ASA 105 329 75 727 9 354 64 % 12 % 4 113 51 %
Unlisted companies in categories 1–3
Ambita AS 160 96 0 60 % 45 % 3 9 %Baneservice AS 371 164 62 44 % 32 % 8 18 %Flytoget AS 1 393 802 0 58 % 23 % 181 100 %Mesta AS 2 262 1 003 9 44 % 35 % 300 90 %Veterinærmedisinsk Oppdragssenter AS 188 40 8 21 % 156 % 64 66 %
Aker Kværner Holding AS 5 579 5 577 0 100 % – 0 0 %Nammo AS 4 641 2 370 752 51 % 10 % 109 50 %
Aerospace Industrial Maintenance Norway SF 675 408 0 60 % 4 % 0 0 %Argentum Fondsinvesteringer AS 8 001 7 955 2 99 % 5 % 500 125 %Eksportfinans ASA 65 142 7 409 – 36 % -5 % 0 0 %Electronic Chart Centre AS 19 10 0 53 % 11 % 3 273 %GIEK Kredittforsikring AS 493 63 – 26 % 15 % 0 0 %Investinor AS 2 041 2 011 0 99 % 3 % 0 0 %Kommunalbanken AS 449 361 12 202 – 12 % 18 % 417 22 %NSB AS 28 836 9 838 10 387 34 % 24 % 595 28 %Posten Norge AS 16 099 5 926 2 111 37 % -1 % 0 0 %Statkraft SF 173 839 84 967 37 410 49 % -2 % 0 0 %
Effective capital structure and suitable dividends The board and management have been charged with managing the owner’s capi-tal. How the company applies and allocates capital has a major impact on the compa-ny’s value creation. All companies should have an effective mix of debt and equity that paves the way for long-term value creation, efficient goal achievement and lowest cost of capital. Too much equity may lead to low returns on equity and may lead to low investment discipline, while too much debt could incur extensive fund-ing costs and increased risk of bankrupt-cy. The capital structure shall be adapted to the company’s objectives, strategy and risk profile. The board has an overall re-sponsibility to balance this appropriately.
The main purpose of the state’s com-mercial ownership (the companies in cat-egories 1–3) is to achieve the highest pos-
sible return on invested capital over time. The return is measured by the sum of changes in market value of a company’s equity and direct returns in the form of dividends and any buy-back of own shares for cancellation.
As part of its exercise of ownership, the state assesses the companies’ capitalisation and defines target rates of return6 and divi-dend expectations for each company in cat-egories 1–3. Target rates of return and long-term dividend expectations generally apply for a period of three to five years. In addition, the state defines annual dividend expectations. Factors considered in the state’s assessments include the company’s earnings outlook, investment history, in-vestment needs, maturity, growth plans, yield prospects, liquidity and capital cost. Target rates of return and dividend expec-
tations are communicated to each company and are included in the discussions with the company about value growth, profitabil-ity and capital structure, etc.
The state does not have target rates of return for companies that are not based on commercial operation or that are depend-ent on state subsidies. These companies follow the Storting’s Appropriation Regu-lations. The state as an owner expects these companies to operate efficiently and follows this up in its ownership dialogue with the companies.
The Ministry of Trade, Industry and Fisheries revised its long-term dividend expectations for all the companies in cate-gories 1–3 in the portfolio in 2015.
On the previous page is an overview of the relevant figures in terms of the capital structure of the companies in categories 1–3, including figures that provide a snap-shot of the companies’ use of their equity.
6 Target return means the return an investor can expect to receive over time taking into account risk, i.e. a benchmark return.

34
Sustainability and corporate social responsibility integrated into the businessAs an owner, the state wants the compa-nies to maintain and develop value over time. This requires sustainable resource management based on long-term deci-sions, which in turn includes an under-standing of the interaction between the company and society. One aspect of sus-tainability may be the ability to stay ahead of changes in the company’s surround-ings and stakeholders, and adapt the com-pany’s strategy accordingly. Systematic mapping of key stakeholders and how changes affect the company and decisive parameters may be a part of this. Work on corporate social responsibility and sus-tainability is therefore not to be treated as an isolated area in the company, but should affect the company’s goals, posi-tioning and strategy.
The state as an owner expects the com-panies to work on corporate social respon-sibility both because the state believes this helps protect the state’s shareholder value and because companies with state ownership shall act in an ethically correct manner. The state expects companies with state ownership to systematically manage and fulfil their corporate social responsibilities. This should also support the company’s business development. Corporate social responsibility includes responsibilities that companies are ex-pected to assume for people, communities and the environment that are affected by their operations. The state expects the companies’ work on corporate social re-sponsibility to be integrated into the work of and supported by the boards and that they report on significant areas in their annual report.
Sustainability and corporate social re-sponsibility are integrated into the state’s exercise of ownership. The state’s expec-tations are communicated and followed up in the dialogue with the companies. Expectations regarding the companies’ corporate social responsibility are dis-cussed in particular at the annual meeting on corporate social responsibility. Corpo-rate social responsibility is also raised in the quarterly meetings, if and when nec-essary, or via other forms of contact.
The ownership dialogue is normally adapted to the individual company, with a view to ensuring that it is relevant in the light of the distinctive nature, risk and op-erations of each company. In the meetings
on corporate social responsibility, the state emphasizes the companies report-ing on significant aspects of corporate so-cial responsibility based on the company’s operations, including relevant areas for which the state has expressed expecta-tions. The companies are best placed to make these assessments. In addition, the state may raise matters if and when deemed necessary.
Prior to the meetings on corporate so-cial responsibility, the state assesses what it is relevant to discuss at the meeting for each company. Topics that are raised may vary between companies and over the years, based on assessments of what is considered to be material. These assess-ments are based on the information and analysis including: the state’s expecta-tions, information from previous meet-ings where corporate social responsibility has been discussed, the company’s annu-al report / sustainability report, websites, and any other relevant information. The state is especially interested in the guide-lines, systems and measures that the companies have implemented in areas they believe are significant, and how the board is involved in and works on these issues.
Below are examples of some general and some more specific issues that the state may raise with the companies in the ownership dialogue.
– How is the work on corporate social re-sponsibility organised in the company?
– What role does the board play in identi-fying, managing and monitoring corpo-rate social responsibility?
– How does the company define goals and follow-up plans for the most relevant corporate social responsibility topics?
– Does the company have an understand-ing of what is the biggest risk linked to climate change and climate regula-tions?
– Does the company have guidelines and measures to reduce the risk of corrup-tion?
The table on page 35 shows the compa-nies’ respons to some of the questions asked. The answers may provide an indi-cation of whether the companies are fol-lowing up some of the state’s individual expectations related to corporate social responsibility. The relevance and the com-panies’ interpretation of the questions may differ between companies. The board
is responsible for assessing how the ex-pectations can best be followed up and that they are operationalised and reported on appropriately. The state expects the companies to report on significant issues and explain if they do not comply with the state’s expectations, which they may have good reasons not to do (the “comply or explain” principle). The reasons for any non-compliances are not presented in the table; the results should therefore be in-terpreted with caution.
The companies have been given the op-portunity to highlight specific areas with-in corporate social responsibility that they have worked on in 2015 in the company reports, which start on page 41.
Transparency and good reportingAccess to relevant information about a company is a key prerequisite for a re-sponsible exercise of ownership. It may also influence the access to capital mar-kets and the legitimacy among the com-pany’s stakeholders. Relevant, and timely information enables the owners to evalu-ate the companies’ activities, perfor-mance, development and goal achieve-ment on an ongoing basis.
The state obtains relevant information from quarterly reports and annual re-ports, other publicly available informa-tion, general meetings and the ownership dialogue. The state’s expectations of transparency and reporting apply to the areas described throughout this chapter, including the board and its work, corpo-rate governance, capital structure and dividend, and sustainability and corporate social responsibility. Expectations are communicated in the ownership dialogue and are assessed specially in connection with the preparations for the general meeting when the company’s annual re-port and annual accounts are to be ap-proved.
A number of factors can form the basis for understanding the opportunities and risks facing the company. In order to exer-cise good ownership, the state needs to understand which factors that might im-pact the company’s value creation. These may include how the company is affected by global challenges such as population growth, resource scarcity, changes in commodity prices, political unrest and cli-mate change, the company’s strategic competition, the company’s main stake-holders, the goals set by the board and which resources are essential.

35
Corporate social responsibility
Does the company have publicly
available ethical guidelines?
Does the company have publicly available guidelines for its work
on corporate social responsibility?
Is the work on climate and the environment, human rights, employee
rights and for transparency and against corruption integrated in the corporate
social responsibility guidelines?
Does the company report on corporate social responsibility in accordance with
GRI?1?
Does the company adhere to the OECD
guidelines for multi- national companies?
Does the company have any other, more specific
company or industry-oriented guidelines for its reporting?
Listed companiesDNB ASA Yes Yes Yes Yes Yes YesEntra ASA Yes Yes Yes No N/A NoKongsberg Gruppen ASA Yes Yes Yes Yes Yes NoNorsk Hydro ASA Yes Yes Yes Yes Yes YesSAS AB Yes Yes Yes Yes Yes NoStatoil ASA Yes Yes Yes Yes Yes YesTelenor ASA Yes Yes Yes Yes Yes YesYara International ASA Yes Yes Yes Yes Yes N/A
Unlisted companies in categories 1–3Ambita AS Yes Yes Yes No No NoBaneservice AS Yes Yes Yes No No NoFlytoget AS Yes Yes Yes Yes No YesMesta AS Yes Yes Yes No No YesVeterinærmedisinsk Oppdragssenter AS No No No No No NoAker Kværner Holding AS2 N/A N/A N/A N/A N/A N/ANammo AS Yes Yes Yes Yes Yes YesAerospace Industrial Maintenance Norway SF No No Yes No Yes YesArgentum Fondsinvesteringer AS Yes Yes Yes No Yes YesEksportfinans ASA Yes Yes Yes No No NoElectronic Chart Centre AS Yes Yes No No No NoGIEK Kredittforsikring AS Yes Yes No No No YesInvestinor AS Yes Yes Yes No Yes NoKommunalbanken AS Yes Yes Yes No N/A NoNSB AS Yes Yes Yes No N/A YesPosten Norge AS Yes Yes Yes Yes Yes YesStatkraft SF Yes Yes Yes Yes Yes Yes
Companies in category 4Andøya Space Center AS No No No N/A N/A N/AAvinor AS Yes Yes Yes Yes No NoBjørnøen AS3 N/A N/A N/A N/A N/A N/ACarte Blanche AS No No No No No YesAS Den Nationale Scene Yes Yes Yes No No NoDen Norske Opera & Ballett AS No No No No No NoEksportkreditt Norge AS Yes Yes Yes No Yes YesEnova SF Yes Yes Yes No N/A NoGassco AS Yes Yes Yes No Yes YesGassnova SF Yes Yes Yes No No NoGraminor AS No No No N/A N/A N/AInnovasjon Norge Yes Yes Yes No Yes NoKimen Såvarelaboratoriet AS No No No No No NoKings Bay AS Yes Yes Yes N/A N/A N/ANationaltheatret AS No No Yes No No YesNofima AS Yes No Yes No Yes YesNordisk Institutt for Odontologiske Materialer AS No No No No Yes NoNorfund Yes Yes Yes No Yes NoNorges sjømatråd AS Yes Yes Yes No No NoNorsk Helsenett SF Yes Yes No No N/A NoNorsk rikskringkasting AS Yes No No N/A N/A NoNorsk Tipping AS Yes No No Yes No YesNSD – Norsk senter for forskningsdata AS Yes Yes No No No NoNye Veier AS Yes Yes Yes No No YesPetoro AS Yes Yes No Yes No YesRogaland Teater AS No No No No No YesSimula Research Laboratory AS Yes No No N/A N/A NoSiva – Selskapet for Industrivekst SF Yes Yes Yes No N/A NoSpace Norway AS Yes Yes Yes No No NoStatnett SF Yes Yes Yes Yes N/A YesStatskog SF Yes Yes Yes N/A N/A NoStaur gård AS No No No No No NoStore Norske Spitsbergen Kulkompani AS Yes Yes Yes No N/A N/ATalent Norge AS No No No No No NoTrøndelag Teater AS No No Yes N/A N/A YesUNINETT AS Yes Yes No No No NoUniversitetssenteret på Svalbard AS Yes No No No N/A NoAS Vinmonopolet Yes Yes Yes No N/A No
Regional health authoritesHelse Midt-Norge RHA Yes Yes Yes No No NoHelse Nord RHA Yes No No N/A N/A NoHelse Sør-Øst RHA Yes Yes Yes N/A N/A YesHelse Vest RHA Yes No Yes No No Yes
1 Global Reporting Initiative. 2 Aker Kværner Holding is a holding company without any employees. The questions are therefore not relevant for this company.3 Bjørnøen is managed by Kings Bay and does not have any employees. Comments that apply to Kings Bay also apply to Bjørnøen.

36
of emerging market economies where SOEs are more prevalent.
As the OECD has repeatedly said, a rise in cross-border activity by SOEs is not nec-essarily a cause for concern. But if SOEs benefit from undue advantages in their home economies – such as below market financing costs – then there is a risk of re-source misallocation and, in the longer term, a protectionist backlash from other countries. Ensuring that SOEs operate ef-ficiently, transparently and on equal foot-ing with private companies is therefore crucial for maintaining an open global economy, which is in the interest of us all.
The new GuidelinesThe evolving presence of SOEs has heightened the need for policy makers to implement the standards of good govern-ance embodied in the SOE Guidelines. The SOE Guidelines were first developed in 2005 to give governments a blueprint for establishing good practices for institu-tional, regulatory and corporate govern-ance arrangements to maximise the eco-nomic benefits of SOEs.
Research undertaken by the OECD in-dicates that past national SOE reforms have been broadly consistent with the rec-ommendations established by the SOE Guidelines. For example, significant ac-tion has been taken across the world, in-cluding in Norway, to strengthen and pro-fessionalise the state’s ownership function.
Greater centralisation of ownership within specialised bodies has been helpful in sep-arating the state’s role as an owner from other potentially conflicting functions, such as market regulation or sectoral poli-cy. Many countries have also made signifi-cant progress in enhancing transparency and accountability, including by develop-ing state ownership policies. A growing number of countries have also begun pub-lishing aggregate reports on state owner-ship such as the present publication.
SOEs should create value for the citizens who are the ultimate owners Governments own enterprises for a num-ber of reasons, ranging from maintaining strategic sectors under state control, to developing national champions, to operat-ing “natural monopolies” where direct ownership is deemed more efficient or feasible than regulating private monopo-lies.
The revised SOE Guidelines state in a bolder way that the purpose of state own-ership should be to create value – wheth-er this value takes the form of quality pub-lic service delivery, competitive financial returns, or both – for society through ef-ficient resource allocation. Building on previous guidance calling for the state to develop an ownership policy, the new SOE Guidelines recommend that govern-ments publically disclose – and regularly review – the rationales that motivate state
Raising the standard for efficient and transparent state ownership1
By Adrian Blundell-WignallHead of the OECD Directorate for Financial
and Enterprise Affairs
Citizens are the ultimate owners of state-owned enterprises (SOEs). Hence the public merits at least the same degree of transparency and value for money that shareholders expect from listed compa-nies. This is a fundamental tenet of the OECD Guidelines on Corporate Govern-ance for State-Owned Enterprises (SOE Guidelines). The SOE Guidelines provide recommendations for making state-owned enterprises operate as efficiently and transparently as well-run private firms, while competing with them on an equal footing. This is important both for eco-nomic well-being at home and for main-taining an open international trade and investment climate as state-owned enter-prises are increasingly active in foreign markets.
State-owned enterprises and the global economy Over the past two decades, SOEs have be-come more prominent actors in cross-bor-der trade and investment. By way of illus-tration, among the world’s largest 50 com-panies today, about a dozen are state-owned, compared to only one a little over a decade ago. This reflects in large part the rapid growth and internationalisation
1 The views expressed in this article are those of the author and do not necessarily represent the opinions of the Norwegian Ministry of Trade, Industry and Fisheries, the OECD or its member countries. More information about OECD work on state-owned enterprises, including the full text of the OECD Guidelines on Corporate Governance of State-Owned Enterprises, can be found at www.oecd.org/daf/ca/soemarket.htm.
The OECD Guidelines on Corporate Governance of State-Owned Enterprises were fundamentally revised in 2015, resulting in a heightened international standard for sound state ownership, corporate governance and transparency practices.

37
ownership, as well as the ob-jectives of individual enter-prises.
The SOE Guidelines also contain more explicit stand-ards on corporate disclosure, reflecting the recommenda-tions laid down in the G20-OECD Principles of Corpo-rate Governance. According to the SOE Guidelines, SOEs should be subject to the same high quality accounting, dis-closure, compliance and au-diting standards as listed companies. They should dis-close information on their fi-nancial and operating results, but also on any financial as-sistance or guarantees re-ceived from the state, as well as any foreseeable risk fac-tors or potential liabilities arising from public-private partnerships.
These heightened disclo-sure standards reflect the international consensus that transparency is an impor-tant driver of improved governance and, ultimately, performance.
SOEs should operate on an equal footing with comparable private companies SOEs often compete alongside private en-terprises in the commercial marketplace. Ensuring they compete on equal terms – without any advantages or disadvantages owing to their ownership – is important for maintaining efficient markets. The new SOE Guidelines significantly expand upon the previous standard calling for a level playing field, including more de-tailed advice on how to ensure market consistent financing in practice.
A new chapter devoted purely to situa-tions where SOEs undertake economic activities in the marketplace outlines the many regulatory, financial and operation-al conditions necessary to achieve a level playing field in practice. It is founded on
the principle that any costs related to pub-lic policy activities should be separately and transparently funded by the state – and not cross-subsidised from commer-cial activities – to avoid distortions to the competitive landscape. It also calls for state-owned enterprises’ economic activi-ties to be subject to market consistent rate-of-return requirements. It recognises that these SOEs should not benefit from any indirect financial support such as preferential financing conditions or opera-tional inputs such as energy, water or land obtained at more favourable conditions than those available to private competitors.
This issue of equal treatment also ex-tends to the investors in state-owned en-terprises. The SOE Guidelines comprise specific recommendations regarding the protection of non-state shareholders’ rights to fair and equitable treatment and adequate access to information. Imple-menting these standards is crucial for assuring minority investors and thus al-lowing governments, if they so choose,
to invite private capital into their state-owned enterpris-es.
SOEs should conduct business responsibly and should not be subject to political capture SOEs can play a useful role in setting the business tone in the countries where they op-erate. The state as an owner has a responsibility to ensure that its own enterprises re-spect any national commit-ments regarding responsible business conduct. This also applies to international com-mitments in fields such as human rights, labour rela-tions, environmental regula-tions and tax obligations. The new SOE Guidelines call for state-owned enterprises to observe high standards of re-sponsible business conduct.
They also include specific guidance on the responsibility of boards of directors to develop and monitor internal controls and ethics programmes, including those de-signed to combat fraud and corruption.
Recent work by the OECD has shed light on corruption risks within the state-owned sector. The OECD Foreign Brib-ery Report notably found that the employ-ees of SOEs represented nearly one third of all individuals promised, offered or giv-en bribes in the 427 concluded cases of foreign bribery since the entry into force of the OECD Anti-Bribery Convention. These findings, along with several recent highly publicised corruption scandals in-volving SOEs, indicate a need to promote clean business practices in the state-owned sector. Implementing relevant pro-visions in the SOE Guidelines will contrib-ute to this goal.
Ensuring that SOEs are not subject to political capture is also essential. The new SOE Guidelines recommend that SOEs should not be used to finance political ac-
© OECD

38
tivities or directly make political campaign contributions, given the inherent conflicts of interest involved.
Boards of directors need to be competent, effective and autonomous corporate oversight organs The boards of SOEs should be effective, competent and independent bodies re-sponsible for monitoring the implementa-tion of the state’s objectives. Active and qualified boards can play a key role in en-suring that state-owned enterprises oper-ate at arm’s-length from the general gov-ernment, thus shielding them from exces-sive politicisation and ad-hoc state involve-ment in daily operations.
To fulfil these roles, boards need to be accorded sufficient autonomy and legal responsibility for setting enterprise strat-egy and monitoring management. How-ever, in a number of countries the boards of SOEs are in practice often not accorded a sufficient legal mandate to fulfil these functions or are not sufficiently independ-ent owing to a politicisation of the board nomination process. In some cases, the state bypasses the board of directors to interact directly with the chief executive officer (CEO) of an SOE, rendering the board effectively unable to fulfil its role of monitoring top management.
The revised SOE Guidelines have been greatly enhanced in this respect, includ-ing more specific standards for board in-dependence and performance. They call for the board to be responsible for ap-pointing and removing the CEO. They also propose definitions of board member independence and call for boards to carry out, under the oversight of their Chairs, annual self-evaluations of performance and efficiency.
Full implementation of this new guid-ance on SOE boards of directors will greatly enhance the effectiveness of these corporate bodies, leading to more perfor-mant and professionally-run SOEs.
Which entities are considered to be SOEs? New guidance on ownership, control and commercial orientation There is no “one size fits all” definition of state-owned enterprise. National tradi-tions vary with respect to what is consid-
ered a state-owned enterprise, taking into account characteristics such as legal form, closeness to the general govern-ment administration, degree of state own-ership and commercial orientation.
The SOE Guidelines offer important new guidance in this respect, helping pol-icy makers better identify those SOEs for which their high standards of corporate governance and transparency are most applicable. This includes all SOEs active in the marketplace, regardless of whether they also pursue a public policy objective. It also includes companies in which the state acts as the ultimate beneficiary ma-jority owner – including through subsidi-ary structures – as well as companies that are effectively controlled by the state through means other than majority own-ership, including golden shares and provi-sions securing the state’s ability to appoint a majority of the board of directors.
OECD’s role in guiding reforms to state ownership and corporate governance practices The OECD hosts the world’s only interna-tional forum of state ownership practition-ers – the Working Party on State Owner-ship and Privatisation Practices. The Working Party was the driving force be-hind the revision of the SOE Guidelines and is further tasked with monitoring and supporting the implementation of the SOE Guidelines in OECD countries and elsewhere. The Government of Norway played an active role in the revision of the SOE Guidelines, with the Norwegian ex-perience as an “early mover” in the area of SOE reform proving a great benefit to the process. Norway’s ongoing engagement in the OECD’s work on identifying and disseminating good practices for state ownership and SOE governance is valua-ble to the OECD.
The OECD will continue supporting governments as they undertake reforms in their state owned sectors, through a continued regular exchange of good prac-tices among policy makers and through in-depth country reviews. Ensuring that SOEs efficiently deliver on their commer-cial and public policy objectives is crucial to economic development, well-function-ing markets and societal well-being.
© G
T Nergaard

39
Trøndelag Teater is the regional theatre in Trøndelag and is located in Trondheim.

Mesta is Norway’s largest contracting company in the operation and maintenance of roads. In 2015 the company had revenues of NOK 4.078 million and a profit after tax of NOK 335 million.

41
Category 1 Commercial objectives
This category consists of companies in which the state’s ownership has commercial objectives. The sole purpose of the ownership management of the companies in this category is to maximise the value of the state’s investments, including contributing to the sound commercial development of these companies. The extent to which the state should remain an owner of these companies is subject to ongoing commercial assessment. The state’s expected results and return depend on the companies’ risk profiles. The companies operate in markets with other commercially-oriented players.
Ambita AS 42Baneservice AS 43Entra ASA 44Flytoget AS 45Mesta AS 46 SAS AB 47Veterinærmedisinsk Oppdragssenter AS 48
© A
nders Flæte/M
esta AS 41
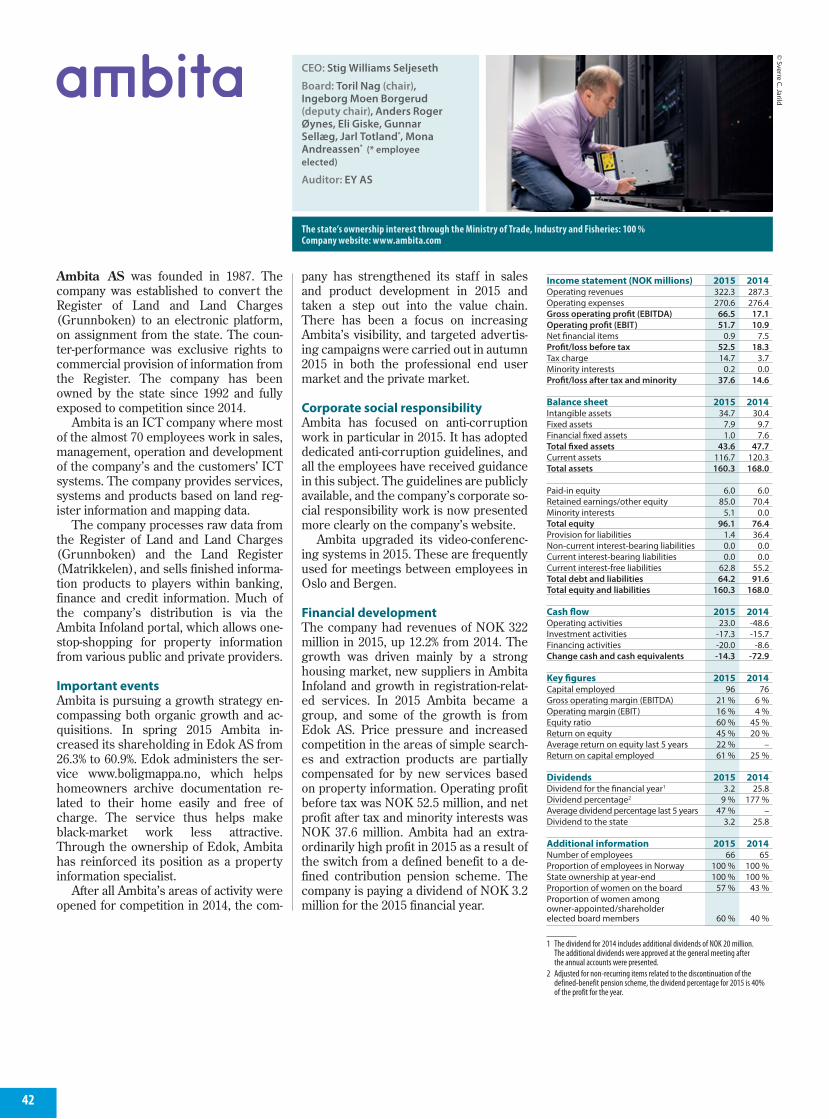
42
Income statement (NOK millions) 2015 2014Operating revenues 322.3 287.3Operating expenses 270.6 276.4Gross operating profit (EBITDA) 66.5 17.1Operating profit (EBIT) 51.7 10.9Net financial items 0.9 7.5Profit/loss before tax 52.5 18.3Tax charge 14.7 3.7Minority interests 0.2 0.0Profit/loss after tax and minority 37.6 14.6 Balance sheet 2015 2014Intangible assets 34.7 30.4Fixed assets 7.9 9.7Financial fixed assets 1.0 7.6Total fixed assets 43.6 47.7Current assets 116.7 120.3Total assets 160.3 168.0 Paid-in equity 6.0 6.0Retained earnings/other equity 85.0 70.4Minority interests 5.1 0.0Total equity 96.1 76.4Provision for liabilities 1.4 36.4Non-current interest-bearing liabilities 0.0 0.0Current interest-bearing liabilities 0.0 0.0Current interest-free liabilities 62.8 55.2Total debt and liabilities 64.2 91.6Total equity and liabilities 160.3 168.0 Cash flow 2015 2014Operating activities 23.0 -48.6Investment activities -17.3 -15.7Financing activities -20.0 -8.6Change cash and cash equivalents -14.3 -72.9 Key figures 2015 2014Capital employed 96 76Gross operating margin (EBITDA) 21 % 6 %Operating margin (EBIT) 16 % 4 %Equity ratio 60 % 45 %Return on equity 45 % 20 %Average return on equity last 5 years 22 % –Return on capital employed 61 % 25 % Dividends 2015 2014Dividend for the financial year1 3.2 25.8Dividend percentage2 9 % 177 %Average dividend percentage last 5 years 47 % –Dividend to the state 3.2 25.8 Additional information 2015 2014Number of employees 66 65Proportion of employees in Norway 100 % 100 %State ownership at year-end 100 % 100 %Proportion of women on the board 57 % 43 %Proportion of women among owner-appointed/shareholder elected board members 60 % 40 %
Ambita AS was founded in 1987. The company was established to convert the Register of Land and Land Charges (Grunnboken) to an electronic platform, on assignment from the state. The coun-ter-performance was exclusive rights to commercial provision of information from the Register. The company has been owned by the state since 1992 and fully exposed to competition since 2014.
Ambita is an ICT company where most of the almost 70 employees work in sales, management, operation and development of the company’s and the customers’ ICT systems. The company provides services, systems and products based on land reg-ister information and mapping data.
The company processes raw data from the Register of Land and Land Charges (Grunnboken) and the Land Register (Matrikkelen), and sells finished informa-tion products to players within banking, finance and credit information. Much of the company’s distribution is via the Ambita Infoland portal, which allows one-stop-shopping for property information from various public and private providers.
Important eventsAmbita is pursuing a growth strategy en-compassing both organic growth and ac-quisitions. In spring 2015 Ambita in-creased its shareholding in Edok AS from 26.3% to 60.9%. Edok administers the ser-vice www.boligmappa.no, which helps homeowners archive documentation re-lated to their home easily and free of charge. The service thus helps make black-market work less attractive. Through the ownership of Edok, Ambita has reinforced its position as a property information specialist.
After all Ambita’s areas of activity were opened for competition in 2014, the com-
pany has strengthened its staff in sales and product development in 2015 and taken a step out into the value chain. There has been a focus on increasing Ambita’s visibility, and targeted advertis-ing campaigns were carried out in autumn 2015 in both the professional end user market and the private market.
Corporate social responsibilityAmbita has focused on anti-corruption work in particular in 2015. It has adopted dedicated anti-corruption guidelines, and all the employees have received guidance in this subject. The guidelines are publicly available, and the company’s corporate so-cial responsibility work is now presented more clearly on the company’s website.
Ambita upgraded its video-conferenc-ing systems in 2015. These are frequently used for meetings between employees in Oslo and Bergen.
Financial developmentThe company had revenues of NOK 322 million in 2015, up 12.2% from 2014. The growth was driven mainly by a strong housing market, new suppliers in Ambita Infoland and growth in registration-relat-ed services. In 2015 Ambita became a group, and some of the growth is from Edok AS. Price pressure and increased competition in the areas of simple search-es and extraction products are partially compensated for by new services based on property information. Operating profit before tax was NOK 52.5 million, and net profit after tax and minority interests was NOK 37.6 million. Ambita had an extra-ordinarily high profit in 2015 as a result of the switch from a defined benefit to a de-fined contribution pension scheme. The company is paying a dividend of NOK 3.2 million for the 2015 financial year.
CEO: Stig Williams Seljeseth
Board: Toril Nag (chair), Ingeborg Moen Borgerud (deputy chair), Anders Roger Øynes, Eli Giske, Gunnar Sellæg, Jarl Totland*, Mona Andreassen* (* employee elected)
Auditor: EY AS
The state’s ownership interest through the Ministry of Trade, Industry and Fisheries: 100 %Company website: www.ambita.com
© Sverre C. Jarild
1 The dividend for 2014 includes additional dividends of NOK 20 million. The additional dividends were approved at the general meeting after the annual accounts were presented.
2 Adjusted for non-recurring items related to the discontinuation of the defined-benefit pension scheme, the dividend percentage for 2015 is 40% of the profit for the year.
Ambita AS
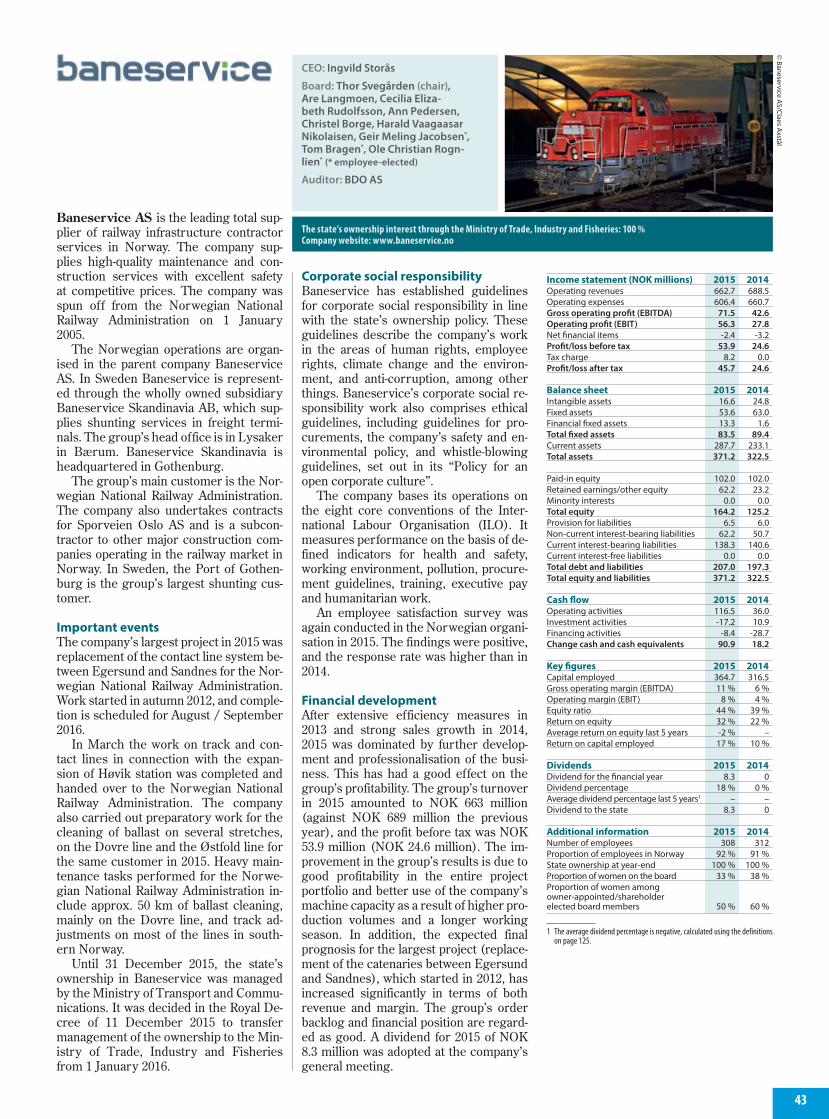
43
Income statement (NOK millions) 2015 2014Operating revenues 662.7 688.5Operating expenses 606.4 660.7Gross operating profit (EBITDA) 71.5 42.6Operating profit (EBIT) 56.3 27.8Net financial items -2.4 -3.2Profit/loss before tax 53.9 24.6Tax charge 8.2 0.0Profit/loss after tax 45.7 24.6 Balance sheet 2015 2014Intangible assets 16.6 24.8Fixed assets 53.6 63.0Financial fixed assets 13.3 1.6Total fixed assets 83.5 89.4Current assets 287.7 233.1Total assets 371.2 322.5 Paid-in equity 102.0 102.0Retained earnings/other equity 62.2 23.2Minority interests 0.0 0.0Total equity 164.2 125.2Provision for liabilities 6.5 6.0Non-current interest-bearing liabilities 62.2 50.7Current interest-bearing liabilities 138.3 140.6Current interest-free liabilities 0.0 0.0Total debt and liabilities 207.0 197.3Total equity and liabilities 371.2 322.5 Cash flow 2015 2014Operating activities 116.5 36.0Investment activities -17.2 10.9Financing activities -8.4 -28.7Change cash and cash equivalents 90.9 18.2 Key figures 2015 2014Capital employed 364.7 316.5Gross operating margin (EBITDA) 11 % 6 %Operating margin (EBIT) 8 % 4 %Equity ratio 44 % 39 %Return on equity 32 % 22 %Average return on equity last 5 years -2 % –Return on capital employed 17 % 10 % Dividends 2015 2014Dividend for the financial year 8.3 0Dividend percentage 18 % 0 %Average dividend percentage last 5 years1 – –Dividend to the state 8.3 0 Additional information 2015 2014Number of employees 308 312Proportion of employees in Norway 92 % 91 %State ownership at year-end 100 % 100 %Proportion of women on the board 33 % 38 %Proportion of women among owner-appointed/shareholder elected board members 50 % 60 %
Baneservice AS is the leading total sup-plier of railway infrastructure contractor services in Norway. The company sup-plies high-quality maintenance and con-struction services with excellent safety at competitive prices. The company was spun off from the Norwegian National Railway Administration on 1 January 2005.
The Norwegian operations are organ-ised in the parent company Baneservice AS. In Sweden Baneservice is represent-ed through the wholly owned subsidiary Baneservice Skandinavia AB, which sup-plies shunting services in freight termi-nals. The group’s head office is in Lysaker in Bærum. Baneservice Skandinavia is headquartered in Gothenburg.
The group’s main customer is the Nor-wegian National Railway Administration. The company also undertakes contracts for Sporveien Oslo AS and is a subcon-tractor to other major construction com-panies operating in the railway market in Norway. In Sweden, the Port of Gothen-burg is the group’s largest shunting cus-tomer.
Important eventsThe company’s largest project in 2015 was replacement of the contact line system be-tween Egersund and Sandnes for the Nor-wegian National Railway Administration. Work started in autumn 2012, and comple-tion is scheduled for August / September 2016.
In March the work on track and con-tact lines in connection with the expan-sion of Høvik station was completed and handed over to the Norwegian National Railway Administration. The company also carried out preparatory work for the cleaning of ballast on several stretches, on the Dovre line and the Østfold line for the same customer in 2015. Heavy main-tenance tasks performed for the Norwe-gian National Railway Administration in-clude approx. 50 km of ballast cleaning, mainly on the Dovre line, and track ad-justments on most of the lines in south-ern Norway.
Until 31 December 2015, the state’s ownership in Baneservice was managed by the Ministry of Transport and Commu-nications. It was decided in the Royal De-cree of 11 December 2015 to transfer management of the ownership to the Min-istry of Trade, Industry and Fisheries from 1 January 2016.
Corporate social responsibilityBaneservice has established guidelines for corporate social responsibility in line with the state’s ownership policy. These guidelines describe the company’s work in the areas of human rights, employee rights, climate change and the environ-ment, and anti-corruption, among other things. Baneservice’s corporate social re-sponsibility work also comprises ethical guidelines, including guidelines for pro-curements, the company’s safety and en-vironmental policy, and whistle-blowing guidelines, set out in its “Policy for an open corporate culture”.
The company bases its operations on the eight core conventions of the Inter- national Labour Organisation (ILO). It measures performance on the basis of de-fined indicators for health and safety, working environment, pollution, procure-ment guidelines, training, executive pay and humanitarian work.
An employee satisfaction survey was again conducted in the Norwegian organi-sation in 2015. The findings were positive, and the response rate was higher than in 2014.
Financial developmentAfter extensive efficiency measures in 2013 and strong sales growth in 2014, 2015 was dominated by further develop-ment and professionalisation of the busi-ness. This has had a good effect on the group’s profitability. The group’s turnover in 2015 amounted to NOK 663 million (against NOK 689 million the previous year), and the profit before tax was NOK 53.9 million (NOK 24.6 million). The im-provement in the group’s results is due to good profitability in the entire project portfolio and better use of the company’s machine capacity as a result of higher pro-duction volumes and a longer working season. In addition, the expected final prognosis for the largest project (replace-ment of the catenaries between Egersund and Sandnes), which started in 2012, has increased significantly in terms of both revenue and margin. The group’s order backlog and financial position are regard-ed as good. A dividend for 2015 of NOK 8.3 million was adopted at the company’s general meeting.
CEO: Ingvild Storås
Board: Thor Svegården (chair), Are Langmoen, Cecilia Eliza-beth Rudolfsson, Ann Pedersen, Christel Borge, Harald Vaagaasar Nikolaisen, Geir Meling Jacobsen*, Tom Bragen*, Ole Christian Rogn-lien* (* employee-elected)
Auditor: BDO AS
The state’s ownership interest through the Ministry of Trade, Industry and Fisheries: 100 % Company website: www.baneservice.no
© Baneservice A
S/Claes Axstål
1 The average dividend percentage is negative, calculated using the definitions on page 125.
Baneservice AS

44
Income statement (NOK millions) 2015 2014Operating revenues 1 999 1 997Operating expenses -560 -580Gross operating profit (EBITDA) 1 440 1 418Depreciation and amortisation -18 -19Profit from property management 1 421 1 399Change in value of investment properties 1 818 1 195Operating profit (EBIT) 3 239 2 594Share of profits in associates and joínt ventures 44 36Net financial items -209 -1 252Profit/loss before tax and minority 3 075 1 377Tax charge 354 351Minority interests 73 -1Profit/loss after tax and minority 2 648 1 027 Balance sheet 2015 2014Intangible assets 161 180Fixed assets 28 859 26 721Financial fixed assets 3 372 1 736Total fixed assets 32 391 28 637Current assets 1 062 662Investment properties held for sale 165 1 551Total assets 33 619 30 850 Paid-in equity 3 739 3 739Retained earnings/other equity 9 255 7 039Minority interests 359 286Total equity 13 354 11 064Provision for liabilities 4 681 4 548Non-current interest-bearing liabilities 12 083 11 826Current interest-bearing liabilities 3 123 2 821Current interest-free liabilities 378 591Total debt and liabilities 20 265 19 786Total equity and liabilities 33 619 30 850 Cash flow 2015 2014Operating activities 849 668Investment activities -1 010 -1 157Financing activities 174 510Change cash and cash equivalents 14 21 Key figures 2015 2014Capital employed 28 559 25 711Gross operating margin (EBITDA) 72 % 71 %Operating margin (EBIT) 162 % 130 %Equity ratio 40 % 36 %Return on equity 22 % 11 %Average return on equity last 5 years 11 % 9 %Return on capital employed 12 % 11 % Assets and dividends 2015 2014Market value at year-end 13 091 14 056Price/book 1.0 1.3Closing price 71.3 76.5Dividend for the financial year1 551 459Dividend percentage 21 % 45 %Average dividend percentage last 5 years 35 % –Dividend to the state1 274 229Return including dividends last year -3.8 % 14.2 %Average return last 5 years – – Sales proceeds to the state 0 3 284 Additional information 2015 2014Number of employees 162 167Proportion of employees in Norway 100 % 100 %State ownership at year-end 49.73 % 49.89 %Proportion of women on the board 43 % 43 %Proportion of women among owner-appointed/shareholder elected board members 40 % 40 %
Entra ASA is one of Norway’s leading real estate companies and an active own-er, manager and developer of office prop-erties. Entra’s strategy is to own high-quality properties in central locations in the four largest cities in Norway. At year-end Entra owned 96 buildings with a com-bined floor space of approx. 1.3 million m2. The market value of the property portfolio was roughly NOK 29.6 billion.
The company’s business strategy is to be a leader in terms of customer-per-ceived quality, to achieve profitable growth, and to be an environmental lead-er in the industry. Entra’s head office is in Oslo, and it has regional offices in Bergen and Trondheim. Public-sector tenants ac-count for roughly 74% of the customer portfolio. The occupancy rate of the port-folio has remained high and stable over time and was 95% at year-end. The weight-ed average unexpired lease term of the company’s leases was just under eight years at the close of the year.
Important eventsIn 2015 Entra signed new and renegotiat-ed leases representing NOK 294 million in annual rent.
Entra completed three major projects in 2015: a new office building of 15,500 m2
in Schweigaardsgate 16 in Oslo, a new of-fice building of 11,400 m2 in Papirbredden in Drammen, and renovation and exten-sion of an office building of 6,200 m2 in Akersgata 34/36 in Oslo. In addition Entra started construction of a new office building of 31,300 m2 in the Sundt quarter in Oslo and started renovation of two properties in Helsfyr.
In 2015 Entra acquired the office sec-tion of the Oslo City shopping centre (a total of 33,300 m2) and the office building development project Trondheimsporten (28,600 m2). In line with its strategy of growth in the largest cities and sale of
non-core properties, Entra sold twelve buildings in Østfold, Lillestrøm, Tromsø, Arendal, Drammen, Stavanger and Oslo during the year.
Corporate social responsibilityEntra aims to be the environmental leader in the industry and has a defined strategy with objectives and action plans for envi-ronmental activities. The company’s envi-ronmental strategy involves developing the property portfolio using innovative solutions and new expertise, reducing energy consumption in its portfolio, strengthening customer collaboration through Green Benefit Agreements, de-veloping and sharing expertise, and con-tributing to positive urban development.
Entra has zero tolerance for corruption and illegal labour practices in all parts of its business and works actively on ethics in practice, responsible procurement and close monitoring of suppliers. Health and safety are high priorities, and the compa-ny’s goal is that no one should suffer inju-ry or become ill as a result of the compa-ny’s working environment. Entra focuses on maintaining a good working environ-ment and ensuring good employee rights, knowledge development, diversity and equal opportunities in the company.
Financial developmentEntra had rental income of NOK 1,760 million in 2015, against NOK 1,772 million in 2014. The reduction is due to extensive sales of non-core properties in 2015. Ad-justed for these sales, there was 6% under-lying growth in rental income. Profit from property management amounted to NOK 1,421 million (NOK 1,399 million). Profit before tax was NOK 3,075 million (NOK 1,377 million) and comprehensive income after tax was NOK 2,750 million (NOK 1,000). The company is paying a dividend of NOK 3 per share for 2015 (NOK 2.5).
CEO: Arve Regland
Board: Siri Beate Hatlen (chair), Martin Mæland (deputy chair), Ingrid Therese Tjøsvold, Kjell Bjordal, Arthur Sletteberg, Birthe Helen Smedsrud Skeid*, Frode Erland Halvorsen* (* employee-elected)
Auditor: Deloitte AS
The state’s ownership interest through the Ministry of Trade, Industry and Fisheries: 49.73 % Company website: www.entra.no
© Enrra A
SA
1 Additional dividends of NOK 650 million were paid to the state in 2014 as the seller of the company in connection with the listing.
Entra ASA

45
Income statement (NOK millions) 2015 2014Operating revenues 960 944Operating expenses 729 700Gross operating profit (EBITDA) 338 350Operating profit (EBIT) 232 244Net financial items 3 8Profit/loss before tax 235 253Tax charge 54 69Profit/loss after tax 181 184 Balance sheet 2015 2014Intangible assets 187 203Fixed assets 992 815Financial fixed assets 0 0Total fixed assets 1 179 1 017Current assets 214 321Total assets 1 393 1 338 Paid-in equity 692 692Retained earnings/other equity 110 62Total equity 802 754Provision for liabilities 232 277Non-current interest-bearing liabilities 0 0Current interest-bearing liabilities 0 0Current interest-free liabilities 358 307Total debt and liabilities 590 584Total equity and liabilities 1 393 1 338 Cash flow 2015 2014Operating activities 291 284Investment activities -268 -42Financing activities -129 -400Change cash and cash equivalents -105 -158 Key figures 2015 2014Capital employed 802 754Gross operating margin (EBITDA) 35 % 37 %Operating margin (EBIT) 24 % 26 %Equity ratio 58 % 56 %Return on equity 23 % 21 %Average return on equity last 5 years 17 % –Return on capital employed 30 % 29 % Dividends 2015 2014Dividend for the financial year 181 129Dividend percentage 100 % 70 %Average dividend percentage last 5 years 119 % –Dividend to the state 181 129 Additional information 2015 2014Number of employees 344 348Proportion of employees in Norway 100 % 100 %State ownership at year-end 100 % 100 %Proportion of women on the board 38 % 38 %Proportion of women among owner-appointed/shareholder elected board members 40 % 40 %
Flytoget AS was founded in 1992 under the name NSB Gardermobanen AS. Opera-tion of the airport express trains started when Oslo Airport opened in 1998. In 2003 the company was demerged from the NSB group as a separate limited company.
Flytoget operates a passenger trans-port service between Drammen and Oslo Airport. The company carries approx. 6.6 million passengers each year, which is roughly 10% of all train passengers in Nor-way and around 20% of all train passen-gers in central eastern Norway. The air-port express trains have a top speed of 210 km/h and run between Oslo Central Station and Oslo Airport every 10 min-utes. Trains run to and from Drammen every 20 minutes. In 2015 Flytoget in-creased the number of departures from three to four trains an hour on weekdays from the stations Lysaker, Sandvika, Skøyen and Nationaltheatret. Also, Sta-bekk was opened as an airport express train station, with hourly departures.
Important eventsFlytoget achieved the second-best result in the company’s history in 2015. Custom-er satisfaction was 96.7% at year-end, and punctuality was 96.6%.
On 15 April 2015 Flytoget signed a con-tract for delivery of eight new train sets, giving the company the capacity to meet the increased population and transport growth in the coming years. The new trains will begin service in 2018.
Flytoget’s objects clause was amended at an extraordinary general meeting on 25 No-vember 2015 through the removing the limi-tation on the company’s transportation stretch.
In March 2016 the company launched a strategic partnership with SAS Euro Bonus, providing Flytog passengers with Euro-Bonus points when they take the air-port express train.
Corporate social responsibilityFlytoget’s operations contribute to a high share of public transport by offering an ef-
ficient and environmentally friendly means of transport to and from Oslo Airport. In addition, the company has made a strate-gic decision to be a driving force for sus-tainable development, where the goal is long-term, sustainable, financial value creation, in line with its stakeholders’ ex-pectations and the state’s ownership poli-cy. Flytoget focuses on ensuring that de-fined sustainability areas are linked to the company’s core business. The company will take an active part in the future devel-opment of railways, work to raise aware-ness of climate change and the environ-ment, and the work of the community to promote efficient use of society’s resourc-es. This can only be achieved by integrat-ing sustainability ambitions into overarch-ing strategies and business priorities. In 2015 the company has worked systemati-cally to integrate sustainability and corpo-rate social responsibility into the compa-ny’s corporate governance, strategies and action plans. This work will continue in 2016.
For 2015 the company is publishing an integrated annual report in accordance with the Global Reporting Initiative’s G4 guidelines, application level “Core”, and the International Integrated Reporting Council’s framework.
Financial developmentFlytoget’s revenue was NOK 960 million in 2015, compared with NOK 944 million in 2014. The revenue growth is ascribable to the increase in fares from February 2015. There was marginal growth in the passenger market in 2015. Competition in the market has increased significantly, and Flytoget’s market share has declined by 1.1 percentage points. Profit before tax was NOK 235 million, and profit after tax was NOK 181 million. This yielded a re-turn on equity of 23%. Flytoget’s equity ratio was 58% at year-end 2015, compared with 56% for 2014. NOK 181 million was allocated to ordinary dividends for the 2015 financial year.
CEO: Linda Bernander Silseth
Board: Wenche Kjølås (chair), Per Sanderud (deputy chair), Trygve Gjertsen, Rolf Gunnar Roverud, Tone Merethe Lindberg, Jan Garder Gundersen*, Per Stene*, Camilla Asker* (* employee-elected)
Auditor: PricewaterhouseCoopers AS
The state’s ownership interest through the Ministry of Trade, Industry and Fisheries: 100 %Company website: www.flytoget.no
© Flytoget A
S
457,6895
Flytoget AS
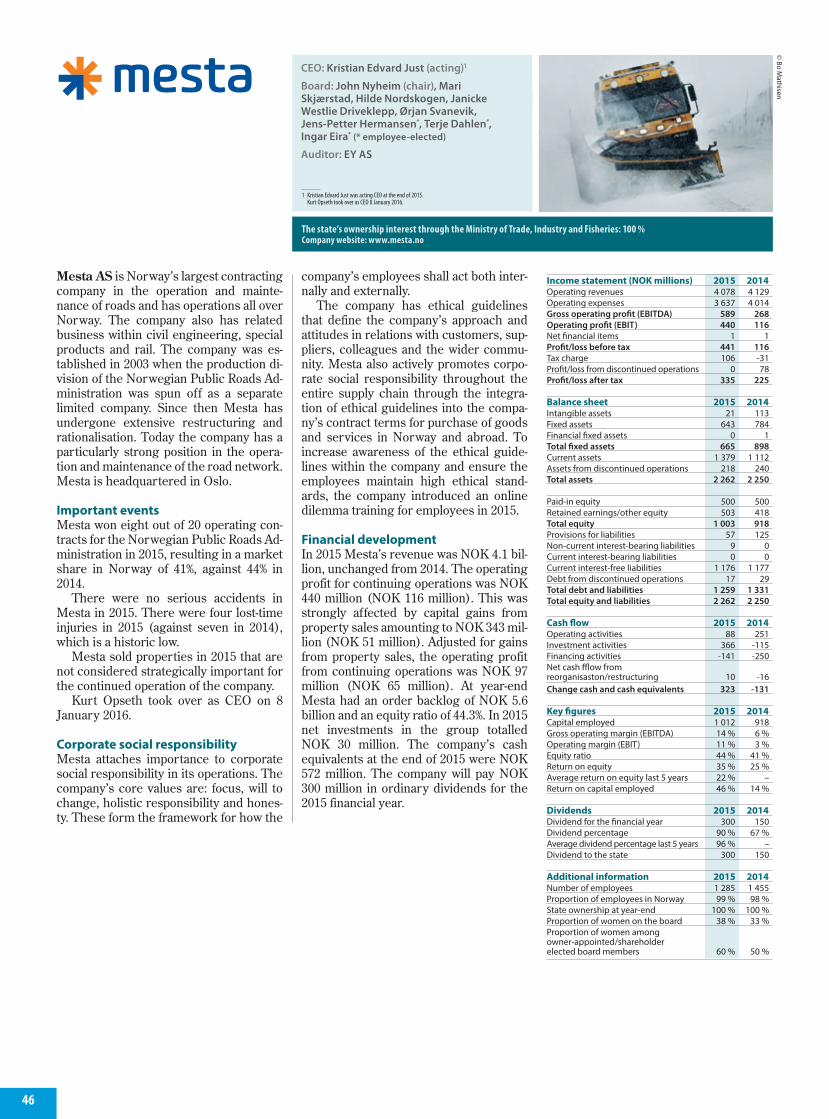
46
Income statement (NOK millions) 2015 2014Operating revenues 4 078 4 129Operating expenses 3 637 4 014Gross operating profit (EBITDA) 589 268Operating profit (EBIT) 440 116Net financial items 1 1Profit/loss before tax 441 116Tax charge 106 -31Profit/loss from discontinued operations 0 78Profit/loss after tax 335 225 Balance sheet 2015 2014Intangible assets 21 113Fixed assets 643 784Financial fixed assets 0 1Total fixed assets 665 898Current assets 1 379 1 112Assets from discontinued operations 218 240Total assets 2 262 2 250 Paid-in equity 500 500Retained earnings/other equity 503 418Total equity 1 003 918Provisions for liabilities 57 125Non-current interest-bearing liabilities 9 0Current interest-bearing liabilities 0 0Current interest-free liabilities 1 176 1 177Debt from discontinued operations 17 29Total debt and liabilities 1 259 1 331Total equity and liabilities 2 262 2 250 Cash flow 2015 2014Operating activities 88 251Investment activities 366 -115Financing activities -141 -250Net cash fflow from reorganisaston/restructuring 10 -16Change cash and cash equivalents 323 -131 Key figures 2015 2014Capital employed 1 012 918Gross operating margin (EBITDA) 14 % 6 %Operating margin (EBIT) 11 % 3 %Equity ratio 44 % 41 %Return on equity 35 % 25 %Average return on equity last 5 years 22 % –Return on capital employed 46 % 14 % Dividends 2015 2014Dividend for the financial year 300 150Dividend percentage 90 % 67 %Average dividend percentage last 5 years 96 % –Dividend to the state 300 150 Additional information 2015 2014Number of employees 1 285 1 455 Proportion of employees in Norway 99 % 98 %State ownership at year-end 100 % 100 %Proportion of women on the board 38 % 33 %Proportion of women among owner-appointed/shareholder elected board members 60 % 50 %
Mesta AS is Norway’s largest contracting company in the operation and mainte-nance of roads and has operations all over Norway. The company also has related business within civil engineering, special products and rail. The company was es-tablished in 2003 when the production di-vision of the Norwegian Public Roads Ad-ministration was spun off as a separate limited company. Since then Mesta has undergone extensive restructuring and rationalisation. Today the company has a particularly strong position in the opera-tion and maintenance of the road network. Mesta is headquartered in Oslo.
Important eventsMesta won eight out of 20 operating con-tracts for the Norwegian Public Roads Ad-ministration in 2015, resulting in a market share in Norway of 41%, against 44% in 2014.
There were no serious accidents in Mesta in 2015. There were four lost-time injuries in 2015 (against seven in 2014), which is a historic low.
Mesta sold properties in 2015 that are not considered strategically important for the continued operation of the company.
Kurt Opseth took over as CEO on 8 January 2016.
Corporate social responsibilityMesta attaches importance to corporate social responsibility in its operations. The company’s core values are: focus, will to change, holistic responsibility and hones-ty. These form the framework for how the
company’s employees shall act both inter-nally and externally.
The company has ethical guidelines that define the company’s approach and attitudes in relations with customers, sup-pliers, colleagues and the wider commu-nity. Mesta also actively promotes corpo-rate social responsibility throughout the entire supply chain through the integra-tion of ethical guidelines into the compa-ny’s contract terms for purchase of goods and services in Norway and abroad. To increase awareness of the ethical guide-lines within the company and ensure the employees maintain high ethical stand-ards, the company introduced an online dilemma training for employees in 2015.
Financial developmentIn 2015 Mesta’s revenue was NOK 4.1 bil-lion, unchanged from 2014. The operating profit for continuing operations was NOK 440 million (NOK 116 million). This was strongly affected by capital gains from property sales amounting to NOK 343 mil-lion (NOK 51 million). Adjusted for gains from property sales, the operating profit from continuing operations was NOK 97 million (NOK 65 million). At year-end Mesta had an order backlog of NOK 5.6 billion and an equity ratio of 44.3%. In 2015 net investments in the group totalled NOK 30 million. The company’s cash equivalents at the end of 2015 were NOK 572 million. The company will pay NOK 300 million in ordinary dividends for the 2015 financial year.
CEO: Kristian Edvard Just (acting)1
Board: John Nyheim (chair), Mari Skjærstad, Hilde Nordskogen, Janicke Westlie Driveklepp, Ørjan Svanevik, Jens-Petter Hermansen*, Terje Dahlen*, Ingar Eira* (* employee-elected)
Auditor: EY AS
© Bo M
athisen
The state’s ownership interest through the Ministry of Trade, Industry and Fisheries: 100 % Company website: www.mesta.no
Mesta AS
1 Kristian Edvard Just was acting CEO at the end of 2015. Kurt Opseth took over as CEO 8 January 2016.

47
Income statement (NOK millions)1 2015 2014Operating revenues 37 477 34 877Operating expenses 36 144 34 755Gross operating profit (EBITDA) 2 719 1 446Operating profit (EBIT) 1 334 122Share of profits in associates and joint ventures 486 -21Net financial items -480 -943Profit/loss before tax and minority 1 339 -842Tax charge 436 -183Minority interests 0 16Profit/loss after tax and minority 904 -675 Balance sheet 2015 2014Intangible assets 1 799 1 745Fixed assets 9 603 8 155Financial fixed assets 7 123 6 858Total fixed assets 18 525 16 758Current assets 11 762 10 109Total assets 30 287 26 868 Paid-in equity 6 759 6 188Retained earnings/other equity -415 -1 717Minority interests 0 25Total equity 6 343 4 496Provision for liabilities 2 182 2 061Non-current interest-bearing liabilities 8 101 7 453Current interest-bearing liabilities 1 494 2 331Current interest-free liabilities 12 168 10 527Total debt and liabilities 23 944 22 372Total equity and liabilities 30 287 26 868 Cash flow 2015 2014Operating activities 2 870 1 006Investment activities -1 052 -441Financing activities -1 075 1 881Change cash and cash equivalents 743 2 446 Key figures 2015 2014Capital employed 15 938 14 280Gross operating margin (EBITDA) 7 % 4 %Operating margin (EBIT) 4 % 0 %Equity ratio 21 % 17 %Return on equity 17 % -18 %Average return on equity last 5 years -1 % –Return on capital employed 13 % 1 % Assets and dividends 2015 2014Market value at year-end2 8 028 4 790Price/book2 1.3 1.1Closing price2 24.4 14.6Dividend for the financial year 0 0Dividend percentage 0 % 0 %Average dividend percentage last 5 years 0 % –Dividend to the state 0 0Return including dividends last year2 60.5 % -7.9 %Average return last 5 years2 1.6 % – Additional information 2015 2014Number of employees 11 288 12 329 Proportion of employees in Norway 32 % 31 %State ownership at year-end 14.29 % 14.29 %Proportion of women on the board 27 % 18 %Proportion of women among owner-appointed/shareholder elected board members 38 % 25 %
SAS AB is one of the leading airlines in Scandinavia, and its main purpose is to of-fer competitive passenger transport based on its home market in Northern Europe and the hubs in Copenhagen, Oslo and Stockholm. The company is part of the global Star Alliance. In the 2014–2015 finan-cial year, the company flew over 28.1 mil-lion passengers to 119 destinations. SAS is headquartered in Stockholm and listed in Sweden, Norway and Denmark.
The airline industry is characterised by intense competition and price pressure, that entails a continous requirement to en-hance efficiency. In 2015 SAS gave priori-ty to improving services for frequent fly-ers to and from Scandinavia, creating an efficient operating platform, and ensuring it has the right competencies.
Important eventsIn 2015 SAS worked with the implementa-tion of a SEK 2.1 billion cost measure pro-gramme with full effect from 2017.
In the 2014–2015 financial year, SAS completed the financing of pre-delivery payments for 13 new aircraft from Airbus.
SAS sold two slot pairs at London Heathrow Airport, generated a USD 82 million capital gain.
SAS acquired Cimber A/S, sold Blue1, and signed a wet lease agreement with CityJet for eight new regional jets.
SAS launched about 50 new seasonal routes to leisure-oriented destinations and new direct routes to Miami, Boston and Los Angeles.
Corporate social responsibilityFor SAS, sustainability is an integrated part of all operations. The company aims
to reduce flight emissions by 20% and re-duce noise emissions on take off by 15% from 2010 to 2020. Examples of how SAS are reducing environmental impact in-clude their initiatives to renew and adjust the aircraft fleet. Furthermore, the com-pany is aiming to regularly use renewable jet fuel in 2020. In 2014–2015 the company reduced its CO2 emissions per passenger kilometre flown by 8% compared with 2010.
Financial developmentThe SAS group’s profit after tax and mi-nority interests was NOK 904 million for the 2014–2015 financial year, compared with a loss of NOK -675 million for the pre-vious financial year. The improvement was mainly driven by growth in passenger revenue, cost savings and lower jet fuel costs. Operating revenue for the year amounted to NOK 37.5 billion, up NOK 2.6 billion from the previous financial year. The increase was mainly driven by higher unit revenue. A growing share of SAS’s revenue is from the company’s Eu-roBonus members, and the number of members rose by 14% over the year to 4.2 million. The group’s equity rose from NOK 4.5 billion to NOK 6.3 billion and was 21% at the end of the financial year, compared with 17% at the beginning of the year. Return on capital employed for the year was 13%, compared with 1% the previ-ous financial year. At the annual general meeting on 8 March 2016, it was decided that no dividends should be payed to the ordinary shareholders. It was decided to pay SEK 350 million in dividends on the company’s preference shares.
CEO: Rickard Gustafson
Board: Fritz Henrik Schur (chair), Jacob Wallenberg (deputy chair), Dag Mejdell (second deputy chair), Monica Caneman, Sanna Suvanto- Harsaae, Lars-Johan Jarnheimer, Berit Svendsen, Carsten Dilling, Jens Lippestad*, Sven Cahier*, Bo Nielsen* (* employee-elected)
Auditor: PricewaterhouseCoopers AB
The state’s ownership interest through the Ministry of Trade, Industry and Fisheries: 14.29 % Company website: www.sasgroup.net
1 The figures are in Norwegian kroner (NOK), converted from SAS’s consolida-ted figures in Swedish kronor (SEK). The exchange rate used is the rate on the balance sheet date of 31 October 2015: NOK / SEK 100.07 for 2015 and 91.62 for 2014 and the average exchange rate for the period November 2014 to October 2015 of NOK / SEK 94.52 for 2015 and 91.77 for 2014.
2 At 31 December. For price / book: market value at 31 Dec. against equity at 31 Oct.
© Knut Lövstuhagen/SA
S AB
SAS AB

48
Income statement (NOK millions) 2015 2014Operating revenues 561.6 548.1Operating expenses 538.5 517.5Gross operating profit (EBITDA) 27.7 36.3Operating profit (EBIT) 23.1 30.7Net financial items 79.5 9.7Profit/loss before tax 102.6 40.3Tax charge 6.6 10.8Profit/loss after tax 95.9 29.6 Balance sheet 2015 2014Intangible assets 2.6 0.0Fixed assets 12.1 13.3Financial fixed assets 10.9 59.8Total fixed assets 25.7 73.2Current assets 162.4 100.2Total assets 188.1 173.4 Paid-in equity 7.5 24.9Retained earnings/other equity 32.7 57.8Total equity 40.2 82.7Provisions for liabilities 0.0 0.0Non-current interest-bearing liabilities 7.7 9.9Current interest-bearing liabilities 0.0 0.0Current interest-free liabilities 140.2 80.7Total debt and liabilities 147.9 90.6Total equity and liabilities 188.1 173.4 Cash flow 2015 2014Operating activities 49.4 23.2Investment activities 121.0 -11.1Financing activities -99.7 -5.7Change cash and cash equivalents 70.7 6.4 Key figures 2015 2014Capital employed 47.9 92.6Gross operating margin (EBITDA) 5 % 7 %Operating margin (EBIT) 4 % 6 %Equity ratio 21 % 48 %Return on equity 156 % 37 %Average return on equity last 5 years 69 % –Return on capital employed 179 % 49 % Dividends 2015 2014Dividend for the financial year 63.5 97.5Dividend percentage 66 % 329 %Average dividend percentage last 5 years 101 % –Dividend to the state 21.6 33.2 Additional information 2015 2014Number of employees 43 42Proportion of employees in Norway 100 % 100 %State ownership at year-end 34 % 34 %Proportion of women on the board 40 % 40 %Proportion of women among owner-appointed/shareholder elected board members 25 % 25 %
Veterinærmedisinsk Oppdragssenter AS (VESO) was established by the Norwe-gian Agricultural Research Council as part of the SEFO group in 1988 and was reor-ganised as a separate limited company in 1991. The company consists of two busi-ness areas: distribution of pharmaceuticals for fish and animals in the Norwegian mar-ket and clinical infection tests on fish in connection with vaccine development, feed development and breeding.
The company is currently a leading dis-tributor of veterinary pharmaceuticals in the Norwegian market and operates one of the leading global clinical laboratories for fish infections in salmonids. The compa-ny’s mission is to offer products and ser-vices that contribute to good animal and fish health, thereby increasing efficiency and sustainability in aquaculture and live-stock production. Pharmaceuticals are dis-tributed from the company’s main office in Adamstuen in Oslo, while the clinical labo-ratory for fish infections is located outside Namsos in Nord-Trøndelag county.
The company seeks to contribute to good animal and fish health in Norway by providing good access to vaccines and drugs, and internationally through the de-velopment of effective vaccines and feed additives.
Important eventsIn 2015 VESO sold the subsidiaries Akva-forsk Genetic Center AS and Akvaforsk
Genetic Center Inc. to Benchmark Breed-ing Ltd, ending its focus on genetics in aquaculture. The company now operates in growth markets, where customers to a moderate extent are affected by the gen-eral economic situation in society.
The total market for pharmaceuticals for animals increased in 2015. In 2015 VESO’s market share in the animal health segment increased, while its share of the fish health market declined slightly. Demand for the company’s services in Vikan has been stable or growing through 2015.
Until 31 December 2015 the state’s ownership in VESO was managed by the Ministry of Agriculture and Food. It was decided in the Royal Decree of 18 Decem-ber 2015 to transfer management of the ownership to the Ministry of Trade, In-dustry and Fisheries from 1 January 2016.
Financial developmentVESO’s revenue increased from 2014 to 2015, ending at NOK 562 million. The op-erating profit for the year was NOK 23.1 million, and the profit before tax was NOK 103 million. The company’s liquid assets at the end of 2015 were NOK 87.5 million, and it is in a good position to finance in-vestments autonomously. The dividends to the owners of NOK 63.5 million takes into consideration the company’s liquidity requirements in 2016 and planned invest-ments.
CEO: Arne Gulbrand Ruud
Board: Bjørn Skjævestad (chair), Arne Gulbrand Ruud (deputy chair), Marit Dille, Bjørn Flatland, Audur Thorisdottir*(* employee-elected)
Auditor: Svindal Leidland Myhrer & Co AS
The state’s ownership interest through the Ministry of Trade, Industry and Fisheries: 34 %Company website: www.veso.no
© Veterinæ
rmedisinsk O
ppdragssenter AS
Veterinærmedisinsk Oppdragssenter AS

49
Baneservice is the leading total supplier of railway infrastructure contractor services in Norway. In 2015 the company had revenues of NOK 663 million and a profit after tax of NOK 46 million.
© Paal Audestad
The state’s ownership interest through the Ministry of Trade, Industry and Fisheries: 34 %Company website: www.veso.no
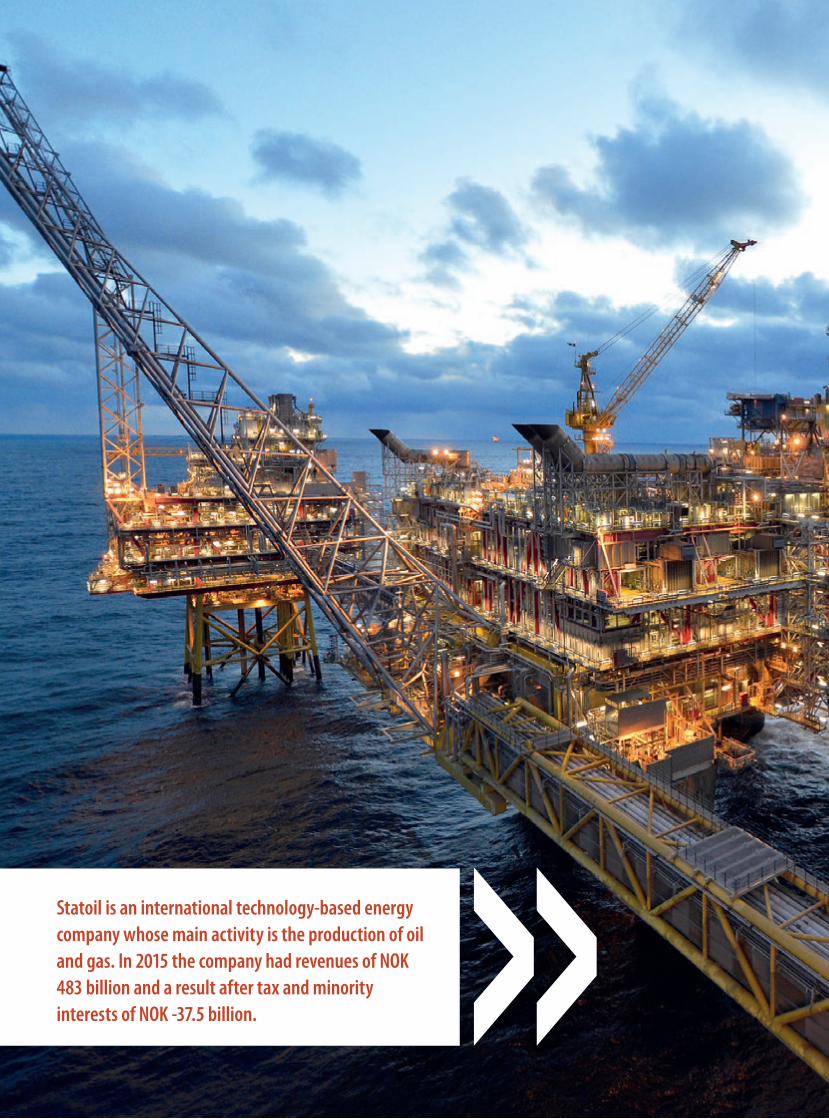
Statoil is an international technology-based energy company whose main activity is the production of oil and gas. In 2015 the company had revenues of NOK 483 billion and a result after tax and minority interests of NOK -37.5 billion.

51
© H
arald Pettersen/Statoil ASA
Category 2 Commercial objectives and objective of maintaining head office functions in Norway
This category includes companies where the state’s ownership has commercial objectives and an objective of maintaining the companies head offices and associatedhead office functions in Norway. An ownership stake of one-third is generally adequate in order to meet the latter objective. The state’s expected results and return depend on the companies’ risk profiles. The companies operate in markets with other commercially-oriented players.
Aker Kværner Holding AS 52DNB ASA 53Kongsberg Gruppen ASA 54Nammo AS 55Norsk Hydro ASA 56Statoil ASA 57Telenor ASA 58Yara International ASA 59

52
Income statement (NOK millions) 2015 2014Operating revenues 0 0Operating expenses 2 2Operating profit (EBIT) -2 -2Net financial items -2 124 -4 690 Profit/loss before tax -2 126 -4 692 Tax charge 2 4Profit/loss after tax -2 127 -4 696 Balance sheet 2015 2014Intangible assets 0 0Fixed assets 0 0Financial fixed assets 5 574 7 948Total fixed assets 5 574 7 948Current assets 5 7Total assets 5 579 7 956 Paid-in equity 4 235 4 235Retained earnings/other equity 1 342 3 486Total equity 5 577 7 720Provision for liabilities 0 0Non-current liabilities 0 0Current interest-bearing liabilities 0 0Current interest-free liabilities 2 235Total debt and liabilities 2 235Total equity and liabilities 5 579 7 956 Cash flow 2015 2014Operating activities 245 584Investment activities 0 0Financing activities -247 -580Change cash and cash equivalents -2 4 Key figures 2015 2014Equity ratio 100 % 97 %Market value *(of the State’s indirect ownership) 1 672 2 385 Dividends 2015 2014Dividend for the financial year 0 231Dividend percentage 0 % –Average dividend percentage last 5 years1 – –Dividend to the state 0 69 Additional information 2015 2014Number of employees 0 0State ownership at year-end 30 % 30 %Proportion of women on the board 50 % 60 %Proportion of women among owner-appointed/shareholder elected board members 60 % 60 %
Aker Kværner Holding AS’s business objective is to own shares in Akastor ASA, Aker Solutions ASA and Kværner ASA. Aker Kværner Holding owns about 40% of the shares in each of these companies and has the same rights as the other sharehold-ers.
The state owns 30% of the shares in Aker Kværner Holding; the other share-holder is Aker ASA. The owners of Aker Kværner Holding have entered into a shareholder agreement, which in practice secures the state and Aker a blocking in-terest in Akastor, Aker Solutions and Kværner with regard to a number of key areas. The state and Aker have made a mutual commitment to maintain the pre-sent ownership in Akastor, Aker Solutions and Kværner for a period of at least ten years (2007–2017). The state’s acquisition of shares in the former Aker Holding took place on 20 December 2007, following au-thorisation from the Storting issued on 11 December 2007. The terms of the acquisi-tion are set out in Proposition no. 88 to the Storting (2006–2007) The state’s owner-ship in Aker Holding AS, and Recommen-dation no. 54 to the Storting (2007–2008).
Financial developmentAker Kværner Holding’s sole income is dividends from Akastor, Aker Solutions and Kværner, plus some limited interest income. The company has few expenses.The underlying assets in Aker Kværner Holding can be measured by the share prices of Akastor, Aker Solutions and Kværner. In 2015 Aker Kværner Holding recorded an impairment loss on shares in these companies of NOK 2.4 billion. The impairment reflects the considerable de-cline in value in oil-related shares on Oslo Stock Exchange in 2015. Aker Kværner Holding also recorded impairment losses on shares in 2014 of NOK 5.3 billion.
On 22 June 2007 the state entered into an agreement to buy 30% of the shares in Aker Holding AS at NOK 145.6 per share in Aker Solutions, plus interest until the takeover date. At the end of 2015 the re-spective share prices for Akastor, Aker Solutions and Kværner were NOK 12, NOK 30.3 and NOK 8.2. Akastor, Aker So-lutions and Kværner reported annual re-sults after tax of NOK -2.6 billion, NOK 0.4 billion and NOK 0.4 billion respectively, for 2015, compared with NOK 2.5 billion, NOK 1.3 billion and NOK -0.1 billion the previous year.
CEO: Arild Støren Frick
Board: Øyvind Eriksen (chair), Ida Helliesen, Kjell Inge Røkke, Else Bugge Fougner, Kristin Margrethe Krohn Devold, Atle Tranøy* (* employee-elected)
Auditor: Deloitte AS
The state’s ownership interest through the Ministry of Trade, Industry and Fisheries: 30 %
© Conoco Phillips
Aker Kværner Holding AS
1 The average dividend percentage is negative, calculated using the definitions on page 125.
53
Income statement (NOK millions) 2015 2014Net interest income 35 358 32 487Net other operating income 18 635 16 877Operating expenses 19 910 20 675Net gains on fixed and intangible assets 45 52Impairment of loans and guarantees 2 270 1 639Operating profit/loss 31 858 27 102Tax expense 7 045 6 463Profit from operationsheld for sale. after taxes -51 -22Profit/loss after tax and minority 24 762 20 617 Balance sheet 2015 2014Cash and deposits with central banks 19 317 58 505Due from credit institutions 301 216 373 409Loans to customers 1 542 744 1 438 839Other assets 735 253 778 588Total assets 2 598 530 2 649 341 Due to credit institutions 161 537 214 214Deposits from customers 944 428 941 534Other debt and liabilities 1 271 533 1 305 552Subordinated loan capital 30 953 29 319Total debt and liabilities 2 408 451 2 490 619Paid-in equity 38 866 38 882Other equity 151 213 119 841Minority interests 0 0Total equity 190 078 158 723Total equity and liabilities 2 598 530 2 649 341 Cash flow 2015 2014Operating activities -43 092 -147 566Investment activities 5 894 -1 360Funding activities -18 604 21 867Foreign currency effects 14 670 19 269Change cash and cash equivalents -41 132 -107 791 Key figures 2015 2014Common equity Tier 1 capital ratio1 14.4 % 12.7 %Tier 1 capital ratio1 15.3 % 13.0 % Capital ratio1 17.8 % 15.2 %Cost/income ratio 36.9 % 41.9 %Net non-performing and net doubtful loans, per cent of net loans 0.76 % 0.96 %Impairment relative to average net loans to customers 0.15 % 0.12 %Return on equity 14.5 % 13.8 %Average return on equity last 5 years 12.7 % – Assets and dividends 2015 2014Market value at year-end 178 842 180 308Price/book2 1.0 1.1Closing price 109.8 110.7Dividend for the financial year 7 330 6 189Dividend percentage 30 % 30 %Average dividend percentage 5 years 27 % –Dividend to the state 2 492 2 104Return including dividends last year 1.9 % 4.7 %Average return last 5 years 9.3 % – Additional information 2015 2014Number of employees 11 840 12 064Proportion of employees in Norway 73 % 73 %State ownership at year-end 34 % 34 %Proportion of women on the board 43 % 38 %Proportion of women among owner-appointed/shareholder elected board members 40 % 40 %
DNB ASA is Norway’s largest financial services group and one of the largest in the Nordic region in terms of market capi-talisation. The Group offers a broad range of financial services, including loans, sav-ing, advisory services, insurance and pen-sions for personal and corporate custom-ers and the public sector. DNB is among the world’s leading banks within its inter-national priority areas, especially energy, shipping, fisheries and seafood. The bank offers 24-hour customer service, tele-phone and online banking, and physical presence in 19 countries and throughout Norway through its branch offices, post offices, and in-store postal and banking outlets. DNB is listed on the Oslo Stock Exchange and is headquartered in Oslo.
Important eventsThe digitalisation of the banking industry and changes in customer behaviour char-acterised 2015. Economic uncertainty re-sulted in a downturn in some industries.
The authorities have introduced strict-er capital requirements over the past few years, and several of these entered into force or were increased during 2015. At the capital markets day in November, DNB presented its new financial ambi-tions, including a plan on how the compa-ny will reach requirement common equity Tier 1 capital. Several measures were im-plemented in the fourth quarter to im-prove capital efficiency, including the sale of individual loans, entering into guaran-tee contracts and property sales.
Corporate social responsibilityDNB’s policy and associated corporate so-cial responsibility guidelines set the standard for all of the Group’s work on compliance and development of responsi-ble business operations. Several factors affect the group’s prioritisation of areas, including input from DNB’s stakeholders
(groups or individuals who are either af-fected by the company’s activities or who can exert a significant influence on DNB’s business). In 2015 the materiality analysis was updated on the basis of feedback from dialogue with stakeholders.
Financial developmentDNB recorded profits of NOK 24,762 mil-lion in 2015, an increase of NOK 4,145 mil-lion from 2014. The improved profit per-formance mainly reflected an increase in net interest income and net other operat-ing income and a reduction in costs.
Higher volumes and wider deposit spreads had a positive effect on net inter-est income in 2015, which was largely at-tributable to exchange rate movements. Other operating income was NOK 1,758 million higher than in 2014, reflecting the effect of basic swaps and an increase in gains on other financial instruments.
Operating expenses were NOK 765 mil-lion lower than in 2014, largely because of the decline in wage costs associated with the transition from defined-benefit to de-fined-contribution pension scheme.
Impaired losses on loans and guarantees increased by NOK 631 million compared with 2014, primarily as a result of higher in-dividual impairment in the shipping and off-shore segment. There was also a rise in col-lective impairment, in part due to the eco-nomic slowdown in some industries.
Common equity Tier 1 capital in-creased by NOK 20.8 billion from the end of 2014 to the end of 2015. Calculated ac-cording to the transitional rules, the com-mon equity Tier 1 capital ratio rose from 12.7% to 14.4%. Return on equity increased from 13.8% to 14.5% during the same peri-od. Adjusted for basis swaps, return on equity declined from 13.6% to 13.3%. DNB is well capitalised, but will continue to build capital organically in order to meet the statutory requirements.
CEO: Rune Bjerke
Board: Anne Carine Tanum (chair), Tore Olaf Rimmereid (deputy chair), Jarle Bergo, Jaan Ivar Semlitsch, Berit Svendsen, Carl Anders Løvvik*, Vigdis Mathisen* (* employee-elected)
Auditor: EY AS
The state’s ownership interest through the Ministry of Trade, Industry and Fisheries: 34 %Company website: www.dnb.no
© D
NB A
SA
1 In accordance with the transitional rules. 2 Excluding hybrid capital.
DNB ASA
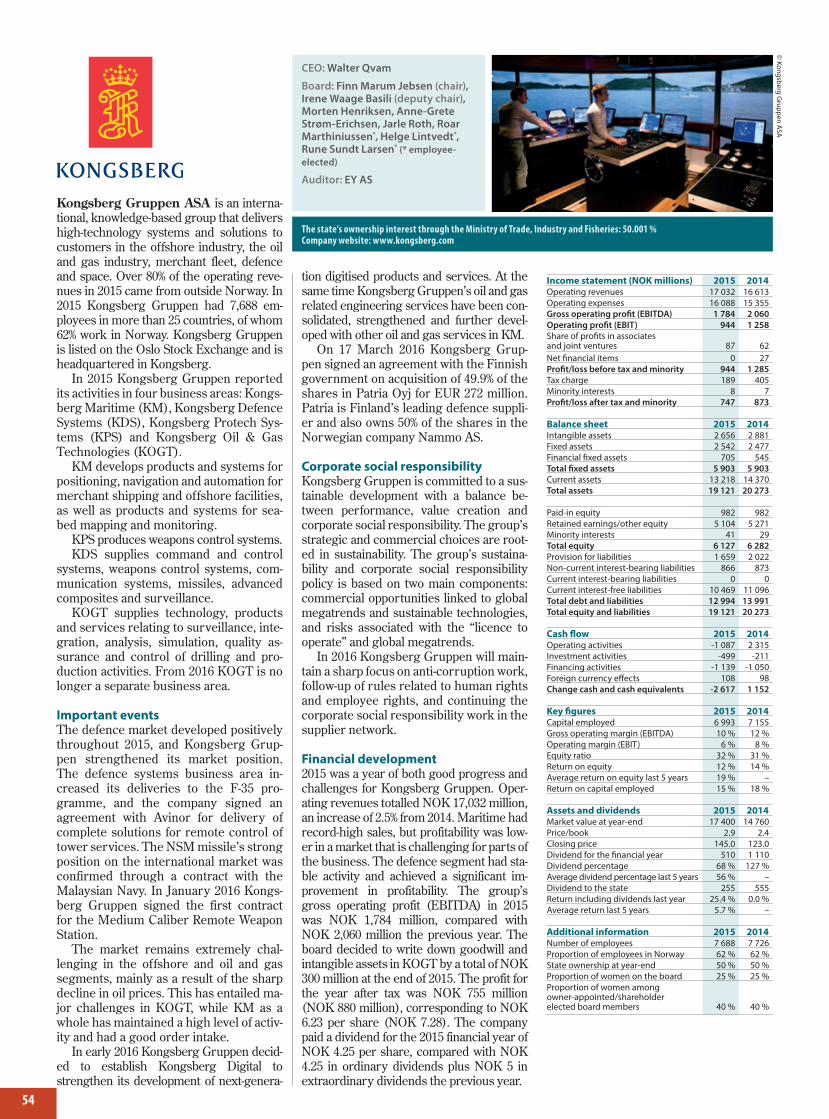
54
Income statement (NOK millions) 2015 2014Operating revenues 17 032 16 613Operating expenses 16 088 15 355Gross operating profit (EBITDA) 1 784 2 060Operating profit (EBIT) 944 1 258Share of profits in associates and joint ventures 87 62Net financial items 0 27Profit/loss before tax and minority 944 1 285Tax charge 189 405Minority interests 8 7Profit/loss after tax and minority 747 873 Balance sheet 2015 2014Intangible assets 2 656 2 881Fixed assets 2 542 2 477Financial fixed assets 705 545Total fixed assets 5 903 5 903Current assets 13 218 14 370Total assets 19 121 20 273 Paid-in equity 982 982Retained earnings/other equity 5 104 5 271Minority interests 41 29Total equity 6 127 6 282Provision for liabilities 1 659 2 022Non-current interest-bearing liabilities 866 873Current interest-bearing liabilities 0 0Current interest-free liabilities 10 469 11 096Total debt and liabilities 12 994 13 991Total equity and liabilities 19 121 20 273 Cash flow 2015 2014Operating activities -1 087 2 315Investment activities -499 -211Financing activities -1 139 -1 050Foreign currency effects 108 98Change cash and cash equivalents -2 617 1 152 Key figures 2015 2014Capital employed 6 993 7 155Gross operating margin (EBITDA) 10 % 12 %Operating margin (EBIT) 6 % 8 %Equity ratio 32 % 31 %Return on equity 12 % 14 %Average return on equity last 5 years 19 % –Return on capital employed 15 % 18 % Assets and dividends 2015 2014Market value at year-end 17 400 14 760Price/book 2.9 2.4Closing price 145.0 123.0Dividend for the financial year 510 1 110Dividend percentage 68 % 127 %Average dividend percentage last 5 years 56 % –Dividend to the state 255 555Return including dividends last year 25.4 % 0.0 %Average return last 5 years 5.7 % – Additional information 2015 2014Number of employees 7 688 7 726 Proportion of employees in Norway 62 % 62 %State ownership at year-end 50 % 50 %Proportion of women on the board 25 % 25 %Proportion of women among owner-appointed/shareholder elected board members 40 % 40 %
Kongsberg Gruppen ASA is an interna-tional, knowledge-based group that delivers high-technology systems and solutions to customers in the offshore industry, the oil and gas industry, merchant fleet, defence and space. Over 80% of the operating reve-nues in 2015 came from outside Norway. In 2015 Kongsberg Gruppen had 7,688 em-ployees in more than 25 countries, of whom 62% work in Norway. Kongsberg Gruppen is listed on the Oslo Stock Exchange and is headquartered in Kongsberg.
In 2015 Kongsberg Gruppen reported its activities in four business areas: Kongs-berg Maritime (KM), Kongsberg Defence Systems (KDS), Kongsberg Protech Sys-tems (KPS) and Kongsberg Oil & Gas Technologies (KOGT).
KM develops products and systems for positioning, navigation and automation for merchant shipping and offshore facilities, as well as products and systems for sea-bed mapping and monitoring.
KPS produces weapons control systems.KDS supplies command and control
systems, weapons control systems, com-munication systems, missiles, advanced composites and surveillance.
KOGT supplies technology, products and services relating to surveillance, inte-gration, analysis, simulation, quality as-surance and control of drilling and pro-duction activities. From 2016 KOGT is no longer a separate business area.
Important eventsThe defence market developed positively throughout 2015, and Kongsberg Grup-pen strengthened its market position. The defence systems business area in-creased its deliveries to the F-35 pro-gramme, and the company signed an agreement with Avinor for delivery of complete solutions for remote control of tower services. The NSM missile’s strong position on the international market was confirmed through a contract with the Malaysian Navy. In January 2016 Kongs-berg Gruppen signed the first contract for the Medium Caliber Remote Weapon Station.
The market remains extremely chal-lenging in the offshore and oil and gas segments, mainly as a result of the sharp decline in oil prices. This has entailed ma-jor challenges in KOGT, while KM as a whole has maintained a high level of activ-ity and had a good order intake.
In early 2016 Kongsberg Gruppen decid-ed to establish Kongsberg Digital to strengthen its development of next-genera-
tion digitised products and services. At the same time Kongsberg Gruppen’s oil and gas related engineering services have been con-solidated, strengthened and further devel-oped with other oil and gas services in KM.
On 17 March 2016 Kongsberg Grup-pen signed an agreement with the Finnish government on acquisition of 49.9% of the shares in Patria Oyj for EUR 272 million. Patria is Finland’s leading defence suppli-er and also owns 50% of the shares in the Norwegian company Nammo AS.
Corporate social responsibilityKongsberg Gruppen is committed to a sus-tainable development with a balance be-tween performance, value creation and corporate social responsibility. The group’s strategic and commercial choices are root-ed in sustainability. The group’s sustaina-bility and corporate social responsibility policy is based on two main components: commercial opportunities linked to global megatrends and sustainable technologies, and risks associated with the “licence to operate” and global megatrends.
In 2016 Kongsberg Gruppen will main-tain a sharp focus on anti-corruption work, follow-up of rules related to human rights and employee rights, and continuing the corporate social responsibility work in the supplier network.
Financial development2015 was a year of both good progress and challenges for Kongsberg Gruppen. Oper-ating revenues totalled NOK 17,032 million, an increase of 2.5% from 2014. Maritime had record-high sales, but profitability was low-er in a market that is challenging for parts of the business. The defence segment had sta-ble activity and achieved a significant im-provement in profitability. The group’s gross operating profit (EBITDA) in 2015 was NOK 1,784 million, compared with NOK 2,060 million the previous year. The board decided to write down goodwill and intangible assets in KOGT by a total of NOK 300 million at the end of 2015. The profit for the year after tax was NOK 755 million (NOK 880 million), corresponding to NOK 6.23 per share (NOK 7.28). The company paid a dividend for the 2015 financial year of NOK 4.25 per share, compared with NOK 4.25 in ordinary dividends plus NOK 5 in extraordinary dividends the previous year.
CEO: Walter Qvam
Board: Finn Marum Jebsen (chair), Irene Waage Basili (deputy chair), Morten Henriksen, Anne-Grete Strøm-Erichsen, Jarle Roth, Roar Marthiniussen*, Helge Lintvedt*, Rune Sundt Larsen* (* employee-elected)
Auditor: EY AS
The state’s ownership interest through the Ministry of Trade, Industry and Fisheries: 50.001 %Company website: www.kongsberg.com
© Kongsberg G
ruppen ASA
Kongsberg Gruppen ASA

55
Income statement (NOK millions) 2015 2014Operating revenues 3 783 3 718Operating expenses 3 499 3 432Gross operating profit (EBITDA) 430 432Operating profit (EBIT) 284 286Net financial items -10 -9Profit/loss before tax and minority 274 277Tax charge 45 73Minority interests 12 15Profit/loss after tax and minority 217 189 Balance sheet 2015 2014Intangible assets 602 481Fixed assets 961 879Financial fixed assets 30 31Total fixed assets 1 593 1 391Current assets 3 048 2 620Total assets 4 641 4 011 Paid-in equity 359 359Retained earnings/other equity 1 970 1 710Minority interests 41 38Total equity 2 370 2 107Provision for liabilities 206 203Non-current interest-bearing liabilities 752 560Current interest-bearing liabilities 0 0Current interest-free liabilities 1 313 1 142Total debt and liabilities 2 271 1 905Total equity and liabilities 4 641 4 011 Cash flow 2015 2014Operating activities 26 277Investment activities -135 -139Financing activities 28 -18Change cash and cash equivalents -81 120 Key figures 2015 2014Capital employed 3 122 2 667Gross operating margin (EBITDA) 11 % 12 %Operating margin (EBIT) 8 % 8 %Equity ratio 51 % 53 %Return on equity 10 % 10 %Average return on equity last 5 years 16 % –Return on capital employed 11 % 13 % Dividends 2015 2014Dividend for the financial year 109 95Dividend percentage 50 % 50 %Average dividend percentage last 5 years 50 % –Dividend to the state 55 47 Additional information 2015 2014Number of employees 2 120 2 160Proportion of employees in Norway 35 % 34 %State ownership at year-end 50 % 50 %Proportion of women on the board 50 % 38 %Proportion of women among owner-appointed/shareholder elected board members 33 % 33 %
Nammo AS was founded in 1998, based on a merger of three major Nordic ammu-nition companies, with a view to strength-ening security of supply in the region. To-day Nammo is a leading supplier of high-end products to the aerospace and de-fence industry. The core business in- cludes development and production of rocket motors, military and sports ammu-nition, shoulder fired systems and envi-ronmentally friendly demilitarisation ser-vices. At the close of 2015 the company had 2,120 employees and 22 production units in 11 countries. Nammo’s head of-fice, with almost one-third of the employ-ees, is located in Raufoss.
Nammo’s vision is “Securing the Fu-ture”. The company will work to secure the future of its customers, owners and employees through delivery of top-quality high-tech products. This in turn creates secure, stable workplaces and a sustaina-ble business.
Nammo is owned by the Norwegian state, represented by the Ministry of Trade, Industry and Fisheries (50%) and Patria Holding Oyj (50%).
Important eventsIn autumn 2015 Nammo Polska Sp.z o.o was established in Warsaw. Long-term partnerships and local presence are of great importance to Nammo. The compa-ny also opened a sales office in the United Arab Emirates.
In August 2015 Morten Brandtzæg took over as CEO, after the previous CEO retired.
From 1 January 2016 a new business unit structure was established, which is more closely aligned with the product ar-eas and markets.
One of the most significant contracts Nammo won in 2015 was a new multi-year agreement to supply AMRAAM rocket motors. Two multi-year contracts from the US authorities for shoulder fired sys-tems were of great importance for Nam-mo’s US subsidiary in the wake of the US military’s budget cuts in recent years.
The disposal of the German Armed Forces’ last inventory of cluster munition was celebrated at Nammo’s demilitariza-tion facility in Germany in autumn 2015.
An important milestone was reached in the first quarter of 2016 when Nammo was awarded a contract by the Norwegian
Armed Forces for the final stages of the development and qualification of a com-plete 155 mm artillery ammunition prod-uct family. The market potential ranges from the Nordic region to various other NATO countries.
Corporate social responsibilityNammo reports in accordance with the Global Reporting Initiative (GRI). During the year, the company has worked on pre-paring for transition from GRI 3 to GRI 4 reporting.
The company adheres to the ten princi-ples of the UN Global Compact and sub-mitted its second report to the Global Compact in summer 2015.
After a risk analysis by DNV GL, Nam-mo implemented an anti-corruption man-ual in addition to the company’s ethical code of conduct. In light of the risk analy-sis, the company also started a new type of anti-corruption training for key person-nel in 2015. Nammo improved its ranking in the Transparency International anti-corruption index for the defence industry in 2015.
Nammo is taking steps to increase the proportion of women in the company. Wom-en currently account for 25% of the compa-ny’s workforce, and the proportion of wom-en in leadership positions is under 10%.
Financial developmentNammo had a profit before tax of NOK 274 million and a profit after tax of NOK 229 million in 2015. Profit before tax is in line with the results for 2014, while profit after tax is NOK 25 million better than last year. Revenue in 2015 rose by 1.8% from the previous year to NOK 3,783 million, where the weaker Norwegian krone re-sulted in growth in the consolidated fig-ures. The company’s equity ratio was 51% and return on equity was 10% in 2015. Nammo had a record-high order backlog of NOK 5,130 million at the close of 2015, which will support the company’s strategy of profitable growth. The company is pay-ing dividends of NOK 109 million for 2015, of which half will go to the state as an owner.
CEO: Morten Brandtzæg
Board: Jan Erik Korssjøen (chair), Heikki Allonen (deputy chair), Dag Opedal, Ingelise Arntsen, Sirpa-Helena Sormunen, Pasi Niinikoski, Marianne Stensrud*, Astrid Berg Ardesjö* (* employee-elected)
Auditor: KPMG AS
The state’s ownership interest through the Ministry of Trade, Industry and Fisheries: 50 %Company website: www.nammo.com
© N
amm
o AS
Nammo AS

56
Income statement (NOK millions) 2015 2014Operating revenues 88 155 78 658Operating expenses 80 409 73 399Gross operating profit (EBITDA) 12 769 10 030Operating profit (EBIT) 7 746 5 259Share of profits in associates and joint ventures 512 415Net financial items -4 833 -3 553Profit/loss before tax and minority 3 425 2 121Tax charge 1 092 892Profit from divested acitivites 0 0Minority interests 313 432Profit/loss after tax and minority 2 020 797 Balance sheet 2015 2014Intangible assets 5 121 5 947Fixed assets 51 174 55 719Financial fixed assets 30 089 28 679Total fixed assets 86 384 90 345Current assets 36 160 35 927Assets held for sale 0 0Total assets 122 544 126 273 Paid-in equity 31 340 31 317Retained earnings/other equity 42 830 42 713Minority interests 5 159 5 911Total equity 79 329 79 941Provision for liabilities 21 846 22 087Non-current interest-bearing liabilities 3 969 5 128Current interest-bearing liabilities 3 562 6 039Current interest-free liabilities 13 837 13 077Total debt and liabilities 43 214 46 331Total equity and liabilities 122 544 126 273 Cash flow 2015 2014Operating activities 14 373 5 965Investment activities -9 391 -2 275Financing activities -7 381 -3 098Foreign currency effects 68 387Avhendet virksomhet 0 -139Change cash and cash equivalents -2 331 840 Key figures 2015 2014Capital employed 86 860 91 108Gross operating margin (EBITDA) 14 % 13 %Operating margin (EBIT) 9 % 7 %Equity ratio 65 % 63 %Return on equity 3 % 1 %Average return on equity last 5 years 2 % –Return on capital employed 10 % 7 % Assets and dividends 2015 2014Market value at year-end 68 546 87 808 Price/book 0.9 1.2Closing price 33.1 42.4Dividend for the financial year 2 042 2 040 Dividend percentage 101 % 256 %Dividend to the state 699 699 Average dividend percentage last 5 years 119 % –Return including dividends last year -19.7 % 60.5 %Average return last 5 years -2.5 % – Additional information 2015 2014Number of employees 13 263 12 922Proportion of employees in Norway 28 % 28 %State ownership at year-end 34 % 34 %Proportion of women on the board 30 % 30 %Proportion of women among owner-appointed/shareholder elected board members 43 % 43 %
Norsk Hydro ASA (Hydro) is a global aluminium company with production, sales and trading activities throughout the value chain, from bauxite, alumina and en-ergy generation to the production of pri-mary aluminium and rolled products as well as recycling. Based in Norway, the company has 13,000 employees involved in activities in more than 50 countries on all continents. Rooted in more than a cen-tury of experience in renewable energy production, technology development and progressive partnerships, Hydro is com-mitted to strengthening the viability of the customers and communities the company serve. Hydro is listed on the Oslo Stock Exchange and is headquartered in Oslo.
Important eventsBy the end of 2015, Hydro’s improvement programmes had resulted in NOK 4.5 bil-lion of annual improvements compared to 2011, of which NOK 0.8 billion was real-ised in 2015. In addition to these annual improvements, by the end of 2015 the joint venture company Sapa delivered an annual improvement of NOK 1 billion through restructuring and synergies. Hy-dro has introduced a new ambition target-ing NOK 2.9 billion of additional annual improvements for the period 2016–2019.
During the year Hydro has continued to strengthen its operations in Brazil. In 2015 talks with the authorities in Para led to renewed deferral of ICMS tax on cer-tain goods and services for a 15 year peri-od. In addition, both Paragominas and Alunorte achieved record-high produc-tion levels in 2015.
A leading technology position supports Hydro’s work on improving operations and the ambition of becoming carbon neu-tral from a life-cycle perspective by 2020. In February 2016 Hydro decided to build a technology pilot at Karmøy, using Hy-dro’s next-generation HAL4e technology. In 2015 Hydro acquired WMR Recycling GmbH, which has the most advanced alu-
minium scrap sorting technology in the world.
In 2015 Hydro entered into long-term power contracts for their Norwegian smelters, the partly-owned aluminium plant Alouette in Canada and the Neuss aluminium plant in Germany.
Corporate social responsibilityThe number of high-risk incidents within Hydro’s operations continued to decline in 2015, and the company’s safety perfor-mance remains among the best in the in-dustry.
Hydro’s climate strategy is an integrat-ed part of the general business strategy, and the company has a long-term goal of becoming climate-neutral by 2020.
In 2015 Hydro imlemented a new sys-tem for planning, monitoring and evaluat-ing social projects in Brazil on three repre-sentative projects.
Hydro reports in accordance with the Global Reporting Initiative (GRI), is mem-ber of the UN’s Global Compact, and has been listed on the Dow Jones sustainabil-ity indices each year since 1999.
Financial developmentThe profit for the year after tax and mi-nority interests was NOK 2,020 million, compared with NOK 797 million in 2014. The negative effects of lower realised al-uminium prices and product premiums were more than offset by the positive currency effects of a stronger US dollar and ongoing improvement work, result-ing in a higher profit for Hydro in 2015. The underlying operating profit increased to NOK 9,656 million in 2015, from NOK 5,692 million in 2014. Operating revenues were up by roughly 12% from previous year to NOK 88 billion. Hydro will pay a dividend of NOK 1 per share in 2016. The dividend reflects the company’s op-erating profit for 2015, a strong financial position and the uncertain market out-look.
CEO: Svein Richard Brandtzæg
Board: Dag Mejdell (chair), Inge Ketil Hansen (deputy chair), Irene Rummelhoff, Eva Persson, Finn Marum Jebsen, Pedro José Rodrigues, Liv Monica Bargem Stubholt, Ove Ellefsen*, Billy Fredagsvik*, Sten Roar Martinsen* (* employee-elected)
Auditor: KPMG AS
The state’s ownership interest through the Ministry of Trade, Industry and Fisheries: 34.26 %Company website: www.hydro.com
© N
orsk Hydro A
SA
Norsk Hydro ASA

57
Income statement (NOK millions) 2015 2014Operating revenues 482 800 622 700Operating expenses 468 000 513 200Gross operating profit (EBITDA) 148 700 210 900Operating profit (EBIT) 14 900 109 500Net financial items -10 600 0Profit/loss before tax and minority 4 300 109 500Tax charge 41 600 87 400Minority interests 200 100Profit/loss after tax and minority -37 500 21 900 Balance sheet 2015 2014Intangible assets 83 300 85 200Fixed assets 546 200 562 100Financial fixed assets 89 300 84 500Total fixed assets 718 800 731 700Current assets 248 000 254 800Assets held for sale 0 0Total assets 966 700 986 400 Paid-in equity 48 100 48 200Retained earnings/other equity 306 700 332 600Minority interests 300 400Total equity 355 100 381 200Provision for liabilities 201 000 216 600Non-current interest-bearing liabilities 275 300 209 600Current interest-bearing liabilities 135 300 179 000Current interest-free liabilities 0 0Total debt and liabilities 611 600 605 200Total equity and liabilities 966 700 986 400 Cash flow 2015 2014Operating activities 109 000 126 500Investment activities -115 100 -112 000Financing activities -7 500 -23 100Foreign currency effects 7 100 5 700Change cash and cash equivalents -6 500 -2 900 Key figures 2015 2014Capital employed 765 700 769 800Gross operating margin (EBITDA) 31 % 34 %Operating margin (EBIT) 3 % 18 %Equity ratio 37 % 39 %Return on equity -10 % 6 %Average return on equity last 5 years 12 % –Return on capital employed 2 % 16 % Assets and dividends 2015 2014Market value at year-end 394 436 418 351Price/book 1.1 1.1Closing price 123.7 131.2Dividends payable1 22 958 33 800Dividend percentage – 154 %Average dividend percentage last 5 years 69 % –Dividend to the state1 15 382 22 646Return including dividends last year -0.8 % -5.2 %Average return last 5 years 2.8 % – Additional information 2015 2014Number of employees 21 581 22 516 Proportion of employees in Norway 88 % 87 %State ownership at year-end 67 % 67 %Proportion of women on the board 45 % 45 %Proportion of women among owner-appointed/shareholder elected board members 38 % 38 %
Statoil ASA is an international technology-based energy company whose main activ-ity is production of oil and gas. The com-pany also has significant downstream op-erations and activities in renewable ener-gy, such as offshore wind farms. The company has operations in more than 37 countries. Statoil is among the world’s largest net sellers of crude oil and con-densate, and is one of the largest suppli-ers of natural gas to the European market. At the end of 2015 the company had ap-prox. 21,600 employees. Statoil is listed on Oslo Stock Exchange and the New York Stock Exchange and is headquartered in Stavanger.
Important eventsOn the Norwegian continental shelf the Va-lemon field and the fast-track development projects Oseberg Delta, Gullfaks Sør Oil and Smørbukk Sør Extension came on stream in 2015. The plan for development and operation (PDO) of the Johan Sver-drup field and the fast-track project Gull-faks Rimfaksdalen were approved by the Ministry of Petroleum and Energy. Recov-erable resources of 1.7–3 billion barrels of oil equivalents make Johan Sverdrup one of the largest oil finds on the Norwegian continental shelf. Production at the field is expected to start in 2019. During 2015 Sta-toil awarded a number of major contracts to companies in the supply industry in con-nection with the project.
Production from the Shell-operated Corrib gas field offshore Ireland, began in December 2015. Phase 2 of the Kizomba satellites in block 15 offshore Angola also came on stream during the year.
New Energy Solutions was established as a new business area in 2015. The main task of the new business unit is to pursue profitable business opportunities in re-newable energy by building on existing expertise and Statoil’s position within off-shore wind.
In 2015 Statoil continued its efforts to op-timise the company’s portfolio and an-
nounced the sale of assets for a total value of NOK 33 billion. In January 2016 Statoil an-nounced the acquisition of 11.93% of the shares in Lundin Petroleum for approx. SEK 4.6 billion.
Corporate social responsibilityStatoil’s ambition is to be an industry lead-er in safe and secure operations, and be recognized as the most carbon efficient oil and gas producer.
Statoil’s efforts to reduce direct green-house gas emissions include improving energy efficiency, reducing methane emissions, eliminating routine flaring and escalating carbon capture and storage. In 2015 flaring at Bakken in the USA was re-duced by over 40%. Statoil has commited to deliver energy efficiency measures for the offshore operations in Norway, result-ing in combined savings of 0.8 million tonnes (accumulated) of carbon dioxide per year between 2008 and 2020. This goal was reached in 2015, and Statoil has there-fore raised the target for 2020 by 50%.
In 2015 Statoil joined the Oil and Gas Climate Initiative, a voluntary, CEO-led grouping that aims to accelerate and guide the industry’s shift towards a low-carbon world.
Financial developmentStatoil’s operating profit for 2015 was NOK 14.9 billion, a decline of 86% com-pared with 2014. The decline in the profit was due to lower prices for oil and gas and substantial write-downs, mainly related to onshore activities in North America. Total equity liquids and gas production was 1.97 million barrels of oil equivalent (boe) a day in 2015, against 1.93 million boe per day in 2014. Start-up of new production and improved regularity were offset by a natural decline in production and sale of assets. Statoil paid a dividend to the share-holders of NOK 7.2 per share in 2015, amounting to a total payout of around NOK 15.4 billion to the state.
CEO: Eldar Sætre
Board: Øystein Løseth (chair), Roy Franklin, Bjørn Tore Godal, Jakob Stausholm, Maria Johanna Oudeman, Wenche Agerup, Rebekka Glasser Herlofsen, Jeroen van der Veer, Ingrid Elisabeth di Valerio*, Stig Lægreid*, Lill-Heidi Bakkerud* (* employee-elected)
Auditor: KPMG AS
The state’s ownership interest through the Ministry of Petroleum and Energy: 67 %Company website: www.statoil.com
© H
arald Pettersen/Statoil ASA
1 Statoil paid dividends for one and a half years in 2014 due to the transition to quarterly dividends.
Statoil ASA

58
Income statement (NOK millions) 2015 2014Operating revenues 128 175 111 443Operating expenses 105 414 86 516Gross operating profit (EBITDA) 43 326 40 456Operating profit (EBIT) 22 761 24 927Share of profits in associates and joint ventures -6 819 -3 859Net financial items -2 920 -1 712Profit/loss before tax and minority 13 022 19 356Tax charge 6 317 6 598Profit from divested acitivites 0 0Minority interests 3 289 3 682Profit/loss after tax and minority 3 414 9 077 Balance sheet 2015 2014Intangible assets 67 830 65 907Fixed assets 69 211 59 562Financial fixed assets 25 555 30 250Total fixed assets 162 596 155 720Current assets 42 313 38 035Total assets 204 909 193 755 Equity attributable to the shareholders in Telenor ASA 58 467 63 755Minority interests 4 660 4 750Total equity 63 127 68 505Provision for liabilities 8 992 9 545Non-current interest-bearing liabilities 63 802 61 113Non-current interest-free liabilities 4 010 1 988Current interest-bearing liabilities 12 626 7 474Current interest-free liabilities 52 352 45 131Total debt and liabilities 141 782 125 251Total equity and liabilities 204 909 193 755 Cash flow 2015 2014Operating activities 37 107 33 851Investment activities -20 281 -20 997Financing activities -15 041 -13 866Foreign currency effects 81 927Change cash and cash equivalents 1 866 -85 Key figures 2015 2014Capital employed 139 555 137 092Gross operating margin (EBITDA) 34 % 36 %Operating margin (EBIT) 18 % 22 %Equity ratio 31 % 35 %Return on equity 6 % 13 %Average return on equity last 5 years 10 % –Return on capital employed 12 % 16 % Assets and dividends 2015 2014Market value at year-end 222 666 227 471Price/book 3.8 3.6Closing price 148.3 151.5Dividend for the financial year 11 261 10 961Dividend percentage 330 % 121 %Average dividend percentage last 5 years 134 % –Dividend to the state 6 078 5 916Return including dividends last year 2.2 % 9.9 %Average return last 5 years 14.5 % –Sales proceeds to the State/ retirement of shares 0 1 048 Additional information 2015 2014Number of employees 35 000 32 099 Proportion of employees in Norway 17.1 % 18.1 %State ownership at year-end 53.97 % 53.97 %Proportion of women on the board 45 % 36 %Proportion of women among owner-appointed/shareholder elected board members 50 % 38 %
Telenor ASA is one of the world’s leading mobile telecommunication operators, with over 200 million mobile subscriptions and 35,000 employees around the world. The company has operations in Norway, Swe-den, Denmark, Hungary, Serbia, Monte-negro, Bulgaria, Thailand, Malaysia, Bangladesh, Pakistan, India and Myan-mar. The company also has a 33% financial stake in VimpelCom Ltd., which operates in 14 countries. Telenor was established in 1994 upon the conversion of Televerket into a limited liability company. The com-pany was listed on the stock exchange in 2000 and is headquartered in Oslo.
Important eventsTelenor appointed a new CEO and board chair in 2015. Sigve Brekke replaced Jon Fredrik Baksaas as CEO, and Gunn Wærsted replaced Svein Aaser as board chair.
Telenor invested considerably in sev-eral of its markets in 2015, partly as a re-sult of the sharp increase in the use of mobile data. In 2015 Telenor passed 200 million mobile subscribers for the first time. Telenor Myanmar made impressive progress in its first year and had 14 mil-lion subscribers at year-end.
In 2015 Telenor withdrew its applica-tion to merge its Danish operation with TeliaSonera, because the companies were unable to agree with the European Com-mission on terms and conditions that were acceptable to all parties.
In February 2016 VimpelCom, in which Telenor holds a 33% stake, an-nounced that the company has admitted to violations of US anti-corruption legisla-tion. VimpelCom has reached a settle-ment agreement with US and Dutch au-thorities whereby the company will pay USD 795 million in fines and forfeiture payments to US and Dutch authorities. VimpelCom will also be subject to inde-pendent external monitoring for at least three years. In 2015 Telenor stated that it plans to sell its shares in VimpelCom.
In February 2016 Telenor acquired Ta-pada Inc., which is a world leader in mar-keting technology. The acquisition will position Telenor in the rapidly growing market for advertising and marketing technology.
Corporate social responsibilityIn 2015 Telenor further improved its in-ternal whistle-blowing procedures and fo-cused on anti-corruption, human rights and responsible monitoring of the supply chain. Telenor scored highly on Deloitte’s benchmarking of ethics and compliance for 2014.
Telenor has continued its work on hu-man rights issues, including emergency preparedness and transparency in relation to privacy and handling of personal data and has participated in various trade fo-rums etc.
Telenor maintains its awareness on cli-mate and environmental issues and in 2015 was the only Norwegian company and the only Nordic telecom operator on CDP’s A-list. (CDP is an independent or-ganisation that collects and publishes in-formation on companies’ greenhouse gas emissions, among other things). This is the second time running that Telenor is on this list.
Financial developmentTelenor’s revenue in 2015 totalled NOK 128 billion, an increase of 15% from the pre-vious year. The increase was largely due to currency gains and revenue growth in sev-eral markets, particularly from operations in Myanmar. This was partially offset by tougher market conditions in Thailand, Denmark and Malaysia. Organic revenue growth was 5%. Gross operating margin (EBITDA) was 33.8% in 2015, down from the previous year, mainly related to a li-cence refund in India and divestment of Conax in 2014. The underlying EBITDA margin was 34.5%, the same as the previ-ous year, in part due to increased contribu-tions from Myanmar, India, Pakistan and Bangladesh.
Telenor’s profit for the year after tax and minority interests was NOK 3.4 bil-lion, down from NOK 9.1 billion the previ-ous year. The profit was negatively affect-ed by write-downs totalling NOK 2.1 bil-lion related to operations in Denmark and NOK 5.4 billion related to the sharehold-ing in VimpelCom. The write-downs are due to the fact that the outlook for the Danish telecommunications market re-mains challenging, as well as a change in the valuation of VimpelCom shares in the accounts in connection with the decision to sell the shares. In addition, the profit was negatively impacted by Telenor’s share of VimpelCom’s provision, which amounted to NOK 2.4 billion. Telenor is paying a dividend of NOK 7.5 per share for the 2015 financial year, amounting to NOK 11.3 billion in total.
CEO: Sigve Brekke
Board: Gunn Wærsted (chair), Franck Emmanuel Dangeard, Burckhard Bergmann, Sally Margaret Davis, Dag Jakob Opedal, Jon Erik Reinhardsen, Marit Vaagen, Regi Aalstad, Per Gunnar Salomonsen*, Åse Selfjord*, Harald Stavn* (* employee-elected)
Auditor: EY AS
The state’s ownership interest through the Ministry of Trade, Industry and Fisheries: 53.97 %Company website: www.telenor.com
© Bo M
athiesen
Telenor ASA

59
Income statement (NOK millions) 2015 2014Operating revenues 111 897 95 343Operating expenses 97 793 85 037Gross operating profit (EBITDA) 21 037 14 983Operating profit (EBIT) 14 104 10 305Share of profits in associates and joint ventures -310 786Net financial items -3 149 -1 057Profit/loss before tax and minority 10 644 10 035Tax charge 2 209 2 092Minority interests 351 319Profit/loss after tax and minority 8 083 7 625 Balance sheet 2015 2014Intangible assets 9 583 12 008Fixed assets 52 424 44 584Financial fixed assets 15 675 16 467Total fixed assets 77 681 73 059Current assets 41 182 38 573Total assets 118 863 111 632 Paid-in equity 583 586Retained earnings/other equity 73 307 63 180Minority interests 1 837 4 196Total equity 75 727 67 962Provision for liabilities 12 382 12 786Non-current interest-bearing liabilities 9 354 10 609Current interest-bearing liabilities 5 737 4 805Current interest-free liabilities 15 664 15 471Total debt and liabilities 43 137 43 671Total equity and liabilities 118 863 111 632 Cash flow 2015 2014Operating activities 14 631 8 607Investment activities -6 888 -9 700Financing activities -8 304 -2 387Foreign currency effects 189 246Change cash and cash equivalents -371 -3 233 Key figures 2015 2014Capital employed 90 818 83 376Gross operating margin (EBITDA) 19 % 16 %Operating margin (EBIT) 13 % 11 %Equity ratio 64 % 61 %Return on equity 12 % 13 %Average return on equity last 5 years 18 % –Return on capital employed 17 % 16 % Assets and dividends 2015 2014Market value at year-end 105 329 92 205Price/book 1.4 1.4Closing price 382.9 333.8Dividend for the financial year 4 113 3 581Dividend percentage 51 % 47 %Average dividend percentage last 5 years 37 % –Dividend to the state 1 489 1 297Return including dividends last year 18.6 % 32.6 %Average return last 5 years 6.0 % –Sales proceeds to the State/ retirement of shares 127 211 Additional information 2015 2014Number of employees 12 883 12 073Proportion of employees in Norway 8 % 8 %State ownership at year-end 36.21 % 36.21 %Proportion of women on the board 38 % 38 %Proportion of women among owner-appointed/shareholder elected board members 40 % 40 %
Yara International ASA (Yara)’s largest business area is the production, distribu-tion and sale of nitrogen-based chemicals. The products are mostly used in mineral fertilisers, but industrial application is an important and rapidly growing area. The company has 30 production units, of which two are in Norway: in Glomfjord and Herøya. Yara has a global presence, and the company’s distribution and mar-keting network encompasses more than 200 terminals, warehouses, blending plants and bagging facilities in more than 50 countries. Yara has just under 12,900 employees, who handle sales in over 150 countries. Yara is listed on the Oslo Stock Exchange and is headquartered in Oslo.
Important eventsIn 2015 Yara has increased its production capacity by ensuring full ownership of the ammonia plant Yara Pilbara in Australia. In addition, together with BASF, Yara initi-ated the construction of an ammonia plant in Freeport, Texas, and began investing in increased production capacity for urea and nitrate at the Sluiskil plant in the Netherlands.
In December 2015 Yara acquired Greenbelt Fertilizers, a leading distribu-tor of fertiliser in Zambia, Malawi and Mo-zambique. This acquisition, which is ex-pected to be concluded in the first half of 2016, confirms Yara’s long-term presence in Africa and will further strengthen the company’s position in a rapidly growing agricultural region.
Yara has invested USD 132 million in a phosphate project in Salitre in Brazil on confirmation of the size of the phosphate reserves.
Yara has divested businesses where a sale represented the greatest value crea-tion for shareholders; for example Yara sold its 50% stake in GrowHow UK to CF Industries and announced the sale of the European CO2 business and its 34% stake in Yara Praxair to Praxair.
Corporate social responsibilityAs a member of the UN Global Compact Yara has undertaken to follow its princi-
ples on human rights, the environment, employee rights and anti-corruption. The company reports to and is approved by FTSE4Good. In addition, Yara adheres to the OECD Guidelines for Multinational Enterprises and Anti-Bribery Convention, and the company supports the UN Sus-tainable Development Goals.
Yara’s strategy is for the company to make a difference by creating value for its shareholders, customers and employees, and for society in general. In line with these principles, Yara operates a number of commercial projects with a develop-ment perspective. Examples include the Southern Agricultural Growth Corridor of Tanzania (SAGCOT) project, the Patient Procurement Platform in partnership with the World Food Programme, AGRA, Rabobank and others, as well as the devel-opment of catalyst technology and opera-tions that have more than halved Yara’s greenhouse gas emissions since 2004.
Financial developmentYara delivered solid financial results in 2015, with CROGI (cash return on gross investment) of 14%, compared with the tar-get of at least 10% over the business cycle. Global fertiliser deliveries were 1% higher than in 2014, mainly as a result of the acqui-sition of OFD Holding Inc. in Latin America and Galvani in Brazil. Margins were lower compared with 2014, as fertiliser prices fell more than raw material costs in 2015.
In 2015 Yara’s net profit after minority interests was NOK 8,083 million, which is 6% higher than in 2014. The most impor-tant reasons for the improvement in the results are lower gas prices in Europe and the stronger US dollar. Yara maintained its strong financial position in 2015. The debt–equity ratio decreased from 0.17 to 0.16, as strong cash inflows, including the sale of GrowHow UK, funded increased investing activities and dividends to share-holders. The company is paying a divi-dend of NOK 15 per share in 2016, related to the results for 2015, up from NOK 13 per share the previous year, entailing a to-tal disbursement of around NOK 4,126 million to the shareholders.
CEO: Svein Tore Holsether
Board: Leif Teksum (chair), Maria Moræus Hanssen (deputy chair), Geir Petter Isaksen, Hilde Bakken, John Gabriel Thuestad, Geir Olav Sundbø*, Rune Bratteberg*, Guro Mauset* (* employee-elected)
Auditor: Deloitte AS
The state’s ownership interest through the Ministry of Trade, Industry and Fisheries: 36,21 %Company website: www.yara.com
© Yara International A
SA
Yara International ASA

Statkraft is a leading international hydropower company, Europe’s largest supplier of renewable energy, and a global market player in energy trading. In 2015 the company had revenues of NOK 20 billion and a result after tax and minority interests of NOK -1.7 billion.

Category 3 Commercial and other specifically defined objectives
This category includes companies where the state’s ownership has commercial objectives and other societal reasons for state ownership than maintaining the head office in Norway. The state’s expected results and return depend on the companies’ risk profiles. The companies operate in markets with other commercially-oriented players.
Aerospace Industrial Maintenance Norway SF 62Argentum Fondsinvesteringer AS 63Eksportfinans ASA 64Electronic Chart Centre AS 65GIEK Kredittforsikring AS 66Investinor AS 67Kommunalbanken AS 68NSB AS 69Posten Norge AS 70Statkraft SF 71
61
© Statkraft SF

Income statement (NOK millions) 2015 2014Operating revenues 578.9 506.5Operating expenses 555.6 436.5Gross operating profit (EBITDA) 51.7 97.9Operating profit (EBIT) 23.3 70.0Net financial items 0.8 0.8Profit/loss before tax and minority 24.1 70.8Tax charge 9.9 19.2Minority interests 0.0 0.0Profit/loss after tax and minority 14.1 51.6 Balance sheet 2015 2014Intangible assets 63.2 76.2Fixed assets 271.7 255.6Financial fixed assets 0.1 0.0Total fixed assets 335.0 331.8Current assets 340.2 327.1Total assets 675.3 658.9 Paid-in equity 353.0 353.0Retained earnings/other equity 55.2 41.1Minority interests 0.0 0.0Total equity 408.2 394.1Provision for liabilities 170.4 170.6Non-current interest-bearing liabilities 0.0 0.0Current interest-bearing liabilities 0.0 0.0Current interest-free liabilities 96.9 94.2Total debt and liabilities 267.0 264.8Total equity and liabilities 675.3 658.9 Cash flow 2015 2014Operating activities 11.3 47.9Investment activities -36.9 -54.9Financing activities 0.0 0.0Change cash and cash equivalents -25.7 -7.0 Key figures 2015 2014Capital employed 408.2 394.1Gross operating margin (EBITDA) 9 % 19 %Operating margin (EBIT) 4 % 14 %Equity ratio 60 % 60 %Return on equity 4 % 14 %Average return on equity last 4 years 4 % –Return on capital employed 6 % 19 % Dividends 2015 2014Dividends 2015 2014Dividend for the financial year 0 0Dividend percentage 0 % 0 %Dividend percentage last 4 years 0 % –Dividend to the state 0 0 Additional information 2015 2014Number of employees 423 436Proportion of employees in Norway 100 % 100 %State ownership at year-end 100 % 100 %Proportion of women on the board 29 % 29 %Proportion of women among owner-appointed/shareholder elected board members 40 % 40 %
Aerospace Industrial Maintenance Norway SF (AIM Norway) was estab-lished in 2011 when the Norwegian Air Force’s main maintenance facility at Kjel-ler was converted to a state enterprise. The company represents the most experi-enced aeronautical community in Nor-way, with continuous operations since 1916. At the close of 2015 AIM Norway had 423 employees at 22 production units, organised in the areas of aircraft mainte-nance, engine maintenance, maintenance of electronic components, mechanical processes and engineering. The company supplies maintenance, repair and modifi-cation services for aircraft, helicopters, components and field equipment to the Norwegian Armed Forces and other mili-tary and civilian organisations. The pro-duction units have a long history of work-ing very closely with the Norwegian Armed Forces’ units at Kjeller and the Norwegian Air Force. The company’s mission is to be the preferred supplier of products and services for air and ground systems, and its vision is to deliver world class aerospace services.
Important eventsIn 2015 AIM Norway signed a major Per-formance Based Logistics agreement with the Norwegian Armed Forces’ Defence Logistics Organisation regarding mainte-nance of Sea King helicopter engines. There was tough international competi-tion for this contract. AIM Norway also signed a framework agreement with Au-gusta Westland for support in connection with the new search and rescue helicop-ter, AW101, covering delivery of a wide range of services. AIM Norway’s interna-tional drive, including the establishment in the UK, has thus far paid off.
AIM Norway started production of horizontal and vertical surfaces for the F-35 tail fin in 2015. During the year, the company delivered three complete sets that were assembled and surface treated at the Kjeller plant. AIM Norway thereby
achieved certification as an approved sup-plier to Lockheed Martin.
Parallel to the new activities, extensive maintenance work continues to be per-formed at the Kjeller plant, primarily of F-16s and Sea Kings. This is expected to decrease slightly going forwards. In the future, AIM Norway will perform engine maintenance for F135 at Rygge.
Corporate social responsibilityAIM Norway actively pursues corporate social responsibility and has established CSR guidelines, which have been incorpo-rated into its governance system. The guidelines for corporate social responsi-bility provide an overarching framework for the work to integrate social and envi-ronmental aspects into the company’s op-erations.
AIM Norway has joined the UN Global Compact initiative and works to promote Global Compact’s ten universally accept-ed principles. The company is working to comply with the OECD Guidelines for Multinational Enterprises and bases its work with its suppliers on the core con-ventions of the International Labour Or-ganisation (ILO). AIM Norway focuses on safety, local involvement, human resourc-es, occupational health and safety, work-ing conditions, anti-corruption, human rights and the environment.
Financial developmentIn 2015 AIM Norway’s revenue was NOK 579 million (compared with NOK 507 mil-lion the previous year) and returned a profit before tax of NOK 24 million (NOK 71 million). The result for 2014 was im-pacted by recognition of NOK 55 million related to changes in the pension obliga-tions in the Norwegian Public Service Pension Fund due to changes in the rules for disability benefit and life expectancy adjustments. The company has equity of NOK 408 million and a solvency ratio of 60%. The company’s liquidity is adequate, at NOK 43 million in liquid assets.
CEO: Ove Radvik Haukåssveen
Board: Jan Erik Korssjøen (chair), Grethe Fossli (deputy chair), Petter Andreas Berg, Svein Ivar Hansen, Tone Merete Lindberg, Bjørn Lien*, Øivind Kongsvold* (* employee-elected)
Auditor: Deloitte AS
The state’s ownership interest through the Ministry of Defence: 100 %Company website: www.aimnorway.com
© Aeorospace Industrial M
aintenance Norw
ay SF
62
Aerospace Industrial Maintenance Norway SF
63
Income statement (NOK millions) 2015 2014Operating revenues 488 801Operating expenses 67 62Gross operating profit (EBITDA) 420 739Operating profit (EBIT) 420 739Net financial items 17 9Profit/loss before tax and minority 437 748Tax charge 36 -25Minority interests 0 0Profit/loss after tax and minority 401 773 Balance sheet 2015 2014Intangible assets 32 68Fixed assets 7 9Financial fixed assets 6 651 6 674Total fixed assets 6 690 6 751Current assets 1 311 1 097Total assets 8 001 7 848 Paid-in equity 4 650 4 650Retained earnings/other equity 3 305 3 154Minority interests 0 0Total equity 7 955 7 804Provision for liabilities 0 0Non-current liabilities 2 0Current interest-bearing liabilities 0 0Current interest-free liabilities 44 44Total debt and liabilities 46 44Total equity and liabilities 8 001 7 848 Cash flow 2015 2014Operating activities 750 417Investment activities -0 60Financing activities -250 -250Change cash and cash equivalents 500 227 Key figures 2015 2014Capital employed 7 957 7 804Gross operating margin (EBITDA) 86 % 92 %Operating margin (EBIT) 86 % 92 %Equity ratio 99 % 99 %Return on equity 5 % 10 %Average return on equity last 5 years 10 % –Return on capital employed 6 % 10 % Dividends 2015 2014Dividend for the financial year 500 250Dividend percentage 125 % 32 %Average dividend percentage last 5 years 57 % –Dividend to the state 500 250 Additional information 2015 2014Number of employees 22 24Proportion of employees in Norway 100 % 100 %State ownership at year-end 100 % 100 %Proportion of women on the board 60 % 60 %Proportion of women among owner-appointed/shareholder elected board members 60 % 60 %
Argentum Fondsinvesteringer AS (Ar-gentum) is a company that invests in pri-vate equity funds. The company was es-tablished in 2001 to manage the state’s in-vestments in private equity funds and contribute to a better functioning capital market for unlisted companies. Argentum is currently invested in 101 funds, which in turn own 569 unlisted companies and is the largest Norwegian venture investor. Argentum is headquartered in Bergen and has an office in Oslo.
Argentum specialises in funds in north-ern Europe and in international energy funds. Argentum commits capital to funds that invest in unlisted companies. Invest-ments are divided into buy-out funds and venture funds.
Argentum Asset Management is the group’s asset management company. The company’s core competence is evaluation and selection of private equity funds and fund managers. Investments are made by investing in newly established funds (pri-mary), by acquiring interests in existing funds (secondary) or through co-invest-ments with fund managers. Argentum As-set Management also manages assets for private investors. Since 2008, one-third of the new capital committed through Ar-gentum Asset Management comes from external investors.
Important eventsA survey conducted by the analysis agen-cy Menon Economics in 2015 on on behalf of Argentum found that Norwegian com-panies owned by funds that Argentum has invested in have created 26,000 jobs through organic growth since 2002. Based on Statistics Norway’s figures for the pe-riod, this represents every tenth new job in Norway. Together these companies employ 53,000 people, and 25% of the jobs are linked to oil-related activities.
Argentum committed a total of NOK 723 million in eight new funds in 2015, in-cluding Norvestor VII, EQT VII, MB Fund V and EnCap Energy Capital Fund X. Total realisations in the portfolio in 2015 amounted to NOK 1,660 million.
Corporate social responsibilityAssessment of corporate social responsi-bility is an integral part of all investment decisions in Argentum and in the monitor-ing of managers of funds that Argentum has invested in. The company also assists its managers develop their processes re-lated to corporate social responsibility.
Argentum is a member of the UN Glob-al Compact and reports to the organisa-tion yearly. In 2015 the company signed a statement for support of the Women’s Empowerment Principles, an initiative to promote gender equality under the aus-pices of the UN.
Argentum is actively involved in NOR-SIF, an independent association of inves-tors interested in responsible and sustain-able development, which in 2015 focused in particular on equity funds and sustain-ability.
Financial developmentArgentum achieved a group profit of NOK 401 million in 2015, compared with NOK 779 million the previous year. The net profit from group investments in private equity funds totalled NOK 470 million in 2015, compared with NOK 774 million in 2014. The market value of the group’s in-vestment portfolio in private equity funds was NOK 6,504 million at year-end 2015, compared with NOK 6,528 million the pre-vious year. The return on the investment portfolio was 15.6% p.a. at the end of 2015 (before Argentum’s own operating costs), measured since its establishment in 2001.
CEO: Joachim Høegh-Krohn
Board: Tom Knoff (chair), Grethe Høiland (deputy chair), Mari Thjømøe, Kjell Martin Grimeland, Tina Steinsvik Sund
Auditor: PricewaterhouseCoopers AS
The state’s ownership interest through the Ministry of Trade, Industry and Fisheries: 100 %Company website: www.argentum.no
© A
rgentum Fondsinvesteringer A
S
Argentum Fondsinvesteringer AS

64
Income statement (NOK millions) 2015 2014Interest income 1 776 2 261Interest costs 1 402 1 800Net interest income 374 461Net operating income -780 -6 060Operating expenses 142 180Net losses 0 0Operating profit/loss -548 -5 779Tax charge -172 -1 506Profit/loss after tax -376 -4 273 Balance sheet 2015 2014Cash and receivables from credit institutions 7 053 12 370Lending 24 462 33 372Securities 24 187 27 991Other assets 9 440 11 896Total assets 65 142 85 629 Debt to credit institutions 0 0Customer deposits 0 0Other debt and liabilities 57 733 76 904Subordinated loan capital 0 965Total debt 57 733 77 869Paid-in equity 2 771 2 771Retained earnings 4 638 4 989Total equity 7 409 7 760Total equity and liabilities 65 142 85 629 Cash flow 2015 2014Operating activities 16 205 22 253Investment activities 6 945 8 189Financing activities -27 245 -31 807Foreign currency effects 909 1 124Change cash and cash equivalents -3 186 -241 Key figures 2015 2014Tier 1 capital ratio 36 % 24 %Capital ratio 36 % 24 %Loss ratio lending 0 % 0 %Return on equity -5 % -43 %Average return on equity last 5 years 0 % – Dividends 2015 2014Dividend for the financial year 0 0Dividend percentage 0 % 0 %Average dividend percentage last 5 years 0 % –Dividend to the state 0 0 Additional information 2015 2014Number of employees 44 48Proportion of employees in Norway 100 % 100 %State ownership at year-end 15 % 15 %Proportion of women on the board 33 % 33 %Proportion of women among owner-appointed/shareholder elected board members 40 % 40 %
Eksportfinans ASA was established in 1962 and is located in Oslo. The company actively manages a portfolio of loans to the Norwegian export industry, foreign buyers of Norwegian capital goods, and the municipal sector in Norway. Almost all of the loans are guaranteed by The Norwegian Export Credit Guarantee Agency (GIEK) and/or banks. The com-pany also manages a portfolio of interna-tional securities. Business is funded through bonds and commercial paper is-sued in the international capital markets. At the close of 2015 the company had 44 employees and was owned by 23 commer-cial and savings banks in addition to the state, represented by the Ministry of Trade and Industry. The state acquired its 15% ownership interest through a private placement in 2001.
Important eventsIn 2015 Eksportfinans’ operations were stable, and it had good liquidity and finan-cial strength. In February 2016 Standard & Poor’s upgraded the company’s credit rating to BBB with a positive outlook.
The company continued to manage its existing portfolio of assets and liabilities in accordance with signed agreements, but without granting new loans. This strat-egy was established in 2012, in connection with Eksportkreditt Norge being made responsible for providing new state-sup-ported export credits. As expected, the company’s value in the statement of finan-cial position declined during the year.
Corporate social responsibilityThe board of Eksportfinans has adopted guidelines for corporate social responsibili-
ty. Eksportfinans’ Social Responsibility Poli-cy provides ethical guidelines for the com-pany, and guidelines on environmentally friendly operations, environmental and so-cial requirements for projects funded by Ek-sportfinans, anti-corruption measures, measures to prevent money laundering and whistle-blowing. The policy document is publicly available on the company’s website.
Financial developmentNet interest income in 2015 was NOK 374 million, compared with NOK 461 million the previous year. The decline was pri-marily due to lower interest-bearing bal-ance. The profit from the underlying busi-ness, excluding unrealised gains and losses on financial instruments and losses hedged by the portfolio hedge agree-ment, was NOK 172 million (NOK 130 million). The result was boosted by ex-traordinary income in the first three quar-ters of the year. Comprehensive income in accordance with IFRS was NOK -351 mil-lion (NOK -4,273 million). The negative figures are primarily due to the reversal of previous unrealised gains on the Eksport-finans’s own debt. This effect was smaller in 2015 due to the lower remaining bal-ance of previous unrealised gains amount-ing to NOK 1.6 billion (net of derivatives) at the end of 2015. This balance will con-tinue to be reversed as unrealised losses in the income statement in the future. At the end of 2015 Eksportfinans had assets totalling NOK 65.1 billion. Debts and lia-bilities amounted to NOK 57.7 billion, and equity was NOK 7.4 billion. The capital adequacy ratio and Tier 1 capital ratio were both 36.5%. Eksportfinans did not pay a dividend in 2015.
CEO: Geir Bergvoll
Board: Sigurd Carlsen (chair), Christian Berg (deputy chair), Tone Lunde Bakker, Bjørn Berg, Marianne Heien Blystad, Rune Helgeland* (* employee-elected)
Auditor: PricewaterhouseCoopers AS
The state’s ownership interest through the Ministry of Trade, Industry and Fisheries: 15 %Company website: www.eksportfinans.no
© Eksportfinans A
SA
Eksportfinans ASA

65
Income statement (NOK millions) 2015 2014Operating revenues 25.4 22.9Operating expenses 26.0 26.6Gross operating profit (EBITDA) -0.3 -3.2Operating profit (EBIT) -0.6 -3.8Net financial items 0.1 0.2Profit/loss before tax -0.6 -3.6Tax charge -1.7 0.0Profit/loss after tax 1.2 -3.6 Balance sheet 2015 2014Intangible assets 3.1 1.4Fixed assets 0.2 0.4Financial fixed assets 0.0 0.0Total fixed assets 3.3 1.8Current assets 15.5 14.0Total assets 18.8 15.7 Paid-in equity 10.0 10.6Retained earnings/other equity 0.0 0.0Total equity 10.0 10.6Provision for liabilities 0.0 0.0Non-current liabilities 0.0 0.0Current interest-bearing liabilities 0.0 0.0Current interest-free liabilities 8.8 5.1Total debt and liabilities 8.8 5.1Total equity and liabilities 18.8 15.7 Key figures 2015 2014Capital employed 10.0 10.6Gross operating margin (EBITDA) -1 % -14 %Operating margin (EBIT) -2 % -17 %Equity ratio 53 % 67 %Return on equity 11 % -29 %Average return on equity last 5 years 3 % –Return on capital employed -5 % -29 % Dividends 2015 2014Dividend for the financial year 3.0 0.0Dividend percentage 273 % 0 %Average dividend percentage last 5 years 489 % –Dividend to the state 3.0 0.0 Additional information 2015 2014Number of employees 17 19Proportion of employees in Norway 100 % 100 %State ownership at year-end 100 % 100 %Proportion of women on the board 33 % 40 %Proportion of women among owner-appointed/shareholder elected board members 33 % 40 %
Electronic Chart Centre AS (ECC) shall contribute to increased safety at sea through maritime innovation and the op-eration of socially beneficial infrastruc-ture and technology. The company was established as a limited company in 1999 and has 17 employees. The company’s ac-tivities are concentrated on delivery of services that ensure that Norway meets its obligations pursuant to international and national strategies regarding safety at sea, while also meeting requirements from new areas of use and new technolo-gy for players on land and at sea.
Important eventsIn 2015 Ralph E. Daber took over as the new CEO of ECC after Robert Sandvik.
ECC developed and launched a new service in 2015 for customers who have purchased their map data via a PRIMAR ENC Service distributor. The service has been named ENC improver and is a ser-vice for reporting errors, deficiencies and ideas for improvement in electronic nauti-cal charts. The purpose of this service is to enable direct feedback from users on the official electronic charts.
PRIMAR Update Tracker was deliv-ered by ECC to the PRIMAR service. This service visualises all the changes in the nautical charts to increase users’ aware-ness of changes in the charts since the last update. At the same time, the mari-time division of the Norwegian Mapping Authority, which is part of the PRIMAR partnership, will gain a tool that can be used in connection with producing and updating maps.
On commission from the Norwegian Mapping Authority, ECC has started an extensive development project to support the International Hydrographic Organisa-tion (IHO)’s S-102 standard for bathymet-ric maps (topographic maps of the sea floor). ECC is involved in this pioneering work and is participating in a project un-der the Norwegian Mapping Authority’s management, along with the Norwegian Coastal Administration, the Norwegian
Armed Forces and players from Sweden and Denmark, to find solutions to facili-tate the production, distribution, quality control and display of data. The S-102 pro-ject aims to pave the way for the produc-tion, testing and trials of S-102 data and also generate valuable experience that can be used in IHO’s standardisation work. ECC has accepted responsibility for developing and establishing solutions for quality control, display and distribution of S-102 data.
ECC has launched the product Map-Tag in collaboration with Smart Manage-ment. Map-Tag is a service for emergency preparedness and planning activities that enable holistic integration of maps and sources of value-adding information, such as tracking information, weather data, lo-cation data, etc. Map-Tag enables users to tag their assets, resources, vessels and other relevant equipment so that they can be tracked and maintained in real time through consistently updated charts.
Corporate social responsibilityECC evaluates and prioritises develop-ment activities, cooperation and business procedures and has a strong awareness of its corporate social responsibility. In 2015 ECC helped facilitate secure information flow, integration of nautical charts with value-added information services and quality assurance of nautical chart data.
Financial developmentThe company had a profit after tax of NOK 1.2 million in 2015. The company’s return on capital employed was -5%, and its equity ratio was 53%. A dividend of NOK 3 million will be paid for 2015. ECC has had a period of investment for future growth, with focus on new business op-portunities and establishment in different user environments. International conven-tions and strategies that impose increased use of ECC’s products and services will provide opportunities for future opera-tions, at the same time as current invest-ments are expected to yield results.
CEO: Ralph Emmanuel Daber
Board: Tina Steinsvik Sund (chair), Knut Ole Flåthen (deputy chair), Nicolai Jarlsby
Auditor: KPMG AS
The state’s ownership interest through the Ministry of Trade, Industry and Fisheries: 100 %Company website: www.ecc.no
© Electronic Chart Centre A
S
The state’s ownership interest through the Ministry of Trade, Industry and Fisheries: 15 %Company website: www.eksportfinans.no
Electronic Chart Centre AS

66
Income statement (NOK millions) 2015 2014Premiums. net of reinsurance 56.1 75.1Allocated return on investments from the non-technical accounts 2.6 5.5Other insurance-related income 3.7 4.4Claims incurred. net of reinsurance -9.6 -64.7Insurance-related operating expenses. net of reinsurance -46.6 -27.0Change in security provision -15.0 25.0Profit/loss of technical account general insurance -8.8 18.4Net income from investments 0.6 9.4Allocated return on investments trans- ferred to the technical accounts -2.6 -5.5Other income 1.3 2.1Profit/loss. non-technical accounts -0.7 6.0Profit/loss from ordinary activities -9.5 24.4Tax expense 1.7 -6.7Profit/loss before of other comprehensive income components -7.8 17.8Actuarial profit/loss 22.4 -18.5Tax on actuarial profit/loss -5.6 5.0Profit/loss after tax 9.0 4.3 Balance sheet 2015 2014Intangible assets 10.0 5.9Investments 345.4 366.0Reinsurers’ share of insurance related liabilities. gross 68.0 182.0Receivables 22.6 5.9Other assets 46.4 80.8Prepaid expenses and earned. not received income 0.9 1.4Total assets 493.3 642.1 Insurance-related liabilities. gross 393.1 535.6Pension liabilities 12.1 32.5Other liabilities 25.3 20.1Total liabilities 430.5 588.3Paid-in equity 35.0 35.0Retained earnings 27.8 18.8Total equity 62.8 53.8Total equity og forpliktelser 493.3 642.1 Cash flow 2015 2014Operating activities -40.3 51.0Investment activities 12.4 -17.8Financing activities 0.0 0.0Change cash and cash equivalents -27.9 33.2 Key figures 2015 2014Capital ratio 25.9 % 20.4 %Solvency margin 549 % 520 %Cost ratio 83.0 % 36.0 %Loss ratio 17.1 % 86.1 %Combined ratio 100.2 % 122.1 %Return on equity 15.4 % 8.2 %Average return on equity last 4 years 3.8 % – Dividends 2015 2014Dividend for the financial year 0 0Dividend percentage 0 % 0 %Dividend percentage last 3 years 0 % –Dividend to the state 0 0 Additional information 2015 2014Number of employees 34 34Proportion of employees in Norway 100 % 100 %State ownership at year-end 100 % 100 %Proportion of women on the board 57 % 43 %Proportion of women among owner-appointed/shareholder elected board members 50 % 50 %
GIEK Kredittforsikring AS’s history dates back to 1922, with insurance of fish exports to Russia. The company was part of The Norwegian Export Credit Guaran-tee Agency (GIEK) until 2001, when it was demerged as a separate limited com-pany. The state’s ownership was managed by GIEK until the end of 2014. The man-agement of the state’s ownership was transferred to the Ministry of Trade, In-dustry and Fisheries on 1 January 2015.
GIEK Kredittforsikring has offices in Oslo and provides credit insurance and related activities. The company empha-sizes good, responsible access to credit insurance for small and medium-sized businesses. GIEK Kredittforsikring shall operate on a commercial basis and with a view to delivering competitive returns.
Important eventsIn 2015 GIEK Kredittforsikring has in-vested in new technical and support sys-tems that will help improve customer ex-perience and ensure increased efficiency and better control in the organisation.
The company reviewed its business strategy in 2015. A new prioritized area is companies that do not currently export, but that sell products and services in the Norwegian domestic market.
It has been resource-demanding to fol-low up the processing of defaults and compensation claims in the wake of the import stop of, among others, seafood to Russia and the unrest in Ukraine in 2015. Nevertheless, at year-end the compensa-tion figures were lower than expected.
In Norway the new EU directive for in-surance companies (Solvency II) has been incorporated into the new Act on financial undertakings and financial groups. The rules entered into force on 1 January 2016, but key parts of the regulations have been in force as transitional provi-sions in 2014 and 2015.
Corporate social responsibilityGIEK Kredittforsikring’s ambition is for the company’s operations and products to create added value for its customers and
help create jobs in Norway. The company is largely aimed at small and medium-sized businesses and has customers throughout Norway.
GIEK Kredittforsikring does not direct-ly affect trade between the company’s cus-tomers and their clients. Nevertheless, it is a clear goal for GIEK Kredittforsikring to help reduce the risk of corruption, money laundering and financing of terror-ism between the company’s customers and their clients. GIEK Kredittforsikring will accordingly contribute to transparent commerce. Preventive work is done through requirements for good documen-tation. In addition, a separate clause has been incorporated into the insurance terms and conditions to combat these types of offences. A procedure has also been established for compliance with laws and regulations on money laundering and financing of terrorism.
Financial development2015 was a challenging year for GIEK Kredittforsikring as many of its customers no longer had access to key markets like Russia and Ukraine. The company has had a significant reduction in its premiums rev-enues, particularly because of the loss of Russia as a market for its customers, as well as increased competition. Sales that previously went to Russia and Ukraine have gone to other markets where the risk and premium levels are lower. However, default payments and claims for damages from 2014 have developed more positively than anticipated at the beginning of 2015. The low level of interest rates mean a low return on the company’s investment port-folio. The company’s pension liabilities have been significantly reduced from 2014 due to changes in the assumptions for, among others, the discount rate and the expected wage development in the compa-ny. The profit for 2015 was NOK 9 million. An increase in the security provision and a healthy profit for the year have resulted in a strengthening of the company’s capital adequacy. The company will not pay divi-dends for 2015.
CEO: Erica Blakstad
Board: Mai-Lill Ibsen (chair), Anne Breiby (deputy chair), Trygve Young, Trond Ellingsen, Einar Westby, Inger Marie Sperre, Kristine Bugge-Lie* (* employee-elected)
Auditor: PricewaterhouseCoopers AS
The state’s ownership interest through the Ministry of Trade, Industry and Fisheries: 100 %Company website: www.giekkreditt.no
© G
IEK Kredittforsikring AS
GIEK Kredittforsikring AS

67
Income statement (NOK millions) 2015 2014Operating revenues 120 -69Operating expenses 65 54Gross operating profit (EBITDA) 56 -122Operating profit (EBIT) 55 -122Net financial items 5 26Profit/loss before tax and minority 60 -96Tax charge 0 4Minority interests 0 0Other income and expenses in the period 0 0Profit/loss after tax and minority 60 -100 Balance sheet 2015 2014Intangible assets 5 6Fixed assets 1 1Financial fixed assets 1 607 1 360Total fixed assets 1 613 1 367Current assets 428 602Total assets 2 041 1 970 Paid-in equity 1 728 1 801Retained earnings/other equity 283 148Minority interests 0 0Total equity 2 011 1 949Provision for liabilities 10 12Non-current interest-bearing liabilities 0 0Current interest-bearing liabilities 0 0Current interest-free liabilities 19 9Total debt and liabilities 30 21Total equity and liabilities 2 041 1 970 Cash flow 2015 2014Operating activities -172 -486Investment activities 173 484Financing activities 0 0Change cash and cash equivalents 1 -3 Key figures 2015 2014Capital employed 2 011 1 949Gross operating margin (EBITDA) 46 % –Operating margin (EBIT) 46 % –Equity ratio 99 % 99 %Return on equity 3 % -5 %Average return on equity last 5 years -3 % –Return on capital employed 3 % -5 % Dividends 2015 2014Dividend for the financial year 0 0Dividend percentage 0 % 0 %Average dividend percentage last 5 years 0 % –Dividend to the state 0 0 Additional information 2015 2014Number of employees 21 22Proportion of employees in Norway 100 % 100 %State ownership at year-end 100 % 100 %Proportion of women on the board 40 % 43 %Proportion of women among owner-appointed/shareholder elected board members 40 % 43 %
Investinor AS invests in competitive, in-ternationally oriented companies, primar-ily start-ups. In addition to investment in the early stages of growth, the company has some flexibility towards investing in companies in the expansion phase. Inves-tinor exercises competent, active owner-ship. The company is operated on com-mercial terms in accordance with the mar-ket investor principle in the EEA agree-ment, and offers a good long-term return with good spread of risk. Investinor sells its stake in portfolio companies when oth-er owners are better suited to take them to the next level. Investinor’s vision is to transform promising companies into glob-al leaders by working with entrepreneurs and other investors.
Important eventsIn 2015 Investinor invested in six new portfolio companies and conducted 25 follow-up investments in its portfolio com-panies. A total of NOK 751 million of ven-ture capital was injected into the portfolio companies, of which Investinor contribut-ed with NOK 261 million.
The investment portfolio increased from 28 to 33 companies.
In the first quarter of 2015 the portfolio company GasSecure AS was sold to the German company Dräger Holding Inter-national GmbH. Since 2010 Investinor had invested a total of NOK 18.1 million in the company and received NOK 117 million in return.
Geir Ove Kjesbu resigned from the po-sition as CEO in March 2016. Conse-quently, CFO Tor Helmersen was appoint-ed acting CEO.
Corporate social responsibilityInvestinor is a responsible investor that will contribute to sustainable wealth creation by taking into account environmental, social and governance (ESG) issues in all its investments. Investinor has incorporated ESG considerations into its investment analysis, decision-making processes and active exercise of ownership. Investinor has committed to the UN’s Global Compact and the UN’s Principles for Responsible In-vestment. Investinor has emphasized devel-oping good internal procedures in order to identify and handle challenges associated with the investment process, i.e. during the analysis and negotiation phase before In-vestinor becomes a co-owner of a company.
In 2015 Investinor prepared a new, more detailed ESG policy for the company’s business. Investinor has also further devel-oped and quality assured its methodology for analysing ESG risks in investments.
Financial developmentAs an investment company Investinor’s operating revenues consist of changes in the value of the investment portfolio. In 2015 Investinor’s operating revenues to-talled NOK 120 million, compared with NOK -68.6 million the previous year. The improvement was due to higher gains on the sale of ownership stakes and a strong-er positive net change in the market value of the investment portfolio. The operating profit for 2015 amounted to NOK 55 mil-lion, compared with a loss of NOK -122 million the previous year. Investinor had a profit for 2015 of NOK 60.1 million (NOK -100 million). Comprehensive income for the period was NOK 62.6 million.
CEO: Geir Ove Kjesbu1
Board: Thomas Falck (chair), Åse Koll Lunde (deputy chair), Beatriz Malo de Molina, Svein Sivertsen, Hans Aasnæs
Auditor: Deloitte AS
The state’s ownership interest through the Ministry of Trade, Industry and Fisheries: 100 %Company website: www.investinor.no
© A
nne Elisabeth Næ
ss
Investinor AS
1 Geir Ove Kjesbu was CEO at the end of 2015. Tor Helmersen was appointed acting CEO 30 March 2016.

68
Income statement (NOK millions) 2015 2014Interest income 5 496 6 011Interest costs 3 884 4 520Net interest and credit income 1 612 1 491Other operating revenues 1 122 -695Operating expenses 151 123Net losses 0 0Operating profit/loss 2 583 673Tax charge 713 182Profit/loss after tax 1 870 491 Balance sheet 2015 2014Cash and receivables from credit institutions 19 428 16 219Net lending 256 815 249 928Securities 149 944 157 364Other assets 23 174 31 955Total assets 449 361 455 466 Debt to credit institutions 7 167 25 135Customer deposits 0 0Other debt and liabilities 428 228 420 100Subordinated loan capital 1 764 1 895Total debt 437 159 437 929Paid-in equity 3 145 2 145Subordinated bonds 994 0 Retained earnings 8 063 6 191Total equity 12 202 8 336Total equity and liabilities 449 361 446 265 Cash flow 2015 2 014Operating activities -7 302 -39 189Investment activities 69 -50Financing activities -45 917 6 763Change cash and cash equivalents -53 150 -32 476 Key figures 2015 2014Common equity tier 1 capital ratio 15.1 % 12.3 %Tier 1 capital ratio 16.5 % 12.3 %Capital ratio 18.8 % 14.5 %Cost ratio 5.5 % 15.5 %Los provions as percentage of gross lending 0 % 0 %Loss ratio lending 0 % 0 %Return on equity 18 % 6 %Average return on equity last 5 years 17 % – Dividends 2015 2014Dividend for the financial year 417 0Dividend percentage 22 % 0 %Average dividend percentage last 5 years 17 % –Dividend to the state 417 0Capital contributions from the State 1 000 0 Additional information 2015 2014Number of employees 72 56Percentage of employees in Norway 100 % 100 %State ownership at year-end 100 % 100 %Proportion of women on the board 44 % 44 %Proportion of women among owner-appointed/shareholder elected board members 43 % 43 %
Kommunalbanken AS, Kommunalbank-en Norway (KBN), was founded in 1999 as a continuation of the state-owned bank Norges Kommunalbank, which was estab-lished in 1927. KBN offers loans to munici-palities, county administrations and compa-nies that perform municipal functions. KBN has granted loans to almost all the municipalities in Norway and has a market share of just below 50%. Lending is financed through borrowing in the capital markets. KBN has the highest possible credit rating (AAA rating). High investor confidence, broad market expertise and a good finan-cial infrastructure give KBN access to sta-ble and cost-effective financing. This ena-bles KBN to facilitate financing of the mu-nicipal sector and help ensure that munici-palities have access to financing.
KBN’s vision is: “Long-term partner for local welfare”. The vision is supported by the values “open, responsible and hands-on”.
KBN shall facilitate cost-effective, long-term financing for the municipal sector. KBN offers the same interest rate terms irrespective of the size of the loan or the municipality, reflecting the company’s sectoral policy function. At the same time KBN shall provide the state with a return on the capital it has invested. The re-quired rate of return for the period 2013–2015 was 10% of value-adjusted equity af-ter tax. KBN is subject to the supervision of the Financial Supervisory Authority of Norway and has been identified as a sys-tematically important financial institution in Norway.
Important eventsKBN granted 591 new loans in 2015, with a combined value of NOK 46.8 billion. A large portion of the new loans has fi-nanced schools, kindergartens, care homes, water, sewage and waste disposal, and transport and communications. At year-end 2015 KBN’s total loans to the local government sector amounted to NOK 254 billion. Total new borrowings for 2015 were NOK 68.6 billion.
KBN wants to help Norwegian munici-palities reach their climate targets. To this end KBN has a special interest-rate prod-uct for climate-friendly investments. In 2015 the proportion of lending to climate-friendly projects increased by 12%, and the volume of outstanding loans was NOK 12.2 billion at year end.
The state’s required rate of return as an owner for the period 2016–2018 was set
to 8% in the national budget for 2016. The revision downwards from the previous pe-riod is related to the fact that the combina-tion of a higher equity ratio and un-changed risk profile serves to reduce risk, and the fact that the risk-free interest rate has been falling in recent years.
Corporate social responsibilityIn 2015 the board of KBN gave priority to work on corporate social responsibility in the areas of ethical conduct, anti-corrup-tion and money laundering, and climate change and the environment.
KBN has conducted seminars and a dedicated e-learning programme on ethi-cal issues.
KBN helps develop the capital market for “green” financing by issuing bonds that finance the municipalities’ climate and environmental investments. The pro-cess has been certified by Cicero, and KBN’s bonds were listed on the Oslo Stock Exchange’s “green” list in 2015. KBN has established a special lending product with a lower interest rate to cre-ate incentives for increased investments that help reduce greenhouse gas emis-sions.
KBN is an Eco-Lighthouse enterprise.
Financial developmentProfit after tax came to NOK 1,870 million in 2015, compared with NOK 491 million the previous year. Net interest income was stable and satisfactory and on a par with 2014. The profit was also affected by the reversal of unrealised losses of NOK -734 million in 2014 to gains of NOK 1,116 million in 2015. KBN’s equity increased by NOK 3.9 billion in 2015 thanks to a profit well above expectations, injected equity capital and the issue of hybrid capi-tal instruments. The operating costs re-mained low and constituted 0.03% of the total assets. The profit after tax entails a return on value-adjusted equity of 20.8%, compared with 6.1% the previous year. In 2015 KBN’s lending rose by 3% and is re-lated to the equity ratio increase. KBN is paying dividends of NOK 417 million to the owner for 2015.
CEO: Kristine Falkgård
Board: Else Bugge Fougner (chair), Martin Skancke (deputy chair), Martha Takvam, Nanna Egidius, Rune Sollie, Rune Midtgaard, Petter Steen jr., Marit Urmo Harstad*, Jarle Byre* (* employee-elected)
Auditor: EY AS
The state’s ownership interest through the Ministry of Local Government and Modernisation: 100 %Company website: www.kommunalbanken.no
© Kom
munalbanken A
S
Kommunalbanken AS

69
Income statement (NOK millions) 2015 2014Operating revenues 15 372 15 336Operating expenses 13 274 13 663Gross operating profit (EBITDA) 3 548 3 297Operating profit (EBIT) 2 098 1 673Share of profits in associates and joint ventures 180 147Unrealised changes in the value of invest- ment properties and upon reclassification 536 181Net financial items -150 -404Profit/loss before tax and minority 2 664 1 597Tax charge 506 88Minority interests 9 4Profit/loss after tax and minority 2 149 1 505 Balance sheet 2015 2014Intangible assets 87 64Fixed assets 19 121 18 621Financial fixed assets 346 283Total fixed assets 19 554 18 968Current assets 9 282 8 883Total assets 28 836 27 851 Paid-in equity 5 144 5 144Retained earnings/other equity 4 691 3 262Minority interests 3 -6Total equity 9 838 8 400Provision for liabilities 1 243 830Non-current interest-bearing liabilities 10 387 9 926Non-current interest-free liabilities 2 345 2 552Current interest-bearing liabilities 1 534 2 495Current interest-free liabilities 3 489 3 648Total debt and liabilities 18 998 19 451Total equity and liabilities 28 836 27 851 Cash flow 2015 2014Operating activities 2 233 1 338Investment activities -1 429 -637Financing activities -1 532 320Foreign currency effects 46 15Change cash and cash equivalents -682 1 036 Key figures 2015 2014Capital employed 21 759 20 821Gross operating margin (EBITDA) 23 % 21 %Operating margin (EBIT) 14 % 11 %Equity ratio 34 % 30 %Return on equity 24 % 18 %Average return on equity last 5 years 14 % –Return on capital employed 13 % 11 % No. of train journeys in Norway (millions) 67.1 63.3Punctuality passenger trains (on time at final destination) 88.6 88.3Freight transport in Norway (million tonnes/km) 1 917 1 813Freight transport in Norway (1000 TEU) 373 376 Public purchases 2015 2014Income from the state 3 091 2 996 Dividends 2015 2014Dividend for the financial year 595 753Dividend percentage 28 % 50 %Average dividend percentage last 5 years 38 % –Dividend to the state 595 753 Additional information 2015 2014Number of employees 12 668 12 962Proportion of employees in Norway 88 % 91 %State ownership at year-end 100 % 100 %Proportion of women on the board 38 % 25 %Proportion of women among owner-appointed/shareholder elected board members 60 % 40 %
NSB AS was established as a separate company in 1996 and has been organised as a limited company since 2002. The company is one of Norway’s largest trans-port groups and also has operations in Sweden and Denmark. The NSB group consists of the business areas passenger trains (NSB AS, NSB Gjøvikbanen AS and Svenska Tågkompaniet AB), freight trans-port (CargoNet AS), bus operations (Nett-buss AS), train maintenance (Mantena AS) and property (ROM Eiendom AS), as well as support functions. The company’s head office is in Oslo.
NSB’s social mission is to provide effi-cient, available, safe and environmentally friendly transport of passengers and freight. The company operates passenger transport by train in Norway, transport of passengers and freight in Norway and other Nordic countries, and other opera-tions that are naturally related to these.
Important eventsIn its consideration of the white paper Report no. 27 to the Storting (2014–2015) On the Right Track. Reform of the rail-way sector and Recommendation no. 386 to the Storting (2014–2015), the Storting approved the proposal for a new organi-sation of the railway sector and the intro-duction of competition in passenger rail transport. The reform entails major changes for the NSB group: passenger rolling stock, ROM Eiendom AS, Mante-na AS and functions related to sales and ticketing are being moved out of NSB in order to facilitate for competition in pas-senger rail transport. The passenger rail market is being divided into six to eight tenders, with the first two tenders planned to be in operation from Decem-ber 2018. These tenders make up about 25% of the revenues of the Norwegian part of NSB’s passenger train operations. The state will directly award a PSO (pub-lic service obligation) contract to NSB after the current contract expires at the end of 2017. The contract will allow a
controlled and predictable phasing down of NSBs directly awarded traffic.
NSB’s expansion of its railway services has helped to increase the number of trav-ellers by 5.7% in the last year and by 26% over the past four years.
Investments in and delivery of new pas-senger trains are continuing, and 71 trains had been put into operation at the end of 2015. Altogether 125 new train sets have been ordered.
NSB’s customer satisfaction score rose by three points in 2015 to 73.
NSB’s freight operations have under-gone a major reorganisation and deliv-ered an operating profit in 2015 for the first time in eight years.
Corporate social responsibilityIn 2014 the transport sector accounted for 31% of Norway’s total greenhouse gas emis-sions. With its rail, bus and real estate op-erations, the NSB group plays a central role in facilitating change in transport patterns towards more public transport and thereby helping reduce emissions. Important meas-ures for NSB include an improved timeta-ble and increased capacity on passenger trains, the development of traffic hubs and residential and commercial buildings in connection with these hubs, and sustaina-ble freight traffic by rail. In 2015 NSB con-tinued its work to improve energy efficien-cy throughout the entire group.
Financial developmentNSB achieved its best financial result ever in 2015, with a consolidated profit after tax of NOK 2,158 million, compared with NOK 1,509 million the previous year. The improvement is primarily attributable to a strong operating profit in passenger train operations, mainly due to growth in the number of passenger journeys, improved profits in bus and freight operations due to cost efficiencies, and considerable profits related to the development and sale of prop-erty. The group’s revenue was NOK 15,372 million, and return on recorded equity was 23.5%.
CEO: Geir Isaksen
Board: Kai Henning Gjesdal Henriksen1 (chair), Bjarne Borgersen (deputy chair), Kjerstin Fyllingen, Åsne Havnelid, Wenche Teigland, Rolf Jørgensen*, Audun Sør-Reime*, Jan Audun Strand* (* employee-elected)
Auditor: Deloitte AS
The state’s ownership interest through the Ministry of Transport and Communications: 100 %Company website: www.nsbkonsernet.no
© M
ads Kristiansen
1 Kai Henning Gjesdal Henriksen was chair at 31 March 2016, but passed away 27 May 2016.
NSB AS

70
Income statement (NOK millions) 2015 2014Operating revenues 25 074 24 404Operating expenses 25 080 23 687Gross operating profit (EBITDA) 1 167 1 789Operating profit (EBIT) -6 717Share of profits in associates and joint ventures 245 126Net financial items -88 -123Profit/loss before tax and minority 151 720Tax charge 212 271Minority interests 1 2Profit/loss after tax and minority -62 447 Balance sheet 2015 2014Intangible assets 2 718 3 140Fixed assets 5 574 4 914Financial fixed assets 619 481Total fixed assets 8 910 8 535Current assets 7 188 6 330Assets held for sale 0 1 512Total assets 16 097 16 377 Paid-in equity 4 112 4 112Retained earnings/other equity 1 816 2 093Minority interests -2 -1Total equity 5 926 6 205Provisions for liabilities 1 450 1 439Non-current interest-bearing liabilities 2 111 1 904Non-current interest-free liabilities 36 63Current interest-bearing liabilities 896 1 626Current interest-free liabilities 5 678 5 140Total debt and liabilities 10 171 10 172Total equity and liabilities 16 097 16 377 Cash flow 2015 2014Operating activities 1 213 1 175Investment activities 485 -897Financing activities -998 4Change cash and cash equivalents 700 282 Key figures 2015 2014Capital employed 8 933 9 735Gross operating margin (EBITDA) 5 % 7 %Operating margin (EBIT) 0 % 3 %Equity ratio 37 % 38 %Return on equity -1 % 7 %Average return on equity last 5 years 6 % –Return on capital employed 8 % 13 %Postal service outlets 1 400 1 420Delivery quality A-priority post (overnight delivery) 85 % 86 % Dividends 2015 2014Dividend for the financial year 0 300Dividend percentage 0 % 67 %Average dividend percentage last 5 years 65 % –Dividend to the state 0 300 Subsidies from the State/ Public purchases 2015 2014Purchase of postal and banking services 418 231 Additional information 2015 2014Number of employees 19 895 19 804Proportion of employees in Norway 80 % 81 %State ownership at year-end 100 % 100 %Proportion of women on the board 50 % 50 %Proportion of women among owner-appointed/shareholder elected board members 50 % 50 %
Posten Norge AS (Posten) is a Nordic mail and logistics group that develops and delivers complete solutions within postal services, communications and logistics. The markets for the group’s services are largely international and are characterised by strong competition and major structural and technological changes. Posten’s ambi-tion is to further develop its position as the market leader in Norway through industri-alisation and organic growth and to devel-op profitable positions in the Nordic region within selected service areas.
Posten was established in 2002 through the conversion of the special-legislation company Posten Norge BA (formerly the public sector enterprise Postverket) to a limited company. The Posten group com-prises the parent company Posten Norge AS and a range of wholly and partly owned subsidiaries. Posten’s social mission is to ensure the nationwide operation of deliv-ery services in a proper and cost-effective manner. The company shall operate postal and logistics operations on a commercial basis. Posten is headquartered in Oslo.
Important eventsIn 2015 the Storting adopted a new Postal Services Act, which came into force on 1 January 2016. The new law allows for free competition throughout the entire postal market and continues the scope of the obli-gation to provide universal postal services, with the exception of postal delivery on Sat-urdays. Statutory services will be secured through agreements with providers of postal services. During the course of 2016 the Min-istry of Transport and Communications will enter into an agreement on the distribution of subscription newspapers on Saturdays, and Posten is going to submit a tender.
Market conditions were challenging in 2015 and the beginning of 2016. Lower activ-ity in the oil industry affected the logistics business in Norway significantly, both di-rectly in the business area Offshore & En-ergy and through ripple effects to other busi-ness areas. The volume of letters decreased by 6.4% in 2015. The decline was increasing towards the end of the year and into 2016.
The work on a new co-located terminal structure for mail, packages and goods and investments in new terminals are well under way and will help to industrialise the business, streamline operations and improve competitiveness.
Corporate social responsibilityPosten reports on corporate social respon-sibility in accordance with the Global Re-porting Initiative framework and bases its operations on the core conventions of the International Labour Organisation (ILO).
The group maintains a particular focus on the areas of occupational health and safety, climate change and the environment, and diversity and integration. Sickness absence fell from 9.3% in 2006 to 6% in 2015, and the group is currently below the average for the Norwegian labour market. The decline means that 550 more people are at work every day. This yields annual savings of around NOK 200 million for Posten and NOK 315 million for society.
In relation to the external environment, the group has set a goal of 40% less carbon emissions by 2020, compared with 2008. In 2015 CO2 emissions were reduced by 28,658 tonnes, a 6% decrease from the pre-vious year. The group currently has Nor-way’s largest electrical fleet, with a total of over 1,100 low emission vehicles.
The group employs people of more than 70 nationalities and has been a “rac-ism-free zone” since 2001. As part of its focus on diversity and integration, Posten offers an internal development pro-gramme for employees with an immigrant background and a mentoring programme for unemployed immigrant women.
Financial developmentThe group’s total operating revenues in 2015 were NOK 25,074 million, up 2.7% from the previous year. Logistics is the group’s largest segment, accounting for 62% of the revenues. Operating revenues from foreign operations made up 35.3% of the group’s sales in 2015, against 33.3% the previous year. For several years the group has realised significant cost efficiencies as a result of rationalisation programmes in both the postal and the logistics segments. It has nevertheless proven difficult to fully compensate for declining volumes of mail. Return on invested capital before non-re-curring items and amortisation (ROIC) for 2015 was 9.9%, down 4 percentage points from the previous year. The group’s operat-ing profit after non-recurring items and amortisation was NOK 239 million in 2015, down from NOK 844 million in 2014. The decline in profit is strongly affected by the decline in activity in the oil sector, weaker market conditions in Norway, and the drift towards services with lower margins. The group’s result after tax was a loss of NOK -61 million in 2015, compared with a profit of NOK 449 million in 2014.
CEO: Dag Mejdell
Board: Idar Kreutzer (chair), Randi Bakkerud Sætershagen (deputy chair), Tove Andersen, Anne Britt Berentsen, Morten Karlsen Sørby, Terje Wold, Siv Astrid Ryan Andersen*, Tom Sørensen*, Ann Elisabeth Wirgerness*, Odd Christian Øverland* (* employee-elected)
Auditor: EY AS
The state’s ownership interest through the Ministry of Transport and Communications: 100 %Company website: www.posten.no
© Posten N
orge AS
Posten Norge AS

71
Income statement (NOK millions) 2015 2014Net operating revenues 20 089 25 869Operating expenses 16 241 12 226Gross operating profit (EBITDA) 10 213 17 677Operating profit (EBIT) 3 848 13 643Share of profits in associates and joint ventures 683 730Net financial items -5 306 -5 941Profit/loss before tax and minority -775 8 432Tax charge 1 550 3 991Minority interests -598 684Profit/loss after tax and minority -1 727 3 758 Balance sheet 2015 2014Intangible assets 5 195 2 821Fixed assets 109 051 97 008Financial fixed assets 31 585 30 384Total fixed assets 145 831 130 213Current assets 28 008 34 508Total assets 173 839 164 721 Paid-in equity 48 250 48 250Retained earnings/other equity 28 274 29 713Minority interests 8 443 7 823Total equity 84 967 85 786Provision for liabilities 21 393 19 089Derivater 3 736 3 556Non-current interest-bearing liabilities 37 410 27 438Current interest-bearing liabilities 7 185 8 186Current interest-free liabilities 19 148 20 666Total debt and liabilities 88 872 78 935Total equity and liabilities 173 839 164 721 Cash flow 2015 2014Operating activities 8 669 6 822Investment activities -9 834 -4 404Financing activities -2 631 2 150Foreign currency effects 195 362Change cash and cash equivalents -3 601 4 930 Key figures 2015 2014Capital employed 129 562 121 410Gross operating margin (EBITDA) 51 % 68 %Operating margin (EBIT) 19 % 53 %Equity ratio 49 % 52 %Return on equity -2 % 5 %Average return on equity last 5 years 2 % –Return on capital employed 4 % 14 % Assets and dividends 2015 2014Dividend for the financial year 0 6 007Dividend percentage 0 % 160 %Average dividend percentage last 5 years 207 % –Dividend to the state 0 6 007Capital contributions from the State 0 5 000Guarantee amount 400 400Guarantee provision to the State 2 2 Additional information 2015 2014Number of employees 4 170 3 348Proportion of employees in Norway 57 % 66 %State ownership at year-end 100 % 100 %Proportion of women on the board 50 % 44 %Proportion of women among owner-appointed/shareholder elected board members 60 % 50 %
Statkraft SF is the parent company in the Statkraft group. Statkraft SF is a leading international hydropower company, Eu-rope’s largest supplier of renewable ener-gy, and a global market player in energy trading. Statkraft is the Nordic region’s second-largest producer of electrical pow-er. The group owns 356 power plants with a total installed capacity of 18,471 MW (Statkraft’s share) with the following dis-tribution by technology: 81.3% hydropow-er, 14.1% gas power, 4.4% wind power and 0.2% biopower. Most of the installed capac-ity is in Norway, at 69.9%, while the Nordic region excluding Norway accounts for 8.6%, Europe excluding the Nordic region accounts for 16.6%, and the rest of the world accounts for 4.9%. Statkraft also has a total installed capacity in district heating of 794 MW in Norway and Sweden. Stat-kraft is headquartered in Oslo.
Statkraft’s ambition is to strengthen its position as a leading international suppli-er of pure energy. Statkraft is well posi-tioned to participate in Europe’s transition to cleaner energy generation and to con-tribute new, clean energy in emerging markets. The following five strategic are-as will be prioritised: European flexible power production, market operations, hy-dropower in emerging markets, wind power and district heating.
Important eventsThe 2015 financial year saw high activity, and Statkraft invested NOK 13.6 billion, of which more than half was in new capacity. Statkraft completed significant invest-ments in upgrading of Nordic hydropow-er plants, the largest being Øvre Røssåga and Nedre Røssåga power plants. Stat-kraft strengthened its international posi-tion through acquisitions in Brazil and Chile. Hydropower plants in Turkey and Peru were completed. In Sweden, a wind power plant was brought into operation, and it was decided to invest in an onshore wind farm in Scotland. Statkraft has joined forces with partners to build Europe’s largest onshore wind power plant in cen-tral Norway. The six wind farms will have a total installed capacity of 1,000 MW.
The group has reduced its investment plan in other areas due to lower power prices and the Storting’s revised dividend policy, which was adopted in December 2015. This basically means that the group will not invest in new offshore wind power projects and that some international hy-dropower projects will be postponed.
Corporate social responsibilityStatkraft adheres to globally-renowned initiatives and standards. Follow-up of cor-porate social responsibility is an integrat-ed part of Statkraft’s governance system. In 2015 Statkraft established a new health and safety programme to strengthen the group’s work in this area. The programme includes new training modules and focus-es on high-risk activities. As part of the group’s preventive anti-corruption work, risk analyses and needs assessments were conducted in all the business areas in 2015, and new training programmes tai-lored to the individual employee were in-troduced.
Financial developmentStatkraft’s operating profit in 2015 was weakened by the low Nordic power pric-es, which are at their lowest level in 15 years. Total power production was 56.3 TWh, at the same level as the previous year, while the Nordic system price was 29% lower. The contribution from growth investments in international hydropower increased, and market operations contin-ued to contribute significantly to the group’s gross operating profit (EBITDA). All the segments made a positive contri-bution to the group’s underlying EBITDA, which amounted to NOK 10.2 billion, down 16% from the previous year. Write-downs and negative currency effects re-lated to financial items of NOK -2.3 billion affected the group’s profit after tax. The currency effects, primarily as a result of the depreciation of the Norwegian krone against the euro, were offset by transla-tion effects in equity. At the end of 2015 the group’s equity was at the same level as the previous year.
CEO: Christian Rynning-Tønnesen
Board: Olav Fjell (chair), Berit Rødseth (deputy chair), Halvor Stenstadvold, Hilde Drønen, Elisabeth Morthen, Vilde Eriksen Bjerknes*, Asbjørn Sevlejordet*, Thorbjørn Holøs* (* employee-elected)
Auditor: Deloitte AS
The state’s ownership interest through the Ministry of Trade, Industry and Fisheries: 100 %Company website: www.statkraft.no
© Statkraft SF
Statkraft AS

72 S TAT E N S E I E R B E R E T N I N G 2 0 1 2 – S E L S K A P S O MTA L E72
Nye Veier’s activities include planning, construction, operation and maintenance of stretches of national highways that are covered by the company’s portfolio.

73
Category 4 Sector policy objectives
State ownership in the companies in category 4 generally have sectoral policy objectives. The targets for these companies should be adapted to the purpose of the ownership of each company. As the owner, the state emphasizes that the sectoral policy objectives being achieved as efficiently as possible.
73
© Agder O
PS
Andøya Space Center AS 74Avinor AS 75Bjørnøen AS 76Carte Blanche AS 77AS Den Nationale Scene 78Den Norske Opera & Ballett AS 79Eksportkreditt Norge AS 80Enova SF 81Gassco AS 82Gassnova SF 83Graminor AS 84Innovasjon Norge 85Kimen Såvarelaboratoriet AS 86Kings Bay AS 87Nationaltheatret AS 88Nofima AS 89Nordisk Institutt for Odontologiske Materialer AS 90Norfund 91Norges sjømatråd AS 92Norsk Helsenett SF 93Norsk rikskringkasting AS 94Norsk Tipping AS 95NSD – Norsk senter for forskningsdata AS 96Nye Veier AS 97Petoro AS 98Rogaland Teater AS 99Simula Research Laboratory AS 100Siva – Selskapet for Industrivekst SF 101Space Norway AS 102Statnett SF 103Statskog SF 104Staur gård AS 105Store Norske Spitsbergen Kulkompani AS 106Talent Norge AS 107Trøndelag Teater AS 108UNINETT AS 109Universitetssenteret på Svalbard AS 110AS Vinmonopolet 111

74
Income statement (NOK millions) 2015 2014Operating revenues 119.1 91.5Operating expenses 98.0 80.1Gross operating profit (EBITDA) 37.0 27.4Operating profit (EBIT) 21.1 11.4Net financial items 0.1 -1.1Profit/loss before tax and minority 21.2 10.3Tax charge 4.4 3.1Profit/loss after tax and minority 16.8 7.2 Balance sheet 2015 2014Intangible assets 3.1 3.8Fixed assets 113.3 115.2Financial fixed assets 1.3 1.4Total fixed assets 117.7 120.3Current assets 29.9 31.8Total assets 147.6 152.1 Paid-in equity 5.0 5.0Retained earnings/other equity 81.1 64.3Total equity 86.1 69.3Provision for liabilities 4.0 5.0Non-current interest-bearing liabilities 36.7 39.1Non-current interest-free liabilities 0.0 0.0Current interest-bearing liabilities 20.8 38.7Current interest-free liabilities 0.0 0.0Total debt and liabilities 61.5 82.7Total equity and liabilities 147.6 152.1 Cash flow 2015 2014Operating activities 10.8 0.0Investment activities -13.3 0.0Financing activities -2.3 0.0Change cash and cash equivalents -4.8 0.0 Key figures 2015 2014Capital employed 143.6 147.1Gross operating margin (EBITDA) 31 % 30 %Operating margin (EBIT) 18 % 12 %Equity ratio 58 % 46 %Return on equity 22 % 11 %Average return on equity last 5 years 12 % –Return on capital employed 16 % 8 % Additional information 2015 2014Number of employees 76 67Proportion of employees in Norway 100 % 100 %State ownership at year-end 90 % 90 %Proportion of women on the board 33 % 33 %Proportion of women among owner-appointed/shareholder elected board members 40 % 40 %
Andøya Space Center AS delivers oper-ational services and products related to space and atmospheric research, environ-mental monitoring, and technology test-ing and verification, as well as contribut-ing to building knowledge and interest in these areas.
The company was established in 1997 under the name Andøya Rakettskytefelt when it was demerged from the Norwe-gian Space Centre foundation. The com-pany has roots in activity that started in Andøya in 1962 under the auspices of the Norwegian Defence Research Establish-ment and the Royal Norwegian Council for Scientific and Industrial Research, originally to meet needs linked to military and civilian radio communications. The group is headquartered in the municipali-ty of Andøy.
In addition to the parent company, the Andøya Space Center AS group compris-es two subsidiaries: Andøya Test Center AS and NAROM (Norwegian Centre for Space Related Education). The ALOMAR observatory is also part of the company’s range of services. The group is owned by the state, through the Ministry of Trade, Industry and Fisheries, (90%) and Kongs-berg Defence & Aerospace AS (10%). The group provides services for national and international research communities (launching of sounding rockets and re-lease of research balloons) and techno-logical testing environments (to test rock-et motors). Andøya Space Center also has increasing activity related to the develop-ment, testing and use of unmanned aerial vehicles (UAV/RPAS) and conducts stu-dent-oriented work through its subsidiary NAROM. Roughly 45% of the company’s total revenues are allocations from Nor-wegian and foreign authorities through the multilateral Esrange Andøya Special Project (EASP) agreement between Swe-den, Norway, Germany, France and Swit-zerland. In addition to the funding from the EASP agreement, the company re-ceives revenues from the sale of services
to the Norwegian Armed Forces and NASA, among others.
Important eventsThe year was characterised by a high lev-el of activity in the group, with many rock-et campaigns for a number of different clients. The subsidiary Andøya Test Cent-er has signed a long-term agreement with the Norwegian Armed Forces, ensuring future revenues for the group. The EASP Agreement was extended by five years, helping ensure greater predictability re-garding the group’s financial situation.
Corporate social responsibilityAndøya Space Center’s corporate social responsibility is most clearly reflected in its mission: to deliver services and prod-ucts related to space and atmospheric re-search, environmental monitoring, and technology testing and verification, as well as contributing to building knowl-edge and interest in these areas. As part of its corporate social responsibility work, the company supports a number of local clubs and organisations engaged in activi-ties aimed at children and young people.
Financial developmentThe group’s revenue increased by 30% from 2014 to 2015, while operating profit increased by 84%. This is largely due to the resumption of operational activities af-ter a temporary shutdown in 2014, due to technical problems with the rocket en-gines the group uses. The operating mar-gin for 2015 was 17.6%. As a result of the EASP Agreement, the group has a prohi-bition against paying dividends stipulated in its articles of association. The major in-vestments that have been made have posi-tioned the company for increased activity in the coming years, but have also entailed higher costs, primarily as a result of high-er financial costs and depreciation. Slight-ly weaker results are therefore expected in the parent company in the next few years.
CEO: Odd Roger Enoksen
Board: Svenn Are Jenssen (chair), Rolf Skatteboe (deputy chair), Sandra Riise, Grethe Stave, Bjørn Kanck, Åge Fredriksen* (* employee-elected)
Auditor: Vesteråls-Revisjon AS
The state’s ownership interest through the Ministry of Trade, Industry and Fisheries: 90 %Company website: www.andoyaspace.no
© Trond A
brahamsen
Andøya Space Center AS

75
Income statement (NOK millions) 2015 2014Operating revenues 11 989 10 671Operating expenses 8 757 8 366Gross operating profit (EBITDA) 4 691 3 645Operating profit (EBIT) 3 232 2 305Net financial items -328 -369Profit/loss before tax 2 904 1 937Tax charge 455 538Profit/loss after tax 2 449 1 399 Balance sheet 2015 2014Intangible assets 1 626 2 054Fixed assets 33 122 28 955Financial fixed assets 942 351Total fixed assets 35 690 31 359Current assets 3 095 2 377Total assets 38 785 33 737 Paid-in equity 5 400 5 400Retained earnings/other equity 9 432 6 823Total equity 14 832 12 223Provision for liabilities 2 129 3 050Non-current interest-bearing liabilities 17 184 14 067Current interest-bearing liabilities 994 552Current interest-free liabilities 3 646 3 845Total debt and liabilities 23 953 21 514Total equity and liabilities 38 785 33 737 Cash flow 2015 2014Operating activities 3 235 3 165Investment activities -3 829 -4 255Financing activities 1 329 1 348Change cash and cash equivalents 735 258 Key figures 2015 2014Capital employed 33 010 26 842Gross operating margin (EBITDA) 39 % 34 %Operating margin (EBIT) 27 % 22 %Equity ratio 38 % 36 %Return on equity 18 % 12 %Average return on equity last 5 years 11 % –Return on capital employed 11 % 9 % Regularity (percentage of scheduled departures carried out) 98 % 99 %Punctuality (percentage of departures carried out with max. 15 minutes delay) 88 % 90 %Traffic (total number of passangers in thousands 50 025 50 106 Dividends 2015 2014Dividend for the financial year 500 500Dividend percentage 20 % 36 %Average dividend percentage last 5 years 36 % –Dividend to the state 500 500 Subsidies from the State/ Public purchases 2015 2014Investment grant 24 75 Additional information 2015 2014Number of employees 3 157 3 214Proportion of employees in Norway 100 % 100 %State ownership at year-end 100 % 100 %Proportion of women on the board 50 % 50 %Proportion of women among owner-appointed/shareholder elected board members 50 % 50 %
Avinor AS was established in 2003 when the public sector enterprise Luftsfartsver-ket was converted into a state-owned lim-ited company. Avinor’s social mission is to own, operate and develop a nationwide network of airports for civilian aviation and a joint air navigation service for civil-ian and military aviation. The flight opera-tions business encompasses 46 airports in Norway, as well as air traffic control tow-ers, control centres and other technical infrastructure for safe flight navigation. Avinor’s goal is to facilitate safe, environ-mentally friendly and efficient aviation and ensure good accessibility for all cate-gories of travellers. In addition to flight operations, Avinor receives commercial revenues from airport hotels, car parks, duty-free sales, cafés and restaurants, and other services for air passengers at the airports. The company’s head office is lo-cated in Oslo.
Avinor shall, to the greatest possible extent, be self-financed through its own revenues from the primary activities and its commercial activities. Within the com-pany, operations are managed as a single unit such that the financially profitable air-ports help finance the unprofitable air-ports. The air navigation services are self-financed through pricing the services ac-cording to the cost coverage principle.
Important eventsAvinor is currently in a phase character-ised by major changes and development, as a result of major restructuring within air navigation services, new international regulatory requirements and the need for greater capacity at the largest airports. The group has a high level of investments dominated by the expansion of terminals at the airports in Oslo and Bergen, and several other sizeable projects.
In 2015 the Ministry of Transport and Communications allowed Avinor Flysik- ring AS to be able to provide consulting services in other countries, (cf. Proposi-tion no. 19 to the Storting (2015–2016) Amendments to the 2015 national budget
under the Ministry of Transport and Communications).
The merger of Oslo Lufthavn AS into Avinor AS was adopted on 1 January 2016.
Corporate social responsibilityAvinor’s corporate social responsibility work is based on the OECD guidelines for responsible business, and the company actively follows up the expectations re-garding the company’s corporate social responsibility defined in the articles of as-sociation and the Accounting Act.
Avinor joined the UN’s Global Compact in 2014 and presented its first annual re-port detailing how Avinor administered its corporate social responsibility the pre-vious year. Avinor’s CSR reports are pre-pared in accordance with the principles of the Global Reporting Initiative (GRI)’s G4 Sustainability Reporting Guidelines.
It is Avinor’s goal to be a driving force for climate and environment work in the sector. The external environment is an in-tegral part of Avinor’s management sys-tem and follows the principles set out in ISO 14001.
Financial developmentAvinor had operating revenues of NOK 11,989 million and a profit after tax of NOK 2,449 million in 2015. The volume of traffic decreased by 0.2% in 2015 from the previous year, but the result for the year was positively affected by gains from the sale of property at Oslo Airport. Avinor’s cost efficiency programme met its target of reducing annual costs by NOK 150 mil-lion with a wide margin. Project activity remains high, with investments of NOK 5,658 million in capital equipment and in-frastructure. The investments are fi-nanced by borrowing, and Avinor’s total interest-bearing debt at the end of 2015 was NOK 18,490 million. Avinor paid a dividend of NOK 500 million to the state in line with the current dividend policy for the financial years 2014–2017, with the aim of strengthening the company’s equi-ty in a period of high investments.
CEO: Dag Falk-Petersen
Board: Ola Mørkved Rinnan (chair), Ola Henrik Strand (deputy chair), Mari Thjømøe, Tone Merethe Lindberg, Eli Skrøvset, Herlof Nilssen, Grete Ovnerud*, Heidi Anette Sørum*, Per Erik Nordsveen* og Bjørn Tore Mikkelsen* (* employee-elected)
Auditor: EY AS
The state’s ownership interest through the Ministry of Transport and Communications: 100 %Company website: www.avinor.no
© Avinor A
S
Avinor AS

76
Income statement (NOK millions) 2015 2014Operating revenues 0.2 0.2Of which subsidies from Kings Bay AS 0.2 0.2Operating expenses 0.2 0.2Operating profit/loss 0.0 0.0Net financial items 0.0 0.0Profit/loss before tax 0.0 0.0Tax charge 0.0 0.0Profit/loss after tax 0.0 0.0 Balance sheet 2015 2014Intangible assets 0.0 0.0Fixed assets 3.9 3.9Financial fixed assets 0.0 0.0Total fixed assets 3.9 3.9Current assets 0.3 0.3Total assets 4.2 4.2 Paid-in equity 4.0 4.0Retained earnings/other equity 0.1 0.1Total equity 4.1 4.1Provision for liabilities 0.0 0.0Non-current liabilities 0.0 0.0Current interest-bearing liabilities 0.0 0.0Current interest-free liabilities 0.1 0.1Total debt and liabilities 0.1 0.1Total equity and liabilities 4.2 4.2 Additional information 2015 2014Number of employees 0 0State ownership at year-end 100 % 100 %Proportion of women on the board 50 % 50 %Proportion of women among owner-appointed/shareholder elected board members 40 % 50 %
Bjørnøen AS owns all the land and sev-eral buildings of cultural and historical value on the Arctic island of Bjørnøya. The company was taken over by the Nor-wegian state in 1932 and was placed under Kings Bay AS’s management in 1967, which also supplies management services to Bjørnøen. Part of the government sub-sidy allocated to Kings Bay is transferred to Bjørnøen for its operations. Bjørnøen’s objective is to operate and utilise the com-pany’s properties in Svalbard and carry out other activities related to this.
The Norwegian Meteorological Insti-tute’s Weather Service for Northern Nor-way leases property for its meteorological station on Bjørnøya. The Weather Service for Northern Norway is also responsible for coordinating the scientific activities conducted on the property that it leases on the island. The Bjørnøya Nature Re-serve was established in 2002. The re-serve includes the entire island, except for a small area. The Governor of Svalbard is the authority responsible for the man-agement and monitoring of the nature re-serve.
The objective of the state’s ownership of Bjørnøen is to manage the occupation of property on the island of Bjørnøya and
thus safeguard Norwegian sovereignty. Bjørnøya is situated in a strategically im-portant location, halfway between the Norwegian mainland and Spitsbergen. A small area of land on the island meets sup-ply and transport needs and can serve as an emergency harbour in the event of re-covery of oil in the Barents Sea and for other activities in the Arctic region.
Important eventsThe Russian ship Petrozavodsk ran aground on the southern tip of Bjørnøya in 2009 and is still a potential source of lo-cal pollution. The company wants the wreck removed with minimal damage to Bjørnøya and the surrounding nature. In autumn 2011 the Norwegian Coastal Ad-ministration concluded that it is not safe to remove the wreck.
Financial developmentThe company’s operating revenues stem from leasing the property and were NOK 18,542 in 2015. Operating costs exceeding this amount are covered by subsidies transferred from Kings Bay, which are al-located in the national budget. The subsi-dies amounted to NOK 161,215 in 2015, the same as in 2014.
CEO: Ole Øiseth
Board: Unni Steinsmo (chair), Widar Salbuvik (deputy chair), Kirsten Broch-Mathisen, Egil Murud, Sven Ole Fagernæs, Turid Lie Vilkensen* (* employee-elected)
Auditor: PricewaterhouseCoopers AS
The state’s ownership interest through the Ministry of Trade, Industry and Fisheries: 100 %Company website: www.kingsbay.no
© Kings Bay A
S
Bjørnøen AS
77
Income statement (NOK millions) 2015 2014Operating revenues 39.8 37.5Operating expenses 38.2 36.5Gross operating profit (EBITDA) 2.5 1.7Operating profit (EBIT) 1.6 1.0Net financial items 0.1 0.2Profit/loss before tax 1.8 1.2Tax charge 0.0 0.0Profit/loss after tax 1.8 1.2 Balance sheet 2015 2014Intangible assets 0.0 0.0Fixed assets 4.5 3.8Financial fixed assets 0.7 0.8Total fixed assets 5.2 4.6Current assets 13.2 10.4Total assets 18.4 15.0 Paid-in equity 0.1 0.1Retained earnings/other equity 7.0 5.2Total equity 7.1 5.3Provision for liabilities 5.4 4.9Non-current interest-bearing liabilities 0.0 0.0Current interest-bearing liabilities 0.0 0.0Current interest-free liabilities 5.9 4.8Total debt and liabilities 11.3 9.7Total equity and liabilities 18.4 15.0 Cash flow 2015 2014Operating activities 4.8 2.1Investment activities -1.6 -0.5Financing activities 0.0 0.0Change cash and cash equivalents 3.2 1.6 Key figures 2015 2014Capital employed 7.1 5.3Gross operating margin (EBITDA) 6 % 5 %Operating margin (EBIT) 4 % 3 %Equity ratio 38 % 35 %Return on equity 28 % 25 %Average return on equity last 3 years 12 % –Return on capital employed 29 % 25 % Other key figures 2015 2014Total number of performances 101 128Tickets sold 18 495 20 236Bergen audiences (excluding the Cultural Rucksack) 64 % 87 %Audiences. Norwegian tours (excluding the Cultural Rucksack) 51 % 58 %Ticket sales 2.7 2.3 Subsidies 2015 2014Ministry of Culture 25.6 24.0Hordaland County Council and Bergen municipality 11.0 10.3Total subsidies 36.5 34.3 Additional information 2015 2014Number of employees 30 28Proportion of employees in Norway 100 % 100 %State ownership at year-end 70 % 70 %Proportion of women on the board 43 % 43 %Proportion of women among owner-appointed/shareholder elected board members 50 % 50 %
Carte Blanche AS is Norway’s national company of contemporary dance and the only permanent contemporary dance ensemble in Norway. The company was established in Bergen in 1989. Carte Blanche produces and presents perfor-mances created by renowned and new Norwegian and international contempo-rary dance choreographers. The compa-ny has national and regional responsibility for communicating contemporary dance to a diverse audience and knowledge about Norwegian contemporary dance worldwide by working for international recognition and an international pres-ence. The company has 30 employees, 14 of whom are dancers. The company puts on two or three new productions every year, consisting of three to five choreogra-phies. The productions tour Norway and other countries with 60–70 performances per year.
Important eventsSince the demolition of Teatergarasjen in 2008, Carte Blanche’s studio has func-tioned as a temporary home stage in Ber-gen. The current lease expires at the end of 2018, and the owner has been unwilling to sign a new contract, but is open to a short-term extension while new produc-tion facilities are completed.
A feasibility study conducted in winter 2015 on commission from the City of Ber-gen concluded that the co-location of Carte Blanche, BIT Teatergarasjen and rehearsal premises for Den Nationale Scene in the former public baths Sentral-badet could be an efficient and innovative project both for the institutions involved and for the people of Bergen. Co-location in this venue would provide both produc-tion facilities and a home stage in Bergen, as well as facilitating a unique collabora-tion between three of Bergen’s perform-ing arts institutions. In spring 2015 the
city government of Bergen wanted to sell Sentralbadet to the highest bidder, but changed its mind a few days later after strong reactions from the people of Ber-gen and other politicians. A working group was established consisting of repre-sentatives of the three owners of Carte Blanche to continue the work on the pro-ject. In winter 2015–2016 the City of Ber-gen and Hordaland county administration resolved to continue working to develop the project in Sentralbadet in an outline project, which is due to be completed in autumn 2016.
Corporate social responsibilityCarte Blanche works to strengthen the place of contemporary dance in society and is actively seeking to change the per-ception of contemporary dance as a nar-row art form that appeals to a select few, to a relevant form of artistic expression for many. The company is working to identify new audiences and is helping in-crease the public’s knowledge of dance through written texts, meetings, dialogue, workshops, etc. Educational programmes linked to performances for schools are an important part of this work. Touring in-creases knowledge of contemporary forms of dance.
Financial developmentCarte Blanche posted a profit of approx. NOK 1.8 million in 2015 (4% of the total revenue). In recent years, a restructuring of the technical department from a high proportion of contracted freelancers to more permanent employees, has yielded significant cost reductions on pay and fees to technical personnel. In 2010 the com-pany voluntarily established a fund for fu-ture maintenance and investments. The subsequent years’ surplus has been paid into this fund, primarily in view of the im-minent move to new premises.
Theatre director: Hooman Sharifi
Board: Hallvard Bakke (chair), Grete Line Simonsen (deputy chair), Laila Dåvøy, Ruth Grung, Svein Halleraker, Ole Hope, Ole Martin Meland* (* employee-elected)
Auditor: PricewaterhouseCoopers AS
The state’s ownership interest through the Ministry of Culture: 70 %Company website: www.carteblanche.no
© Thor Brødreskift
Carte Blanche AS

78
Income statement (NOK millions) 2015 2014Operating revenues 141.3 141.2Operating expenses 134.7 129.7Gross operating profit (EBITDA) 10.0 15.0Operating profit (EBIT) 6.6 11.6Net financial items 0.5 0.9Profit/loss before tax 7.1 12.5Tax charge 0.0 0.0Profit/loss after tax 7.1 12.5 Balance sheet 2015 2014Intangible assets 0.0 0.0Fixed assets 20.0 19.5Financial fixed assets 7.0 1.6Total fixed assets 27.0 21.1Current assets 43.4 36.9Total assets 70.3 58.0 Paid-in equity 1.7 1.7Retained earnings/other equity 33.9 26.8Total equity 35.6 28.5Provision for liabilities 0.0 -4.7Non-current interest-bearing liabilities 0.0 0.0Current interest-bearing liabilities 0.0 0.0Current interest-free liabilities 34.7 34.2Total debt and liabilities 34.7 29.5Total equity and liabilities 70.3 58.0 Cash flow 2015 2014Operating activities 10.3 9.1Investment activities -3.9 -4.6Financing activities 0.0 0.0Change cash and cash equivalents 6.4 4.5 Key figures 2015 2014Capital employed 35.6 28.5Gross operating margin (EBITDA) 7 % 11 %Operating margin (EBIT) 5 % 8 %Equity ratio 51 % 49 %Return on equity 22 % 56 %Average return on equity last 3 years 37 % –Return on capital employed 22 % 56 % Other key figures 2015 2014Total number of performances 790 799Tickets sold 127 635 141 941Audiences 72 % 75 %Ticket sales 21.2 24.3 Subsidies from the State/ Public purchases 2015 2014Ministry of Culture 115.2 112.8 Additional information 2015 2014Number of employees 138 140Proportion of employees in Norway 100 % 100 %State ownership at year-end 66.67 % 66.67 %Proportion of women on the board 29 % 43 %Proportion of women among owner-appointed/shareholder elected board members 40 % 60 %
AS Den Nationale Scene (DNS) is a na-tional theatre located in Norway’s second-largest city, Bergen, and is the only national theatre located outside the capital. The cul-turally-significant theatre building from 1909 has one of the city’s grandest and most central locations in Engen and is a key element in Norway’s theatre traditions. The theatre is an extension of Ole Bull’s Det Norske Theater, which was established in 1850. DNS puts on productions on the theatre’s three stages: Store Scene, which seats 451, Teaterkjelleren, which seats 200, and Lille Scene, which seats 80. The theatre was originally built for 60 employees and one stage, while DNS currently has 160 em-ployees and three stages. Store Scene is based on the original salon from 1909.
DNS’s vision is to create socially-rele-vant, engaging and important theatre of high artistic quality. DNS wants to be an attractive venue for audiences and a quali-ty-conscious, bold and renowned institu-tion for dramatic art in the Nordic region.
Important eventsRepresented by the Ministry of Culture, DNS has worked on a “choice of solution” study to determine what kind of buildings will best enable DNS to fulfil its role in so-ciety in a meaningful way. This work was completed in 2015. Support for the pro-cess within the organisation has been en-sured through a broad-based project in which all the professional groups are rep-resented. The choice of solution process is now being quality assured through an initial external quality assurance (KS1).
The evaluation committee for resource use and artistic work at performing arts institutions, appointed by the Ministry of Culture, stated that during the evaluation period DNS has demonstrated “a willing-ness to think broadly and creatively, and a clear desire to be a prominent player in society”. The committee was also im-pressed by the level of activity at DNS.
Corporate social responsibilityDNS exercises corporate social responsi-bility in accordance with the govern-ment’s ownership policy. The theatre at-taches importance to offering a diverse repertoire and renewing its programme for children and young people. DNS aims to be an institution that collaborates with independent artists and works to ensure that different groups of artists can live from their art in Bergen. Collaboration is also an important instrument in audience development.
In addition to working with major cul-tural institutions and a number of educa-tional organisations in the city, DNS en-gaged many freelancers in 2015. Towards the end of 2015 the work on audience de-velopment was further intensified, with a view to reaching new audience groups.
In addition to a number of planned out-reach events, DNS entered into an agree-ment with the Kavli Trust, helping the theatre to be able to gift tickets to users of organisations that work to promote social inclusion.
Financial developmentThe profit for the year was almost NOK 7.1 million. This robust result was due to good cost control. In recent years DNS had made a profit, strengthening its equi-ty. The profits are partly a result of re-duced use of overtime and fewer exter-nally contracted extras than budgeted. Clarification of budgetary responsibilities and management and greater use of digi-tal tools have contributed to better control of the use of resources. Pension calcula-tions have had a positive impact on the ac-counts, resulting in a higher surplus. 2015 saw a decline in ticket revenues, partly due to a children’s and family event that did not have the intended and expected audience appeal. The theatre is working to ensure a better balance between state subsidies and own revenues.
Theatre director: Signe Agnete Gullestad Haaland
Board: Siren Nøkling Sundland (chair), Victor Danielsen Norman (deputy chair), Harald Alfsen, Kristin Bjørn, Ole Hope, Stig Amdam*, Frode Prestegård* (* employee-elected)
Auditor: EY AS
The state’s ownership interest through the Ministry of Culture: 66.67 %Company website: www.dns.no
© Thor Brødreskift
AS Den Nationale Scene

79
Income statement (NOK millions) 2015 2014Operating revenues 743.2 728.3Operating expenses 809.8 743.1Gross operating profit (EBITDA) -51.2 -5.2Operating profit (EBIT) -66.6 -14.8Net financial items -0.6 -2.2Profit/loss before tax -67.2 -16.9Tax charge 0.0 0.0Profit/loss after tax -67.2 -16.9 Balance sheet 2015 2014Intangible assets 0.0 0.0Fixed assets 56.2 64.1Financial fixed assets 10.3 58.8Total fixed assets 66.5 122.9Current assets 106.5 61.3Total assets 173.0 184.2 Paid-in equity 10.4 10.4Retained earnings/other equity -76.5 -9.3Total equity -66.1 1.1Provision for liabilities 24.1 25.5Non-current interest-bearing liabilities 30.3 1.0Current interest-bearing liabilities 0.0 0.0Current interest-free liabilities 184.6 156.6Total debt and liabilities 239.1 183.1Total equity and liabilities 173.0 184.2 Cash flow 2015 2014Operating activities 55.7 25.9Investment activities -7.5 -20.7Financing activities -1.4 -0.1Change cash and cash equivalents 46.8 5.1 Key figures 2015 2014Capital employed -35.8 2.1Gross operating margin (EBITDA) -7 % -1 %Operating margin (EBIT) -9 % -2 %Equity ratio -38 % 1 %Return on equity 207 % -177 %Average return on equity last 3 years 90 % –Return on capital employed 384 % -115 % Other key figures 2015 2014Total number of performances 496 449Tickets sold 301 707 297 334Audiences 84 % 86 %Ticket sales 107.6 96.3 Subsidies from the State/ Public purchases 2015 2014Ministry of Culture 589.6 577.2 Additional information 2015 2014Number of employees 655 642Proportion of employees in Norway 100 % 100 %State ownership at year-end 100 % 100 %Proportion of women on the board 57 % 50 %Proportion of women among owner-appointed/shareholder elected board members 60 % 50 %
Den Norske Opera & Ballett AS (DNO &B), the Norwegian National Opera & Ballet, is Norway’s largest institution for music and the dramatic arts and shall pre-sent operas, ballets and concerts of the highest artistic quality. DNO&B consists of the companies the Norwegian National Ballet and the Norwegian National Opera, in addition to the Norwegian National Op-era Orchestra, the Norwegian National Opera Chorus, the Norwegian National Opera Children’s Chorus and the Norwe-gian National Ballet School. DNO&B’s mission is to be Norway’s opera house. DNO&B aims to be accessible to the broadest possible audience and has an ex-plicit goal of being a leading institution in the international opera and ballet world.
Important eventsA new opera director and a new music di-rector were appointed in 2015 (the music director will take up office in 2016 and the opera director in 2017).
Nasjonalballetten UNG / Norwegian National Ballet 2 was established.
Corporate social responsibilityDNO&B is an Inclusive Working Life company (under the IA scheme) and had seven people on IA placements in 2015. In addition the company had five apprentic-es, four soloist interns and three trainee ballet dancers in house in 2015.
DNO&B is about to enter into an agree-ment with the Eco-Lighthouse Founda-tion for environmental certification, which entails compliance with over 80 different
environmental requirements relating to the working environment, energy con-sumption, procurements, transport and waste management.
In 2015 too DNO&B collaborated ex-tensively with various cultural organisa-tions on a number of productions, includ-ing the Ultima festival, the CODA festival, Kulturklovnene, Høydan Kulturproduks-joner, Tabanka Dance Ensemble, Jo Strømgren Kompani, Carte Blanche, Oslo World Music Festival, Bydel Bjerke and a number of orchestras and ensembles.
The focus on children and young peo-ple is important. In 2015 DNO&B hosted baby opera, children’s opera, the Ballet School’s student performance and several productions involving young performers. In addition, the establishment of Nasjonal-balletten UNG / Norwegian National Bal-let 2 was an important milestone.
Financial developmentRecord audience figures meant ticket rev-enues increased by NOK 5 million, which is 5.3%. However, the accounts show a re-sult for the year of approx. NOK -67 mil-lion, which is NOK 50 million worse than the previous year. This is wholly due to increased pension costs (an increase of approx. NOK 55 million). In light of the result for the year, the company’s equity, which was about NOK 1 million at the be-ginning of the year, was negative by some NOK -66 million at year-end. Taking the present value of the pension liabilities ful-ly into account, equity is negative by about NOK -400 million.
CEO: Nils Are Karstad Lysø
Board: Anne Carine Tanum (chair), Jan Petersen (deputy chair), Harald Espedal, Päivi Irmeli Kärkkäinen, Monica Siv Salthella, Rasmus Heggdal*, Marit Brekke* (* employee elected)
Auditor: KPMG AS
The state’s ownership interest through the Ministry of Culture: 100 %Company website: www.operaen.no
© Erik Berg/D
en Norske O
pera & Ballett A
S
Den Norske Opera & Ballett AS

80
Income statement (NOK millions) 2015 2014Net operating revenues 102.0 98.9Operating expenses 101.7 93.3Gross operating profit (EBITDA) 4.1 9.4Operating profit (EBIT) 0.3 5.7Net financial items 2.0 2.2Profit/loss before tax 2.3 7.9Tax charge 1.3 2.2Profit/loss after tax 1.1 5.6 Balance sheet 2015 2014Intangible assets 5.9 8.5Fixed assets 1.7 2.8Financial fixed assets 6.3 7.3Total fixed assets 13.9 18.7Current assets 70.3 69.0Total assets 84.2 87.7 Paid-in equity 13.9 13.9Retained earnings/other equity 31.5 30.4Total equity 45.4 44.3Provision for liabilities 20.9 21.4Non-current interest-bearing liabilities 0.0 0.0Current interest-bearing liabilities 0.0 0.0Current interest-free liabilities 17.9 22.0Total debt and liabilities 38.8 43.3Total equity and liabilities 84.2 87.7 Cash flow 2015 2014Operating activities 2.1 6.9Investment activities 0.0 -3.0Financing activities 0.0 0.0Change cash and cash equivalents 2.1 4.0 Key figures 2015 2014Capital employed 45.4 44.3Gross operating margin (EBITDA) 4 % 9 %Operating margin (EBIT) 0 % 6 %Equity ratio 54 % 51 %Return on equity 2 % 14 %Average return on equity last 3 years 18 % –Return on capital employed 6 % 19 % Subsidies from the State 2015 2014The ministry of Trade, Industry and Fisheries 100.0 100.5 Additional information 2015 2014Number of employees 43 44Proportion of employees in Norway 100 % 100 %State ownership at year-end 100 % 100 %Proportion of women on the board 50 % 50 %Proportion of women among owner-appointed/shareholder elected board members 60 % 60 %
Eksportkreditt Norge AS, Export Cred-it Norway, was established in 2012 to man-age the state’s export credit scheme, which until 2011 was managed by Ek-sportfinans ASA. The export credit scheme offers loans to finance Norwegian export contracts. Borrowers can choose between government-supported loans with a fixed interest rate (CIRR – Com-mercial Interest Reference Rate) and loans with market interest rates. The terms of the loans are governed by the OECD framework on officially supported export credits, among others. Eksport-kreditt Norge is responsible for the whole process associated with sales and market-ing, processing of applications, granting, loan agreements and documentation, dis-bursements, and following up loans.
The aim of Eksportkreditt Norge is to promote Norwegian exports through competitive, accessible and efficient ex-port financing. The company’s activities are regulated by the Act relating to Ek-sportkreditt Norge AS and the Export Credit Regulations. All applications that comply with the rules will receive an offer of financing. The loans are funded by the Treasury and are recorded on the state’s statement of financial position. The state thus assumes all the risks associated with the credit scheme. All the loans must be guaranteed by state export guarantee in-stitutions or financial institutions with good credit ratings. Alternatively, small loans and small parts of large loans to de-veloping countries and emerging econo-mies may be secured by cash deposits.
Important eventsAt the end of 2015 the loan portfolio was approx. NOK 76.5 billion, up from approx. NOK 61 billion in 2014. Of this, 59% was CIRR loans and 41% was loans at market interest rates. About 74% of the portfolio was guaranteed by the state management company, The Norwegian Export Credit Guarantee Agency (GIEK). Some 98.2% of the company’s loans are tied to the oil and gas industry and maritime industries. The situation in the oil and gas industry led the company to work on following up out-standing loans in this part of the portfolio in 2015.
The company worked actively to strengthen partnerships with GIEK and Innovasjon Norge. In 2014 Eksportkreditt Norge and GIEK introduced a simplified solution for small and medium-sized en-terprises. In 2015 Eksportkreditt Norge and GIEK marketed this solution through
joint customer events in Norway and abroad, among others. The simplified so-lution has been well received in the mar-ket, and several loans were paid out in 2015 under the new system.
Corporate social responsibilityThe general guidelines for corporate so-cial responsibility at Eksportkreditt Norge are found in the OECD Common Approaches for Officially Supported Export Credits and Environmental and Social Due Diligence and the Recommendation on Bribery and Officially Supported Export Credits. In 2014, Eksportkreditt Norge also adopted the Equator Principles. In ac-cordance with guidelines from the OECD and the Equator Principles, the company classifies its loans according to the risk of adverse environmental and social im-pacts.
Eksportkreditt Norge collaborates for-mally with GIEK, and together they can have a positive impact through the re-quirements they set for the players in the projects they finance. The company also works in a directed manner on anti-cor-ruption. Anti-corruption measures are im-plemented based on risk assessments of countries, sectors and transaction types. In certain cases, special investigations may be necessary relating to client, com-pany and ownership structure, geographi-cal location and transaction structure. All loans are given on the condition that there is no suspicion of corruption related to the transaction.
Financial developmentRevenues and expenses related to the loan portfolio under the export credit scheme are not included in Eksportkreditt Norge’s accounts, but are recognised directly in the national accounts on a cash basis. Eksport-kreditt Norge’s operations are based on grants from the state. The state requires that the grants are used effectively, but it is not an end in itself that the company shall generate a profit, and it does not pay a divi-dend. In 2015 the company received a grant of NOK 100 million. Profit after tax was NOK 1.1 million.
CEO: Jarle Roth
Board: Else Bugge Fougner (chair), Finn Ivar Marum, Siri Beate Hatlen, Trude Husevåg, Arild Vik, Jørgen Christian Hauge*
(* employee-elected)
Auditor: KPMG AS
The state’s ownership interest through the Ministry of Trade, Industry and Fisheries: 100 %Company website: www.eksportkreditt.no
© N
orthwind
Eksportkreditt Norge AS

81
Income statement (NOK millions) 2015 2014Operating revenues 118.4 102.9Operating expenses 114.3 104.0Gross operating profit (EBITDA) 4.7 -1.1Operating profit (EBIT) 4.1 -1.2Net financial items 0.5 0.6Profit/loss before tax 4.6 -0.6Tax charge 0.0 0.0Profit/loss after tax 4.6 -0.6 Balance sheet 2015 2014Intangible assets 0.0 0.0Fixed assets 4.0 0.4Financial fixed assets 0.0 0.0Total fixed assets 4.0 0.4Current assets 33.2 31.4Total assets 37.2 31.8 Paid-in equity 5.0 5.0Retained earnings/other equity 9.1 4.5Total equity 14.1 9.5Provision for liabilities 0.0 0.0Non-current interest-bearing liabilities 0.0 0.0Current interest-bearing liabilities 0.0 0.0Current interest-free liabilities 23.1 22.3Total debt and liabilities 23.1 22.3Total equity and liabilities 37.2 31.8 Cash flow 2015 2014Operating activities 5.0 4.0Investment activities 0.0 0.0Financing activities 0.0 0.0Change cash and cash equivalents 5.0 4.0 Key figures 2015 2014Capital employed 14.1 9.5Operating margin (EBIT) 3 % -1 %Equity ratio 38 % 30 %Return on equity 39 % -6 %Average dividend percentage last 5 years -13 % –Return on capital employed 39 % -6 %Conctractual energy result (TWh) 1.4 1.4 Additional information 2015 2014Number of employees 77 68Proportion of employees in Norway 100 % 100 %State ownership at year-end 100 % 100 %Proportion of women on the board 40 % 44 %Proportion of women among owner-appointed/shareholder elected board members 43 % 43 %
Enova SF was established in 2001 after a reorganisation of the work on restructur-ing energy consumption and generation. Enova’s objective is to promote an envi-ronmentally friendly restructuring of en-ergy consumption and generation and to develop energy and climate technologies. The company shall help improve energy supply reliability and reduce greenhouse gas emissions. Enova manages the Ener-gy Fund, which is intended to be a long-term source of funding for the work. The Energy Fund is funded by a parafiscal charge on electricity grid tariffs, the pro-ceeds from the Fund for Climate, Renew-able Energy and Energy Efficiency Meas-ures, and interest earned on the balance of capital in the Energy Fund the previous year.
Enova is managed according to the principles of management by objectives and results. There is a clear division of re-sponsibilities and roles between the Min-istry of Petroleum and Energy as the cli-ent and Enova as the contractor. The task of managing the Energy Fund was as-signed to Enova through a four-year agreement between the Ministry of Petro-leum and Energy and Enova, as well as in the annual letter of assignment from the Ministry.
Important eventsEnova was given responsibility for two new assignments in 2015. Enova shall manage a rights-based programme for en-
ergy conservation measures in homes and take over Transnova’s assignments related to environmentally friendly trans-port.
Corporate social responsibilityIt is a basic prerequisite for Enova that all work is performed in accordance with ap-plicable laws and regulations and in line with good practice in areas such as occu-pational health and safety, the environ-ment, human rights, business ethics and anti-corruption. Enova has ethical guide-lines defining requirements for employ-ees, partners and others acting on the company’s behalf. Enova’s ethical guide-lines are available on the company’s web-site. Enova shall be a role model within environmental and climate issues and seeks to minimise the company’s impact on the external environment. Part of Eno-va’s corporate social responsibility is exer-cised through awareness campaigns aimed at children and young people.
Financial developmentThe annual budget framework for Enova’s operations is determined each year by the Ministry of Petroleum and Energy and is covered by the Energy Fund. Since the company does not generate any revenue itself, no dividend is determined for distri-bution from Enova. Enova is not liable to pay tax. NOK 5 million was injected into Enova as invested capital on its establish-ment.
CEO: Nils Kristian Nakstad
Board: Tore Holm (chair), Elizabeth Baumann Ofstad (deputy chair), Eirik Gaard Kristiansen, Katharina Thøgersen Bramslev, Dina Elverum Aune, Olav Hasaas, Einar Håndlykken, Tor Brekke*, Konrad Pütz*, Hege Glasø Wiggen* (* employee-elected)
Auditor: Deloitte AS
The state’s ownership interest through the Ministry of Petroleum and Energy: 100 % Company website: www.enova.no
© Enova SF
Enova SF
82
Income statement (NOK millions) 2015 2014Operating revenues 0.0 0.0Operating expenses 0.0 0.0Gross operating profit (EBITDA) 0.0 0.0Operating profit (EBIT) 0.0 0.0Net financial items 0.2 0.3Profit/loss before tax 0.2 0.3Tax charge 1.7 0.1Profit/loss after tax -1.5 0.1 Balance sheet 2015 2014Intangible assets 19 16 Fixed assets 163 153 Financial fixed assets 483 717 Total fixed assets 665 886 Current assets 602 529 Total assets 1 267 1 415 Paid-in equity 10 10 Retained earnings/other equity 4 6 Total equity 14 16 Provision for liabilities 511 730 Non-current interest-bearing liabilities 0 0Current interest-bearing liabilities 79 78 Current interest-free liabilities 662 591 Total debt and liabilities 1 252 1 399 Total equity and liabilities 1 267 1 415 Cash flow 2015 2014Operating activities 77 202Investment activities -44 -35Financing activities 0 0Change cash and cash equivalents 33 168 Key figures 2015 2014Pipeline system (no. of km) 8 000 8 000Regularity 99.4 % 99.9 %Gas transport to onshore terminals in Europe (billion Sm3) 107 101Largest delivery per 24 hours (mill. Sm3) 365 352Ships arriving at Kårstø 787 711Tariff income Gassco operatorship 26 969 27 578Operating costs Gassco operatorship 4 795 5 321 Subsidies from the State/ Public purchases 2015 2014Subsidy for CO2. value chain studies 3.4 4.0 Additional information 2015 2014Number of employees 355 359Proportion of employees in Norway 59 % 59 %State ownership at year-end 100 % 100 %Proportion of women on the board 50 % 50 %Proportion of women among owner-appointed/shareholder elected board members 40 % 40 %
Gassco AS was established in 2001 and operates gas pipelines and transport re-lated gas processing facilities. As pipeline operator Gassco is responsible for operat-ing the infrastructure and management of the existing gas plants on behalf of the owners. Gassco is also involved in the planning of new pipes, processing plants and gas receiving terminals. Capacity management is another key role for Gassco, which entails allocating and dis-tributing capacity to the shippers in com-pliance with agreed rules.
The gas transport system is owned by various joint ventures, which are in turn owned by oil and gas companies on the Norwegian continental shelf and infra-structure companies. Gassco’s operations are conducted on behalf of the joint ven-tures at the owners expense and risk. Gassco does not make a profit or loss from its operation. The shippers pay regu-lated transport tariffs that provide the owners of the gas transport system with a reasonable return on their investments.
Gassco’s head office is at Karmøy, with branches in Germany, Belgium, France and the UK. Gassco had 355 employees at the end of 2015, of whom 142 work at the gas terminals in Europe.
Important eventsIn 2015 under Gassco’s operatorship 108 billion standard cubic metres (Sm3) of gas were delivered from the Norwegian continental shelf to the receiving termi-nals in Germany, Belgium, France and the UK. This represents an increase of 7 bil-lion Sm3 compared with 2014.
The average regularity for the trans-portation system was 99.38%, in 2105, compared with 99.92% in 2014. A new re-cord was set for highest daily volume de-livered at 365.3 million Sm3.
Kårstø, one of the largest processing plants for natural gas in the world, turned 30 years in 2015. Continous expansion has increased its capacity fivefold since 1985. In 2015 an upgrade of two steam boilers was completed while the plant was in full operation.
Removal of the B11 platform in the
North Sea, of which Gassco is the opera-tor, was completed in 2015, in addition to an onshore gas security project for the land-based assets in Norway.
A tie-in was performed on the Vest-erled pipeline in the UK sector, in prepara-tion for the Mariner field.
Mechanical completion of the new re-ceiving terminal for export of Norwegian gas to Germany was completed and hand-ed over to Gassco’s operating organisa-tion in Emden.
Gassco has evaluated future gas trans-port solutions for the Butch, Alpha Cen-tral, Vette, Frigg Gamma Delta, Krafla, Astero, Skarfjell, Afrodite, Pil, Bue and Trestakk fields.
Gassco has taken over the operator-ship of the new Utsira High gas pipe, which will transport rich gas to the Scot-tish Area Gas Evacuation (Sage) system and St Fergus in Scotland. Gassco has also taken over the operatorship of the Knarr pipe that will transport rich gas to the Shell-Esso Gas and Liquids (SEGAL) system and St Fergus in Scotland. It has been decided that Gassco will be the op-erator of the pipeline that will carry gas from the Johan Sverdrup field when the pipeline becomes operational.
Corporate social responsibilityGassco exercises its corporate social re-sponsibility in part by supporting clubs and organisations in the region where its head office is located and in other local communities with activities of which the company is the operator. Culture and sport are the company’s selected areas for col-laboration, and Gassco gives particular pri-ority to supporting activities for children and young people. In its tender processes Gassco demands that suppliers document that they have established a corporate so-cial responsibility policy and guidelines that are consistent with Gassco’s corporate social responsibility guidelines.
Financial developmentThe result for the year was a deficit of NOK -1.5 million, which will be covered by other equity.
CEO: Frode Leversund
Board: Ottar Inge Rekdal (chair), Mimi Kristine Berdal (deputy chair), Johan Einar Hustad, Nina Schieldrop Lie, Terje Aven, Roar Bøe*, Henny May Justad*, Hilde Berge Kringstad* (* employee-elected)
Auditor: Deloitte AS
The state’s ownership interest through the Ministry of Petroleum and Energy: 100 %Company website: www.gassco.no
© G
assco AS
Gassco AS
83
Income statement (NOK millions) 2015 2014Operating revenues 103.7 108.4Operating expenses 101.3 99.8Gross operating profit (EBITDA) 2.6 8.9Operating profit (EBIT) 2.4 8.6Net financial items 0.9 1.1Profit/loss before tax 3.4 9.6Tax charge 0.0 0.0Profit/loss after tax 3.4 9.6 Balance sheet 2015 2014Intangible assets 0.0 0.0Fixed assets 0.3 0.5Financial fixed assets 0.0 0.0Total fixed assets 0.3 0.5Current assets 102.7 76.4Total assets 103.0 76.9 Paid-in equity 10.0 10.0Retained earnings/other equity 29.4 14.5Minority interests 0.0 0.0Total equity 39.4 24.5Non-current interest-free liabilities 19.3 28.7Non-current interest-bearing liabilities 0.0 0.0Current interest-bearing liabilities 0.0 0.0Current interest-free liabilities 44.3 23.7Total debt and liabilities 63.6 52.4Total equity and liabilities 103.0 76.9 Cash flow 2015 2014Operating activities 26.4 13.9Investment activities 0.0 -0.1Financing activities 0.0 0.0Change cash and cash equivalents 26.4 13.9 Key figures 2015 2014Capital employed 39.4 24.5Gross operating margin (EBITDA) 3 % 8 %Operating margin (EBIT) 2 % 8 %Equity ratio 38 % 32 %Return on equity 11 % 40 %Average return on equity last 5 years 10 % –Return on capital employed 11 % 40 % Subsidies from the State 2015 2014Government grants 76.7 77.0 Additional information 2015 2014Number of employees 35 37Proportion of employees in Norway 100 % 100 %State ownership at year-end 100 % 100 %Proportion of women on the board 50 % 50 %Proportion of women among owner-appointed/shareholder elected board members 40 % 40 %
Gassnova SF is the Norwegian state en-terprise for carbon capture and storage and manages the state’s interests related to carbon capture, transportation and storage. Gassnova was established as an administrative agency under the Ministry of Petroleum and Energy in 2005 and was transformed into a state enterprise in 2007. The enterprise will develop and demonstrate technology for capture, transportation and storage of carbon with dissemination potential, so that carbon capture and storage (CCS) can become an effective environmental measure.
Gassnova is located in Porsgrunn and had 35 employees at the end of 2015.
Important eventsIn 2015 Gassnova adopted a new strategy based on the government’s CCS strategy and the Storting’s ambition of realising a full-scale CCS demonstration facility by 2020, Gassnova’s objectives and the glob-al need for CCS in order to reach the two-degree target.
On 4 May 2015 Gassnova delivered a pre-feasibility study report to the Ministry of Petroleum and Energy summarising the work on the study of potential full-scale carbon capture and storage projects in Norway. The pre-feasibility study iden-tified three sources of emissions and sev-eral storage locations that may be techni-cally suitable for CCS. Gassnova has pointed out that it will be important to es-tablish predictable and appropriate frame-work conditions, the need to coordinate future efforts across the CCS chain and to ensure progress regarding the maturing of potential CO2 storage sites.
Since it opened, Technology Centre Mongstad (TCM) has established itself as an important arena for targeted testing, development and qualification of technol-ogy. Testing activities at TCM have led to a significant building of expertise for the owners of the facilities and the technology suppliers. In addition, the knowledge and expertise gained from the testing activi-ties have been further expanded through research and development at national and international research institutions. Work to facilitate long-term activity at the tech-nology centre beyond the current con-
tract period has been a high priority in 2015, in the form of dialogue with various leading international technology suppli-ers who have expressed interest in testing their technologies at TCM and through assessments related to different options for organising operations after 2017.
For ten years CLIMIT has worked to facilitate close, long-term collaboration between research and industry. Gassnova has focused on facilitating broader inter-national collaboration in the projects and opportunities for increased support inten-sity for the parties involved. In November 2015 the CLIMIT programme was ap-proved by the EFTA Surveillance Author-ity (ESA) for another five-year period.
Tore Amundsen stepped down as CEO at the end of 2015 and was replaced by Trude Sundset from 1 January 2016.
Corporate social responsibilityGassnova shall help develop and demon-strate technologies for CCS to incentivise CCS deployment, so that CCS becomes a tool to combat global warming. In this context Gassnova attaches particular im-portance to its responsibility to communi-cate its findings and knowledge based on the enterprise’s mission. In 2015 Gassno-va signed an agreement with the Research Centre in Porsgrunn, which includes pro-moting information on climate change and CCS aimed at children and young people in primary schools.
Financial developmentGassnova’s operations are funded via the national budget, and it is a not-for-profit enterprise. Gassnova invoices the Minis-try of Petroleum and Energy for services it performs for the Ministry, in accord-ance with the budget adopted. The enter-prise also receives revenues from sale of services to TCM DA. The enterprise’s ex-penses mainly consist of wages, hire of personnel, purchase of external services, travel expenses, rent and other office ex-penses. The surplus for 2015 was NOK 3.4 million, compared with a surplus of NOK 9.6 million in 2014. At year-end the enter-prise had bank deposits of NOK 100 mil-lion, and the liquidity situation is consid-ered good.
CEO: Tore Amundsen1
Board: Einar Steensnæs (chair), Ellen Cathrine Rasmussen (deputy chair), Cathrine Brekke, Trond Moengen, Alfred Nordgård, Liv Lønne Dille* (* employee-elected)
Auditor: Deloitte AS
The state’s ownership interest through the Ministry of Petroleum and Energy: 100 %Company website: www.gassnova.no
© TCM
DA
Gassnova SF
1 Tore Amundsen was CEO at the end of 2015. Trude Sundset took over as CEO 1 January 2016.

84
Income statement (NOK millions) 2015 2014Operating revenues 63.5 63.7Operating expenses 62.4 58.7Gross operating profit (EBITDA) 3.1 7.0Operating profit (EBIT) 1.1 5.0Net financial items 0.9 1.3Profit/loss before tax 2.0 6.4Tax charge 0.2 1.7Profit/loss after tax 1.8 4.6 Balance sheet 2015 2014Intangible assets 0.0 0.0Fixed assets 8.0 6.5Financial fixed assets 35.4 36.1Total fixed assets 43.4 42.6Current assets 52.9 53.8Total assets 96.3 96.4 Paid-in equity 27.5 27.5Retained earnings/other equity 44.4 43.0Total equity 71.9 70.4Provision for liabilities 0.1 0.1Non-current interest-bearing liabilities 5.4 6.1Current interest-bearing liabilities 18.9 19.7Current interest-free liabilities 0.0 0.0Total debt and liabilities 24.4 25.9Total equity and liabilities 96.3 96.4 Key figures 2015 2014Capital employed 96.2 96.3Gross operating margin (EBITDA) 5 % 11 %Operating margin (EBIT) 2 % 8 %Equity ratio 75 % 73 %Return on equity 3 % 7 %Average return on equity last 3 years 4 % –Return on capital employed 2 % 7 % Subsidies from the State/ Public purchases 2015 2014Subsidies from the State/Public purchases 22.0 22.5 Additional information 2015 2014Number of employees 32 31Proportion of employees in Norway 100 % 100 %State ownership at year-end 28.2 % 28.2 %Proportion of women on the board 38 % 38 %Proportion of women among owner-appointed/shareholder elected board members 43 % 43 %
Graminor AS is a plant breeding compa-ny that develops new and improved plant varieties, tests and represents imported varieties, and produces pre-basic seed in order to provide Norwegian farming and horticulture with disease-free field crops and horticultural plants that are suitable for Norwegian growing conditions.
The company was established in 2002 as a continuation of Norsk Kornforedling AS, in order to collect Norwegian plant breeding for farming and horticulture in a single company.
Graminor is responsible for all cultiva-tion of crops and horticultural plants in Norway. Its purpose is to ensure that pro-ducers have access to varied and disease-free plant material that is suitable for Nor-wegian conditions.
Important eventsIn 2015 the company increased sales of its cereals in Finland, and the market share of oats in particular has increased signifi-cantly.
Corporate social responsibilityIn 2015 Graminor increased its participa-tion in research and development projects and was involved in 18 major projects. The focus on research and development en-tails more efficient processing activities, among other things.
Financial developmentThe company had total operating reve-nues of NOK 63.5 million and a profit after tax of NOK 1.8 million, compared with NOK 4.6 million in 2014. The financial sit-uation is good. No dividends were paid for 2015.
CEO: Idun Christie
Board: Harald Milli (chair), Bjørn Stabbetorp (deputy chair), Harald Lossius, Wenche Myhre Dale, Annette Olesen, Nina Heiberg, Jostein Fjeld, Lars Reitan* (* employee-elected)
Auditor: BDO AS
The state’s ownership interest through the Ministry of Agriculture and Food: 28.2 %Company website: www.graminor.no
© G
raminor A
S
Graminor AS

85
Income statement (NOK millions) 2015 2014Recognised grants 1 058 1 110Other operating revenues 173 212Total operating revenues 1 231 1 322Operating expenses 1 387 1 425Net financial items 440 416Operating profit before losses on loans and guarantees 284 312Net losses 21 14Profit/loss before tax 263 298Tax charge 0 0Profit/loss after tax 263 298 Balance sheet 2015 2014Bank deposits 6 112 5 939Net lending 16 861 17 163Securities 105 74Ownership interests in group companies 0 0Fixed assets 27 30Other assets 459 451Total assets 23 565 23 656 Deposits from the State 14 825 15 355Net bond loan debt 0 0Other debt and liabilities 1 231 986Other debt and liabilities 3 890 3 953Total loan and investment fund 2 084 1 850Total debt and liabilities 22 030 22 144Paid-in equity 666 666Retained earnings 870 847Total equity 1 535 1 513Total equity and liabilities 23 565 23 656 Cash flow 2015 2014Operating activities 495 -532Innbetaling fra eier 229 -244Investment activities -20 -22Financing activities -530 460Change cash and cash equivalents 173 -338 Dividends 2015 2014Dividend for the financial year 235 45Dividend percentage 89 % 15 %Average dividend percentage last 5 years 40 % –Dividend to the state 217 25 Subsidies from the State/ Public purchases 2015 2014Grants 1 058 1 110
Allocations Transfers to the State/owners 235 45Transferred to/from funds and equity 28 254Total allocations 263 298 Additional information 2015 2014Number of employees 716 766Proportion of employees in Norway 79 % 74 %State ownership at year-end 51 % 51 %Proportion of women on the board 55 % 45 %Proportion of women among owner-appointed/shareholder elected board members 56 % 44 %
Innovasjon Norge, Innovation Norway, is part of the Norwegian innovation policy system. The company manages instru-ments to promote business development on behalf of various ministries, regional authorities and county governors. These instruments share the common goals of triggering commercial and socio-econom-ically profitable business development and releasing the potential in the different regions’ business opportunities by sup-porting promising entrepreneurs, high-growth companies and innovative busi-ness communities.
Innovasjon Norge is organised as a special-legislation company in accordance with the Act relating to Innovasjon Norge. This form of association means that the company is a separate legal entity with in-dependent and professional responsibility for decisions concerning individual mat-ters. Ownership of Innovasjon Norge is shared by the state, represented by the Ministry of Trade, Industry and Fisher-ies, (51%) and the county administrations (49%).
Important eventsIn 2015 the Storting and the county coun-cil allocated a total of NOK 3.4 billion to the company. This is used to fund loans, grants, consulting, promotion and net-working through Innovasjon Norge’s vari-ous services. Along with loan schemes, the grants resulted in business ventures of NOK 6.1 billion.
Innovasjon Norge reports on the im-pact of its work among its customers as part of its management by objectives and results system. The underlying data are provided by Statistics Norway. The re-sults in the annual report for 2015 indicate that Innovasjon Norge’s work is effective. Companies that received support from In-novasjon Norge had a higher annual in-crease in revenues (12.6 percentage points) and productivity (1.9 percentage points) over a three-year period than the control group. This method was further developed in 2014, and the figures are therefore not directly comparable with previous years. There is no difference in commercial profitability, compared with the control group. Number of employees and value creation increased by 5.4 and 5.9 percentage points respectively.
In spring 2015 a number of dialogue meetings were held across the country, with the Dream Commitment as the over-arching topic. Input from more than 3,500
participants was summarised in a sepa-rate report that will form the basis for the further development of Innovasjon Norge’s instruments, and which will be used in the dialogue with owners, clients, partners and others interested in innova-tion and business development.
In 2015 the company completed a downsizing and restructuring process. By year-end the company had reduced its workforce to meet expectations regarding increased efficiency, implemented a new organisational structure and prepared a revised strategy. This will enable Inno-vasjon Norge to meet the evolving needs of its customers, partners and clients, as well as pave the way for more efficient in-teraction with these.
Corporate social responsibilitySustainability shall underlie all of Innovas-jon Norge’s activities. In 2015 the compa-ny established a separate division for sus-tainability, and the Board adopted a new strategy for this area. This strategy, to-gether with Innovasjon Norge’s anti-cor-ruption policy, governs the customer-ori-ented corporate social responsibility work.
The UN Global Compact has been the main platform for Innovasjon Norge’s cor-porate social responsibility work. From 2015 the OECD Guidelines for Multina-tional Enterprises and the UN Human Rights Framework are also included. In addition, Innovasjon Norge has a good working relationship with the organisa-tions Transparency International and the Ethical Trading Initiative.
Financial developmentInnovasjon Norge’s operating revenues fell to NOK 1,231 million in 2015, com-pared with NOK 1,322 million the previ-ous year. Operating costs totalled NOK 1,387 million (NOK 1,425 million). The decline is related to the restructuring pro-cess in the company. Net interest income amounted to NOK 426 million. (NOK 417 million). Innovasjon Norge posted a profit of NOK 263 (298) million. The company has proposed transferring NOK 216 mil-lion to the state, represented by the Minis-try of Trade, Industry and Fisheries, and NOK 19 million to the counties.
CEO: Anita Krohn Traaseth
Board: Per Otto Dyb (chair), Tone Merete Lindberg (deputy chair), Reidar Bye, Jan Løkling, Jørand Ødegård Lunde, Einar Enger, Martha Kold Bakkevig, Wenche Kjølås, Heidi Wang, Ove Haaversen- Westhassel*, Toini Hilde Annbjørnsdatter Ness* (* employee-elected)
Auditor: Deloitte AS
The state’s ownership interest through the Ministry of Trade, Industry and Fisheries: 51 %Company website: www.innovasjonnorge.no
© Innovasjon N
orge
Innovasjon Norge

86
Income statement (NOK millions) 2015 2014Operating revenues 11.2 12.0Operating expenses 12.2 11.9Gross operating profit (EBITDA) -0.8 0.2Operating profit (EBIT) -1.0 0.1Net financial items 0.2 0.3Profit/loss before tax -0.8 0.4Tax charge -0.2 0.1Profit/loss after tax -0.6 0.3 Balance sheet 2015 2014Intangible assets 0.2 0.0Fixed assets 0.5 0.7Financial fixed assets 0.0 0.0Total fixed assets 0.7 0.7Current assets 12.5 13.2Total assets 13.2 13.9 Paid-in equity 8.0 8.0Retained earnings/other equity 3.1 3.7Total equity 11.1 11.7Provision for liabilities 0.0 0.0Non-current interest-bearing liabilities 0.0 0.0Current interest-bearing liabilities 2.1 2.1Current interest-free liabilities 0.0 0.0Total debt and liabilities 2.1 2.2Total equity and liabilities 13.2 13.9 Key figures 2015 2014Capital employed 13.2 13.9Gross operating margin (EBITDA) -7 % 2 %Operating margin (EBIT) -9 % 1 %Equity ratio 84 % 84 %Return on equity -5 % 3 %Average return on equity last 3 years 2 % –Return on capital employed -6 % 3 % Subsidies from the State/ Public purchases 2015 2014Subsidies from the State/Public purchases 3.4 3.4 Additional information 2015 2014Number of employees 20 20Proportion of employees in Norway 100 % 100 %State ownership at year-end 51 % 51 %Proportion of women on the board 33 % 33 %Proportion of women among owner-appointed/shareholder elected board members 20 % 20 %
Kimen Såvarelaboratoriet AS is Nor-way’s only centre of expertise on seed quality and seed analysis and is the nation-al reference laboratory for seed analysis. The company has built its expertise through 130 years of principally state ownership. The laboratory was restructured as a lim-ited company in 2004. The company is owned by the state through the Ministry of Agriculture and Food (51 %), Felleskjø-pet Agri SA (34 %) and Strand Unikorn AS (15 %).
Kimen Såvarelaboratoriet is accredited by ISTA (International Seed Testing As-sociation) for analysis of germination, seed health, purity and moisture content determination of all relevant seeds and can issue international seed certificates. The accreditation guarantees quality and national competence in the field. The company’s main strategy is to cover the needs of the seed industry and the gov-ernment for services in purity, germina-tion and health analyses of seed.
Important eventsA new technical director was hired in 2015 (overlapping with the outgoing technical director from April 2015 until February 2016). The technical director of Kimen Såvarelaboratoriet has overall responsibil-ity for quality and technical operations in the company. Seed testing and analysis is a broad area and unique in the national context. The board regarded the long pe-riod of overlap as important to ensure ad-equate transfer of knowledge between the outgoing and the incoming technical di-rector.
In early 2015 the board considered and adopted Kimen Såvarelaboratoriet’s stra-tegic plan for the period 2015–2020. Con-tinuation and protection of the company’s unique expertise are key points in the strategic plan.
Corporate social responsibilityKimen Såvarelaboratoriet shall cover the needs of the seed industry and the gov-ernment for competence and analyses in the field of seed. Analysis of seed samples also provides a foundation for the Norwe-gian Food Safety Authority’s certification of seed for sale. The agreement regarding development of knowledge and knowl-edge support between Kimen Såvarelabo-ratoriet and the Food Safety Authority de-scribes the tasks ascribed to the company by the Food Safety Authority as a state authority (emergency preparedness, pro-fessional advice, risk assessment, refer-ence function, diagnosis and method de-velopment, monitoring, and obtaining knowledge and reporting). Kimen Såvare-laboratoriet’s reference functions are set out in EU / EEA legislation. In 2015 the company delivered services and analyses in accordance with agreements, objec-tives and strategies, as well as demand in the field.
Financial developmentKimen Såvarelaboratoriet’s financial per-formance is closely linked to the demand for analyses in the field of seed. In addi-tion, the public subsidy is essential to en-able the laboratory to exercise functions beyond ordinary analysis, such as the role as an advisory body in matters pertaining to its core expertise. Most of the sales rev-enue comes from analysis of samples. The volume of samples tests for analysis varies from season to season, depending on the quality of the year’s seed and grain har-vest and the need for seed in the individu-al year. Revenue also includes analyses and services for research institutions. Fi-nancially, 2015 was not such a good year for the company, albeit for undramatic reasons: in addition to slightly lower anal-ysis sales, the company had additional personnel expenses in 2015 linked to the hiring of a new technical director.
CEO: Birgitte Henriksen
Board: Kåre Oskar Larsen (chair), Arnfinn Sjøseth (deputy chair), Unni Abrahamsen, Jostein Fjeld, Jon Atle Repstad, Barbro Isaksen* (* employee-elected)
Auditor: Mazars Revisjon AS
The state’s ownership interest through the Ministry of Agriculture and Food: 51 %Company website: www.kimen.no
© Kim
en Såvarelaboratoriet AS
Kimen Såvarelaboratoriet AS

87
Income statement (NOK millions) 2015 2014Operating revenues 55.1 62.6Operating expenses 57.9 59.1Operating profit/loss -2.8 3.5Net financial items -0.1 -0.2Profit/loss before tax -2.9 3.3Tax charge -0.5 0.5Profit/loss after tax -2.5 2.8 Balance sheet 2015 2014Intangible assets 0.6 0.1Fixed assets 1.6 0.0Financial fixed assets 0.0 0.0Total fixed assets 2.2 0.1Current assets 22.8 24.6Total assets 25.0 24.7 Paid-in equity 7.0 7.0Retained earnings/other equity 5.5 8.0Total equity 12.5 15.0Provision for liabilities 0.0 0.0Non-current liabilities 0.0 0.0Current interest-bearing liabilities 0.0 0.0Current interest-free liabilities 12.5 9.7Total debt and liabilities 12.5 9.7Total equity and liabilities 25.0 24.7 Cash flow 2015 2014Operating activities 8.5 3.4Investment activities -20.7 -22.2Financing activities 20.7 22.2Change cash and cash equivalents 8.5 3.4 Subsidies 2015 2014General State subsidies for operations and investments 19.0 19.0Subsidies from others 1.9 2.1Total subsidies to Bjørnøen AS -0.2 -0.2Total subsidies to Kings Bay AS 20.7 20.9 Application of subsidies Investments 22.3 22.2Transferred from previous years 0.0 1.3Transferred to next year -1.6 0.0Subsidies recognised during the year 0.0 0.0Total application of subsidies 20.7 20.9 Additional information 2015 2014Number of employees 24 26Proportion of employees in Norway 100 % 100 %State ownership at year-end 100 % 100 %Proportion of women on the board 50 % 50 %Proportion of women among owner-appointed/shareholder elected board members 40 % 50 %
Kings Bay AS, which was founded in 1916, is responsible for the operation and development of the infrastructure in Ny-Ålesund in Svalbard. Operations include emergency preparedness, sea services, air transport, engineering services, ac-commodation, food and refreshments, and water and electricity supply. The com-pany also provides services to cruise ships and other vessels that arrive for the day during the summer season. Kings Bay prioritises environmentally sound and efficient operations.
One of the objectives of the state’s own-ership in Kings Bay AS is to ensure that Ny-Ålesund can be developed as a Norwe-gian centre for international Arctic re-search in Svalbard.
Ten research communities from differ-ent nations have a permanent base in Ny-Ålesund, and every year close to 20 differ-ent research communities carry out re-search projects on Kings Bay’s property in and around Ny-Ålesund.
Important eventsThere were 14,437 research days in Ny-Ålesund in 2015. This is roughly the same high level as in 2014. A significant portion of the research days are related to marine research based in the marine laboratory, which has been upgraded and expanded in recent years. There were a total of ap-prox. 29,045 overnight stays in Ny-Ålesund in 2015, including employees, visitors and seasonal workers.
A fiber optic cable was laid between Ny-Ålesund and Longyearbyen in autumn 2014, and all the research stations were connected in the first half of 2015. The fiber optic network will allow the ex-change of large volumes of research data in almost real time and is expected to pro-vide a sound basis for long-term develop-ment of the location as a research centre. The further expansion of the research in-frastructure will be shared facilities where availability is based on contract hire.
Kings Bay is continuing to develop Ny-Ålesund in an environmentally friendly perspective. A sewage treatment plant was established in autumn 2015.
The Ny-Ålesund Symposium, which brings together international experts, is scheduled to be held again in September 2016, hosted by the Minister of Trade and Industry.
Nine official delegations, consisting of 143 persons, visited Ny-Ålesund in 2015, including the Secretary-General of the United Nations Ban Ki-moon, the US Sen-ators McCain, Murkowski, Barrosso and Rounds, the Netherlands’ Minister of For-eign Affairs Koenders and Norway’s Min-ister of Foreign Affairs Brende, Minister of Justice and Public Security Anundsen and former Minister of Fisheries Aspaker.
Corporate social responsibilityKings Bay has publicly available ethical guidelines. Its annual report provides in-formation about the company’s work on corporate social responsibility.
Financial developmentKings Bay aims for its operating accounts to balance, while major investments and other extraordinary costs that arise as a result of the company’s obligations are covered by a state subsidy. The income statement for 2015 shows a financial re-sult for the year of NOK -2.5 million. Oper-ating revenues in 2015 amounted to NOK 55.1 million, against NOK 62.6 million the previous year. The decline from the previ-ous year is mainly due to the loss of ex-traordinary income from construction ac-tivities. The majority of the expenses are related to air transport and airport opera-tions, diesel for the power station and pay-roll expenses. An unexpected increase in air transport expenses in 2015 is the main reason for the operating deficit. The com-pany received an investment grant from the state of NOK 19 million in 2015.
CEO: Ole Øiseth
Board: Unni Steinsmo (chair), Widar Salbuvik (deputy chair), Kirsten Broch-Mathisen, Egil Murud, Sven Ole Fagernæs, Turid Lie Vilkensen* (* employee-elected)
Auditor: PricewaterhouseCoopers AS
The state’s ownership interest through the Ministry of Trade, Industry and Fisheries: 100 %Company website: www.kingsbay.no
© Kings Bay A
S
Kings Bay AS

88
Income statement (NOK millions) 2015 2014Operating revenues 258.1 243.5Operating expenses 251.8 239.2Gross operating profit (EBITDA) 16.6 14.2Operating profit (EBIT) 6.3 4.3Net financial items -0.4 -0.1Profit/loss before tax 5.9 4.2Tax charge 0.0 0.0Profit/loss after tax 5.9 4.2 Balance sheet 2015 2014Intangible assets 0.0 0.0Fixed assets 50.0 56.9Financial fixed assets 4.6 4.6Total fixed assets 54.6 61.5Current assets 68.1 35.0Total assets 122.7 96.4 Paid-in equity 10.2 10.2Retained earnings/other equity 27.5 21.5Total equity 37.7 31.7Provision for liabilities 8.7 3.2Non-current interest-bearing liabilities 10.6 13.1Current interest-bearing liabilities 0.0 0.0Current interest-free liabilities 65.7 48.4Total debt and liabilities 85.1 64.8Total equity and liabilities 122.7 96.5 Cash flow 2015 2014Operating activities 33.5 16.5Investment activities -3.5 -6.4Financing activities 4.0 -1.1Change cash and cash equivalents 34.0 9.0 Key figures 2015 2014Capital employed 48.3 44.8Gross operating margin (EBITDA) 6 % 6 %Operating margin (EBIT) 2 % 2 %Equity ratio 31 % 33 %Return on equity 17 % 14 %Average return on equity last 3 years 11 % –Return on capital employed 15 % 13 % Other key figures 2015 2014Total number of performances 907 989Tickets sold 235 926 214 000Audiences 83 % 77 %Ticket sales 56.6 44.3 Subsidies from the State 2015 2014Ministry of Culture 189.2 188.2 Additional information 2015 2014Number of employees 380 390Proportion of employees in Norway 100 % 100 %State ownership at year-end 100 % 100 %Proportion of women on the board 38 % 43 %Proportion of women among owner-appointed/shareholder elected board members 40 % 40 %
Nationaltheatret AS was founded in 1899 with the objective of putting on thea-tre productions. The company has par-ticular responsibility for safeguarding na-tional cultural policy interests in the field of dramatic art. Nationaltheatret is located in central Oslo between the Royal Palace, the Storting and the University. National-theatret’s strategy for the years 2015–2018 states that Nationaltheatret shall be the leading theatre in Norway, develop dra-matic art, and receive international recog-nition. Performances should be daring and relevant, and the theatre should be open and engage the public. The theatre will strive to be a modern theatre compa-ny in terms of its organisation and techni-cally, with up-to-date premises and facili-ties. The theatre has a number of perma-nent stages in Oslo city centre and one stage in the neighbourhood of Torshov. In addition, Nationaltheatret shares joint workshops with Rikstheatret in Brobekk.
Important eventsIn June 2012 the government decided to conduct an external quality assurance process with a “choice of solution” study and associated external quality assurance in connection with renovation of the Na-tionaltheatret building. The assumption is that the Nationaltheatret building will be renovated and refurbished as a theatre. The choice of solution study was carried out in 2013–2014, and the external quality assurance will be carried out in 2015. Both the choice of solution study and the external quality assurance were published on 26 October 2015.
Corporate social responsibilityNationaltheatret safeguards national cul-tural policy interests in the field of dramat-ic art. Nationaltheatret works to make dramatic art and high-quality culture available to everyone, promotes artistic development and renewal, and protects the national cultural heritage. National-theatret shall contribute to an open and enlightened public discourse through its activities. The theatre also regards it as an important social responsibility for itself to work actively to provide a healthy work-ing environment and to structure its op-erations such that energy consumption, waste and emissions are minimised as far as is possible within the constraints of the current buildings.
Financial developmentThe accounts for 2015 show a profit for the year of just over NOK 6 million. Equi-ty at the end of 2015 amounted to NOK 37.8 million, which is 15% of the total rev-enue. The theatre has worked systemati-cally to increase its own revenues in order to provide the core business with greater flexibility. The increase in revenues is pri-marily attributable to larger audiences. Ticket revenues in 2015 were just over NOK 12 million higher than the previous year. In addition, the theatre restaurant had a good year financially, with increased sales. Payroll costs including pensions in-creased by NOK 12.5 million in 2015. In 2015 the theatre and orchestra sector worked on finding a more predictable and sustainable pension plan. This was tempo-rarily resolved in the 2016 main wage set-tlement.
CEO/Theatre director: Hanne Tømta
Board: Anne Enger (chair), Øystein Kåre Djupedal (deputy chair), Leif Pagrotsky, Jens Paludan Heyerdahl, Tone Winje, Ingjerd Egeberg*, Mattis Herman Nyquist*, Bjørn Moe* (* employee-elected)
Auditor: Nitschke AS
The state’s ownership interest through the Ministry of Culture: 100 %Company website: www.nationaltheateret.no
© Tor Einstadblad
Nationaltheatret AS

89
Income statement (NOK millions) 2015 2014Operating revenues 545.0 527.0Operating expenses 524 491.5Gross operating profit (EBITDA) 46.0 43.8Operating profit (EBIT) 21.0 35.5Net financial items 1.0 -0.2Profit/loss before tax 22.0 35.3Tax charge 0.0 -0.5Profit/loss after tax 22.0 35.8 Balance sheet 2015 2014Intangible assets 0.0 0.0Fixed assets 41.0 54.1Financial fixed assets 0.3 0.6Total fixed assets 41.3 54.7Current assets 220.3 199.8Total assets 261.6 254.5 Paid-in equity 21.1 21.1Retained earnings/other equity 80.9 44.3Total equity 102.0 65.4Provision for liabilities 19.0 32.4Non-current interest-bearing liabilities 0.1 26.1Current interest-bearing liabilities 0.0 0.0Current interest-free liabilities 140.5 130.6Total debt and liabilities 159.6 189.1Total equity and liabilities 261.6 254.5 Cash flow 2015 2014Operating activities 42.8 66.5Investment activities -41.7 -3.5Financing activities -26.0 -11.0Foreign currency effects 0.0 0.0Change cash and cash equivalents -24.9 52.0 Key figures 2015 2014Capital employed 102.1 91.5Gross operating margin (EBITDA) 8.4 % 8.3 %Operating margin (EBIT) 3.9 % 6.7 %Equity ratio 39.0 % 25.7 %Return on equity 26 % 75 %Average return on equity last 5 years 18 % –Return on capital employed 24 % 47 % Subsidies from the State 2015 2014Government grants 97.4 98.6 Additional information 2015 2014Number of employees 344 345Proportion of employees in Norway 100 % 100 %State ownership at year-end 56.84 % 56.84 %Proportion of women on the board 38 % 50 %Proportion of women among owner-appointed/shareholder elected board members 40 % 50 %
Nofima AS is an internationally re-nowned applied research institute that de-livers research and solutions that yield competitive advantages along the entire value chain in industries that produce food. This encompasses the company’s objective of contributing to increased food safety and sustainable production of safe food that promotes public health. The company’s focus on sustainable, business-oriented value creation and social devel-opment in the food, fisheries and aquacul-ture sector is realised through close con-tact with industry players and authorities, as well as through active dissemination and implementation of research results. Nofima collaborates with a broad range of research and development groups in Nor-way and internationally to enhance the quality and value of its activities.
Nofima has 344 employees at five sites across the country and is headquartered in Tromsø.
Important eventsNofima was awarded a number of new projects and assignments in 2015 and in-creased its work to ensure that research results are used.
Nofima is a partner in the cluster initia-tive in Bergen, which was awarded the status of a National Centre of Expertise (NCE Seafood Innovation) together with a number of business and research groups.
In 2015 Nofima updated its business plan and sharpened its focus on sustaina-ble and profitable food production. Through the development of strategic ini-tiatives, the company has sharpened its professional profile in order to enhance its scientific quality and relevance for the business community.
With a view to ensuring better utilisa-tion of the company’s infrastructure, it was decided to co-locate the company’s research on feed and nutrition at Kjerreid-viken. The amalgamation is scheduled to be completed by the end of the first quar-ter of 2016 and will be achieved using the infrastructure funds that Nofima received from the Research Council of Norway to upgrade the facilities for feed and nutri-tion research.
The company achieved high capacity utilisation throughout the year, which is a positive development. Cost control is good throughout the company.
Six doctorates were completed in 2015 by candidates employed at Nofima, and 156 scientific publications were published with the participation of Nofima employ-ees.
Corporate social responsibilityNofima has ethical guidelines and re-search ethics guidelines. The company bases its operations on the eight core con-ventions of the International Labour Or-ganisation (ILO) and follows specific com-pany and industry-oriented guidelines in its reporting. In addition, the company follows government guidelines to mini-mise the environmental impact of its re-search activities.
Financial developmentRevenue in Nofima amounted to NOK 545 million in 2015 (up 3.4% from the previous year), and the company had an operating profit of NOK 22 million. The equity ratio at the end of 2015 was 39%. Nofima has achieved both a higher level of funding and kept its costs under control. 2015 was a good year for Nofima’s research activi-ties.
In 2015 the company repaid the out-standing residual balance of NOK 21.4 million on the bridging loan from the state, which was established when the company was founded. The original loan sum was NOK 42.8 million. In 2010 it was converted into a serial loan with a repay-ment term of ten years.
Nofima is experiencing fierce competi-tion for research funding from the Re-search Council of Norway and industry, and there is uncertainty about long-term project financing. The company has there-fore paid particular attention to cement-ing the company’s professional standing through improved quality and a more tar-geted profile. The healthy financial results have given Nofima a certain degree of room for manoeuvre, allowing the com-pany to invest in expertise and further de-velopment of research infrastructure.
CEO: Øyvind Fylling-Jensen
Board: Olav Fjell (chair), Eirik Selmer-Olsen (deputy chair), Yngve Myhre, Edel Storelvmo, Ann Øygård, Jens Petter Wold*, Bjørn Inge Bendiksen*, Bente Asbjørnsen* (* employee-elected)
Auditor: PricewaterhouseCoopers AS
The state’s ownership interest through the Ministry of Trade, Industry and Fisheries: 56.84 %Company website: www.nofima.no
© Bjørn Joachim
sen
Nofima AS
90
Income statement (NOK millions) 2015 2014Operating revenues 32.2 27.5Operating expenses 29.3 24.4Gross operating profit (EBITDA) 3.3 4.8Operating profit (EBIT) 2.9 3.1Net financial items 0.1 0.2Profit/loss before tax 3.0 3.3Tax charge 0.0 0.0Profit/loss after tax 3.0 3.3 Balance sheet 2015 2014Intangible assets 0.0 0.0Fixed assets 3.1 2.2Financial fixed assets 0.0 0.0Total fixed assets 3.1 2.2Current assets 14.5 10.8Total assets 17.6 13.0 Paid-in equity 0.1 0.1Retained earnings/other equity 11.0 8.3Total equity 11.1 8.4Provision for liabilities 0.0 0.0Non-current interest-bearing liabilities 0.0 0.0Current interest-bearing liabilities 0.0 0.0Current interest-free liabilities 6.5 4.6Total debt and liabilities 6.5 4.6Total equity and liabilities 17.6 13.0 Cash flow 2015 2014Operating activities 4.1 3.2Investment activities -1.3 -0.5Financing activities 0.0 0.1Change cash and cash equivalents 2.8 2.8 Key figures 2015 2014Capital employed 11.1 8.4Gross operating margin (EBITDA) 10 % 18 %Operating margin (EBIT) 9 % 11 %Equity ratio 63 % 65 %Return on equity 31 % 43 %Average return on equity last 3 years 35 % –Return on capital employed 31 % 43 % Subsidies from the State/ pubic procurements 2015 2014Subsidies 18.5 14.1 Additional information 2015 2014Number of employees 26 25Proportion of employees in Norway 100 % 100 %State ownership at year-end 49 % 49 %Proportion of women on the board 50 % 40 %Proportion of women among owner-appointed/shareholder elected board members 50 % 40 %
Nordisk Institutt for Odontologiske Materialer AS (NIOM) was established as a state-owned limited company in 2009 by the Ministry of Health and Care Ser-vices (49% of the shares) and UniRand AS (51%) as owners. NIOM was founded back in 1972 as an institute under the Nordic Council of Ministers. NIOM is a Nordic cooperative body working to promote and continue the Nordic cooperation within the mandate and framework contract be-tween the company and the Nordic Coun-cil of Ministers. The company shall also safeguard the purposes and tasks set out in the Ministry of Health and Care Ser-vices’ annual budget and the Directorate of Health’s subsidy scheme.
NIOM’s objective is to ensure that den-tal products in the Nordic region meet health and technical standards in terms of developments in the field. The company’s tasks are research, material testing, stand-ardisation and information activities di-rected towards the health authorities and the dental health services in the Nordic region. The company’s research and in-formation activities shall be scientifically founded and applicable to clinical dentist-ry. NIOM and the public dental health service’s centres of expertise shall col-laborate on clinical and patient-related re-search projects.
NIOM’s vision is to help ensure safe, well-functioning biomaterials for patients in the Nordic countries. The company’s strategy is to have a high Nordic profile, conduct biomaterials research on a high international level, be an active contribu-tor to policy formulation in European and international standardisation, and that the company’s assignment work generates funds and knowledge that can strengthen the company’s other activities.
Important eventsNIOM’s information activities, research activities and research collaboration are all linked to the Nordic countries and Nor-dic synergy. Five visiting scientists have been offered a place to work at NIOM in 2015, three of whom come from universi-
ties and colleges in Denmark, Finland and Iceland. There are planned and ongoing collaborative projects with all the dental health service’s centres of expertise.
Nordic dentists are informed of the re-sults of NIOM’s research and advice through lectures at dental conferences, publication in Nordic dental journals, and on NIOM’s website. In addition Nordic dentists receive a monthly newsletter from the company. NIOM also answers a number of queries from Nordic dentists regarding the use and choice of materials.
NIOM’s participation in European and international standardisation provides Nordic influence in the field, as the other Nordic countries (except for Sweden in the field of dentistry) do not participate in the standardisation work, or do so only to a limited extent. NIOM’s researchers are group leaders and technical experts on committees for material quality and bio-logical qualities related to dental and med-ical biomaterials.
NIOM’s Nordic utility has been as-sessed, and Nordic health authorities point out that NIOM has a special position in relation to materials research in the Nordic region and that NIOM is an invalu-able source of independent product infor-mation regarding dental materials.
Corporate social responsibilityNIOM’s activities play an important role in ensuring patient safety in the Nordic region.
Financial developmentNorwegian health authorities fund NIOM’s rent, standardisation work and research in collaboration with dental health service’s centres of expertise. This amounted to 60% of the revenue in 2015. The company re-ceived framework funding from the Nordic Council of Ministers for 2015 and for the period 2016–2018 for visiting scientists ac-tivity, information and biomaterials re-search. At the end of 2015 the accounts showed a surplus of NOK 2.7 million com-pared with the budgeted NOK 0.2 million. The company does not pay dividends.
CEO: Jon Einar Dahl
Board: Pål Barkvoll (chair), Ellen Berggreen, Pål Brodin, Hilde Kanli Galtung, Erik Gulbrandsen, Marianne Hiorth, Preben Hørsted Bindslev, Anne Nordblad, Helga Ágústsdóttir, Andreas Cederlund
Auditor: Lundes Revisjonskontor I DA
The state’s ownership interest through the Ministry of Health and Care Services: 49 %Company website: www.niom.no
© N
ordisk Institutt for Odontologiske M
aterialer AS
Nordisk Institutt for Odontologiske Materialer AS

91
Income statement (NOK millions) 2015 2014Operating revenues 274 277Operating expenses 105 13Gross operating profit (EBITDA) 100 139Operating profit (EBIT) 168 264Net financial items 290 335Profit/loss before tax 458 598Tax charge 0 0Profit/loss after tax 458 598 Balance sheet 2015 2014Intangible assets 0 0Fixed assets 4 5Financial fixed assets 3 592 2 849Total fixed assets 3 596 2 854Current assets 11 925 9 839Total assets 15 521 12 693 Paid-in equity 11 217 9 737Retained earnings/other equity 4 225 2 860Total equity 15 442 12 597Provision for liabilities 25 26Non-current interest-bearing liabilities 0 0Current interest-bearing liabilities 0 0Current interest-free liabilities 54 70Total debt and liabilities 79 96Total equity and liabilities 15 521 12 693 Cash flow 2015 2014Operating activities 150 133Investment activities -3 180 -909Financing activities 1 671 1 229Change cash and cash equivalents -1 359 453 Key figures 2015 2014Percentage new investments in least developed countries1 38 % 24 %Percentage investments in Africa1 85 % 81 % Subsidies from the State 2015 2014Subsidies for professional investment assistance 21 19Capital contributions from the State 1 480 1 230 Additional information 2015 2014Number of employees 67 61Proportion of employees in Norway 65 % 69 %State ownership at year-end 100 % 100 %Proportion of women on the board 50 % 50 %Proportion of women among owner-appointed/shareholder elected board members 50 % 50 %
Norfund ((the Norwegian Investment Fund for Developing Countries) was es-tablished as a special-legislation company in 1997. The fund is an instrument in Nor-wegian development policy, which con-tributes to development by investing in profitable and sustainable companies in developing countries. Norfund invests eq-uity, directly in enterprises and indirectly through funds, as well as providing loans and guarantees to individual companies.
Important eventsNorfund entered into investment agree-ments totalling NOK 2.4 billion in 2015. Of these investments roughly NOK 328 mil-lion was in clean energy, NOK 1.5 billion in financial institutions and NOK 325 mil-lion in food and agriculture. Around NOK 253 million was invested in funds for small and medium-sized enterprises (SMEs). Some 85% of new investments were in sub-Saharan Africa, while 38% were in so-called least developed countries (LDCs). The largest investment in 2015 was a stake of 12.2% in Equity Group Holdings Ltd. (Equity Bank), which is the second largest bank in Kenya, in partnership with Norfinance AS.
In 2015 Norfund revised its strategy. The main elements of Norfund’s strategy are competence-based growth, geograph-ic concentration on eastern and southern Africa, Central America and some coun-tries in Southeast Asia and prioritisation of investments in clean energy, financial institutions and food and agriculture. The fund aims to strengthen its role as an ac-tive, strategic minority investor with a main emphasis on use of equity instru-ments. The geographical universe is be-ing extended slightly to include Ethiopia, Somaliland and a gradual entry into West Africa. Investments through platform com- panies such as SN Power, the Norwegian Microfinance Initiative and Globeleq will play a central role in the future.
Corporate social responsibilityNorfund exercises corporate social re-sponsibility by setting high standards for its own operations and the operations of the companies in its portfolio. Norfund has zero tolerance for corruption and re-
quires respect for human rights, gender equality, local communities, and the envi-ronment and biodiversity. Norfund there-fore stipulates compliance requirements over and above those that are regulated in national legislation and commits the busi-nesses to compliance with the environ-mental and social standards of the World Bank’s International Finance Corpora-tion. Monitoring compliance with these standards is an integral part of the work related to entering into investment agree-ments and following up the investments.
At the end of 2015 some 382,000 people were employed in businesses Norfund had invested in directly or indirectly. The companies purchased goods and services from local suppliers for NOK 22 billion. The energy companies in the portfolio produced a total of 18.5 TWh of electricity in 2015, equivalent to the consumption of 25 million people in the countries con-cerned. Norfund’s renewable portfolio helped prevent around 7.4 million tonnes of carbon emissions in 2015. The agricul-tural companies cultivated 45,000 hec-tares of land and produced 125,000 tonnes of food.
Financial developmentNorfund’s parent company posted a sur-plus for 2015 of NOK 426 million, against NOK 598 million the previous year, and revenues amounted to NOK 340 million (NOK 462 million). The company’s oper-ating expenses before currency gains and losses on loans and write-downs rose by NOK 33 million to NOK 173 million in 2015. Norfund’s total on the statement of financial position at year-end 2014 was NOK 15,085 million (NOK 12,693 mil-lion). The company had equity of NOK 15,006 million (NOK 12,597 million). Val-ue-adjusted equity at year-end 2015 was NOK 19,400 million (NOK 15,530 mil-lion). The return on the investment port-folio in 2015 was 3.5% measured in the in-vestment currency and 18.7% in Norwe-gian kroner. Since its establishment, the fund has had an average annual return of 5.4% in the investment currency and 10.5% in Norwegian kroner, calculating the re-turn from the start date of the invest-ments.
CEO: Kjell Roland
Board: Kristin Clemet (chair), Borghild Holen, Finn Marum Jebsen, Martin Skancke, Brit Kristin Sæbø Rugland, Andre Støylen, Nina Elisabeth Hansen*, Vegard Benterud* (* employee-elected)
Auditor: Deloitte AS
The state’s ownership interest through the Ministry of Foreign Affairs: 100 %Company website: www.norfund.no
© N
orfund
1 Not including SN Power Invest AS
Norfund

92
Income statement (NOK millions) 2015 2014Operating revenues 544.2 511.7Operating expenses 459.9 473.7Gross operating profit (EBITDA) 85.2 38.7Operating profit (EBIT) 84.3 38.0Net financial items -0.7 4.4Profit/loss before tax 83.6 42.4Tax charge 0.0 0.0Profit/loss after tax 83.6 42.4 Balance sheet 2015 2014Intangible assets 0.0 0.0Fixed assets 3.7 1.2Financial fixed assets 0.1 0.1Total fixed assets 3.8 1.3Current assets 547.8 456.6Total assets 551.6 457.8 Paid-in equity 107.9 107.9Retained earnings/other equity 331.3 247.8Total equity 439.2 355.7Provision for liabilities 0.0 0.0Non-current interest-bearing liabilities 0.0 0.0Current interest-bearing liabilities 0.0 0.0Current interest-free liabilities 112.4 102.1Total debt and liabilities 112.4 102.1Total equity and liabilities 551.6 457.8 Cash flow 2015 2014Operating activities 91.4 46.3Investment activities -4.6 -35.7Financing activities 0.0 0.0Change cash and cash equivalents 86.8 10.7 Key figures 2015 2014Capital employed 439.2 355.7Gross operating margin (EBITDA) 16 % 8 %Operating margin (EBIT) 15 % 7 %Equity ratio 80 % 78 %Return on equity 21 % 13 %Average return on equity last 5 years 12 % –Return on capital employed 23 % 15 % Subsidies from the State/ Public purchases 2015 2014Subsidies from the State/Public purchases 0 0 Additional information 2015 2014Number of employees 68 72Proportion of employees in Norway 73 % 69 %State ownership at year-end 100 % 100 %Proportion of women on the board 60 % 60 %Proportion of women among owner-appointed/shareholder elected board members 57 % 57 %
Norges sjømatråd AS, the Norwegian Seafood Council, aims to increase value creation in the seafood industry through greater demand for and awareness of Nor-wegian seafood abroad. This is achieved through generic marketing and work on market information, market access and preparedness. The Norwegian Seafood Council also seeks to develop new and further exploit established markets and strengthen and cement the reputation of Norwegian seafood.
The Norwegian Seafood Council’s head office is in Tromsø, and the compa-ny has employees in 13 markets. The Min-ister of Fisheries constitutes the compa-ny’s general meeting and chooses the board. It is a statutory requirement that the board should be representative of the fisheries and aquaculture industry.
Important events Norwegian seafood exports reached yet another new record. The export value reached NOK 74.5 billion in 2015, an in-crease of 8%, or NOK 5.8 billion more than in 2014. Exports to the EU reached NOK 50 billion for the first time, after 17% growth in 2015. The EU receives 67% of the total seafood exports and is the Nor-wegian seafood industry’s main market. A favourable exchange rate has affected exports positively in 2015.
In February 2015 the government sent out for consultation a proposal for amend-ments to the Regulations relating to ex-port of fish and fish products (the Fish Export Regulations) and the Regulations relating to coordinated collection of taxes on fish exports. On the basis of the con-sultation, the government decided in May 2015 to differentiate the marketing tax that funds the Norwegian Seafood Coun-cil. The rate for salmon and trout was low-ered from the common rate of 0.75% to 0.6% from 1 January 2016. After new input from stakeholders in the industry and a revised assessment, the government de-
cided on 25 August 2015 to reduce the rate for important pelagic species to 0.6%. The purpose of lowering the tax rate is to reduce the Norwegian Seafood Council’s revenues, which increase in line with the value of exports.
In connection with the aforementioned consultation, the Ministry of Trade, In-dustry and Fisheries amended Regulation no. 157 of 22 March 1991 relating to ex-port of fish and fish products. The amend-ments also pertained to the composition of the board and the process for board elections in the company to bring them into line with the Norwegian state’s prin-ciples for good corporate governance (see the white paper Report no. 27 to the Stort-ing (2013–2014) Diverse and value-creat-ing ownership for a complete description of the state’s ownership policy).
Corporate social responsibility The Norwegian Seafood Council has pub-licly available ethical guidelines that gov-ern its work on corporate social responsi-bility. The company bases its operations on the eight core conventions of the Inter-national Labour Organisation (ILO).
Financial developmentThe activities of the Norwegian Seafood Council are financed by the fisheries and aquaculture industry through the applica-ble marketing tax pursuant to the Fish Export Act of March 1990. In 2015 the marketing tax for most products was 0.75% of the export value. Revenues in the accounts totalled NOK 544 million in 2015, around NOK 33 million higher than the previous year. The increase is attribut-able to the higher value of seafood ex-ports from Norway. Operational invest-ments totalled NOK 431 million. This is an increase of NOK 14 million. The Norwe-gian Seafood Council reported an overall surplus of NOK 84 million in 2015. Total assets were NOK 552 million at the end of the year.
CEO: Terje Ernst Martinussen
Board: Marianne Elisabeth Johnsen (chair), Sverre Søraa (deputy chair), Anne Breiby, Knut Halvard Lerøy, Eva Marie Kristoffersen, Andreas Mikalsen, Solveig Strand, Ove Johansen*, Trude Bessesen*, Marit Stagrum Ottem* (* employee-elected)
Auditor: KPMG AS
The state’s ownership interest through the Ministry of Trade, Industry and Fisheries: 100 %Selskapets nettsider: www.seafood.no • www.godfisk.no
© N
orges sjømatråd A
S
Norges sjømatråd AS

93
Income statement (NOK millions) 2015 2014Operating revenues 366.4 315.0Operating expenses 362.7 307.5Gross operating profit (EBITDA) 32.8 41.3Operating profit (EBIT) 3.8 7.5Net financial items 3.1 2.8Profit/loss before tax 6.9 10.3Tax charge 0.0 0.0Profit/loss after tax 6.9 10.3 Balance sheet 2015 2014Intangible assets 0.2 1.4Fixed assets 75.9 62.3Financial fixed assets 0.5 8.8Total fixed assets 76.6 72.5Current assets 160.3 111.2Total assets 236.9 183.7 Paid-in equity 0.1 0.1Retained earnings/other equity 121.6 114.8Total equity 121.7 114.9Provision for liabilities 25.9 15.3Non-current interest-bearing liabilities 0.0 0.0Current interest-bearing liabilities 0.0 0.0Current interest-free liabilities 89.3 53.5Total debt and liabilities 115.2 68.8Total equity and liabilities 236.9 183.7 Cash flow 2015 2014Operating activities 84.9 52.6Investment activities -41.7 -31.2Financing activities 0.0 0.0Change cash and cash equivalents 43.3 21.4 Key figures 2015 2014Capital employed 121.7 114.9Gross operating margin (EBITDA) 9 % 13 %Operating margin (EBIT) 1 % 2 %Equity ratio 51 % 63 %Return on equity 6 % 9 %Average dividend percentage last 5 years 7 % –Return on capital employed 6 % 10 % Subsidies 2015 2014Ministry of Health and Care Services 120.1 97.5Nasjonal IKT HF 0.7 0.0Total subsidies 120.8 97.5 Additional information 2015 2014Number of employees 172 154Proportion of employees in Norway 100 % 100 %State ownership at year-end 100 % 100 %Proportion of women on the board 57 % 50 %Proportion of women among owner-appointed/shareholder elected board members 60 % 50 %
Norsk Helsenett SF was founded by the Ministry of Health and Care Services in 2009. This state enterprise is responsible for operating and further developing a se-cure, robust and expedient national ICT infrastructure that meets the need for ef-ficient interaction between all of the play-ers in the health and care sector (the Health Network). This includes develop-ment, establishment and operation of a number of national services, like www.helsenorge.no, the Core Record System, Electronic Data Interchange (EDI) and video conferencing.
Norsk Helsenett’s activities are fi-nanced through a membership fee for connection to the Health Network, state grants for operation of national services and various projects. The customer group consists of all the health trusts, munici-palities, general practitioners and other providers in the health and care sector, and a number of different third-party sup-pliers who deliver services to them over the Health Network.
Norsk Helsenett has a total of 172 em-ployees at its head office in Trondheim and the branch offices in Tromsø and Oslo.
Important eventsHaving signed an agreement with Broad-net to build a new high-availability, nation-wide network for the health and care sec-tor, Norsk Helsenett focused on establish-ing the new core network in 2015. In line with the plan, the core network was estab-lished at the end of 2015, and the basis for putting in place an efficient regional infra-structure is now being established in col-laboration with the regional health au-thorities.
Traffic in the health network is increas-ing substantially, and over 169 million electronic messages were exchanged in 2015, an increase of almost 7% compared with the previous year. “Nursing and care messages” is a generic term for messages that also include the municipal sector. It is an important key figure for measuring the developments in messaging in the prima-ry health service, and the number of mes-sages rose from 2.3 million in 2014 to 3.2 million in 2015.
In respect of security, there was a height-ened focus on the intrusion testing service in the sector in 2015. A number of such in-trusion tests were conducted in collabora-tion with stakeholders in the sector, and security holes were identified and closed. At the end of the year, 273 municipalities were registered as members of the national protection programme for the health and care sector, compared with 168 the previ-ous year. The work on information security was further enhanced through HelseC-SIRT (Computer Security Incident Re-sponse Team) being upgraded to Helse-
CERT (Computer Emergency Response Team) from year-end. HelseCERT will be the joint national centre of expertise for computer security in the health care sector and collaborates with the corresponding national and international bodies.
At an extraordinary general meeting in Norsk Helsenett on 19 February 2016, the enterprise was tasked with drawing up a plan with a view to establishing a central service centre for administrative services in the health and care administration. The service centre will be responsible for key functions related to procurements, ICT, and archiving and document management and shall be established through the transfer of tasks and full-time equivalents from the agencies under the Ministry of Health and Care Services. The plan was scheduled to be completed by 1 June 2016, and the work on establishing a central service centre will be completed by 1 January 2018.
Corporate social responsibilityNorsk Helsenett exercises its corporate so-cial responsibility in a number of ways, in-cluding apprenticeships and providing a good training environment. The enterprise has various activities aimed at students, through both teaching at universities and colleges and company visits. Norsk Helsen-ett assumes responsibility by being an In-clusive Working Life company (under the IA scheme) and has a good working rela-tionship with the Norwegian Labour and Welfare Organisation (NAV) locally to adapt workplaces and by offering intern-ships in the company. Norsk Helsenett is also an important specialist resource and contributor to the development of national ICT tasks. The enterprise is working to en-sure operations are as climate neutral and environmentally friendly as possible by having environmentally friendly office premises, using energy-saving virtual products and extensive use of video confer-encing to reduce travel.
Financial developmentNorsk Helsenett is not intended to pro-vide the owner with a financial return. Revenue in 2015 was approx. NOK 366 million, and the result for the year was a surplus of NOK 6.8 million. The compa-ny’s equity situation is satisfactory.
CEO: Håkon Grimstad
Board: Toril Bariusdotter Ressem (chair), Rune Espedal (deputy chair), Herlof Nilssen, Trude Andresen, Mona Elizabeth Svanquist Søndenå, Gunvor Klausen*, Sindre Solem*
(* employee-elected)
Auditor: BDO AS
The state’s ownership interest through the Ministry of Health and Care Services: 100 %Company website: www.nhn.no
© N
orsk Helsenett SF
Norsk Helsenett SF

94
Income statement (NOK millions) 2015 2014Operating revenues 5 593 5 510Operating expenses 5 843 5 530Gross operating profit (EBITDA) 10 239Operating profit (EBIT) -250 -19Net financial items 70 31Profit/loss before tax -180 12Tax charge 3 4Profit/loss after tax -183 8 Balance sheet 2015 2014Intangible assets 122 100Fixed assets 1 578 1 555Financial fixed assets 98 228Total fixed assets 1 798 1 882Current assets 1 343 1 222Total assets 3 142 3 104 Paid-in equity 1 000 1 000Retained earnings/other equity 86 269Total equity 1 086 1 269Provision for liabilities 923 924Non-current interest-bearing liabilities 0 0Current interest-bearing liabilities 113 0Current interest-free liabilities 1 019 911Total debt and liabilities 2 056 1 836Total equity and liabilities 3 142 3 104 Cash flow 2015 2014Operating activities 145 346Investment activities -219 -315Financing activities 113 -80Change cash and cash equivalents 40 -49 Key figures 2015 2014Capital employed 1 199 1 269Gross operating margin (EBITDA) 0 % 4 %Operating margin (EBIT) -4 % 0 %Equity ratio 35 % 41 %Return on equity -16 % 1 %Average dividend percentage last 5 years -1 % –Return on capital employed -14 % 2 % Other key figures 2015 2014Licence fees as percentage of total revenues 97 % 96 %Licence fee per year per household including VAT 2 756 2 729Percentage of the population that uses NRK every day 86 % 87 %Market share NRK TV (all year) 40 % 38 %Market share NRK radio (all year) 65 % 66 % Subsidies from the State 2015 2014Ministry of Culture (Nynorskprisen) 0.3 0.3 Additional information 2015 2014Number of employees 3 485 3 649Proportion of employees in Norway 100 % 100 %State ownership at year-end 100 % 100 %Proportion of women on the board 50 % 50 %Proportion of women among owner-appointed/shareholder elected board members 60 % 60 %
Norsk rikskringkasting AS (NRK) was established in 1933. With its three televi-sion channels, a number of radio stations, the website www.nrk.no and services on other platforms, NRK provides a wide range of media offerings. From 1933 until the early 1980s, NRK was the sole broad-caster in Norway. NRK’s public service re-mit is set out in the company’s articles of association. It rests on three basic pillars: NRK shall support and strengthen democ-racy, NRK shall strengthen the Norwegian language, identity and culture, and NRK shall ensure universal availability. The lat-ter is a prerequisite for succeeding at the first two.
NRK reflects the geographical diversi-ty of Norway and has a good local offering and local presence. The company has twelve district offices that produce news from throughout the country on every platform, in addition to content on nation-al TV and radio broadcasts. NRK is repre-sented at over 50 locations in Norway through its local offices, and has foreign correspondents at ten locations around the world.
Important eventsFollowing negotiations with the unions, NRK has discontinued its defined-benefit pension scheme and switched to a de-fined-contribution plan. This means that in the future the company’s annual pen-sion costs will be predictable and at a rea-sonable level.
In June 2015 the government presented the white paper Report no. 38 to the Stort-ing (2014–2015) Open and informed, on public service broadcasting and media di-versification. The white paper stated that globalisation of the media market means that it is at least as important now as previ-ously to have a public broadcaster to safe-guard Norwegian content, culture and lan-guage. The Storting considered the report on 1 March 2016, and a broad political ma-jority supported the main lines of the gov-ernment’s proposal. At the same time a majority of the Storting asked the govern-ment to propose a new mandate for NRK, measures to ensure that NRK and the li-cence payers are afforded greater predict-ability through management signals every four years, and to present proposals for fu-ture financing by the end of 2016.
In autumn 2015 the government ap-pointed an expert group to examine the various alternatives for public funding of NRK. The group will submit its report on 1 July 2016.
NRK has maintained a strong position in the competition for people’s time and attention. It has high support and legiti-macy among the Norwegian population: 86% of all people over the age of 12 years use one or more of NRK’s services daily. NRK has had a good reputation among the population for a long time: On Ipsos’ annual reputation survey, 80% of the popu-lation stated that they have a very good or fairly good overall impression of NRK. There is also high and stable support for the licence fee: In NRK’s annual profile survey, 70% of the respondents stated that the licence fee is “very good” or “good” value for money.
Corporate social responsibilityAs part of its public service remit NRK shall be a source of new understanding and shared experiences through its pro-gramme offerings. By making its pro-gramme offerings available on the plat-forms where audiences are found, value is also added to the content in the interface with the public.
Financial developmentNRK (the group) reported a result after tax of NOK -183 million in 2015, a decline of NOK 191 million from the previous year. The deficit is due to extraordinary costs of NOK 264 million related to the termination of the defined-benefit pension plan and costs for restructuring and severance pay as a result of the downsizing of the work-force by approx. 160 FTEs since 2014.
Revenues amounted to NOK 5,593 mil-lion, an increase of NOK 83 million or 1.5% from the previous year. Operating expens-es including pensions and restructuring rose by NOK 313 million or 5.7% to NOK 5,843 million. Net financial items were NOK 70 million.
The TV licence fee rose from NOK 2,729 in 2014 to NOK 2,756 in 2015, includ-ing VAT at 8%. The number of licence pay-ers rose by 20,000 from December 2014 to December 2015, reaching 2,020,000 at year-end 2015. NRK’s commercial activi-ties are organised through a wholly-owned subsidiary, NRK Aktivum AS, which made an overall contribution of NOK 85 million to the programme activities in 2015.
Director of Broadcasting: Thor Gjermund Eriksen
Board: Birger Magnus (chair), Gunvor Ulstein (deputy chair), Geir Bergkastet, Ellen Inga Olavs- datter Hætta, Audhild Gregorius-dotter Rotevatn, Lars Oscar Toverud*, May-Britt Bøhn*, Per Ravnaas* (* employee-elected)
Auditor: KPMG AS
The state’s ownership interest through the Ministry of Culture: 100 %Company website: www.nrk.no
© N
orsk rikskringkasting AS
Norsk rikskringkasting AS

95
Income statement (NOK millions) 2015 2014Operating revenues 29 770 26 926Operating expenses 25 343 22 792Gross operating profit (EBITDA) 4 706 4 339Operating profit (EBIT) 4 427 4 134Net financial items 58 81Profit/loss before tax 4 485 4 215Tax charge 0 0Profit/loss after tax 4 485 4 215 Balance sheet 2015 2014Intangible assets 240 317Fixed assets 585 677Financial fixed assets 67 71Total fixed assets 892 1 065Current assets 4 342 3 934Total assets 5 234 4 999 Paid-in equity 0 0Retained earnings/other equity 214 300Total equity 214 300Provision for liabilities 87 67Non-current interest-bearing liabilities 0 0Non-current interest-free liabilities 0 0Current interest-bearing liabilities 0 0Current interest-free liabilities 4 933 4 631Total debt and liabilities 5 020 4 698Total equity and liabilities 5 234 4 999 Cash flow 2015 2014Operating activities 4 670 4 309Investment activities -110 -452Financing activities -4 242 -4 098Change cash and cash equivalents 317 -241 Key figures 2015 2014Capital employed 214 300Gross operating margin (EBITDA) 16 % 16 %Operating margin (EBIT) 15 % 15 %Equity ratio 4 % 6 %Return on equity1 – – Average dividend percentage last 5 years1 – – Return on capital employed1 – – Allocations of proceeds 2015 2014Profits distributed through Tippenøkkelen 3 785 3 450Grassroots share 394 356Profit for health and distribution 231 246Profit for bingo owners’ causes 59 55Measures to combat compulsive gambling 15 12Transferred to/from investment fund 0 0Transferred to/from other equity 0 96Total allocations 4 485 4 215 Additional information 2015 2014Number of employees 406 418Proportion of employees in Norway 100 % 100 %State ownership at year-end 100 % 100 %Proportion of women on the board 50 % 43 %Proportion of women among owner-appointed/shareholder elected board members 50 % 40 %
Norsk Tipping AS was established in 1946 and started operating in 1948. The company has exclusive rights to offer a range of money games in Norway and op-erates pursuant to The Gaming Act. The company shall, in accordance with the rules laid down by the Ministry of Cul-ture, operate gambling in a socially ac-ceptable form under public control, with a view to preventing negative consequenc-es of gambling activities. At the same time, the company shall, through efficient operations, ensure that as much of the proceeds from the games as possible go to socially beneficial causes decided by the owner. The Storting and the govern-ment distribute the surplus, which is shared between sports, culture, and vol-untary / humanitarian organisations.
Norsk Tipping is headquartered in Hamar and has about 400 employees.
Important eventsIn June Norsk Tipping arranged a large exhibition and congress for the regulated lotteries and gaming industry in Europe, the EL Congress “Touch Tomorrow”.
In 2015 Norsk Tipping completed its Datasenter 2020 project, the largest IT up-grade in Norsk Tipping’s history. Over the past five years, Norsk Tipping has sys-tematically modernised its IT infrastruc-ture.
In August the board adopted the strate-gic plan for the period up to 2020. Norsk Tipping’s ambition for the period is to in-spire a new generation and that the compa-ny should be, and be perceived as, even more important for society. The digitisation of games, communication and distribution will be continued in the coming years.
The new game Nabolaget (“the Neigh-bourhood”) was launched in March 2015. This is a game where a random player is selected as the winner of NOK 1 million.
Corporate social responsibilityNorsk Tipping’s corporate social respon-sibility is most clearly apparent in its mis-sion – to provide money games that chan-nel the Norwegian public’s desire for gaming to responsible gaming under po-lice control, that do not create social prob-lems. The company has always been a pio-neer in introducing measures to prevent problem gambling.
In 2014 Norsk Tipping launched a new framework for responsible gaming and in-vested time and resources in implement-ing and further developing this in 2015. The framework is based on the company’s requirements for registered gaming, which means that people who want to play Norsk Tipping’s games must be regis-tered as a customer.
Financial developmentNorsk Tipping’s total operating revenues increased from NOK 26.9 billion in 2014 to NOK 29.8 billion in 2015. As a result of major variations in prizes between the dif-ferent products and a high level of replay of prizes for some of the company’s games, net gaming revenues (gaming rev-enues less prizes) are deemed to be a bet-ter measure of developments in revenue. Net gaming revenues increased from NOK 6.7 billion to NOK 7.2 billion. This is growth of 7.5%. Norsk Tipping’s surplus grew from NOK 4.2 billion in 2014 to NOK 4.5 billion in 2015.
CEO: Torbjørn Almlid
Board: Linda Bernander Silseth (chair), Bjørn Maaseide (deputy chair), David Hansen, Anne Lise Meyer, Bjørn Vidar Mathisen*, Kjersti Langseth*
(* employee-elected)
Auditor: KPMG AS
The state’s ownership interest through the Ministry of Culture: 100 %Company website: www.norsk-tipping.no
© N
orsk Tipping AS
1 Calculated using the definitions on page 125, return on equity and return on capital employed will be over 1,000%.
Norsk Tipping AS

96
Income statement (NOK millions) 2015 2014Operating revenues 65.5 63.0Operating expenses 63.8 51.4Gross operating profit (EBITDA) 2.1 11.9Operating profit (EBIT) 1.7 11.6Net financial items 1.5 1.9Profit/loss before tax 3.2 13.5Tax charge 0.0 0.0Profit/loss after tax 3.2 13.5 Balance sheet 2015 2014Intangible assets 0.0 0.0Fixed assets 0.7 0.8Financial fixed assets 0.3 0.4Total fixed assets 1.0 1.2Current assets 77.8 69.4Total assets 78.8 70.6 Paid-in equity 7.4 7.4Retained earnings/other equity 25.7 22.4Total equity 33.0 29.8Provision for liabilities 12.6 12.3Non-current interest-bearing liabilities 0.0 0.0Current interest-bearing liabilities 0.0 0.0Current interest-free liabilities 33.2 28.5Total debt and liabilities 45.8 40.8Total equity and liabilities 78.8 70.6 Key figures 2015 2014Capital employed 33.0 29.8Gross operating margin (EBITDA) 3 % 19 %Operating margin (EBIT) 3 % 18 %Equity ratio 42 % 42 %Return on equity 10 % 59 %Average dividend percentage last 5 years 31 % –Return on capital employed 10 % 59 % Subsidies from the State 2015 2014Subsidies from the Ministry of Education and Research and other ministries 16.1 15.1Subsidies from the Research- Council of Norway 21.1 17.9Total subsidies 37.2 33.0 Additional information 2015 2014Number of employees 86 78Proportion of employees in Norway 100 % 100 %State ownership at year-end 100 % 100 %Proportion of women on the board 43 % 43 %Proportion of women among owner-appointed/shareholder elected board members 40 % 40 %
NSD – Norsk senter for forsknings-data AS (NSD) was established as a na-tional infrastructure for research in 1971 and has been organised as a limited com-pany since 2003. NSD’s objective is to manage data and provide services to the research sector. The company is engaged in development work within its area in col-laboration with national and international actors. The company’s head office is in Bergen.
Important eventsOn 1 March 2016 NSD changed its name from Norsk samfunnsvitenskapelig data-tjeneste AS (Norwegian Social Science Data Services) to NSD – Norsk senter for forskningsdata AS (Norwegian Centre for Research Data). The reason is that NSD’s services are far more wide-reaching than previously and now cover more disci-plines than the social sciences alone. The new name better reflects the company’s current operations.
In connection with the local and county council elections in autumn 2015, NSD ar-ranged national mock elections in schools, on commission from the Directorate for Education and Training. The school elec-tions in 2015 were the 15th since the pro-ject started in 1989 and had the highest turn-out rate ever.
In the project Remote Access Infra-structure for Data Register (RAIRD) NSD and Statistics Norway are developing a functional online research tool for regis-try data using new technologies for stor-age, processing and analysis of large and complex data collections. The aim is to simplify and increase access to registry data for research purposes, while protect-ing privacy and data security.
With funding from the Research Coun-cil of Norway and in close contact with experts in the UK and USA, NSD is in the start-up phase of a project, Norwegian Open Research Data Infrastructure (NORD-i) to develop a new e-infrastruc-ture for easy transfer of data and metadata and open access with efficient access to and sharing of data. This will be a new ad-vanced e-infrastructure that will provide researchers with even better opportuni-ties to manage, submit and access data in a safe, user-friendly and efficient manner.
NSD is the Norwegian service provid-er for the pan-European research infra-structure CESSDA – Consortium for Eu-
ropean Social Science Data Archives. NSD has been an active participant in this meta-data project, which is the basis for most of the major international develop-ment projects, primarily projects financed through the EU’s framework pro-grammes. NSD is currently participating in two projects with funding from Horizon 2020, one of which (SERISSA) is a project based on the three social science research infrastructures of the ESFRI roadmap. The other project, CESSDA SaW, aims to strengthen and widen the European re-search infrastructure CESSDA.
Corporate social responsibilityNSD shall ensure that data are dissemi-nated and services provided to the re-search sector. Archiving and facilitating reuse of data is thus a key part of NSD’s business as a whole. It is therefore impor-tant for NSD that its services are relevant to the research community and that activi-ties are in line with Norwegian and Euro-pean research policy. This involves a com-mitment to research infrastructure where open sharing of research data is the goal, which has always been an important pre-requisite for NSD’s work and organisation.
NSD works in a long-term perspective to improve opportunities and working con-ditions for people involved in empirical re-search, who are largely dependent on ac-cess to data. This is done by collecting, processing, adapting, archiving and main-taining data and disseminating them to re-search communities while ensuring that the data are available in a form that enables them to be used in research without major legal, financial or practical costs. NSD also provides researchers with services and ad-vice regarding data collection, research design, data analysis, methodology, priva-cy and research ethics.
Financial developmentNSD’s revenue rose by 4% from 2014 to 2015, while the financing structure has re-mained stable. Its main sources of income are the Research Council of Norway, the ministries, the university and university college sector and the EU. In keeping with NSD’s articles of association, NSD does not pay dividends.
CEO: Bjørn Henrichsen
Board: Jens Petter Aasen (chair), Elin Haugsgjerd Allern, Torbjørn Hægeland, Knud Knudsen, Eva Stensland, Ove Dybvik Andersen*, Lis Tenold* (* employee-elected)
Auditor: BDO AS
The state’s ownership interest through the Ministry of Education and Research: 100 %Company website: www.nsd.uib.no
© N
SD – N
orsk senter for forskningsdata AS
NSD – Norsk senter for forskningsdata AS

97
Income statement (NOK millions) 2015 Operating expenses 46.6Gross operating profit (EBITDA) -46.6Operating profit (EBIT) -46.6Net financial items 0.3Profit/loss before tax -46.9Tax charge 0.0Profit/loss after tax -46.9 Balance sheet 2015 Intangible assets 0.0Fixed assets 0.0Financial fixed assets 0.0Total fixed assets 0.0Current assets 691.4Total assets 691.4 Paid-in equity 657.5Retained earnings/other equity -46.9Total equity 610.6Provision for liabilities 0.0Non-current interest-bearing liabilities 0.0Current interest-bearing liabilities 57.0Current interest-free liabilities 23.8Total debt and liabilities 80.8Total equity and liabilities 691.4 Cash flow 2015 Operating activities -46.9Investment activities 0.0Financing activities 0.0Change cash and cash equivalents -46.9 Key figures 2015 Capital employed 667.6Gross operating margin (EBITDA) –Operating margin (EBIT) –Equity ratio 88 % Additional information 2015 Number of employees 3Proportion of employees in Norway 100 %State ownership at year-end 100 %Proportion of women on the board 40 %Proportion of women among owner- appointed/shareholder elected board members 40 %
Nye Veier AS was established on 4 May 2015, after which the Board made the nec-essary preparations for the company to be able to be in ordinary operation from 1 January 2016. The company has been tasked with undertaking the planning, construction, operation and maintenance of stretches of national highways that are covered by the company’s portfolio and which the company, pursuant to an agree-ment with the Ministry of Transport and Communications, has assumed responsi-bility for and operating associated activi-ties. The purpose of state ownership of Nye Veier is to achieve a more cohesive and cost-efficient development of safe na-tional highways, thus creating added val-ue compared with a traditional approach to road construction. The development of the stretches in the company’s portfolio will be prioritised according to their eco-nomic profitability.
Nye Veier is aiming to ensure the com-pany is a lean, efficient contracting organ-isation. The company will build over 500 km of highway with a revenue of about NOK 130 billion over the next 20 years. Nye Veier’s start-up portfolio comprises the following four areas: E6 Trøndelag, E6 Mjøs region, E18 south-east Norway and E39 south-west Norway. The compa-ny’s head office is in Kristiansand.
Important eventsThe framework for Nye Veier’s operations was presented to the Storting in the white paper Report no. 25 to the Storting (2014–2015) On the right road – Reforms in the road sector. The white paper provided an overview of the company’s tasks and start-up portfolio, as well as models for fi-nancing and governance. In Proposition no. 1 to the Storting (2015–2016) it was proposed that in 2016 the Ministry of Transport and Communications would be
able to bind the state to future budget commitments and sign contracts with Nye Veier. Proposition no. 1 to the Storting, Supplement no. 2 (2015–2016) contained a proposal to increase the share capital in Nye Veier in connection with the company becoming operational. The capital in-crease was approved at an extraordinary general meeting on 18 December 2015. The company had equity of NOK 611 mil-lion at the end of 2015.
In autumn 2015 a CEO and manage-ment group were recruited for the com-pany. Nye Veier will have its first develop-ment contracts in the tendering phase in 2016.
Corporate social responsibilityNye Veier benefits society through the sound construction of safe roads. This means that the company focuses on cor-porate social responsibility in general and occupational health and safety in particu-lar. Nye Veier aims to be a socially respon-sible client and has established guidelines for ethics and corporate social responsi-bility for use internally and in relation to the company’s subcontractors. The com-pany’s ambition is to help raise profes-sionalism in the industry. The company bases its operations on the core conven-tions of the International Labour Organi-sation (ILO).
Financial developmentIn 2015 Nye Veier had start-up costs, but no revenues. The company’s result for 2015 was a deficit of NOK -46.9 million. The company’s total assets amounted to NOK 691 million at the end of 2015 (in-cluding the approved but not recorded capital increase of NOK 657 million). Of the total assets, 88% is equity and 8% is a short-term loan from the owner. The com-pany does not pay dividends to the owner.
CEO: Ingrid Dahl Hovland
Board: Rolf Gunnar Roverud (chair), Dag Morten Dalen, Eli Giske, Siri Beate Hatlen, Harald Vaagaasar Nikolaisen
Auditor: EY AS
The state’s ownership interest through the Ministry of Transport and Communications: 100 %Company website: www.nyeveier.no
© Tress D
esign/Anders M
artinsen
Nye Veier AS

98
Income statement (NOK millions) 2015 2014Operating revenues 285.7 292.5Operating expenses 283.0 301.5Gross operating profit (EBITDA) 4.7 -6.3Operating profit (EBIT) 2.7 -9.0Net financial items 1.8 3.1Profit/loss before tax 4.5 -5.9Tax charge 0.0 0.0Profit/loss after tax 4.5 -6.0 Balance sheet 2015 2014Intangible assets 0.0 0.0Fixed assets 4.9 3.4Financial fixed assets 0.0 0.0Total fixed assets 4.9 3.4Current assets 211.8 191.3Total assets 216.6 194.8 Paid-in equity 10.0 10.0Retained earnings/other equity 13.4 8.9Total equity 23.4 18.9Provision for liabilities 135.3 116.4Non-current interest-bearing liabilities 0.0 0.0Current interest-bearing liabilities 0.0 0.0Current interest-free liabilities 58.0 59.5Total debt and liabilities 193.2 175.9Total equity and liabilities 216.6 194.8 Cash flow 2015 2014Operating activities 24.1 3.2Investment activities -3.4 -2.8Financing activities 0.0 0.0Change cash and cash equivalents 20.7 0.5 Key figures 2015 2014Capital employed 23.4 18.9Gross operating margin (EBITDA) 2 % -2 %Operating margin (EBIT) 1 % -3 %Equity ratio 11 % 10 %Return on equity 21 % -27 %Average return on equity last 5 years -12 % –Return on capital employed 24 % -25 % Subsidies from the State/ Public purchases 2015 2014Subsidies from the State/Public purchases 284.6 288.8 Additional information 2015 2014Number of employees 64 67Proportion of employees in Norway 100 % 100 %State ownership at year-end 100 % 100 %Proportion of women on the board 57 % 43 %Proportion of women among owner-appointed/shareholder elected board members 60 % 40 %
Petoro AS manages the commercial as-pects of the State’s Direct Financial Inter-est (SDFI) in the petroleum sector on the Norwegian continental shelf and other as-sociated operations on behalf of the state. The company was formed in 2001 as part of the restructuring of the state’s oil and gas operations. Petoro’s activities are gov-erned by chapter 11 of the Petroleum Act. The overall objective for the management of the SDFI portfolio is to achieve the high-est possible income for the state.
The SDFI scheme was established with effect from 1985. Under this scheme, the state participates as a direct investor in petroleum operations on the Norwegian continental shelf. Petoro is the licensee for the state’s interests in production li-cences, fields, pipelines and onshore fa-cilities. Petoro is responsible for manag-ing the SDFI portfolio on commercial terms. At the end of 2015 the portfolio consisted of 34 producing fields, 174 pro-duction licences and 15 joint ventures for pipelines and terminals. Petoro is not an operator.
Petoro is not responsible for selling the oil and gas managed by the company and is thus not a player in the oil and gas mar-kets. Responsibility for marketing and sale of the state’s petroleum has been as-signed to Statoil under a special instruc-tion – the sales and marketing instruction. The cash flow generated by selling SDFI petroleum goes directly from Statoil to the Treasury. Petoro is responsible for monitoring Statoil’s marketing and sale of the petroleum produced from the state’s direct participatory interests, pursuant to the marketing and sale instruction. Both Statoil and Petoro have an independent and joint responsibility for ensuring that the state’s coordinated ownership strate-gy is implemented in line with its inten-tions. In view of the large assets under management, it is important that Petoro exercises sound financial management and accounting of the SDFI portfolio.
Important eventsNet cash flow from SDFI to the state was NOK 93.6 billion in 2015 (against NOK
111.1 billion the previous year). The de-crease in profit was mainly due to lower oil prices. Total revenues amounted to NOK 158 billion in 2015, and expenses ex-cluding impairments were NOK 75.7 bil-lion.
Total production was 1,068 million bar-rels of oil equivalent per day, which is 7% higher than in 2014 due to improved regu-larity and completion of wells. The oil fields Troll, Åsgard, Oseberg, Heidrun, Snorre and Gullfaks accounted for ap-prox. 60% of the total liquids production. Around 70% of the gas production came from the fields Troll, Ormen Lange and Åsgard. The net cash flow from the SDFI portfolio is transferred directly to the State Pension Fund Global and consti-tutes a large part of the state’s revenues from the petroleum sector.
Corporate social responsibilityPetoro has publicly available ethical guidelines and guidelines for its work on corporate social responsibility. The com-pany bases its operations and reporting on corporate social responsibility on the relevant parts of the Global Reporting Ini-tiative and the eight core conventions of the International Labour Organisation (ILO). In addition, the company follows other, more specific company and indus-try-oriented guidelines in its reporting.
Financial developmentPetoro’s operations are based on grants from the state. Separate accounts are kept for Petoro’s operations in accordance with the rules laid down in the Norwegian ac-counting and company legislation. A clear distinction is drawn between financial as-pects relating to the SDFI and the opera-tion of Petoro. Allocations relating to the SDFI are voted on by the Storting on an annual basis. Expenses and income relat-ing to the SDFI are channelled via the na-tional budget. Separate accounts are kept for the SDFI, both on the cash basis in ac-cordance with the Appropriation Regula-tions and the Regulations on Financial Management in Central Government and pursuant to the accruals principle.
CEO: Grethe Moen
Board: Gunn Wærsted (chair), Hilde Myrberg (deputy chair), Per-Olaf Hustad, Per Arvid Schøyen, Trude Haugen Fjeldstad, Marit Ersdal*, Lars Kristian Bjørheim* (* employee-elected)
Auditor: Erga Revisjon AS
The state’s ownership interest through the Ministry of Petroleum and Energy: 100 %Company website: www.petoro.no
© H
arald Pettersen/Statoil ASA
Petoro AS

99
Income statement (NOK millions) 2015 2014Operating revenues 107.5 99.2Operating expenses 99.2 93.3Gross operating profit (EBITDA) 13.3 8.1Operating profit (EBIT) 8.3 5.9Net financial items -1.3 -0.1Profit/loss before tax 7.0 5.8Tax charge 0.0 0.0Profit/loss after tax 7.0 5.8 Balance sheet 2015 2014Intangible assets 0.0 0.0Fixed assets 80.1 50.2Financial fixed assets 3.3 3.3Total fixed assets 83.4 53.5Current assets 33.7 20.2Total assets 117.1 73.7 Paid-in equity 3.4 3.4Retained earnings/other equity 47.4 40.4Total equity 50.8 43.8Provision for liabilities 2.3 2.9Non-current interest-bearing liabilities 40.2 9.3Current interest-bearing liabilities 0.0 0.0Current interest-free liabilities 23.8 17.7Total debt and liabilities 66.3 29.9Total equity and liabilities 117.1 73.7 Cash flow 2015 2014Operating activities 16.9 8.8Investment activities -35.0 -1.5Financing activities 30.9 -0.5Change cash and cash equivalents 12.8 6.8 Key figures 2015 2014Capital employed 91.0 53.1Gross operating margin (EBITDA) 12 % 8 %Operating margin (EBIT) 8 % 6 %Equity ratio 43 % 59 %Return on equity 15 % 14 %Average return on equity last 3 years 10 % –Return on capital employed 13 % 13 % Other key figures 2015 2014Total number of performances 577 629Tickets sold 68 791 84 393Ticket sales 12 11 Subsidies 2015 2014Ministry of Culture 58.9 54.3Rogaland County Council and Stavanger municipality 27.1 25.3Sum tilskudd 86.0 79.6 Additional information 2015 2014Number of employees 120 126Proportion of employees in Norway 100 % 100 %State ownership at year-end 66.67 % 66.67 %Proportion of women on the board 71 % 71 %Proportion of women among owner-appointed/shareholder elected board members 60 % 60 %
Rogaland Teater AS’s main activity is to present theatre of high artistic quality to the inhabitants of the region. The compa-ny in its present form was established in 1947, but the theatre has existed in the same premises since it was first estab-lished in Stavanger in 1883. The children’s and youth theatre, where children per-form for children in a professional setting, is an integrated and important part of the theatre’s activities. The theatre has four stages in central Stavanger, and mounts productions on its own stages and through collaboration projects.
Important eventsThe programme for 2015 consisted of 11 new own productions, of which one was a première in Norway and three were world premières, one take-away production, and two productions with StatsTeatret and the Danish Mungo Park in collaboration with Tou Scene.
Rogaland Teater had a small decrease in the number of new own productions in 2015 compared with the previous year due to work on a new stage rig, entailing closure of the main stage for six months, plus the first rehearsals for the repertory theatre. 2015 was also marked by fewer joint productions than in previous years. This led to a decline in the overall number of visitors, but an increase in tickets sold for own productions. In 2015 the theatre had 6,591 more tickets redeemed for own productions than the previous year, an in-crease of 9.5%.
Work on a new stage rig started in March 2015. This meant that the main stage and the blackbox studio Intim-scenen were closed and Teaterhallen was used as the main stage. From being the only institutional theatre in Norway with a manual fly system, the theatre reopened the main stage in October with a new mo-torised, computer-controlled stage rig. The upgrade cost NOK 39.7 million, which was the original budget.
In connection with the board’s exten-
sion of the theatre director’s fixed-term contract, it was decided that Rogaland Teater should evaluate switching from en-suite production programming to reperto-ry programming. The purpose of this change is better use of resources and greater diversity in its programming, which will increase audience numbers. The project is expected to deliver a recom-mendation for voting at the start of 2017.
In early 2015 Rogaland Teater submit-ted consultative input to the municipal area plan for Stavanger, in which the thea-tre called for more detailed analysis of the two different site options (Bekhuskaien and Stavanger station). The theatre re-ceived funds via the national budget to implement a “choice of solution” study for the project. This work will continue in 2016.
Corporate social responsibilityRogaland Teater has ethical guidelines in-corporated into its personnel policy. These regulate issues such as supplier and cus-tomer relations, entertainment and gifts, whistle-blowing, etc. The theatre works systematically to reduce risks and provide a good, safe working environment and to ensure the building is accessible to all, de-spite its structural limitations. The thea-tre’s operations do not pollute the envi-ronment.
Financial developmentFor Rogaland Teater 2015 was a year of multiple prizes and awards, additional al-locations, switching to modern fly tech-nology, solid earnings, good audience numbers and not least a broad artistic pro-gramme. Revenues totalled NOK 108 mil-lion in 2015, compared with NOK 99.2 mil-lion the previous year, of which NOK 21.5 million (NOK 19.6 million) was own earn-ings. Operating costs totalled NOK 99.2 million (NOK 93.3 million). The result for 2015 was a surplus of NOK 6.9 million, and liquidity was satisfactory throughout the year.
Theatre director: Arne Nøst
Board: Brit Kristin Sæbø Rugland (chair), Agnes Inderhaug (deputy chair), Ardashir Esfandiari, Tone Brandtzæg, Odd Jo Forsell, Grete Larssen*, Mette Arnstad* (* employee-elected)
Auditor: EY AS
The state’s ownership interest through the Ministry of Culture: 66.67 %Company website: www.rogaland-teater.no
© Rogaland Teater A
S/Håvard D
irdal
Rogaland Teater AS
100
Income statement (NOK millions) 2015 2014Operating revenues 190.8 148.5Operating expenses 173.4 149.3Gross operating profit (EBITDA) 19.3 1.1Operating profit (EBIT) 17.4 -0.8Net financial items 0.2 0.4Profit/loss before tax and minority 17.6 -0.4Tax charge 1.4 0.1Minority interests -0.1 1.6Profit/loss after tax and minority 16.1 1.1 Balance sheet 2015 2014Intangible assets 0.0 0.0Fixed assets 6.2 6.9Financial fixed assets 12.9 9.0Total fixed assets 19.1 15.9Current assets 67.9 47.2Total assets 87.0 63.1 Paid-in equity 1.2 1.2Retained earnings/other equity 45.7 29.5Minority interests 1.9 1.8Total equity 48.8 32.5Provision for liabilities 0.1 0.1Non-current interest-bearing liabilities 3.8 4.2Current interest-bearing liabilities 0.0 0.0Current interest-free liabilities 34.3 26.3Total debt and liabilities 38.2 30.6Total equity and liabilities 87.0 63.1 Cash flow 2015 2014Operating activities 23.1 -9.4Investment activities -5.0 -2.9Financing activities -0.4 -0.3Foreign currency effects 0 0Change cash and cash equivalents 17.7 -12.6 Key figures 2015 2014Capital employed 52.6 36.7Gross operating margin (EBITDA) 10 % 1 %Operating margin (EBIT) 9 % -1 %Equity ratio 56 % 52 %Return on equity 41 % 4 %Average dividend percentage last 5 years 26 % –Return on capital employed 40 % 0 % Publications 2015 2014Books and doctoral theses 11 14Articles in refereed journals 97 86Peer-reviewed articles 95 68Number of post-graduate fellowships 34 34Number of post-doctoral fellows 20 21 Subsidies from the State 2015 2014Research grants 58 52 Additional information 2015 2014Number of employees 144 140Proportion of employees in Norway 97 % 99 %State ownership at year-end 100 % 100 %Proportion of women on the board 60 % 55 %Proportion of women among owner-appointed/shareholder elected board members 63 % 71 %
Simula Research Laboratory AS (Sim-ula) was established in 2001 and conducts basic research in selected areas within the field of software engineering and com-munications technology, thereby contrib-uting to innovation in trade and industry. Simula educates computer scientists in collaboration with degree-conferring in-stitutions, primarily the University of Oslo. The company combines academic traditions with business management models.
The company has the following sub-sidiaries: Simula Innovation AS, and Simu-la School of Research and Innovation AS. Simula Innovation is wholly owned, while Simula School of Research and Innovation is jointly owned by Simula (56%), Statoil (21%), Bærum municipality (14%), Tel-enor (7%), Norsk Regnesentral (1%) and Pfizer (1%). The parent company and sub-sidiaries collaborate closely and are locat-ed in the municipality of Bærum. Simula also has ownership stakes in several com-panies, most of which are spin-offs origi-nating in activities at the centre.
Simula hosts a centre of excellence, the Centre of Biomedical Computing, as well as a Centre for Research-based Innova-tion, the Certus Centre. Simula is also a research partner in the Centre of Cardio-logical Innovation, a centre for research-based innovation at Oslo University Hos-pital.
Important eventsSimula has collaborated with the Univer-sity of California, San Diego for several years, and in 2015 a joint PhD programme was established, focusing on computa-
tional science applications for biomedi-cine.
In the past year Simula has formalised its partnership with the University of Ber-gen and has established the limited com-pany Forskningssenteret for informas-jons- og kommunikasjonssikkerhet AS (Simula@UiB). From 2016 Simula@UiB is receiving operating funding from the Min-istry of Transport and Communications.
There was good influx of new projects in 2015 too, and Simula did particularly well in the Research Council of Norway’s FRINATEK programme.
Corporate social responsibilitySimula works to maintain and develop a high level of awareness with regard to di-versity, gender balance and the working environment in general. Simula has an in-ternational research community, and more than half of the employees come from outside Norway, representing over 29 different nations. Simula will follow up the good results achieved from previous work for a more equal gender balance and has a goal that by 2017 at least 30% of the academic staff are women.
Financial developmentSimula’s revenues increased from NOK 149 million in 2014 to NOK 191 million in 2015. Revenues have increased by 28.5%, while expenses have increased by 16.1%, resulting in a substantial improvement in the operating profit for 2015 compared with 2014. The group’s operating profit has gone from a deficit of NOK -0.8 mil-lion in 2014 to a profit of NOK 17.4 million in 2015.
CEO: Aslak Tveito
Board: Ingvild Myhre (chair), Mats Lundqvist, Pinar Heggernes, Ingolf Søreide, Annik Myhre, Yngvild Wasteson, Silvija Seres, Sverre Gotaas, Özgü Alay*, Ernst Gunnar Gran* (* employee-elected)
Auditor: Lundes Revisjonskontor DA
The state’s ownership interest through the Ministry of Education and Research: 100 %Company website: www.simula.no
© Birgitte H
eneide
Simula Research Laboratory AS

101
Income statement (NOK millions) 2015 2014Tilskudd 158 135Other operating revenues 229 224Total operating revenues 387 359Operating expenses 306 315Gross operating profit (EBITDA) 140 113Operating profit (EBIT) 81 43Net financial items 22 78Profit/loss before tax and minority 102 121Tax charge 13 12Minority interests 1 -2Profit/loss after tax and minority 89 111 Balance sheet 2015 2014Intangible assets 66 42Fixed assets 1 515 1 293Financial fixed assets 950 884Total fixed assets 2 530 2 220Current assets 492 963Total assets 3 021 3 183 Paid-in equity 786 1 177Retained earnings/other equity 195 98Minority interests 37 29Total equity 1 018 1 304Sum statslån 700 700Provision for liabilities 76 78Non-current interest-bearing liabilities 1 041 878Non-current interest-free liabilities 0 22Current interest-bearing liabilities 186 0Current interest-free liabilities 0 201Total debt and liabilities 1 303 1 179Total equity. statslån og gjeld 3 021 3 183 Cash flow 2015 2014Operating activities 47 43Investment activities -81 7Financing activities -441 73Change cash and cash equivalents -475 124 Key figures 2015 2014Capital employed 2 945 2 881Gross operating margin (EBITDA) 36 % 32 %Operating margin (EBIT) 21 % 12 %Equity ratio 34 % 41 %Return on equity 8 % 9 %Average dividend percentage last 5 years 1 % –Return on capital employed 6 % 7 % State loan limit 700 700State loans 700 700Interest on state loans 20 22Commission on state loans 7.0 7.0 Subsidies from the State 2015 2014Ministry of Local Government and Modernisation 86 92Ministry of Trade, Industry and Fisheries 70 55Total subsidies 156 147 Assets in and out of the company 2015 2014Capital contributions from the State 0 0Capital reducition for repayment to the State -391 0 Additional information 2015 2014Number of employees 41 53Proportion of employees in Norway 100 % 98 %State ownership at year-end 100 % 100 %Proportion of women on the board 63 % 50 %Proportion of women among owner-appointed/shareholder elected board members 57 % 43 %
Siva – Selskapet for Industrivekst SF (Siva) was established in 1968 and is part of the Norwegian innovation policy sys-tem. Siva is a national instrument for facili-tating ownership and development of com-panies, business clusters and knowledge environments throughout the country, with a particular responsibility for promot-ing growth in outlying regions. The main objective is to trigger profitable business development in companies and regional business and knowledge environments. The company has two secondary objec-tives: 1) Through its property investments Siva shall lower barriers to entry where market mechanisms make this especially difficult, including for major industrial property projects; and 2) Siva’s innovation activities shall facilitate the establishment and development of enterprises in busi-ness and knowledge environments and link these together in regional, national and international networks. Innovation ac-tivities are funded by grants allocated via the national budget. Siva’s property opera-tions are self-financing and are subject to financial return requirements.
Siva’s head office is in Trondheim, and at the end of 2015 the company had 41 em-ployees.
Important eventsIn April 2015 Espen Susegg was appoint-ed as CEO of Siva. During the year, the company implemented a comprehensive cost-saving and rationalisation process that enabled it to meet the owner’s re-quirements. As part of this process, the company closed its branch in Oslo, termi-nated operations in Russia and reorgan-ised its operations into fewer divisions with fewer managers.
In 2015 and early 2016 Siva revised its strategy, focusing on the three main are-as: 1) Industrial development and test are-nas for future-oriented industries; 2) Strong regional networking arenas for the commercialisation of research and new ideas from industry; 3) Relevant and flex-ible instruments with sufficient financial leeway. The revised strategy indicates that Siva wants to have a clearer role in restructuring trade and industry in Nor-way. The company prioritises interaction
with the other innovation policy agencies, with a main focus on Innovation Norway and the Research Council of Norway.
Corporate social responsibilitySiva has published its internal ethical guidelines on its website and is opposed to all forms of corruption. It works active-ly to prevent corruption in accordance with Norwegian law and international treaties. Human rights norms are defined in international human rights treaties, which Norway has adopted and which therefore apply to Siva. They include the UN Declaration of Human Rights, stand-ards from the International Labour Or-ganisation (ILO), principles of the UN Global Compact and the OECD Guide-lines for Multinational Enterprises.
Financial developmentThe recorded subsidy for 2015 was NOK 158 million, compared with NOK 135 mil-lion the previous year. Innovation activi-ties are balanced by the total expenses related to this activity corresponding to the subsidy. Rental income from property operations amounted to NOK 196 million (NOK 191 million). Rental income is af-fected by certain tenants’ operations and ability to pay, and Siva has lost rental in-come from premises for the solar panel industry in particular. At the end of 2015 83% of the company's property portfolio was hired out (87%).
The operating profit for the group was NOK 81 million in 2015 (NOK 43 million). The profit for the year was NOK 89 mil-lion (NOK 109 million). The main reason for the fall in profit is lower income from associated companies. In 2015 Siva con-ducted a capital decrease of NOK 391 mil-lion for repayment to the owner of the dividends received from its involvement in Koksa Eiendom AS. Total assets were NOK 3,022 million (NOK 3,183 million) at year-end. The group’s equity ratio at the end of 2015 was 34% (41%). In addition to equity, Siva has a borrowing facility with the Treasury. At the end of 2015 the bal-ance on these loans was NOK 700 million, unchanged from the previous year. No re-search and development activities were expensed or capitalised in 2015.
CEO: Espen Susegg
Board: Kristin Reitan Husebø (chair), Peter Arbo (deputy chair), Sverre Narvesen, Kari Riddervold, Helene Jebsen Anker, Mette Kamsvåg, Bjørn Østbø, Randi Torvik* (* employee-elected)
Auditor: Deloitte AS
The state’s ownership interest through the Ministry of Trade, Industry and Fisheries: 100 %Company website: www.siva.no
© Kjell O
scar Petersen
Siva – Selskapet for Industrivekst SF

102
© Space N
orway A
S
Income statement (NOK millions) 2015 2014Operating revenues 46.0 32.2Operating expenses 62.6 37.9Gross operating profit (EBITDA) -4.6 6.0Operating profit (EBIT) -16.6 -5.7Net financial items 71.7 48.3Profit/loss before tax 55.1 42.6Tax charge -6.0 -3.9Profit/loss after tax 61.1 46.5 Balance sheet 2015 2014Intangible assets 12.4 6.4Fixed assets 155.3 166.4Financial fixed assets 321.6 239.8Total fixed assets 489.3 412.6Current assets 175.4 167.6Total assets 664.7 580.2 Paid-in equity 2.6 2.6Retained earnings/other equity 403.5 312.4Total equity 406.1 315.0Provision for liabilities 0.0 0.0Non-current interest-bearing liabilities 190.0 199.8Current interest-bearing liabilities 68.6 65.4Current interest-free liabilities 0.0 0.0Total debt and liabilities 258.6 265.2Total equity and liabilities 664.7 580.2 Cash flow 2015 2014Operating activities 55.0 15.0Investment activities -52.7 -17.0Financing activities 0.0 2.0Change cash and cash equivalents 2.3 0.0 Key figures 2015 2014Capital employed 664.7 580.2Gross operating margin (EBITDA) -10 % 19 %Operating margin (EBIT) -36 % -18 %Equity ratio 61 % 54 %Return on equity 17 % 24 %Average dividend percentage last 5 years 20 % –Return on capital employed 11 % 17 % Additional information 2015 2014Number of employees 14 12Proportion of employees in Norway 100 % 100 %State ownership at year-end 100 % 100 %Proportion of women on the board 50 % 50 %Proportion of women among owner-appointed/shareholder elected board members 50 % 50 %
Space Norway AS (previously Norsk Rom- senter Eiendom AS) is a sectoral policy tool to procure space-related infrastructure for Norwegian needs and to trigger business development linked to Norwegian space-re-lated activities. Space Norway was estab-lished in 1995 when it was spun off from the Norwegian Space Centre, and the company is operated in accordance with ordinary business principles. The company has been a state-owned limited company since the Norwegian Space Centre was converted into an administrative body. The state’s own-ership of Space Norway was managed by the Norwegian Space Centre until 2013; then in 2014 responsibility was transferred to the Ministry of Trade, Industry and Fish-eries. The group’s head office is in Oslo.
The company owns and manages the fiber optic cable between Svalbard and mainland Norway. The line communi-cates data read by satellites in space to antennas on Svalbard, but has also be-come the “lifeline” for communication with the community in Svalbard. The company also sublets a transponder on Telenor’s Thor 7 satellite for communica-tion with the Norwegian Troll research station in Antarctica. In line with its pur-pose, the company is continuing to identi-fy, investigate and develop new space-re-lated projects based in Norway, alone or in collaboration with others.
Space Norway owns 50% of the shares in Kongsberg Satellite Services AS (KSAT), which operates ground stations that communicate with satellites. The company is the largest of its kind in the world and has enjoyed good growth in the international market. Space Norway also owns 100% of the shares in Statsat AS, which is a tool for the development and operation of small satellites for state pur-poses.
Important events2015 was dominated by the building up of the group and development of new pro-jects. A major review was conducted of the fiber optic cable communications with Svalbard, with the aim of improving relia-bility. Space Norway has also worked on developing a possible future communica-tions solution for northern areas and on test measurements for the European Space Agency ESA.
In May 2015 Statsat assumed responsi-bility for operation of the Norwegian AIS satellites for the Norwegian Coastal Ad-ministration.
Communications with the Troll station via Thor 7 became operational on 1 Au-gust 2015.
Corporate social responsibility The company has adopted principles for ethics and corporate social responsibility, including work on responsible procure-ments and the relationship with suppliers. The company’s operations are intended to build competence and resolve tasks that are important to Norwegian society in a long-term perspective.
Financial developmentIn 2015 the group had revenues of NOK 46 million and a profit before tax of NOK 55.1 million. This is an increase of 29% from the previous year, which is mainly due to higher dividends from its stake in KSAT. In light of the company’s risk in connection with disruptions linked to the company’s assets, the company needs to build up stronger equity and adequate li-quidity. For this reason, no dividends are being paid for the 2015 financial year.
CEO: Jostein Rønneberg
Board: Asbjørn Birkeland (chair), Øyvind Stene, Ingvild Ragna Myhre, Vendela Maria Paxal
Auditor: KPMG AS
The state’s ownership interest through the Ministry of Trade, Industry and Fisheries: 100 %Company website: www.spacenorway.no
Space Norway AS
103
Income statement (NOK millions) 2015 2014Operating revenues 5 906 5 563Operating expenses 4 192 4 185Gross operating profit (EBITDA) 3 340 2 528Operating profit (EBIT) 1 714 1 378Share of profits in associates and joint ventures 8 11Net financial items -312 -269Profit/loss before tax 1 410 1 120Tax charge 307 291Profit/loss after tax 1 103 829 Balance sheet 2015 2014Intangible assets 336 280 Fixed assets 36 768 32 562 Financial fixed assets 5 303 3 429 Total fixed assets 42 407 36 271Current assets 3 140 4 836 Total assets 45 547 41 107 Paid-in equity 5 950 5 950 Claim for approved, not- recorded contributed capital 0 0Retained earnings/other equity 7 614 6 601 Minority interests 41 78Total equity 13 605 12 629Provision for liabilities 1 969 2 036 Non-current interest-bearing liabilities 24 266 22 138 Current interest-bearing liabilities 4 023 2 505 Current interest-free liabilities 1 684 1 799 Total debt and liabilities 31 942 28 478Total equity and liabilities 45 547 41 107 Cash flow 2015 2014Operating activities 2 260 3 028Investment activities -5 777 -5 997Financing activities 2 194 5 018Change cash and cash equivalents -1 323 2 049 Key figures 2015 2014Capital employed 41 894 37 272Gross operating margin (EBITDA) 57 % 45 %Operating margin (EBIT) 29 % 25 %Equity ratio 30 % 31 %Return on equity 8 % 7 %Average dividend percentage last 5 years 8 % –Return on capital employed 6 % 5 % Dividends 2015 2014Dividend for the financial year 357 321Dividend percentage 32 % 39 %Average dividend percentage last 5 years 24 % –Dividend to the state 357 321 Additional information 2015 2014Number of employees 1 214 1 121Proportion of employees in Norway 100 % 100 %State ownership at year-end 100 % 100 %Proportion of women on the board 44 % 44 %Proportion of women among owner-appointed/shareholder elected board members 50 % 50 %
Statnett SF was established in 1992 and is the transmission system operator in Nor-way. Statnett is responsible for maintaining the balance between production and con-sumption of electricity at all times, includ-ing measures for handling critical energy situations. Furthermore Statnett is respon-sible for ensuring the rational operation and development of the central grid in ac-cordance with socio-economic criteria. Statnett shall otherwise follow commercial principles.
Statnett owns approx. 90% of the trans-mission grid in Norway and the power connections abroad and 28.2% of the phys-ical power exchange Nord Pool Spot AS. Statnett is a monopoly enterprise subject to regulation by the energy authorities. This entails that the Norwegian Water Re-sources and Energy Directorate, which stipulates income limits for all the grid companies, sets an annual maximum al-lowed income for the enterprise. Statnett’s head office is in Oslo.
Important eventsAccording to the enterprise’s grid develop-ment plan Statnett expects to invest NOK 50–70 billion in the period 2015–2025. Grid investments are needed to strengthen se-curity of supply in some parts of the coun-try and to enable new consumption, new renewable power production and increased cross border power exchange. In addition, large parts of the grid are quite old, and some parts are near the end of their techni-cal lifetime.
In 2015 several major projects were un-der construction, including Ofoten–Bals-fjord, Ørskog–Sogndal and voltage up-grades in the area between Sauda and Kristiansand (the western corridor).
Parts of the Lofoten ring were acquired by Statnett and incorporated into the cen-tral grid.
The board made a final investment de-cision on two new interconnections, one to Germany and one to the UK.
Corporate social responsibilityStatnett has publicly available ethical guidelines and guidelines for its work on corporate social responsibility. The com-pany reports on corporate social responsi-bility in accordance with the Global Re-porting Initiative framework at application level B. Statnett adheres to the relevant parts of the OECD guidelines for multina-tional companies and bases its operations on the eight core conventions of the Inter-national Labour Organisation (ILO). In addition, Statnett follows other, more spe-cific company and industry-oriented guidelines in its reporting.
Statnett’s activity affects users of the power grid and a broad range of actors in society. In 2015 public meetings were held to identify needs and gather suggestions for Statnett’s grid development plan, one of the enterprise’s key planning docu-ments. For the first time, the draft grid development plan was circulated for pub-lic consultation, before the final version was published on 1 October 2015.
Financial developmentStatnett’s operating revenues in 2015 were NOK 5,906 million (NOK 5,563 mil-lion the preceding year). The group’s op-erating costs totalled NOK 4,192 million (NOK 4,185 million), and the operating profit was NOK 1,714 million (NOK 1,378 million). Profit after tax was NOK 1,103 million in 2015 (NOK 829 million). The increase in the profit was partly due to higher tariff revenues and higher conges-tion revenues. Adjusted for changes in higher / lower revenues and estimated interest costs, the profit for the year after tax was NOK 1,427 million (NOK 1,284 million). At the end of 2015 group equity was NOK 13,605 million (NOK 12,629 mil-lion). Adjusted for higher / lower reve-nues after tax, equity was NOK 12,622 mil-lion (NOK 11,322 million) yielding an eq-uity ratio of 27.7% (27.5%).
CEO: Auke Lont
Board: Per Hjorth (chair), Synne Homble (deputy chair), Maria Sandsmark, Egil Gjesteland, Kirsten Indgjerd Værdal, Einar Strømsvåg, Ane Meisingset Elgesem*, Steinar Jøråndstad*, Pål Erland Opland* (* employee-elected)
Auditor: EY AS
The state’s ownership interest through the Ministry of Petroleum and Energy: 100 %Company website: www.statnett.no
© Statnett SF
Statnett SF

104
Income statement (NOK millions) 2015 2014Operating revenues 353 459Operating expenses 290 301Gross operating profit (EBITDA) 76 173Operating profit (EBIT) 62 159Net financial items -37 -7Profit/loss before tax and minority 26 152Tax charge 1 24Minority interests 0 0Profit/loss after tax and minority 25 128 Balance sheet 2015 2014Intangible assets 17 16Fixed assets 1 756 1 783Financial fixed assets 43 87Total fixed assets 1 816 1 887Current assets 158 186Total assets 1 974 2 072 Paid-in equity 1 354 1 354Retained earnings/other equity 354 336Minority interests 9 9Total equity 1 717 1 700Provision for liabilities 73 89Non-current interest-bearing liabilities 125 159Current interest-bearing liabilities 0 0Current interest-free liabilities 59 125Total debt and liabilities 257 373Total equity and liabilities 1 974 2 072 Cash flow 2015 2014Operating activities 69 150Investment activities 27 -15Financing activities -98 -87Change cash and cash equivalents -2 49 Key figures 2015 2014Capital employed 1 842 1 859Gross operating margin (EBITDA) 22 % 38 %Operating margin (EBIT) 18 % 35 %Equity ratio 87 % 82 %Return on equity 1 % 8 %Average return on equity last 5 years 4 % –Return on capital employed 4 % 9 % Revenue distribution 2015 2014Property 29 % 19 %Energy 5 % 4 %Forestry 36 % 30 %Outdoor recreation 11 % 9 %Forest protection compensation 0 % 18 %Property sale 13 % 16 %Other 6 % 5 %Number of hunting and fishing licenses sold 36 380 37 701 Subsidies from the State/ Public purchases 2015 2014Purchase of services 14 14Subsidies 3 5Total subsidies from The State/ public procurements 17 19 Dividends 2015 2014Dividend for the financial year 11 52Dividend percentage 44 % 41 %Average dividend percentage last 5 years 55 % –Dividend to the state 11 52 Additional information 2015 2014Number of employees 128 134Proportion of employees in Norway 100 % 100 %State ownership at year-end 100 % 100 %Proportion of women on the board 43 % 43 %Proportion of women among owner-appointed/shareholder elected board members 40 % 40 %
Statskog SF is Norway’s largest land-owner and manages around 5.9 million hectares, or more than 1/5 of the main-land surface area. Most of this is moun-tains and uncultivated wilderness. The enterprise is also Norway’s largest forest owner, with around 6% of the productive forest area. A large part of the state’s land in southern and central Norway consists of state-owned common land managed by Statskog, the mountain boards and the common land boards, pursuant to the Act relating to the exploitation of rights and entitlements in the state commons and the Act on forestry etc. in the state com-mons. Statskog’s commercial operations are related to forestry, management of wilderness areas, energy and other land-use and property management.
In addition to its commercial activities, Statskog conducts management tasks for the state as prescribed in law, delegated authority, and as instructed by the Minis-try of Agriculture and Food and the Min-istry of Climate and the Environment. These tasks consist of the exercise of state authority, supervision of property and common land, and management of hunting and fishing on state-owned land. Statskog shall also safeguard and develop all assets on public lands and guarantee the public’s access to hunting, fishing and outdoor activities in Norway.
Statskog’s head office is in Namsos.
Important events On commission from the owner, Statskog has studied privatisation of the company’s commercially viable forests. The board presented the final report to the owner on 2 March 2015. In the national budget for 2016, the government announced that it will allow Statskog to expand the ongoing sale of isolated properties to improve the overall configuration of the holding by up to 15,000 hectares.
2015 was the year of outdoor recrea-tion in Norway. In addition to the enter-prise’s ordinary work related to outdoor recreation, Statskog initiated several cam-paigns to highlight the opportunities in forest and mountain areas in Norway.
Corporate social responsibilityStatskog shall conduct sustainable forest-ry and land-use management, striking a balance between the considerations of profitability, resource utilisation, conser-vation and other stakeholder interests. As a state landowner, Statskog shall guaran-tee the public’s access to hunting and fish-ing and facilitate the public’s access to outdoor recreation. The company does this by offering hunting and fishing li-cences at a reasonable market price.
Statskog collaborates with volunteer organisations, schools, businesses and others to increase knowledge about na-ture and outdoor life, with a focus on chil-dren and young people. The company also offers affordable rental of cabins. In addi-tion, the company has many open shelters and huts that anyone can use free of charge.
Statskog develops the assets on public lands in a way that safeguards environ-mental and conservation interests, while also contributing to others’ wealth crea-tion and development.
Financial developmentThe 2015 accounts show higher revenues and a higher profit than the previous year. In 2014 the company had major one-off revenue from forest protection compensa-tion, which was substantially lower in 2015.
The general operation of the company resulted in lower profits in 2015 than the previous year. This is mainly due to lower harvested volumes in forestry operations. Despite the lower operating profit com-pared with the previous year, the board is satisfied that the company has good cost control and that all the other revenue are-as apart from forest operations are show-ing steady growth in sales and profitabili-ty. Financial items had a significantly poorer performance in 2015 than the pre-vious year. The main reason for this is that the company has made extraordinary write-downs in the energy projects in the wholly owned subsidiary Statskog Energi AS and its wholly and partly owned com-panies.
CEO: Øistein Aagesen
Board: Gunnar Olofsson (chair), Eli Reistad (deputy chair), Tom Lifjell, Marianne Olssøn, Hans Aasnæs, Knut Røst*, Tine Lomsdal* (* employee-elected)
Auditor: KPMG AS
The state’s ownership interest through the Ministry of Agriculture and Food: 100 %Company website: www.statskog.no
© Jan Rune D
anielsen
Statskog SF

105
Income statement (NOK millions) 2015 2014Operating revenues 9.7 8.0Operating expenses 10.1 8.5Gross operating profit (EBITDA) 0.0 0.0Operating profit (EBIT) -0.4 -0.5Net financial items -0.2 -0.1Profit/loss before tax -0.6 -0.6Tax charge 0.5 -0.2Profit/loss after tax -1.1 -0.4 Balance sheet 2015 2014Intangible assets 0.0 0.5Fixed assets 2.9 2.9Financial fixed assets 0.1 0.1Total fixed assets 3.0 3.5Current assets 2.4 2.2Total assets 5.4 5.7 Paid-in equity 1.5 1.5Retained earnings/other equity -0.6 0.5Total equity 0.9 2.0Provision for liabilities 0.0 0.0Non-current interest-bearing liabilities 2.9 2.4Current interest-bearing liabilities 0.0 0.0Current interest-free liabilities 1.6 1.3Total debt and liabilities 4.5 3.7Total equity and liabilities 5.4 5.7 Cash flow 2015 2014Operating activities 0.1 0.9Investment activities -0.5 -0.3Financing activities 0.5 -0.4Change cash and cash equivalents 0.1 0.2 Key figures 2015 2014Capital employed 3.8 4.4Gross operating margin (EBITDA) 0 % 0 %Operating margin (EBIT) -4 % -6 %Equity ratio 17 % 35 %Return on equity -76 % -20 %Average return on equity last 3 years -29 % –Return on capital employed -9 % -9 % Additional information 2015 2014Number of employees 7 7Proportion of employees in Norway 100 % 100 %State ownership at year-end 100 % 100 %Proportion of women on the board 40 % 60 %Proportion of women among owner-appointed/shareholder elected board members 40 % 60 %
Staur gård AS was established in 2001 to continue the business at the state-owned farm Staur gård in Stange municipality, which had previously been run by the Nor-wegian Grain Corporation. The company’s objective is to facilitate research and devel-opment (R&D) in agriculture and to run the unique property as a guesthouse. R&D activities are carried out by private compa-nies. Staur gård conducts its own agricul-tural activities on the remaining parts of the property. The property, which was pro-tected by the Directorate for Cultural Her-itage in Norway in 2012, is a singular prop-erty that was used in the past for the gov-ernment’s budget conferences. The pur-pose of its guest accommodation business is to protect and develop the unique as-pects of the property.
In other respects, the relationship be-tween the company and the Ministry of Agriculture and Food is regulated in the lease, where the company has undertak-en a number of obligations related to the property. The current lease was signed in 2013 for a ten-year period.
Corporate social responsibilityGraminor, the Norwegian Sheep and Goat Breeders Association and Geno / the Nor-wegian Beefbreeders Association rent buildings and land and purchase services from Staur gård in order to conduct breed-ing, research and experiments. Staur gård also produces roughage and straw for sale to tenants. Much of the activity at the farm is exclusive to Staur gård. The farm is the most important arena for testing and breeding beef cattle and is Norway’s only remaining artificial breeding centre for sheep.
Financial developmentHaving achieved acceptable profits in the period 2010–2013, Staur gård posted a large deficit in 2014. A similar deficit is expected for 2015 too. Revenue has in-creased by about 20%, but operating costs have also been significantly higher. No dividends have been drawn during the past few years.
CEO: Ola Martin Qvale
Board: Anne Kathrine Fossum (chair), Kristen Bartnes (deputy chair), Eli Skoland, Arne Bardalen, Bernt Bucher Johannessen
Auditor: Sandberg Revisjon AS
The state’s ownership interest through the Ministry of Agriculture and Food: 100 %Company website: www.staur.no
© Staur gård A
S
Staur Gård AS

106
Income statement (NOK millions) 2015 2014Operating revenues 885 1 021 Operating expenses 1 319 1 816 Gross operating profit (EBITDA) -267 274 Operating profit (EBIT) -434 -794 Net financial items -291 -108 Profit/loss before tax -725 -902 Tax charge 42 191 Profit/loss after tax -766 -1 093 Balance sheet 2015 2014Intangible assets 2 16 Fixed assets 335 409 Financial fixed assets 6 6 Total fixed assets 344 431 Current assets 693 684 Total assets 1 037 1 115 Paid-in equity 164 165 Retained earnings/other equity -519 251 Total equity -355 415 Provision for liabilities 324 224 Non-current interest-bearing liabilities 51 53 Current interest-bearing liabilities 382 0Current interest-free liabilities 634 422 Total debt and liabilities 1 391 699 Total equity and liabilities 1 037 1 115 Cash flow 2015 2014Operating activities -435 -24Investment activities 150 -411Financing activities 452 -3Change cash and cash equivalents 166 -438 Key figures 2015 2014Capital employed 78 469Gross operating margin (EBITDA) -30 % 27 %Operating margin (EBIT) -49 % -78 %Equity ratio -34 % 37 %Return on equity1 – -115 %Average dividend percentage last 5 years1 – –Return on capital employed -141 % -75 % Additional information 2015 2014Number of employees 207 344Proportion of employees in Norway 100 % 100 %State ownership at year-end 100 % 99.94 %Proportion of women on the board 38 % 38 %Proportion of women among owner-appointed/shareholder elected board members 60 % 60 %
Store Norske Spitsbergen Kulkompa-ni AS’ (SNSK) core business is coal min-ing in Svalbard. The company was estab-lished in Longyearbyen in 1916 and con-tinues to be an important player in the community in Svalbard.
SNSK’s headquarter is in Longyearby-en and the company currently operates two coal mines through its subsidiary Store Norske Spitsbergen Grubekompani AS (SNSG): Gruve 7 in Adventdalen out-side Longyearbyen and Svea Nord 60 km south of Longyearbyen. The SNSK group also consists of the wholly owned subsidi-ary Store Norske Boliger AS and the part-ly owned subsidiary Pole Position Logis-tics AS (65%).
Important eventsDue to the operations in the coal company SNSG were reduced to a minimum in 2015. During the last year SNSK under-went an extensive restructuring, which included reduction of employees, cost cut-ting measures and restructuring of the operations in the subsidiary SNSG. This process is continuing in 2016. In June 2015 SNSK received capital from the state of NOK 500 million in the form of loans and purchases of SNSK-owned land in Svalbard.
In December 2015 the owners of SNSK approved the board’s recommendation to increase operations in Gruve 7 to two shifts in 2016, combined with prepara-tions for an operation rest in Svea and Lunckefjell. The operation rest will last for up to three years from 2017. The solution requires capital from the owner and agreements have been entered into with the company’s main bank and the owner to enable this solution.
The company’s revised business plan implies that approximately 100 employees will continue to work in the company. In addition, critical expertise will be kept in the company making it possible to re-open the Lunckefjell mine during the next three years. Reopening will depend on an increase in coal prices, among other things.
In 2015 the state, represented by the Ministry of Trade, Industry and Fisher-ies, increased its ownership share from 99.94% to 100% in SNSK.
Corporate social responsibilityCorporate social responsibility is a central part of SNSK’s business strategy and pro-vides a guideline for the company’s opera-tions. The company is aware of the envi-ronmental impact of its operations and works actively to minimise emissions and the negative impact on the natural envi-ronment. Through the Svalbard Environ-mental Protection Act, SNSK adheres to strict environmental legislation and has a vision of zero accidents and undesirable environmental impact.
SNSK is upping its work to develop al-ternative business activities in Svalbard based on the company’s unique expertise in demanding industrial operations in the northern part of the Arctic. SNSK’s major-ity shareholding in the logistics company Pole Position Logistics is one of several examples of this. The goal is to contribute to the continued existence and further de-velopment of the community in Longyear-byen and to ensure that it develops in a manner that underpins the overriding aims of Norway’s policy for Svalbard.
Financial developmentThe SNSK group had a result before tax of NOK -725 million, compared with NOK -902 million the previous year. The result is largely impacted by continuously low coal prices and reduced production volumes. Low coal prices during the year were to some extent offset by the weakening of NOK compared to USD. The result for the year is also impacted by large non-recur-ring items, including gains from the sale of property of NOK 245 million, losses on currency futures of NOK 260 million, and write-downs of NOK 125 million. Provi-sions of NOK 72 million were made for en-vironmental liabilities. Equity at the end of 2015 was NOK -355 million, compared with NOK 415 million the previous year.
CEO: Wenche Ravlo
Board: Annette Malm Justad (chair), Per Ole Morken (deputy chair), Birger Solberg, Hege Schøyen Dillner, Britt Mjellem, Alf Brun*, Arne Kristoffersen*, Torstein Nilsen* (* employee-elected)
Auditor: PricewaterhouseCoopers AS
The state’s ownership interest through the Ministry of Trade, Industry and Fisheries: 100 %Company website: www.snsk.no
© Store N
orske Spitsbergen Kulkompani A
S
1 Calculated using the definitions on page 125, return on equity will be negative by over 500%.
Store Norske Spitsbergen Kulkompani AS
107
Talent Norge AS was established on 21 January 2015 and received a NOK 30 mil-lion subsidy from the state for general cul-tural purposes and talent development in 2015. The allocation for 2016 is NOK 30.6 million. The company has been in contin-uous operation since it was launched. From 1 September Talent Norge moved from its original location in the attic of the DNB Savings Bank Foundation’s tempo-rary premises into Kulturmeglerne AS’s premises at Brenneriveien 5. The compa-ny has signed a lease for office space and the opportunity to make use of services related to office operations, strategy and communication.
Talent Norge’s strategic vision is to en-able outstanding artistic talents to realise their maximum potential. The main objec-tive is to contribute to better development of artistic talent and a richer cultural sec-tor. The company wants to establish suc-cessful, permanent relations both artisti-cally and financially: i.e. investments in talent that lead to high artistic recognition and public investments that trigger sub-stantial private investment.
Talent Norge will collaborate with lead-ing organisations and institutions to pro-vide talented young artists with special-ised expertise to develop, support and enable their potential, and trigger at least as much private capital as public in the project portfolio. Priority will be given to investments in especially promising tal-ents ahead of higher arts education and recently qualified artists with unique, doc-umented potential. The target group is both performing and creative artists in all art forms and expressions. All measures shall take place in collaboration with rec-ognised cultural institutions and business-es that can initiate, shape and implement the projects and/or benevolent founda-tions, sponsors and patrons interested in investing in the projects.
With its broad competence the board has also participated in various meetings and events to establish and maintain a good dialogue with both the cultural sec-tor and private partners. In addition to ap-proving specific investments, the board’s main tasks were designing a strategy for the company and hiring a general manag-er. After a thorough process undertaken by a handful of the board members, sup-ported by the recruitment company Hodejegerne, Maria Mediaas Jørstad was appointed as CEO on 1 September 2015.
In its first year of operation, the main task was to spread word about the com-pany in the field and the various groups’ challenges in talent development, mainly through a series of input meetings and meetings with individual players. In spring 2015 the company held a series of input meetings, from Tromsø in the north to Stavanger in the south. The company held further supplementary meetings with individual players, institutions, pro-ject owners, the administration of the Sami Parliament and various foundations. This work generated a number of project proposals. Some of the projects have been realised in 2015, some will be realised in the next few years, and for some, further work is being done on the project and/or the funding.
Financial developmentOf the original allocation, a total of NOK 26.9 million had been spent on talent de-velopment at the end of 2015. The eleven projects that Talent Norge has contribut-ed funds to range in time from 2015 until 2021. The grants triggered NOK 51.7 mil-lion in co-financing from 15 private sourc-es. Talent Norge’s allocation for 2015 trig-gered a total of NOK 78.6 million in invest-ments in talent in the cultural sector.
CEO: Maria Cecilie Mediaas Jørstad
Board: John Gordon Bernander (chair), Bentein Baardson, Cecilie Broch Knudsen, Brit Kristin Sæbø Rugland, Ingrid Røynesdal, Bjørn Olav Ragnar Øiulfstad)
Auditor: Deloitte AS
The state’s ownership interest through the Ministry of Culture: 33.33 %Company website: www.talentnorge.no
© Jörg W
iesner
Income statement (NOK millions) 2015 Operating revenues 30.0Operating expenses 30.1Gross operating profit (EBITDA) -0.1Operating profit (EBIT) -0.1Net financial items 0.1Profit/loss before tax 0.0Tax charge 0.0Profit/loss after tax 0.0 Balance sheet 2015 Intangible assets 0.1Fixed assets 0.0Financial fixed assets 0.0Total fixed assets 0.1Current assets 23.0Total assets 23.1 Paid-in equity 0.0Retained earnings/other equity 0.0Total equity 0.1Provision for liabilities 22.5Non-current interest-bearing liabilities 0.0Current interest-bearing liabilities 0.0Current interest-free liabilities 0.5Total debt and liabilities 23.0Total equity and liabilities 23.1 Cash flow 2015 Operating activities 0.5Investment activities -0.2Financing activities 22.7Change cash and cash equivalents 23.0 Key figures 2015 Capital employed 0.1Gross operating margin (EBITDA) 0 %Operating margin (EBIT) 0 %Equity ratio 0 % Additional information 2015 Number of employees 2Proportion of employees in Norway 100 %State ownership at year-end 33.33 %Proportion of women on the board 50 %Proportion of women among owner- appointed/shareholder elected board members 50 %
Talent Norge AS

108
Income statement (NOK millions) 2015 2014Operating revenues 121.1 111.7Operating expenses 119.3 109.3Gross operating profit (EBITDA) 4.6 5.1Operating profit (EBIT) 1.8 2.3Net financial items 0.3 0.3Profit/loss before tax 2.2 2.6Tax charge 0.0 0.0Profit/loss after tax 2.2 2.6 Balance sheet 2015 2014Intangible assets 0.0 0.0Fixed assets 18.1 20.9Financial fixed assets 6.2 7.3Total fixed assets 24.4 28.2Current assets 22.9 15.8Total assets 47.3 44.0 Paid-in equity 1.1 1.1Retained earnings/other equity 24.6 22.4Total equity 25.7 23.5Provision for liabilities 0.0 0.0Non-current interest-bearing liabilities 0.0 0.0Current interest-bearing liabilities 0.0 0.0Current interest-free liabilities 21.6 20.5Total debt and liabilities 21.6 20.5Total equity and liabilities 47.3 44.0 Cash flow 2015 2014Operating activities 7.5 7.0Investment activities 0.0 0.0Financing activities 0.0 -6.7Change cash and cash equivalents 7.5 0.3 Key figures 2015 2014Capital employed 25.7 23.5Gross operating margin (EBITDA) 4 % 5 %Operating margin (EBIT) 2 % 2 %Equity ratio 54 % 53 %Return on equity 9 % 12 %Average return on equity last 3 years 9 % –Return on capital employed 9 % 11 % Other key figures 2015 2014Total number of performances 532 414Tickets sold 107 024 78 613Audiences 77 % 67 %Ticket sales 20.2 12.1 Subsidies from the State 2015 2014Ministry of Culture 68.4 66.8Sør-Trøndelag County Council, Trondheim municipality and collaborators 29.7 29.0Total subsidies 98.0 95.8 Additional information 2015 2014Number of employees 173 160Proportion of employees in Norway 100 % 100 %State ownership at year-end 66.67 % 66.67 %Proportion of women on the board 43 % 43 %Proportion of women among owner-appointed/shareholder elected board members 40 % 40 %
Trøndelag Teater AS is the regional the-atre in Trøndelag and is located in Trond-heim. Trøndelag Teater was established in Trondheim in 1937. According to the articles of association, its objective is ”... to provide theatre in Trondheim and the surrounding regions, as well as tours and guest performances."
In 1997, the theatre moved into a new theatre building, which integrated the Gamle Scene building from 1816 and the Theatercafeen restaurant from the end of the last century. The theatre has five stag-es with total seating capacity of about 1,100 seats every evening, with the main stage “Hovedscenen” seating 520. The other stages are Teaterkjelleren, Studioscenen, Gamle Scene and Theatercafeen.
Trøndelag Teater has a strategy plat-form that sets the framework for its cur-rent operations. Its vision is: “Trøndelag Teater will be the most important cultural institution in central Norway, by having the theatre mean something to all inhabit-ants of the region.” Its mission: “Trønde-lag Teater will present professional pro-ductions for the audience. Different forms of artistic expression must be part of the repertoire, separately and integrated.” The purpose / scope is: “Art: We will give the audience good experiences by creat-ing engaging, challenging and entertain-ing theatre. We will cover the span be-tween traditional and modern performing art. We will be bold in our work with the classics. We will consciously work to pro-mote new Norwegian drama. We will be one of the leading theatres in the national context.” Market: “Theatre is for the audi-ence. Our goal is a broader, larger audi-ence, not least children and young people. The entire organisation must focus on en-suring a positive overall experience."
Important events2015 was another good year for Trøndelag Teater, with high visiting numbers, artis-
tic successes, good operations and sound finances. Last year Trøndelag Teater was nominated for nine Hedda Awards and won two. This is recognition and confir-mation that the theatre delivers top-quali-ty artistic productions. In 2015 the theatre had a total of 107,024 spectators, surpass-ing the theatre’s target of 100,000 specta-tors a year.
Corporate social responsibilityTrøndelag Theatre is conscious of its cor-porate social responsibility in accordance with the government’s ownership policy. As a major cultural player in central Nor-way and in light of the influence it has by virtue of this role, the theatre has there-fore set clear goals for its corporate social responsibility work. This affects selection of productions and how they are interpret-ed, as well as a clear CSR focus in connec-tion with the use of workforce and pro-curement of materials and services. The theatre has developed best practices in this area and has not registered any devia-tion from its objectives for 2015. Exam-ples include integration of different art forms, multicultural personnel and gen-der equality at every level of the company. The theatre also has a manifesto for inte-gration and gender equality, which was drawn up by the employees and has been adopted by the board. The board has ap-pointed a committee to draw up ethical guidelines.
Financial developmentThe 2015 accounts show a surplus of NOK 2.2 million. The surplus is larger than budgeted, primarily as a result of reduced payroll costs and lower electricity and heating costs. The board has proposed that the surplus be transferred to other equity, which now amounts to NOK 25.7 million. Trøndelag Teater does not pay dividends to its owners.
Theatre director: Kristian Seltun
Board: Terje Roll Danielsen (chair), Tore Onshuus Sandvik (deputy chair), Leif Bjerkan, Aina Holst, Turid Stenseth, Ingeborg Hopshaug*, Hallbjørn Rønning* (* employee-elected)
Auditor: PricewaterhouseCoopers AS
The state’s ownership interest through the Ministry of Culture: 66.67 %Company website: www.trondelag-teater.no
© G
T Nergaard/Trøndelag Teater A
S
Trøndelag Teater AS

109
Income statement (NOK millions) 2015 2014Operating revenues 297.1 326.3Operating expenses 219.5 338.0Gross operating profit (EBITDA) 83.5 -6.5Operating profit (EBIT) 77.6 -11.7Net financial items 3.4 3.8Profit/loss before tax 81.0 -7.9Tax charge 0.0 0.0Profit/loss after tax 81.0 -7.9 Balance sheet 2015 2014Intangible assets 28.1 32.9Fixed assets 4.3 2.6Financial fixed assets 13.7 16.0Total fixed assets 46.1 51.5Current assets 294.2 215.5Total assets 340.3 267.1 Paid-in equity 3.0 3.0Retained earnings/other equity 230.0 149.1Total equity 233.0 152.1Provision for liabilities 6.1 55.5Non-current liabilities 0.0 0.0Current interest-bearing liabilities 0.0 0.0Current interest-free liabilities 101.2 59.5Total debt and liabilities 107.3 115.0Total equity and liabilities 340.3 267.1 Cash flow 2015 2014Operating activities 52.3 -71.2Investment activities 2.7 -3.0Financing activities -1.7 -1.7Change cash and cash equivalents 53.3 -75.9 Key figures 2015 2014Capital employed 233.0 152.1Gross operating margin (EBITDA) 28 % -2 %Operating margin (EBIT) 26 % -4 %Equity ratio 68 % 57 %Return on equity 42 % -5 %Average dividend percentage last 5 years 11 % –Return on capital employed 43 % -5 % Subsidies from the State 2015 2014Ministry of Education and Research 45.5 115.5Others 36.5 33.0Total subsidies 82.0 148.5 Additional information 2015 2014Number of employees 105 108Proportion of employees in Norway 100 % 100 %State ownership at year-end 100 % 100 %Proportion of women on the board 43 % 33 %Proportion of women among owner-appointed/shareholder elected board members 50 % 40 %
UNINETT AS is the authorities’ tool for development and operation of a versatile national e-infrastructure for research and higher education. The company develops and operates the Norwegian research and education network on behalf of the Minis-try of Education and Research and deliv-ers network infrastructure with produc-tion services and experimental services. Through collaboration and synergies, UNINETT optimises the acquisition and use of the overall ICT resources in the university and university college sector in Norway.
UNINETT AS was established in 1993 and is the parent company in the UNI-NETT group. The group has two wholly owned subsidiaries: UNINETT Norid AS, which is the national registration unit for the .no domain, and UNINETT Sigma2 AS, which manages procurement and op-eration of national equipment for ad-vanced scientific calculations. All the com-panies are run from shared offices in Trondheim.
Important eventsThe research network has gigabit capaci-ty for all of the universities and university colleges, and traffic is increasing steadily. In 2015 UNINETT continued building backup paths on the network and capacity upgrades on long-distance connections in the main network
UNINETT AS has received a grant of NOK 90 million to lay subsea fiber optic cables between Ny-Ålesund and Long-yearbyen in Svalbard. Connection was completed in the first half of 2015, and it is now fully operational.
The UNINETT-coordinated eCampus programme, which uses ICT infrastruc-ture to support teaching, research and
dissemination, was granted NOK 15 mil-lion in 2015. The programme has estab-lished a set of services that are now in use by more than 40 institutions, and process-es linked to joint procurement of digital learning solutions and digital examina-tions were initiated in autumn 2015.
Together with the University of Oslo, the University of Bergen, the Norwegian University of Science and Technology (NTNU) and the University of Tromsø – the Arctic University of Norway, UNI-NETT has initiated a national programme to explore and develop future ICT solu-tions for universities and colleges based on cloud technology. The sky-tech pro-gramme was allocated NOK 10 million in the national budget for 2016.
Corporate social responsibilityUNINETT is working for the Norwegian university and university college sector to rationalise energy use in computer rooms and increase the use of video conferencing as part of the government’s “Green IT” programme. By working towards common solutions, UNINETT constantly seeks to manage public assets in the best possible way and save resources for society.
Financial developmentUNINETT is planning for the develop-ment of the research network to take place in part based on the company’s eq-uity, meaning the equity ratio and annual profit vary according to investments. In 2015 the group had operating revenues of NOK 297 million and returned a profit of NOK 81 million. The increased profit is a result of reversed pension obligations as the group has switched from a defined-benefit to a defined-contribution pension plan.
CEO: Petter Kongshaug
Board: Britt Elin Steinveg (chair), Frank Arntsen, Steen Pedersen, Benedicte Rustad, Pål Dietrichs, Cecilie Ohm, Morten Knutsen*
(* employee-elected)
Auditor: EY AS
The state’s ownership interest through the Ministry of Education and Research: 100 %Company website: www.uninett.no
© U
NIN
ETT AS
UNINETT AS

110
Income statement (NOK millions) 2015 2014Operating revenues 143.5 143.6Operating expenses 148.8 141.6Gross operating profit (EBITDA) -3.4 4.5Operating profit (EBIT) -5.3 2.0Net financial items -0.1 0.1Profit/loss before tax -5.4 2.1Tax charge 0.0 0.0Profit/loss after tax -5.4 2.1 Balance sheet 2015 2014Intangible assets 0.0 0.0Fixed assets 36.4 38.4Financial fixed assets 0.1 0.1Total fixed assets 36.5 38.5Current assets 43.6 58.0Total assets 80.1 96.5 Paid-in equity 2.1 2.1Retained earnings/other equity 14.1 19.5Total equity 16.2 21.6Provision for liabilities 1.1 6.9Non-current interest-bearing liabilities 21.6 23.6Current interest-bearing liabilities 0.0 0.0Current interest-free liabilities 41.2 44.4Total debt and liabilities 63.9 74.9Total equity and liabilities 80.1 96.5 Cash flow 2015 2014Operating activities -11.0 4.8Investment activities -6.2 -6.3Financing activities -2.9 -3.6Change cash and cash equivalents -20.1 -5.1 Key figures 2015 2014Capital employed 37.8 45.2Gross operating margin (EBITDA) -2 % 3 %Operating margin (EBIT) -4 % 1 %Equity ratio 20 % 22 %Return on equity -29 % 10 %Average dividend percentage last 5 years 5 % –Return on capital employed -11 % 7 % Other key figures 2015 2014Student labour years 202.7 190.3 Subsidies from the State 2015 2014Government grants 121.8 117.9 Additional information 2015 2014Number of employees 118 106Proportion of employees in Norway 100 % 100 %State ownership at year-end 100 % 100 %Proportion of women on the board 70 % 56 %Proportion of women among owner-appointed/shareholder elected board members 50 % 50 %
Universitetssenteret på Svalbard AS, The University Centre in Scalbard, (UNIS) was established as a state-owned limited company in 2002. The company replaced the former foundation, University Cours-es on Svalbard, established by the four Norwegian universities in 1994. The com-pany offers courses and conducts re-search based on Svalbard’s geographic location in the High Arctic and the special advantages associated with using nature as a laboratory. The study programmes are at university level and are a supple-ment to the education offered by the uni-versities on the mainland, as part of an ordinary course of study leading to a Bachelor’s, Master’s or PhD degree. The study programme shall have an interna-tional profile, and teaching is in English.
UNIS has four fields of study: Arctic bi-ology, Arctic geology, Arctic geophysics and Arctic technology. In 2015 a total of 96 courses were taught at bachelor’s, mas-ter’s or doctorate level at UNIS, 690 stu-dents from 44 countries attended classes, and 58 master students worked on their theses. This corresponds to 203 student labour years. In 2015 Norwegian degree students made up 45% of the students; i.e. 310 students. In addition, 38 post-doctoral research fellows and PhD students stud-ied at UNIS in 2015.
Important events UNIS works closely with Norwegian uni-versities to develop an Arctic profile with-in the existing study programmes at the mainland universities. This will provide a more stable flow of students to UNIS, at the same time as it will make the Norwe-gian universities more attractive at a time of growing attention to the Arctic region and climate change.
The increased quality and number of publications reflect the fact that UNIS has become the fifth largest institution within polar research in Norway. Scientific arti-cles from UNIS are cited above the global average citation index. Furthermore, UNIS is the second largest institution on polar research within the university sec-tor and is now the largest Norwegian in-stitution conducting research in Svalbard and the ocean areas surrounding Sval-
bard, measured in both number of re-search days and number of publications.
In 2015 UNIS’s researchers published 118 scientific articles in peer-reviewed journals, 46 of which were at the highest level. A study published in Nature Geosci-ence indicates that the ice-covered earth 650 million years ago was more sensitive to orbital forcing than previously thought and that the ice started melting before CO2 concentrations had reached the threshold level for complete melt-back. A multidisciplinary study published in Nature Communications demonstrates for the first time a direct link between the sea temperature in the Arctic fjords and glacier calving rates. This also demon-strates that it is possible to study glacier dynamics and understand what affects the glacier with observations and time series from the sea and atmosphere using re-mote sensing and satellite data.
Corporate social responsibilityUNIS shall be a resource for the local com-munities in Svalbard. This includes the staff, students and the knowledge they possess. The staff shall live and work in Longyearbyen and contribute to the devel-opment of both the institution and the com-munity. UNIS purchased 49% of its goods and services locally in Longyearbyen.
As an educational institution, UNIS of-fers research-based and field-based edu-cation at a high level to young people from many different countries and thereby con-tributes to recruitment of qualified labour for research, management and business development in and for the Arctic.
Financial developmentUNIS received subsidies totalling NOK 122 million via the Ministry of Education and Research’s budget in 2015. The com-pany also received project income for re-search of NOK 48.5 million and income from consulting services and rent of NOK 17.6 million. The annual accounts show a deficit, which can be ascribed to invest-ments that were planned for 2016 and 2017 having to be made in 2015. Most of the deficit can be ascribed to increased costs related to fieldwork and cruises and personnel costs.
CEO: Ole Arve Misund1
Board: Berit Johanne Kjeldstad (chair), Jarle Nygard (deputy chair), Eva Falleth, Lise Øverås, Morten Hald, Geir Hekne, Pernille Eidesen*, Elise Strømseng*, Eli Anne Ersdal*, Helene Overaa Eide (student representantive) (* employee-elected)
Auditor: PricewaterhouseCoopers AS
The state’s ownership interest through the Ministry of Education and Research: 100 %Company website: www.unis.no
© D
avid Wrangborg
Universitetssenteret på Svalbard AS
1 Ole Arve Misund was CEO at the end of 2015. Frank Nilsen was appointed acting CEO 1 February 2016.
111
Income statement (NOK millions) 2015 2014Operating revenues 12 806 12 634Of which alcohol tax 6 781 6 713Operating expenses 12 666 12 382Gross operating profit (EBITDA) 214 331Operating profit (EBIT) 140 252Net financial items 22 39Result before the Vinmonopol tax 161 291Vinmonopol tax 44.4 79.3Profit after the Vinmonpol tax 117 211 Balance sheet 2015 2014Intangible assets 331 386Fixed assets 268 244Financial fixed assets 1 1Total fixed assets 600 632Current assets 3 123 2 979Total assets 3 723 3 611 Paid-in equity 0 0Retained earnings/other equity 553 461Total equity 553 461Non-current interest-free liabilities 1 122 1 188Non-current interest-bearing liabilities 0 0Current interest-bearing liabilities 0 0Current interest-free liabilities 2 049 1 961Total debt and liabilities 3 171 3 150Total equity and liabilities 3 723 3 611 Cash flow 2015 2014Operating activities 176.9 237.1Investment activities -86.2 -79.4Financing activities 0 0.3Change cash and cash equivalents 91 158 Key figures 2015 2014Capital employed 553 461Gross operating margin (EBITDA) 2 % 3 %Operating margin (EBIT) 1 % 2 %Equity ratio 15 % 13 %Return on equity 23 % 45 %Average dividend percentage last 5 years 29 % –Return on capital employed 32 % 62 % Dividends 2015 2014Dividend for the financial year 59 106Dividend percentage 50 % 50 %Average dividend percentage last 5 years 50 % –Dividend to the state 59 106 Additional information 2015 2014Number of employees 1 857 1 825Proportion of employees in Norway 100 % 100 %State ownership at year-end 100 % 100 %Proportion of women on the board 44 % 44 %Proportion of women among owner-appointed/shareholder elected board members 50 % 50 %
AS Vinmonopolet is a state-owned com-pany with exclusive rights to sell alcoholic beverages containing more than 4.7% al-cohol by volume to consumers through retail outlets. The company was founded in 1922. Vinmonopolet is one of the most important measures in Norway’s alcohol policy and is intended to help limit alcohol consumption by regulating availability. The alcohol policy is expressed through effective social control, measures to cre-ate positive attitudes, efficient operations and absence of promotional activities. To ensure legitimacy with the general public, Vinmonopolet places emphasis on being a specialised trade chain with a wide range of products and personal customer ser-vice. Vinmonopolet is headquartered in Oslo.
Important eventsIn 2015 Vinmonopolet opened nine new retail outlets, all of which are self-service. Vinmonopolet has a total of 306 outlets and is established in 240 of the country’s municipalities. Of Norway’s population, 91% live in municipalities with a Vinmono-polet outlet and 96% of the population live less than 30 km from their nearest outlet. Accessibility has increased each year, in keeping with the expansion of the net-work of outlets. Nine outlets are in catego-ry 1 (smallest outlets), which are intend-ed to further improve availability in rural Norway.
Vinmonopolet has a strong reputation. For the third consecutive year the com-pany topped TNS Gallup’s syndicated cor-porate reputation survey and was among the top ten in most of the other major reputation surveys in Norway.
Corporate social responsibilityIn cooperation with the other Nordic alco-hol monopolies in Sweden, Finland, Ice-land and the Faroe Islands, Vinmonopolet has set ethical requirements for the actors in the supply chain. In recent years Vin-monopolet has monitored ethical perfor-mance in the supply chain by asking sup-pliers to report on their compliance with the requirements. The programme has a broad reach and has provided a good plat-form on which to build more comprehen-sive monitoring of suppliers.
In 2015 Vinmonopolet was admitted as a member of the corporate social responsi-bility organisation Business Social Compli-ance Initiative. At the same time joint guidelines have been issued for how the Nordic monopolies shall follow up their suppliers in a uniform manner through membership. The importers have a gen-eral responsibility for monitoring their supply chains. Vinmonopolet and the oth-er monopolies undertake more compre-hensive follow-up of suppliers from high-risk areas. In 2015 Vinmonopolet started following up three such suppliers, one from South Africa and two from Argentina, and their respective importers.
Financial developmentVinmonopolet’s financial development re-mained positive in 2015. The main drivers are increased revenues through a higher average price of sold articles and strict cost control, resulting in lower operating costs. Revenue measured in litres of drinks sold has declined from previous years as a result of lower sales of light-wine in the second half of the year.
CEO: Kai Henning Gjesdal Henriksen1
Board: Hill-Marta Solberg (chair), Margrethe Sunde (deputy chair), Marit Warncke, David Hansen, Per Arne Olsen, Sverre Helno, Helge Storvik*, Turid Sundsetvik*, Svend Bang Pedersen* (* employee-elected)
Auditor: PricewaterhouseCoopers AS
The state’s ownership interest through the Ministry of Health and Care Services: 100 %Company website: www.vinmonopolet.no
© A
S Vinmonopolet
AS Vinmonopolet
1 Kai Henning Gjesdal Henriksen was CEO at 31 December 2015, but passed away 27 May 2016.
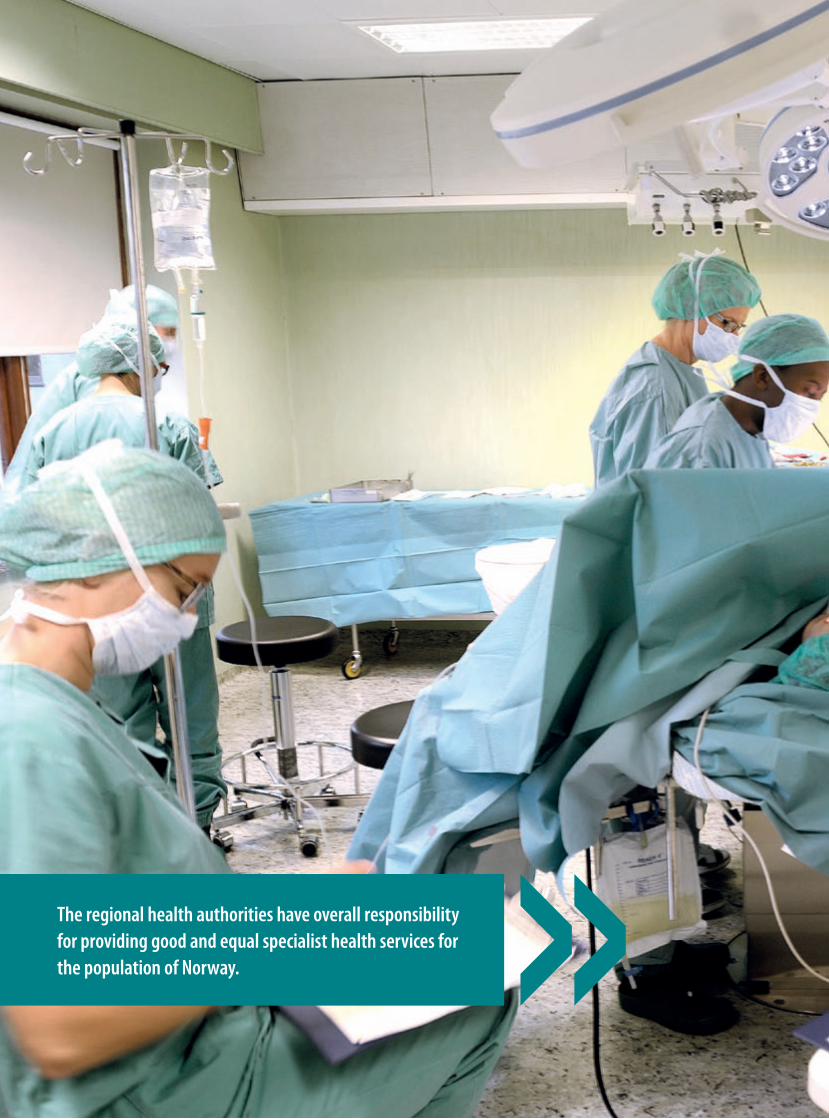
112 S TAT E N S E I E R B E R E T N I N G 2 0 1 2 – S E L S K A P S O MTA L E
The regional health authorities have overall responsibility for providing good and equal specialist health services for the population of Norway.
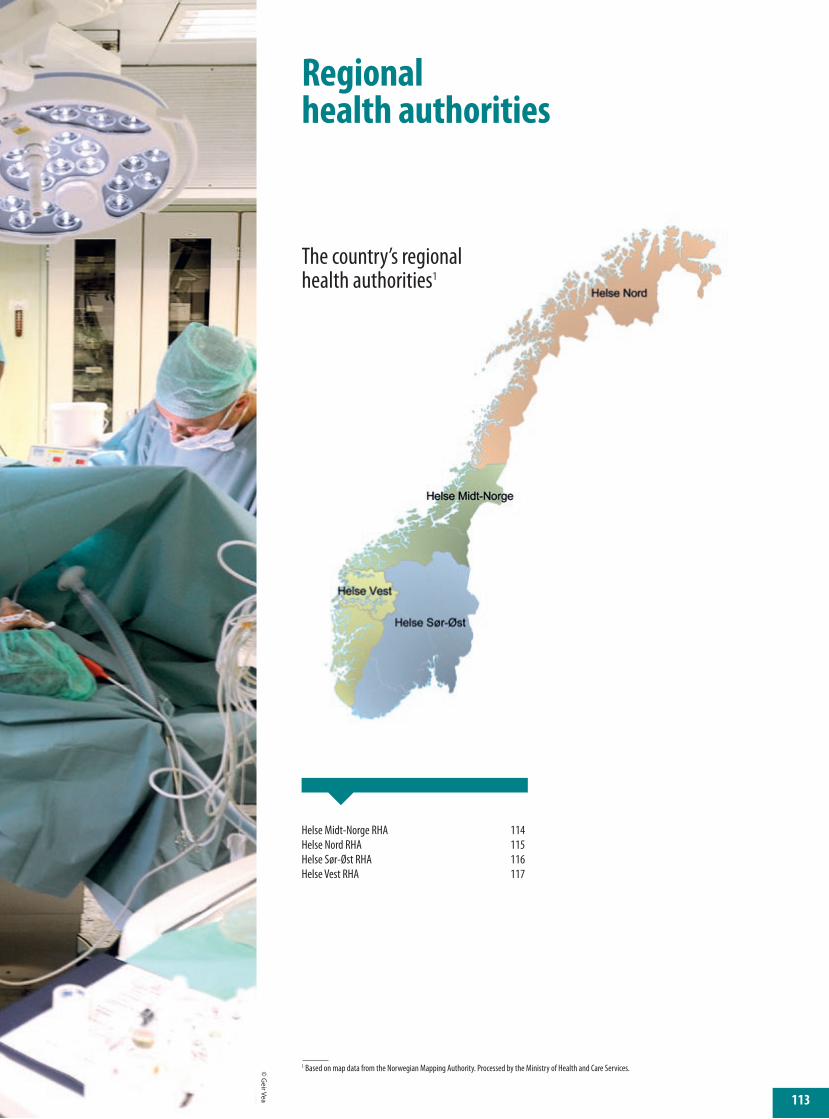
113
Regional health authorities
Helse Midt-Norge RHA 114Helse Nord RHA 115Helse Sør-Øst RHA 116Helse Vest RHA 117
1 Based on map data from the Norwegian Mapping Authority. Processed by the Ministry of Health and Care Services.
The country’s regional health authorities1
© G
eir Vea

114
Income statement (NOK millions) 2015 2014Operating revenues 21 080 18 799Operating expenses 20 635 16 494Operating profit/loss 445 2 305Net financial items -49 -53Tax charge 3 0Profit/loss for the year 393 2 252Exempt from performance requirement 0 0Performance requirements set by the Ministry of Health and Care Services 0 1 449 Deviation from performance requirements set by the Ministry of Health and Care Services 393 802 Balance sheet 2015 2014Intangible assets 467 427Fixed assets 13 262 13 667Financial fixed assets 2 308 3 293Total fixed assets 16 037 17 388Stock of goods 243 245Receivables 751 623Bank deposits, cash, etc. 2 628 1 894Total current assets 3 622 2 762Total assets 19 659 20 149 Paid-in equity 6 485 6 485Retained earnings 1 963 1 570Total equity 8 448 8 055Provisions for liabilities 3 865 4 013Other non-current liabilities 3 275 3 519Current liabilities 4 071 4 563Total debt and liabilities 11 211 12 094Total equity and liabilities 19 659 20 149 Cash flow 2015 2014Operating activities 2 093 741Investment activities -594 -882Financing activities -765 -396Change cash and cash equivalents 734 -537 Key figures 2015 2014Population under Helse Midt-Norge RHF’s “care provider” responsibility 709 504 709 504Number of out-patient consultations, somatic 916 924 879 114Number of patients discharged from in-patient treatment in psychiatric health care 7 602 7 663Number of out-patient contacts in psychiatric health care 288 093 269 246Number of patients discharged from interdisciplinary specialised inpatient treatment for substance abuse 2 037 1 825Number of outpatient concacts for substance abuse 40 529 37 492Number of days average waiting time (NPR) 67 72 Subsidies/public procurements 2015 2014From the state 19 473 16 471Municipal funding 0 775Total 19 473 17 247 Additional information 2015 2014Number of full-time equivalents (FTE) in the health trust group 15 877 15 160State ownership at year-end 100 % 100 %Proportion of women on the board 44 % 44 %Proportion of women among owner-appointed/shareholder elected board members 50 % 50 %
Helse Midt-Norge RHF, Central Nor-way Regional Health Authority, was estab-lished in 2002 and has overall responsibil-ity for ensuring the inhabitants of the counties Sør-Trøndelag, Møre og Roms-dal and Nord-Trøndelag access to high-quality specialist health services on a level comparable with other parts of the coun-try. The health region comprises Møre og Romsdal Hospital Trust, St. Olavs Hospi-tal Trust, Nord-Trøndelag Hospital Trust and the Central Norway Hospital Pharma-cies. The Helse Midt-Norge RHF has its head office in Stjørdal. The health region’s vision is “Teaming with you for your health”, based on the core values of quali-ty, security and respect.
The Helse Midt-Norge RHF has long-term agreements with a number of private suppliers of health services. In 2015 Helse Midt-Norge RHF purchased external health services for a value of approx. NOK 2 billion, which is about 9.5% of its operat-ing expenses. The terms for allocations to the regional health authorities are set out in special regulatory documents.
Important eventsThe health trust group has worked sys-tematically to reduce waiting times and eliminate breaches of maximum waiting time. Never before have waiting times in the health region been so short and breaches of maximum waiting time so few. At the end of the year, the average waiting time for people who had started treatment was 56 days. Average waiting time for the year as a whole was 67 days. The number of cases of exceeded maxi-mum waiting time has also been reduced significantly, and the health trusts are now close to reaching the target of zero exceeded waiting times.
Following the decision of December 2014 to locate the new joint hospital for Nordmøre and Romsdal in Hjelset in Mol-de municipality, work has been conducted to choose a concept for the project in 2015. The design phase is scheduled to be completed in 2016. The new Nordmøre og Romsdal Hospital will replace the current services at Molde Hospital and Kristian-
sund Hospitals. The project also includes planning for a district medical centre in Kristiansund.
From 1 January 2015 ambulance opera-tions in the health region were transferred from the Central Norway Ambulance Trust to the three hospital trusts in the region.
The Helse Midt-Norge RHF is in the process of compiling a basis for a decision on the procurement of a new medical re-cords system. The hospitals’ patient ad-ministration systems and electronic medi-cal records are to be replaced, and work is already under way to enter into binding agreements with municipalities in central Norway. The Helse Midt-Norge RHF and municipal authorities want a common so-lution for all the health services in central Norway. The aim is to introduce a com-mon system for the specialist health ser-vices and the municipalities by 2022.
In 2015 there were about 130 ongoing PhD projects and close to 80 post-doctoral and research positions in the health re-gion.
Corporate social responsibilityWork on environmental performance and corporate social responsibility is continu-ing at Helse Midt-Norge RHF. All of the regional health authorities, including Helse Midt-Norge RHF, have achieved en-vironmental certification pursuant to NS – EN ISO 14001:2004. The Helse Midt-Norge RHF conducts annual external au-dits to verify compliance with the environ-mental management system in line with the standard and that there is a continu-ous improvement. The Helse Midt-Norge RHF has guidelines for exercise of corpo-rate social responsibility and ethical guidelines. Anti-corruption was included in a revision of the ethical guidelines in March 2016.
Financial developmentThe recorded profit for 2015 for the health trust group was NOK 393 million. The owner’s performance requirement was a break-even financial result.
The state’s ownership interest through the Ministry of Health and Care Services: 100 %Company website: www.helse-midt.no
CEO: Stig Arild Slørdahl
Board: Ola Henrik Strand (chair), Paul Steinar Valle (deputy chair), Brit Tove Welde, Vigdis Harsvik, Tore Kristiansen, Liv Stette, Ellen Marie Wøhni*, Ivar Østrem*, Randulf Søberg* (* employee-elected)
Auditor: BDO AS
© Kristin Støylen
Helse Midt-Norge RHF

115
Income statement (NOK millions) 2015 2014Operating revenues 17 209 15 102Operating expenses 16 634 13 509Operating profit/loss 575 1 593Net financial items 42 72Tax charge 1 0Profit/loss for the year 617 1 665Exempt from performance requirement 0 0Performance requirements set by the Ministry of Health and Care Services 0 1 301Deviation from performance requirements set by the Ministry of Health and Care Services 617 363 Balance sheet 2015 2014Intangible assets 498 354Fixed assets 11 238 10 317Financial fixed assets 1 460 2 141Total fixed assets 13 196 12 812Stock of goods 185 182Receivables 540 544Bank deposits, cash, etc. 2 437 1 891Total current assets 3 162 2 616Total assets 16 358 15 428 Paid-in equity 7 921 7 921Retained earnings 1 706 1 090Total equity 9 627 9 011Provisions for liabilities 434 368Other non-current liabilities 2 692 2 429Current liabilities 3 605 3 621Total debt and liabilities 6 731 6 418Total equity and liabilities 16 358 15 428 Cash flow 2015 2014Operating activities 2 032 749Investment activities -1 856 -1 789Financing activities 369 643Change cash and cash equivalents 546 -397 Key figures 2015 2014Population under Helse Nord RHF’s “care provider” responsibility 481 994 480 740Number of out-patient consultations, somatic 479 317 465 728Number of patients discharged from in-patient treatment in psychiatric health care 6 680 6 563Number of out-patient contacts in psychiatric health care 202 401 188 774Number of patients discharged from interdisciplinary specialised inpatient treatment for substance abuse 1 075 1 102Number of outpatient concacts for substance abuse 14 143 12 832Number of days average waiting time (NPR) 75 75 Subsidies/public procurements 2015 2014From the state 16 200 13 747Municipal funding 0 533Total 16 200 14 281 Additional information 2015 2014Number of full-time equivalents (FTE) in the health trust group 13 359 13 219State ownership at year-end 100 % 100 %Proportion of women on the board 60 % 60 %Proportion of women among owner-appointed/shareholder elected board members 57 % 57 %
Helse Nord RHF, Northern Norway Re-gional Health Authority, was established in 2002 and has overall responsibility for ensuring the inhabitants of northern Nor-way and Svalbard access to high-quality specialist health services on a level com-parable with other parts of the country. This health region comprises Finnmark Hospital Trust, University Hospital of North Norway Trust, Nordland Hospital Trust, Helgeland Hospital Trust and Hos-pital Pharmacy of North Norway Trust. The Helse Nord RHF has its head office in Bodø. The Helse Nord RHF has long-term agreements with a number of private sup-pliers of health services. In 2015 Helse Nord RHF purchased external health ser-vices for a value of approx. NOK 0.7 bil-lion, which is roughly 4% of its operating expenses.
The terms for allocations to the region-al health authorities are set out in special regulatory documents.
Important eventsIn 2015 Helse Nord RHF put a huge amount of work into introducing the can-cer care pathway. The results have been good, and in 2015 a total of 28 pathways were introduced. There have been signifi-cant and systematic efforts to reduce the number of breaches of maximum waiting time and to reduce waiting times during
2015. There was a substantial decrease in the number of breaches of maximum wait-ing time in 2015, and this work will contin-ue into 2016.
In 2015 Helse Nord RHF opened a new patient hotel in Tromsø. The hotel has 17 floors including the basement, 243 hotel rooms and 488 hotel beds. The new pa-tient hotel provides a good service for pa-tients receiving outpatient care at the Uni-versity Hospital of North Norway in Tromsø.
Corporate social responsibilityThe Helse Nord RHF has introduced envi-ronmental management, and all the health trusts are now ISO 14001 certified. The Helse Nord RHF is a member of the Nor-wegian recycling scheme Grønt Punkt and the Ethical Trading Initiative.
Financial developmentThe Helse Nord RHF budgets to operate with a surplus in order to have the flexibil-ity it needs for necessary investments. The health trust group has achieved this every year since 2009. The health trust group recorded a surplus of NOK 617 mil-lion for 2015, which is NOK 217 million higher than the board’s performance re-quirement and NOK 617 million higher than the owner’s performance require-ment.
CEO: Lars Vorland
Board: Marianne Telle (chair), Inger Lise Strøm (deputy chair), Svenn Are Jenssen, Line Miriam Sandberg, Arnfinn Sundsfjord, Jonny-Leo Jernsletten, Kari Jørgensen, Eirik S. Holand*, Sissel Alterskjær*, Kari B. Sandnes* (* employee-elected)
Auditor: KPMG AS
The state’s ownership interest through the Ministry of Health and Care Services: 100 %Company website: www.helse-nord.no
© G
eir Vea
Helse Nord RHF

116
Helse Sør-Øst RHF, South-Eastern Re-gional Health Authority, was established in 2007 and has its head office in Hamar. The regional national health authority shall ensure that the inhabitants of the counties Østfold, Akershus, Oslo, Hed-mark, Oppland, Buskerud, Vestfold, Tele-mark, Aust-Agder and Vest-Agder have access to high-quality specialist health services on a level comparable with other parts of the country.
The regional health authority consists of Akershus University Hospital Trust, Oslo University Hospital Trust, Sunnaas Rehabilitation Hospital Trust, Hospital Pharmacies Trust, Vestfold Hospital Trust, Innlandet Hospital Trust, Tele-mark Hospital Trust, Østfold Hospital Trust, Sykehuspartner (a supplier of med-ical services), Sørlandet Hospital Trust and Vestre Viken Hospital Trust.
The health trusts’ main functions are performed at the publicly owned hospi-tals, but there are also requirements for good cooperation between private and public health services to ensure better uti-lisation of available capacity and to give patients greater freedom of choice. The Helse Sør-Øst RHF has long-term agree-ments with a number of private suppliers. In 2015 external health services for a val-ue of approx. NOK 4.5 billion were pur-chased, equivalent to 5.7% of the operating costs.
In addition to ensuring high-quality specialist health services on a level com-parable with other parts of the country, Helse Sør-Øst RHF also has statutory functions in research, education, and training of patients and next-of-kin.
Important eventsThere has been growth in activity within all the service areas in the South-Eastern Norway health region in 2015. Active steps are being taken to meet the require-ment for greater growth in psychiatric health care and interdisciplinary special-ised alcohol and substance abuse treat-ment (TSB) than in somatic health care.
Much of the work in 2015 to reduce waiting times targeted the groups that have had to wait the longest. The health region achieved a significant reduction in average waiting time, but it did not reach the national target of no more than 65 days.
The share of exceeded maximum wait-ing time was reduced in 2015, but is still above the goal of zero breaches of guaran-teed maximum waiting time. The largest proportion of exceeded maximum waiting times is in somatic services, but there was also a high proportion of breaches of max-imum waiting time at private institutions
for psychiatric services for children and young people and interdisciplinary spe-cialised alcohol and substance abuse treatment (TSB).
In November 2015 all the services at the hospital in Fredrikstad were transferred to Østfold Hospital in Kalnes. The new hospi-tal was officially opened by H.M. King Harald on 30 November. With an invest-ment of NOK 6.1 billion, the new hospital was completed without overrunning the budget and half a year ahead of schedule.
Corporate social responsibilityThe Helse Sør-Øst RHF publishes a sepa-rate environmental and CSR report, cov-ering topics such as the environment and climate change, human rights, employee rights, social conditions and anti-corrup-tion.
All the hospital trusts are going to imple-ment a standardised environmental man-agement system. At the end of 2015 ten out of eleven hospital trusts had achieved envi-ronmental certification pursuant to ISO 14001 certification. Oslo University Hospital Trust will be certified in 2016.
The health trust group, which spends a total of NOK 25 billion per annum on goods and services, has ethical guidelines for procurements and supplier contact. The Helse Sør-Øst RHF is a member of the Ethical Trading Initiative and has committed to work actively to ensure im-provements in labour rights, human rights and environmental protection in the production of the goods and services it uses. In 2015 several acquisitions were followed up with inspections and verifica-tion throughout the entire supply chain to the final production sites. Suppliers who want to deliver to Helse Sør-Øst RHF must be a member of the Norwegian recycling scheme Grønt Punkt Norge or similar.
Financial developmentWith a view to being able to provide good, future-oriented health care in the years ahead, positive financial results must be generated within a given framework to en-able investments. The recorded profit for 2015 for the health trust group was NOK 1 billion. The owner’s performance require-ment was a break-even financial result.
CEO: Cathrine Marie Lofthus
Board: Ann-Kristin Olsen (chair), Anne Cathrine Frøstrup (deputy chair), Eyolf Bakke, Bernadette Kumar, Geir Nilsen, Truls Velgaard, Sigrun Elisabeth Vågeng, Kirsten Brubakk*, Terje Bjørn Keyn*, Svein Øverland* (* employee-elected)
Auditor: PricewaterhouseCoopers AS
The state’s ownership interest through the Ministry of Health and Care Services: 100 %Company website: www.helse-sorost.no
© Sykehuset Ø
stfold
Income statement (NOK millions) 2015 2014Operating revenues 78 925 69 500Operating expenses 77 849 63 243Operating profit/loss 1 077 6 257Net financial items -28 -4Tax charge 2 1Profit/loss for the year 1 046 6 252Exempt from performance requirement 0 0Performance requirements set by the Ministry of Health and Care Services 0 5 436 Deviation from performance requirements set by the Ministry of Health and Care Services 1046 816 Balance sheet 2015 2014Intangible assets 3 041 2 657Fixed assets 42 852 42 439Financial fixed assets 10 722 13 611Total fixed assets 56 615 58 708Stock of goods 470 488Receivables 2 113 1 864Bank deposits, cash, etc. 2 922 3 541Total current assets 5 506 5 893Total assets 62 120 64 601 Paid-in equity 32 471 32 471Retained earnings 35 -1 026Total equity 32 506 31 445Provisions for liabilities 5 046 4 765Other non-current liabilities 9 113 9 146Current liabilities 15 456 19 245Total debt and liabilities 29 614 33 156Total equity and liabilities 62 120 64 601 Cash flow 2015 2014Operating activities 7 000 1 001Investment activities -4 102 -6 464Financing activities -3 517 3 924Change cash and cash equivalents -619 -1 539 Key figures 2015 2014Population under Helse Sør-Øst RHF’s “care provider” responsibility 2 900 000 2 900 000Number of out-patient consultations, somatic 2 754 834 2 640 849Number of patients discharged from in-patient treatment in psychiatric health care 26 909 27 061Number of out-patient contacts in psychiatric health care 1 334 817 1 266 079Number of patients discharged from interdisciplinary specialised inpatient treatment for substance abuse 8 641 8 394Number of outpatient concacts for substance abuse 238 429 218 361Number of days average waiting time (NPR) 68 73 Subsidies/public procurements 2015 2014From the state 72 424 61 090Municipal funding 0 3 088Total 72 424 64 178 Additional information 2015 2014Number of full-time equivalents (FTE) in the health trust group 59 788 58 627State ownership at year-end 100 % 100 %Proportion of women on the board 50 % 57 %Proportion of women among owner-appointed/shareholder elected board members 57 % 43 %
Helse Sør-Øst RHF

117
Helse Vest RHF, Western Norway Re-gional Health Authority, was established in 2002 and has overall responsibility for ensuring the inhabitants of the counties Rogaland, Hordaland and Sogn og Fjor-dane access to high-quality specialist health services on a level comparable with other parts of the country. The health re-gion comprises Førde Hospital Trust, Ber-gen Hospital Trust, Fonna Hospital Trust, Stavanger Hospital Trust, Trust Sjukehu-sapoteka Vest (Hospital Pharmacies), Trust Helse Vest Procurement and Helse Vest IKT. The Helse Vest RHF has its head office in Stavanger.
The Helse Vest RHF has long-term agreements with a number of private sup-pliers of health services. In 2015 Helse Vest RHF purchased external health ser-vices for a value of approx. NOK 2.8 bil-lion, which is about 10.3% of its operating expenses.
The terms for allocations to the region-al health authorities are set out in special regulatory documents. The Helse Vest RHF’s vision is to promote health and quality of life.
Important eventsIn 2015 Helse Vest RHF achieved good re-sults in terms of quality and financial per-formance, two crucial preconditions for safe, good health care services. Priority areas in 2015 include a focus on good dia-logue between patients and hospitals, bet-ter organisation, patient safety and build-ing of common systems, and have helped to strengthen the health service for pa-tients.
The hospitals in western Norway treat-ed more patients in 2015 than ever before, while waiting times were shorter. In 2015 hospitals and institutions in western Nor-way carried out a total of 1,635,208 consul-tations. There were some 176,000 more patient contacts in outpatient and day treatment, all areas, in 2015 than the pre-vious year.
Efforts to enhance quality and improve
patient safety in the hospitals were key priority areas in health trust group, along with occupational health and safety. Through selected priority areas the hospi-tals shall facilitate better patient care, fewer injuries and safeguarding of patient safety. In 2015 several of the packages of measures in the programme for patient safety were implemented at all the hospi-tals and relevant institutions. All the hos-pitals in the health region now report on a series of quality indicators.
In 2015 new legislation allowed the health trusts to establish shared health registers for multiple legal entities. The Helse Vest RHF was the first health re-gion in the country to merge the four re-cord systems into a single database. All the hospitals have access to the same in-formation, and it is now far easier to get patient information to follow the patient throughout their care so that information is available when it is needed.
Corporate social responsibilityThe Helse Vest RHF has publicly available ethical guidelines and follows company-specific and industry-oriented guidelines in its reporting. Principles and practices concerning transparency apply to all the health trusts. All the health trusts in the health region are environmentally certi-fied. Certification according to the ISO standard shows that the trust has intro-duced environmental management and an environmental management system, which are instruments to achieve the goal of more environmentally friendly opera-tions.
Financial developmentThe health trust group achieved a com-bined surplus of NOK 680 million. The result for Helse Vest RHF is a surplus of NOK 664 million, and this is the seventh consecutive year that Helse Vest RHF has delivered a profit. This strengthens the authority’s ability to invest and benefits patients and employees.
CEO: Herlof Nilssen
Board: Terje Vareberg (chair), Lise Reinertsen (deputy chair), Ohene Aboagye, Gunnar Berge, Tone Berntsen Steinsvåg, Olin Johanne Henden, Lise Karin Strømme*, Bente Pilskog*, Tom Guldhav* (* employee-elected)
Auditor: EY AS
The state’s ownership interest through the Ministry of Health and Care Services: 100 %Company website: www.helse-vest.no
© H
else Vest RHA
/Eivind Senneset
Income statement (NOK millions) 2015 2014Operating revenues 27 724 24 385 Operating expenses 27 113 21 746 Operating profit/loss 611 2 639Net financial items 68 70Tax charge -1 0Profit/loss for the year 680 2 709Exempt from performance requirement 0 0Performance requirements set by the Ministry of Health and Care Services 0 1 913 Deviation from performance requirements set by the Ministry of Health and Care Services 680 796 Balance sheet 2015 2014Intangible assets 621 554 Fixed assets 14 410 13 891 Financial fixed assets 2 549 3 635 Total fixed assets 17 580 18 080Stock of goods 112 105 Receivables 718 639 Bank deposits, cash, etc. 3 547 3 077 Total current assets 4 377 3 821Total assets 21 957 21 901 Paid-in equity 10 630 10 630 Retained earnings 2 685 2 007 Total equity 13 315 12 637Provisions for liabilities 958 686 Other non-current liabilities 2 375 2 370 Current liabilities 5 309 6 208 Total debt and liabilities 8 642 9 264Total equity and liabilities 21 957 21 901 Cash flow 2015 2014Operating activities 2 875 1 180 Investment activities -1 799 -1 971 Financing activities -607 1 107 Change cash and cash equivalents 469 316 Key figures 2015 2014Population under Helse Vest RHF’s “care provider” responsibility 1 096 202 1 086 829Number of out-patient consultations, somatic 1 033 266 969 198Number of patients discharged from in-patient treatment in psychiatric health care 11 722 11 615Number of out-patient contacts in psychiatric health care 431 448 393 424Number of patients discharged from interdisciplinary specialised inpatient treatment for substance abuse 2 643 2 220Number of outpatient concacts for substance abuse 143 672 77 206Number of days average waiting time (NPR) 66 69 Subsidies/public procurements 2015 2014From the state 26 150 22 017Municipal funding 0 984Total 26 150 23 001
Additional information 2015 2014Number of full-time equivalents (FTE) in the health trust group 21 379 20 735State ownership at year-end 100 % 100 %Proportion of women on the board 56 % 60 %Proportion of women among owner-appointed/shareholder elected board members 50 % 50 %
Helse Vest RHF
118
© Erik Berg
Other companiesFilmparken ASThe company offers facilities for record-ing films, including studios and offices, in Jar in Bærum. The state, represented by the Ministry of Culture, owns 77.6% of the shares in Filmparken, and the City of Oslo owns 11.6%. The remaining 10.8% of the shares are owned by about 80 municipali-ties and a bank.
Filmparken’s buildings were built in the period 1935–1995 and are of varying technical and architectural standards. Two of the studios are of possible cultural heritage interest. Following a complaint to the EFTA Surveillance Authority (ESA) in 2006, it became clear that the state can-not subsidise the company for reasons of fair competition. Filmparken has not man-aged to make a sufficient profit to be able to maintain and develop the property, and the buildings are currently run-down and outdated.
The state has been involved in film pro-duction and studio operations at Jar since 1948, when the state bought shares in the municipally owned company Norsk Film AS and its subsidiary Norwegian Filmstu-dio AS. In 2001 the state sold Norsk Film AS (the film production company), but re-tained a majority holding in the film stu-dios and the property that are currently administered by Filmparken.
The Storting has authorised the state to sell Filmparken. In the national budget for 2014, the Storting concluded that ”... the state shall no longer be bound by the obliga-tion to ensure studio operations for produc-tion of feature films, since the facilities at Jar are not used for the production of feature films and thus no longer support cultural policy considerations. The state ought there-fore to be allowed to terminate its ownership in Filmparken.” The Storting has author-ised the Ministry of Culture to sell the state’s shares in Filmparken in the national budgets for 2015 and 2016.
FolketrygdfondetFolketrygdfondet is a special-legislation company that manages the Government Pension Fund Norway (GPFN) in ac-cordance with specific management pro-visions set out by the Ministry of Fi-nance. The company is wholly owned by the state through the Ministry of Fi-nance. The establishment of the special-legislation company Folketrygdfondet in 2008 underscored the distinction be-tween the GPFN as the asset pool and Folketrygdfondet as the entity manag-ing this asset pool. The GPFN is placed as a capital contribution with Folketryg-dfondet. At the end of 2015 GPFN had a market value of NOK 198 billion. Folket-rygdfondet makes investment decisions
and exercises ownership rights inde-pendently of the Ministry of Finance.
The objective of the GPFN is to achieve the highest possible return measured in Norwegian kroner and after costs. The re-turn is not transferred to the Treasury, but is added to the fund capital on an on-going basis.
Folketrygdfondet invests the GPFN in listed shares and bonds in Norway, Swe-den, Denmark and Finland. The company is one of the largest financial investors on the Oslo Stock Exchange. The Norwegian equity investments correspond to about 5% of the total market value listed on the stock exchange, and the average stake in Norwegian shares that Folketrygdfondet was invested in at year-end 2015 was 5.8%. At the same date Folketrygdfondet had 52 employees located in Oslo.
Olaug Svarva is the CEO of Folketrygd-fondet. The Board consists of the following owner-appointed members: Erik Keiserud (chair), Siri Teigum (deputy chair), Mari-anne Hansen, Renate Larsen, Einar Westby, Hans Aasnæs and Bernt Arne Ødegaard. Henrik Fosby is the employee-elected board member.
For more information on Folketrygd-fondet, see the company’s website www.folketrygdfondet.no, the white paper Re-port no. 23 (2015–2016) Management of the Government Pension Fund in 2015 and report no. 29 (2015–2016) Financial Market Report 2015.
Rosenkrantzgate 10 ASRosenkrantzgate 10 is a property compa-ny whose only asset is the property with the address Rosenkrantzgate 10. The company’s activities are related to the lease of premises in this property. The building houses Oslo Nye Teater, which has a preferential right to lease premises in the building.
The company’s share capital amounts to NOK 651,450 and is divided into 13,029 shares with a nominal value of NOK 50. The state, through the Ministry of Culture, owns 3.07% of the shares. The City of Oslo is the majority shareholder with 78.89% of the shares, while 16.69% of the shares are owned by unknown shareholders.
The state’s shareholding is a result of previous involvement in / ownership of Oslo Nye Teater, which the City of Oslo now owns in full. The Ministry of Culture has previously tried to sell its shares to the City of Oslo, but the latter has not been willing to buy them as long as the chal-lenge related to many unknown sharehold-ers is unresolved and until it can take over full ownership. The board has now taken new steps to resolve the challenges associ-ated with the unknown shareholders.

119
Den Norsk Opera & Ballett is Norway’s largest institution for music and the dramatic arts and shall present operas, ballets and concerts of the highest artistic quality.
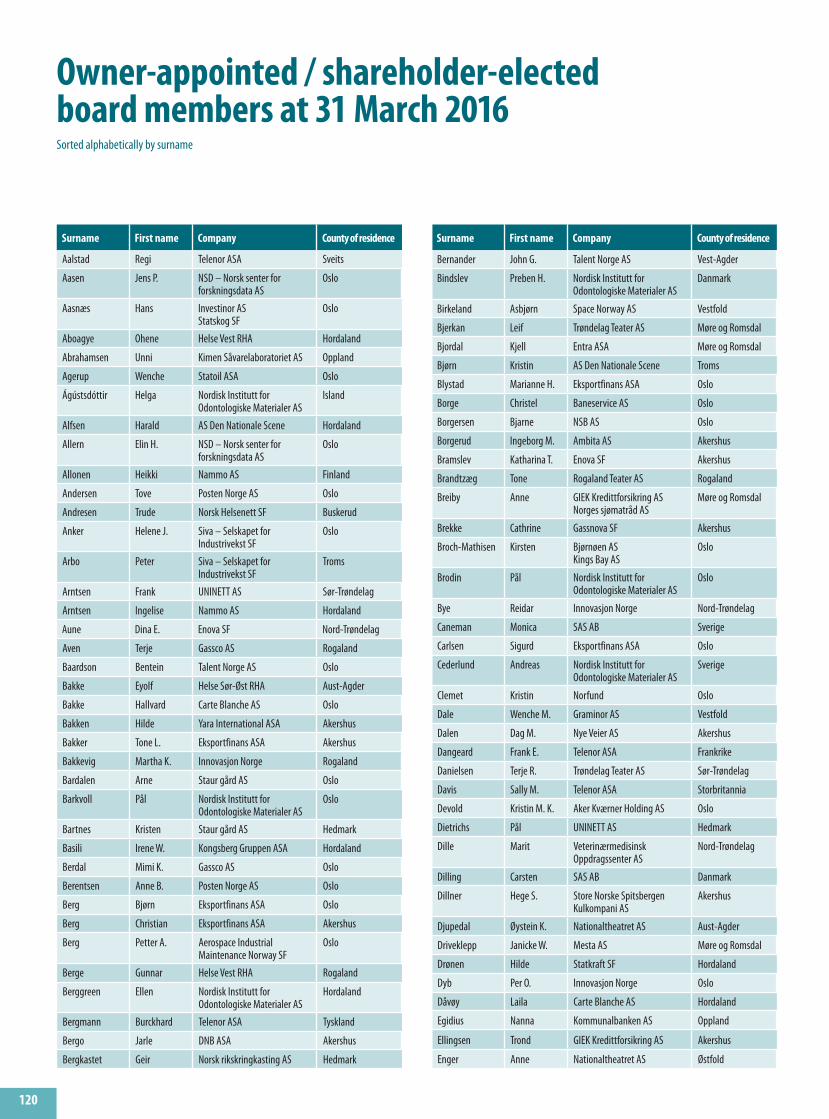
120
Owner-appointed / shareholder-elected board members at 31 March 2016
Surname First name Company County of residence
Aalstad Regi Telenor ASA Sveits
Aasen Jens P. NSD – Norsk senter for forskningsdata AS
Oslo
Aasnæs Hans Investinor AS Statskog SF
Oslo
Aboagye Ohene Helse Vest RHA Hordaland
Abrahamsen Unni Kimen Såvarelaboratoriet AS Oppland
Agerup Wenche Statoil ASA Oslo
Ágústsdóttir Helga Nordisk Institutt for Odontologiske Materialer AS
Island
Alfsen Harald AS Den Nationale Scene Hordaland
Allern Elin H. NSD – Norsk senter for forskningsdata AS
Oslo
Allonen Heikki Nammo AS Finland
Andersen Tove Posten Norge AS Oslo
Andresen Trude Norsk Helsenett SF Buskerud
Anker Helene J. Siva – Selskapet for Industrivekst SF
Oslo
Arbo Peter Siva – Selskapet for Industrivekst SF
Troms
Arntsen Frank UNINETT AS Sør-Trøndelag
Arntsen Ingelise Nammo AS Hordaland
Aune Dina E. Enova SF Nord-Trøndelag
Aven Terje Gassco AS Rogaland
Baardson Bentein Talent Norge AS Oslo
Bakke Eyolf Helse Sør-Øst RHA Aust-Agder
Bakke Hallvard Carte Blanche AS Oslo
Bakken Hilde Yara International ASA Akershus
Bakker Tone L. Eksportfinans ASA Akershus
Bakkevig Martha K. Innovasjon Norge Rogaland
Bardalen Arne Staur gård AS Oslo
Barkvoll Pål Nordisk Institutt for Odontologiske Materialer AS
Oslo
Bartnes Kristen Staur gård AS Hedmark
Basili Irene W. Kongsberg Gruppen ASA Hordaland
Berdal Mimi K. Gassco AS Oslo
Berentsen Anne B. Posten Norge AS Oslo
Berg Bjørn Eksportfinans ASA Oslo
Berg Christian Eksportfinans ASA Akershus
Berg Petter A. Aerospace Industrial Maintenance Norway SF
Oslo
Berge Gunnar Helse Vest RHA Rogaland
Berggreen Ellen Nordisk Institutt for Odontologiske Materialer AS
Hordaland
Bergmann Burckhard Telenor ASA Tyskland
Bergo Jarle DNB ASA Akershus
Bergkastet Geir Norsk rikskringkasting AS Hedmark
Surname First name Company County of residence
Bernander John G. Talent Norge AS Vest-Agder
Bindslev Preben H. Nordisk Institutt for Odontologiske Materialer AS
Danmark
Birkeland Asbjørn Space Norway AS Vestfold
Bjerkan Leif Trøndelag Teater AS Møre og Romsdal
Bjordal Kjell Entra ASA Møre og Romsdal
Bjørn Kristin AS Den Nationale Scene Troms
Blystad Marianne H. Eksportfinans ASA Oslo
Borge Christel Baneservice AS Oslo
Borgersen Bjarne NSB AS Oslo
Borgerud Ingeborg M. Ambita AS Akershus
Bramslev Katharina T. Enova SF Akershus
Brandtzæg Tone Rogaland Teater AS Rogaland
Breiby Anne GIEK Kredittforsikring AS Norges sjømatråd AS
Møre og Romsdal
Brekke Cathrine Gassnova SF Akershus
Broch-Mathisen Kirsten Bjørnøen AS Kings Bay AS
Oslo
Brodin Pål Nordisk Institutt for Odontologiske Materialer AS
Oslo
Bye Reidar Innovasjon Norge Nord-Trøndelag
Caneman Monica SAS AB Sverige
Carlsen Sigurd Eksportfinans ASA Oslo
Cederlund Andreas Nordisk Institutt for Odontologiske Materialer AS
Sverige
Clemet Kristin Norfund Oslo
Dale Wenche M. Graminor AS Vestfold
Dalen Dag M. Nye Veier AS Akershus
Dangeard Frank E. Telenor ASA Frankrike
Danielsen Terje R. Trøndelag Teater AS Sør-Trøndelag
Davis Sally M. Telenor ASA Storbritannia
Devold Kristin M. K. Aker Kværner Holding AS Oslo
Dietrichs Pål UNINETT AS Hedmark
Dille Marit Veterinærmedisinsk Oppdragssenter AS
Nord-Trøndelag
Dilling Carsten SAS AB Danmark
Dillner Hege S. Store Norske Spitsbergen Kulkompani AS
Akershus
Djupedal Øystein K. Nationaltheatret AS Aust-Agder
Driveklepp Janicke W. Mesta AS Møre og Romsdal
Drønen Hilde Statkraft SF Hordaland
Dyb Per O. Innovasjon Norge Oslo
Dåvøy Laila Carte Blanche AS Hordaland
Egidius Nanna Kommunalbanken AS Oppland
Ellingsen Trond GIEK Kredittforsikring AS Akershus
Enger Anne Nationaltheatret AS Østfold
Sorted alphabetically by surname

121
Surname First name Company County of residence
Enger Einar Innovasjon Norge Oslo
Eriksen Øyvind Aker Kværner Holding AS Oslo
Esfandiari Ardashir Rogaland Teater AS Rogaland
Espedal Harald Den Norske Opera & Ballett AS Rogaland
Espedal Rune Norsk Helsenett SF Rogaland
Fagernæs Sven O. Bjørnøen AS Kings Bay AS
Oslo
Falck Thomas Investinor AS Oslo
Falleth Eva Universitetssenteret på Svalbard AS
Oslo
Fjeld Jostein Graminor AS Kimen Såvarelaboratoriet AS
Hedmark
Fjeldstad Trude H. Petoro AS Belgia
Fjell Olav Nofima AS Statkraft SF
Akershus
Flatland Bjørn Veterinærmedisinsk Oppdragssenter AS
Oslo
Flåthen Knut O. Electronic Chart Centre AS Oslo
Forsell Odd J. Rogaland Teater AS Rogaland
Fossli Grethe Aerospace Industrial Maintenance Norway SF
Oslo
Fossum Anne K. Staur gård AS Hedmark
Fougner Else B. Aker Kværner Holding AS Eksportkreditt Norge AS Kommunalbanken AS
Oslo
Franklin Roy Statoil ASA Storbritannia
Frøstrup Anne C. Helse Sør-Øst RHA Buskerud
Fyllingen Kjerstin NSB AS Hordaland
Galtung Hilde K. Nordisk Institutt for Odontologiske Materialer AS
Akershus
Giske Eli Ambita AS Nye Veier AS
Akershus
Gjertsen Trygve Flytoget AS Oslo
Gjesteland Egil Statnett SF Buskerud
Godal Bjørn T. Statoil ASA Oslo
Gotaas Sverre Simula Research Laboratory AS Vestfold
Grimeland Kjell M. Argentum Fondsinvesteringer AS
Akershus
Grung Ruth Carte Blanche AS Hordaland
Gulbrandsen Erik Nordisk Institutt for Odontologiske Materialer AS
Akershus
Hald Morten Universitetssenteret på Svalbard AS
Troms
Halleraker Svein Carte Blanche AS Hordaland
Hansen David Norsk Tipping AS AS Vinmonopolet
Vestfold
Hansen Inge K. Norsk Hydro ASA Oslo
Hansen Svein I. Aerospace Industrial Maintenance Norway SF
Østfold
Hanssen Maria M. Yara International ASA Frankrike
Harsvik Vigdis Helse Midt-Norge RHA Sør-Trøndelag
Hasaas Olav Enova SF Akershus
Hatlen Siri B. Entra ASA Eksportkreditt Norge AS Nye Veier AS
Akershus
Havnelid Åsne NSB AS Akershus
Heggernes Pinar Simula Research Laboratory AS Hordaland
Heiberg Nina Graminor AS Sogn og Fjordane
Surname First name Company County of residence
Hekne Geir Universitetssenteret på Svalbard AS
Svalbard
Helno Sverre AS Vinmonopolet Oslo
Helliesen Ida Aker Kværner Holding AS Oslo
Henden Olin J. Helse Vest RHA Sogn og Fjordane
Henriksen Kai H. G. NSB AS Oslo
Henriksen Morten Kongsberg Gruppen ASA Aust-Agder
Herlofsen Rebekka G. Statoil ASA Oslo
Heyerdahl Jens P. Nationaltheatret AS Oslo
Hiorth Marianne Nordisk Institutt for Odontologiske Materialer AS
Oslo
Hjorth Per Statnett SF Oslo
Holen Borghild Norfund Oslo
Holm Tore Enova SF Akershus
Holst Aina Trøndelag Teater AS Sør-Trøndelag
Homble Synne Statnett SF Oslo
Hope Ole Carte Blanche AS AS Den Nationale Scene
Hordaland
Husebø Kristin R. Siva – Selskapet for Industrivekst SF
Rogaland
Husevåg Trude Eksportkreditt Norge AS Hordaland
Hustad Johan E. Gassco AS Sør-Trøndelag
Hustad Per-Olaf Petoro AS Rogaland
Hægeland Torbjørn NSD – Norsk senter for forskningsdata AS
Oslo
Hætta Ellen I. O. Norsk rikskringkasting AS Finnmark
Høiland Grethe Argentum Fondsinvesteringer AS
Rogaland
Håndlykken Einar Enova SF Telemark
Ibsen Mai-Lill GIEK Kredittforsking AS Oslo
Inderhaug Agnes Rogaland Teater AS Rogaland
Isaksen Geir P. Yara International ASA Akershus
Jarlsby Nicolai Electronic Chart Centre AS Vest-Agder
Jarnheimer Lars-Johan SAS AB Sverige
Jebsen Finn M. Kongsberg Gruppen ASA NorfundNorsk Hydro ASA
Oslo
Jenssen Svenn A. Andøya Space Center AS Helse Nord RHA
Nordland
Jernsletten Jonny-Leo Helse Nord RHA Finnmark
Johannessen Bernt B. Staur gård AS Akershus
Johnsen Marianne E. Norges sjømatråd AS Akershus
Justad Annette M. Store Norske Spitsbergen Kulkompani AS
Oslo
Jørgensen Kari Helse Nord RHA Finnmark
Kamsvåg Mette Siva – Selskapet for Industrivekst SF
Møre og Romsdal
Kanck Bjørn Andøya Space Center AS Troms
Kjeldstad Berit J. Universitetssenteret på Svalbard AS
Sør-Trøndelag
Kjølås Wenche Flytoget AS Innovasjon Norge
Hordaland
Knoff Tom Argentum Fondsinvesteringer AS
Akershus
Knudsen Cecilie B. Talent Norge AS Oslo
Knudsen Knud NSD – Norsk senter for forskningsdata AS
Rogaland
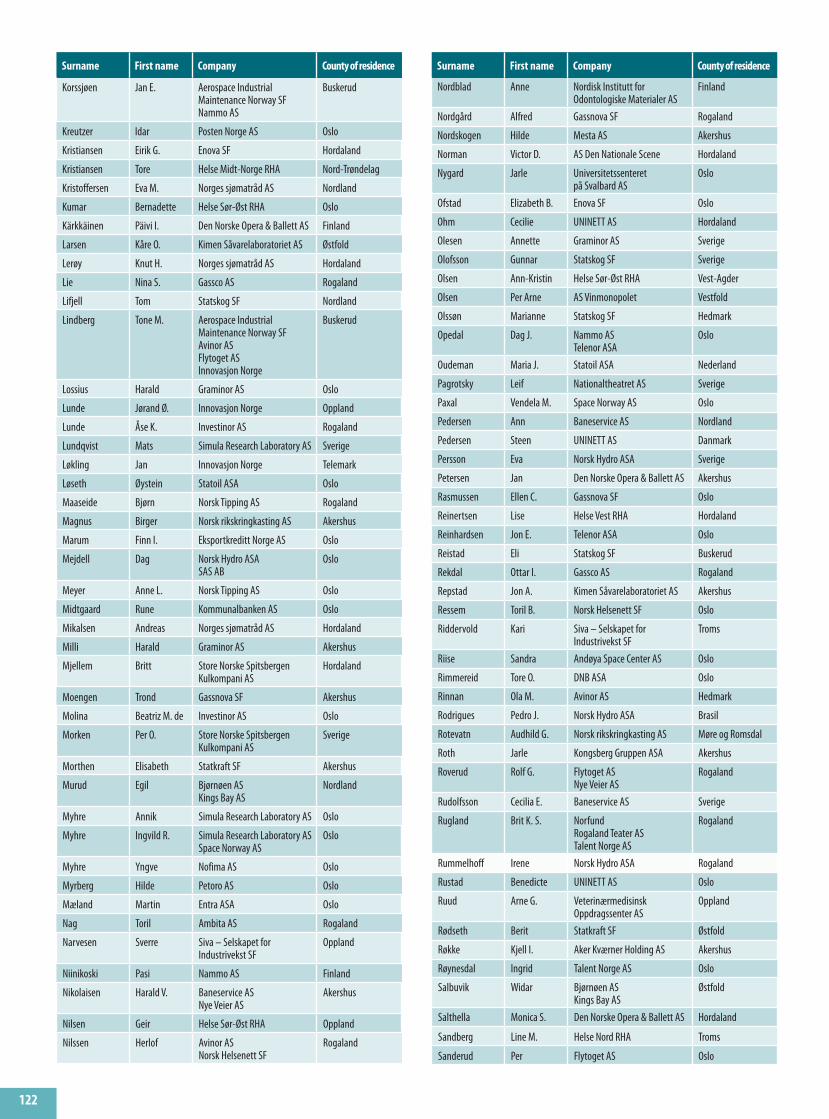
122
Surname First name Company County of residence
Korssjøen Jan E. Aerospace Industrial Maintenance Norway SF Nammo AS
Buskerud
Kreutzer Idar Posten Norge AS Oslo
Kristiansen Eirik G. Enova SF Hordaland
Kristiansen Tore Helse Midt-Norge RHA Nord-Trøndelag
Kristoffersen Eva M. Norges sjømatråd AS Nordland
Kumar Bernadette Helse Sør-Øst RHA Oslo
Kärkkäinen Päivi I. Den Norske Opera & Ballett AS Finland
Larsen Kåre O. Kimen Såvarelaboratoriet AS Østfold
Lerøy Knut H. Norges sjømatråd AS Hordaland
Lie Nina S. Gassco AS Rogaland
Lifjell Tom Statskog SF Nordland
Lindberg Tone M. Aerospace Industrial Maintenance Norway SF Avinor AS Flytoget AS Innovasjon Norge
Buskerud
Lossius Harald Graminor AS Oslo
Lunde Jørand Ø. Innovasjon Norge Oppland
Lunde Åse K. Investinor AS Rogaland
Lundqvist Mats Simula Research Laboratory AS Sverige
Løkling Jan Innovasjon Norge Telemark
Løseth Øystein Statoil ASA Oslo
Maaseide Bjørn Norsk Tipping AS Rogaland
Magnus Birger Norsk rikskringkasting AS Akershus
Marum Finn I. Eksportkreditt Norge AS Oslo
Mejdell Dag Norsk Hydro ASA SAS AB
Oslo
Meyer Anne L. Norsk Tipping AS Oslo
Midtgaard Rune Kommunalbanken AS Oslo
Mikalsen Andreas Norges sjømatråd AS Hordaland
Milli Harald Graminor AS Akershus
Mjellem Britt Store Norske Spitsbergen Kulkompani AS
Hordaland
Moengen Trond Gassnova SF Akershus
Molina Beatriz M. de Investinor AS Oslo
Morken Per O. Store Norske Spitsbergen Kulkompani AS
Sverige
Morthen Elisabeth Statkraft SF Akershus
Murud Egil Bjørnøen AS Kings Bay AS
Nordland
Myhre Annik Simula Research Laboratory AS Oslo
Myhre Ingvild R. Simula Research Laboratory AS Space Norway AS
Oslo
Myhre Yngve Nofima AS Oslo
Myrberg Hilde Petoro AS Oslo
Mæland Martin Entra ASA Oslo
Nag Toril Ambita AS Rogaland
Narvesen Sverre Siva – Selskapet for Industrivekst SF
Oppland
Niinikoski Pasi Nammo AS Finland
Nikolaisen Harald V. Baneservice AS Nye Veier AS
Akershus
Nilsen Geir Helse Sør-Øst RHA Oppland
Nilssen Herlof Avinor AS Norsk Helsenett SF
Rogaland
Surname First name Company County of residence
Nordblad Anne Nordisk Institutt for Odontologiske Materialer AS
Finland
Nordgård Alfred Gassnova SF Rogaland
Nordskogen Hilde Mesta AS Akershus
Norman Victor D. AS Den Nationale Scene Hordaland
Nygard Jarle Universitetssenteret på Svalbard AS
Oslo
Ofstad Elizabeth B. Enova SF Oslo
Ohm Cecilie UNINETT AS Hordaland
Olesen Annette Graminor AS Sverige
Olofsson Gunnar Statskog SF Sverige
Olsen Ann-Kristin Helse Sør-Øst RHA Vest-Agder
Olsen Per Arne AS Vinmonopolet Vestfold
Olssøn Marianne Statskog SF Hedmark
Opedal Dag J. Nammo AS Telenor ASA
Oslo
Oudeman Maria J. Statoil ASA Nederland
Pagrotsky Leif Nationaltheatret AS Sverige
Paxal Vendela M. Space Norway AS Oslo
Pedersen Ann Baneservice AS Nordland
Pedersen Steen UNINETT AS Danmark
Persson Eva Norsk Hydro ASA Sverige
Petersen Jan Den Norske Opera & Ballett AS Akershus
Rasmussen Ellen C. Gassnova SF Oslo
Reinertsen Lise Helse Vest RHA Hordaland
Reinhardsen Jon E. Telenor ASA Oslo
Reistad Eli Statskog SF Buskerud
Rekdal Ottar I. Gassco AS Rogaland
Repstad Jon A. Kimen Såvarelaboratoriet AS Akershus
Ressem Toril B. Norsk Helsenett SF Oslo
Riddervold Kari Siva – Selskapet for Industrivekst SF
Troms
Riise Sandra Andøya Space Center AS Oslo
Rimmereid Tore O. DNB ASA Oslo
Rinnan Ola M. Avinor AS Hedmark
Rodrigues Pedro J. Norsk Hydro ASA Brasil
Rotevatn Audhild G. Norsk rikskringkasting AS Møre og Romsdal
Roth Jarle Kongsberg Gruppen ASA Akershus
Roverud Rolf G. Flytoget AS Nye Veier AS
Rogaland
Rudolfsson Cecilia E. Baneservice AS Sverige
Rugland Brit K. S. Norfund Rogaland Teater AS Talent Norge AS
Rogaland
Rummelhoff Irene Norsk Hydro ASA Rogaland
Rustad Benedicte UNINETT AS Oslo
Ruud Arne G. Veterinærmedisinsk Oppdragssenter AS
Oppland
Rødseth Berit Statkraft SF Østfold
Røkke Kjell I. Aker Kværner Holding AS Akershus
Røynesdal Ingrid Talent Norge AS Oslo
Salbuvik Widar Bjørnøen AS Kings Bay AS
Østfold
Salthella Monica S. Den Norske Opera & Ballett AS Hordaland
Sandberg Line M. Helse Nord RHA Troms
Sanderud Per Flytoget AS Oslo

123
Surname First name Company County of residence
Sandsmark Maria Statnett SF Møre og Romsdal
Sandvik Tore O. Trøndelag Teater AS Sør-Trøndelag
Schur Fritz H. SAS AB Danmark
Schøyen Per A. Petoro AS Rogaland
Sellæg Gunnar Ambita AS Oslo
Selmer-Olsen Eirik Nofima AS Oslo
Semlitsch Jaan I. DNB ASA Akershus
Seres Silvija Simula Research Laboratory AS Akershus
Silseth Linda B. Norsk Tipping AS Akershus
Simonsen Grete L. Carte Blanche AS Hordaland
Sivertsen Svein Investinor AS Sør-Trøndelag
Sjøseth Arnfinn Kimen Såvarelaboratoriet AS Akershus
Skancke Martin Kommunalbanken AS Norfund
Oslo
Skatteboe Rolf Andøya Space Center AS Akershus
Skjærstad Mari Mesta AS Hedmark
Skjævestad Bjørn Veterinærmedisinsk Oppdragssenter AS
Akershus
Skoland Eli Staur gård AS Hedmark
Skrøvset Eli Avinor AS Akershus
Sletteberg Arthur Entra ASA Akershus
Solberg Birger Store Norske Spitsbergen Kulkompani AS
Sør-Trøndelag
Solberg Hill-Marta AS Vinmonopolet Nordland
Sollie Rune Kommunalbanken AS Akershus
Sormunen Sirpa-Helena Nammo AS Finland
Sperre Inger M. GIEK Kredittforsikring AS Møre og Romsdal
Stabbetorp Bjørn Graminor AS Akershus
Stausholm Jakob Statoil ASA Danmark
Stave Grethe Andøya Space Center AS Troms
Steensnæs Einar Gassnova SF Rogaland
Steinsmo Unni M. Bjørnøen AS Kings Bay AS
Sør-Trøndelag
Steinsvåg Tone B. Helse Vest RHA Hordaland
Steinveg Britt E. UNINETT AS Troms
Steen jr. Petter Kommunalbanken AS Rogaland
Stene Øyvind Space Norway AS Akershus
Stenseth Turid Trøndelag Teater AS Sør-Trøndelag
Stensland Eva NSD – Norsk senter for forskningsdata AS
Troms
Stenstadvold Halvor Statkraft SF Oslo
Stette Liv Helse Midt-Norge RHA Møre og Romsdal
Storelvmo Edel Nofima AS Norland
Strand Ola H. Avinor AS Helse Midt-Norge RHA
Sør-Trøndelag
Strand Solveig Norges sjømatråd AS Møre og Romsdal
Strøm Inger L. Helse Nord RHA Nordland
Strøm-Erichsen Anne-Grete Kongsberg Gruppen ASA Bergen
Strømsvåg Einar Statnett SF Rogaland
Stubholt Liv M. B. Norsk Hydro ASA Akershus
Støylen Andre Norfund Oslo
Sund Tina S. Argentum Fondsinvesteringer AS Electronic Chart Centre AS
Sør-Trøndelag
Surname First name Company County of residence
Sunde Margrethe AS Vinmonopolet Oslo
Sundland Siren N. AS Den Nationale Scene Hordaland
Sundsfjord Arnfinn Helse Nord RHA Troms
Suvanto-Harsaae Sanna SAS AB Finland
Svanevik Ørjan Mesta AS Akershus
Svegården Thor Baneservice AS Oppland
Svendsen Berit DNB ASA SAS AB
Oslo
Sætershagen Randi B. Posten Norge AS Hedmark
Søndenå Mona E. S. Norsk Helsenett SF Finnmark
Søraa Sverre Norges sjømatråd AS Sogn og Fjordane
Sørby Morten K. Posten Norge AS Sverige
Søreide Ingolf Simula Research Laboratory AS Akershus
Takvam Martha Kommunalbanken AS Akershus
Tanum Anne C. DNB ASA Den Norske Opera & Ballett AS
Østfold
Teigland Wenche NSB AS Hordaland
Teksum Leif Yara International ASA Hordaland
Telle Marianne Helse Nord RHA Troms
Thjømøe Mari Argentum Fondsinvesteringer AS Avinor AS
Oslo
Thuestad John G. Yara International ASA Akershus
Tjøsvold Ingrid T. Entra ASA Oslo
Ulstein Gunvor Norsk rikskringkasting AS Møre og Romsdal
Vaagen Marit Telenor ASA Sverige
Valle Paul S. Helse Midt-Norge RHA Møre og Romsdal
Vareberg Terje Helse Vest RHA Rogaland
Velgaard Truls Helse Sør-Øst RHA Østfold
Veer Jeroen van der Statoil ASA Nederland
Vik Arild Eksportkreditt Norge AS Rogaland
Værdal Kirsten I. Statnett SF Nord-Trøndelag
Vågeng Sigrun E. Helse Sør-Øst RHA Oslo
Wallenberg Jacob SAS AB Sverige
Wang Heidi Innovasjon Norge Nord-Trøndelag
Warncke Marit AS Vinmonopolet Hordaland
Wasteson Yngvild Simula Research Laboratory AS Akershus
Welde Brit T. Helse Midt-Norge RHA Nord-Trøndelag
Westby Einar GIEK Kredittforsikring AS Oslo
Winje Tone Nationaltheatret AS Oslo
Wold Terje Posten Norge AS Troms
Wærsted Gunn Telenor ASA Petoro AS
Oslo
Young Trygve GIEK Kredittforsikring AS Akershus
Øiulfstad Bjørn O. R. Talent Norge AS Oslo
Østbø Bjørn Siva – Selskapet for Industrivekst SF
Hordaland
Øverås Lise Universitetssenteret på Svalbard AS
Hordaland
Øygård Ann Nofima AS Møre og Romsdal
Øynes Anders R. Ambita AS Vest-Agder

124
The state’s direct ownership is managed by several ministries. Their contact details appear below.
Ministry of FinanceTelephone: +47 22 24 90 90
The Asset Management Department(Folketrygdfondet)
Ministry of DefenceTelephone: +47 23 09 80 00
Department of Management and Financial Governance(Aerospace Industrial Maintenance Norway SF)
Ministry of Health and Care ServicesTelephone: +47 22 24 90 90
Ownership Department(Helse Midt-Norge RHA, Helse Nord RHA, Helse Sør-Øst RHA, Helse Vest RHA and Norsk Helsenett SF)
Public Health Department(AS Vinmonopolet)
Department of Municipal Health Care Services(Nordisk Institutt for Odontologiske Materialer AS)
Ministry of Local Government and ModernisationTelephone: +47 22 24 90 90
Department of Local Government(Kommunalbanken AS)
Ministry of CultureTelephone: +47 22 24 90 90
Department of Media Policy and Copyright(Filmparken AS, Norsk rikskringkasting AS, Norsk Tipping AS)
Department of the Arts and Museums(Carte Blanche AS, AS Den Nationale Scene, Den Norske Opera & Ballett AS, Nationaltheatret AS, Rogaland Teater AS, Rosenkrantzgate 10 AS, Talent Norge AS, Trøndelag Teater AS)
Ministry of Education and ResearchTelephone: +47 22 24 90 90
Department of Higher Education(NSD – Norsk senter for forskningsdata AS, Simula Research Laboratory AS, UNINETT AS, The University Centre in Svalbard AS)
Ministry of Agriculture and FoodTelephone: +47 22 24 90 90
Department of Administration and Finance(Staur gård AS)
Department of Food Policy(Kimen Såvarelaboratoriet AS)
Department of Forest and Natural Resource Policy(Graminor AS, Statskog SF)
The Ministry of Trade, Industry and FisheriesTelephone: +47 22 24 90 90
Ownership Department(Aker Kværner Holding AS, Ambita AS, Argentum Fondsinvester-inger AS, Baneservice AS, Bjørnøen AS, DNB ASA, Eksportfinans ASA, Electronic Chart Centre AS, Entra ASA, Flytoget AS, GIEK Kredittforsikring AS, Investinor AS, Kings Bay AS, Kongsberg Gruppen ASA, Mesta AS, Nammo AS, Norsk Hydro ASA, SAS AB, Statkraft SF, Store Norske Spitsbergen Kulkompani AS, Telenor ASA, Veterinærmedisinsk Oppdragssenter AS, Yara International ASA)
Research and Innovation Department(Andøya Space Center AS, Innovasjon Norge, Nofima AS, Siva – Selskapet for Industrivekst SF, Space Norway AS)
Trade Policy Department(Eksportkreditt Norge AS)
Economic Policy Department(Norges sjømatråd AS)
Ministry of Petroleum and EnergyTelephone: +47 22 24 90 90
Climate, Industry and Technology Department(Gassnova SF)
Energy and Water Resources Department(Enova SF, Statnett SF)
Oil and Gas Department(Gassco AS)
Department for Economic and Administrative Affairs(Petoro AS, Statoil ASA)
Ministry of Transport and CommunicationsTelephone: +47 22 24 90 90
Department of Public and Rail Transport(NSB AS)
Department of Civil Aviation, Postal Services and Telecommunications(Avinor AS, Posten Norge AS)
Department of Public Roads and Traffic Safety(Nye Veier AS)
Ministry of Foreign AffairsTelephone: +47 23 95 00 00
Department for Economic Relations and Development(Norfund)
Contact details
125
Comments• The data used in this report were provided by the companies,
including in their annual reports and accounts for 2015.
• The information is up-to-date at 31 December 2015, with the exception of information relating to board composition and the state’s shareholdings, which is up-to-date at 31 March 2016.
• SAS AB submits its accounts according to Swedish accounting standards.
• The key figures have been calculated using a common method for all the companies (see the definitions provided below). They may therefore differ slightly from the figures stated by the companies in their annual reports.
• At the time of printing several of the companies had not held their annual general meeting / company meeting. The figures for these companies have been approved by the auditors, but the dividends may be changed at the annual general meeting / company meeting.
• Previous years’ data may be corrected in annual reports etc. This State Ownership Report uses the most recent information. This means that historical data may differ from what was stated in previous ownership reports.
• The method for calculating the number of employees at different companies varies between employees at year-end, number of man-years, and the average for the year.
• For the regional health authorities, profit or loss for the year after tax and minority interests (see the table on page seven under “key figures” and the table on page 23) is the profit or loss defined as any deviation from the performance requirements set by the Ministry of Health and Care Services.
• The Ministry of Trade, Industry and Fisheries cannot be held responsible for any errors in the figures and calculations. More information on the individual companies under the Ministry of Trade, Industry and Fisheries can be found in the companies’ annual reports.
DefinitionsBelow are definitions of some of the main terms used in the State Ownership Report. These may differ from the definitions used by the companies.
• Capital employed: The sum of equity and interest-bearing debt.
• Cash flow: Operating activities under cash flow in the company report.
• Cost ratio: Operating costs divided by the sum of net interest and credit-commission income and other operating revenues.
Comments and definitions
• Direct return: Dividend paid per share in 2015 as a percentage of the share price at 31 December 2015 (source: FactSet).
• Dividend percentage: Funds set aside for dividends as a proportion of the annual profit for the group. Average dividend percentage is calculated as the total dividend divided by the total consolidated profit after taxes and minority interests for the past five years.
• Equity ratio: Equity as a percentage of total assets.
• Gross operating margin (EBITDA margin): Gross operating profit (EBITDA) divided by operating revenues.
• Gross operating profit (EBITDA): Operating profit (EBIT) before depreciation and amortisation.
• Operating margin (EBIT margin): Operating profit (EBIT) divided by operating revenues.
• Operating profit (EBIT): Operating revenues less operating expenses, depreciation and amortisation.
• Remuneration of board members: Remuneration of the chair, deputy chair and board members as approved at the annual general meeting / corporate assembly in 2015, unless otherwise stated. Total remuneration of board members is the ordinary remuneration that has been paid and remuneration for work on board committees.
• Return: Share price performance including reinvested dividends (source: FactSet). The geometric average is used to calculate the average annual return over the past five years.
• Return on capital employed: The sum of operating profit (EBIT), financial income and share of profit from associates, divided by the average capital employed over the past two years.
• Return on equity: The profit for the year after minority interests and taxes divided by the majority’s share of the average book equity. The arithmetic mean is used to calculate the average return on equity over the past five years.
• Value of the state’s shareholding: For listed companies, the values are based on the market prices at 31 December 2015 and the number of shares owned by the state on the same date (source: FactSet). For unlisted companies in which the state’s ownership has a commercial objective, book equity with the deduction of minority interests at 31 December 2015 is used. No value is estimated for companies in which the state’s ownership has a sectoral policy objective.
• Weighted return last year: Value-adjusted return including reinvested dividends for the eight listed companies (source: FactSet).
• Weighted return on equity: Equity weighted in relation to the state’s share of book equity less minority interests at 31 December 2015.

Published by the Ministry of Trade, Industry and Fisheries
Layout: 07 Media – 07.no Design: Itera AS
10/2016
Norwegian text translated into Englishby Amesto Translation
W-0012 E
Past editions of the State Ownership Report are available at www.eierberetningen.no

Published by The Ministry of Trade, Industry and Fisheries
Internett www.publikasjoner.dep.no
E-mail [email protected] +47 222 40 000
Design Itera AS
Layout 07 Media – 07.no10/2016
W-0012 E