the state of victoria, 9 15. victoria. statistical register of the state of victoria, for the year...
TRANSCRIPT

1 9 15.
VICTORIA.
STATISTICAL REGISTER
OF
THE STATE OF VICTORIA, FOR THE YEAR
1914.
(J}ompil~d 1rom ®ffidal ~~ct1~ds in th~ Q91Jire o~ the OSocernment ~tntist.
PART V.
POPULATION.
PRESENTED TO BOTH HOUSES OF PARLIAMENT BY HIS EXCELLENCY'S COMMAND.
81 3athnitl: ALBBBT I. IWLLBTT, GOVBRNMBNT PRINTBB, !IBLBOlJ'D&
No. 44.-[ls. 9d.].-11341.

•
Preparation • Printing ,850 copies)
APPROXIMATE COST OF PAPER. £ s. d.
48 0 0
• The labour oi eompiling this Paper extends io many Departments of ihe Service; it is therefore impossible to give the co1t of its preparation .

P A R T V.-P 0 P U LA T I 0 N .
CONTENTS.
CENSUS OF 1911.-POPULATION
" " , ,,
"
" 1836 to 1911
CoLOURED PERSoNs
PoPULATION IN EACH CouNTY
" " "
CoMMONWEALTH ELECTORAL DivisiON
STATE ELECTORAL PROVINCE
, " ,, DISTRICT
" " , OF MUNICIPALITIES
" "
" ToWNS CONTAINING 1,000 INHABITANTS AND UPWARDS
BIRTHPLACES OF THE PEOPLE
" RELIGIONS OF THE PEOPLE
" AGES OF THE PEOPLE
" EDUCATIO)l OF THE PEOPLE
" " " CHILDREN AGED 6 TO 13 YEARS
, " PERSONS RECEIVING INSTRUCTION AND NOT BEING
INSTRUCTED
" CONJUGAL CONDITION OF THE PEOPLE IN VICTORIA
" ,, " MELBOURNE AND SUBt'RBS
" " "
" "
OccuPATIONs oF THE PEOPLE .••
LENGTH OF RESIDENCE IN AUSTRALIA
BIRTHPLACES AND AGES OF MALES
" FEMALES
AGEs, BIRTHPLACES, AND CoNJUGAL CoNDITION oF THE BLIND
" " " " "
NATURE OF DwELLINGS
DwELLINGs-MATERIALS OF WHICH CoMPOSED
INMATES OF DWELLINGS
" WEEKLY RENTAL VALUE OF PRIVATE DWELLINGS
PoPULATION oF VIcToRIA, 31sT DECEMBER, 1914
" " 1836 to 1914
NATURAL INCREASE OF POPULATION o:F VICTORIA
TOTAL
EsTIMATED PoPULATION OF VICTORIA-RETURN FOR TJ;JN YEARS ..
URBAN AND RuRAL PoPULATION, 1881-1914 ...
IMMIGRATION AND EMIGRATION BY SEA, 1914
IMMIGRATION AND EMIGRATION BY SEA-RETD"RN FoR FouR YEARS
NoMINATED AND AssisTED btMIGRATION, 1914
STATE-ASSISTED IMMIGRATION TO END OF 1914
ARRIVALS AND DEPARTUREg BY RAIJ,, 1914
MIGRATION BY RAIL, 1911 TO 1914 .••
CHINESE IMMIGRATION AND EMIGRATION, 1914
CHINESE IMMIGRATION AND EMIGRATION, 1905 TO 1914
DEAF MUTES
CoLOURED PERSONs, ARRIVALS AND DEPARTURES oF, 1905 To 1914
EsTIMATKD PoPULATION OF MELBOURNE AND SuBURBS, 1841 TO 1914 ...
ENUMERATED PoPULATION OF MELB<lURNE AND SuBURBs, 1901 AND 1911, AND EsTUIATED
PoPULATION, 1914
PoPULATION OF THE PRINCIPAL TowNs ouTsmE :MELBOURNE AND SuBURBs, 1901, 1911, AND 1914
NATURALIZATION-RETURN FOR TEN YEARS ...
CoMMoNWEALTH OF AUSTRALIA-SENATE-GENERAL ELECTION, 1914
" NuMBER OF
" " ,,
, HousE oF HEPRESENTATtVES-GENERAL ELECTION, 1914
ELECToRs-LEGISLATIVE CouNCIL, 1914-15 (I.) , IN EACH PROVINCK DIVISION, 1914-15 (I!.)
, LEGISLATIVE AssEMBLY, 1915 (Ill. ) IN EACH AssEMBLY DIVISION, 1915 (IV.)
" AND VoTES PoLLED-LEGISLATIVE CouNCIL-TRIENNIAL ELECTION, 1913 (V.)
" ,, LEGISLATIVE AssEMBLY-GENERAL ELECTION, 1914 (VI.)
PREFERENTIAL COUNT
PROPORTION oF ELEOTORS WHO VoTED AT GENERAL EL&CTIONs, 1866 TO 1914
NUKBER OF ELEOTORS-RETURN FOR TEN YEARS
P.iGB
5
5 6 6
7 7 8
9
11
12 14
15
16
16
17 18
18
19
19
20 22 24 25 26 27 27 28
29 29 31 31
31
31
32 33
33 3t 34
34 36 35 35
36
36
37 37 37 38
38
39
42 42 45 46 49
51
51
[217]


STATISTICAL REGISTER OF VICTORIA, 1914.
P 0 P U L A T I 0 N ..
* * * The Tables in this Part relating to the Census of 1911 are derived from the returns tabulated by Mr. G. H. Knibbs, C.M.G., Commonwealth Statistician.
CENSUS OF 1911.-POPULATION.
RETURN showing the Population of Victoria according to the Census taken on 2nd April, 1911.
Population Living in- Males. Females. Persons.
Municipalities-Cities, Towns, and Boroughe Shires
No Municipality Ships and Vessels
Total Population
Date of Enumeration.
1836 (25th May) 1836 (8th November) •• 1838 (12th September) 1841 (2nd March) 1846 .. " 1851 " , 1854 (26th April) 1857 (29th March) •• 1861 (7th April) 1871 (2nd April) 1881 (3rd April) 1891 (5th April) 1901 (31st March) 1911 (2nd April)
349,683 301,716
110 4,082
655,591
CENSUS OF 1911.-POPULATION, 1836-1911
(Distinguishing Chinese and Aborigines).
Total Population. • Chinese.
392,387 266,778
72 723
659,960
742,070 568,494
182 4,805
1,315,551
Aborigines.
Males. Females. Persons. Males. Females. Persons. Males. Females. Persons.
142 186
3,080 8,274
20,184 46,202
. . 155,887 • • 264,334 • . 328,651 . • 401,050 • • 452,083 • . 598,414 .. 603,883 • . 655,591
35 38
431 3,464
12,695 31,143 80,911
146,432 211,671 330,478 410,263 541,991 597,458 659,960
-------·----- ----- ----- ----- ----- -----177 224
3,511 11,738 32,879 77,345
236,798 410,766 540,322 731,528 862,346
1,140,405 1,201,341 1,315,551
2,373 25,421 24,724 17,899 11,869 8,772 6,740 4,956
3 8
36 259 605 609 645
2,373 25,424 24,732 17,935 12,128 9,177 7,349 5,601
1,600t 1,152 1,046
784 460 325 367 340
900t 616 648 546 320 240 285 SOS I
5,000t
2,500t 1,768 1,694 1,330
780 565 652 643
•Including Chinese, also Aborigines from 1851 to 1901; in 1911 full-blooded Aborigines numbering 103 males a.nd 93 femall,;sha.ve been excluded from the figures in these three columns, but are included under the heading " Aborigines."
t 01Hcially estimated; but according to other and apparently m,Jre reliable estimates made by pri,·ate personi the Aborigines numbered not less than 15,000 when the colony was founded in 1830.
t Partly estimated.
[219]

6 STATISTICAL REGISTER OF VICTORIA, 1914.-POPULATION.
CENSUS OF 1911.-COLOURED PERSONS IN VICTORIA
(Exclusive of Aboriginals).
Male& Female& Total.
:&a.ee. Full· Half· Total. Full- Half· Total, Full· Half· blood. caste. blood. caste. blood. caste. --- --- --- --- --- --- ---- ---
Asiatic-Chinese .. .. .. 4,491 465 4,956 216 429 645 4,707 894 Hindus .. .. .. 720 73 793 9 32 41 729 105 Japanese .. .. .. 39 13 52 8 7 15 47 20 Syrians .. .. .. 244 11 255 197 5 202 441 16 :Mala.ys .. .. .. 5 5 10 .. 8 8 5 13 Filipinos .. .. .. 1 1 2 .. .. . . 1 1 Javanese .. .. .. 2 2 4 .. 1 1 2 3 Cingalese .. .. .. 14 1 15 1 3 4 15 4 Afghans and Baluchis .. 8 .. 8 1 . . 1 9 . . Arabs .. .. .. 2 .. 2 .. .. . . 2 . . Persians .. .. .. 11 .. 11 .. .. . . 11 . . Armenians •• .. .. 1 .. 1 1 .. 1 2 . . Tibetans .. . . .. 1 .. 1 .. .. .. 1 . .
A.frican-Negroes .. . . .. 44 27 71 11 36 47 55 63 Egyptians .. .. .. 3 .. 3 .. . . .. 3 . .
American-American Indians .. .. 3 1 4 .. 1 1 3 2 West Indians (so described) .. 3 3 6 .. 4 4 3 7
Polynesian-Polynesian (so described) .. 2 .. 2 1 1 2 3 1 :Maoris .. .. .. 5 2 7 2 2 4 7 4 Fijians . . .. .. .. .. .. 2 .. 2 2 . .
Indefinite-Coloured (so described) .. 1 2 3 .. .. .. 1 2
--- --- --- -··-- --- --- --- --·-Total .. .. 5,600 606 6,206 449 529 978 6,049 1,135
CENSUS OF 1911.-POPULATION IN EACH COUNTY
(Exclusive of Full-blooded Aboriginals).
County. Population. Population.
County.
Males, Females. Persons. Males. Females.
Anglesey .. .. 4,772 4,180 8,952 Lowan . . .. 7,082 6,231 Benambra .. .. 3,625 2,957 6;582 I Millewa .. . . '56 28 Bendigo .. .. 26,771 27,729 54,500 Moira .. .. 16,814 15,028 Bogong .. .. 14,681 13,224 27,905 Mornington .. .. 19,034 16,279 Borung .. .. .. 16,289 14,562 30,851 Norman by .. .. 5,900 6,007 Bourke .. .. .. 295,309 327,502 622,811 Polwarth .. .. 7,367 6,533 Buln Buln .. .. 22,283 18,774 41,057 Ripon .. . . 7,4o4 6,448 Croajingolong .. . . 1,510 1,190 2,700 Rodney .. . . 10,399 9,089 Dalhousie .. . . 8,917 8,724 17,641 Tal bot .. . . 23,567 24,364 Dargo .. .. 3,077 2,441 5,518 Tambo .. .. 1,650 1,329 Delatite .. . . .. 11,491 10,574 22,065 Tarijil . . .. 10,130 9,562 Dundas .. .. 5,298 5,152 10,450 Tatchera .. .. 6,318 4,519 Evelyn .. . . .. 9,026 8,265 17,291
I Villiers .. . . 11,430 11,297
Follett .. .. .. 1,372 1,339 2,711 I Weeah .. . . 1,255 697 Gladstone .. .. 8,752 7,961 16,713 I Wonnangatta .. . . 998 733 Grant .. .. 34,991 36,486 71,477 Grenville .. .. 20,503 22,567 43,070 Outside Counties-Gun bower .. .. 5,083 4,181 9,264 Shipping .. . . 4,082 723 Hampden .. .. 6,707 6,188 12,895 Heytesbury .. .. 3,705 3,261 6,966 Kara Kara .. .. 8,265 7,274 15,539 Total .. . . 655,591 659,960 l:.a.rka.rooc .. .. 9,618 6,562 16,180
i
TotaL
---
5,601 834 67
457 18 2 5
19 9 2
11 2 1
118 3
5 10
4 11
2
3 ---
7,184
Persollil.
13,31 8
31,84
3 4 2 3 7 0 2 8
35,31 11,90 13,90 13,91 19,48 47,931 2,97
19,69 10,83
9 2 7 7 2
22,72 1,95 1,731
4,80 5
1,315,55 1

STATISTICAL REGISTER OF VICTO.RIA, 1914.-POPULATION.
CENSUS OF 1911.-POPULATION IN EACH COMMONWEALTH ELECTORAL DIVISION
Commonwealth lectoral E
D ivision.
va t
n 0
a mite .. er s nd ians .. ng oorie rnong rne
..
..
..
..
..
..
..
..
..
..
..
..
.. ..
.. .. ..
Ba.lacla. Ba.llara Batma Ben dig Bourke Corang Corio Echuca Fawkn Flinder Gipps1a Gramp Indi Kooyo La. a nee Mariby Melbou Melbou Mernda Wanno Wimm Yarra
rne Ports
n era .. g Ship pin
To tal
..
..
..
..
..
..
Under 21.
---12,875 10,841 ll,416 12,265 17,663 13,065 13,050 13,054 12,185 14,692 13,287 ll,896 13,472 12,848 10,792 15,522 9,105
13,862 12,0ll 12,037 16,057 10,750
740 ---283,485
(Exclusive of Full-blooded Aboriginals).
Males. Females. Persons.
21 and Not Under 21 and Not Under 21 and Not upwards. stated. Total. 21. upwards. stated. Total. 21. upwards. stated. --- -- --- --- --- -- --- --- --- --
17,677 113 30,665 13,488 23,882 209 37,579 26,363 41,559 322 11,794 ll2 22,747 ll,201 15,046 144 26,391 22,042 26,840 256 15,602 143 27,161 ll,845 18,247 186 30,278 23,261 33,849 329 14,161 136 26,562 12,285 15,316 214 27,815 24,550 29,477 350 21,144 205 39,012 18,058 24,171 236 42,465 35,721 45,315 441 16,299 169 29,533 12,556 14,129 106 26,791 25,621 30,428 275 16,612 180 29,842 12,819 17,208 189 30,216 25,869 33,820 369 16,287 199 29,540 12,228 13,748 121 26,097 25,282 30,035 320 17,489 96 29,770 12,957 25,887 241 39,085 25,142 43,376 337 18,753 190 33,635 13,313 15,640 178 29,131 28,005 34,393 368 16,214 ll2 29,613 12,379 13,084 70 25,533 25,666 29,298 182 15,093 145 27,134 ll,391 13,637 131 25,159 23,287 28,730 276 16,120 170 29,762 12,613 13,849 147 26,609 26,085 29,969 317 17,195 ll8 30,161 13,656 24,249 169 38,074 26,504 41,444 287 11,626 104 22,522 10,642 12,614 107 23,363 21,434 24,240 2ll 19,665 162 35,349 15,694 21,402 233 37,329 31,216 41,067 395 21,293 174 30,572 8,935 18,751 341 28.027 18,040 40,044 515 17,567 138 31,567 13,615 17,865 209 31:689 27,477 35,432 347 16,123 ll8 28,252 11,521 14,824 ll3 26,458 23,532 30,947 231 14,002 120 26,159 ll,500 13,389 ll9 25,008 23,537 27,391 239 21,384 246 37,687 14,326 14,452 149 28,927 30,383 35,836 395 13,429 85 24,264 ll,234 15,819 160 27,213 21,984 29,~48 245
3,318 24 4,082 152 563 8 723 892 3,881 32 --- ~- --- --- --- -- --- --- --- --368,847 3,259 655,591 278,408 377,772 3,780 659,960 561,893 746,619 7,039
7
Total.
68,244 49,138 57,439 54,377 81,477 56,324 60,058 55,637 68,855 62,766 55,146 52,293 56,371 68,235 45,885 72,678 58,599 63,256 54,710 51,167 66,614: 51,477
4,805
1,315,551
(221]
8 STATISTICAL REGISTER OF VICTORIA, 1914.-"POPULATION.
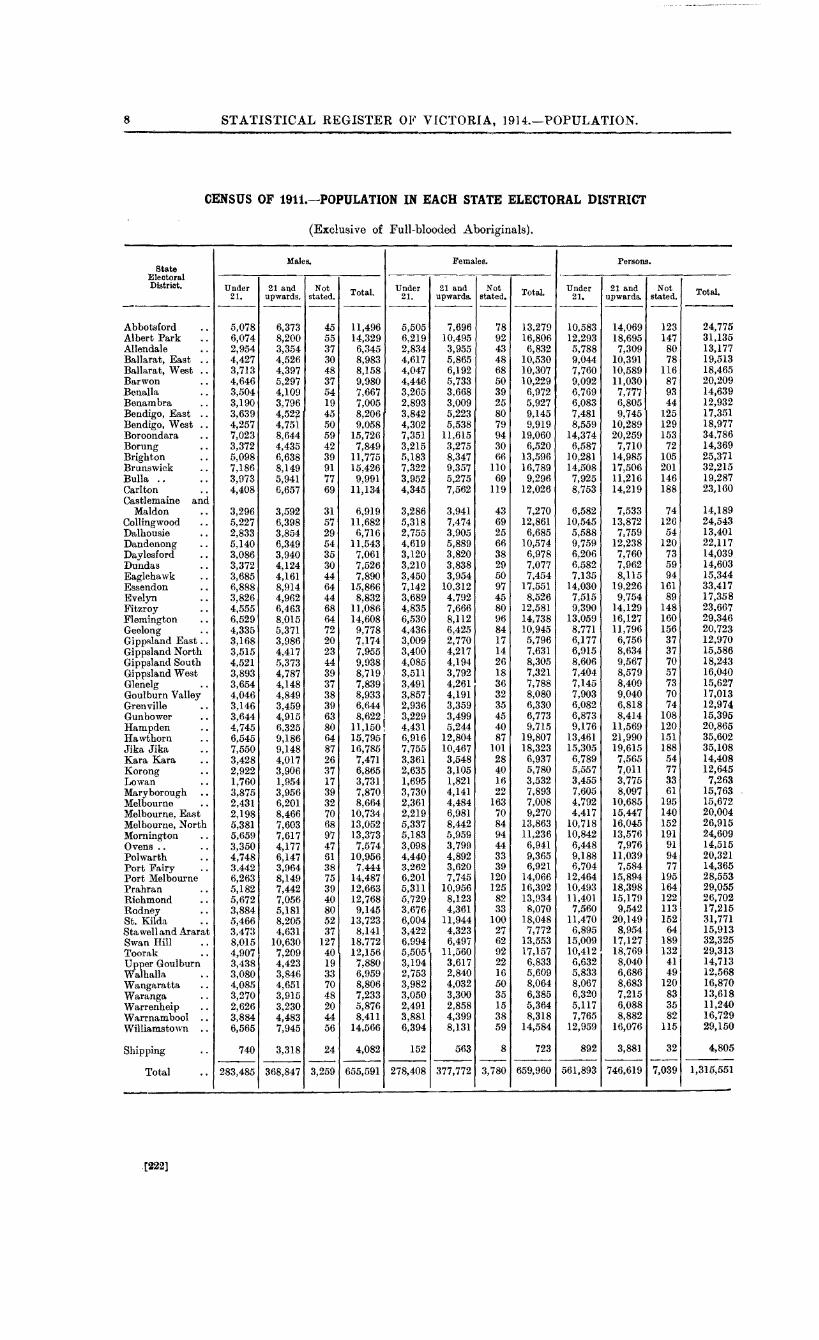
CENSUS OF 1911.-POPULATION IN EACH STATE ELECTORAL DISTRICT
State Electoral District.
otsford .. rt Park .. dale .. rat, East rat, West ..
Abb Albe All en Ball a Ball a Barw Bena Ben a Bend Bend Boro Boru Brigh Brun Bulla Carlt Cast}
on .. lla .. m bra .. igo, East igo, West .. ondara .. ng .. ton .. swick .. .. .. on .. emaine and I don ..
ngwood .. ousie .. enong ..
esford .. as ..
ehawk .. ndon .. yn .. oy .. ington .. ng sland East ..
M a Colli Dalh Dand Dayl Dund Eagl Esse Eve I Fitzr Flem Geelo Gipp Gipp Gipp Gipp Glen Goul Gren Gunb Ham Haw Jika Kara Koro Lowa Mary Melb Melb Melb Morn Oven Polw Port Port Prah Rich Rodn St. Ki Staw Swan Toor Uppe Walh Wan Wara Warr Warr Willi
sland North sland South sland West elg burn Valley ville .. ower .. pden .. thorn .. Jika .. Kara ..
ng .. n .. borough .. ourne .. ourne, East ourne, North ington .. s .. .. arth .. Fairy .. Melbourne ran .. mond .. ey .. 'lda
ell and Ararat Hill ..
ak .. r Goulburn all a
garatta nga enheip nambool amstown
ling Ship1
T otal
. [222]
..
..
..
..
.. ..
..
..
Under 21.
---5,078 6,074 2,954 4,427 3,713 4,646 3,504 3,190 3,639 4,257 7,023 3,372 5,098 7,186 3,973 4,408
3,296 5,227 2,833 5,140 3,086 3,372 3,685 6,888 3,826 4,555 6,529 4,335 3,168 3,515 4,521 3,893 3,654 4,046 3,146 3,644 4,745 6,545 7,550 3,428 2,922 1,760 3,875 2,431 2,198 5,381 5,659 3,350 4,748 3,442 6,263 5,182 5,672 3,884 5,466 3,473 8,015 4,907 3,438 3,080 4,085 3,270 2,626 3,884 6,565
740 ---283,485
(Exclusive of Full-blooded Aboriginals).
Males. Females. Persons.
21 and Not Under 21 and Not Under 21 and Not upwards. stated. Total. 21. upwards. stated, Total 21. upwards. stated. --- -- --- --- --- -- --- --- --- --
6,373 45 11,496 5,505 7,696 78 13,279 10,583 14,069 123 8,200 55 14,329 6,219 10,495 92 16,806 12,293 18,695 147 3,354 37 6,345 2,834 3,955 43 6,832 5,788 7,309 80 4,526 30 8,983 4,617 5,865 48 10,530 9,044 10,391 78 4,397 48 8,158 4,047 6,192 68 10,307 7,760 10,589 116 5,297 37 9,980 4,446 5,733 50 10,229 9,092 11,030 87 4,109 54 7,667 3,265 3,668 39 6,972 6,769 7,777 93 3,796 19 7,005 2,893 3,009 25 5,927 6,083 6,805 44 4,52~ 45 8,206 3,842 5,223 so 9,145 7,481 9,745 125 4,751 50 9,058 4,302 5,538 79 9,919 8,559 10,289 129 8,644 59 15,726 7,351 ll,615 94 19,060 14,374 20,259 153 4,435 42 7,849 3,215 3,275 30 6,520 6,587 7,710 72 6,638 39 11,775 5,183 8,347 66 13,596 10,281 14,985 105 8,149 91 15,426 7,322 9,357 llO 16,789 14,508 17,506 201 5,941 77 9,991 3,952 5,275 69 9,296 7,925 11,216 146 6,657 69 11,134 4,345 7,562 ll9 12,026 8,753 14,219 188
3,592 31 6,919 3,286 3,941 43 7,270 6,582 7,533 74 6,398 57 11,682 5,318 7,474 69 12,861 10,545 13,872 126 3,854 29 6,716 2,755 3,905 25 6,685 5,588 7,759 54 6,349 54 11,543 4,619 5,889 66 10,574 9,759 12,238 120 3,940 35 7,061 3,120 3,820 38 6,978 6,206 7,760 73 4,124 30 7,526 3,210 3,838 29 7,077 6,582 7,962 59 4,161 44 7,890 3,450 3,954 50 7,454 7,135 8,115 94 8,914 64 15,866 7,142 10,312 97 17,551 14,030 19,226 161 4,962 44 8,832 3,689 4,792 45 8,526 7,515 9,754 89 6,463 68 ll,086 4,835 7,666 80 12,581 9,390 14,129 148 8,015 64 14,608 6,530 8,112 96 14,738 13,059 16,127 160 5,371 72 9,778 4,436 6,425 84 10,945 8,771 11,796 156 3,986 20 7,174 3,009 2,770 17 5,796 6,177 6,756 37 4,417 23 7,955 3,400 4,217 14 7,631 6,915 8,634 37 5,373 44 9,938 4,085 4,194 26 8,305 8,606 9,567 70 4,787 39 8,719 3,5ll 3,792 18 7,321 7,404 8,579 57 4,148 37 7,839 3,491 4,261 36 7,788 7,145 8,409 73 4,849 38 8,933 3,857 4,191 32 8,080 7,903 9,040 70 3,459 39 6,644 2,936 3,359 35 6,330 6,082 6,818 74 4,915 63 8,622( 3,229 3,499 45 6,773 6,873 8,414 108 6,325 80 11,150. 4,431 5,244 40 9,715 9,176 11,569 120 9,186 64 15,795 6,916 12,804 87 19,807 13,461 21,990 151 9,148 87 16,785 7,755 10,467 101 18,323 15,305 19,615 188 4,017 26 7,471 3,361 3,548 28 6,937 6,789 7,565 54 3,906 37 6,865 2,635 3,105 40 5,780 5,557 7,0ll 77 1,954 17 3,731 1,695 1,821 16 3,532 3,455 3,775 33 3,956 39 7,870 3,730 4,141 22 7,893 7,605 8,097 61 6,201 32 8,664 2,361 4,484 163 7,008 4,792 10,685 195 8,466 70 10,734 2,219 6,981 70 9,270 4,417 15,447 140 7,603 68 13,052 5,337 8,442 84 13,863 10,718 16,045 152 7,617 97 13,373 5,183 5,959 94 11,236 10,842 13,576 191 4,177 47 7,574 3,098 3,799 44 6,941 6,448 7,976 91 6,147 61 10,956 4,440 4,892 33 9,365 9,188 11,039 94 3,964 38 7,444 3,262 3,620 39 6,921 6,704 7,584 77 8,149 75 14,487 6,201 7,745 120 14,066 12,464 15,894 195 7,442 39 12,663 5,3ll 10,956 125 16,392 10,493 18,398 164 7,056 40 12,768 5,729 8,123 82 13,934 11,401 15,179 122 5,181 80 9,145 3,676 4,361 33 8,070 7,560 9,542 ll3 8,205 52 13,723 6,004 11,944 lOO 18,048 11,470 20,149 152 4,631 37 8,141 3,422 4,323 27 7,772 6,895 8,954 64
10,630 127 18,772 6,994 6,497 62 13,553 15,009 17,127 189 7,209 40 12,156 5,505 11,560 92 17,157 10,412 18,769 132 4,423 19 7,880 3,194 3,617 22 6,833 6,632 8,040 41 3,846 33 6,959 2,753 2,840 16 5,609 5,833 6,686 49 4,651 70 8,806 3,982 4,032 50 8,064 8,067 8,683 120 3,915 48 7,233 3,050 3,300 35 6,385 6,320 7,215 83 3,230 20 5,876 2,491 2,858 15 5,364 5,117 6,088 35 4,483 44 8,411 3,881 4,399 38 8,318 7,765 8,882 82 7,945 56 14,566 6,394 8,131 59 14,584 12,959 16,076 115
3,318 24 4,082 152 563 8 723 892 3,881 32
--- -- --- --- --- -- --- --- --- --368,847 3,259 655,591 278,408 377,772 3,780 659,960 561,893 746,619 7,039
Total.
24,77 31,13
5 5
13,177 19,513 18,46 20,20 14,63
5 9 9
12,932 17,351 18,977 34,786 14,369 25,371 32,215 19,287 23,160
14,189 24,543 13,401 22,117 14,039 14,603 15,344 33,417 17,358 23,667 29,346 20,723 12,970 15,586 18,243 16,040 15,627 17,013 12,974 15,395 20,865 35,602 35,108 14,408 12,645
7,263 15,763 15,672 20,004 26,915 24,609 14,515 20,321 14,365 28,553 29,055 26,702 17,215 31,771 15,913 32,325 29,313 14,713 12,568 16,870 13,618 11,240 16,729 29,150
4,805
1,315,551

STATISTICAL REGISTER OF VICTORIA, 1914.-POPULATION. 9
CENSUS OF 1911.-POPULATION OF MUNICIPALITIES, ETC.
Enumerated Population. Enumer ated Population.
CITIES.
Ballarat Bendigo Brunswick Collingwood Essen don Fitzroy Footscray Gee long Hawthorn Malvern Melbourne Prahran Richmond South Melbourne St. Kilda.
Total Cities (15)
TOWNS.
Ballara t East Brighton Camberwell Caulfield Kew .. Northcote Port Melbourne Warrnambool .. Williamstown ..
Total Towns (9)
BOROUGHS.
Ararat Browns and Scarsdale Buninyong Carisbrook Castlemaine Chewton Clones Coburg Creswick Daylesford Dunolly Eaglehawk Echuca Geelong West .. Hamilton Horsham Inglewood Koroit Majorca Malmsbury r,Iaryborough Newtown and Chilwell Oakleigh Portland Port Fairy Queenscliff Raywood Rutherglen Sale .. Sebastopol Smythesdale Stawell St. Arnaud Tal bot Tarnagulla Wangaratta Wonthaggi
Total Boroughs (37)
Total Cities, Towns and Boroughs '
Males. Females.
9,671 12,346 13,287 15,252 15,426 16,789 15,986 18,204 ll,037 12,712 16,085 18,198 ll,906 11,737 6,447 7,171
10,731 13,719 6,807 9,162
51,958 51,635 19,469 25,898 19,354 21,088 22,060 24,130 10,877 14,457
241,101 272,498
7,470 8,492 5,405 6,678 5,635 6,916 7,246 8,673 5,064 6,088 8,431 9,088 6,768 6,747 3,3ll 3,699 7,572 7,703
56,902 64,084
2,095 2,120 597 504 507 573 457 482
2,443 2,785 461 469
. 738 1,007 4,753 4,752 1,142 1,284 1,834 2,012
568 663 3,700 3,888 1,714 1,832 3,331 3,774 2,314 2,586 1,648 1,680
580 615 853 889 297 264 349 410
2,703 2,972 2,663 3,168 1,024 1,127
868 I,ll4 936 1,013 912 1,100 255 205 832 913
I,588 1,8I6 984 I,190 2ll 197
2,031 2,379 1,830 1,940
460 536 437 429
1,640 1,842 I,925 1,275
51,680 55,805
349,683 392,387
Total Persons.
SHIRES.
22,01 7 Alberton 28,53 9 Alexandra 32,21 34,19
5 Arapiles 0 Ararat
23,74 9 Avoca 34,28 3 Avon 23,64 3 Bacchus Marsh 13,61 8 Bairnsdnlc 24,45 0 Ballan 15,96 9 Ballarat
103,59 3 Bannockburn 45,36 7 Barrarbool 40,44 2 Beechworth 46,19 0 Belfast 25,33 4 Bellarinc
Benalla 513,59 9 Berwick
Bet Bet Birchip Borung Bray brook Bright
15.96 2 Broadford 12;08 3 Broadmeadows 12,55 I Bulla 15,91 9 Buln Buln 11,15 2 Bungaree 17,51 9 Buninyong 13,51 5 Charlton
0 Chiltern 7,01 15,27 5 Colac
Corio 120,98 6 Cranbourne
4,21 1,10 1,08
93 5,22
93 1,74
Creswick Dandenong Deakin Dimboola
5 Donald I Doncaster 0 Dundas 9 Dunmunkle 8 East Loddon 0 Eltham 5 Epping
9,50 5 Euroa 2,42 6 Fern tree Gully.. . 3,84 6 Flinders and Kangerong 1,23 I Frankston and Hastings 7,58 8 Gisborne 3,54 6 Glenelg 7,10 5 Glenlyon 4,90 0 Gordon 3,32 8 Goulburn 1,19 5 Grenville 1,74 2 Hampden
56 I Healesville 75 9 Heidelberg
5,67 5 Heytesbury 5,83 1 Howqua 2,15 1 Huntly I,98 2 Kara Kara I,94 9 Karkarooc 2,01 2 Keilor
46 0 Kcrang I,74 5 Kilmore 3,40 4 Korong 2,17 4 Kowree
40 8 Kyneton 4,41 0 Lancefield 3,77 0 Lawloit
99 6 Leigh 86 6 Lexton
3,48 2 Lillydale 3,20 0 Lowan
Maffra 107,48 5 Maldon
742,07
Mansfield
·I Marong 0 Melton
Males.
3,039 I,466 1,460 3,563 2,042 1,244 1,366 4,229 2,ll9 2,056
963 1,078 3,101 1,379 2,ll4 3,974 3,646 1,703 1,203 2,913 1,269 3,205
879 1,037 1,156 2,736 1,888 2,981 1,499 1,186 7,748 1,647 2,171 2,388 2,591 1,501 3,294 1,715
651 I,857 2,336 1,003 1,756
683 2,727 1,902 I,465 1,479
996 2,823
883 I,780 1,373 2,435 5,165
828 4,094 2,4I7
646 1,755 I,996 3,395
502 5,044
901 2,986 1,8I5 3,402
494 I,892
984 I,025 3,142 2,044 2,217 2,20I I,836 3,476
669
Females.
2,440 1,25I I,306 2,772 I,845 I,OI4 1,290 3,96I I,929 2,240
879 928
2,877 1,211 2,148 3,7I4 2,986 1,477
908 2,499 1,104 2,738
762 1,063 1,266 2,189 1,787 2,613 I,281 1,209 6,464 1,327 I,818 2,334 2,543 1,185 2,502 1,391
544 1,685 1,946
665 I,667
615 2,403 1,7ll I,512 1,429 1,094 2,775
831 1,514 1,222 2,230 4,664
920 4,516 2,104
485 1,498 1,663 2,348
420 3,925
906 2,531 I,618 3,502
451 1,490
813 872
3,187 1,777 I,951 2,218 1,581 3,I70
548
Total Persons.
5,479 2,717 2,766 6,335 3,887 2,258 2,656 8,190 4,048 4,296 I,842 2,006 5,978 2,590 4,262 7,688 6,632 3,I80 2,ll1 5,4I2 2,373 5,943 1,641 2,100 2,422 4,925 3,675 5,594 2,780 2,395
14,212 2,974 3,989 4,722 5,134 2,686 5,796 3,I06 1,I95 3,542 4,282 1,668 3,423 1,298 5,130 3,6I3 2,977 2,908 2,090 5,598 1,714 3,294 2,595 4,665 9,829 1,748 8,610 4,52I I,l31 3,253 3,659 5,743
922 8,969 1,807 5,517 3,433 6,904
945 3,382 I,797 1,897 6,329 3,82I 4,I68 4,419 3,417 6,646 1,217
[223]

10 STATISTICAL REGISTER OF VICTORIA, 1914.-POPULATION.
CENSUS OF 1911.-POPULATION OF MUNICIPALITIES, ETC.---continued.
Enumerated Population. Enumerated Population.
Males. Females. Total Persons. Males. Females. Total
Persons.
SHIRES-continued. SHIREs-continued.
Meredith 676 593. 1,269 South Gippsland Merriang 580 446 1,026 Springfield Metcalfe 1,272 1,185 2,4.57 Stawell
2,423 1,882 4,305 335 266 601
2,096 1,602 3,698 Mildura 3,545 2,574 6,119 Stra thfieldsaye .. 1,929 1,878 3,807 Minhamite 996 879 1,875 Swan Hill 4,066 2,729 6,795 Mirboo 762 630 1,392 Tal bot 560 494 1,054 Monrabbin 6,lli3 6,644 12,757 Tambo 1,339 1,146 2,485 Mornington 655 774 1,429 Templestowe 544 457 1,001 :Yiortlake 1,738 1,496 3,234 Towong 3,566 2,852 6,418 Morwell 1,894 1,571 3,.165 Traralgon 1,458 1,396 2,854 Mount Alexandra 924 974 1,898 Tullaroop Mount Franklin 1,210 2,404 Tungamah
1,587 1,402 2,989 2,882 2,494 5,376
Mount Rouse 1,434 2,715 Upper Yarra 2,072 1,572 3,644 Mulgrave 1,226 2,423 Violet Town Mc!Yor 2,160 4,084 Walhalla
1,267 1,180 2,447 1,174 986 2.160
Nanacan 2,957 5,408 \Vannon 1,458 1,308 2,766 Newham a.nd Woodend 1,145 2,281 Waranga 2,876 2,415 5,291 Newstead 962 1,882 Warragul 2,262 2,192 4,454 North Ovens 1,425 1,246 2,671 \Varrnambool 4,506 4,147 8,653 Numurkah 3,587 3,257 6,844 Werriboo 2,030 1,703 3,733 Nunawading 3,413 3,707 7,120 Whittlesea 1,160 1,049 2,209 Omeo .. 2,103 1,644 3,747 Whmnera 2,116 1,771 3,887 Orbost 2,327 1,856 4,183 Winohelsea 2,103 1,938 4,041 Oxley 2,350 1,961 4,311 Wodonga 981 959 1,940 Phillip Island and Woorayl 2,709 2,107 4,816
Woolamai 2,251 1,616 3,867 \Vychoproof Poowong and Jeetho 4,065 3,384 7,449 Yackandandah
2,580 1,733 4,313 2,315 2,008 4,323
Portland 2,737 2,554 5,291 Yarrawonga Preston 2,457 2,592 5,049 Yea ..
1,610 1,499 3,109 1,406 1,197 2,603
Pyalong 544 491 1,035 Ripon 2,126 2,010 4,136 Total Shires (146) 301,716 266,778 568,494 Rochester 2,524 2,172 4,696 Rodney 3,639 3,079 6,718 Romsey 954 925 1,879 Outside Local Government Rosedale 1,781 1,591 3,372 Area-Rutherglen 2,571 2,147 4,718 Not incorporated Seymour 1,990 1,841 3,831 Shipping Shepparton 3,243 2,856 6,099
llO 72 182 4,082 723 4,805
South Barwon 1,346 1,366 2,712 'l'otal Victoria 655,591 659,960 1,315,551

STATISTICAL REGISTER OF VIC'rORIA, 1914.-POPULATION.
CENSUS OF 1911.-TOWNS IN VICTORIA WITH A POPULATION OF 1,000 PERSONS AND UPWARDS.
Ararat Borough Avoca Bacchus Marsh Bairnsdale
Town.
Ballarat City .. Ballarat East Town Beaufort Beech worth Benalla Bendigo City Birchip Black burn Box Hill Bray brook Brighton Town Browns and Sca.rsdale Borough Brunswick City Buninyong Borough Camberwell Town Ca.mperdown .. Carisbrook Borough Casterton Castlemaine Borough Caulfield Town Charlton Chewton Borough Chiltern Clunes Borough Cobden Ooburg Borough Colac Coleraine Collin~wood City CresWlck Borough Dandenong Daylesford Borough Dimboola •. Donald DoncQ.ster Dunolly Borough Eagleha wk Borough Echuoa Borough Essendon City Euroa Fairfield Fitzroy City Footscray City Frankston Geelong City .. Geelong West Borough •• Hamilton Borough Hampton Hawthorn City Healesville Heathcote Heidelberg Horsham Borough Inglewood llorough Ivanhoe Kangaroo Flat .. Kerang Kew Town Kilmore Koroit Borough Korumburra KyabraiP
I Population.
4,215 1,232 1,208 3,412
22,017 15,962 1,372 3,409 2,650
28,539 1,208 1,158 2,532 1,371
12,083 1,101
32,215 1,080
12,551 3,473
939 1,431 5,228
15,919 1,352
930 2,746 1,745 1,126 9,505 3,992 1,489
34,190 2,426 1,939 3,846 1,435 1,193 1,158 1,231 7,588 3,546
23,749 1,745 2,342
34,283 23,643
1,173 13,618 7,105 4,900 1,369
24,450 1,567 1,234 2,478 3,328 1,195 1,600 1,014 2,131
11,152 1,278 1,742 2,246 1,613
Kyneton Leongatha Lillydale Ma:ffra Maldon Malvern City Mans field
Town.
Mary borough Borough Melbourne City Men tone Mildura Mirboo Mooroopna Mordialloc Mornington Mortlake M or well Murchison Murtoa Newtown and Chilwell Borough Nhill N orthcote Town Numurkah Oakleigh Borough Penshurst Port Fairy Borough Portland Borough Port Melbourne To\'.'11 Prahran City .. Preston Queenscliff Borough Richmond City Rainbow Rochester Rush worth Rutherglen Borough St. Arnaud Borough St. Kilda City Sale Borough .. Sandringham .. Sebastopol Borough Seymour Shepparton South Melbourne City •. Sta well Borough Surrey Hills Swan Hill Talbot Borough Tatura Terang Traralgon Trentham Walhalla Wangaratta Borough \V arrackna heal Warragul Warrnambool Town Wedderburn Werribee Williamstown Town Wonthaggi Borough Woodend Wodonga Yarrawonga Yea. .•
Population.
3,174 1,875 1,404 1,336 3,077
15,969 1,110 5,675
103,593 1,164 4,608 1,154 1,432 1,434 1,397 1,332 1,080 1,123 1,147 5,831 1,528
17,519 1,351 2,151 1,283 1,949 1,982
13,515 45,367 5,049 2,012
40,442 1,303 1,205 1,348 1,745 3,770
25,334 3,404 2,642 2,174 2,112 3,000
46,190 4,410 2,703 1,769
996 1,230 2,255 2,056 1,139 1,549 3,482 2,484 2,308 7,010 1,204 1,206
15,275 3,200 1,317 1,510 1,848 1,126
[225]
11

12 STATISTICAL REGISTER OF VICTORIA, 1914.-POPULATION.
CENSUS OF 1911.-BIRTHPLACES OF THE PEOPLE RESIDING IN MELBOURNE AND SUBURBS AND REMAINDER OF STATE
(Exclusive o£ Full-blooded A.OiDrl~~ma,J.S ------------------------------~
Population of Melbourne and
Birthplace,
AUSTRALASIA-Commonwea.lth of Australia.-
Victoria.. • • New South Wales Queensland South Australia .. Western Australia Tasmania Northern Territory Australia. (undefined)
New Zealand
EUROPE-
• England .Wales Scotland Ireland Isle of Man Other European British Possessions .. Austria-Hungary Belgium .. Denmark .. France Germany .• Greece Italy Netherlands Norway Portugal Russia. Spain Sweden Switzerland Other European Countries
AsiA-British India. Ceylon Hong Kong Straits Settlements Other Asiatic British Possessions Afghanistan Arabia China Japan Java .. Philippine Islands Syria Other Asiatic Countries
AFRICA-Cape of Good Hope Mauritius .. Natal Orange Free State .. Transvaal .. South Africa (undefined) Other African British Possessions Egypt . . .. Other African Countrit>s
AMERICA
Barbadoes Canada Jamaica .. Newfoundland
.. -, ..
Other American British Possessions .. Argentine Republic Brazil Chile Mexico Peru United States of America Other American Countries
[226]
.. .. , "i •• I
Males.
---
199,595 6,163 1,183 4.314 1~210 5,058
5 3.791 3;279
25,872 676
6,862 7,894
92 224 150 39
331 219
1,761 226 415
66 275 18
477 114 511 105 60
353 35 19 15 12
1 1
2,307 24 4 2
129 15
67 85 36
2 33
245 7 6 5
3 263 28 16 32
7 7 9 6 3
620 44
Suburbs.
Females. Total.
--- ---
229,276 428,871 8,357 14,520 1,606 2,789 5,651 9,965 1,288 2,498 7,281 12,339
7 12 4,880 8,671 3,613 6,892
23,155 49,027 605 1,281
6,441 13,303 11,310 19,204
52 144 217 441 47 197 19 58 88 419
188 407 816 2,577
8 234 193 608 26 92 49 324
3 21 259 736 49 163 56 567 57 162 26 86
296 649 22 57 10 29 11 26 10 22
.. ]
.. 2,3J 38
6 30 11 15 3 5
106 235 6 21
98 165 66 151 30 66
1 3 40 73
271 516 17 24 5 ll 8 13
1 4 162 425 34 62
8 24 21 53 2 9
10 17 5 14 1 7 2 5
429 1,049 38 82
Remainder of State.
Males. Females. Total,
--- --- ---
295,895 285,453 581,348 7,110 7,062 14,172
771 842 1,613 7,086 6,476 13,562 1,034 1,004 2,038 3,557 3,134 6,691
5 1 6 4,882 4,968 9,850 1,689 1,486 3,175
22,191 15,474 37,665 819 590 1,409
7,338 5,936 13,274 11,275 10,998 22,273
95 50 145 174 122 296 130 28 158 33 8 41
448 44 492 252 75 327
2,582 983 3,565 53 10 63
725 166 891 85 9 94
451 32 483 20 3 23
300 37 337 45 15 60
627 26 653 387 83 470
11 1 12
826 131 957 25 18 43 46 4 50 13 4 17 8 5 13 5 .. 5 2 .. 2
1,939 18 1,957 23 4 27
7 1 8 3 2 5
57 31 88 68 .. 68
36 49 85 31 17 48 19 25 44 .. 2 2
8 8 16 136 102 238
7 7 14 13 2 15 11 3 14
5 3 8 255 100 355
14 11 25 17 7 24 21 8 29
6 3 9 8 5 13 3 3 6 4 3 7 1 1 2
465 236 701 37 16 531
The Whole State.
Males. Females. Total.
--- ---
495,490 514,729 1,010,21 9 13,273 15,419 28,692
1,954 2,448 4,402 11,400 12,127 23,527 2,244 2,292 4,536 8,615 10,415 19,030
10 8 18 8,673 9,848 18,521 4,968 5,099 10,067
48,063 38,629 86,692 1,495 1,195 2,690
14,200 12,377 26,577 19,169 22,308 41,477
187 102 289 398 339 737 280 75 355
72 27 99 779 132 911 471 263 734
4,343 1,799 6,142 279 18 297
1,140 359 1,499 151 35 186 726 81 807 38 6 44
777 296 1,073 159 64 223
1,138 82 1,220 492 140 632
71 27 98
1,179 427 1.606 60 40 100 65 14 79 28 15 43 20 15 35
6 .. 6 3 .. 3
4,246 56 4,302 47 10 57 11 12 23 5 5 10
186 137 323 83 6 89
103 147 250 116 83 199 55 55 110
2 3 5 41 48 89
381 373 754 14 24 38 19 7 26 16 11 27
8 4 12 518 262 782
42 45 80 33 15 47 53 29 88 13 5 18 15 15 30 12 8 20 10 4 14
4 3 7 1:08fi 665 1.750
811 541 135
STATISTICAL REGISTER OF VICTORIA, 1914.-POPITLATION. 13
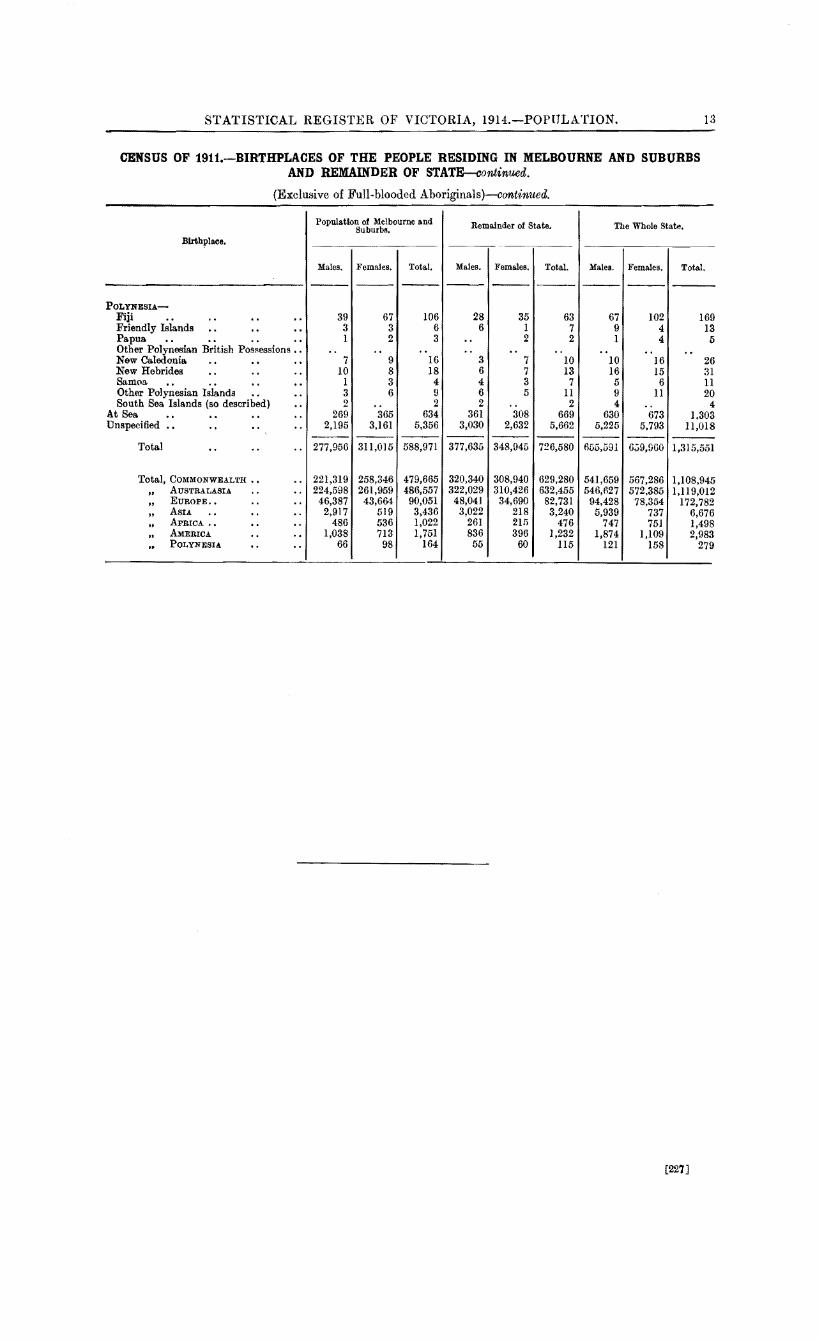
CENSUS OF 1911.-BIRTHPLACES OF THE PEOPLE RESIDING IN MELBOURNE AND SUBURBS AND REMAINDER OF STATE-continued.
(Exclusive of Full·blooded Aboriginals)-continued.
Population of Melbourne and Suburbs. Remainder of State. The Whole State.
Birthplace.
Males. Females. Total. Males. Females. Total. Males. Females. Total.
---- --- --- --- --- --- --- ---PoLYNESIA-
Fiji .. .. .. .. 39 67 I06 28 35 63 67 102 I69 Friendly Islands .. .. .. 3 3 6 6 I 7 9 4 I3 Papua .. .. .. . . I 2 3 . . 2 2 I 4 5 Other Polynesia.n British Possessions •• .. .. .. .. . . .. .. .. .. New Caledonia .. .. .. 7 9 16 3 7 IO IO 16 26 New Hebrides .. .. .. IO 8 I8 6 7 I3 I6 15 31 Samoa .. .. .. I 3 4 4 3 7 5 6 11 Other Polynesian Islands .. .. 3 6 9 6 5 11 9 11 20 South Sea Islands (so described) .. 2 .. 2 2 .. 2 4 .. 4
At Sea. .. .. . . .. 269 365 634 36I 308 669 630 673 I,303 Onspecified •• .. .. . . 2,195 3,161 5,356 3,030 2,632 5,662 5,225 5,793 11,0I8
--- --- --- --- --- --- --- ---Total .. .. .. 277,956 311,015 588,971 377,635 348,945 726,580 655,591 Gi:i9,9GO 1,315,55I
Total, CoMMONWEALTH •• .. 221,319 258,346 479,665 320,340 308,940 629,280 541,659 567,286 1,108,945 .. AUSTRALASIA .. . . 224,598 261,959 486,557 322,029 310,426 632,455 546,627 572,385 1,ll9,012 u EUROPE •• .. .. 46,387 43,664 90,051 48,041 34,690 82,731 94,428 78,354 172,782 u Asu .. .. .. 2,917 519 3,436 3,022 218 3,240 5,939 737 6,676 u AFRICA., .. .. 486 536 1,022 261 2Hi 476 747 751 I,498 ,, AMERICA .. .. 1,038 713 1,751 836 396 1,232 I,874 1,109 2,983 , PoLYNESIA .. .. 66 98 164 55 60 115 121 158 279
[227]

STATISTICAL REGISTER OF VICTORIA, 1914.-POPULATION.
CENSUS OF 1911.-PRINCIPAL RELIGIONS OF THE PEOPLE (Exclusive of Full-blooded Aborigina:ls).
Melbourne and Suburbs. Remainder of State. Th& WlWI~ B&•&e.
Religion.
I. CHRISTIAN. Church of England Methodist .. Presbyterian .. Congregational Baptist Church of Christ Salvation Army Lutheran Seventh Day Adventist Unitarian .. Protestant (undefined) Roman Catholic Greek Catholic Catholic (undefined) Others
Total .•
II. NON-CHRISTIAN. Hebrew Mohammedan Buddhist Confucian Pagan Others
Total
Ill. INDEFINITE. No Denomination Freethinker Agnostic Others
Total
IV. NO RELIGION. Atheist No Religion .. Others
Total ..
V. OBJECT TO STATE
VI. UNSPECIFIED ..
Grand Total
..
..
..
..
..
..
..
.. ..
..
..
..
.. ..
..
..
..
.. ..
.. ..
..
..
..
..
..
Males. Females. Persons. Males. Females. __ __, --- --- --- ---
103,036 114,769 217,805 122,565 110,717 29,301 34,866 64,167 55,075 57,420 41,605 47,324 88,929 75,048 70,576 4,650 5,671 10,321 2,974 3,189 8,632 10,996 19,628 5,502 6,114 4,202 5,391 9,593 3,154 3,764 1,528 2,288 3,816 1,881 2,102 1,649 990 2,639 5,376 3,667
223 436 659 328 456 210 150 360 104 48
7,093 6,187 13,280 6,283 4,553 52,955 64,737 117,692 78,693 75,369
314 76 390 71 12 3,286 3,531 6,817 4,240 3,622 2,153 2,707 4,860 1,658 1,536
--- --- --- --- ---260,837 300,119 560,956 362,952 343,145 --- --- --- --- ---
2,821 2,738 5,559 393 318 45 11 56 315 20 22 .. 22 26 ..
578 3 581 166 1 407 .. 407 93 1 342 114 456 410 18
--- --- --- --- ---4,215 2,866 7,081 1,403 358
--- --- --- --- ---
369 272 641 308 229 302 103 405 346 47 495 184 679 257 37 850 803 1,653 420 202
--- --- --- --- ---2,016 1,362 3,378 1,331 515
--- --- --- --- ---
66 22 88 60 ;,
1,104 332 1,436 827 172 22 5 27 31 ..
--- --- --- --- ---1,192 359 1,551 918 172
--- --- --- --- ---6,930 4,477 11,407 7,282 3,281
2,766 1,832 4,598 3,749 1,474 --- --- --- -- ---277,956 311,015 588,971 377,635 348,945
---------------------
Persons. Males. Females. Perao111.
--- --- ---
233,282 225,601 225,486 4lH,087 112,495 84,376 92,286 176,662 145,624 116,653 117,900 234,553
6,163 7,624 8,860 16,484 11,616 14,134 17,110 31,244 6,918 7,356 9,155 16,511 3,983 3,409 4,390 7,799 9,043 7,025 4,657 11,682
784 551 892 1,443 152 314 198 512
10,836 13,376 10,740 24,116 154,062 131,648 140,106 271,754
83 385 88 473 7,862 7,526 7,153 14,679 3,194 3,811 4,243 8,054
--- --- ---706,097 623,789 643,264 1,267,053 --- --- ---
711 3,214 3,056 6,270 335 360 31 391 26 48 .. 48
167 744 4 748 94 500 1 501
428 752 132 884 --- --- ---
1,761 5,618 3,224 8,842 --- --- ---
537 677 501 1,172 393 648 150 798 294 752 221 973 622 1,270 1,005 2,275
--- --- ---1,846 3,347 1,877 5,224
--- --- ---
60 126 22 148 999 1,931 504 2,435
31 53 5 58 --- --- ---
1,090 2,110 531 2,641 --- --- ---
10,563 14,212 7,758 21,970
5,223 6,515 3,306 9,821 --- --- ---726,580 655,591 659,960 1,315,551

STATISriCAL REGISTER OF VICTORIA, 1914.-POPULATION.
CENSUS OF 1911.-AGES OF THE PEOPLE.
PoPULATION at different ages, as enumerated at the Census of the 2nd April, 1911.
(Exclusive of Full-blooded Aboriginals.)
. Melbourne and Suburbs • Remainder of State. The Whole State.
.Age. Males. Females. Total. Males. Females. Total. Males. Females. Total.
-~-
0 .. .. .. 6,387 6,189 12,576 9,482 8,900 18,382 15,869 15,089 30,958 1 .. .. .. 5,866 5,698 11,564 8,953 8,631 17,584 14,819 14,329 29,148 2 .. .. .. 5,512 5,290 10,802 8,608 8,026 16,634 14,120 13,316 27,436 3 .. .. .. 5,734 5,518 ll,252 8,594 8,502 17,096 14,328 14,020 28,348 4 .. .. .. 5,486 5,390 10,876 8,439 8,273 16,712 13,925 13,663 27,588
Under 5 years .. 28,985 28,085 57,070 44,076 42,332 86,408 73,061 70,417 143,478 ---
5 .. .. . . 5,364 5,413 10,777 8,243 7,939 16,182 13,607 13,352 26,!:159 6 .. .. .. 5,385 5,120 10,505 8,075 i 7,834 15,909 13,460 12,954 26,414 7 .. .. .. 4,967 5,122 10,089 7,769 7,383 15,152 12,736 12,505 25,241 8 .. .. .. 5,290 5,181 10,471 7,676 7,573 15,249 12,966 12,754 25,720 9 .. .. .. 5,195 5,028 10,223 7,651 7,311 14,962 12,846 12,339 25,185
5-10 .. .. 26,201 25,864 52,065 39,414 38,040 77,454 65,615 63,904 129,519
10 .. .. .. 5,180 5,275 10,455 8,009 7,622 15,631 13,189 12,897 26,086 ll .. .. .. 5,276 5,375 10,651 7,857 I 7,634 15,491 13,133 13,009 26,142 12 .. .. . . 4,752 4,986 9,738 7,060 6,930 13,990 11,812 11,916 22,728 13 .. .. .. 5,152 5,001 10,153 7,313 7,135 14,448 12,465 12,136 24,601 14 .. .. .. 5,332 5,328 10,660 7,655 7,237 14,892 12,987 12,565 25,552
10-15 .. .. 25,692 25,965 51,657 37,894 36,558 74,452 63,586 62,523 126,109 ----
15 .. .. .. 5,540 5,925 11,465 7,541 7,288 14,829 13,081 13,213 26,294 16 .. .. .. 5,613 6,195 11,808 7,968 7,164 15,132 13,581 13,359 26,940 17 .. .. .. 5,952 6,539 12,491 7,704 7,065 14,769 13,656 13,604 27,260 18 .. .. .. 6,155 6,864 13,019 7,959 7,053 15,012 14,114 13,917 28,031 19 .. .. .. 5,994 6,868 12,862 7,378 6,758 14,136 13,372 13,626 26,998
15-20 .. .. 29,254 32,391 61,645 38,550 35,328 73,878 67,804 67,719 135,523
20 .. .. .. 6,038 7,070 13,108 7,381 6,775 14,156 13,419 13,845 27,264
Under 21 .. .. ll6,170 ll9,375 235,545 167,315 159,033 326,348 283,485 278,408 561,893 -
21-25 .. . . 21,901 26,742 48,643 26,575 24,630 51,205 48,476 51,372 99,848 25-30 .. .. 23,593 28,503 52,096 28,362 27,148 55,510 51,955 55,651 107,606 30-35 .. .. 19,700 24,ll9 43,819 25,228 24,575 49,803 44,928 48,694 93,622 35-40 .. .. 17,477 21,815 39,292 23,831 22,734 46,565 41,308 44,549 85,857 40-45 .. .. 18,417 21,210 39,627 24,095 21,270 45,365 42,512 42,480 84,992 45-50 .. .. 18,218 19,599 37,817 22,797 18,878 41,675 41,015 38,477 79,492 50-55 .. .. 14,304 14,859 29,163 17,562 14,561 32,123 31,866 29,420 61,286 55-60 .. .. 8,687 9,340 18,027 10,799 9,ll7 19,916 19,486 18.4-57 37,fl43 60-65 .. .. 5,990 7,313 13,303 7,844 7,003 14,847 13,834 14,316 28,150 65-70 .. .. 4,478 6,235 10,713 6,954 6,368 13,322 11,432 12,603 24,035 70-75 .. .. 3,433 4,699 8,132 5,982 5,273 11,255 9,415 9,972 19,387 75-80 .. .. 2,516 3,045 5,561 4,759 3,889 8,648 7,275 6,!)34 14.209 80-85 .. .. 1,341 1,536 2,877 2,562 1,851 4,413 3,903 3,387 7,290 85-90 .. .. 389 485 874 744 644 1,388 1,133 1,129 2,262 90-95 .. .. 93 125 218 174 140 314 267 265 532 95-100 .. .. 7 21 28 27 35 62 34 56 90
lOO and upwards .. 1 3 4 7 7 14 8 10 18
21 and upwards .. 160,545 189,649 350,194 208,302 188,123 396,425 368,847 377,772 746,619
Unspecified .. .. 1,241 1,991 3,232 2,018 1,789 3,807 3,259 3,780 7,039
Total .. .. 277,956 311,015 588,971 377,635 348,945 726,580 655,591 659,960 1,315,553 I
[229)

16 STATISTICAL REGISTER OF VICTORIA, 1914.-POPULATION.
CENSUS OF 1911.-EDUCATION OF THE PEOPLE.
(Exclusive of Full·blooded Aboriginals.)
English Language. Foreign Language only.
Age. Cannot Not Stated. Total. Read and Read only. Read and Read only. Read.
Write. Write.
--·--
MALES.
0-5 73,061 73,061 5-10 53,505 159 2 8 9,575 2,366 65,615
10-15 62,993 9 17 251 316 63,586 15-20 66,598 18 132 8 276 772 67,804 20 and upwards 362,256 1,065 3,378 512 5,562 9,493 382,266 Unspecified 2,401 20 43 4 270 521 3,259
Total 547,753 1,271 3,572 532 88,995 13,468 655,591
FEMALES.
0-5 70,417 70,417 5-10 51,603 195 4 5 8,695 3,402 63,904
10-15 61,975 11 8 160 369 62,523 15-20 66,678 7 26 130 878 67,719 20 and upwards 372,557 2,381 624 60 4,826 11,169 391,617 Unspecified 2,862 32 3 1 221 661 3,780
Total 555,675 2,626 665 66 84,449 16,479 659,960
PBRSONS.
0-5 .. .. .. . . . . .. .. 143,478 . . 143,478 5-10 .. .. .. 105,108 354 6 13 18,270 5,768 129,519
10-15 .. .. .. 124,968 20 25 .. 411 685 126,109 15-20 .. .. .. 133,276 25 158 8 406 1,650 135,523 20 and upwards .. .. 734,813 3,446 4,002 572 10,388 20,662 773,883 Unspecified .. .. 5,263 52 46 5 491 1,182 7,039
Total . . .. 1,103,428 3,897 4,237 598 173,444 29,947 1,315,551
CENSUS OF 1911.-0HILDREN OF BOTH SEXES AGED FROM 6 TO 13 YEARS (BOTH INCLUSIVE) IN MELBOURNE AND SUBURBS AND REMAINDER OF STATE.
Melbourne and Suburbs. Remainder of State. VIctoria.
Particulars. Males. Females. TotaL Males. Females. Total. Males. Females. TotaL
Mumber being educated ! at--
State School .. 28,347 26,481 54,828 49,838 46,655 96,493 78,185 73,136 151,321 Private School .. 9,346 10,754 20,100 6,021 6,693 12,714 15,367 17,447 32,814 Home .. .. 368 523 891 830 1,079 1,909 1,198 1,602 2,800
Number recorded as "Scholar," but class of School not stated .. 811 973 1,784 1,015 859 1,874 1,826 1,832 3,658
Number not indicated as receiving instruction •. 2,325 2,357 4,682 3,7Q6 4,136 7,842 6,031 6,493 12,524
Total .. .. 41,1971 41,088 82,285 61,410 59,422 120,832 102.607 100,510 203.117
_ ..
[230
•

STATISTICAL REGISTER OF VICTORIA, 1914.-POPULATION. 17
CENSUS OF 1911.-PERSONS RECEIVING INSTRUCTION AND NOT BEING INSTRUCTED.
Under 5 5 6 7 8 9
10 11 12 13 14 15 16 17 18
Age.
19 .. 20 and upwards Unspecified
Total
Under 5 5 6 7 8 ~
10 11 12 13 14 15 16 17 18 19 20 and upwards Unspecified
Total
Under lS 5 ~ 7 8 9
10 11 12 13 14 15 16 17 18 19 20 and upwards Unspecified
Total
1114.1.-n.
State School.
1,630 5,381 9,273 9,899
10,338 10,235 10,569 10,425 9,117 8,329 3,508
892 289 155 135
77 93
241
90,586
1,466 4,687 8,492 9,139 9,709 9,468 9,877 9,861 8,909 7,681 3,470 1,074
362 205 103 89 66
208
84,866
3 096 10:068 17,765 19,038 20,047 19,703 20,446 20,286 18,026 16,010
6,978 1,966
651 360 238 166 159 449
175,452
(Exclusive of Full-blooded Aboriginals).
Number being Educated at-
Private School. Home. University.
Number Recorded as "Scholar,"
but Class of School not
stated.
Number not indicated as
receiving Instruction.
------- ------- ---------- --------
MALES.
391 45 34 70,961 73,061 1,033 292 225 6,676 13,607 1,889 334 248 1,716 13,460 1,886 202 226 523 12,736 1,908 165 249 306 12,966 1,953 126 232 300 12,846 1,956 113 203 348 13,189 1,970 102 222 414 13,133 1,880 99 211 505 11,812 1,925 57 235 1,919 12,465 1,669 60 161 7,589 12,987 1,326 45 115 10,703 13,081 1,016 42 12 58 12,164 13,581
636 21 34 37 12,773 13,656 367 22 120 27 13,443 14,114 276 28 112 17 12,862 13,372 592 48 540 19 380,974 382,2nn 62 6 2 85 2,863 3,259
22,735 1,807 820 2,604 537,039 655,591
FEMALES.
381 24 25 68,521 70,U7 1,033 380 316 6,936 13,352 1,874 427 261 1,900 12,954
• 2,248 267 231 620 12,505 2,252 199 209 385 12,754 2,166 155 234 316 12,339 2,373 154 217 276 12,897 2,321 154 250 423 13,009 2,129 132 216 530 11,916 2,084 114 214 2,043 12,136 1,802 102 191 7,000 12,nno 1,348 71 102 10,618 13,213 1,113 31 9 90 11,754 13,359
601 25 13 57 12,703 13,604 347 22 26 53 13,366 13,917 156 9 44 27 13,301 13,626 267 9 112 391,163 391,617 58 4 69 3,441 3,780
24,553 2,279 204 2,762 545,296 I 659,960
PERSONS.
77 2 69 59 139,482 143,478 2,066 672 541 13,612 26,959 3,763 761 509 3,616 26,414 4,134 469 457 1,143 25,241 4,160 364 458 691 25,720 4,119 281 466 616 25,185 4,329 267 420 624 26,086 4,291 256 472 837 26,142 4,009 231 427 1,035 23,728 4,009 171 449 3,962 24,601 3,471 162 352 14,589 25,552 2,674 116 217 21,321 26,294 2,129 73 21 148 23,918 26,940 1,237 46 47 94 25,476 27,260
714 44 146 80 26,809 28,031 432 37 156 44 26,163 26,998 859 57 652 19 772,137 773,883 120 10 2 154 6,304 7,039
47,288 4,086 1,024 5,366 1,082,335 1,315,551
~31J

18 STATISTICAL REGISTER OF VICTORIA, 1914.-POPULATIO~.
CENSUS OF 1911.-CONJUGAL CONDITION OF THE PEOPLE.
TABLE I.-Conjugal Condition of Males and Females in Victoria at the Census of 1911.
(Exclusive of Full-blooded Aboriginals.)
Males. Females.
Ag~. Never Married. Widowed. Divorced. Not Total. Never Married. Widowed. Divorced. Not
Married. stated. :&tarried. stated.
--- --- --- -- --- ~- --- --Under 14 .. 189,275 .. .. . . .. 189,275 184,279 .. .. . . . .
14 .. 12,986 1 .. .. . . 12,987
I 12,559 6 .. .. . .
15 .. 13,081 .. .. . . .. 13,081 13,194 12 1 .. 6 16 .. 13,577 4 .. .. .. 13,581 13,311 44 .. . . 4 17 .. 13,640 16 .. .. .. 13,656 I 13,382 216 . . . . 6 18 .. 14,057 57 .. .. .. 14,114 I 13,402 501 2 .. 12 19 .. 13,235 137 .. .. . . 13,372 I 12,672 939 3 .. 12 20 .. 13.065 352 2 .. .. 13,419 12,209 1,591 19 4 22
21-5 42,075 6,240 60 5 96 48,476 37,119 14,109 102 15 27 25-30 31,498 20,069 281 32 75 51,955 26,521 28,595 442 64 29 30-5 17,720 26,557 525 63 63 44,928 16,354 31,290 930 98 22 35-40 12,285 28,022 860 69 72 41,308 12,085 30,541 1,799 107 17 40-5 10,070 31,054 1,230 89 69 42,512 9,214 30,266 2,870 112 18 45--50 7,897 31,120 1,827 109 62 41,015 6,902 27,318 4,138 108 11 50-5 5,430 24,182 2,111 82 61 31,866 4,572 19,793 4,965 82 8 55-60 3.182 14,455 1,768 46 35 19,486 2,391 11,316 4,718 21 11 60-5 2.204 9,779 1,790 30 31 13,834 1,409 7,368 G,508 20 ll 65-70 1,867 7,396 2,131 14 24 11,432 966 5,153 6,459 15 10 70-5 1,696 5,411 2,266 17 25 9,415 539 3,196 6,220 4 13 75--80 1,170 3,684 2,396 3 22 7,275 312 1,662 4,949 7 4 80--5 571 1,626 1,688 7 11 3,903 150 578 2,652 I 6 85-90 165 385 580 .. 3 1,133 51 120 953 .. 5 90--5 49 81 137 .. .. 267 4 37 223 . . 1 95-100 9 8 17 .. .. 34 5 1 50 .. . .
lOO and over .. 3 5 .. .. 8 .. 1 9 . . . . Unspecified 1.800 l,lll 146 9 193 3,259 1,255 1,812 504 7 202
--- --- --- -- --- --- --- --- --Total 1422,604 211,750 19,820 575 842 655,591 394,857 216,465 47,516 665 457
Total.
---184,279
12,565 13.213 13,359 13,604 13,917 13,626 13,845 51,372 55,651 48,694 44,549 42,480 38,477 29,420 18,457 14,316 12,603
9,972 6,934 3,387 1,129
265 56 10
3,780 -----659,960
TABLB !I.-Conjugal Condition of Males and Females in Melbourne and Suburbs at the Census of 1911. (Exclusive of Full-blooded Aboriginals.)
Are. Ne
~Iarr ver ied.
Under 14 •• 75 14 . . 5 15 . . 5 16 . . 5 17 .. 5 IS . . 6 19 .. 5 20 . . 5
21-5 18 25-30 13 30-5 6 35-40 4 40-5 3 45-50 2 50-5 1 55-60 I 60--5 65-70 70-5 75-8(} 80-5 85--90 90-5 95-100
lOO and over Unspecified
,546 ,332 ,540 ,611 ,942 ,128 ,910 ,836 ,418. ,058 ,944 ,541 ,756 ,807 ,930 ,075 699 502 400 241 107
31 9 I
690
Total 171 ,054
Married.
---.. .. ..
2 10 27 84
200 3,440
10,351 12,471 12,448 14,002 14,435 11,302
6,695 4,452 3,037 2,086 1,334
604 143 32 4
.. 471
---97,630
Males.
Widowed. Divorced. Not stated.
--- --.. .. .. .. .. .. .. .. . . . . .. .. .. .. .. .. .. .. .. .. ..
2 .. .. 30 4 9
144 24 16 238 41 6 417 45 26 587 56 16 891 67 18
1,003 52 17 878 28 11 823 10 6 932 5 2 933 10 4 936 1 4 625 2 3 215 .. ..
52 .. .. 2 .. .. 1 .. ..
74 1 5 --- --
8,783 346 143
Females,
-
Total. Never Married. Widowed. Married. Divorced. Not Total. stated.
------ ---75,5461 5,332
74,586 .. . . 5,325 3 ..
74,586 5,328
5,540: 5,6131
5,912 7 I 6,170 24 ..
5 5,925 I 6,19S
5,952! 6,447 92 .. 6,539
6,1551 5,994 6,038
21,901
6,636 222 2 6,423 438 2 6,294 736 18
19,846 6,826 52
4 6,864 5 6,868
4 18 7,070 7 ll 26,742
23,593[ 14,326 13,879 239 47 12 28,503 19,7001 17,477'
8,858 14,676 503 6,485 14,224 1,023
71 ll 24,119 77 6 21,815
18,41 T 4,~28 14,503 1,690 83 6 21,~10 18,218 14,3041
3,750 13,362 2,405 2,588 0,477 2,735
78 4 19,599 58 1 14,859
8,6871 5,9901 4,4781 3,433
1,414 5,343 2,562 899 3,514 2,880 610 2,289 3,326 336 1,364 2,996
17 4 9,340 15 5 7,313 9 1 6,235 2 1 4,699
2,516 1 200 635 2,208 2 3,045 1,341! 91 196 1,247 2 1,536
389. 26 52 405 2 485 931 .. 19 105 1 125
7! 4 .. 17 21 }I
1,2411
277,956 J
.. 1 2 632 936 276
---182,786 102,818 24,694
3 5 142 1,991
475 242 311,015
I ~--

STATISTICAL REGIS'fER OF VICTORIA, 1914.-POPULATION. 18
CENSUS OF 1911.-0CCUPATIONS OF THE PEOPLE.
Grade.
Oeeapation (Class). Working Assisting,
1
on Own but not In Receipt Employer. • Account, Receiving of Wages Unemployed. Not
but not Wa~es or Salary. Applicable. Employing or Sa ary.
I
Not Total. Stated. .
Labour.
Professional .• 2,581 6,625 52 27,808 538 5,542 673 43,819 Domestic 4,365 2,614 464 50,527 2,059 1,617 529 62,175 Commercial .• 11,528 9,877 816 59,862 1,900 6,399 1,229 91,611 Transport and Communication 1,358 1,496 80 34,196 872 966 270 39,238 Industrial 14,857 8,525 492 147,933 8,813 5,434 1,719 187,773 Primary Producers 32,008 20,429 13,495 64,404 2,615 3,507 Independent .. 8,053
7,926 144,384 .. 8,053
Total Breadwinners 66,697 49,566 15,399 384,730 16,797 31,518 12,346 577,053
Dependents .. .. 721,137 .. 721,137 Unspecified .. 331 174 6,876 972 1,145 5,203 2,660 17,361
Grand Total 67,028 49,740 22,275 385,702 17,942 757,858 15,006 1,315,551
CENSUS OF 1911.-POPULATION OF MELBOURNE AND SUBURBS AND REMAINDER OF STATR CLASSIFIED ACCORDING TO LENGTH OF RESIDENCE IN AUSTRALIA.
(Exclusive of Full-blooded Aboriginals.)
Melbourne and Suburbs. Remainder of State. The Whole State. Length of Residence in Australia
in Years. Males. Females. Persons. 1\fales. Females. Persons. Males. Females. Persons.
--- --- --- --- --- --- --- -~-
0-5 .. .. .. 7,308 4,847 12,155 6,190 2,285 8,475 13,498 7,132 20,630 5--10 .. .. .. 2,031 1,496 3,527 1,435 681 2,116 3,466 2,177 5,643
10-15 .. .. .. 2,775 1,393 4,168 1,692 625 2,317 4,467 2,018 6,485 15-20 .. .. . . 2,633 2,141 4,774 2,007 1,117 3,124 4,640 3,258 7,898 20-25 .. .. . . 9,151 7,031 16,182 5,763 2,956 8,719 14,914 9,987 24,901 25-30 .. .. .. 7,868 5,343 13,211 4,557 2,139 6,696 12,425 7,482 19,907 30-35 .. .. .. 4,267 2,976 7,243 3,250 1,548 4,798 7,517 4,524 12,041 35--40 .. .. . . 2,532 2,281 4,813 2,153 1,427 3,580 4,685 3,708 8,393 40-45 .. .. . . 2,816 3,463 13,279 3,447 2,868 6,315 6,263 6,331 12,594 45-50 .. .. .. 2,958 3,879 6,837 4,G43 4,406 9,049 7,601 8,285 15,886 5Q-55 .. .. .. 3,482 4,905 8.387 6,040 5,485 11,525 9,522 10,390 19,912 55-60 .. .. .. 4,812 6,347 11,159 8,428 7,611 16,039 13,240 13,958 27,198 60-65 .. .. .. 898 1,274 2,172 l,H54 ),590 3,244 2,552 2,864 5,416 65-70 .. .. . . 133 261 394 373 355 728 506 616 1,122 70-75 .. .. . . lOO 167 267 246 223 469 346 390 736 75-80 .. .. . . 14 31 45 36 34 70 50 65 115 80-85 .. .. .. 3 5 8 11 13 24 14 18 32 85-90 . . .. .. 1 3 4 2 3 5 3 6 9 90-95 .. .. .. .. .. .. 1 . . 1 I . . 1 95-100 .. .. .. .. .. .. .. . . . . .. . . . . 100 and upwards .. .. .. .. .. . . .. .. . . .. . . Unspecified .. .. 2,855 4,826 7,681 5,367 4,639 10,006 8,222 9,465 17,687 Australian born .. .. 221,319 258,346 479,665 320,340 308,940 629,280 541,659 567,286 1,108,945
--- --- --- - --- --- --- -Total .. .. .. 277,956 311,015 588,971 377,635 348,945 726,580 655,591 659,960 1,315,551
BZ t233)

't3 rf .......
8 ~ .£' . : Birthplace, .!;lO ~z
A US'Ill.ALASIA-Commonwealth of Australia-
! Victoria .. 2 New South Wales 3 Queensland .. 4 South Australia 5 Western Australia 6 Tasmania .. 7 Northern Territory 8 Australia (undefined) 9 New ZPaland
ElTROPE-10 Em;land 11 Wales .. 12 Scotland 13 Ireland 14 Isle of Man • . • • . • 15 Other Enropt,an British Possessions 16 Austria-Hungary 17 Relgium 18 Denmark 19 France •. 20 Germany 21 Greece 22 It.'l.Jy •• 28 Netherlands 24 Norway 25 Portu~al 26 Russia 27 Spain •• 28 Sweden 29 Switzerland . . • . 30 Other European Countries
ABIA-11 British India 82 Ceylon 83 Hong Kong •. 34 Straits Settlements • • • • 85 Other Asiatic British Pos.'*'ssions •. 86 Afghanistan 37 Arabia. 88 China •• 39 Japan •• •o Java • • . • 41 Philippine Islands •2 Scyria • . • • 43 Other Asiatic Countries
AFRICA-.4 Capt> of Good Hope 45 Mauritius •. •e Natal • . . . 47 Oran~te FreP State 48 Transvaal •• •9 Sout.h Africa (undf'flned) •• 60 Other African Britillh Possessions •• 51 Eqypt.. • • • • i2 Other African CountrJes ••
BIRTHPLACES AND AGES OF MALES IN THE STATE OF VICTORIA AT THE CENSUS, 2nd APRIL, 1911. (Exclusive of Full-blooded Aboriginals.)
0-5. 5-10. I 10-15. 115-20. I 2o-25. I 25~30. I 30-35. I 35-40. I 40-45. I 45-50. I 50-55. I 55-60. I 60-65. I 65-70. I 70-75. 75-80. I 80-85. I 85-90.1 90-95.
260
208 10 57 11
1 1 5
3 1
2 2
12
1 2
3 1
2
7
2 1
12 50 1
1,42!) 272
4.28 5
102 25
1 2
10 3 2
10 1 3 5 3
6
5 1
17
20
20 90
2 1 1
58,2:05 1,242
218 431 5i3 426
2 1,431
139
348 5
98 25
1 5
3 2
13 4
28
10 3
2 1
23 1 2 1
18 3
13 2
11 3
12 1 7
44
61,522 1,522
240 584 112 611)
1 1,384
203
676 7
112 55
2 9 4
11 22
106 29 sa
2 89
22 9
15 3 6
42 2 3 3 4
1 10
6
1 12
2
52,366 1,733
372 1,066
63 901
5 967 485
1,724 34
431 270
7 10 20
5 43 22
270 38
100 14 72
.. 81 16 71
9 7
103 1 5
48
3
16 12
4 5 2
21 2 7 1
712 836
2,570 132
760 467
6 14 26
7 48 46
241 48
107 13 44
78 20 57 10 16
132 3 5 5 1
208 2
24 17
9 7 3
31 1 8
2,653 88
704 563
6 7
24 3
40 31
268 44
lH 12 36
3 58 18 7() 18 10
142 10 15
2 2
536 17
1 1
26 10
5 15
4
24
2 •. 1
31,362 829 112 962
21 536
558 571
2,616 67
674 745
3 25 20
5 27 35
231 34
112 9
46 3
50 21 71 33
5
167 7 7
1 2
691 9
•. 18
13
1 9 3
1 13 2 1 1
556 625
3,633 109 863
1,194 20 25 23
9 57 34
305 13
107 7
81 4
82 21
118 31
8
133 11 11
1 1 1 1
701 7 2
27 5
4 18
3
11 1 1 !
26,588 661
97 1,144
30 743
1 460 450
4,721 161
1,323 1,951
28 43 39
6 89 33
429 24 D3 12
114 2
94 8
199 40
4
114 7 1
15 4
7 17 1
19 1 1 8
'io7 136
4,569 189
1,355 2,017
25 46 28 13
118 48
463 13 94 10 98
6 83
7 167
48 5
91 6 4 2 5 1
382
1 16
7
7 17 1
13
3
6,986 373
21 790 26
536
118 62
5,117 173
1,472 1,739
16 54 25
2 80 46
416 8
78 12 79
2 69 9
118 46
3
57 4 1 1 1 1
220 1
5 2
10 7 4
21
1,942 336
7 472 14
428
49 33
5,278 140
1,587 1,967
15 49 14
3 57 49
371 3
52 11 42
4 49
2 69 47 2
47 4 1 3
3 1
10 4
13
987 256
1 162
5 392
22 23
4,128 135
1,326 2.585
13 41 19
7 72 37
381 6
61 12 26
2 38
5 63 48
29 1 1
133
2 1 2 2
3 6
4 1
8 6
3,610 142
1,2411 2,539
14 26
9 4
60 30
360 3
46 13 21
4 18
9 53 69
21 1 4 l
'2o4
2 3
3
14 13
1
1 33
31 2 2 2
3,042 83
1,059 1,765
19 29' 10
1 49 16
272 4
21 14 17
8 13 s
S1 55
.. 1
1,764 65
695 764
8 15
2 3
17 18
126 4 9 8 5 4 8 1
18 24
15 I 6
1 1
197
6
90
2 I 2
1
2 3 1
13
545 12
212 203
3 2 2
4 4
40
3 1 1
s 5 2
30
4 2
7
120 2
38 55
1 1
1 11
5
95-100,
9
6 8
2
100 and upwards.
2
4 2
Unspeci· fied.
1,890 61
6 56 8
45
118 28
212 6
77 219
2 5 3
2 1
%3 3
19
4
8 1
10 6 2
34 1
2 l
1
Total.
495,490 13,273
1,954 11,400
2.244 8,615
10 8,673 4,968
48,063 1,495
14,200 19,169
187 398 280
72 779 471
4,343 279
1,140 151 726 38
777 159
1,138 492
71
1,179 60 65 28 20
6 3
4,246 47 11
5 186
83
103 116
55 2
41 381 14 19 16
1.\:) 0
00 1-:3 > 1-:3 H 'l:< ri H 0 > ~
:;tl t;rj ~ H 00 H r-:1 ~
0 1-:x:j
....... c.o .... ~
~ 0 ""= c:: t"' ll> 1-:3 -0 z
'i3 .?l'
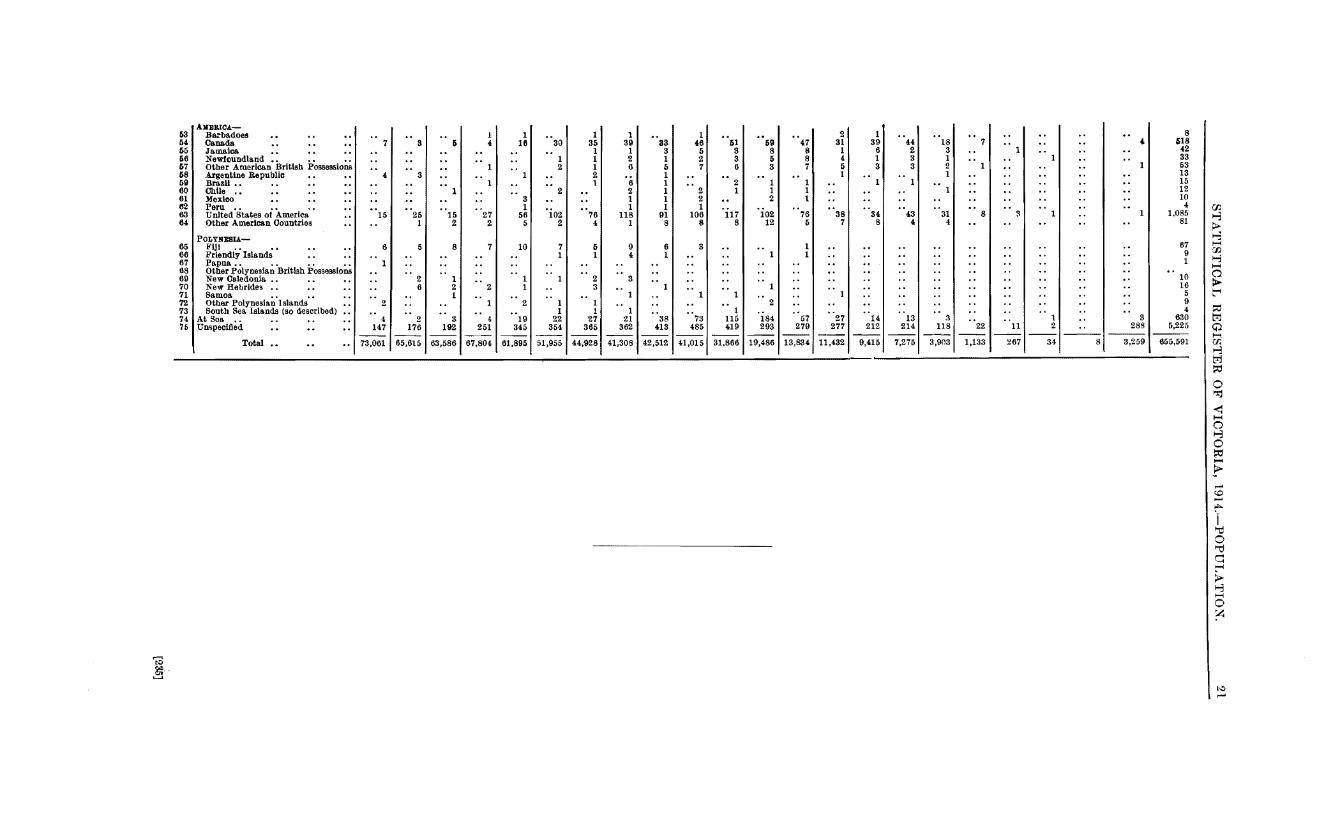
AKJ!lli.IOA-53 Barba.does • • • • • • 54 Canada. • • • • •• 55 Jamaica •• • • •• 56 Newfoundland • • • • • • 57 Other American British Possessions 58 Argentine Republic • • • • 59 Brazil.. •• •• •• 60 Chile • • • • • • •• 61 Mexico • • • • • • 62 Peru •• .. •• •• 63 United States of America •• 64 Other American Countries ••
POLYNJIISU.-65 b'iji • • • • • • • • 66 Friendly Islands • • • • 67 Pa.pna •• • . • • •• 68 Other Polynesia.n British Possessions 69 New Caledonia • • • • • • 70 New Hebrides • • • • • • 71 Samoa. •• •• • •
7
4
.. 15
6
8
3
25 1
2 6
5
.• l
•• 15
2
8
1 2 1
1 4
7
2
1 16
3 1
56 5
10
1 1
30
1 2
2
'io2 2
7 1
1 35 1 1 1 2 1
.. 76 4
5 1
2 3
1 39 1 2 6
6 2 1 1
118 1
9 4
3
33 3 1 5 1 1 1 1 1
91 8
6 1
1 46
5 2 7
2 2 1
106 8
3
1
51 3 3 6
2 1
117 8
•• 59 8 5 3
1 1 2
'io2 12
1
.. ,7 8 8 7
.. 1
1 1
•• 76
5
2 31
1 4 5 1
38 7
•• 1
72 Other Polynesb.n I stands •• , 2 • • • • 1 2 1 1 .. .. .. • . 2 .. . • 73 South Sea. Islands (so described) • . • • • • • • • • • • 1 1 1 • • • • 1 • • • . • . 74 At Soa .. • • .. • • 4 2 3 4 19 22 27 21 38 73 115 184 57 27 76 Unapecifled • • • • .. 147 176 192 251 345 354 365 362 413 485 419 293 279 277 ---- ---- ---- ---- ---- ---- ---- ---- ----
Total •• .. I 73,061 65,615 63,586 67,804 61,895 51,955 44,928 41,308 42,512 41,015 31,866 19,486 13,834 11,432
1
391 44 6 2 1 3 3 3
11 1
. I '!
141 13 212 214
9,4151 7,275
18 3 1 2 1
"31 4
3 118
3,903
7
8 :t
22 11
1,133 267
1
1 2
34 8
'
3 288
3,259
8 518
42 33 53 13 15 12 10 4
1.085 81
67 9 1
.. 10 16
5 9 4
630 1),225
655,591
00 1-3 > ~ 1--1 ':.IJ 1-:l 1--1 0 > r ::0 ~ Q 1--1 00 .-:3 ~ ~
0 ~
~ 1--1 0 1-3 0 ~ ~
?-,......
~ ,:>.
'i ~ 0 '"'0 c: 1--1
> 1-3 1--1 0 ~
t...::> ,......

'i a
8
i lio 1QZ
1 2 3 4 6 6 7 8 9
10 11 12 13 14 15 16 17 18 19 20 !1 :2 23 24 26 26 27 !8 %9 ao :11 IZ 33 .. S5 SI '17 18 S9 40 41 4.2
" t4 u 46 47 a •• 6.0 51 it
N,•w EUROPE
England Wa.les .. Seotland
Birthplace.
Ir~>la.nd . . . . • • hle of M:an . • . • • • Other European British Possessions Austria-Hungary Belgium .. Denmark France .. Germany Greece Italy .. Netherlands Norway Portugal Russia. Spain .. Sweden Switzerland • • • • Other European Countries
Asu.....,. British Ind.Ja Ceylon •. Hong Kong •• Straits Settlements • • • • Other Asiatic British POSil8sslons •• Afgllanistan Arabia China •• Japan .• Java •• •• PbiUppine Islanda Syria • • • • • • other Asiatic Countries ••
AlPRlCA-Ca.pe of Good Hope Mauritius •• Natal •. .. Orange Free State Transvaal • • • • • . Routb Africa (undefined) •• Other African British Posaessfolll,. Egypt.. •• .. Other African Countries ••
BIRTHPLACES AND AGES OF FEMALES IN THE STATE OF VICTORIA AT THE CENSUS, 2nd APRIL, 1911.
0-5.
67,572 821 107 231 454 361
218
272 7
66 12 2
3 5 1 5 1
6 1
3
5
6
"u "u
GG 1
5-10.
58,340 1,o:n
156 355 722 4::12
1,637 2,)8
378 7
88 31
4 2
3 2
13 2 7
3 5
12 1 2 s 1
2 2 1
4:
19
21 2
23 98 1
10-15.
56,949 1,253
220 450 570 39-!
1,625 164
396 1
91 37
2 1
12 1
17
2
11 2 1 3
10
1 2
1 7 2
8 3 1
8 41 8
15-20.
61,848 1,564
291 I} HI 126 641
.. 1 1,417
221
367 1
74 53 1 1 :~
1 1 7
14 3
36
1
15 3 s 3 4
14
2
2
1 13
6 2 3
12
1 1
20-25.
56,837 2,112
466 1,111
88 990
3 1,104
508
86-! 10
180 203
6 5 1 7
14 44 1
50
6
22 3 5 6 3
21 4
1 1
4
1
17 1
11 1
2 16
(Exclusive of Full-blooded Aboriginals).
25-30. I 30-35. I 35-40.
44,873 2,156
861 1,890
60 1,08J
776 908
1,748 47
398 408
5 12
8 2 8
19 63
4 46 2
12 1
28 5 4
11 4
45 6 1
12 2
21
17 5 6 1 1
44 1 2 1
:H~,997 1,553
260 1,4-l,2
54 779
1 666 894
92 1
43 2 9
34 6
1 3
5 2
.. 12
12 10
3
25 1
35,487 1,108
191 1,125
46 813
1 679 645
2,042 59
514 874
1 10 10
3 11 21
100
23 3 3 1
25 7 6 8 4:
55 4 4 1 1
10 2 2 2
16 1
7 8 2
15
2 1
40-45.
82,794 985 208
1,173 38
856
654 625
2,316 56
580 1,206
6 18
6 3
13 23
102 1
27 5
11 1
32 5
14 10
1
49 5 5
1
7
3 1
13 2
9 3 1
6 3
45-50.1 50-55.1 55-60. I 60-65. I 65-70. I 70-75. I 75-80.
28,125 752 122
1,085 36
948
542 385
2,915 99
752 1,648
9 22
8 1
20 28
128 1
32 2 4 1
46 6 8
12 2
48 2 2 1 1
6 1 8
10
10 11
8
1 18 1
19 675 594 24
1,057 24
889
382 111
3,050 117 892
1,624 10 20
5 3
15 24
149 2
27 6
10
34 4
12 10
2
22 2
1
2
1
7
9 9
..10 8 1 1
7,349 462 22
822 28
644
157 55
4,321 155
1.383 2,004
9 44 9 2
13 19
187
15 3
10
21 2
2 1
2
6
19 6 2
1 18
1
2,231 374
8 441
14 549
53 41
4,907 l:l7
1,613 3,008
19 59
2 4 9
20 226
12 2 8
30 2
2
4
9 8
9 4
1,210 349
2 180
14 470
27 a2
8 3 1 2 5 1 2 9
26 1
2 11
3 1
161 155
1 61
6 293
6 4
4 4 1
8 3 7
12
19 1
1 2
4 1
2
46 48 1 6 3
135
5
2,728 111
1,195 2,147
3 25
1 1 3
6 2
5
11
1 2
1 2
100 and 80-85. I 85-90. 190-95. 19&-100. I upwards.
121 8 14 9
50
5
1,528 44
687 8C6
4 10
1
2 7
58
3
3 1
2
544 17
220 232
6
4 21
1
1 2
127 3
53 51
4
1 1 5
20
16 12
2
2
3 5
Unspeci· fled.
2,214 87
8 75
9 76
113 30
280 10 97
364 1 4 1
6 13
1 3
3
1 1 2
1 2
1 1
Total,
514,729 15,419 2,448
12,127 2,292
10,415 8
9,848 5,099
38,629 1,195
12,377 22,308
102 339
75 27
132 263
1,799 18
359 35 81
6 296
64 82
140 27
427 40 14 15 15
56 10 12
5 137
6
147 83 55
8 48
373 24
7 11
~ ~
[/).
~ ~ H ....... (f)
H ....... a > t"i ~ M Q ....... [/).
H M ~ 0 ~
-< ....... a H 0 l;:C
"""" ? ....... t'.C -~ .I ~ 0 ""C d t"i > 1-3 -0 ~

AMERIOA-~ Barbadoes 54 Canada 65 Jamaica 56 Newfoundland • . • . • . 57 Otber American British Possessions 58 Ar~tentine Republic 59 Brazil.. • • 60 Chile .• 11 Mexico 62 Peru • . • . • • 63 Unit,ed States of America 64 Other American Countries
PoLY'fESIA.-15 Fiji . • .• 66 Friendly Islands 67 Pa.pua. . • . • •• 18 Other Polynesian British Possessions G9 New Caledonia •. 70 New Hebrides •• 11 Samoa •. •• 72 Other Polynesia.n Islands 73 Sout,fJ Sea Islands (so described) 74 At Sea •• 75 Unspecified
Total
'i .::!
4
11 1
2
1 2 1
3 148
9
14
8
1 2
1 203
2
2
18
7
1
2 193
3
22 1
14
6 293
3 3
2
33 1
10 1
4 5
19 405
16 1
55 2
14
4
28 415
14 5
1 50 3
12 1
1 2 1 1
.. 32 462
•• 20
1
•• 72
5
16 1
2
32 445
20 1 1 4
2 2
1 69
4
6 1
1 1 2
44 443
•• 22
2 1 2
55 1
4
2
.. 65 464
•• 26
4
4
2 1
1 65
3
4
98 369
1 23
5 1 6
•• 78
6
'2os 295
32 9 1 5
6 1
• .47
8
3
66 290
26 3 5 2
31 9
33 303
70,417 t 63,0041 62,523 I 67,719165,2171 55,651 t 48,6941 44,549 I 42,480 I 38,477 I 29,420 118,4571 14,316 I 12,603
1 22
5 3
1 1
.. 19 2
1
•. 20 288
9,972
11 2 1 1
2
11 5
10 237
6,934
1 2 4
7 3
3 123
3,387
4
2 2
4
1 40
1,129
2
1 13
265 66 10
1
3
4 363
3,780
4 262
45 16 29
6 16
8 4 3
665 54
102 4 4
16 15
6 11
673 5,793
659,960
00 1-3 > 1-3 H 00
'"" ~ 0 > t'-1
!:l:i t_l;j Q ~
00 1-3 trj ~
0 1-:J::j
-< -0 ~ 0 ~ ~
..> I-' <.0
..... . , "'d 0 "'d q t'-1 > '"" H 0 ~
to ~

24 STATISTICAL REGISTER OF 1914.-POPULATION.
CENSUS OF 1911.-AGES, BIRTHPLACES, AND CONJUGAL CONDITION OF THE BLIND.
(Ages of the Blind.)
[238]
Age Group. Males. Females. Total.
------ ------- -------Under 5 years ... l.i 7 12 5 to 10 years .•• 7* 2 9*
10 " 15 , 4 5 9 15 " 20 "
16* 15 31* 20 " 25 " 16 11 27 25 J) 30 "
19 14 33 30 " 35 "
19* 23 42* 35 " 40 "
23* 17 40* 40 " 45 "
35 29 64 45 " 50 "
48 30 78 50 " 55 "
53 32* 85* 55 " 60 "
49 31 80 60 " 65 "
39 36 75 65 " 70 "
62* 42* 104t 70 " 75 ,, 41 51* 92* 75 " 80 "
71 59 130 80 " 85 , 44* 52 96"' 85 " 90 "
27 32 59 90 " 95 "
11 11 22 95 ., 100
" 3 3 6
Unspecified 3 5 8 ____ .,. ____ Total 595 507 1,102
• Including one blind deaf mute. t Including two blind deaf mutes.
BIRTHPLACES OF THE BLIND.
Birthplace. Males.
Australasia-Victoria. 217* New South lV a.les 14 Queensland South Australia 9 Western Australia ... 1 Tasmania .•• 14 Australia undefined 6
-----Commonwealth 261
New Zealand 2 Europe-
155t England Wales 4 Scotland 37 Ireland 82 Isle of Man Other European British Possessions
2 Denmark France 2 Germany 12 Greece 1 Italy 2 Portugal 1 Russia 3 Sweden 1 Switzerland
Asia-British India 2 China 14
Africa-Cape of Good Hope ... South Africa (undefined) Other African British Possessions
America-t\ ewfoundla.nd United States Other American Countries
At Sea Unspecified
Total
• Including four blind deaf mutes.
1 3t 1
8
595
t Including one blind deaf mute. § Including two blind deaf mutes.
Females.
------166t 13 2 7 1
11 8
------208
3
126t 2
43 91 1 1
8
1
1 1
2
1 16t
507
Total.
383t 27 2
16 2
25 14
469
5
281§ 6
80 173
1 1 2 2
20 1 2 1 4 1 1
3 14
1 1 1
1 5t 1 1
24t
1,102
t Including fiw blind deaf mutes.

STATISTICAL REGISTER OF VICTORIA, 1014.-POPULATION.
CONJUGAL CONDITION OF THE BLIND.
Conjugal Condition.
Married Never Married Widowed Divorced Not stated
Total
• Including six blind deaf mutes.
Males.
-----
207 264* 121
1 2
595
t Including one blind deaf mute. § Including two blind deaf mutes.
l!'emales. Total.
-----135 342 17lt 435:t: 200§ 321§
1 3
-----507 1,102
:t: Including seven blind deaf mutes.
CENSUS OF 1911.-AGES, BIRTHPLACES, AND CONJUGAL CONDITION OF DEAF MUTES.
Under 5 years 5 to 10 years
10 " 15 " 15 " 20 20 ,. 25 " 25 " 30 30 " 35 35 lt 40 40 " 45 45 50 50 " 55 " 55 " 60 60 " 65 65 " 70 70 " 75 75 " 80 80 , 85 " 85 " 90 90 " 95 95 , lOO Unspecified
Total
Age Group.
(Ages of Deaf Mutes.)
Males.
-----5
29* 38 35"' 20 21 13* 20* 20 15 22 11 10
7* 2 3 3*
6
280
Females.
-----2
33 37 20 24 18 12 22 16 19 11* 9 7 4* 5* 5 5 1
5
255
• Including one blind deaf mute. t Including two blind deaf mutes.
Tota.l.
------7
62* 75 55* 44: 39 25* 4:2* 36 34 33* 20 17 Ut 7* 8 8* 1
11
535
[230]
25

STATISTICAL REGISTER OF VICTORIA, 1~14.-POPULATIO.N.
BIRTHPLACES OF DEAF MUTES.
Birthplace. Males. Females. Total.
Australasia-Victoria .. .. .. 205* 199t 404t New South Wales .. .. 8 2 10 Queensland .. .. .. 1 .. 1 South Australia . . .. 5 10 15 Yv est ern Australia .. .. 1 1 2 Tasmania .. .. . . 3 5 8 Australia undefined .. .. 5 1 6
Commonwealth .. .. 228 218 446
New Zcahnd .. .. .. 3 5 8 E,n·ope-
England .. .. . . 27t 18t 45§ Scotland . . .. .. 5 5 10 Ireland .. .. . . 6 3 g :France .. .. . . . . .. 1 1 Germrmy .. .. . . 2 .. 2 Italy .. . . .. .. l . . 1 Switzerland .. . . .. 1 . . 1
A-,ia-China .. .. . . .. 1 .. 1
Africa-South Afriea .. .. .. 1 .. 1
America-United States .. .. .. It . . It
Unspecified .. .. . . .. 4 5-f 9t Total .. .. .. 280 255 535
* Including four blind deaf mutes. t Including one blind deaf mute. § Including two blind deaf mutes.
t Including five blind deaf mutes.
CONJUGAL CONDITION OF DEAF MUTES.
Conjugal Condition.
Married Never Married Widowed .. Divorced· .. Not stated ..
Total
Males.
51 223*
4
2
280
Females.
54 184t
15§
2
255
Total.
105 407t
19§
4
535
• Including sh: blind deaf mutes. t Including one blinrt deaf mute. t Including seven blind dear mutes. § Including two blind deaf mutei!.
CENSUS OF 1911.-NATURE OF DWELLINGS.
Nature of Dwelling.
Private House Tenement in Private House Caretaker's Quarters in Store, Offices, &c. Hotel Boarding House, Lodging House, Coffee Palace Educational Institution Religious Institution (non-Educational) Hospital Charitable Institution (other than Hospital) Penal Establishment Military and Naval Establishments Police Barracks Police Station and Quarters Fire Station Unspecified Wagons, Carts, Trains, &c. Aboriginal Camps in which Whites or Half-castes were Living Other Camps without Dwellings ..
Total
Number.
261,977 1,657
280 2,932 4,390
173 39
317 100
35 28 14
318 56
221 145
1 812
273,495

STATISTICAL REGISTER OF VICTORIA, 1914.-POPULATION. 27
CENSUS OF 1911.-PRIVATE AND OTHER DWELLINGS CLASSIFIED ACCORDING TO MATERIAL.
Number of Dwellings. Inmates of Dwellings. MR.terials.
Private. Other. Total. Private. Other. Total.
Stone 5,905 664 6,569 29,707 9,597 39,304 Brick 69,537 5,064 74,601 328,362 63,111 391,473 Concrete 655 42 597 2,840 418 3,258 Iron .. 2,619 43 2,662 11,008 354 11,362 Wood 175,122 2,937 178,059 806,687 24,452 831,139 Sun-dried Bricks 2,203 5 2,208 10,593 84 10,677 Pis6 54 54 310 310 Lath and Plaster 619 12 631 2,607 39 2,736 Wattle and Dab 335 335 1,341 1,341 Bark .. 671 671 1,565 1,565 Bushes, Rushes, Spinife:x:, &c. 7 7 8 8 Calico, Canvas, Hessian 4,762 8 4,770 7,842 51 7,893 Ruberoid and other Compositions 41 l 42 126 7 133 Unspecified • . • . 1,204 127 1,331 4,630 2,899 7,529 Wagons, Carts, Trains, &c. 145 145 287 287 Aboriginal Ca1llps in which White or Half.
castes were living l l l 1 Other Camps without Dwellings .. 812 812 1,730 1,730 Shipping .. . . . . 4,805 4,805
Total 263,634 9,861 273,495 1,207,716 107,835 1,315,661 I
CENSUS OF 1911.-INMATES OF PRIVATE AND OTHER DWELLINGS (CLASSIFIED ACCORDIN.G TO NUMBER OF ROOMS).
1 .. 2 3 4 5 •• 6 .• 7 8 .. 9
10 11 lJ .. 13 14 .. 15 16 17 .. 18 19 20 and upwards Unspecified ..
Number of Rooms.
Wagons, Carts, Trains, &c. . . . . Aboriginal Camps in which Whites or Half-castes were Living Other Camps without Dwellings Shipping
Total ..
Private.
13,015 23,582 63,728
260,270 272,491 248,934 142,659 80,882 39,241 25,036 10,090 8,363 3,694 3,662 1,869 1,367
812 621 372
2,565 4,463 .. .. .. ..
1,207,716
Inmates of Dwellings.
Other. TotaL
149 13,164 133 23,715 251 63,979 881 261,151
2,311 274,802 4,934 253,868 6,149 148,808 6,696 87,578 5,889 45,130 6,266 31,302 4,335 14,425 4,788 13,151 3,171 6,865 3,581 7,243 3,037 4,906 2,536 3,903 2,260 3,072 2,131 2,752 1,657 2,029
34,006 36,571 5,851 10,314
287 287 1 1
1,730 1,730 4,805 4,805
107,835 1,315,551
[24ll

28 STATISTICAL REGISTER OF VICTORIA, 1914.-POPULATION.
CENSUS OF 1911.-WEEKLY RENTAL VALUE OF PRIVATE DWELLINGS.
Weekly Rental Value. Number. Weekly Rental Value. Number.
Under Is. 641 3ls. and under 3'2s. .(()
Is. and under 2s. 4,324 328. , , 33s. 271 28. "
, 3s. 8,I91 33s. , , 34s. 42 3s. " 4s. 7,I06 34s. , 35s. 66 4s. , , 5s. 9,300 35s. , , 36s. 566 5s. 11 11 6s. 24,887 36s. ,
" 37s. 31 68. , If 7s. 16,927 37s. If , 3Ss. 68 7s. 11 If Ss. I9,I36 38s. If 11 39s. 56 Ss. , If 9s. I7,9S4 39s. If If 40s. 6 9s. If 11 lOs. 9,33I £2 11 , £2 5s. I,044
I Os, If If lls. 30,I66 £2 5s. and under £2 IOs. 160 lis. , I2s. 7,508 £2 IOs. , £215s. 323 I2s. , I3s. I5,333 £215s. If 11 £3 40 13s. , 11 14s. 4,601 £3 11 If £3 5s. 277 14s. 11 If I5s. 4,391 £3 5s. ,
" £3 10s. 23 15s. 11 , 16s. 11,264 £3 !Os. , 11 £3 15s. 49 l6s. (! If 17s. 3,641 £3 l5s. , , £4 ... 17 17s. , 11 18s. 3,551 £4 , 11 £4 5s. 107 18s. I! If I9s. 2,079 £4 5s. 11 If ;£4 !Os. 4: 19s. , , 20s. 25I £4 !Os. " £4 l5s. 12 20s. If " 2ls. 7,929 £4 l5s. " £5 I 2ls. , 2'2s. 1,004 £5 "
, £6 110 22s. 11 " 23s. 1,619 £6 ,, , £7 35 23s. , , 24s. 495 £7 11 , £8 17 24s. "
, 25s. 146 £8 If £9 16 25s. " " 26s. 3,945 £9 If If £IO 1 26s. " " 27s. IS7 £10 and upwards IT 27s. 11 11 28s. 693 Unspecified 4I,264 2Ss. " 11 29s. 117 29s. !! 11 30s. 38 Total 263,634 30s. If If 3Is. 2,1S6
[242]

STATISTICAL REGISTER OF VICTORIA, 1914.-POPULA'I'ION. 29
POPULATION OF VICTORIA. RETURN showing the Estimated Population of Victoria, at the end of the Year 1914, and the
Estimated Mean Population during that Year.
Year 1914.
Estimated Population, 31st Dece~ber, 1913 Births .. . DPaths .. .
Natural Incrense Migration by Sea (as adjusted)
Arrivals Departures
Gain Sea wards .•. Migration by Land (A.s adju!lted)
Arrivals Departures
Gain by Land
Estimated Population, 31st December, 1914
Estimated Mean Population, 1914
17,677 7,486
Males. Females. Total.
706,948 705,171 1,412,119
9·528 10,191 1 9.7'9
6, )21 -527 5.794
• Including 15,355 members of the Australian Expeditionary Force and 46 nurses who left Victoria for the front during the December quarter.
POPULATION OF VICTORIA, 1836 TO 1914.
1
Population on 31st December. Annual Increa~>e. Natural Increase, i.e., Excess of Arrivals over Excess of Births over Deaths. Departures.
Year.
Males. Females. Total. MalE'S Females. Total. Males. FemalE's. Total. Males. F0males. Total.
1836 186 38 224 .. .. * * ~I
- ~ * * * 1837 984 280 1,264 798 242 1,040 * * 6 * * 1,034 1838 3,080 431 3,511 2,096 151 !,247 * * 8 * * 2,239 1839 4,104 1,718 5,822 1,024 1,287 2,311 * * 7!" * * 2,236 1840 7,254 3,037 10,291 3,150 1,319 4,469 * * 160 * * 4,309
1841 14,391 6,025 20,416 7,137 2,988 10,125 * * 299 * * 9,826 1842 15,691 8,108 23,799 1,300 2,083 3,383 * * 612 * *
I
2,771 1843 15,892 8,211 24,103 201 103 304 * * 1,004 * * ~700 1844 17,626 9,108 26,734 1,734 897 2,631 * * 1,096 * * i 1,535 1845 20,624 10,656 31,280 2,998 1,548 4,546 * * 1,194 * * I
3,352 I
1846 23,531 14,803 38,334 2,907 4,147 7,054 * * 1,268 * I * !
5.786 1847 26,004 16,932 42,936 2,473 2,129 4,602 * * 1,30(1 * *
I 3,302
1848 30,697 20,693 51,390 4,693 3,761 8,454 * * 1,384 * * 7,070 1849 39,556 26,664 66,220 8,859 5,971 14,830 * * 1,:52() * * 13,510 1850 45,495 00,667 76,162 5,939 4,003 9,942 897 99() 1,893 3,0071 8,049
!
1851 58,235 39,254 97,489 12,740 8,587 21,327 * * 1,884 * * ! 19,443
1852 110,825 57,496 168,321 52,590 18,242 70,832 632 1,019! 1,6fil 5Ul581 17,2231 69,181 1853 146,456 75,980 222,436 35,631 18,484 54,115 * * I * ~5,631·1 18,484: 54,ll5 1854 205,629 106,678 312,307 59,173 30,698 89,871 -73 1,354! 1,281 09,24() 29,344 1 88,590 1855 234,450 129,874 364,324 28,821 23,196 52,017 1,843 3,49Gj 5,338 2G,97E, 19,701\ 46,679
4,9lll I
6,H48! 1856 255,827 141,733 397,560 21,377 11,859 33,236 3,781 8,692 J7,;")H(i: 24,54·i 1857 297,547 165,588 463,135 41,720 23,855 6fi,575 4,133 5,802! 9,935 37,587 1 18,053! 55.640 1858 323,576 180,943 504,519 26,029 15,355 41,384 4,634 6,280i 10,914 21,3951 9,075: 30,470 1859 I 335,708 194,554 530,262 12,132 13,611 25,74:3 5,520 7,1031 12,62!l 6,Eil21 6,508 1!5,120 1860 328,251 209,596 537,847 -7,4571 15,042 7,585 4,7ll 6,0~Hj 10,802 -12,1681 8,951! -3,217
I
3,437 1 1861 321,724 220,076 541,800 i- 6,fi27 10,480 3,953 5,896 7,0431 12,939 -12,423 -8,98() 1862 324,107 230,251 554,358 2,:l83l 10,175 12,558 6,653 7,6581 14,3ll -4,270 1 2,517j -1,753 1863 327,249 244,310 571,559 3,142 14,059 17,201 6,591 7,813 14,404 -3,449! 6,2461 2,797 1864 343,296 258,047 601,343 16,047 13,737 29,784 8,039 8,7541 16,793 8,008 4,983 12,991 1865 350,871 270,224 621,095 7,575 12,177 19,752 7,107! 8,347 15,454 468j 3,830 4,298
1866 357,012 279,970 636,982 6,141 9,746 15,887 5,6541 7,070 12,724 4871 2,676 3,163 1867 362,273 289,298 651,571 5,261 9,328 14,589 6,480 7,395 13,875 --1,219 1,933 714 1868 373,232 301,382 674,614 10,959 12,084 23,043 7,976' 9,200 17,176 2,9831 2,884 5,867 1869 385,561 314,229 699,790 12,329 12,847 25,176 7,004 8,406 15,410 5,325 4,441 9,766 1870 398,755 327,844 726,599 13,194 13,615 26,809 7,883 8,848 16,731 5,3111 4,767 10,078
1871 407,884 339,528 747,412 9,12{) ll,684 20,813 8,155 9,309 17,464 974 2,3751 3,349 1872 410,278 348,706 758,984 2,394 9,178 11,572 7,523 9,007 16,530 -5,129
-~i!l -4,958
1873 414,917 357,122 772,039 4,639 8,416 13,055 7,669 8,930 16,599 -3,030 -3,544 1874 418,534 364,740 783,274 3,617 7,618 11,235 6,665 7,913 14,57E -3,048 -295 -3,343 1875 421,023 370,376 791,399 2,489 5,636 8,125 5,120 6,313 ll,43~ -2,631 -677 -3,308
• Information not available.
[.243]

30 STATISTICAL REGISTER OF VICTORIA, 1914.-POPULATION.
POPULATION OF VICTORIA, 1836 TO 1914--tontinued.
Population on 31st December. Annual Increase. Natural Increase, i.e., Excess of Arrivals over Year. Excess of Births over Deaths. Departures.
-
1\fales. Females. Total. ]}fales. J Females. Total. Males.] Females. / Total. Males. I Females. Total.
1876 424,838 376,879 801,717 3,8~~ 6,503 10,318 6,0431 7,1651 13,208 - 2,2281 662 -2,890 1877 430,616 384,878 815,494 7,999 13,777 5,927 7,307 13,234 149 692 543 1878 435,691 391,748 827,439 il~ 6,870 11,945 6,5731 7,3061 13,879 1,498 436 -1,934 1879 441,434 399,186 840,620 7,438 13,181 6,694 8,025 14,719 -951[ -587 -1,53 1880 451,456 40R,tH1 860,0G7 10,022 9,425 19,447 6,7481 7,748: 14,496 3,2741
1,677 4,951 !
1881 462,159 417,727 879,886 10,703 9,116 19,819 6,8791 7,9641 14,843 3,824 1,152 4,976 1882 472,110 427,452 899,562 9,951 9,725 19,676 5,7121 7,401 13,113 4,239 2,324 6,563 1883 483,912 436,782 920,694 11,802 9,330 21,132 6,699 7,836 14,535 5,1031 1,494 6,007 1884 496,998 447,566 944,564 13,086 10,784 23,870 7,169 8,1761 15,345 5,917 2,008 8,525 1885 511,010 453,192: 969,202 14,012 10,626 24,638 7,155 8,45()! 15,611 6,8571 2,170 9,027
1886 528,919 471,59111,000,510 17,909 13,399 31,308 7,178 8,69~1 15,872 10,731 4,705 15,436 1887 546,918 486,075 1,032,993 17,999 14,484 32,483 7,663 9,37ai 17,038 10,336 5,109 15,445 1888 570,480 506,486 1,076,96() 23,562 20,411 43,973 8,232 9,9841 18,216 15,330 10,427 25,757 1889 582,547 521,180 1,103,727 12,067 14,694 26,761 7,649 9,3181 16,967 4,418 5,376 9,794 1890 596,064 537,202 1,133,266 13,517 16,022 29,539 8,806 10,760 19,566 4,7ll 5,262 9,973
1891 606,035 551,643 1,157,678 9,971 14,4411 24,412 8,932 10,9421 19,874 1,039 3,499 4,538 1892 608,700 559,900 1,168,600 2,665 8,257 10,922 10,307 ll,673 21,980 -7,642 -3,416 -ll,058 1893 609,6201 566,540 1,176,160 920 66401 7,560 9,272 10,7721 20,044 -8,352 -4,132 -12,484 1894 609,595 572,69511,182,290 -25 6:H55 6,130 8,604 10,224 18,828 8,629 -4,069 -12,698 1895 608,240 577,710 1,185,950 -1,355 5,015 3,660 8,491 9,579 18,070 9~846 41664 -1~410
8
1896 599,890 580,390! 1,180,280 -8,350 2,6801 -5,670 7,558 8,906 16,464 -15,908 ~ 6,226 -22,134 1897 600,120 582,590 1,182,710 2301 2,200 1 2,430 7,479. 8,7051 16,184 7,249 6,505 -13,754 1898 598,950 584,110 1,183,060 -1,1701 1,5201 350 4,902. (),575 ll,477 -6,072 -5,055 11,127 1899 600,480 588,990 1,189,470 1,.530 4,880 6,410 6,499 7,931! 14,430 -4,969 -3,051 -8,020 1900 602,487 594,719 1,197,206 2,007 5,729 7,736 7,207 8,357 15,564 -5,200 -2,628 -7,828
1901 610,005 602,608 1,212,613 7,518 7,889 15,407 6,841 8,263 15,104 677 374 303 1902 609,246 60(),594 1,215,840 -759 3,986 3,227 6,431 7,853 14,284 7,190 -3,867 -11,057 1903 607,092 608,ll0 1,215,202 -2,154 1,516, 638 6,489 7,485 13,974 8,643 - 5,969 -14,612 1904 607,285 611,323 1,218,608 193 3,213 3,406 7,321 8,049 15,370 -7,128 4,836 -11,964 1905 612,488' 616,497 1,228,985 5,203 5,174 10,377 7,250 8,181 15,431 2,047 -:M)()7 -5,054
1906 620,125 624,349 1,244,474 7,637 7,852 15,489 7,374 8,233 15,607 263t -381 -118 1907 627,631 632,837 1,260,468 7,506 8,488 15,994 8,009 8,818 16,827 -503! -330 ~833 1908 633,104. 637,993 1,271,097 5,473 5,156 10,629 7,258 8,076 15,334 -1,785 -2,920 -4,705 1909 643,642i 647,377 1,291,019 10,538 9,384 19,922 8,022 9,091 l7,ll3 2,5161 293 2,809 1910 652,2851 655,826 1,308,111 8,643 8,449 17,092 8,279 8,422 16,701 364: 27 391
1911 668,7591 670,343 1,339,102 16,474 14,517 30,991 8,579 9,231 17,810 7,895 5,286 13,181 1912 689,825 690,736 1,380,561 21,066 20,393 41,459 9,154 10,053 19,207 ll,912 10,340 22,252 1913 706,948 705,171 1,412,119 17,123 14,435 31,558 9,939 10,557 20,496 7,184 3,878 11,062 1914 712,594[ 718,073 1,430,667 5,646 12,902 18,548 9,528 10,191 19,719 -3,882 2,711 -1,171

Year.
1905 xgo6 1907 1908 19c9 1910 1911 Igl2 1913 1914
Total
Year.
1905 ... 1906 ... 1907 ... •9oj! ... 1909 ... 1910 ... 1911 ... 1912 ... 19IJ ... 1914 ...
Total
Year.
1905 1906 1907 1908 1909 1910 1911 1912 1913 1914
STATISTICAL REGISTER OF VICTORIA, 1914-POPULATION. 31
NATURAL INCREASE OF POPULATION OF VICTORIA. RETURN showing the Excess of Births over Deaths, 1905 to 19l4·
In Melbourne and Suburbs Outside Melbourne and Suburbs. Total of Victoria. (Greater Melbourne).
Males. Females. Total. Males. Females. Total. Males. Females. Total.
2,675 2,676 5.351 4.575 5.5°5 Io,o8o /,250 8,181 I j,43 I 2,687 2,603 5,2gO 4,687 5,6JO 10,317 7·374 8,233 1),607 2,972 3,o65 6,037 5,037 5.753 10,790 8,oog 8.818 16,827 z,734 2.795 5>529 4.524 5,281 g,8o5 7,258 8,o76 15.334 3· 129 ),J6I 6,+90 4.893 5.73° 10,623 8,022 9·091 17, I I 3 J,I45 3,0lj 6,160 5.134 5,407 10,541 8,279 8,422 16,;ox
3·449 3·499 6,g48 5,1 JO 5.732 xo,l\62 8,579 g,2JI 17,810 3,967 4.290 8,257 5,187 5.763 10,950 9,154 1o,o53 19,207 4.735 4,702 9.437 5,204 ;,8 55 II,059 9·939 xo,s 57 201496 4,517 4,641 g,I j8 5,011 5.55° IO,j6I g,j28 IC,I 91 Ig,7I9
----- -----••• I 34,010 I 49.382 ;6, 206 105,588 83,392 e;o,853 I 74,245
TOTAL INCREASE OF POPULATION OF VICTORIA, 1905 TO 1914.
Natural fncrease Gain hy Immigration. Total Increase of Population.
--" ! -
Males. I Females. Total. Males. ~[ales.
------. .. 7·250 8,18 I ... ::-.374 8,233 . .. 8,o;;g 8,818
15,431 2,047 - 3,007 - 5·054 5,203 5,1/4 10,377 Ij,6o7 263 381 -118 7,637 7,8)2 I 5,489 16,827 5°3 -330 -833 7,5o6 8,488 I 5,994 . .. 7,2j8 8,o76 I 5,334 - 1,785 -2,920 -4.7°5 5.473 5,156 10,629
. .. 8,022 g,o~I I7,IIJ 2,516 293 2,8og 10,538 9,384 19,922
... 8,279 8,422 16,701 364 27 391 8,643 8,+49 17,092
. .. 8,579 g,23 I 17 1810 ;,895 5,286 q,18r 16.474 14,517 30.~91
... 9, 1 54 IO,Oj3 19,207 10,340 22,252 21.c66 20,J1:13 41,4 59
. .. 9·939 1°,557 20,496 J,878 I 1 ,o62 1 4:435 JI,sss
... 9,523 10,191 I 9,719 2,711 -1,171 12,902 x8,548
... 83,392 go,853 174,245 15,897 37,814 Io6,750 212,0$9
ESTIMATEJJ POPULATION OF VICTORIA.-RETURN FOR TEN YEARS.
Population on the pst December. i Mean Population during· the Year.
Year.
Males. Females. Total. Males.
1-----
612,488 616,497 1,228,98 5 1905 6o9,886 61J,9IO 620,12$ 624,349 1,244.474 1906 616,306 620,423 62.7,631 632,837 1,260,468 1907 623,878 628,593 6J3,104 637,993 1,271,097 1908 63o,367 635 1415 643,642 6.p,J77 11 291,019 i 1909 6J8,373 642,68 5 6p,285 655,826 11 308 1 1Il 1910 647.964 651,601 668,7~9 670,3+3 1,339,102 1911 657.951 662,423 689,82 5 6go,736 1,380,561 1912 677,214 679,173 706,948 705,171 1 1412,119 1913 69$,638 6g7,)42 712·594 718,073 I,430,667 1914 712,6~0 710,873
URBAN AND RURAL POPULATION OF VICTORIA, 1881-1914.
Year.
1881 {Census} 1891 n 1901 19Il " 1912 {:llst Dec.} 1 913
Urban Distl'icts.
Other Urhan.
Rural Districts Total,
I,Z2J,796 11 2361 729 1,252,471 1,265,782 1,28r,os8 1,299,565 1,pc,J74 1,356,387 1,393,180 1,423,513
NoTE.-Melbourne and Suburbs (Greate.- Melbourne) comprises the area within a radius of 10 miles frcm the centre of the City of Melbourne other Urban Districts the space outside that limit, embraced in cities, towns, and boroughs (present and forn:;er). The remainder of the State u; considered Rural. In 1914 the area of Greater Melbourne was 255 square mile8, that of other '_Trban Districts 376 square miles and tkat •t Rural DiJtrictll 87,2.$3 square mileil. '

32 STATISTICAL REGISTER OF VICTORIA, 1914.-POPULATION.
IMMIGRATION AND EMIGRATION BY SEA.
(AS RECORDED.)
RETURN of the Number of Immigrants who arrived in, and of the Number of Emigrants who departed from, the State of Victoria by Sea tlnricg each Quarter of the Year 1!114, also the Numbers arriving from, and departing to, the other States of the Commonwealth, New Zealand, South Afriea, the U niteu Kingdom, other British Dominions, and Foreig11 Ports.
Place of Departure or Destination.
By Sea-Inter-State-
New South Wales Queensland South Australia Western Australia ... Tasmania Northern 'l"erritory ...
Total Inter-State
Oversea-British-
United Kingdom Canada Cape Colony Fiji Hong Kong lndia and Ceylon Natal New Zealand Pa.pua Straits Settlements Other British Possessions
Total British Countries
ForeignChina. France Germany Italy Japan ... New Caledonia Spain .. South Sea Islands United States Other Foreign Countries
Total Foreign Countries
'Iotal Oversea Countries
Total Seaward ...
Arrivals for- Departures for-
Excess ofArrivals ( ;-} Departures {- ).
I 10,658 8,516 4,537 6,962 30,673 12,329 9, 798 4,966 6,503 33,596, -2,923
1,431 1,018 1,035 1,229 4,713 1,645 2,564 1,337 874 6,420 -1,707 2,316 1,840 989 1,3141 6,459 2,0821 2,004 792 946 5,824 +635 2,918; 2,09~ 1,~23 3,0331 9,573 2,773, 2,686 1,522 1,28~ 8,267 + 1,306
I 14.889, 9,74Jl 5,;081 6,205[ 36,549 10,79?: 7,326; 4,732 9,03J 3I,892 +4,657 --~ ___:_o ~~-~! __ 5_3 __ 'i __ 9
1
_::1 __ 33 __ 7_s ___ 2_5
32,221 _23,240113,802, 18,7571 88,020 :9,633 24,387; 13,378 18,679' 86,077 + 1,943
2,074 17
228 33 45
312 )4
I,463
4,506 I
181 41
119 215 57
1,124 3 4
11
3,178 2
190 47 79 99 11
659 3 3
46
3,454 13,21~ I,86! 2,062 ';42 996 5,664
22~ 8~~ '"i71\ '"ioo ... 52 ... 79 ... 402 40 161 141 41 7 12 74 35 278 97! JO() 12S liS 452
Ill 737 1451 143 109 186 583 22 104 7Si 75 74 S7 264
256 3,502 1,410i 872 573 877 3,732
... s 2~ ··· sj ... 3 ... II 3~ ~~
~ I~ 81 ~ M ~ 1~ '4,2341
-6,-2-82_1_4_,-31_7 ..
1-4-,-18-8, I9,021 3,795, 3,463
1
1,731,---;"91,-11,35S
+7.548 +23
+424 +87
-174 +154 -160 -230 -27 - 7
+25
+7,663 ---- --J-~···-'----·---;--·---1---;.---1-----
6 69 1' l2 88 . . . 62 30 .. . 92 271 111 771 ll 470 257 199 51 17 524
95 lOI 36 258 490 84 42 104 ... 230 ~69 148 391 .•. 456 169 136 22 7 334
IS 28 9 11 66 65 15 17 12 I09 2 1 ...... 3 1 ......... I s . .. 3 . .. . . . 2 1 ~ ••• 32 .. . 2 . .. 5 . .. 1 • .. 40
... 30 6 .. . 4 14 54 12i 6 3 27! 48
-4 -54
+260 +122 -43 +2 +3 35
+6 +243 172 129! 101 71 473 68! 911 47 241 230
---s66 ~~---;n: 379 2,108 f38st 553 279i8RII:60s --+-500 I I I ----,--,-- --- ---~-- -- ------ ----
5,100 6,878 4,584 114,567 21,129 4,483, 4,016! 2,010 2,4571 12,966 +8,163
·37,321 30,118 18,386 _23,324 109,149 ,::~6~28,403]15,388 21,1~! 99,043 -~+~1_-o_.-1_o-6 Australian Expeditionary Iforce 1 ... ... .. , , .. . . ... ... ... I ... I5,4oij 15,40I -15,401
[246]

STATISTICAL REGISTElt OF VICTORIA, 19l4.-POPULAT101'\. 33
IMMIGRATION AND EMIGRATION BY SEA. -RETURN FOR FOUR YEARS. (As UECORDED.)
[~D1lGRANT8.
Male<~. I Females.'
Numhefl! from-
Year Total
! Tasmania. Number. New 'fhe Other
8outh 'Vestern Zealand United British Wale~.
Australia. Kingdom. Dominions. --- --· ---- --·-~ -----
1911 I06,J49 64,248 4-2,101 28,769 +.455 5> 14 3 9·956 3),J40 5,224 I 2,646 1,495 1912 I 24,527 7 3,766 50,761 32,38 I 3,8 3 3 5.473 10,326 36,866 S10JO 24,022 r,665 I 913 u 4, 58o 68,592 +5.994 29,206 J,788 6,J IO I 9·'76 36,)04 3,664 2o,o86 1,913 1914 ro9,149 65,749 43.400 30,673 4,7n 6,459 ! 9.573 36,)49 J,502 I 3,2 I 2 1,430
!<~MIGRANTS.
Numbers to-
Year. Total Males. Females.
Tasmania. I New Zealand. Number. New South The Other
South Queens· AUR· 'Vestern United British 'f)
'Vales. land. tra.lia. Australia. Kingdom. Dominions. ~ I
···-- ---- ---- ---- --- --- ----------'--·- -----19!1 93,246 55.914 37.332 30,231 4,924 5,857 g,844 29,909 4,629 1,o56; 4,130 r,191 19 1,456 1912 99,9331 6o,o28 39.905 33,146 4,368 5.893 9.134 34,279 4.743 94°i 4.473 1,472 9 1.+76 1913 101,718 61,838 3g,88o 31 ,r68 5.294 6,ros 9,263 35.899 4.455 8 381 5·633 1,343 12 ]1,708 19 14 i *gg,0431 59,395* 39.648* 3 3, 5 g6 6,420 5,824 8,267 3I ,892 3.732 666 ;,664 1,374 I 48 11, 56o
* Exclusive of 15,401 members of the Australi:m Expeditionary Force (15,355 soldiers and 46 nurses), who left Victoria for the fnmt durin~r the December quarter.
NOMINATED AND ASSISTED IMMIGRATION TO VICTORIA, 1914.
1\Iarried. Single. Male. Female. Total.
Nominated. Assisted. INo>mlnate,"ct. Assisted. Assisted. Assisted. IJ:I''; on1in:1te,d. Assisted.
----1----
739 1,68o 4, 3 I 5 I 13 54
NUMBER OF NOMINATED AND ASSISTED IMMIGRANTS WHO ARRIVED IN VICTORIA DURING EACH MONTH OF 1914.
Month. Nominated. Assisted. Total. Month. Nominated. Assisted. Total.
----·-January 84 26o 344 August 217 440 657 February 101 go 191 September 23 205 228 March 461 530 991 October Jog 288 397 April 250 643 893 November 458 )21 979 May 235 859 1,094 December 122. 127 June 202 58s 79° -----July 280 52 5 8os 'l'ota.l 2,425 5,071 7.496
11341.-C [:247]

34
New South Wales
·South .Australia
STATISTICAL REGISTER OF VlCTORIA, 1914.-POPULATION.
1838-so 18~1-60 1861-70 1871-8o 1881-90 1891-00 1901 1902 1903 1904 1905 1go6 1907 1908 1909 1910 1911 1912 191J 1914
STATE ASSISTED IMMIGRATION TO THE END OF 1914.
Period.
Total
Number of StaLeAssisted Immigrants.
28,632 87,g6J 46,594
5,54S '2
127 J60 652
1,690 6,776
IS, II 9 12,146 7·496
2IJ,I02 ------- -·- ----------------------------
ARRIVALS AND DEPARTURES BY RAIL, 1914.
(As RECORDED.)
Arrivals during the Quarter ended-
Departures during the Quarter ended-
Excess of Arrivals ( + ). Departures (-).
31st March.
Joth June.
;cth Sept.
Total.\
1
Fst ;oth I ~oth . 31st. Total. ;rst ;oth ;oth ! 31st I Total. _. :Marc~~ .. June.l Sept. :: ~ --_ March. June. Sept. Dec. ~
i \ ---------
Jg,684 t,P,0+4: 36,277 36,352! J5,230 J4,J34 qr,993 -1,670-2,291 -I,5J8 + 5,550 I
+SI
IJ,J89 54,2581 IJ,IOl 13,8711 ll,OoJ' 101040 48,015 +98 + 169 +2,62.7 + 3,349! +6,243
I '
I
---~--~-~-!~----·--1--1----
Total ... 47,8o6 48,toi 47.322 53,073 196,302:49.378: 50,223,46,233,44,174 -1,572-2,122 + l,o8g +8,8gg I ' I
6,294
MIGRATION BY RAIL, 1911 TO 1914.
(As RECORDED.)
Arrivals. Departures. Excess of Arrivals.
Year.
Females. I Males. Females. 'l'otal. Males. Females. Total. Males. Total.
tgll ... ... . . 97t955 .p,o27 144,982 9°,Q35 45,160 q6,095 7,07.0 1,867 8,887
191Z ... ... . .. 100,1 5l sz,o36 1,2,189 100,326 57.,047. 152,368 -173 -6 -179 1913 .. ... ... 137.,718 5 3,778 186,496 130,536 5 5.486 t86,on 2,187. -1,708 474 1 14 ... ... . .. 139·694 56,6o8 196, ]07. I p,873 57,135 19o,oo8 6,87.1 -57.7 6,294 9
NoTB.-For the four years enumerated in *hill Table, the Inter·State passengers have been countro at the Border Stations.
[248]

STATISTICAL REGISTER OF VICTORIA, 1914,-POPULA.TIOX.
CHINESE MIGRATION, 1914.
Place of Arrival or Deputnre.
New South "\V ales Queensland ... South Australia "\Vestern Australia Tasmania ... N mv Zealand Other British Possessions
Adults Children
Tqtal
2
9
308
* Exces:o; of Arrkals.
Departures.
6
Excess of ArrivaH I+J
Departures (- ).
-2
+7 -2
-177
CHINESE IMMIGRATION AND EMIGRATION.-RETURN FO.R TEN YEARS.
35
Year. Chinese Immigrants. Chinese Emigrants. Year. Chinese Emigrants.
1905 506 5°9 1910 424 418 1906 376 526 1911 435 454 1907 464 419 1912 545 ss6 1908 566 448 1913 475 579 1909 523 556 1914 323 SOl
ARRIVALS IN AND DEPARTURES FROM VICTORIA OF COLOURED PERSONS <OTHER THAN CHINESE), 1905 TO 1914.
Arrivals in Excess Year. Arrivals. Departures. ( +) ; Departures
in Excess ( - ).
1905 58 136 -7S 1906 71 129 -ss 1907 41 79 -38 1908 64 62 +2 1909 59 6g 1910 137 156 -19 f9fl 104 77 +27 1912 133 74 +59 1 913 117 91 +26 1914 ss 67
I
-9
Total 852 940 l -88
[249]

38 STATISTICAL REGISTER OF VICTORIA, 1914.-POPULATION.
ESTIMATED POPULATION OF MELBOURNE AND SUBURBS, 1841 TO 1914.
I Estimated Population. Estimated Population. I
Year. Year.
I 31st December. Mean. 3rst December. Mean.
-1 1841* 4.479 1887 405,520 391,550 1846* 12,351 1888 412,350 4 19.490 1851* 39,ooo 1889 459. J60 44 5,220 1854* Ioo,ooo 1890 482,600 473.500 I8S7* I I71 2IJ I89I 486,620 491,700 I86I* I 39,916 1892 469,390 481,550 1865 16410JI 1601586 I893 449,56o 457,230 r866 1701 921 167,476 1894 444.340 441 1890 a867 1 7~.•5s 174,366 1895 452,210 448,2 so J868 I86,o78 181,945 1896 458,300 456,170 1869 194,690 190,212 1897 466,895 4f:l,430 I870 202,97 5 199,169 1898 480,390 47).360 1871 215,991 2o6,78o 1899 489,6oo 487,420 1872 229,125 22),203 1900 +9+.905 49 r,78o 1873 236,990 23J,047 1901 50I,j8o 498,030 1874 242,8oo 240,9J2 1902 502,840 502,120 1875 245,873 244,668 1903 5o5,76o so3,56o 1876 248,878 247.079 1904 511,520 507,960 1877 253.577 250,678 1905 51 9.9 2 5 515,o8o I878 260,738 256,477 I9o6 5Jo,6;5 524,770 1879 271,100 265,ooo 1907 543,I15 536,540 188o 281,037 277,200 I908 557.350 549,690 1881 288,169 284,874 1909 573,255 565 1010 1882 297.937 291,464 1910 588,ooo sS I ,500 1883 3I3,55o 304,410 1911 6oo, 160 594. 25° 1884 334,030 322,690 1912 628,430 6141300 t8S 5 358,5oo 345.380 1913 6<;t,ooo 639,700 1886 38I 1590 37I,63o 6J4,000 662, soo
• Census population.
ENUMERATED POPULATION OF MELBOURNE AND EACH OF ITS SUBURBS ON 31st MARCH, 1901, AND 2nd APRIL, 1911, AND ESTIMATED POPULATION 31st DECEMBER, 1914.
l Enumerated Popu-/Increase between Sub-districts. lation, :z.nd April, the Censu~es of
1911, 1901 and 1911.
Melbourne City-Bourke "\Vard
~( 12,603
?( q,o28 r .,5
" Gipps
" 7,363 7,154 -209
" Lonsdale
" 2.443 2,638 195
Latrobe " 3.4°5 3,8or ~~ 396
Albert 8,oo2 9,262 _;;. I 1,260 Smith
" 14,22) 15,495 I r,270
,, , Victoria "
20,333 21,302 969
" Hopetoun, 29,066 30,9IJ l1,847
Fitzroy City 31,687 34,283 2,596 Collingwood City 32,749 J4,190 1,441 .Richmond City 37,824 40,442 2,618 Brunswick City 24,141 32,21 s 8,074 N orthcote Town* 9,677 17.5 19 7,842 Prahran City ... 40,441 45.367 4.926 South Melbourne City 40,619 46,190 5,57 1 Port Melbourne Town 121 I 76 13.515 1,339 St. Kilda City 20,542 25,334 4.792 Brighton Town 10,047 12,083 2,036 Essendon City 171426 23,749 6, '?23 Hawthorn City 21,430 24.45° 3,020 Kew Town (including Lunatic Asylum) 9,469 I 1,152 1,683 Footseray City 18,318 23,643 5.325 \Villiamstown Town 14,052 15,275 1,223 Oakleigh Borough ... I ,273 1 1 1 51 878 Caulfield City
... 9.541 15·9 19 6,378
Malvern City IO,tll9 15·96g 5.35° Camberwell Town+ 8,6oz 12,551 3.949 Preston Shire 4,059 5,049 99° Coburg Town (with Stockade) 6, 772 9·5°5 2 .733 Shires (parts of)-
1,9o6 864 Bray brook 11 042 Broadmeadows ... 982 994 12 Doncaflter 498 568 70 Eltham ss 510 425 Epping 196 p6 IJO Heidelberg 7,280 3, r6q Keilor ++6 74 Moorabbin 6,o76 2,684 Mulgrave 539 201 Nunawading 4,821 •• 3 55 Templestowe 341 IQ
'Ve!Tibee 977 '125 Whittlesea 8q 38
Shipping in Hobson's Bay and River
Total ... NoTE.-The populations in the various sub-districts include inmates of all institutions within their boundaries.
• Northcote was declared a. city on 3oth !larch, 1914.--'!' Cumberwell was declared a city on 2oth April, 19r4.
[250]
Estimated Popu-lation, 31st De-cember, 1914.
r 13.470 7.39°
g I 2,730 ...._~ 3·93°
-g I 9,570 ..... I 16,o2o
L 22,020 31,960 35.75° 36,350 41,8oo 38,2 30 23,160 +8,200 48,5oo 1),;'60 J01 160 16,ooo 301000 28,250 12,980 28,66o 17,400 4,250
21,500 22,500 16,670
7,o5o 12,900
2,250 I 1 100
640 520 350
9,030 490
7.570 640
6,o6o \90
11IJO
90 2, 58o

STATISTICAL REGISTER OF VICTORIA, 1914.-POPULATION. 37
POPULATION OF THE PRINCIPAL TOWNS IN VICTORIA OUTSIUE MELBOURNE AND SUBURBS, AT THE CENSUSES OF 1901 AND 1911, AND AT 31st DECEMBER, 1914.
1901, l9II. (Census.) (Census.)
Ballarat and Suburbs-Balla.rat City ... ... ... . .. 25,499 22,017 Ballarat East Town ... .. , ... . .. 18,324 IS,962 Sebastopol Borough ... ... ... . .. 2,969 2,174 Bungaree West Riding ... ... ... 1,83 I t z,25o* Old ~outh Road Division ... ... . .. 791 I
Total Ba.llarat and Suburbs ... ... 49.414 42,403 ·-
Bendigo and Suburbs-Bendigo City ... ... . .. ... 30,774 ::8,539 Eaglehawk Borough ... . .. ... ... 8,367 7,588 Other parts of Sandhurst Parish ... ... 3,560 3,290"'
!-Total Bendigo and Suburbs ... ... 42,701 39.417
--------·--Geelong and Suburbs-
Geelong City ... ... ... . .. I 2,418 IJ,6I8 Gee long West Borough ... ... ... 5,871 7.105 Newtown and Chilwell Borough ... ... 5,049 5,831 South Barwon Shire (all except Connewarre Riding) 1,679 I,96+ * Corio Shire (.Moorpanyal Riding) .. . .. . I ,33 3 1·755*
Total Geelong and Suburbs ... ... 26,350 30,273
Castlemaine and Suburbs-Castlemaine Borough .• , ... . .. ... 5.7°3 5,228 Chewton Borough ... ... ... . .. 1,229 93° Campbell's Creek ... ... ... ... 980 862*
---------TotallJastle.:naine and Suburbs ... ... 7,9I2 7,020
Warrnambool Town ... ... ... ... 6,404 7,0IO Maryborough Borough ... ... ... . .. 5,622 s,675 Hamilton Borough ... ... . .. . .. 4,024 4,900 Mildura ... ... ... ... . .. I,6o6 4,6o8 Stawell Borough ... ... ... . .. ... 5,318 4,4IO
• Estimated.
NATURALIZATION.-RETURN FOR TEN YEARS.
Birthplaces.
Franf!e Belgium Austria Germany Russ1a Norway and Sweden Other European Countries United States ••• Other Countries ...
Total
1905.
4 I
IO 8I 16 40 57 4 ...
--·--2.13
1906. 1907.
11 I I 3 I
I I 7 1I5 63
10 4 48 52 87
I
70 12 6 4 ...
---- ----301 214
Numbers Naturalized in each Year.
19::>8. 1909· 1910. 1911. ----·~-
8 7 I I2 15 3 I 5 1 4 13 l 4 I2
95 226 128 19I J I 28 34 34 37 70 44 92 77 134 87 124
8 21 IS 21 . .. 7 .. . I
I 243 5°7
I 329 491
I I
I 1914. (Estimated.
I
2I,524 16,284 2,420
2,250
42,478
z8,ooo 7,766 3,290
39,o56
I
I 16, I )0 8,759 6,8oo I,925
i
1,830
35.444 -------
s,sso 95° 862
7,362
7,400 5, 3oo s,ooo 4,875
I 4.550
19!2. 191J. 1914.
17 17 15 2 4 7
IJ 21 66 IIO l73 648
13 38 I Il 29 74 142 89 92 190
6 13 16 16 2 7
295 434 1,202'~
• The large increase in the numbers nn.turalized in r9r4 is attribut,able to the outbreak of war in Europe.
COMMONWEALTH OF AUSTRALIA.
STATE OF VICTORIA (THE SENATE).
ELECTORS who Voted in the State of Victoria for Senators at the Sixth General Election on sth September, 1914.
11341.-D
EJectors EnrolledMale Female
Electors to whom Ballot-papers were issuedMale Female
Number of Informal Ballot-papers
335,0 57 309,8.p 21,24-6
[251]
•

38 STATISTICAL REGISTER OF VICTORIA, 1914.-POPULATION.
CO:M:MONWE4LTH OF AUSTRALIA.
STATE OF VICTORIA (HouSE OF REPRESENTATIVES).
RETURN of the Number of Electors who Voted in each Division at the Sixth General Election on 5th September, 1914.
Division.
Balaclava Ballarat Batman Bendigo Bourke Corangamite Corio Echuca Fawkner Flinders Gippsland Grampians Henty lndi .• Kooyong Maribyrnong l\Iel bourne Melbourne Ports Wannon Wimmera Yarra
Total Less 4 uncontested
districts ..
Total contested districts
Electors enrolled.
Males. Females. Total.
--16,210 23,099 39,309 17,721 20,376 38,097 17.754 20,578 38,332 16.660 18,906 35,566 21,256 23,372 44,628 20,214 17,809 38,023 19,335 19,377 38,712 19,390 17,110 36,500 17,595 22,170 39,765 20,220 17,180 37,400 20,562 16,434 36,996 17,497 17,243 34,740 20,415 25,529 45,944 18,919 16,317 35,236 17,626 24,132 41,758 20,494 22,088 42,582 19,131 18,578 37,709 22.270 21,015 43,285 18,410 17,06I 35,471 20,432 14,648 35,080 18,944 20,663 39 .. 607 --- --- ---401,055 413,685 814,740
79,400 76,904 I56,304 --- ---- ---321,655 336, 78I 658,436
Electors to whom Ballot-papers were lllsued.
Males. Females. Total. ---
13,356 17,496 30,852 15,922 17,341 33,263 .. .. Uncontested
14,696 15,092 29,788 17,330 16,735 34,065 17,967 14,673 32,640 16,554 15,345 31,899 16,468 12,979 29,447 14,175 15,915 30,090 16,541 12,492 29,033 17,955 12,876 30,831 15,646 14,060 29,706 16,248 18,092 34,340 16,952 13,684 30,636 14,702 17,163 3I,865 16,951 16,040 32,991 14,57I I2,901 27,472 . . .. Uncontested
16,588 13,873 30,46I .. .. Uncontested .. . . Uncontested
--- -.. . . .. .. .. . .
- -
272,622 256,757 529,379
Percentage of Electors to whom Ballot-papers were
Informal issue(l to Total Number Ballot· of Electors Enrolled. papers.
Males. Females. Total. --
719 82•39 75•74 78•49 566 89•85 85•11 87'31
.. .. .. .. 509 88'21 79•83 83'75 583 81'53 71•60 76'33 530 88•88 82·39 85•84 519 85•62 79•19 82•40 589 84·93 75•86 80•68 626 80•56 71•79 75'67 629 81•80 72•71 77•63 473 87•32 78·35 83•34 495 89•42 81•54 85'51 753 79•59 70•87 74•74 217 89•60 83•86 86'95 636 83•4I 71•12 76'31 583 82•71 72•62 77•48 807 76·I6 69•44 72•85
.. .. . . . . 480 90•10 81•31 85'88
.. . . .. ..
. . . . . . .. --- -- --- --. . .. .. . .
.. .. . . .. --- -- ---- --
9,714 I 84·76 76•24 80•40
NUMBER OF ELECTORS.-LEGISLATIVE COUNCIL.-(!.) RETURN of the Number of Electors for each Eiectoral Province on the Rolls for 1914-15.
Electoral Provinces.
Bendigo East Yarra Gippsland Melbourne Melbourne East .. Melbourne North Melbourne South Melbourne West Nelson Northern North-Eastern •. North-Western •. Southern South-Eastern .. South-Western .. Wellington Western
Grand Total
[252]
: Males.
--
8,471 22,399 10,576 14,267 I5,360 23,742 I7,724 20,333 8,388 9,90I 9.883
12;635 I0,237 I6.586 12,803 8,237
10,702 ---1232,244
Ratepe.yers.
Females. Total. - ---
2,70I 11,172 6,324 28,723 2,564 I3,I40 4,777 19,044 3,696 I9,056 4,I80 27,922 5,498 23,222 4,I09 24,442 2,564 I0,952 2,632 I2,533 2,909 12,792 2,844 15,479 2,863 I3,100 4,487 21,073 3,077 15,880 2,221 10,458 2,570 I3,272
--- ---60,016 292,260
Number of Electors on the Rolls.
Non-ratepayers. Total.
Males. Females. Total. Males. Females.
-- ---
4 .. 4 8,475 2,701 19 IO 29 22,4I8 6,334 4 2 6 10,580 2,566 9 4 I3 14,276 4,78I 5 6 11 I5,365 3,702
10 5 I5 23,752 4,I85 8 10 18 17,732 5,508 5 I 6 20,338 4,110
19 9 28 8,407 2,573 I4 7 2I 9,9I5 2,639 7 1 8 9,890 2,9IO 8 I 9 12,643 2,845
19 7 26 10,256 2,870 4 2 6 16,590 4,489 6 I 7 12,809 3,078 7 5 12 8,244 2,226 6 .. 6 I0,708 2,570
--- --- --- ---154 71 225 232,398 60,087
TotaL
11,I7 28,75 13,14 I9,05 19,06 27,93 23,24
6 2 6 7 7 7 0 8 0 4 0 8 6 9
24,44 10,98 12,55 12,80 15,48 13,12 2I,07 15,8 10,4
87 70 8 13,27
292,4 85
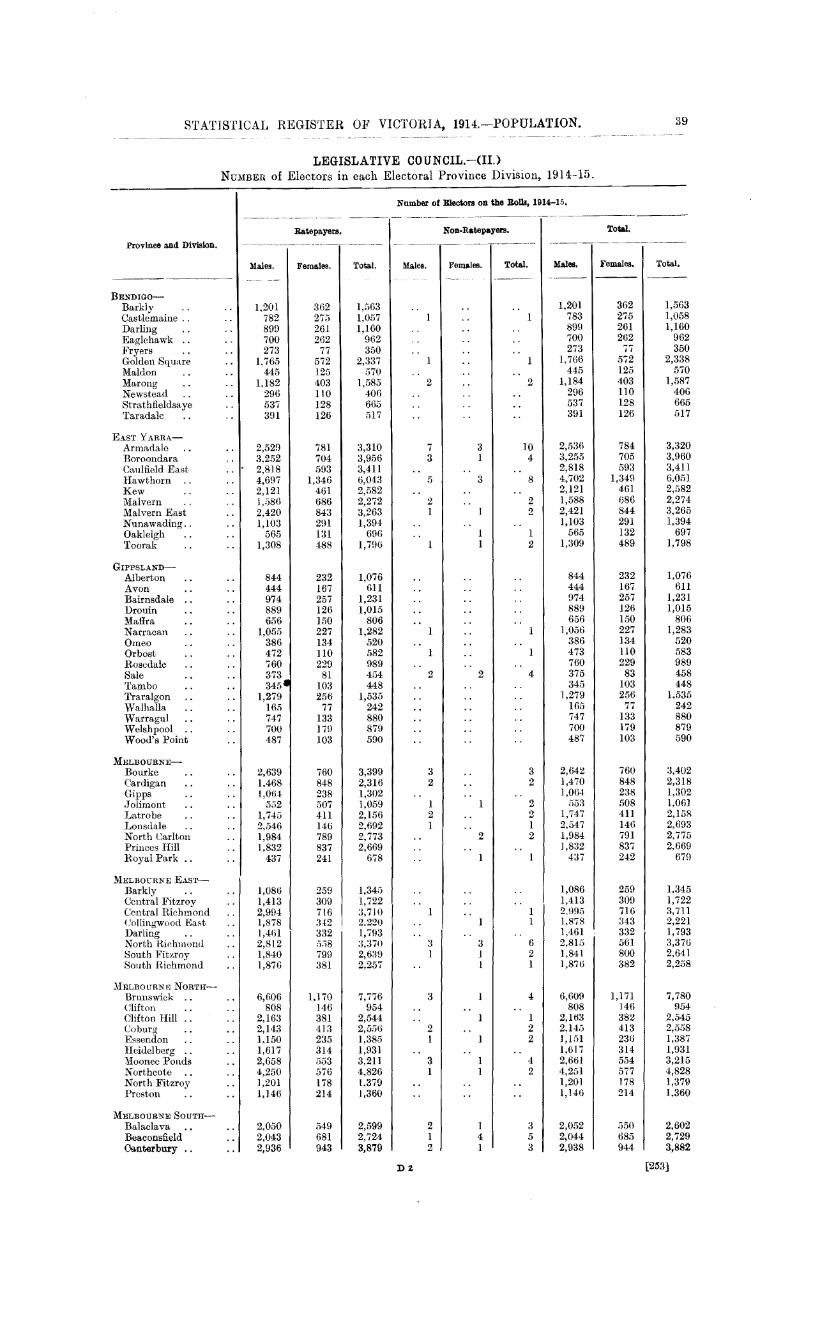
S'Lt\.TISTICAL REGISTER O:F VICTORIA, 1914.-POPULATION. 39
LEGISLATIVE COUNCIL.-(Il.) NuMBER of Electors in each Electoral Province Division, 1914-15.
Number of Blect.om on the Rolls, 1914-16.
Ra~payem. N on-Ratepay61'8. ToW.
Province and Division.
Males. Females. Total. Males. Females. Total. Males. Females. Total.
---
BEND I GO-Barkly 1,201 :362 Castlemaine .. 782 27;) Darling 899 261 Eagle hawk .. 700 262 Fryers 273 77 Golden Square 1,765 572 Mal don 445 125
1,563 .. .. .. I,201 362 1,563 1,057 1 .. 1 783 275 1,058 1,I60 . . .. .. 899 26I I,160
962 . . . . . . 700 262 962 350 .. . . .. 273 77 350
2,337 I .. 1 1,766 572 2,338 570 '. .. .. 445 I25 570
Marong 1,182 403 Newstead 296 llO
I,585 2 .. 2 I,I84 403 I,587 406 '. . . . . 296 llO 406
Strathfieldsa ye 537 128 Taradale 391 126
665 . . .. .. 537 I28 665 5I7 .. .. . . 39I 126 517
EAST YARRA-Armadalc 2,529 781 Boroondara 3,252 704 Caulfield East 2,818 593 Hawthorn .. 4,697 1,346 Kew 2,121 461 Malvern 1,586 686 Malvern East 2,420 843 Nunawading .. 1,103 291 Oakleigh 565 131 Toorak 1,308 488
3,3IO 7 3 lO 2,536 784 3,320 3,956 3 I 4 3,255 705 3,960 3,4II .. . . . . 2,8I8 593 3,4I1 6,043 5 3 8 4,702 I,349 6,051 2,582 .. .. .. 2,I21 46I 2,582 2,272 2 .. 2 1,588 686 2,274 3,263 I ] 2 2,42I 844 3,265 I,394 '. .. .. I,103 29I 1,394
696 .. I I 565 132 697 I,796 I 1 2 1,309 489 1,798
GIPPSLAND-Alberton 844 232 Avon 444 167
I,076 .. .. .. 844 232 1,076 611 .. . . . . 444 167 611
Bairnsdale 974 257 Drouin 889 126
1,231 .. .. . ' 974 257 I,231 I,015 .. .. .. 889 I26 I,OI5
Maffra 656 150 806 .. .. .. 656 I 50 806 Narracan 1,055 227 Omeo 386 134
1,282 1 .. 1 1,056 227 1,283 520 .. . . .. 386 134 520
Orbost 472 110 582 1 .. 1 473 llO 583 Rosedale 760 229 989 .. . . .. 760 229 989 Sale 373 81 4()4 2 2 4 375 83 458 Tambo 345 103 448 .. . ' .. 345 103 448 Traralgon 1,279 256 Walhalla 165 77
1,535 .. .. . . 1,279 256 I,535 242 .. .. .. I65 77 242
Warragul 747 133 Welsh pool 700 179 Wood's Point 487 103
880 .. . . .. 747 I33 880 879 .. .. . . 700 179 879 590 .. .. . ' 487 I03 590
MELBOURNE-Bourke 2,639 760 3,399 3 .. 3 2,642 760 3,402 Cardigan 1,468 848 Gipps 1,064 238 Jolimont 5i}2 507
2,3I6 2 .. 2 I,470 848 2,318 I,302 .. . . .. I,064 238 1,302 I,059 1 I 2 553 508 I,06J
Latrobe I,74;) 411 2,156 2 .. 2 1,747 4ll 2,15S Lonsdale 2.546 146 2,692 I .. I 2,547 I46 2,693 North Carlton I,984 789 2,773 .. 2 2 I,984 791 2,775 Princes Hill 1,832 837 2,669 .. . ' .. ],832 837 2,669 Royal Park .. 437 241 678 .. 1 I 437 242 679
MELBOURNE EAST-Barkly 1,086 259 Central Fitzroy 1,413 309 Central Richmond 2,994 716 Collingwood East 1,878 ~H2
Darling 1,461 332 North Richmond 2,812 558
I,345 .. .. .. I,086 259 I,345 1,722 .. . ' .. I,4I3 309 I,722 3,710 I .. I 2,995 7I6 3, 7I1 2,220 .. I I 1,878 343 2,22I 1,793 .. .. . ' I,46I 332 1,793 :~,370 3 3 6 2,8I5 56 I 3,376
South Fitzroy 1,840 799 South Richmond 1,876 38I
2,639 ] 1 2 1,841 800 2,64I 2,257 .. l I 1,876 382 2,258
:MELBOURNE NoRTH-Brunswick 6,606 I,170 7,776 3 I 4 6,609 I,17I 7,780 Clifton 808 146 954 .. .. .. 808 146 954 Clifton Hill 2,163 381 2,544 .. I I 2,I63 382 2,545 Coburg 2,143 413 Essen don 1,150 235
2,556 2 .. 2 2,I45 4I3 2,558 1,385 I 1 2 ] ,151 236 1,387
Heidelberg I,617 314 1,931 .. .. . . I,617 3I4 1,93I :lYioonee Ponds 2,658 553 3,211 3 I 4 2,661 554 3,215 Northcote 4,250 576 4,826 I l 2 4,2fH 577 4,828 North Fitzroy 1,201 178 Preston I,146 214
1,379 .. . . .. I,201 178 I,379 1,360 .. . . . . I,l46 214 I,360
MELBOURNE SouTH-Balaclava 2,050 549 2,599 2 I 3 2,052 650 2,602 Beaconsfi.eld 2,043 681 2,724 I 4 5 2,044 685 2,729 Os.nterbury .. 2,936 943 3,879 2 1 3 2,938 944 3,882
DZ [253]

40 STATISTICAL REGISTER. OF VICTORIA, 1914.-POPULATION. --~-~~--~--------~
LEGISLATIVE COUNOIL.-(II.) NuMBER of Electors in each Electoral Province Division, 1914-15-continued.
Number of Electors on the Rolls, 1914-15. -~~--
Province and Division. Ratepayers. Non-Ratepayers. Total. --- -~~ -~ ~- --
Males. Females. ToW. Males. Females. Total. .Hales. Females. ToW • ------ ~ --·-··----
MELBOURNE SouTH---con-tinued.
Caulfield .. .. 1,980 519 2,499 ] . . 1 1,981 519 2,500 Emerald Hill .. 1,061 177 1,238 1 I 2 I,062 I78 1,240 Prahran .. .. 2,806 584 3,390 .. .. . . 2,806 584 3,390 St. Kilda East .. 1,252 481 1,733 .. . . . . 1,252 481 1,733 St. Kilda West .. 1,006 563 1,569 .. .. . . 1,006 563 1,569 South Yarra .. 2,590 1,001 3,591 1 3 4 2,591 1,004 3,595
MELBOURNE WEST-Ascot Vale .. .. 1,775 3I4 2,089 5 1 6 1,780 315 2,095 Flemington .. .. 2,833 661 3,494 .. . . .. 2,833 661 3,494 Footscray .. .. 2,926 444 3,370 .. .. .. 2,926 444 3,370 North Footscray .. 2,603 414 3,017 . . .. . . 2,603 414 3,017 North Melbourne .. 3,099 976 4,075 . . . . .. 3,099 976 4,075 North Williamstown .. 1,652 224 1,876 .. .. . . 1,652 224 1,876 Port Melbourne .. 4,185 844 5,029 .. . . .. 4,185 844 5,029 South Williamstown .. 1,260 232 I,492 .. .. . . I,260 232 I,492
NELSON-
I Ararat .. .. 604 I49 753 .. .. . . 604 I49 753 Beaufort .. .. 527 174 701 .. . . . . 527 I74 70I Carisbrook .. .. 219 30 249 .. . . . . 2I9 30 249 Clunes .. .. 205 I3I 336 . . .. . . 205 I3I 336 Creswick .. .. 570 I 56 726 5 I 6 575 I 57 732 Dunolly .. .. 694 258 952 3 .. 3 697 258 955 Glenorchy .. .. 549 I 55 704 6 2 8 555 I 57 7I2 Lands borough .. 597 I62 759 I 2 3 598 164 762 Lex ton .. .. 3I5 68 383 2 I 3 3I7 69 386 Maryborough .. 627 146 773 I . . I 628 I46 774 Moyston . . .. I,009 324 I,333 .. . . . . 1,009 324 1,333 St. Arnaud .. .. 409 I65 574 .. 1 I 409 I66 575 Stawell .. .. 379 I 52 53 I .. .. . . 379 152 53 I Stuart Mill .. .. 754 229 983 .. .. . . 754 229 983 Tal bot .. .. 347 I07 454 I 2 3 348 I09 457 Timor .. .. 583 158 741 .. .. . . 583 158 741
NoRTHERN-.1 Echuca .. .. 474 171 645 1 .. 475 171 646
Goulburn .. .. 235 83 318 .. . . . . 235 83 318 Heath cote .. .. 495 185 680 1 .. 1 496 185 681 Huntly .. .. 499 15I 650 .. .. . . 499 I 51 650 Kerang .. .. 1,358 327 1,685 .. . . .. 1,358 327 1,685 Mooroopna . . .. I,044 285 I,329 .. .. . . I,044 285 I,329 Numurkah .. .. I,406 363 1,769 .. .. . . 1,406 363 1,769 Rochester .. .. 868 128 996 1 .. 1 869 128 997 Rochester East .. 697 233 930 .. .. . . 697 233 930 Rush worth .. .. 802 290 I,092 11 7 18 813 297 I,110 Serpentine .. .. 414 48 462 .. .. . . 414 48 462 Shepparton .. .. I,609 368 I,977 . . .. . . 1,609 368 I,977
NORTH-EASTERN-Beechworth .. .. 671 235 906 .. .. . . 671 235 906 Benalla .. .. I,983 536 2,519 2 .. 2 1,985 536 2,521 Bright .. .. 689 185 874 1 .. I 690 185 875 Chiltern .. .. 274 60 334 .. .. . . 274 60 334 Mansfield . . .. 485 145 630 . . .. . . 485 145 630 Oxley . . .. 661 214 875 .. .. . . 661 214 875 Rutherglen .. .. 778 220 998 . . . . . . 778 220 998 Strathbogie .. .. 643 I91 834 .. . . . . 643 I91 834 Towong .. .. 865 248 I,ll3 I I 2 866 249 I,ll5 Tungamah .. .. 498 I28 626 .. .. . . 498 128 626 Wangaratta .. .. 882 301 I,I83 2 .. 2 884 30I I,I85 Wodonga .. .. 293 89 382 .. . . . . 293 89 382 Y ackandandah .. 688 179 867 . . .. . . 688 179 867 Yarrawonga .. 473 178 651 I . . I 474 I78 652
NoRTH-WEsTERN-Birchip .. .. 841 297 1,I38 .. .. . . 841 297 1,138 Boort .. .. 942 277 1,219 2 1 3 944 278 I,222 Charlton .. .. 493 102 595 . . .. . . 493 102 595 Dim boo la .. .. 1,359 195 1,554 1 .. 1 1,360 195 1,555 Dunmunkle .. 678 184 862 .. . . . . 678 184 862 Hors ham .. .. 942 240 1,182 . . . . . . 942 240 1,182 Inglewood .. .. 908 I21 I,029 . . . . . . 908 121 1,029 Karkarooc .. .. 980 221 i 1,201 . . . . . . 980 221 1,201 Lawloit .. .. 6I8 143 761 . . . . . . 618 143 761 Low an .. .. 687 125 I 812 . . . . . . 687 125 8I2 Mildura .. .. 959 I86 ' 1,145 . . . . . . 959 186 1,145 Swan Hill .. .. 1,621 314 1,835 5 . . 5 1,526 314 1,840 Warracknabeal .. 934 292 1,226 .. . . . . 934 292 1,226 Wycheproof .. 773 147 920 .. .. . . 147 920

•
STATISTICAL REGISTER OF VICTORIA, 1914.-POPUI.ATION.
LEGISLATIVE COUNCIL. -(11.)
NuMBER of Electors in each Eleetoral Province Division, 1914-15-continued.
Province and Division,
Males.
---SouTHERN
Alexandra Bacchus Marsh Ballan Broadmeadows Bullarook Daylesford Don caster Eltham Franklin Gisborne Healesville Kilmore Kyneton Lancefield Melton Pyalong Seymour Whittlesea Yea
SouTH-EASTERNBerwick Brighton Cranbourne .. Dandenong Flinders ,Jeetho Lilydale Moorabbin Mornington .. Mulgrave Phillip Island .. Scores by Woorayl
Sol.:"TH-WEsTERNBarrarbool .. Camperdown Go lac Gee long Lara Leigh Meredith .• Newtown and Chilwell Queenscliff .. West Geelong Winchelsea .. Wyndham ..
WELLINGTONBallaarat Ballaarat East Bungaree Buninyong .. Dowling Forest Pitfie1d Sebastopol
WESTERNArapiles Casterton Cobden Edenhope Hamilton Koroit Minhamite Mort lake Penshurst Portland Port Fairy Wannon Warrnambool
Total .. I 2
659 478 464 738 262 379 428 617 580 730 251 533
1,070 461 890 202 464 600 431
1,038 2,909
779 1,196
596 969
1,268 2,794
889 1,222 1,314
795 817
869 1,743 2,010 2,548
888 273 182 828
1,023 1,281
661 497
2,998 2,061
597 978 616 299 688
630 837 776 641
1,391 1,521
380 508 418
1,227 771 501
1,101
32,244
.Ratepayers.
Females
256 95
us us 61
ll3 86
173 188 221 148 169 321 ll2 158 84
153 159 130
340 770 115 407 190 212 320 841 304 228 337 216 207
147 337 ;)7!)
!l53 193 72 31
236 265 254 127 83
980 580 110 172 13!) 99
l-t4
lf\8 i 214 102 312 355 260 66 85 92
372 158 128 258
60,016
Number of Electors on the Rolls, 19U-15.
Non-Ratepayers • Total.
Total. Males. Females. Total. Males. Females.
---
915 . . .. .. 573 2 4 6
659 256 480 99
582 2 .. 2 856 .. .. .. 323 4 .. 4 492 .. .. .. 514 .. .. .. 790 .. .. .. 768 .. .. .. 951 .. .. .. 399 .. .. .. 702 3 .. 3
1,391 .. .. .. 573 . . . . ..
466 118 738 118 266 61 379 ll3 428 86 617 172 580 188 730 221 251 148 536 169
1,070 321 461 ll2
1,048 3 2 5 286 1 1 2 617 .. .. .. 759 4 .. 4 561 . . . . ..
893 160 203 85 464 153 604 159 431 130
1,378 .. . . .. 3,679 .. 1 1
894 .. . . .. 1,038 340 2,909 771
779 ll5 1,603 .. . . ..
786 3 .. 3 1,196 407
599 190 1,181 . . . . .. 1,588 .. .. .. 3,635 .. .. .. 1,193 ... .. .. 1,450 1 .. 1 1,651 .. 1 I 1,011 .. .. .. 1,024 .. .. ..
969 212 1,268 320 2,794 841
889 304 1,223 228 1,314 338
795 216 817 207
1,010 .. .. . . 2,080 3 .. 3 2,389 .. .. .. 3,501 2 1 3 1,081 .. . . ..
345 1 .. 1 213 . . .. ..
1,064 .. .. .. 1,288 .. . . .. 1,535 . . . . ..
788 . . .. ... ,)80 .. . . ..
869 147 1,746 :337 2,010 379 2,550 954
888 193 274 72 182 31 828 236
1,023 265 1,281 254
661 127 497 83
3,978 7 3 10 2,641 .. . . ..
707
I . . . . ..
l, 150 .. 2 2 752 .. .. .. :398 . . .. .. 832 .. .. ..
3,005 983 2,061 580
597 110 978 174 616 136 299 99 688 144
798 .. .. .. 630 168 1,051 .. . . ..
878 . . .. . . 837 214 776 102
953 .. .. . . 641 312 1,74() 1 .. 1 1,781 .. .. . .
446 . . . . .. 1,392 355 ],521 260
380 66 593 .. . . .. ;.)08 85 510 . . .. .. 418 92
1,599 1 .. 1 929 .. . . . .
1,228 372 771 158
629 I .. 1 502 128 1,359 3 ..
I :J
292,260 154 71 225
1.104 258
232,398 60,087
41
Total.
915 579 584 856 327 492 514 790 768 951 399 705
1,391 573
1,053 288 617 763 561
1,378 3,680
894 1,603
789 1,181 1,588 3,635 1,193 1,451 1,652 1,011 1,024
1,016 2,083 2,389 3,504 1,081
346 213
1,064 1,288 1,535
788 580
3,988 2,641
707 1,152
752 398 832
798 1,051
878 953
1,747 1,781
446 593 510
1,600 929 630
1,362
292,4Rf)
[255]

42 STATISTICAL REGISTER OF VICTORIA, 1914.-POPULATION.
NUMBER OF ELECTORS.-LEGISLATIVE ASSEMBLY.-(III.)
RETURN of the Number of Resident Electors for each Electoral District on the Rolls which came
into force on the I st July, W15.
Number of Electors on the .Annual
Electoral District. General Rolls, 1915,
Males. Females. Total.
Abbotsford 7,080 7,717 14,797 Albert Park 8,286 10,034 18,320 Allandale 2,959 3,246 6,205 Ballaarat East 4,781 5,989 10,770 Ballaarat West 4,321 6,128 10,449 Barwon 5,432 5,703 11,135 Benalla 4,181 3,770 7,951 Benambra 4,055 3,103 7,158 Bendigo East 5,008 4,520 9,528 Bendigo West 4,719 5,679 10,398 Boroondara 13,608 1(),953 30,561 Borung 3,952 3,346 7,298 Brighton 8,338 9,329 17,667 Brunswick 8,884 10,215 19,099 Bulla 5,611 4,883 10,494-Carlton 6,487 7,307 13,7!l4 Castlemaine and Maldon 3,344 3,782 7,126 Collingwood (),272 7,41;') 13,687 Dalhousie 3,627 :~.684 7,:511 Dandenong 0,855 (i,:34.) 1a.2uo Daylesford 3,602 :5,424 7,02(i Dundas 4,428 4,1()2 8,590 Eaglehawk 4,042 3,899 7,941 East Melbourne 5,245 o,989 11,234 Essendon 11,224 12,8;")3 24,077 Evelyn ri,343 4,8!)!) 10,2+4 Fitzroy 5,187 f)J)l1 11,098 Flemington 10,025 H,9ii1 Hl,97fi Gee long fi,476 7,;39;) l-I-,Oi1 Gippsland East 3,644 2.;)57 (),201 Gippsland North 4,817 4,382 9,19\l Gippsland South 5,3()4 4,237 9,6Ql Gippsland West 4,663 :1,785 8,448
Electoral District.
Glenelg Goulburn Valley Grenville Gun bower Hampden Hawthorn ,Jika .Jika Kara Kara Korong Lowan :VIaryborough 31:elbourne .Jiornington North Melbourm• On:ns Polwarth Port Fairy Port .Jicll;ourne Prahra.n lUdunolHl Rodney Stawell and Ararat St. Kilda Swan Hill Toorak Upper Goulburn Walhalla \Vangaratta \Varanga Warrenheip Warrnam bool \Villiamstown
Total
1-lumber of Electors on the .Annual General Rolls, 1 Ql5.
Males. Females. ~ - -~
4,583 4,471 4,688 4,308 3,152 3,027 4,679 3,630 13,52;') 5,656 !1,153 14,112
11,610 13,083 :5,853 3,430 3,788 :3,240 4,721 4,332 :1,720 :5,982 :5,869 3,213 7,343 6,153 7,432 8,474 3,29J. :3,250 5,920 5,027 4,121 3,()()0
8,ii7(i 8,140 7.882 ] l,ii08 7,386 8,554 5,4i:i7 4,798 4,()53 4,175
10,399 14,357 0,883 6,225 8,986 13.674 4.367 3,738 3,590 2,fi90 4,283 4.0ii3 3,595 :~.I :i8 3,201 2,785 4,538 4,:mo
10,421 9,865
378,530 398,130
Total.
9,05 8,99 6,17 8,30
4 6 9 9
12,181 23,26 24,69
7,28 7,02 9,05 7,70
5 3 3 8 3 2 '!, 7,08.
13,49 15,90.
6 6 4 7
6,54 10,94
7,781 16,71. 6
0 0 ;)
19,39 15,94 l(i,25r: 8,82
24,75 13,10 22,66
8 6 8 0
8,10. 6,28 8,33 6,73 ;),98 9,12
20,28
0 G 3 6 8 6
776,66 0
XOTE.-Under the provisions of the Electoral Act 1910, Rolls of Ratepayers and Son-ratepayers for the Legislative Assembly were aboli:;hed. The printerl Annual or Special Genenl Rolls contai:c the names of re<>ident elcC't•1T'I only. The Electoral Act 1910 makes provision for continuous enrolment for the J,egialath·e Assembly, and names are adtlerl to the Re.dstrar>' Otllciai Roll;:; dnring the currency of such Rolls. Persons possessing a property qualification must make claim for enrolment within three months after the emnin!! into force of the printed Rolls. ln the event of an election, a list of names added to the Roll since printing (including pro]Jerty holders, if any) up to and inclu:<ive of a day being thirty days before a vacancy or di~solution i!l printed for use at such <>lrction.
LEGISLATIVE ASSEMBLY.-UV.)
NuMBER of Resident Electors in each Electoral District Division, on 1st July, 1915.
Number of Electors on the Annual Number of Electors on the Annual
District and Division. General Rolls, HH5. General Rolls, 1915.
District and Division.
Males. Females. Total. Males. Females. Total.
ABBOTSFORD-Collingwood East 2,661 3,067 5,728 BALLAARAT WEST~ 4,321 6,128 10,449 North Richmond 4,419 4,650 9,069
BARWON-Barrarbool 1,248 1,130 2,378
ALBERT PARK- Lara 1,097 954 2,051 Beaconsfield 3,768 4,446 8,214 Newtown and Uhilwell 1,513 2,065 3,578 Canterbury 4,518 5,588 10,106 Queenscliff 1,574 1,554 3,128
BENALLA-A.LLANDALE- Benalla 1,578 1,448 3,026
Clunes 777 1,038 1,815 :VIokoan 1,010 846 1,856 Ore;,; wick 891 971 1,862 Yarrawonga .. 1,593 1,476 3,069 Dowlinv li'orest 1,010 1,042 2,052 Lexton 281 195 476 BENAMBRA-
Towong 2,210 1,468 3,678
BALLAARA'l' EAS'l Wodonga 756 678 1,434
4.781 5,989 10,770 Yackandanda.h 1,089 957 2,046 [256]

STATISTICAL REGISTER OF VICTORIA, 1914.-POPULATION. ~3
LEGISLATIVE ASSEMBLY.-(IV.) Number of Resident Electors in each Electoral District Division ou lst July, 1915-continued.
Number of Electors on the Annual Number of Electors on the Annn'll General Rolls, 1915. General Rolls, 1915.
Dlslric\ and Division. District and Division.
Males. Fema.les. Total. Males. Females. Total.
BENDIGO EAST- EAST MELBOURNE-Barkly 3,134 2,471 5,605 Gipps 1,572 1,081 2,653 Darling 1,358 1,586 2,944 Jolimont 2,862 4,042 6,904 Strathfieldsaye 516 463 979 Latrobe 811 866 1,677
BENDIGO WEST-Golden Square 3,276 4,320 7,596 EssENDoN-Kangaroo Flat 1,443 1,359 2,80Z Ascot Vale 2,686 2,923 5,609
Coburg 3,143 3,506 6,649 BOROONDARA- Essendon 1,557 1,829 3,386
Boroondara 4,390 5,776 10,166 Moonee Ponds 3,838 4,595 8,433 Caulfield East 3,643 4,258 7,901 Malvern East 3,317 4,301 7,618 Nunawading .. 1,507 1,822 3,329 EvELYN-Oakleigh 751 796 1,547 Eltham 1,056 943 1,999
Healesville 457 461 918 BORUNG~ Lilydale 2,754 2,517 5,271
Birchip 983 775 1,758 Whittlesea 1,078 978 2,056 Dunmunkle .. 1,221 1,046 2,267 W arrackna heal 1,748 1,525 3,273
FITZROY-BRIGHTON- Central Fitzroy 1,647 1,897 3,544
Brighton 2,558 3,457 (i,Ol5 Clifton 1,358 1,752 3,110 Elsternwick .. 1,478 2,003 3,481 South Fitzroy 2,182 2,262 4,444 Moorabbin 4,302 3,869 8,171
FLEMINGTON-BRUNSWICK 8,884 10,215 19,099 I Flemington .. 4,246 4,390 8,636
Hot ham 1,318 1,366 2,684 North Footscray 4,461 4,195 8,656
BULLA-Bacchus Marsh 882 763 1,645 Broadmeadows 1,199 1,088 2,287 GEELONO-Gisborne 937 939 1,876 East Geelong 2,727 3,291 6,018 Melton 1,520 1,313 2,833 West Geelong 3,749 4,304 8,053 Wyndham 1,073 780 1,853
GIPPSLAND EAST-CARLTON- Dargo 672 501 1,173
Cardigan 3,429 3,628 7,057 Omeo 940 644 1,584 Princes Hill .. 3,058 3,679 6,737 Orbost 1,196 837 2,033
Tambo 836 575 1,411 CASTLEMAINE-MALDON-
Castlemaine .. 1,552 1,887 3,439 GIPPSLAND NoRTH-Fryers 399 437 836 Avon 873 702 1,575 Mal don 770 886 1,656 Bairns dale 1,501 1,405 2,906 Taradale 623 572 1,195 Maffra 1,496 1,199 2,695
Sale 947 1,076 2,023 CoLLINowoon-
Barkly 1,633 1,911 3,544 GIPPSLAND SouTH-Clifton Hill 2,557 3,082 5,639 Alberton 1,682 1,256 2,938 Darling 2,082 2,422 4,504 Rose dale 629 535 1,164
Traralgon 1,826 1,575 3,401 DALHOUSIE- Welsh pool 1,227 871 :::.,098
Kilmore 921 886 1,807 Kyneton 1,615 1,866 3,481 GIPPSLAND WEST-Lancefield 813 694 1,507 Drouin 1,395 1,078 2,473 Pyalong 278 238 516 Mirboo 805 615 1,420
Warragul 1,203 1,139 2,342 DANDENONG- Woorayl 1,260 953 2,213
Berwick 2,086 1,754 3,840 Dandenong 2,129 2,057 4,186 GLENELG-Mulgrave 1,642 1,615 3,257 Branxholme 1,18;'5 1,178 2,363 Scores by 998 919 1,917 Casterton 1,719 1,626 3,345
Heywood 788 683 1,471 DAYLESFORD- Portland 891 984 1,875
Bullarook ~132 305 637 Daylesford 960 1,010 1,970 GOULBURN VALLEY-Franklin 1,043 930 1,973 Arcadia 620 605 1,225 Newstead 455 454 909 Katamatite 654 535 1,189 Trent ham 812 725 1,537 Numurkah 1,858 1,672 3,530
'I Shepparton 1,556 1,496 3,052 DUNDAS- ,,
Arapiles 848 684 1,532 GRENVILLE-Balmoral 392 280 67~
ii Buninyong 1,160 1,114 2,274 Edenhope 987 881 1,868 Pitfield 889 784 1,673 Hamilton 2,201 2,317 4,518 Sebastopol 1,103 1,129 2,232
':
EAGLEHAWK- GUNBOWER-Bridgewater 868 739 1,607 Boort 579 484 1,063 Eaglehawk .. 1,726 2,008 3,734 Kerang 2,788 2.165 4,953 Huntly 1,047 841 1,888 Terrick 545 438 983 Runnymede 401 311 712 Wycheproof .. 767 543 1,310
[~57]

44 STATISTICAL REGISTER OF VICTORIA, 1914. -POPULATION.
LEGISLATIVE ASSEMBLY.-(IV.) NuMBER of Resident Electors in each Electoral District Division, on 1st July, 1915-continued.
Number of Electors on the Annual
li General Rolls, 1915.
District and Division.
Males. Females. Total.
11
i' AMPDEN-
11
Beaufort .. .. 1,513 1,285 2,798 Camperdown .. 3,169 2,899 6,068 Mortlake .. .. 934 823 1,757
H
Wickliffe .. .. 909 649 1,558
li H AWTHORN- 11
Hawthorn .. .. 6,250 10,042 16,292 I Kew .. .. 2,903 4,070 6,973 I
!
IKA JIKA- I I
Heidelberg .. . . 2,476 2,782 5,258 ' I J
Northcote . . .. 6,034 6,771 12,805 North Fitzroy .. 1,581 1,915 I 3,496 I Preston .. .. 1,519 1,615 3,134 I
K ARA KARA-Dunolly . . .. 1,258 1,187 2,445 Lands borough .. 551 462 1,013 St. Arnaud .. . . 905 923 1,828 Stuart Mill .. .. 1,139 858 1,997
K ORONG-Charlton .. .. 1,254 1,094 2,348 Inglewood .. .. 937 813 1,750 Serpentine .. .. 567 460 1,027 Wedderburn .. 1,030 873 1,903
L OWAN-Dimboola .. . . 1,536 1,330 2,866 Horsham .. .. 1,650 1,638 3,288 Lawloit .. .. 531 469 1,000 Nhill .. .. 1,004 895 1,899
iARYBOROUGH-Carisbrook .. 337 306 643 Maryborough .. 1,267 1,441 2,708 Tal bot .. . . 1,255 1,246 2,501 Timor .. . . 861 989 1,850
iELBOURNE-Bourke .. 3,424 2,815 6,239 Lonsdalc; .. . . 445 398 843
lORNINGTON-Flinders .. .. 916 865 1,781 Jeetho .. .. 1,890 1,533 3,423 Mornington .. .. 1,316 1,299 2,615 Phillip Island .. 3,221 2,456 5,677
:: N ORTH MELBOURNE--
North Carlton .. 2,968 3,503 6,471 North Melbourne .. 3,511 3,722 7,233 Royal Park .. .. 953 1,249 2,202
0 VENS-Beechworth .. .. 1,278 1,369 2,647 Bright .. .. 1,525 1,320 2,845
I Chiltern .. .. 491 561 1,052
p .OLWARTH-Corangamite .. .. 3,162 2,853 6,015 Leigh . . .. 634 568 1,20~ Otway .. .. 1,021 663 1,684 Winchelsea .. . . 1,1~3 943 2,046
PORT FAIRY-Koroit .. .. 1,503 1,300 2,803 Minhamite . . .. 553 452 1,005 Peflshurst .. .. 779 695 1,474 Port Fairy . . .. 1,286 1,213 2,499
PORT MELBOURNE-Emerald Hill .. 4,466 4,198 8,664 Port Melbourne .. 4,110 3,942 8,052
,I . I! IJ
[258]
District and Division.
PRAHRAN-Prahran .. . . South Yarra ..
RICHMOND-Cent!ral Richmond .. South Richmond ..
RODNEY-Echuca .. .. Mooroopna .. .. Rochester .. . . Rochester East ..
STAWELL AND ARARAT-Ararat .. . . Glenorchy .. .. Moyston .. .. Stawell .. . .
ST. KILDA-Balaclava .. .. Caulfield .. . . St. Kilda East .. St. Kilda West ..
SWAN HILL-Corong .. .. Mildnra .. . . Swan Hill . . ..
TOORAK-Armadale .. .. Malvern . . .. Toorak .. . .
UPPER GouLBURN-Alexandra .. . . Mansfield .. .. Seymour .. .. Strathbogie . . .. Yea . . ..
WALHALLA-Narracan . . .. Walhalla . . . . Wood's Point ..
WANGARATTA-Oxley . . .. Peechelba .. . . Rutherglen .. . . Wangaratta .. ..
WARANGA-Goulburn . . .. Heathcote . . .. Rushwort,h . . ..
W ARRENHEIP-Ballan .. .. Bungaree .. .. Meredith .. .. Warrenheip . .
W ARRNAMBOOL--Allansford .. . . Cobden .. .. Warrnambool ..
WILLIAMSTOWN-Footscray . . .. North Williamstown . . South Williamstown ..
Total ..
Number of Electors on General Rolls, 1
Males. Females. --~-
3,421 5,142 4,461 6,366
4,639 5,376 2,747 3,178
1,026 1,046 1,906 1,641 1,587 1,371
938 740
1,ll9 1,176 1,269 758 1,128 901 1,137 1,340
3,146 4,107 2,814 3,717 2,072 3,042 2,367 3,491
2,707 1,650 2,221 1,655 1,955 2,920
4,006 5,859 2,557 3,848 2,423 3,967
952 796 1,106 930
931 842 609 532 769 638
1,290 1,038 807 661
1,493 991
1,026 870 216 179
1,349 1,285 1,692 1,719
1,379 1,280 1,ll6 938 1,100 920
1,040 986 1,126 938
389 331 646 530
1,435 1,313 1,250 1,071 1,853 2,206
4,981 4,750 2,834 2,769 2,606 2,346
378,530 398,130
the Annual 915.
Total.
8,56 10,82
3 7
10,01 5,92
2,07 3,54 2,95 1,67
2,29 2,02 2,02 2,47
7,25 6,53 5,11 5,85
4,35 3,87 4,87
5 5
2 7 8 8
5 7 9 7
3 1 4 8
7 6 5
9,86 5 5 0
6,40 6,39
1,74 2,03 1,77 1,14 1,40
8 6 3 1 7
2,32 8 8 4
1,46 2,48
1,89 39
2,63
6 5 4 1 3,41
2,65 2,05 2,02
2,02
9 4 0
2,06 6 4 0 6
72 1,17
2,7 2,3 4,0
9,7
48 21 59
5,6 31 03 52 4,9
776,6 60
•

STATISTICAL REGISTER OF VICTORIA, 1914.-POPULATION.
LEGISLATIVE COUNCIL.-(V.)
RETURN showing the Number of Electors on the Rolls and the Number of Electors who Voted at the Triennial Election on the 6th June, I 9 I 3·
Prov
East Yarra Melbourne Melbourne East Melbourne North Melbourne South Melbourne West Bendigo Gippsland Nelson Northern Nort.h-Eastern ... North-Western Southern South- Eastern South-Western Wellington Western
inoes.
...
... ...
...
...
... ...
...
...
... ...
...
... ... ...
... ...
...
... ...
... ...
...
. ..
. ..
...
...
...
... ...
... . ..
... . .. Less uncontest ed provinces { 12.)
Total ... ... ...
Number Number of Electors on
Rolls. Ratepayers.
-----
2.3,970 10,672. 18,454 .. 17,332 . .. 2.3,499 12.,145 2.1,460 . .. zr,46o 10,640 I 1,c69 ... 12,866 ... 10,780 ... 12,2.2.5 6,004 U,4J9 . .. 15,22.4 ... 13,033 . .. 18,492 8,205 14,593 ... 10,2.76 . .. 13,003 ...
2.70,175 ... 170,529 ... ---
99,646 4-7,666 I
of Electors who Voted.
Non-Ratepayers.
zs
8
3
II
6
Total.
10,697 !
Informal Votes.
95 Uncontested Uncontested
12.,153 ! 87 Uncontested
10,643 I 94 Uncontested Uncontested Uncontested
6,015 I 39 Uncontested Uncontested Uncontested
8,2.1 1 I 93 Uncontested Uncontested TJ neon tested
----- -----
Number who Voted
by Post.
143
132.
4+
67
359
-----
745
~f0li:ct~g:'s who Voted.
44'63
. 51'72.
49'59
49'2.0
44'40
-----
['l59]
45

LEGISLATIVE ASSEMBLY (VI.) I~ to NuMBER of Electors and Votes Polled at the General Election on 26th November, 1914. ~
I Percenta~e of Electors
No. of l~lectors who Voted. No. of I Electors Enrolled. First Preference No. of Electors who Voted. Electoral Dlstrlcts. ' Candidates' Names. Votes recorded for Informal who
each Candidate. Ballot- Voted Males. papers. by Post. l Males. I Females. I Total. loo
1-.3 >
Abbotsford 7,736 8,533 16,269 Gordon Charles Webber .. .. Unoppos<>d f-:3 .. .. ~ Albert Park .. . . 9,301 10,94r'i 20,246 George Alexr. Elmslie .. . . .. Unopposed 00
Allandale .. 3,015 3,306 6,321 Sir Alexr. James Peacock, K.C.M.G. .. Unopposed ;-3 . . .. )....j
0 Ballaarat East .. .. 4,913 6,081 10,994 r ,James l{arrisoll .. .. . . 3,524· } 3,546 4,170 7,716 113 399 72·17 68·57 70·18 > \Robe1·t M<>Gregor .. .. .. 4,07!) t-1 BaJlaar<'Lt West . . . . 4,472 6,234 10,706 f Ma,tthew Baird .. . . . . 4,390 } 3,153 4,106 7,2:i9 104 342 70·50 65·86 67·80 t:t1 t 'l'homas Itichards .. .. .. 2,76:i trj Barwon .. .. .. 5,551 :.>,773 11,324 r James Farish FalTer .. .. . . 3,711 I. 3,4,38 :l,OOO 6,438 194 73 61·93 51·96 56·85 0 \Alexr. Fredk. Parker .. .. . . 2,;")3:{ I ~
Benalla 4,286 3,808 8,094 I Ebene:ter Brown .. . . 1,411 } 2,448 1,832 4,280 84 36 57 11 48·11 52·88 rJ:; . . .. .. .. f-:3 \.John ,Joseph Carlisle .. .. . . 2,78;1 t?::l {John Willin.m Leckie . .. .. 2,18:) l ~ Renambra .. 4,08~ I 3,101 I 7,190 I J orgcn Vincent Pcter<cn .. . . 500 2,586 1,847 4,433 82 71 63·24 59·56 61·65 .. .. I J 0 John Robert Ross .. .. .. 1,668
Bendigo East 4,321 5,ll8 9,439 { James Henry Curnow .. 2,287 } 2,76!) 2,808 5,577 164 147 64·08 54·86 59·08 1-Ij . . . . .. . .
Alfred John Hampson .. .. .. 3,12() <l {David Andrew .. .. .. 2,87!) I .......
0 Bendgo West .. . . 4,770 5,707 10,477 Arthur Ernest Cook .. .. .. 1,M:3 f 3,340 3,438 6,778 166 273 70·02 60·24 64·69 ~ David Smitht . . . . .. .. 2,190 0 Boroondarn. .. . . 13,412 16,;162 29,974 jRalph Charrett . . . . .. 3,i)37 } 5,663 6,007 ll,670 204 ll9 42·22 36·27 38·93 :::0
l Sir Frank Maddl n .. .. . . 7,92!1 ~
Borung .. .. .. 4,227 3,538 7,765 William Hutchinwm .. .. Cnopposed ? Brighton . . .. .. 7,306 10,768 18,074 f Alhert Andrews .. .. .. 2,048 } 3,565 :~,975 7,540 144 57 48·79 36·91 41·71 _.
\. Oswald Hobins;m Snowball .. . . 5,348 c.o Brunswick .. .. .. 9,841 11,869 21,710 fJa.mes 1-toberts ,Jewell .. .. . . 0.318 ' 5,426 5,039 10,465 298 95 55·13 42·45 48·20 ~ \Joseph W<txman .. .. . . ~~.84!l j I Bulla .. .. .. 5,768 5,084 10,852 { George Francis McGowan .. . . 2,24() ' 3,425 2,641 6,066 131 105 59·38 51·94 55·89 '"d Andrew Robert Robertson .. .. 3,68\l j 0 Carlton . . . . 6,783 7,680 14,463 Ro bert Henry Solly .. . . . . Unopposed '"0 Castlemaine and Maldon .. 3,434 3,929 7,363 {Luke J ames Clough .. .. . . 1,547 I. 2,628 2,671 5,299 90 320 76•52 67•98 71•97 Cl
Harry S. W. Lawson .. .. .. 3,662 j ~ Collingwood .. 6,796 7,765 14,561 Martin Hannah .. . . Unopposed > ..
~ Dalhousie .. .. . . 3,745 3,698 7,443 f Reginald I von Argyle .. .. . . 2,465 } 2,729 2,618 5,347 112 248 72•87 70•79 71•84 ~ lAllan Francis Cameron .. .. . . 2,770 0 Dandenong .. .. 7,227 6,676 13,903 William Stephen Keast .. .. . . Unopposed ~ Daylesford .. .. .. 3,689 3,524 7,213 fMorton Dunlop .. .. . . 1,547 \ 2,465 2,161 4,626 68 119 66•82 61•32 64•13 l Donald McLeod .. .. .. 3,0ll I
{ Egerton Wilberham Holdent .. .. 2,740
{I Dundas .. ..
"I 4,5421 4,2591 8,801 I ,John Loughnane .. .. . . 918 3,3651 2,9091 6,2741 122 I 182 I 74'091 68·30 I 71•28 William Kennedy Smith .. .. 2,494
Eagle hawk .. .. 4,090 3,939 8,029 f Thomas Tunnecliffe .. .. . . 2,783 2,906 2,500 5,406 87 223 71'05 63•46 67•33 l William Wall ace .. .. . . 2,536 j Percy J ames Clarey .. .. .. 1,853 }I East Melbourne . . .. I 6,493 I 6,830 I 13,323 I Valentine Francis Cole .. .. . . 918 3,321 1 3,620 1 6,941 I 210 I 110 I 51·14 I 53·00 I 52'09 l Alfred Alexander Farthing .. .. 1,910 Sir Henry Weedont .. .. .. 1,990

GENERAL ELECTION FOR THE LEGISLATIVE ASSEMBLY, 1914:-continued.
No. of [ Percentage of Electors Electors Enrolled. First Preference ~ o. of Electors who Voted. No. of Electors who voted.
Electoral Districts. I Candidates' Names. Vote;; recorded for --Informal who
each Candidate. Ballot- Voted Males. Females. Total. Males. Females. Total. papers. by Po•t.l Males. Females, Total.
-- -Essen don .. .. .. I 11,792 13,503 25,295 ( Maurice McCrae Black burn .. 7,342 l 7,055 7,142 14,197 195 229 59•82 52'89 56•12 J.1
1-3 -, Edward Russell Thomas Reynolds .. 6,660 J > ~Edwa.d Arthur Duncan .. .. .. 1,285 l 1-3 William Hugh Everard .. .. 804
2,317 I 1-4
Evelyn .. .. .. j 5,461 i 4,94o 1 10,401 I George Arnot Maxwell .. .. . . 935 3,164 5,481 210 94 57•93 46•90 52•69 00 1-3 J ames Rougett .. .. .. 1,546
J 1-4
William Sell . . . . .. .. 370 0 Edward Charles Skardon .. .. 331 l>
Fitzroy .. .. .. 6,900 8,159 15,059 John William Billson .. . . Unopposed ::""
Flemington .. .. .. 10,389 9,805 20,194 Edward Coughlan Warde .. .. Unopposed ~ Geelong .. .. .. 6,444 7,614 14,058 William Plain .. .. .. Unopposed ('1'-j
{Jame' Cameront .. .. . . 1,788 1 Q Gippsland East 4,042 2,668 6,710 Donald Mc:Rae* .. 342 2,472 1,507 3,979 93 72 61•15 56'48 59•30 -.. .. .. . . 00
Edward Fitzgerald Russell . . .. 1,756 j 1-3 \Waiter Lyon . . . . .. . . 802 }
(:l:j
Gipps1and North .. .. 4,926 4,478 9,404 / Francis John Cork er Minchin .. . . 1,121 3,009 2,541 5.640 95 169 62•91 56•74 59•97 w James Weir McLachlan .. .. 3,622 0
Gippsland South .. .. 5,599 4,379 9,978 Thomas Livingston .. .. . . Unopposed ~ Gippsland West .. .. 4,751 3,832 8,583 John Emanuel Mackey .• .. . . Unopposed < Glenelg .. .. ··I 4,785 4,522 9,307 { Hugh John Munro Camp bell .. . . 3,449 ' 3,241 2,899 6,140 200 140 67•73 64'10 65•97 -Charles W. S. Paramor .. .. .. 2,491 f 0
(Thomas Francis Lyons .. .. .. 1,094
~ ~
Goulburn Valley .. .. I 4,785 1 4,428 I 9,213 I John Davidson Mitchcllt . . 2,001 2,951 2,472 5,423 86 91 61•67 55•82 58•86 0 l Alexr. McBride McClelland .. .. 815 t;'d 1-4
Patrick D. K. O'Hanlon . . .. 1,427 I > .I
Grenville .. .. .. 3,175 3,112 6,287 ~John Chatham .. .. .. . . 2,496 \ 2,236 2,110 4,346 92 115 70•42 67•80 69•12 "' { Nicholas Howell .. .. . . 1,758 f ......
Gunbower .. c.o .. .. 4,886 3,742 8,628 Henry Angus .. .. . . .. Unopposed ......
Hampden .. .. .. 6,561 5,705 12,266 { Patrick McMahon .. .. . . 2,850 \ 4,123 3,206 7,329 183 134 62•84 56•19 59•75 .~
David Swan Oman . . .. 4,296 f I Hawthorn .. .. .. 9,940 14,136 24,076 JFrederick William Dawborn . . . . 1,939 ) 1-d
l William Murray McPherson .. .. 6,1S7 I 3,831 4,466 8,297 171 53 38•54 31•59 34•46 0 Jika Jika .. .. .. 11,953 13,509 25,462 (James George Mcmbrey 7,177 }
1-d . . .. ~ L Francis Edward Morgan . . .. .5,623 0,784 6,248 13,032 232 171 56•75 46•25 51'18 t"'l
Kara Kara .. .. 3,950 3,508 7,458 {John War burton Pennington .. . . 3,545 } ~ IUchard J oseph Taaffe .. .. .. 1,872 2,927 2,580 5,507 90 215 74•10 73•54 73•84 ~
Korong .. .. .. 3,895 3,307 7,202 {Achilles Gray .. .. . . . . 2,611 I 1-4
William Williams .. . . 1,496 f 2,311 1,918 4,229 122 140 59•33 57•99 58'72 0 .. :z Low an .. . . .. 4,878 4,457 9,335 J amcs Menzies .. .. .. . . Unopposed Maryborough .. .. 3,925 3,987 7,912 ( J ames Edward Holland .. . . 1,748 I.
\.Alfred Richard Out trim . . .. 2,930 I 2,594 2,167 4,761 83 202 66·09 54•35 60.17 Melbourne •. .. .. 6,135 3,969 10,104 f Henry Ern est Hall .. .. . . 1,574 I
l Alexander Rogers .. .. . . 2,799 J 2,672 1,860 4,532 159 29 43'55 46•86 44•85
Mornington .. .. 7,457 6,240 13,697 I f Alfred Downward •. .. . . 3,735 } 3,723 2,418 6,141 213 53 49'92 38•75 44•83
i North Melbourne "1 Francis J oseph Murphy .. .. 2,193 .. .. 8,350 9,119 17,46911Henry Nolan . . . . .. . . 2,320 } 4,033 3,834 7,867 253 46 48•30 42•04 45•03
...... \ George Michael Prendergast . . .. 5,294 .._,Ovens . . .. .. 3,401 3,351 6, 752 JChristopher James Bennett .. . . 2.083 } 2,387 2,082 4,469 93 145 70•18 62•13 66•18
· l Alfred Arthur Billson .. 2,293 ~~ .. .. -...(

'N 0:>
~ Electoral Dlstric\s.
Polwarth ••
Port }'airy ••
Port Melbourne Prahran
Richmond
Rodney
St Kilda
Stawell and Ararat
Swan Hill
Toorak
Upper Goulburn
Walhalla
Wangaratta
Waranga
Wattet.neip
Warrnambool
Williamstown
Totals Less 16 Uncontested Districts
Totals
Electors Enrolled.
Males. FemaJ.es. Total.
6,647 4,462 11,109
4,118 3,757 7,875
9,517 7,476 16,993 8,273 12,002 20,275
8,366 9,076 17,442
5,689 4,967 10,656
10,773 14,522 25,295
4, 719 4,412 9,131
8,152 5,248 13,400
8,834 13,325 22,159
4,480 3,753 8,233
3,821 2,823 6,644
4,397 4,121 8,518
3,769 3,289 7,058
3,340 2,863 6,203
4,651 4,664 9,315
10,501 9,835 20,3:~6
398,234 411,792 810,026 108,950 107,742 216,692
---289,284 304,050 593,334
GENERAL ELECTION FOR THE LEGISLATIVE ASSEMBLY, 1914--continued.
Candidates' Names.
{John J oseph Consedine John Glass J ohnstone
{ Henry Stephcn Bailey J ames Ji'rancis Duffus George Sangster
]Henry .Jamcs Duke l Donald Mackinnon f Thomas Cornelius Brennan \Edmund John Cotter (Richard H. S. Ab bott* H ugh McKenzie ..
\ Andrew W. H. White ..
{Robert George McCutcheon Robert Leslie Smart ..
fWilliam Tibbles \ Richard Frederick Toutcher fJohn l H ugh 1nev1tm<.tuu
{Norman Bayles Philip Behrend
JMalcolm Kenneth McKenzie \ l\1ichael O'Brien .. (Samuel Barnes \ Edward Nichols {John Bowser .. l William H. l\L Phillips f•J ohn Cordon l Daniel William jWilliam Benjamin \ Edmund ,John Hogan
{,John Murray .. Alfred John Pearce John Lemmon
First Preference Votes recorded for
eaeh Candidate.
2,576 4,389 } 2,874 } 2,602
Unopposed 4,462 } 4,913 1,967 I 6,335 f
385 l 3,575 :3,149 J 5,975 } 3,287 2,520 l 3,124 f 3,459 } 2,449 7,047 I 2,129 I 2,746 \ 1,833 j 1,811 I 1,021 j 3,269 \ 1,347 J 3,442 1 1,229 j 2,062 \ 2,327 r 3,715 \ 2,195 f
Unopposed
312,696
No. of Electors who Voted.
Males. Females. Total.
3,932 3,222 7,154
3,132 2,476 5,608
4,369 5,229 9,598
4,463 4,063 8,526
3,982 3,298 7,280
4,170 5,243 9,413
3,123 2,631 5,754
3,828 2,270 6,098
3,827 5,533 9,360 I
2,711 I 2,023 4,734
1,799 1,091 2,890
2,519 2,175 4,694
2,612 2,157 4,769
2,450 2,049 4,504
3,204 2,879 6,083
.. .. ..
.. . . ..
166,502 153,448 319,950
No. of No. of Electors
Informal. who Ballot- Voted papers. by Post.
-- ---189 218
132 155
223 118
224 71
171 356
151 97
110 215
1!)0 95
184 125
155 139
58 30
78 126
98 140
115 173
173 191
7,254 7,266
Percentage of Electors who Voted.
Males. Females. Total.
---59•15 72•21 64•39
76•05 65•90 71•21
52•81 43•56 47•33
53•34 44•76 48•88
69•99 66•39 68•31
38•70 36•10 37•21
66•17 59'63 63•01
46·95 I 43'25 45•51
43•32 41'52 42•24
60'51 53•90 57'50
47•09 38•64 43•50
57•29 52'77 55'10
69•30 65•58 67•56
73•50 71'56 72•61
68•88 61•72 65•30
---.. .. . . .. .. ..
---57'55 50'46 53'92
• Deposit forfeited, having polled less than one-fifth of the first preference votes received by the elected candidate. t The candidate who received the greatest number of first preference votes did not secure 1\n absolute majority as required by thl' P1·ejere11tial Voting .At:t 1911. For particulars of preferential count. see subsequent tables.
""" 00
(J)
1-3 > ~ I-;
\J.2 ~ 1-1 0 > r ~ trj
0 H (.f:.:
1-3 t=:l ~
0 ~
~ 1-1 0 1-3 c ~ -_?> ........ (.0 -~
I ~ 0 '"C q r > ~ H
0 z
•

STATISTICAL REGISTER OF VICTORIA, 1914.-POPULATION. 49
PREFERENTIAL COUNT.
(GENERAL ELECTION, 26TH NOVEMBER, 1914:.)
DETAILS of the Preferential Count in each District where an Absolute Majority was not obtained on the First Count by any Candidate.
Elertoml District of Be11digo West.
First Count--First preference votes
Distribution of ballot-papers of Cook, defeated candidnte
Final Count
FJlectoral District of Dundas.
2,879
41S
3,297
Candidates.
Cook.
1,543
Total.
Smith.
2,190 6,612
1,125 1,543
3,315 6,612
--·~-----~--------------------,.---~
First Count--First preference votes
Distribution of ballot-papers of Loughnane, defe,tted candi<hte
Final Count
Holden.
2,740
312
3,052
Elect.Jral District of East Melbourne.
First Count--First preference votes
Distribution of ballot-papers of Cole, first defeated candidate
Second Count
Distribution of ballot-papers of Clarey, second defeated candidn.te
Fin~tl Count
Clarey.
I.S53
204
2,057
Electoral Di8trict of Evelyn.
Candidates.
- d i ~ ~ t ~
~ ;.. " fil ~
------~
First Count-First preference votes .. .. 1,285 804 935
Distribution of ballot-papers of Skardon. first defeated candidate .. .. . . 32 73 41
Second Count .. . . 1,:n1 877 976
Distribution of ballot-papers of Sell, second defeated candidate 31 113 ;)4
Third Count .. .. .. 1.3-1.8 H90 1.030
Distribution of ballot-papers of Ewrard, third defeated candidate lOO .. 284
Candidat{'s.
I.oughnane.
91S
Candidates.
C<lle. Farthing.
918 1,910
283
2,1fl3
1,536
3,729
...; ~ :=
~ 0 ~ m
1.546 370
ss 97
1,634 467
269 . . 1,903 ..
1)06 .. ---·-
Fourth Count .. .. . . 1.448 . . 1,314 2,!>09 .. Distribution of ballot-papers of Maxwcll, fourth
defeated candidate .. 387 . . .. 927 . . -----
Final Count .. . . .. 1,8:~5 . . . . 3,436 . .
Smith.
2,494
606
3,100
Wee don.
1,990
431
2,421
521
2,942
d 0
'E o:l
,.Id m
331
..
..
..
. .
. .
. .
..
..
Total.
6,152
918
6,152
Total.
6,671
918
6,671
2,057
6,671
Total.
5,271
331
5,271
467
5,271
990
5,271
1,314
5,271
(263]
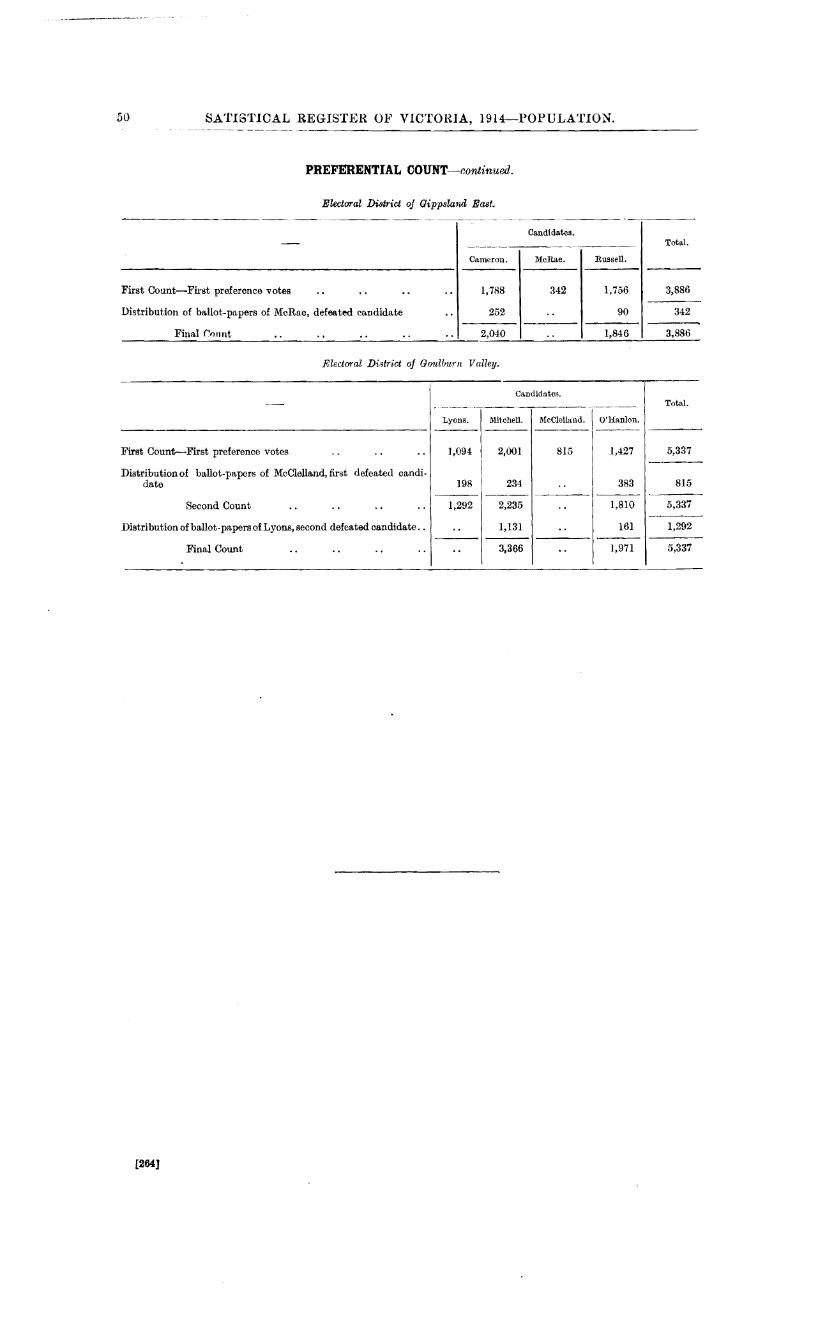
50 SATI8TICAL REGISTEH OF VICTOHIA, 1914-POPULATION.
PREFERENTIAL COUNT-continued.
Electaral District of Gippsland East.
Candidates. - Total.
Caroeron. McRae. Russell.
First Count-First preference votes .. .. .. . . 1,788 342 1,756 3,886
Distribution of ballot-papers of McRae, defeated candidate .. 252 .. 90 342 -----
Final f:onnt .. .. . . .. .. 2,040 .. 1,846 3,886
Fllectaral District of Goulburn Valley.
Candidates. - Total.
Lyons. Mite hell. McClelland. O'Hanlon.
First Count--First preference votes .. .. . . 1,094 2,001 815 1,427 5,337
Distributionof ballot-papers of McClelland,first defeated candi-date 198 234 .. 383 815
Second Count .. .. .. .. 1,292 2,235 .. 1,810 5,337
Distribution of ballot-papers of Lyons, second defeated candidate .. .. 1,131 .. 161 1,292
Final Count .. .. .. . . .. 3,366 . . 1,971 5,337
[264]

Year.
STATISTICAL REGISTER OF YICTORIA, 1914.-POPULATION.
PROPORTION OF VOTERS AT GENERAL ELECTIONS FOR THE LEGISLATIVE ASSEMBLY-1866 TO 1914.
----------------------------------------------
Year of General Election.
1866 r868 1871 1874 Iis 77 188o (.February) r88o (.July) r883 J886 r88g
l'roportlon of Electors of ContesttJ Uistricts
who Voted.
Per cent. 55'10 61 '59 6s·o2 61'00 62'2.9 66·56 6 s ·8 5 64'96 64']0 66·58
Y c .. r vf Ueneml Eiection.
1892. 1894 1897 1goo 1902 1904 19::.7 1908 1911 1914
Prop0rtion of r;lectors (If :Jontested Districts
who Voted.
Per cent. 6.). 12.
7°'99 /0'33 63'47 65'47 66'72 6r ·26 53'64 6r6r 53 '92.
NUMBER OF ELECTORS.-RETURN FOR TEN YEA.RS.
Number of Electors on the Rolls.
Legislative Council. Legislative Assembly.
Ordinary, Ratepayers. Total. Ordinary, Ratepayers. or Yon-Ra.tepayers. or Yon-Ratepayers.
Total. ,... ____ -------- --------
1905-6 357 17],693 178,oso 28,280 :2.19,527 247,807 1906-7 492 x8o,3o7 1 So,799 41,329 222,559 263,888 1907-8 489 184,745 185,234 37.58' 2.26,293 26J,876 1908-9 270 188,7 56 189,026 27,826 230,473 2 ss, 299 1909-10 576 239.944 240,520* 195.737 291,924 487,66r* 191Q-II 639 248,842 249,481 t t 6g+.~61t 191 1-12. 172 258,570 258,742 t t 667,983t 1912.-13 J21 269,888 270,209 t t 67o,nst 1913-14 421 28J,668 284,089 r t 784,11 rt 1914-15 225 292 1260 292,48 5 t t 776,66ot
51
*The great incn:ase in the number of electors on the rnll~ in 1909-Io iR accounted for by the operation of the Adult S~1jfrage .Act 1908, No. 2.185, which extended the franchise to women.
t Under the proYisions of the Electoral Act, 1910, of ratepayers nl!d non-ratepay< rs for the Legislative Assembly were aboli~heO. Specia.lgeneral rolls were prepared in 191 I and rgq from o! an electoml canvass.
A. ~1. LAUGHTON, Government Statist.
By Authority: ALBERT J. MULLETT, Government Prin.ter, Melbourne.
(265]