the state of the states - rockefeller institute of government
TRANSCRIPT

The State of The States
13th Annual NMTRI
Tax Policy Conference
Albuquerque, NM
Lucy Dadayan
Senior Policy Analyst
April 28, 2016

Overview
State fiscal challenges
Slow economic recovery
Slower tax revenue recovery Oil & coal states hit hard Growing reliance on sin taxes
Growing revenue volatility & fiscal challenges
Fiscal reality & outlook
2

State fiscal challenges
Great Recession far worse than past recessions Variables that drive revenue hit harder than broader economy, harder than before
Revenue recovery is very slow State inflation-adjusted tax revenue is still below pre-recession in half of the states
Longer-term spending pressures loom Employment and wage recovery is very slow Major cuts in government employment Growing pension liabilities Growing Medicaid costs due to higher recession-related enrollment
3
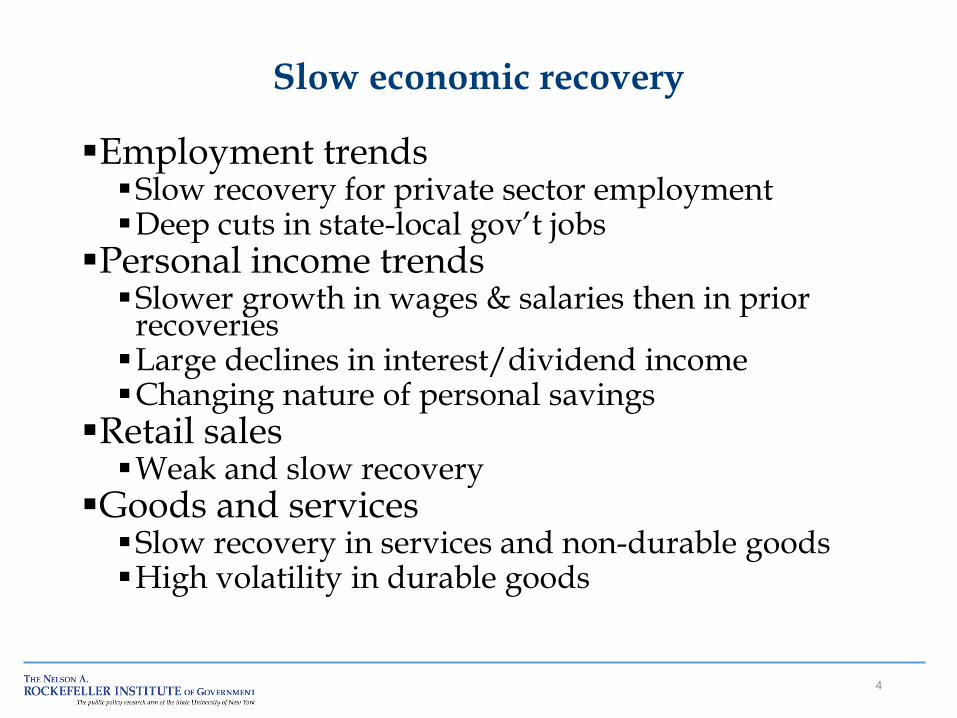
Slow economic recovery
Employment trends Slow recovery for private sector employment Deep cuts in state-local gov’t jobs
Personal income trends Slower growth in wages & salaries then in prior
recoveries Large declines in interest/dividend income Changing nature of personal savings
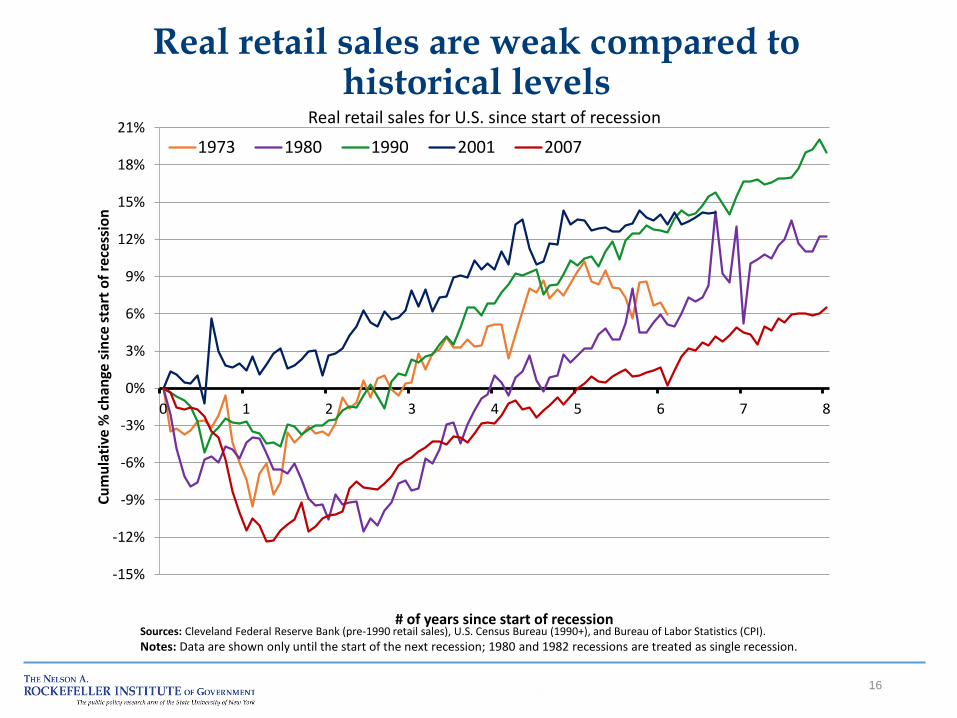
Retail sales Weak and slow recovery
Goods and services Slow recovery in services and non-durable goods High volatility in durable goods
4

5
The impact of the Great Recession on employment: dire picture for government emp.
Mar-16 Dec-07 Peak empMarch 2016
vs Dec 2007
March 2016
vs Peak
Total nonfarm 143,774 138,413 138,432 Jan-08 3.9 3.9
Total private 121,692 116,037 116,044 Jan-08 4.9 4.9
State and local government 19,312 19,620 19,824 Aug-08 (1.6) (2.6)
State government 5,100 5,139 5,214 Aug-08 (0.8) (2.2)
State gov education 2,432 2,327 2,383 Aug-08 4.5 2.0
State gov, non-education 2,668 2,812 2,830 Aug-08 (5.1) (5.7)
Local government 14,212 14,481 14,610 Jul-08 (1.9) (2.7)
Local gov education 7,820 8,055 8,119 Jul-08 (2.9) (3.7)
Local gov, non-education 6,392 6,426 6,507 Dec-08 (0.5) (1.8)
Percent change
Source: U.S. Bureau of Labor Statistics, Current Employment Statistics (seasonally adjusted).
Employment Sector
Employment (thousands)Recession
peak date

6
Private sector employment recovery much slower compared to past recoveries
-9%
-6%
-3%
0%
3%
6%
9%
12%
15%
18%
21%
0 1 2 3 4 5 6 7 8
Cu
mu
lati
ve p
erce
nt
chan
ge s
ince
sta
rt o
f re
cess
ion
# of years since start of recession
Private sector employment since start of recession
1973-Nov 1980-Jan 1990-July 2001-March 2007-Dec
Source: U.S. Bureau of Labor Statistics (CES, seasonally adjusted). Notes: Data are shown only until the start of the next recession; 1980 & 1981 recessions treated as single recession.

7
Deep cuts in state-local gov’t jobs; deeper than any other recession in the last 50 years
-4%
-2%
0%
2%
4%
6%
8%
10%
12%
14%
16%
18%
20%
0 1 2 3 4 5 6 7 8
Cu
mu
lati
ve p
erce
nt
chan
ge s
ince
sta
rt o
f re
cess
ion
# of years since start of recession
State and local government employment since start of recession
1973-Nov 1980-Jan 1990-July 2001-March 2007-Dec
Source: U.S. Bureau of Labor Statistics (CES, seasonally adjusted). Notes: Data are shown only until the start of the next recession; 1980 & 1981 recessions treated as single recession.

8
State-local gov’t employment still declining, in contrast to the rebound in private employment
-8%
-6%
-4%
-2%
0%
2%
4%
6%
Cu
mu
lati
ve p
erce
nt
ch
ange
sin
ce s
tart
of
rece
ssio
n
Employment in selected industries since start of 2007 recession
Private State gov. Local gov. State-local gov.
Source: U.S. Bureau of Labor Statistics (CES, seasonally adjusted).

9
State government employment: Education (mostly higher ed.) up, all else down
-6%
-4%
-2%
0%
2%
4%
6%
Cu
mu
lati
ve p
erce
nt
chan
ge s
ince
sta
rt o
f re
cess
ion
State government employment since start of 2007 recession
State government State gov. education State gov. non-education
Source: U.S. Bureau of Labor Statistics (CES, seasonally adjusted).

10
Local government employment: Education way down, some improvement in non-education
-4%
-3%
-2%
-1%
0%
1%
2%
Cu
mu
lati
ve p
erce
nt
chan
ge s
ince
sta
rt o
f re
cess
ion
Local government employment since start of 2007 recession
Local government Local gov. education Local gov. non-education
Source: U.S. Bureau of Labor Statistics (CES, seasonally adjusted).

11
S&L gov’t employment down 1/2 million jobs since August 2008; down in 29 states
12
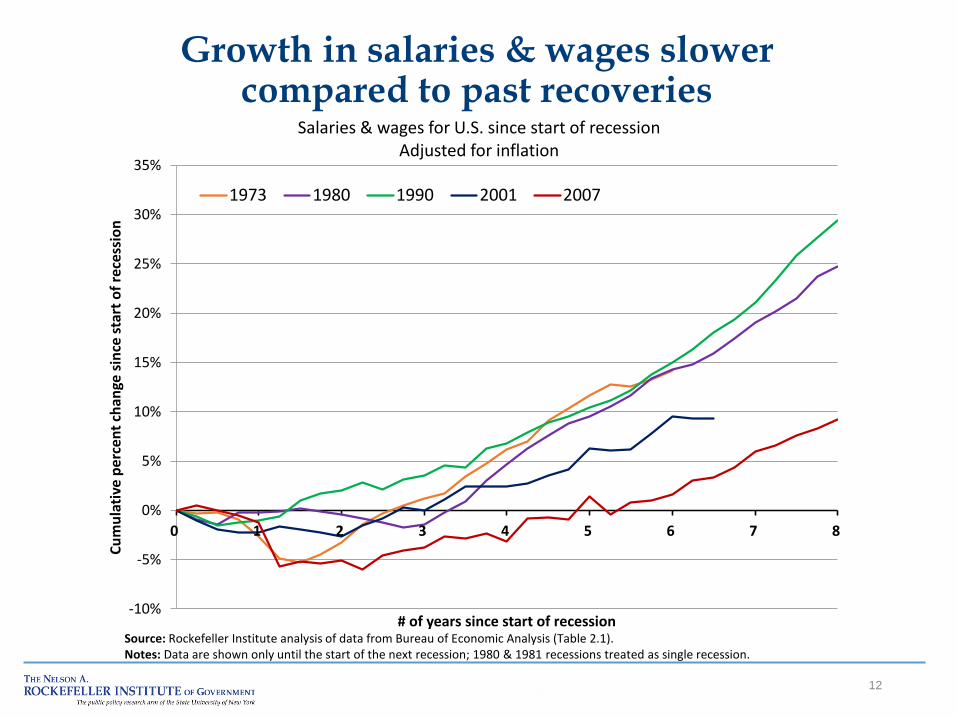
Growth in salaries & wages slower compared to past recoveries
-10%
-5%
0%
5%
10%
15%
20%
25%
30%
35%
0 1 2 3 4 5 6 7 8
Cu
mu
lati
ve p
erce
nt
chan
ge s
ince
sta
rt o
f re
cess
ion
# of years since start of recession
Salaries & wages for U.S. since start of recession Adjusted for inflation
1973 1980 1990 2001 2007
Source: Rockefeller Institute analysis of data from Bureau of Economic Analysis (Table 2.1). Notes: Data are shown only until the start of the next recession; 1980 & 1981 recessions treated as single recession.
13
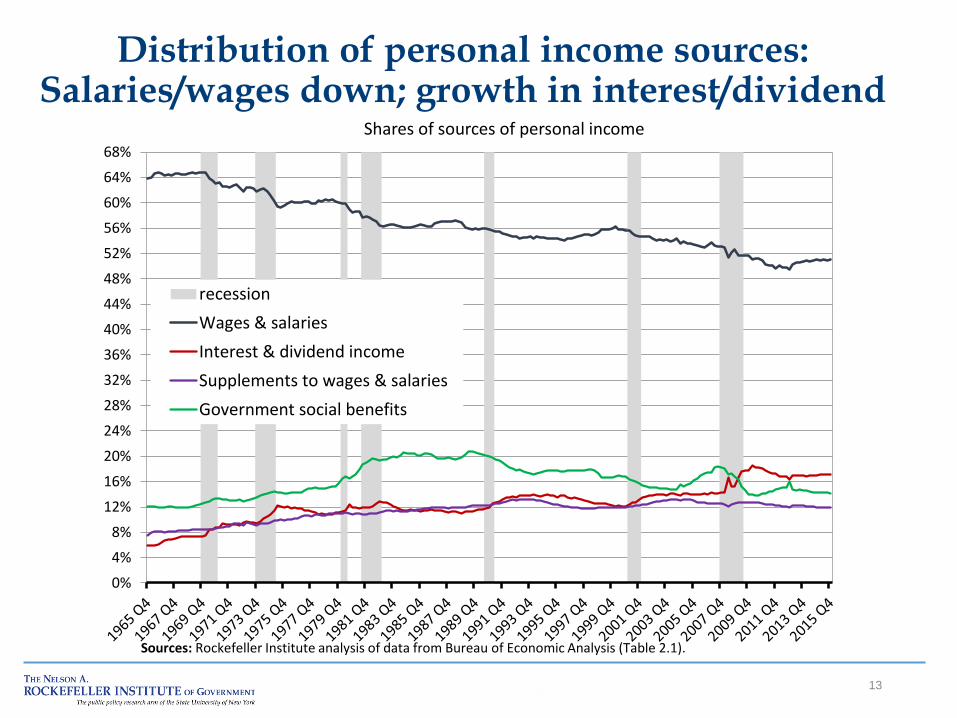
Distribution of personal income sources: Salaries/wages down; growth in interest/dividend
0%
4%
8%
12%
16%
20%
24%
28%
32%
36%
40%
44%
48%
52%
56%
60%
64%
68%
Shares of sources of personal income
recession
Wages & salaries
Interest & dividend income
Supplements to wages & salaries
Government social benefits
Sources: Rockefeller Institute analysis of data from Bureau of Economic Analysis (Table 2.1).

14
Large growth in government social benefits; Large declines in interest/dividend income
-30%
-20%
-10%
0%
10%
20%
30%
40%
Cu
mu
lati
ve %
ch
ange
sin
ce s
tart
of
rece
ssio
n
Sources of personal income for U.S. since start of 2007 recession Adjusted for inflation
Wages & salaries Supplements to wages & salariesInterest & dividend income Government social benefits
Sources: Rockefeller Institute analysis of data from Bureau of Economic Analysis (Table 2.1).
15
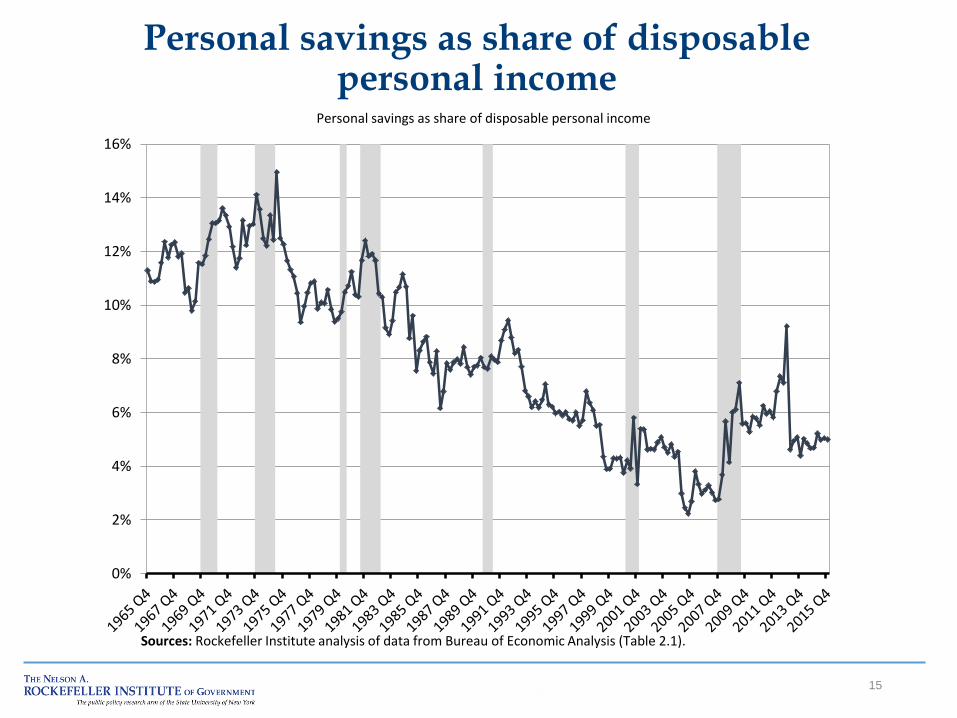
Personal savings as share of disposable personal income
0%
2%
4%
6%
8%
10%
12%
14%
16%
Personal savings as share of disposable personal income
Sources: Rockefeller Institute analysis of data from Bureau of Economic Analysis (Table 2.1).
16
Real retail sales are weak compared to historical levels
-15%
-12%
-9%
-6%
-3%
0%
3%
6%
9%
12%
15%
18%
21%
0 1 2 3 4 5 6 7 8
Cu
mu
lati
ve %
ch
ange
sin
ce s
tart
of
rece
ssio
n
# of years since start of recession
Real retail sales for U.S. since start of recession
1973 1980 1990 2001 2007
Sources: Cleveland Federal Reserve Bank (pre-1990 retail sales), U.S. Census Bureau (1990+), and Bureau of Labor Statistics (CPI).
Notes: Data are shown only until the start of the next recession; 1980 and 1982 recessions are treated as single recession.

17
Consumption of durable & non-durable goods was hit hard
-18%
-15%
-12%
-9%
-6%
-3%
0%
3%
6%
9%
12%
15%
18%Year-over-year percent change in real consumption
Durable GoodsNondurable GoodsServices
Source: U.S. Bureau of Economic Analysis, National Income and Product Accounts, Table 2.3.6.
18
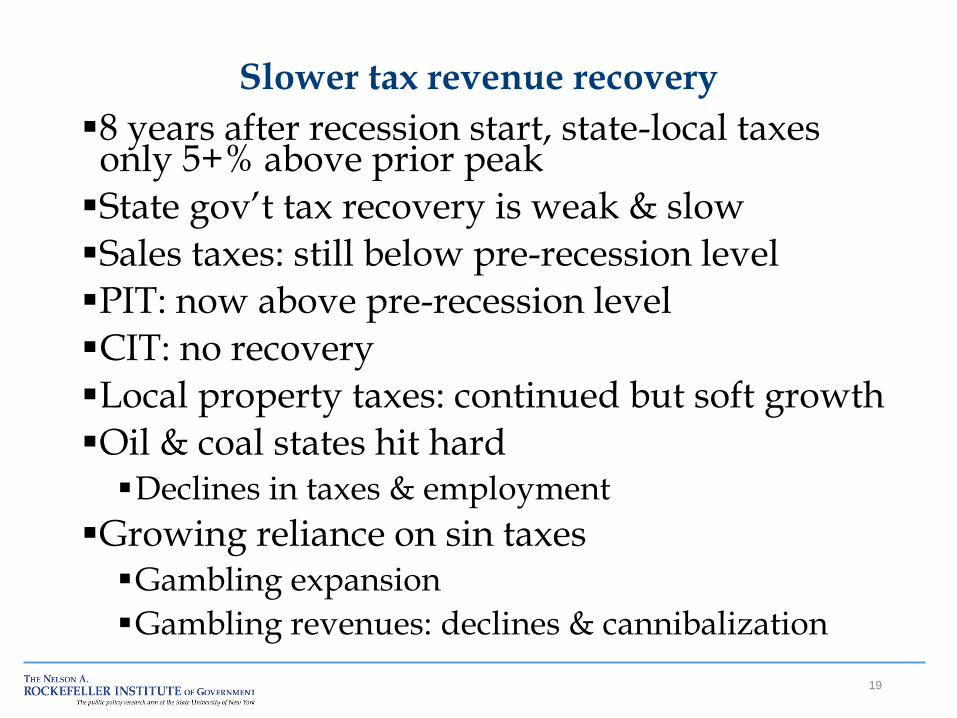
Slower tax revenue recovery
8 years after recession start, state-local taxes only 5+% above prior peak
State gov’t tax recovery is weak & slow
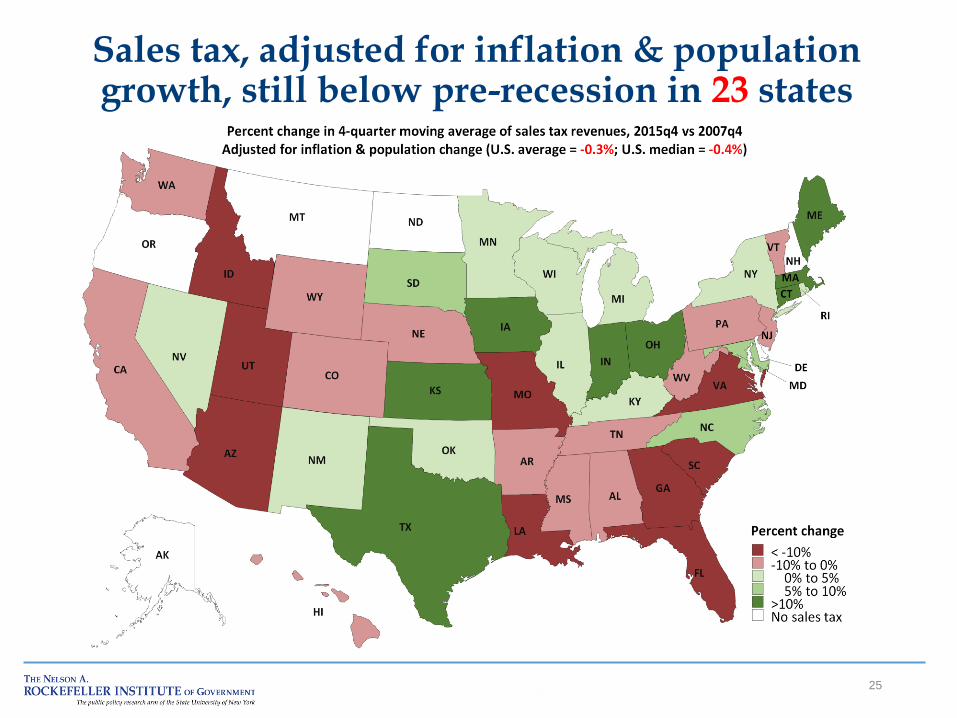
Sales taxes: still below pre-recession level
PIT: now above pre-recession level
CIT: no recovery
Local property taxes: continued but soft growth
Oil & coal states hit hard Declines in taxes & employment
Growing reliance on sin taxes Gambling expansion
Gambling revenues: declines & cannibalization
19

State & local government tax revenues: Only 8+% above prior peak
20
-10%
-5%
0%
5%
10%
15%
20%
25%
30%
35%
40%
0 1 2 3 4 5 6 7 8
Cu
mu
lati
ve p
erce
nt
chan
ge s
ince
sta
rt o
f re
cess
ion
# of years since start of recession
State and local government major tax revenue since start of recession Four-quarter moving average, adjusted for inflation
1973 1980 1990 2001 2007
Source: Rockefeller Institute analysis of data from U.S. Census Bureau. Notes: Data are shown only until the start of the next recession; 1980 & 1981 recessions treated as single recession.

21
Income & sales taxes are recovering; “other” taxes stagnant; corporate 15% below prior peak
-28%
-24%
-20%
-16%
-12%
-8%
-4%
0%
4%
8%
12%
16%
Cu
mu
lati
ve %
ch
ange
sin
ce s
tart
of
rece
ssio
n
State government tax revenue for U.S. since start of 2007 recession Four-quarter moving average, adjusted for inflation
Total Tax Sales tax PIT CIT Other
Sources: U.S. Census Bureau , Quarterly Summary of State & Local Government Tax Revenue and Bureau of Economic Analysis (GDP). Notes: (1) 4-quarter average of inflation-adjusted tax revenue; (2) No adjustments for legislative changes.

22
State government tax revenues: Recovery is weak and slow
-11.8%
7.9%
-15%
-10%
-5%
0%
5%
10%
15%
20%
25%
30%
35%
0 1 2 3 4 5 6 7 8
Cu
mu
lati
ve %
ch
ange
sin
ce s
tart
of
rece
ssio
n
Years since start of recession
State government tax revenue since start of recession Four-quarter moving average, adjusted for inflation
1990 2001 2007
Sources: U.S. Census Bureau (taxes) and Bureau of Economic Analysis (GDP).
Notes: 4-quarter average of inflation-adjusted tax revenue. Data are shown only until the start of the next recession.

23
State taxes, adjusted for inflation & population growth, still below pre-recession in 25 states

24
State government sales taxes: Still below pre-recession level
-10.6%
6.4%
-15%
-10%
-5%
0%
5%
10%
15%
20%
25%
30%
35%
0 1 2 3 4 5 6 7 8
Cu
mu
lati
ve %
ch
ange
sin
ce s
tart
of
rece
ssio
n
Years since start of recession
State government sales tax revenue since start of recession Four-quarter moving average, adjusted for inflation
1990 2001 2007
Sources: U.S. Census Bureau (taxes) and Bureau of Economic Analysis (GDP).
Notes: 4-quarter average of inflation-adjusted tax revenue. Data are shown only until the start of the next recession.
25
Sales tax, adjusted for inflation & population growth, still below pre-recession in 23 states

26
State government personal income taxes: Now above pre-recession level
-16.4%
13.2%
-20%
-15%
-10%
-5%
0%
5%
10%
15%
20%
25%
30%
35%
40%
45%
0 1 2 3 4 5 6 7 8
Cu
mu
lati
ve %
ch
ange
sin
ce s
tart
of
rece
ssio
n
Years since start of recession
State government personal income tax revenue since start of recession Four-quarter moving average, adjusted for inflation
1990 2001 2007
Sources: U.S. Census Bureau (taxes) and Bureau of Economic Analysis (GDP).
Notes: 4-quarter average of inflation-adjusted tax revenue. Data are shown only until the start of the next recession.
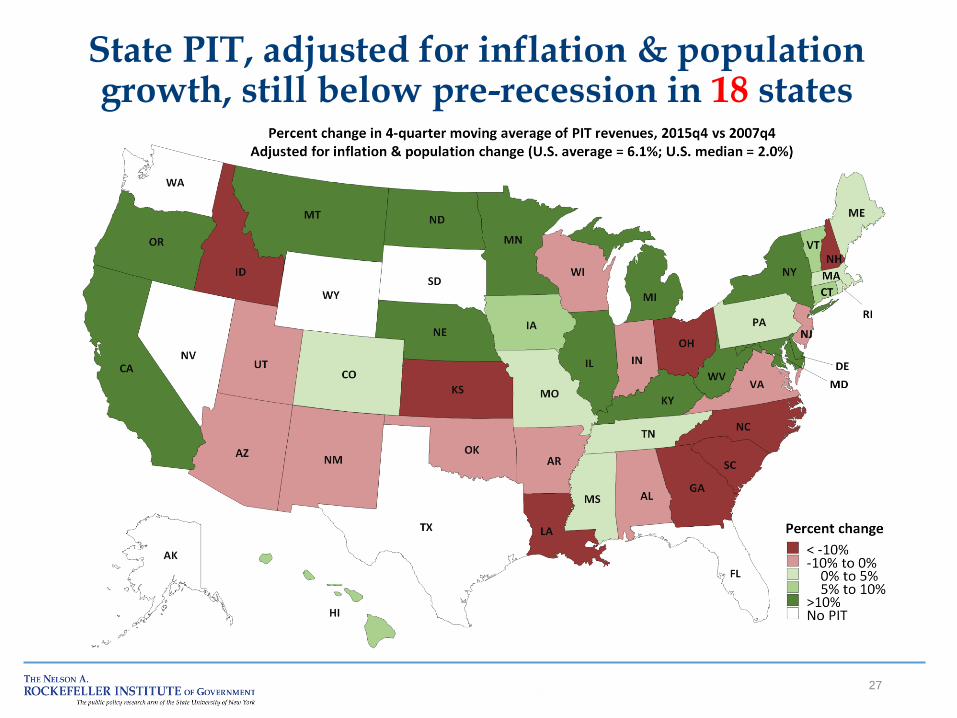
27
State PIT, adjusted for inflation & population growth, still below pre-recession in 18 states
28
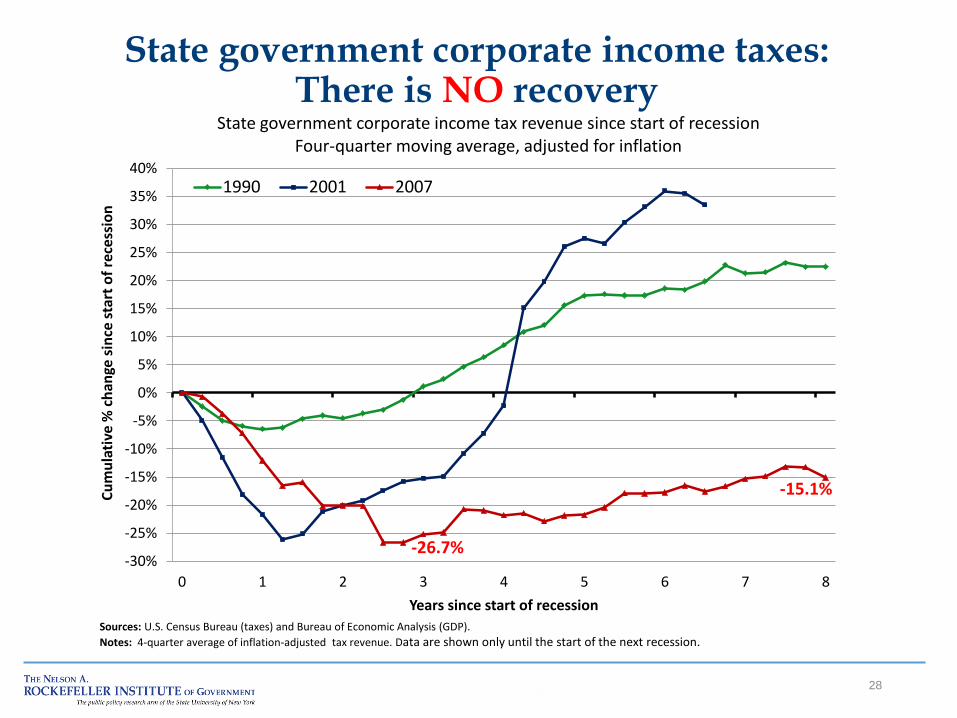
State government corporate income taxes: There is NO recovery
-26.7%
-15.1%
-30%
-25%
-20%
-15%
-10%
-5%
0%
5%
10%
15%
20%
25%
30%
35%
40%
0 1 2 3 4 5 6 7 8
Cu
mu
lati
ve %
ch
ange
sin
ce s
tart
of
rece
ssio
n
Years since start of recession
State government corporate income tax revenue since start of recession Four-quarter moving average, adjusted for inflation
1990 2001 2007
Sources: U.S. Census Bureau (taxes) and Bureau of Economic Analysis (GDP).
Notes: 4-quarter average of inflation-adjusted tax revenue. Data are shown only until the start of the next recession.

29
State CIT, adjusted for inflation & population growth, still below pre-recession in 33 states

30
Local government property taxes: Continued but soft growth
6.5%
-5%
0%
5%
10%
15%
20%
25%
30%
35%
40%
0 1 2 3 4 5 6 7 8
Cu
mu
lati
ve %
ch
ange
sin
ce s
tart
of
rece
ssio
n
Years since start of recession
Local government property tax revenue since start of the recession Four-quarter moving average, adjusted for inflation
1990 2001 2007
Sources: U.S. Census Bureau (taxes) and Bureau of Economic Analysis (GDP).
Notes: 4-quarter average of inflation-adjusted tax revenue. Data are shown only until the start of the next recession.

31
Continued growth in local government property taxes & housing prices
-10%
-5%
0%
5%
10%
15%
Year-over-year percent change in housing prices vs. local property taxes Four-quarter moving average
Recession
Housing Price Index
Local Property Taxes
Sources: U.S. Census Bureau, Quarterly Summary of State & Local Government Tax Revenue (local property taxes) and Federal Housing Finance Agency, House Price Indexes data (all transactions).
Oil & Trouble
32

33
Oil & coal states: Economy, employment, taxes
StateOil & gas
extraction
All other
mining
activities
Total
mining
Severance
taxes
Other
taxesTotal taxes
Alaska 22.1% 6.4% 28.4% -0.6% 72.4% -86.6% -31.0% -63.6%
North Dakota 6.4% 8.3% 14.6% -5.6% 53.8% -44.7% -1.4% -25.2%
Louisiana 7.5% 2.6% 10.1% -1.0% 8.9% -36.2% -4.5% -7.1%
Wyoming 14.9% 18.2% 33.1% -3.6% 39.0% -19.5% 4.6% -4.8%
Oklahoma 11.4% 2.9% 14.3% -0.7% 7.5% -48.1% -0.6% -4.3%
New Mexico 6.1% 3.5% 9.6% 0.4% 18.5% -37.5% 5.4% -2.7%
Texas 11.6% 2.1% 13.8% 1.6% 10.9% -44.2% 2.7% -2.4%
West Virginia 2.0% 11.4% 13.4% -1.4% 12.7% -24.6% 1.9% -1.6%
Oil & coal states 10.9% 3.1% 14.0% 0.6% 16.4% -35.5% 2.9% -3.2%
Other states 0.4% 0.5% 0.9% 2.4% 0.2% -20.7% 6.6% 6.6%
United States 1.8% 0.9% 2.7% 2.1% 2.1% -43.5% 5.4% 4.5%
Mining industries as share of
state GDP, 2013
Employment
change,
March 2016
vs. January
2015
Severance
taxes as %
of total
taxes
(FY 2014)
Percent change, 4-quarters ending
December 2015 vs. year earlier

34
Oil & coal states: 3 consecutive quarterly declines in state taxes
2.1%
-2.0%
3.8%
5.6% 5.5%
7.4%
5.0%
3.6% 3.6% 3.1%
8.8%
4.2% 3.4%
-2.9%
-5.9%
-12.9%
-15%
-10%
-5%
0%
5%
10%
2014Q1 2014Q2 2014Q3 2014Q4 2015Q1 2015Q2 2015Q3 2015Q4
Year-over-year percent change in state government taxes
Non-oil states
Oil states
Source: Rockefeller Institute analysis of Census Bureau data.

35
Oil & coal states: Declines in employment
-1.2%
-0.8%
-0.4%
0.0%
0.4%
0.8%
1.2%
1.6%
2.0%
2.4%
Cumulative percent change in employment
Non-oil states Oil states
Source: Rockefeller Institute analysis of Bureau of Labor Statistics data.

Gambling Fever
36

37
Gambling availability & expansion
Gambling Type # of states
Period when gambling was adopted
Pre-1990 1990-2000
2001-2007
2008-2015
Lottery 44 32 5 5 2
Casinos 18 (+2) 4 7 2 5 (+ NY&MA)
Racinos 13 0 6 5 2
Pari-Mutuel 43
Indian Casinos 28

38
Shares of Gambling Revenues, FY 2015 Lottery Still The Big Player in Gambling
Lottery 66%
Casino 19%
Racino 12% Video gaming
2%
Pari-mutuel 0%
39
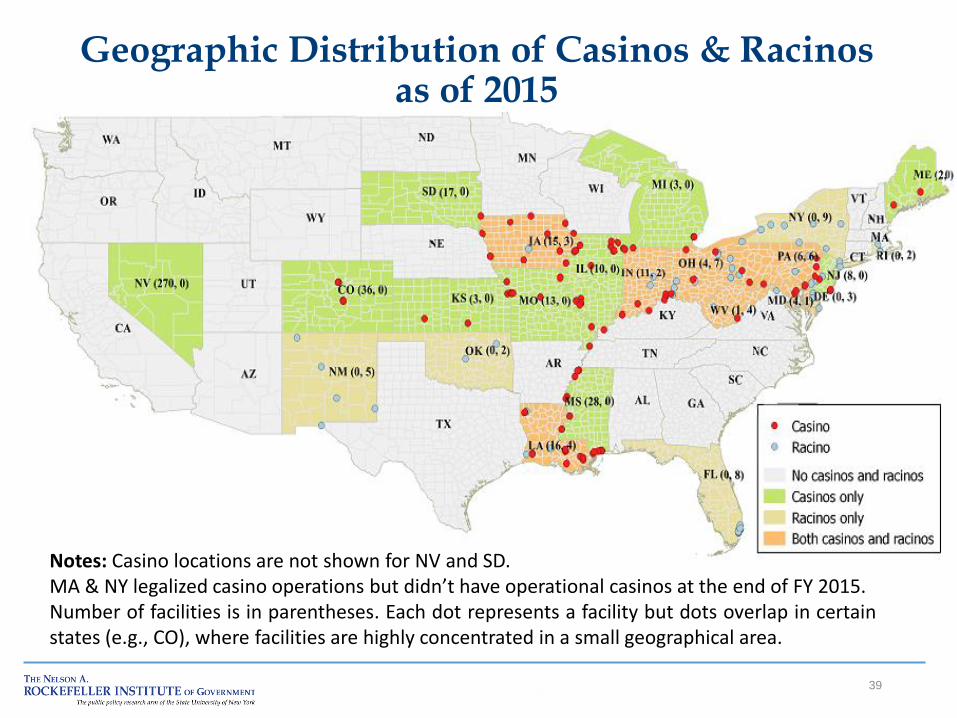
Geographic Distribution of Casinos & Racinos as of 2015
Notes: Casino locations are not shown for NV and SD. MA & NY legalized casino operations but didn’t have operational casinos at the end of FY 2015. Number of facilities is in parentheses. Each dot represents a facility but dots overlap in certain states (e.g., CO), where facilities are highly concentrated in a small geographical area.

40
Casino & racino tax & fee revenues: Clearly cannibalization
% change CAGR % change $ change
FY 2008 FY 2014 FY 2015FY 2014-
15
FY 2008-
15FY 2008-15 FY 2008-15
United States $8,248.5 $8,592.0 $8,686.4 1.1% 0.7% 5.3% $437.9
"Older" casino/
racino states$7,255.3 $6,144.7 $6,073.0 -1.2% -2.5% -16.3% ($1,182.3)
Colorado 120.3 106.2 110.1 3.6 (1.3) (8.5) (10.2)
Delaware 236.9 166.0 151.0 (9.1) (6.2) (36.3) (85.9)
Il l inois 776.4 523.2 498.3 (4.8) (6.1) (35.8) (278.1)
Indiana 910.7 662.3 617.9 (6.7) (5.4) (32.1) (292.8)
Iowa 339.4 303.3 305.0 0.6 (1.5) (10.1) (34.4)
Louisiana 596.5 506.0 534.9 5.7 (1.5) (10.3) (61.5)
Maine 22.7 51.5 51.7 0.5 12.5 127.9 29.0
Michigan 332.2 267.3 273.5 2.3 (2.7) (17.7) (58.6)
Mississippi 383.2 251.0 250.2 (0.3) (5.9) (34.7) (133.0)
Missouri 476.6 444.4 440.9 (0.8) (1.1) (7.5) (35.7)
Nevada 1,089.8 924.0 909.9 (1.5) (2.5) (16.5) (179.9)
New Jersey 523.5 260.9 241.2 (7.6) (10.5) (53.9) (282.3)
New Mexico 74.6 67.8 70.6 4.1 (0.8) (5.4) (4.0)
New York 545.7 949.6 943.7 (0.6) 8.1 72.9 398.0
Oklahoma 12.0 20.9 20.6 (1.2) 8.1 72.3 8.7
Rhode Island 327.0 324.4 327.2 0.9 0.0 0.1 0.2
South Dakota 17.7 16.4 16.1 (2.0) (1.4) (9.3) (1.6)
West Virginia 470.2 299.6 310.2 3.5 (5.8) (34.0) (160.0)
"New" casino/
racino states $993.2 $2,447.2 $2,613.4 6.8% 14.8% 163.1% $1,620.2
Florida 134.1 176.2 182.6 3.6 4.5 36.2 48.5
Kansas 96.8 98.6 1.8 98.6
Maryland 383.7 445.5 16.1 445.5
Ohio 426.8 527.5 23.6 527.5
Pennsylvania 859.1 1,363.7 1,359.2 (0.3) 6.8 58.2 500.1
State
$ millions, adjusted to inflation

41
Lottery revenues: Not much growth between 2008 & 2015; declines in 21 states

42
Gambling revenues: Weak growth between 2008 & 2015; declines in 23 states

Lessons from gambling revenues: Short-term relief, long-term disappointment
Gambling is NOT recession-proof Gambling expansion brings in more revenue, until a saturation point is reached
Some new revenue represents a shift, rather than net growth
Future growth in gambling revenue will not keep pace with tax revenue, or spending • If gambling revenue is intended to support part of the overall budget, gaps may emerge in future years
Gambling is a slow-growing revenue source & not a solution in the never-ending quest to balance the budget
43
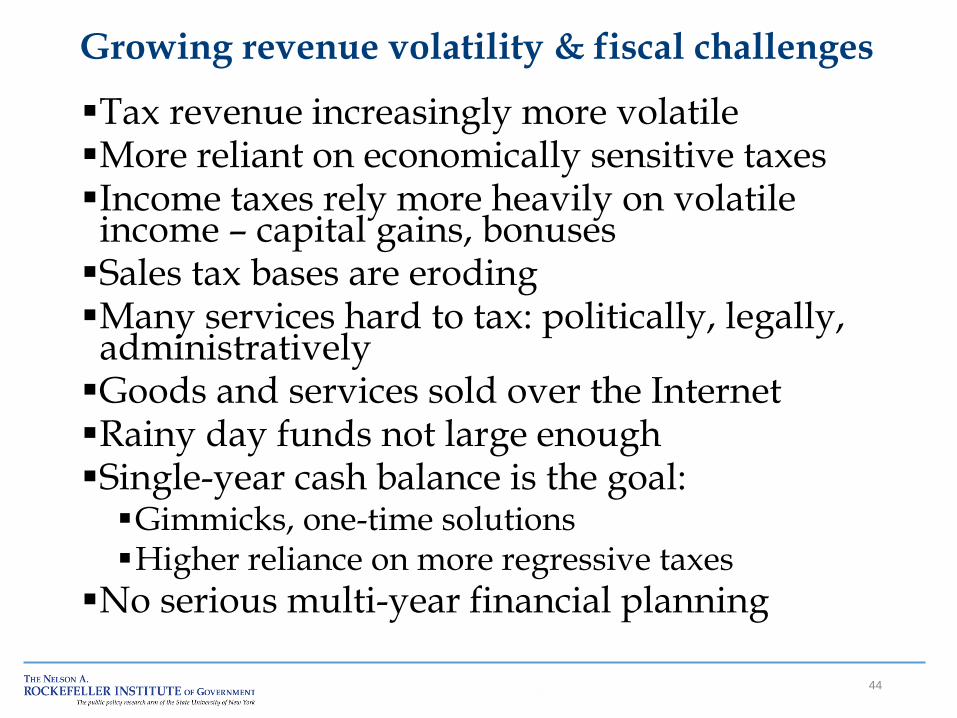
Growing revenue volatility & fiscal challenges
Tax revenue increasingly more volatile More reliant on economically sensitive taxes Income taxes rely more heavily on volatile income – capital gains, bonuses
Sales tax bases are eroding Many services hard to tax: politically, legally, administratively
Goods and services sold over the Internet Rainy day funds not large enough Single-year cash balance is the goal:
Gimmicks, one-time solutions Higher reliance on more regressive taxes
No serious multi-year financial planning
44
45
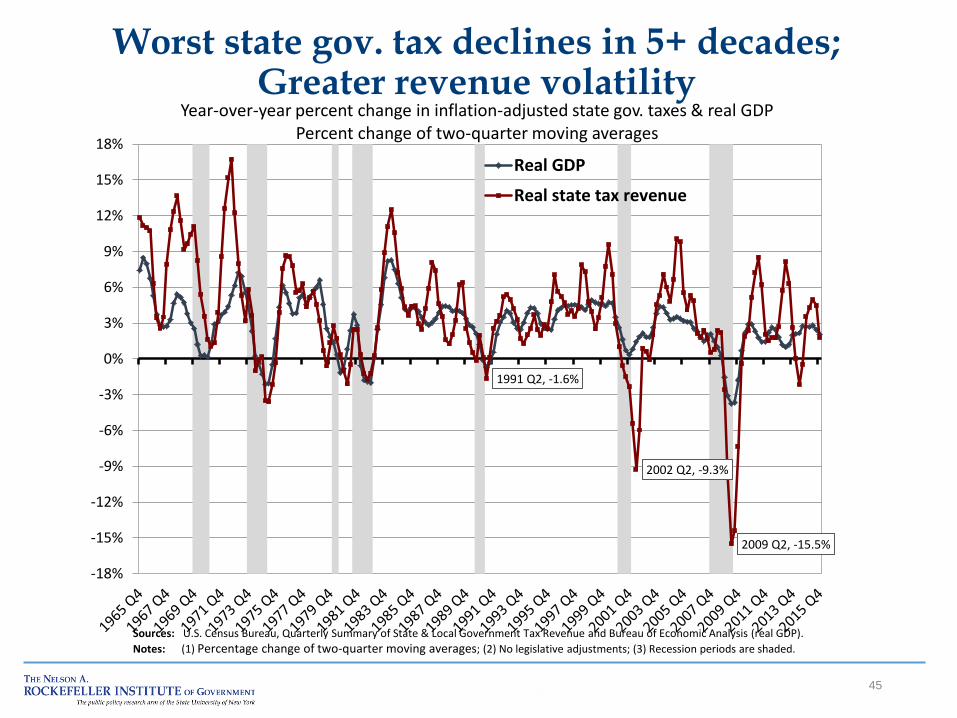
Worst state gov. tax declines in 5+ decades; Greater revenue volatility
1991 Q2, -1.6%
2002 Q2, -9.3%
2009 Q2, -15.5%
-18%
-15%
-12%
-9%
-6%
-3%
0%
3%
6%
9%
12%
15%
18%
Year-over-year percent change in inflation-adjusted state gov. taxes & real GDP Percent change of two-quarter moving averages
Real GDP
Real state tax revenue
Sources: U.S. Census Bureau, Quarterly Summary of State & Local Government Tax Revenue and Bureau of Economic Analysis (real GDP).
Notes: (1) Percentage change of two-quarter moving averages; (2) No legislative adjustments; (3) Recession periods are shaded.
46
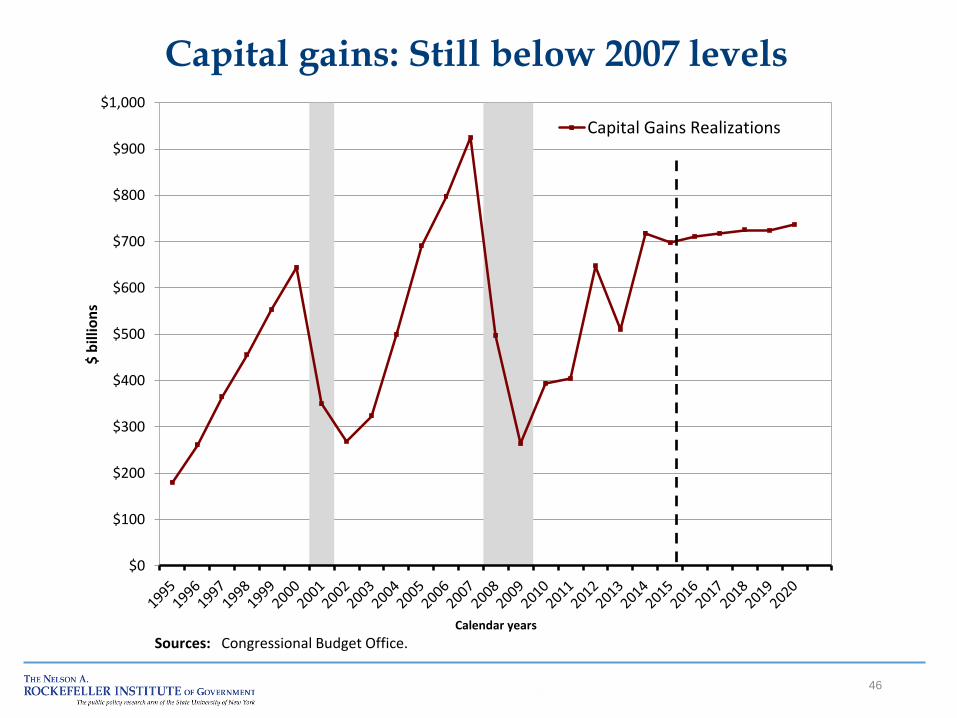
Capital gains: Still below 2007 levels
$0
$100
$200
$300
$400
$500
$600
$700
$800
$900
$1,000$
bill
ion
s
Calendar years
Capital Gains Realizations
Sources: Congressional Budget Office.

47
Percent change in S&P 500, capital gains, & April final returns, by tax year
(60)
(40)
(20)
0
20
40
60
80P
erce
nt
chan
ge v
s. y
ear
ago
S&P 500
Capital gains
Final returns (paid in following April)
Notes: (1) S&P 500 is calendar year average of daily adjusted closes; (2) Capital gains for 2015 are estimated by the CBO; (3) Final returns is median of state percentage changes; 2015 value (to be paid with April 2016 returns) is the authors' rough guess. Sources: (1) S&P 500 (Yahoo); (2) Capital gains (CBO, www.cbo.gov/publication/51129); (3) Final returns (Rockefeller Institute).
?
Federal fiscal cliff acceleration of
capital gains
Capital gains trough after acceleration
Rebound from trough

Fiscal reality & outlook
State & local gov’t finances hit hard by recession & financial crisis, much harder than economy
The revenue recovery is weak & prolonged Differing fiscal, tax & economic structures play important roles
Many states face fiscal stresses Growing revenues volatility Additional fiscal pressures in oil/coal states
AK, LA, NM, ND, OK, TX, WV, WY Additional fiscal pressures in states with large
pension liabilities: CT, KS, IL, NJ, PA
Long-term spending pressures Without significant policy changes, long-term fiscal sustainability is under threat
48

Rockefeller Institute of Government
The Public Policy Institute of the State University of New York 411 State Street Albany, NY 12203-1003 www.rockinst.org
Lucy Dadayan
Senior Policy Analyst