the state of the south june 29, 2012 richard hart communications director, mdc
TRANSCRIPT

The State of the SouthJune 29, 2012
Richard HartCommunications Director, MDC

Median IncomeThe South and US: 1990 to 2010
Source: US Census BureauNote: In 2010 inflation-adjusted dollars
20102008
20062004
20022000
19981996
19941992
19901988
19861984
19821980
19781976
1974
$17,000
$19,000
$21,000
$23,000
$25,000
$27,000
$29,000
US South

19801982
19841986
19881990
19921994
19961998
20002002
20042006
20082010
10%
11%
12%
13%
14%
15%
16%
17%
18%
19%
20%
SouthUS
Share of Persons Below the Poverty Level
South and United States: 1980 to 2010
Source: Current Population Survey

Percent Change in Resident Population: 2000 to 2010
Source: U.S. Census Bureau, 2010 Census

Overall Performance: Recession and Recovery
Source: Brookings Metropolitan Policy Program
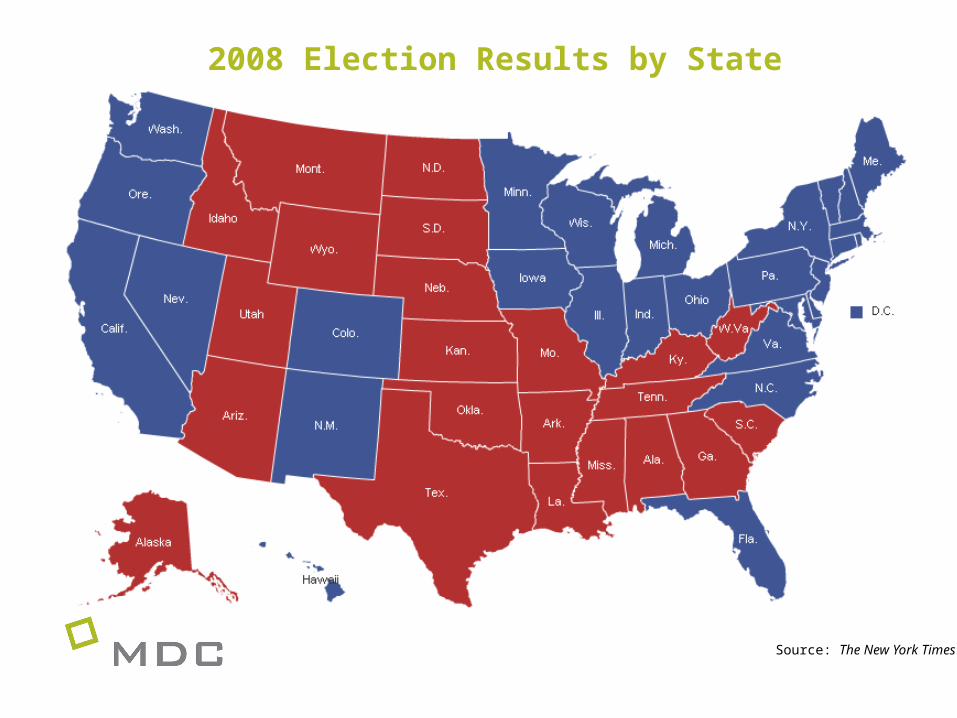
2008 Election Results by State
Source: The New York Times

2008 Election Results by County
Source: The New York Times

A Shifting Electorate
The New York Times Source: The New York Times

Population by Race/Ethnicity and Age Group South Region, 2009
Source: U.S. Census Bureau, American Community Survey, 2009

Source: MDC tabulation of data from the Population Division, U.S. Census Bureau
Aging AnglosMedian Age of State Population by Race and Ethnic Group,
2008

© MDC, Inc. All Rights Reserved
Latino GrowthChange in Population, 2000-2006/8
Source: MDC tabulation of American Community Survey Data, 2000 and 2006-8

Metros Advance, Rural Grows SlowlyIncrease in Jobs in the South, 1987-2008
Source: Bureau of Economic Analysis

ItalyMexico
PortugalArkansasLouisiana
GreeceWest Virginia
PolandTexas
TennesseeMississippi
AlabamaKentuckyGeorgia
OECD averageSouth Carolina
SwitzerlandFlorida
North CarolinaNetherlands
United KingdomSpain
FinlandSweden
DenmarkUnited States
AustraliaBelgium
FranceVirginiaNorwayIreland
New ZealandJapanKorea
Canada
18.919.5
21.425.9
28.128.128.2
30.030.731.331.731.832.2
34.034.234.435.035.336.036.737.1
38.939.340.040.140.440.741.341.442.442.7
43.947.3
53.755.555.8
Percentage of Young-Adult Degree Attainment*
*Ages 25-34 with at least a two-year degree
Sources: OECD and U.S. Census Bureau, American Community Survey
Note: OECD country-level data is for 2008, while ACS state-level data is for 2009.

Source: U.S. Census Bureau, American Community Survey
Percentage of Population 25 and Over with an Associate Degree or Higher by Race/Ethnicity, 2009

Alabam
a
Arkan
sas
Florida
Georg
ia
Kentu
cky
Louis
iana
Miss
issipp
i
North
Car
olina
South
Car
olina
Tenne
ssee
Texas
Virgini
a
Wes
t Virg
inia
United
Sta
tes
0
2
4
6
8
10
12
14
16
18
20
2010 Average Unemployment Status by Race, Hispanic or Latino Ethnicity
Total White Black or African American Hispanic or LatinoSource: Bureau of Labor Statistics

Unemployment Rate by Educational Attainment Level, 25-64 Years Old
Source: U.S. Census Bureau, 2009 American Community Survey

May 2011 May 2012 Over-the-year change
AL 9.3 7.4 -1.9AR 8.1 7.3 -0.8FL 10.6 8.6 -2GA 9.8 8.9 -0.9KY 9.6 8.2 -1.4LA 7.4 7.2 -0.2MS 10.7 8.7 -2NC 10.5 9.4 -1.1SC 10.4 9.1 -1.3TN 9.4 7.9 -1.5TX 8.1 6.9 -1.2VA 6.2 5.6 -0.6WV 7.9 6.9 -1US 9 8.2 -0.8
Unemployment Rate, Seasonally Adjusted
Source: The Bureau of Labor Statistics

NC Jobs Deficit Continues to GrowJobs needed to return to pre-recession
employment levels and keep up with population growth
May 2008 May 2009 May 2010 May 2011 May 2012
50,344
353,063
500,068518,598
555,357
Source: The North Carolina Justice Center and the NC Division of Employment Security

A Postsecondary Peek at 2018Share of Total Jobs Within State Requiring Postsecondary
Education in 2018
Source: Georgetown University’s Center on Education and the Workforce

307 West Main StreetDurham, NC 27701-3215
Phone: 919.381.5802Fax: 919.381.5805
www.mdcinc.org