the state of tennessee local government employee group · the state of tennessee – local...
TRANSCRIPT

THE STATE OF TENNESSEE –
LOCAL GOVERNMENT EMPLOYEE GROUP
O T H E R P O S T- E M P L O Y M E N T B E N E F I T S
A C T U A R I A L R E P O R T A S O F J U LY 1 , 2 0 1 5 F O R F I S C A L Y E A R
E N D I N G J U N E 3 0 , 2 0 1 6

May 13, 2016
Mr. Ike Boone
Financial Oversight Coordinator
F&A Division of Accounts
State of Tennessee
14th Floor, William Snodgrass Tower
312 Rosa L. Parks Avenue
Nashville, TN 37243
Re: GASB Statement No. 45 Actuarial Valuation
Of Other Post-Employment Benefits (OPEB)
Dear Mr. Boone:
Gabriel, Roeder, Smith & Company (GRS) has been engaged by the State of Tennessee to perform an Actuarial
Valuation of Other Post-Employment Benefits (OPEB) provided through the State’s group insurance plans. As
such the State of Tennessee is our Client-Principal. We are pleased to present herein the results of the valuation
of benefits provided to retirees covered under the Local Government Employee Group.
The Valuation was performed as of July 1, 2015 with results applicable to the fiscal year ending June 30, 2016
and covers implicit and direct premium subsidies to the medical (including prescription drug) benefits provided
to retirees. This Report presents the cost and liability attributed to employees and retirees of the Local
Government Agencies.
The actuarial calculations were prepared for the purposes of complying with the requirements of Statement No.
45 of the Governmental Accounting Standards Board (GASB) and have been made on a basis consistent with
our understanding of these accounting standards. Determinations of the liability associated with the benefits
described in this Report for purposes other than satisfying the financial reporting requirements of participating
governmental entities, may produce significantly different results. This Report may be provided to parties other
than Local Government Employers only in its entirety and only with the permission of the State.
All actuarial calculations were performed on the basis of the Substantive Plan and the Actuarial Assumptions
and Methods, as set forth in the respective sections of this Report.
The Valuation was performed on the basis of employee, retiree, premium, plan and financial information
supplied by officials of the State and the Tennessee Consolidated Retirement System. We checked for internal
reasonableness and year-to-year consistency, but did not otherwise audit the data. We are not responsible for
the accuracy or completeness of the information provided by officials of the State and the Tennessee
Consolidated Retirement System. Results by employer, as reflected on the pages at the end of this Report, are
based on data provided by State representatives (including indicators as to what employer the employees and
retirees are associated with as of June 30, 2015). We did not audit or validate this census data. Furthermore,
while the actuarial assumptions and methods employed are reasonable for the group as a whole, they may not be
reasonable for any individual employer.
The calculations are based upon assumptions regarding future events, which may or may not materialize. They
are also based upon current plan provisions that are outlined in this Report. If you have reason to believe that
the assumptions that were used are unreasonable, that the plan provisions are incorrectly described, that

Mr. Ike Boone
May 13, 2016
Page 2
important plan provisions relevant to this proposal are not described, or that conditions have changed since the
calculations were made, you should contact the author(s) of this Report prior to relying on information in the
Report.
Future actuarial measurements may differ significantly from the current measurements presented in this Report
due to such factors as the following: plan experience differing from that anticipated by the economic or
demographic assumptions; changes in economic or demographic assumptions; increases or decreases expected
as part of the natural operation of the methodology used for these measurements; and changes in plan
provisions, applicable law, accounting standards and interpretations. Due to the limited scope of the actuary’s
assignment, the actuary did not perform an analysis of the potential range of such future measurements.
This valuation assumed the continuing ability of the plan sponsor to make the contributions necessary to fund
this plan. A determination regarding whether or not the plan sponsor is actually able to do so is outside our
scope of expertise and was not performed.
To the best of our knowledge the information contained in this Report is accurate and fairly presents the
actuarial position of the plan as of the valuation date. All assumptions and calculations have been made in
conformity with generally accepted actuarial principles and practices and with the Actuarial Standards of
Practice issued by the Actuarial Standards Board. If you have reason to believe that the information provided in
this Report is inaccurate, or is in any way incomplete, or if you need further information in order to make an
informed decision on the subject matter of this Report, please contact the author of the Report prior to making
such decision.
James J. Rizzo and Piotr Krekora are members of the American Academy of Actuaries. These actuaries meet
the Academy’s Qualification Standards to render the actuarial opinions contained herein.
The signing actuaries are independent of the plan sponsor.
Gabriel, Roeder, Smith & Company will be pleased to review this valuation report and to answer any questions
pertaining to the valuation.
Respectfully submitted,
GABRIEL, ROEDER, SMITH & COMPANY
James J. Rizzo, ASA, MAAA
Senior Consultant & Actuary
Piotr Krekora, ASA, MAAA
Consultant & Actuary
TABLE OF CONTENTS
SECTION TITLE PAGE
A EXECUTIVE SUMMARY A-1
B SUMMARY OF ACTUARIAL VALUATION RESULTS
1. SUMMARY OF ACTUARIAL VALUATION RESULTS B-1
2. AGE AND SERVICE TABLES B-4
C DEVELOPMENT OF INITIAL PER CAPITA COSTS C-1
D ACTUARIAL ASSUMPTIONS AND METHODS
1. METHODS AND DEMOGRAPHIC/ECONOMIC ASSUMPTIONS D-1
2. HEALTH COVERAGE ASSUMPTIONS D-4
3. MISCELLANEOUS AND TECHNICAL ASSUMPTIONS D-8
4. DEFINITION OF TECHNICAL TERMS D-9
E
F
APPENDIX
SUMMARY OF SUBSTANTIVE PLAN PROVISIONS
REQUIRED ACTUARIAL INFORMATION (GASB 45)
RESULTS BY EMPLOYER
E-1
F-1
G-1

SECTION A
EXECUTIVE SUMMARY

Gabriel Roeder Smith & Company Local Government Employee Group OPEB for YE 6/30/2016| A-1
EXECUTIVE SUMMARY
The results presented herein are applicable to the year ending June 30, 2016 and are based on an Actuarial
Valuation performed as of July 1, 2015. We are also including projected results to be used for the June 30,
2017 reporting in the absence of significant changes.
This Actuarial Valuation and Report covers the OPEBs provided to the retirees of Local Government
Employers. Additional costs and liabilities borne and reportable by the some of the employers are included in a
separate Actuarial Valuation and Report for the Tennessee Plan (the Medicare Supplement).The Substantive
Plan provisions for the OPEBs provided through the Local Government Employee Group are described in the
Section at the end of this Report entitled “Summary of Substantive Plan Provisions.”
G A S B ’ S R A T I O N A L E
Prior to implementation of GASB Statement Nos. 43 and 45, the costs of OPEBs had been reflected in the
majority of governmental financial statements on a pay-as-you-go basis of accounting. The issuance of GASB
Statement Nos. 43 and 45 reflected GASB’s effort in moving toward full accrual accounting for all
governmental entities which issue government-wide financial statements according to generally accepted
accounting principles.
The subsidy provided by Local Government Employers had been recorded as an expense only after employees
retire, and then only one year at a time as the subsidy was paid. Statement No. 45 views the subsidy for retiree
medical benefits as a form of compensation which must be accrued on the books of the Local Government
Employer during an employee’s working life, rather than waiting until the employee’s service to the Local
Government has been completed and he or she has retired. So GASB requires the lifetime value of that subsidy
to be expensed over the working career of the employees.
D I R E C T S U B S I D I E S
Multiple levels of the direct premium subsidy are being offered to the retirees covered under the Local
Government Employee Group Plan. In general, retirees are required to make contributions at the full blended
premium rate with some employers offering direct premium subsidies with amounts ranging from a portion of
retiree only premium to a full premium for dependent coverage. More details can be found in the section titled
“Summary of the Substantive Plan Provisions.”
I M P L I C I T R A T E S U B S I D Y
According to the Summary of Substantive Plan Provisions, retirees and their dependents are permitted to
remain covered under the employer’s respective medical plans as long as they pay the required premiums
applicable to the plan and coverage elected.
It may appear, at first glance, that there is no obligation on the part of a governmental entity for subsidizing the
retiree coverage beyond the direct subsidy referenced above. However, even if the governmental entity were to
eliminate any direct subsidy and start charging retirees with the full blended rate developed for the type of
coverage elected, there would still be a residual liability. This liability arises because the full published
premiums are based on a blending for the experience among younger active employees and older retired
employees. Since older retirees generally have higher costs, this means that the governmental entity is actually
subsidizing the cost of the retiree and dependent coverage because it pays all or a significant portion of that
premium on behalf of the active employees.

Gabriel Roeder Smith & Company Local Government Employee Group OPEB for YE 6/30/2016| A-2
GASB No. 45 calls this the “implicit rate subsidy”. Even though it appears that there is no subsidy of retiree
and dependent coverage, there really is, and it is not an insignificant amount. A group of 62-year-old retirees or
dependents can easily cost over 50% more than the employer is collecting from them for coverage. The
governmental entity, therefore, has assumed an obligation to pay for that implicit subsidy for the covered
lifetimes of the current retirees and their dependents, as well for the covered lifetimes of the current employees
after they retire.
Measuring the current year’s implicit subsidy (and direct subsidy), projecting them for decades into the future
and making an allocation of that cost to different years, is the purpose of this Actuarial Valuation and Report.
F U N D E D A N D U N F U N D E D P L A N S
Currently, the Local Government Employee Group’s OPEB benefits are unfunded. That is, there is no separate
Trust Fund or equivalent arrangement into which the employers make contributions to advance-fund the
obligation, as they do for its pension plan, the Tennessee Consolidated Retirement System (TCRS). Therefore,
the ultimate subsidies which are provided over time are financed directly by general assets of the employer.
These assets are invested in short-term fixed income instruments according to its current investment policy.
Consequently, according to GASB Statement No. 45, the interest discount rate used to calculate the present
values and costs of the OPEB must be the long-range expected return on such short-term fixed income
instruments. The State selected an interest discount rate of 3.75% for this purpose. If the OPEB Plan were
advance-funded with its assets invested in a reasonable mix of stocks and longer bonds and, if the plan adopted
a Funding Policy to make fully funding cash deposits into a qualifying OPEB Trust, then a much higher interest
discount rate may be used, say, 5.5% to 6.5%. This would result in a substantially lower Annual OPEB Cost
and a substantially lower Unfunded Actuarial Accrued Liability than if 3.75% were used.
A C T U A R I A L A S S U M P T I O N S
In any long-term actuarial valuation (such as for Pensions and OPEBs), certain demographic, economic and
behavioral assumptions are made concerning the population, the investment discount rates and the benefits
provided. Examples include assumptions about future employment, mortality, and the participation or
acceptance rates. Future determinations of the funded status of the plan and the employer’s annual required
contributions are subject to continual revision as actual results are compared with past expectations and new
estimates are made about the future. These actuarial assumptions form the basis for the actuarial model which is
used to project the future population, the future benefits provided, and the future contributions collected. Then
the investment discount rate assumption is used to discount those projected net OPEB benefits to a present
value. This and other related present values are used to calculate the Annual OPEB Cost that will be expensed
in the Local Government Employee Group’s financial statements and the unfunded actuarial accrued liability
disclosed in the statements as well.
Calculations for financial reporting purposes are based on the benefits provided under terms of the substantive
plan (the plan as understood by the employer and the plan members) in effect at the time of each valuation and
on the pattern of sharing costs between the employer and plan members to that point. Projections of benefits for
financial reporting purposes are based on the current legal or contractual obligations of employers without
making explicit provisions for potential future changes in the pattern of cost sharing between the employer and
plan members. Actuarial calculations reflect a long-term perspective. Consistent with that perspective, actuarial
methods and assumptions used include techniques that are designed to reduce the effects of short-term volatility
in actuarial accrued liabilities.
It would be instructive to review the Section of this Report titled, “Actuarial Assumptions and Methods” for
details of all the relevant Actuarial Assumptions used in this Valuation.

Gabriel Roeder Smith & Company Local Government Employee Group OPEB for YE 6/30/2016| A-3
A C T U A R I A L C O S T M E T H O D S
GASB Statement No. 45 allows flexibility to governmental employers in the use of various actuarial cost
methods. The results presented herein have been obtained with the Projected Unit Credit actuarial cost method
with an amortization of the unfunded actuarial accrued liability as a level percent of expected payroll.
S U M M A R Y
Following is a chart that summarizes the results of this Actuarial Valuation for the OPEBs provided through the
Local Government Employee Group Plan. More details can be found on following pages.
As of July 1, 2015 July 1, 2013¹
Actuarial Accrued Liability 42,111,615$ 38,640,760$
Actuarial Value of Assets - -
Unfunded Actuarial Accrued Liability 42,111,615 38,640,760
For FYE June 30, 2016 June 30, 2014
Annual Required Contribution 5,970,923 5,335,418
A C C R U E D L I A B I L I T Y A N D A N N U A L O P E B C O S T
The Unfunded Actuarial Accrued Liability represents an actuarial measurement of the obligation that is
attributable to prior service, based on the actuarial cost method used to allocate the cost to prior years of
employment. This will be displayed in the Notes to Financial Statements and Required Supplementary
Information within the Local Government Employee Group’s annual financial statement.
The Annual OPEB Cost is the amount that is expensed for the year. Each individual employer participating in
the Local Government Employee Group Health Plan effectively has a fully insured contract with the total Plan.
As such, the offset to the OPEB Expense (Annual OPEB Cost) equals the total cost borne by the Local
Government for coverage for retirees and their dependents for the year (net of the retiree’s own payments for
the year). This offset is called the Employer Contribution.
The cumulative difference between the Annual OPEB Cost for the year and the Employer Contribution for the
year is called the Net OPEB Obligation. This is the amount of the expense charged for the year (per GASB No.
45) which was not yet offset by Employer Contributions. The Net OPEB Obligation will be reflected as a
liability in the Statement of Net Position of the Local Government’s annual financial statement. It flows right to
the balance sheet, remains there, and accumulates each year until fully paid off by future Employer
Contributions.
C H A N G E S I N C O S T S A N D L I A B I L I T I E S
The Unfunded Actuarial Accrued Liability and accounting expense have a tendency to increase from one
valuation to the next for any ongoing plan with no benefit reductions and no advance funding in a trust. A
detailed analysis of the root causes of all changes in costs and liabilities is beyond the scope of this Report.
Nonetheless, below we briefly discuss some of the factors contributing to the changes, to the extent feasible.

Gabriel Roeder Smith & Company Local Government Employee Group OPEB for YE 6/30/2016| A-4
We did not measure the impact of each individual change and the order does not have any particular
significance:
- Initial cost of coverage: The average cost of coverage decreased since the prior Valuation was
performed. It was previously assumed that the 60 year old male retiree, for example, would incur an
average of $8,947 in claims and other costs for the year 2013. In this Actuarial Valuation, it is assumed
for the year 2015, that a 60-year old male retiree would incur $9,140. This is lower than projected cost
of $10,291 based on assumptions used in the prior Valuation. This had a decreasing effect on the costs
and liabilities.
- Changes in Retiree Premiums: The average gross premium rate did not change significantly from $600
per month as of 1/1/2013. In the previous Valuation, the average premium was projected to increase to
$690 per month but it changed to $609. This premium increase is slower than increases in the claim
costs and as such had an increasing effect on the implicit subsidy.
- Changes in covered population: The number of retirees with medical coverage currently included in the
valuation decreased from 158 as of 7/1/2013 to 137 as of 7/1/2015. At the same time, the number of
active employees with medical coverage increased from 17,688 to 17,865. The combined population
changes had little effect on the costs and liabilities. However, some of the local governmental entities
providing direct premium subsidies withdrew from the plan and consequently a smaller proportion of
the covered population is projected to have subsidized coverage. This had a net decreasing impact on
the plan experience in total.
- Short Term Medical Trend assumption: It was assumed previously that premiums and costs would
increase at a rate of 6.5% for the year beginning January 1, 2016. Trend rates for costs continue to
increase at 6.5% for the year beginning January 1, 2016. Trend rates for premiums applicable to the
year beginning January 1, 2016 decrease by 1.96% to reflect premiums established for that year. This
had a modest increasing effect on the costs and liabilities.
- Long Term Medical Trend assumption: The trend rate for the cost of benefits and premiums charged to
retirees has been revised to be based on the recently updated forecasting model built and published
(December 2007, as updated November 2015) in Modeling Long-Term Health Care Cost Trends
sponsored by the Society of Actuaries and authored by Prof. Thomas E. Getzen. Under this model,
assumed trend rates decline over a 34-year period from 6.00% assumed for the year 2017 to the
ultimate level of 4.345%. This had a modest decreasing effect on the costs and liabilities.
- Valuation Discount Rate: Upon discussion and direction from State officials, we have decreased the
discount rate used to calculate the present values and costs of the OPEB. According to GASB
Statement No. 45, this rate must be the long-range expected return on such short-term fixed income
instruments. Given the recent trend in long term forecasts, we revised the discount rate from 4.0% used
previously to 3.75%. We estimated that lowering the discount rate increased the Actuarial Accrued
Liability by approximately 3.2%.
As can be seen from this summary of changes, there may have been offsetting factors at work to change the
results from the last full Valuation to this one. The net effect was an increase in the plan’s actuarial liabilities
and on the plan’s accounting expense.
Although these factors may have similar effects on all participating employers, experience of individual
employers may be different than the aggregate experience of the plan.
SECTION B
SUMMARY OF ACTUARIAL VALUATION RESULTS

Gabriel Roeder Smith & Company Local Government Employee Group OPEB for YE 6/30/2016| B-1
S U M M A R Y V A L U A T I O N R E S U L T S
Total Medical/Rx
Costs
Gross Medical/Rx
Premiums
Local
Government
Direct Subsidy
Net Employer
Costs
Number of Participants Covered
Active Participants 17,865 17,865 17,865 17,865
Retired Participants 137 137 137 137
Total Participants 18,002 18,002 18,002 18,002
Actuarial Present Value of Benefits
Active Participants 220,047,663 (162,679,206) 27,630,387 84,998,844
Retired Participants 6,033,010 (4,262,882) 2,260,770 4,030,898
Total Participants 226,080,673 (166,942,088) 29,891,157 89,029,742
Actuarial Accrued Liability
(Projected Unit Credit Actuarial Cost Method)
Active Participants 94,089,145 (69,169,159) 13,160,731 38,080,717
Retired Participants 6,033,010 (4,262,882) 2,260,770 4,030,898
Total Participants 100,122,155 (73,432,041) 15,421,501 42,111,615
Actuarial Value of Assets -
Unfunded Actuarial Accrued Liability 100,122,155 (73,432,041) 15,421,501 42,111,615
Annual Required Contribution
of the Employer (ARC) for YE 6/30/16
(Projected Unit Credit Actuarial Cost Method)
Normal Cost 10,222,151 (7,583,528) 1,121,771 3,760,394
Amortization of UAAL 2,210,529
Annual Required Contribution for FYE 6/30/16 5,970,923$
Per Active Participant 334$
ACTUARIAL VALUATION RESULTS AS OF JULY 1, 2015

Gabriel Roeder Smith & Company Local Government Employee Group OPEB for YE 6/30/2016| B-2
V A L U A T I O N R E S U L T S B Y S U B S I D Y T Y P E
Implict Subsidy
Local
Government
Direct Subsidy
Net Employer
Costs
Number of Participants Covered
Active Participants 17,865
Retired Participants 137
Total Participants 18,002
Actuarial Present Value of Benefits
Active Participants 57,368,457 27,630,387 84,998,844
Retired Participants 1,770,128 2,260,770 4,030,898
Total Participants 59,138,585 29,891,157 89,029,742
Actuarial Accrued Liability
(Projected Unit Credit Actuarial Cost Method)
Active Participants 24,919,986 13,160,731 38,080,717
Retired Participants 1,770,128 2,260,770 4,030,898
Total Participants 26,690,114 15,421,501 42,111,615
Actuarial Value of Assets -
Unfunded Actuarial Accrued Liability 26,690,114 15,421,501 42,111,615
Annual Required Contribution
of the Employer (ARC) for YE 6/30/16
(Projected Unit Credit Actuarial Cost Method)
Normal Cost 2,638,623 1,121,771 3,760,394
Amortization of UAAL 2,210,529
Annual Required Contribution for FYE 6/30/16 5,970,923$
Per Active Participant 334$
ACTUARIAL VALUATION RESULTS AS OF JULY 1, 2015

Gabriel Roeder Smith & Company Local Government Employee Group OPEB for YE 6/30/2016| B-3
E F F E C T O F T H E E X C I S E T A X O N H I G H C O S T H E A L T H P L A N S
Results presented above reflect the estimated impact of the excise tax on high cost (Cadillac) health plans. As
provided by the Patient Protection and Affordable Care Act of 2010, provisions of the law pertaining to the tax
will first take effect in 2020. The excise tax will be 40% of costs above a threshold. Under our Valuation
assumptions, we anticipate that the Plan will not be subject to the excise tax at least until 2025. Additional details
can be found on page D-6. The following table illustrates an estimated impact of the tax:
Results Reflecting
Expected Impact of
Excise Tax
Original Results
(Without Provisions
for Excise Tax)
Number of Participants Covered
Active Participants 17,865 17,865
Retired Participants and Surviving Spouses 137 137
Total Participants 18,002 18,002
Actuarial Present Value of Benefits
Active Participants 84,998,844 82,236,758
Retired Participants 4,030,898 4,028,913
Total Participants 89,029,742 86,265,671
Actuarial Accrued Liability
(Projected Unit Credit Actuarial Cost Method)
Active Participants 38,080,717 37,356,312
Retired Participants 4,030,898 4,028,913
Total Participants 42,111,615 41,385,225
Actuarial Value of Assets - -
Unfunded Actuarial Accrued Liability (PUC) 42,111,615 41,385,225
Annual Required Contribution
of the Employer (ARC) for YE 6/30/16
(Projected Unit Credit Actuarial Cost Method)
Normal Cost 3,760,394 3,649,875
Amortization of UAAL 2,210,529 2,183,184
Annual Required Contribution for FYE 6/30/16 5,970,923$ 5,833,059$
ACTUARIAL VALUATION RESULTS AS OF JULY 1, 2015
Gabriel Roeder Smith & Company Local Government Employee Group OPEB for YE 6/30/2016| B-4
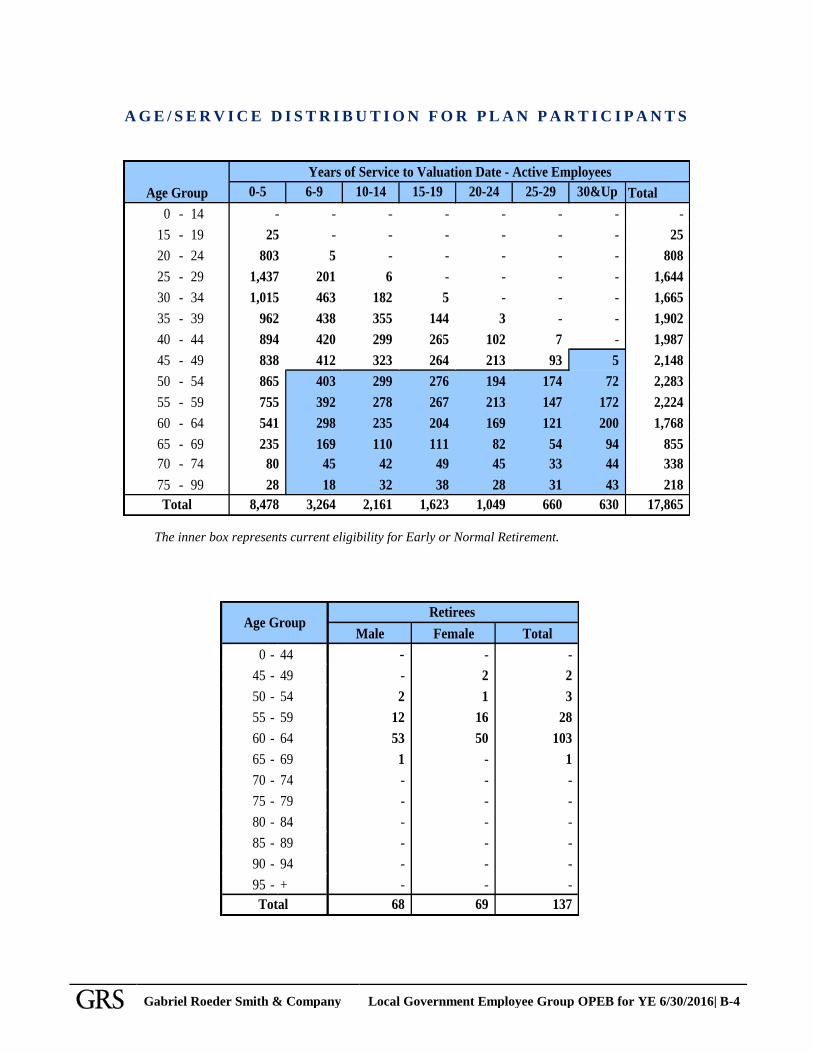
A G E / S E R V I C E D I S T R I B U T I O N F O R P L A N P A R T I C I P A N T S
0-5 6-9 10-14 15-19 20-24 25-29 30&Up Total
0 - 14 - - - - - - - -
15 - 19 25 - - - - - - 25
20 - 24 803 5 - - - - - 808
25 - 29 1,437 201 6 - - - - 1,644
30 - 34 1,015 463 182 5 - - - 1,665
35 - 39 962 438 355 144 3 - - 1,902
40 - 44 894 420 299 265 102 7 - 1,987
45 - 49 838 412 323 264 213 93 5 2,148
50 - 54 865 403 299 276 194 174 72 2,283
55 - 59 755 392 278 267 213 147 172 2,224
60 - 64 541 298 235 204 169 121 200 1,768
65 - 69 235 169 110 111 82 54 94 855
70 - 74 80 45 42 49 45 33 44 338
75 - 99 28 18 32 38 28 31 43 218
8,478 3,264 2,161 1,623 1,049 660 630 17,865
Years of Service to Valuation Date - Active Employees
Age Group
Total
The inner box represents current eligibility for Early or Normal Retirement.
Male Female Total
0 - 44 - - -
45 - 49 - 2 2
50 - 54 2 1 3
55 - 59 12 16 28
60 - 64 53 50 103
65 - 69 1 - 1
70 - 74 - - -
75 - 79 - - -
80 - 84 - - -
85 - 89 - - -
90 - 94 - - -
95 - + - - -
68 69 137
Age Group
Total
Retirees

SECTION C
DEVELOPMENT OF INITIAL PER CAPITA COSTS

Gabriel Roeder Smith & Company Local Government Employee Group OPEB for YE 6/30/2016| C-1
D E V E L O P M E N T O F I N I T I A L P E R C A P I T A C O S T S
By offering medical coverage to employees, retirees and their dependents, the participating Employers assume
the responsibility for the total expected premiums charged by the Plan. These costs are partially offset by
contributions from employees and retirees. While the total premium amount charged for covering employees
and retirees and their dependents is the same without regard to the age or gender of the member, the true costs
of medical and prescription coverage in any given year, depends on these factors. As the ages of employees,
retirees and dependents in the covered population increase, so do their costs of benefits.
The table and the graph below illustrate the expected initial monthly Per Capita Costs (PCC) applicable to
current retirees in the coming year.
Sample Sample
Ages Ages
45 344.18$ 475.02$ 65 478.58$ 451.40$
50 448.17 552.10 70 521.35 504.49
55 589.74 643.91 75 559.94 546.38
59 725.00 725.00 80 587.83 577.55
60 761.68 749.99 85 592.10 599.08
64 926.22 874.10 90 581.13 605.08
Female
All Retirees Grandfathered Retirees Only
Male MaleFemale
Initial Monthly Per Capita Cost
By Age/Sex
Note: Grandfathered retirees are permitted to continue in the core plan.
For comparison, the gross published premiums are also presented on the graph below. The spread between the
Per Capita Cost and that gross premium represents the implicit subsidy provided by the employer. The total
subsidy is equal to the difference between the Per Capita Cost and premiums actually collected from the retiree
(not shown).
$-
$100
$200
$300
$400
$500
$600
$700
$800
$900
$1,000
50 55 60 65 70 75
Member's Current Age
Expected Monthly Per Capita Cost
For Retirees/Spouses in the Next Valuation Year
Male PCC Female PCC Average Gross (Unsubsidized) Published Premium
Gabriel Roeder Smith & Company Local Government Employee Group OPEB for YE 6/30/2016| C-2
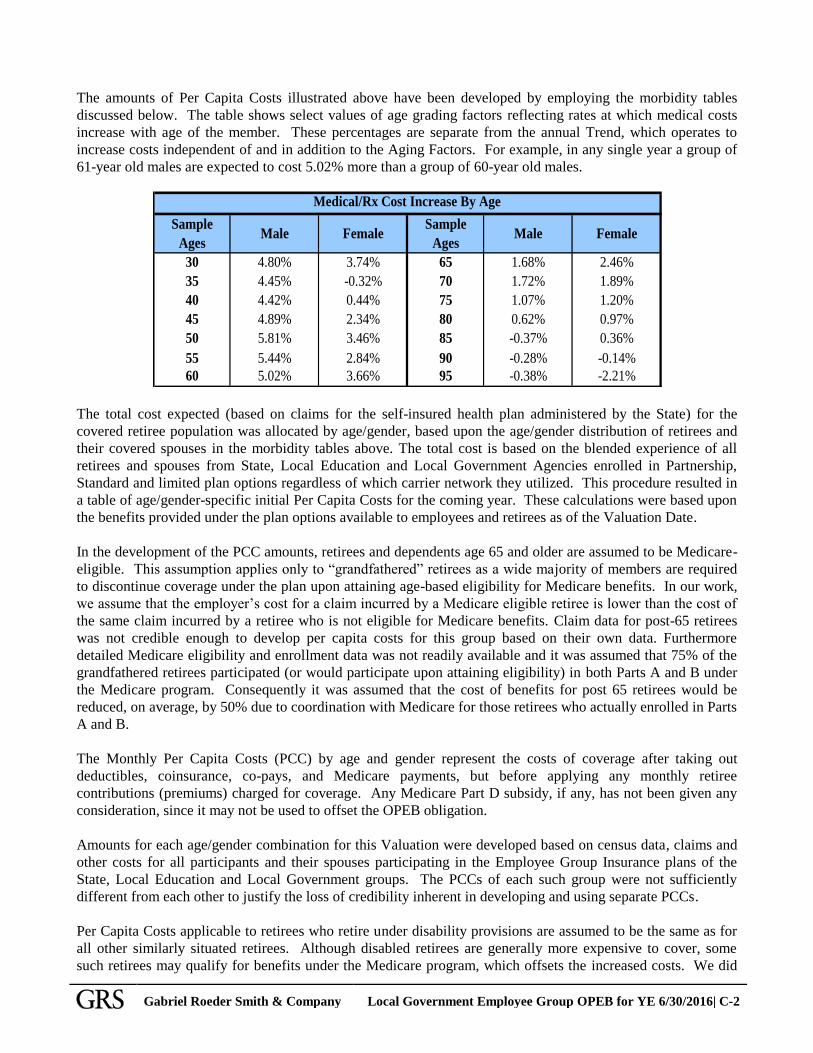
The amounts of Per Capita Costs illustrated above have been developed by employing the morbidity tables
discussed below. The table shows select values of age grading factors reflecting rates at which medical costs
increase with age of the member. These percentages are separate from the annual Trend, which operates to
increase costs independent of and in addition to the Aging Factors. For example, in any single year a group of
61-year old males are expected to cost 5.02% more than a group of 60-year old males.
Sample Sample
Ages Ages
30 4.80% 3.74% 65 1.68% 2.46%
35 4.45% -0.32% 70 1.72% 1.89%
40 4.42% 0.44% 75 1.07% 1.20%
45 4.89% 2.34% 80 0.62% 0.97%
50 5.81% 3.46% 85 -0.37% 0.36%
55 5.44% 2.84% 90 -0.28% -0.14%
60 5.02% 3.66% 95 -0.38% -2.21%
Medical/Rx Cost Increase By Age
Male Female Male Female
The total cost expected (based on claims for the self-insured health plan administered by the State) for the
covered retiree population was allocated by age/gender, based upon the age/gender distribution of retirees and
their covered spouses in the morbidity tables above. The total cost is based on the blended experience of all
retirees and spouses from State, Local Education and Local Government Agencies enrolled in Partnership,
Standard and limited plan options regardless of which carrier network they utilized. This procedure resulted in
a table of age/gender-specific initial Per Capita Costs for the coming year. These calculations were based upon
the benefits provided under the plan options available to employees and retirees as of the Valuation Date.
In the development of the PCC amounts, retirees and dependents age 65 and older are assumed to be Medicare-
eligible. This assumption applies only to “grandfathered” retirees as a wide majority of members are required
to discontinue coverage under the plan upon attaining age-based eligibility for Medicare benefits. In our work,
we assume that the employer’s cost for a claim incurred by a Medicare eligible retiree is lower than the cost of
the same claim incurred by a retiree who is not eligible for Medicare benefits. Claim data for post-65 retirees
was not credible enough to develop per capita costs for this group based on their own data. Furthermore
detailed Medicare eligibility and enrollment data was not readily available and it was assumed that 75% of the
grandfathered retirees participated (or would participate upon attaining eligibility) in both Parts A and B under
the Medicare program. Consequently it was assumed that the cost of benefits for post 65 retirees would be
reduced, on average, by 50% due to coordination with Medicare for those retirees who actually enrolled in Parts
A and B.
The Monthly Per Capita Costs (PCC) by age and gender represent the costs of coverage after taking out
deductibles, coinsurance, co-pays, and Medicare payments, but before applying any monthly retiree
contributions (premiums) charged for coverage. Any Medicare Part D subsidy, if any, has not been given any
consideration, since it may not be used to offset the OPEB obligation.
Amounts for each age/gender combination for this Valuation were developed based on census data, claims and
other costs for all participants and their spouses participating in the Employee Group Insurance plans of the
State, Local Education and Local Government groups. The PCCs of each such group were not sufficiently
different from each other to justify the loss of credibility inherent in developing and using separate PCCs.
Per Capita Costs applicable to retirees who retire under disability provisions are assumed to be the same as for
all other similarly situated retirees. Although disabled retirees are generally more expensive to cover, some
such retirees may qualify for benefits under the Medicare program, which offsets the increased costs. We did
Gabriel Roeder Smith & Company Local Government Employee Group OPEB for YE 6/30/2016| C-3
not assess the relative magnitude of these factors but given the fact that they offset each other combined with a
relatively low incidence of disability retirements, we believe that overall materiality of this aspect does not
warrant more detailed analysis. Consequently, all retirees are subjected to the same model regardless of
disability status.
SECTION D
ACTUARIAL ASSUMPTIONS AND METHODS
Gabriel Roeder Smith & Company Local Government Employee Group OPEB for YE 6/30/2016 |
D-1
ACTUARIAL ASSUMPTIONS AND METHODS
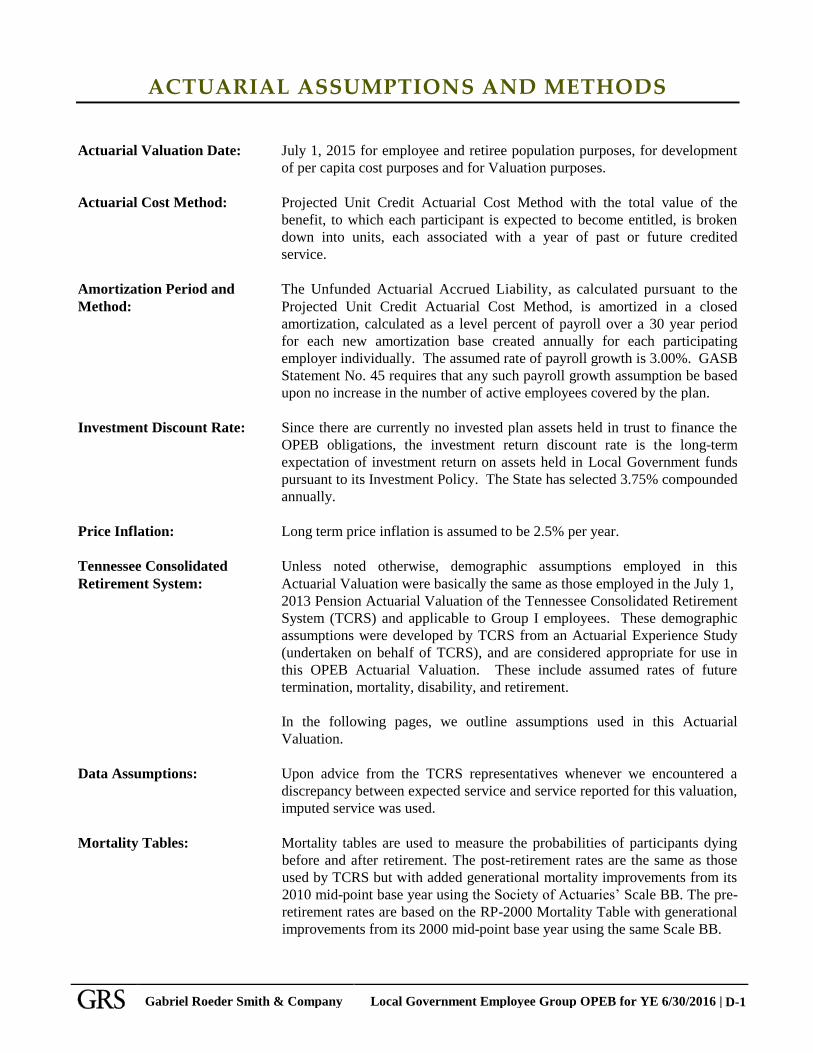
Actuarial Valuation Date: July 1, 2015 for employee and retiree population purposes, for development
of per capita cost purposes and for Valuation purposes.
Actuarial Cost Method: Projected Unit Credit Actuarial Cost Method with the total value of the
benefit, to which each participant is expected to become entitled, is broken
down into units, each associated with a year of past or future credited
service.
Amortization Period and The Unfunded Actuarial Accrued Liability, as calculated pursuant to the
Method: Projected Unit Credit Actuarial Cost Method, is amortized in a closed
amortization, calculated as a level percent of payroll over a 30 year period
for each new amortization base created annually for each participating
employer individually. The assumed rate of payroll growth is 3.00%. GASB
Statement No. 45 requires that any such payroll growth assumption be based
upon no increase in the number of active employees covered by the plan.
Investment Discount Rate: Since there are currently no invested plan assets held in trust to finance the
OPEB obligations, the investment return discount rate is the long-term
expectation of investment return on assets held in Local Government funds
pursuant to its Investment Policy. The State has selected 3.75% compounded
annually.
Price Inflation: Long term price inflation is assumed to be 2.5% per year.
Tennessee Consolidated Unless noted otherwise, demographic assumptions employed in this
Retirement System: Actuarial Valuation were basically the same as those employed in the July 1,
2013 Pension Actuarial Valuation of the Tennessee Consolidated Retirement
System (TCRS) and applicable to Group I employees. These demographic
assumptions were developed by TCRS from an Actuarial Experience Study
(undertaken on behalf of TCRS), and are considered appropriate for use in
this OPEB Actuarial Valuation. These include assumed rates of future
termination, mortality, disability, and retirement.
In the following pages, we outline assumptions used in this Actuarial
Valuation.
Data Assumptions: Upon advice from the TCRS representatives whenever we encountered a
discrepancy between expected service and service reported for this valuation,
imputed service was used.
Mortality Tables: Mortality tables are used to measure the probabilities of participants dying
before and after retirement. The post-retirement rates are the same as those
used by TCRS but with added generational mortality improvements from its
2010 mid-point base year using the Society of Actuaries’ Scale BB. The pre-
retirement rates are based on the RP-2000 Mortality Table with generational
improvements from its 2000 mid-point base year using the same Scale BB.
Gabriel Roeder Smith & Company Local Government Employee Group OPEB for YE 6/30/2016 |
D-2
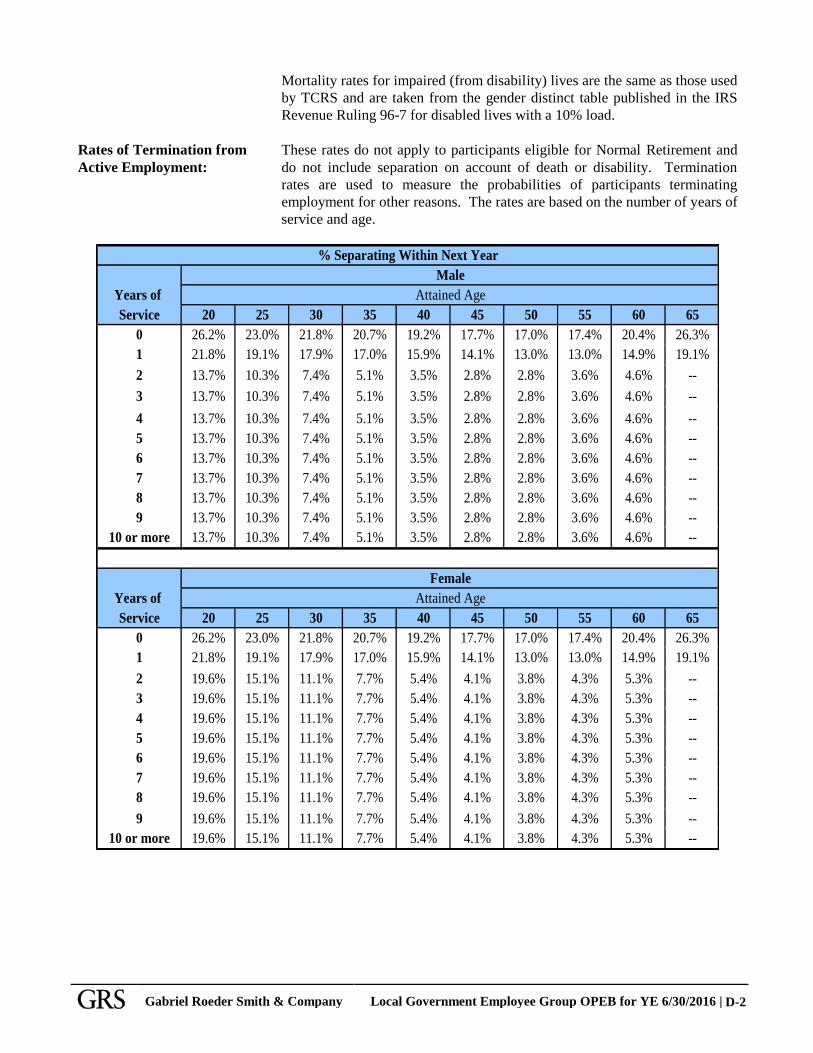
Mortality rates for impaired (from disability) lives are the same as those used
by TCRS and are taken from the gender distinct table published in the IRS
Revenue Ruling 96-7 for disabled lives with a 10% load.
Rates of Termination from These rates do not apply to participants eligible for Normal Retirement and
Active Employment: do not include separation on account of death or disability. Termination
rates are used to measure the probabilities of participants terminating
employment for other reasons. The rates are based on the number of years of
service and age.
Years of
Service 20 25 30 35 40 45 50 55 60 65
0 26.2% 23.0% 21.8% 20.7% 19.2% 17.7% 17.0% 17.4% 20.4% 26.3%
1 21.8% 19.1% 17.9% 17.0% 15.9% 14.1% 13.0% 13.0% 14.9% 19.1%
2 13.7% 10.3% 7.4% 5.1% 3.5% 2.8% 2.8% 3.6% 4.6% --
3 13.7% 10.3% 7.4% 5.1% 3.5% 2.8% 2.8% 3.6% 4.6% --
4 13.7% 10.3% 7.4% 5.1% 3.5% 2.8% 2.8% 3.6% 4.6% --
5 13.7% 10.3% 7.4% 5.1% 3.5% 2.8% 2.8% 3.6% 4.6% --
6 13.7% 10.3% 7.4% 5.1% 3.5% 2.8% 2.8% 3.6% 4.6% --
7 13.7% 10.3% 7.4% 5.1% 3.5% 2.8% 2.8% 3.6% 4.6% --
8 13.7% 10.3% 7.4% 5.1% 3.5% 2.8% 2.8% 3.6% 4.6% --
9 13.7% 10.3% 7.4% 5.1% 3.5% 2.8% 2.8% 3.6% 4.6% --
10 or more 13.7% 10.3% 7.4% 5.1% 3.5% 2.8% 2.8% 3.6% 4.6% --
Years of
Service 20 25 30 35 40 45 50 55 60 65
0 26.2% 23.0% 21.8% 20.7% 19.2% 17.7% 17.0% 17.4% 20.4% 26.3%
1 21.8% 19.1% 17.9% 17.0% 15.9% 14.1% 13.0% 13.0% 14.9% 19.1%
2 19.6% 15.1% 11.1% 7.7% 5.4% 4.1% 3.8% 4.3% 5.3% --
3 19.6% 15.1% 11.1% 7.7% 5.4% 4.1% 3.8% 4.3% 5.3% --
4 19.6% 15.1% 11.1% 7.7% 5.4% 4.1% 3.8% 4.3% 5.3% --
5 19.6% 15.1% 11.1% 7.7% 5.4% 4.1% 3.8% 4.3% 5.3% --
6 19.6% 15.1% 11.1% 7.7% 5.4% 4.1% 3.8% 4.3% 5.3% --
7 19.6% 15.1% 11.1% 7.7% 5.4% 4.1% 3.8% 4.3% 5.3% --
8 19.6% 15.1% 11.1% 7.7% 5.4% 4.1% 3.8% 4.3% 5.3% --
9 19.6% 15.1% 11.1% 7.7% 5.4% 4.1% 3.8% 4.3% 5.3% --
10 or more 19.6% 15.1% 11.1% 7.7% 5.4% 4.1% 3.8% 4.3% 5.3% --
Female
Attained Age
% Separating Within Next Year
Attained Age
Male

Gabriel Roeder Smith & Company Local Government Employee Group OPEB for YE 6/30/2016 |
D-3
Rates of Disability: Disability rates are used to measure the probabilities of active participants
becoming disabled.
Sample
Ages
20 0.03% 0.03%
25 0.03% 0.03%
30 0.03% 0.03%
35 0.03% 0.03%
40 0.08% 0.08%
45 0.20% 0.20%
50 0.38% 0.38%
55 0.49% 0.49%
60 -- --
65 -- --
Male Female
% Becoming Disabled Within Next Year
Rates of Retirement: Rates of retirement are used to measure the probabilities of an eligible active
employee retiring during the next year.
Sample
Ages
50
55
60
65
70
75
Unreduced Retirement Annual Rates
FemaleMale
9.0%
9.0%
10.5%
24.0%
18.0%
100.0%
8.0%
8.0%
11.0%
22.0%
19.0%
100.0%
Rates of retirement are increased by 12.5% in the year an employee first
reaches eligibility for unreduced retirement before attaining age 60.
In addition, rates of retirement are increased by 8% for ages 60 and higher
for employees with 15 or more years of service.
Gabriel Roeder Smith & Company Local Government Employee Group OPEB for YE 6/30/2016 |
D-4
H E A L T H C O V E R A G E A S S U M P T I O N S
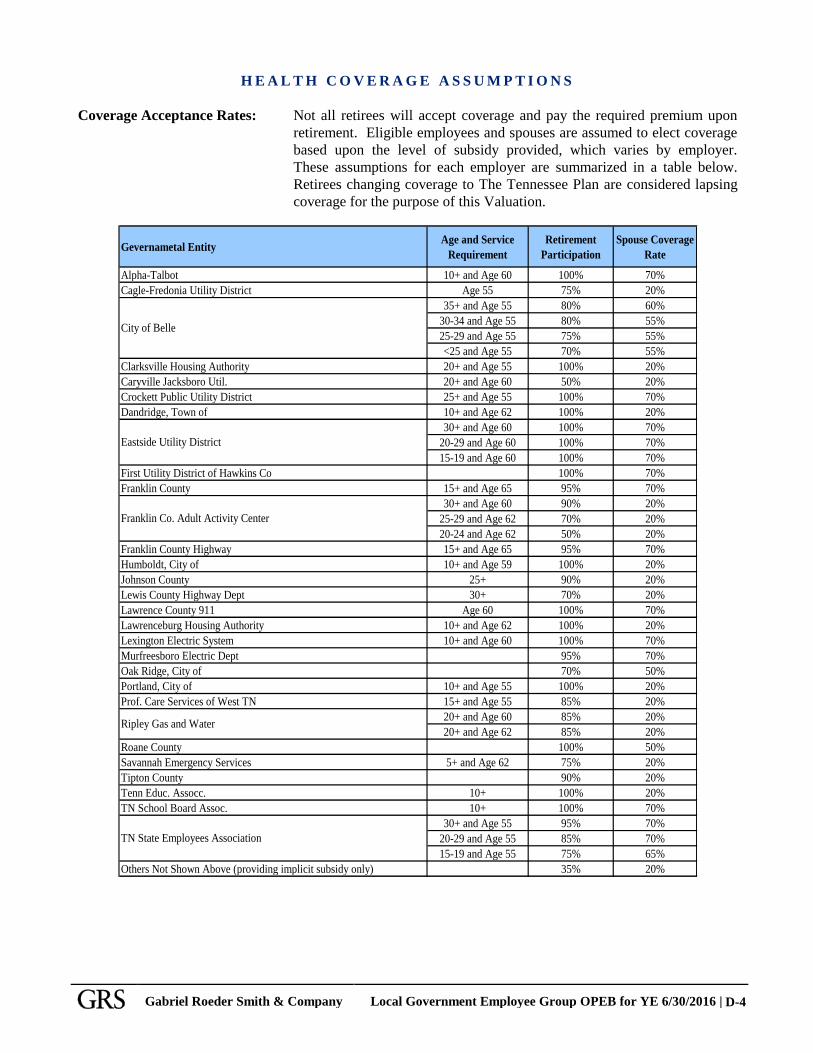
Coverage Acceptance Rates: Not all retirees will accept coverage and pay the required premium upon
retirement. Eligible employees and spouses are assumed to elect coverage
based upon the level of subsidy provided, which varies by employer.
These assumptions for each employer are summarized in a table below.
Retirees changing coverage to The Tennessee Plan are considered lapsing
coverage for the purpose of this Valuation.
Gevernametal EntityAge and Service
Requirement
Retirement
Participation
Spouse Coverage
Rate
Alpha-Talbot 10+ and Age 60 100% 70%
Cagle-Fredonia Utility District Age 55 75% 20%
35+ and Age 55 80% 60%
30-34 and Age 55 80% 55%
25-29 and Age 55 75% 55%
<25 and Age 55 70% 55%
Clarksville Housing Authority 20+ and Age 55 100% 20%
Caryville Jacksboro Util. 20+ and Age 60 50% 20%
Crockett Public Utility District 25+ and Age 55 100% 70%
Dandridge, Town of 10+ and Age 62 100% 20%
30+ and Age 60 100% 70%
20-29 and Age 60 100% 70%
15-19 and Age 60 100% 70%
First Utility District of Hawkins Co 100% 70%
Franklin County 15+ and Age 65 95% 70%
30+ and Age 60 90% 20%
25-29 and Age 62 70% 20%
20-24 and Age 62 50% 20%
Franklin County Highway 15+ and Age 65 95% 70%
Humboldt, City of 10+ and Age 59 100% 20%
Johnson County 25+ 90% 20%
Lewis County Highway Dept 30+ 70% 20%
Lawrence County 911 Age 60 100% 70%
Lawrenceburg Housing Authority 10+ and Age 62 100% 20%
Lexington Electric System 10+ and Age 60 100% 70%
Murfreesboro Electric Dept 95% 70%
Oak Ridge, City of 70% 50%
Portland, City of 10+ and Age 55 100% 20%
Prof. Care Services of West TN 15+ and Age 55 85% 20%
20+ and Age 60 85% 20%
20+ and Age 62 85% 20%
Roane County 100% 50%
Savannah Emergency Services 5+ and Age 62 75% 20%
Tipton County 90% 20%
Tenn Educ. Assocc. 10+ 100% 20%
TN School Board Assoc. 10+ 100% 70%
30+ and Age 55 95% 70%
20-29 and Age 55 85% 70%
15-19 and Age 55 75% 65%
Others Not Shown Above (providing implicit subsidy only) 35% 20%
City of Belle
Franklin Co. Adult Activity Center
Ripley Gas and Water
TN State Employees Association
Eastside Utility District

Gabriel Roeder Smith & Company Local Government Employee Group OPEB for YE 6/30/2016 |
D-5
Future participation: Active employees currently declining coverage are assumed to opt into the
plan in the future and accept retiree coverage at a 0% rate. Covered
employees are assumed to remain covered until retirement.
Expenses: Expenses are included in the Per Capita Costs.
Expected Retiree Members are required to make monthly contributions in order to maintain
Contributions: their coverage. For the purpose of this Valuation a weighted average
between plan options (Partnership, Standard, Limited) and carriers has
been used with weights derived from the current distribution of members
among plans offered. Such average expected retiree premium contributions
for the first year, before any direct subsidies are shown in the table below.
Retiree 609.00$
Spouse 611.00$
Average Premium (as of Valuation Date)
Health Care Cost Trend Rates: Monthly Per Capita Costs (PCC) and Retiree Contributions for Medical
and Rx benefits are assumed to increase each year according to the rates
set forth in the following table. For example, the Per Capita Costs for the
year beginning on 1/1/2016 are expected to increase by 6.50% over the
rates for the year beginning on 1/1/2015. Premiums for the year beginning
on 1/1/2016 are expected to decrease by 1.96% over the rates for the year
beginning on 1/1/2015 based on actual premiums established for that year
with the carriers.
The trend rate for the costs of benefits and premiums for years after 2016
are based on the forecasting model built and published (December 2007, as
updated November 2015) in Modeling Long-Term Health Care Cost
Trends sponsored by the Society of Actuaries and authored by Prof.
Thomas E. Getzen. The long term rates reflect a 2.5% assumed ultimate
inflation rate, 25% resistance level for health care spending as a percent of
GDP and a 34-year convergence period.
The rates presented below illustrate assumed medical cost inflation in the
absence of the Excise Tax on High-Cost Employer Health Plans.
2016 6.50% -1.96% 2024 5.06% 5.06%
2017 6.00% 6.00% 2025 5.02% 5.02%
2018 5.75% 5.75% 2026 4.97% 4.97%
2019 5.50% 5.50% 2027 4.97% 4.97%
2020 5.25% 5.25% 2028 4.97% 4.97%
2021 5.20% 5.20% … … …
2022 5.16% 5.16% 2050 4.35% 4.35%
2023 5.11% 5.11% Ultimate 4.35% 4.35%
Medical/RxMedical/Rx
Annual Increase Rates
ContributionYear of
IncreaseContribution
Year of
Increase
Gabriel Roeder Smith & Company Local Government Employee Group OPEB for YE 6/30/2016 |
D-6
C O N S I D E R A T I O N O F H E A L T H C A R E R E F O R M
Summary of Selected Provisions and their effects
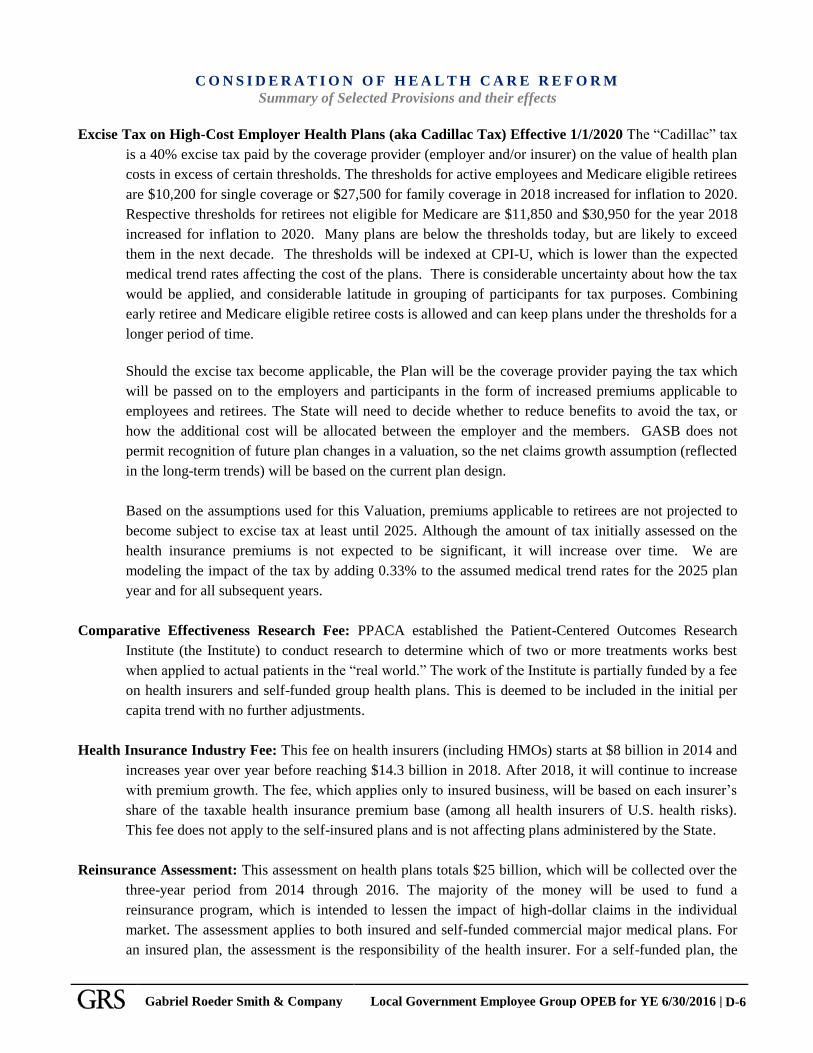
Excise Tax on High-Cost Employer Health Plans (aka Cadillac Tax) Effective 1/1/2020 The “Cadillac” tax
is a 40% excise tax paid by the coverage provider (employer and/or insurer) on the value of health plan
costs in excess of certain thresholds. The thresholds for active employees and Medicare eligible retirees
are $10,200 for single coverage or $27,500 for family coverage in 2018 increased for inflation to 2020.
Respective thresholds for retirees not eligible for Medicare are $11,850 and $30,950 for the year 2018
increased for inflation to 2020. Many plans are below the thresholds today, but are likely to exceed
them in the next decade. The thresholds will be indexed at CPI-U, which is lower than the expected
medical trend rates affecting the cost of the plans. There is considerable uncertainty about how the tax
would be applied, and considerable latitude in grouping of participants for tax purposes. Combining
early retiree and Medicare eligible retiree costs is allowed and can keep plans under the thresholds for a
longer period of time.
Should the excise tax become applicable, the Plan will be the coverage provider paying the tax which
will be passed on to the employers and participants in the form of increased premiums applicable to
employees and retirees. The State will need to decide whether to reduce benefits to avoid the tax, or
how the additional cost will be allocated between the employer and the members. GASB does not
permit recognition of future plan changes in a valuation, so the net claims growth assumption (reflected
in the long-term trends) will be based on the current plan design.
Based on the assumptions used for this Valuation, premiums applicable to retirees are not projected to
become subject to excise tax at least until 2025. Although the amount of tax initially assessed on the
health insurance premiums is not expected to be significant, it will increase over time. We are
modeling the impact of the tax by adding 0.33% to the assumed medical trend rates for the 2025 plan
year and for all subsequent years.
Comparative Effectiveness Research Fee: PPACA established the Patient-Centered Outcomes Research
Institute (the Institute) to conduct research to determine which of two or more treatments works best
when applied to actual patients in the “real world.” The work of the Institute is partially funded by a fee
on health insurers and self-funded group health plans. This is deemed to be included in the initial per
capita trend with no further adjustments.
Health Insurance Industry Fee: This fee on health insurers (including HMOs) starts at $8 billion in 2014 and
increases year over year before reaching $14.3 billion in 2018. After 2018, it will continue to increase
with premium growth. The fee, which applies only to insured business, will be based on each insurer’s
share of the taxable health insurance premium base (among all health insurers of U.S. health risks).
This fee does not apply to the self-insured plans and is not affecting plans administered by the State.
Reinsurance Assessment: This assessment on health plans totals $25 billion, which will be collected over the
three-year period from 2014 through 2016. The majority of the money will be used to fund a
reinsurance program, which is intended to lessen the impact of high-dollar claims in the individual
market. The assessment applies to both insured and self-funded commercial major medical plans. For
an insured plan, the assessment is the responsibility of the health insurer. For a self-funded plan, the

Gabriel Roeder Smith & Company Local Government Employee Group OPEB for YE 6/30/2016 |
D-7
assessment is the employer’s responsibility, but an employer may choose to have a third party
administrator facilitate the payment on behalf of the plan. This is deemed to be included in the initial
per capita trend with no further adjustments.
Implementation of the new requirements: We have not identified any other specific provision of health care
reform that would be expected to have a significant impact on the measured obligation. As additional
guidance on the legislation is issued, we will review and monitor those impacts.
Gabriel Roeder Smith & Company Local Government Employee Group OPEB for YE 6/30/2016 |
D-8
M I S C E L L A N E O U S A N D T E C H N I C A L A S S U M P T I O N S
Decrement Timing: Decrements of all types are assumed to occur at the middle of the year.
Eligibility Testing: Eligibility for benefits is determined based upon the age nearest birthday
and service nearest whole year on the date the decrement is assumed to
occur.
Decrement Relativity: Decrement rates are treated as absolute rates of decrement.
Adjustments: None.
Decrement Operation: All decrements operate simultaneously. Disability and termination rates
cease upon eligibility for normal or early retirement
.

Gabriel Roeder Smith & Company Local Government Employee Group OPEB for YE 6/30/2016 |
D-9
D E F I N I T I O N S O F T E C H N I C A L T E R M S
Actuarial Accrued Liability: Actuarial Accrued Liability is the actuarial present value of projected
future benefits that are attributable to an employees’ service to date.
Sometimes it is expressed as the difference between the actuarial present
value of all future benefit payments and the actuarial present value of
future normal costs.
Actuarial Assumptions: These are factors for estimating expected future experience with respect to
occurrences of mortality, disability, turnover, retirement, rates of
investment income and salary increases, coverage acceptance, trend, aging,
etc.
Actuarial Cost Method: This is a mathematical budgeting procedure for allocating the dollar
amount of the “actuarial present value of future benefit payments” between
future normal costs and actuarial accrued liabilities. It is often referred to
as the “Actuarial Funding Method” or “Actuarial Valuation Cost Method”.
Actuarial Present Value: Actuarial Present Value of a series of expected payments (or a single
payment) is the amount of funds currently required to provide those
expected payments in the future. This amount is determined by discounting
future payments at predetermined rates of interest, taking into account the
probability of payment. It is also referred to as “Present Value.”
Amortization: Amortization is a process of paying off, or recognizing, an interest-
discounted amount with periodic payments of interest and principal,
(similar to paying off an installment loan) -- as opposed to paying it off
with a single sum.
Annual Required Contribution: The ARC is the portion of the present value of projected benefits that is
(ARC): attributable to the current period. Usually it is determined as the normal
cost (as defined below) plus the portion of the unfunded actuarial accrued
liability amortized in the current period. The ARC is an amount that is
actuarially determined to ensure that, if paid on an ongoing basis, it would
provide sufficient resources for future benefit payments.
Normal Cost: Normal Cost is the actuarial cost of a portion of projected future benefits
allocated to the current year by the Actuarial Cost Method. It is sometimes
referred to as “Current Service Cost.”
Unfunded Actuarial Accrued UAAL is the difference between actuarial accrued liability and the
Liability (UAAL): actuarial value of plan assets.
SECTION E
SUMMARY OF SUBSTANTIVE PLAN PROVISIONS

Gabriel Roeder Smith & Company Local Government Employee Group OPEB for YE 6/30/2016 |
D-1
L O C AL G O VE R N M E N T E M P L O Y E E G R O UP
I N SUR AN C E P L AN
SUM M ARY O F SUB STAN T I VE P L AN P R O VI SI O N S
AS O F J ULY 1 , 2 0 1 5
E L I G I B I L I T Y F O R R E T I R E M E N T
All retirees of participating Local Government Agencies retired upon satisfying the Disability, or Early or
Normal Retirement provisions of the Tennessee Consolidated Retirement System (TCRS) may be eligible for
certain post-employment benefits under the Local Government Employee Group Plan. Any employee
becoming a member of TCRS on or after July 1, 1976 and through June 30, 2014 enters TCRS Group I
regardless of employment classification. The following presents the Group I eligibility requirements for
retirement under the Tennessee Consolidated Retirement System (TCRS):
VESTED TERMINATION Full vesting starts after 5 years of creditable service, or 10 years for members
of political subdivisions unless the governing body passes a resolution
authorizing five-year vesting.
However, no other postemployment benefits are available under the State
Employees Group Plan to employees not meeting criteria described below.
25-YEAR RETIREMENT Members of political subdivisions are eligible only if the local government has
passed a resolution authorizing this provision
EARLY RETIREMENT Age 55 and vested.
SERVICE RETIREMENT Earlier of (i) Age 60 and vested, or (ii) Any age with 30 years of creditable
service.
INSURANCE ELIGIBILITY Age 55 with at least 10 years employment with the local government agency
from which individual is retiring and three continuous years of insurance
coverage in the plan immediately prior to final termination for retirement
Age 55 with at least 20 or more years employment with the local government
agency from which the individual is retiring and one year of insurance
coverage in the plan immediately prior to final termination for retirement
30 years of service with the local government agency from with the individual
is retiring at any age and one year of insurance coverage in the plan
immediately prior to final termination for retirement
Public safety employees (police and firemen) in a retirement system other than
TCRS who are age 50 and have at least 25 years of creditable service and one
year of insurance coverage in the plan prior to retirement
Utility board members who are age 55 and have at least 20 years of service
with the same utility district from which they are retiring and one full year of

Gabriel Roeder Smith & Company Local Government Employee Group OPEB for YE 6/30/2016 |
D-2
insurance coverage in the plan immediately prior to retirement, or 30 years of
service with the same utility district from which they are retiring at any age
and one full year of insurance coverage in the plan immediately prior to
retirement
If the individual is retiring through TCRS, they must be receiving a monthly
retirement benefit to continue coverage as a retiree, TCRS participants who
choose a lump-sum retirement benefit are not eligible to continue insurance at
retirement.
DISABLED RETIREES Retirees who were insured through a participating local government agency at
the time of an injury or illness which resulted in their disability may continue
coverage provided that no lapse in medical coverage has occurred by meeting
the requirements outlined above, or by having at least five years employment
with the employer immediately prior to final termination due to disability.
O T H E R P O S T - E M P L O Y M E N T B E N E F I T S - F O R M E D I C A L C O V E R A G E
U N D E R “ T H E L O C A L G O V E R N M E N T E M P L O Y E E G R O U P P L A N ”
Certain Other Post-Employment Benefits (OPEB) are available to current retirees and all employees retiring
from Local Government Agencies under the provisions of Disability, Early or Normal Retirement, as described
above. With exception of a small group of grandfathered individuals, retirees are required to discontinue
coverage under the plan upon attaining age 65. In addition to subsidies that may be provided by the local
employers for retiree premiums the OPEB benefits include access to coverage for the retiree and dependents
under the Medical, Prescription, Dental, Vision, and Long Term Care as described below.
H E A L T H - R E L A T E D B E N E F I T S
Eligible retirees may choose among the same Medical Plan options available for similarly situated active
employees of the employer. Dependents of retirees who continue to meet eligibility requirements may be
covered at the retiree’s option the same as dependents of active employees, provided those dependents were
already enrolled in the Plan when the retiree’s active coverage was terminated or they become eligible based on
a special enrollment provision. Prescription Drug coverage is automatically extended to retirees and their
dependents who continue coverage under any one of the Medical Plan options. Covered retirees and their
dependents are subject to the same Medical and Prescription benefits as are active employees. Retirees and
their dependents eligible for Medicare benefits are not eligible to remain in the Local Government Employee
Group Insurance Plan and may apply for the Medicare Supplement plan (The Tennessee Plan).
D E N T A L , V I S I O N A N D L O N G T E R M C A R E B E N E F I T S
Dental, vision and long term care benefits for retirees and their dependents are fully paid by the retirees, as they
are by employees and their dependents. Consequently, these benefits are not considered as other post-
employment benefits for the purposes of GASB Statement No. 45.
S U R V I V O R S H I P B E N E F I T S
The surviving dependents of a retiree may stay in the plan at no cost for up to six months. Afterwards, the
surviving dependents are eligible to continue coverage under the Local Government Employee Group Plan
subject to payments of the applicable premiums. The surviving dependents must continue to meet eligibility
requirements to remain enrolled in the plan.

Gabriel Roeder Smith & Company Local Government Employee Group OPEB for YE 6/30/2016 |
D-3
R E T I R E E C O N T R I B U T I O N S F O R M E D I C A L / P R E S C R I P T I O N C O V E R A G E
In order to begin and maintain retiree Medical/Prescription coverage, premium contributions are required from
the retiree. For dependent coverage, the retiree is required to pay a premium as well. If any required amounts
are not paid timely, the coverage for the retiree and/or the dependent(s) will cease. Annual plan premium
increases impact the amount of contributions required for retiree and dependent coverage.
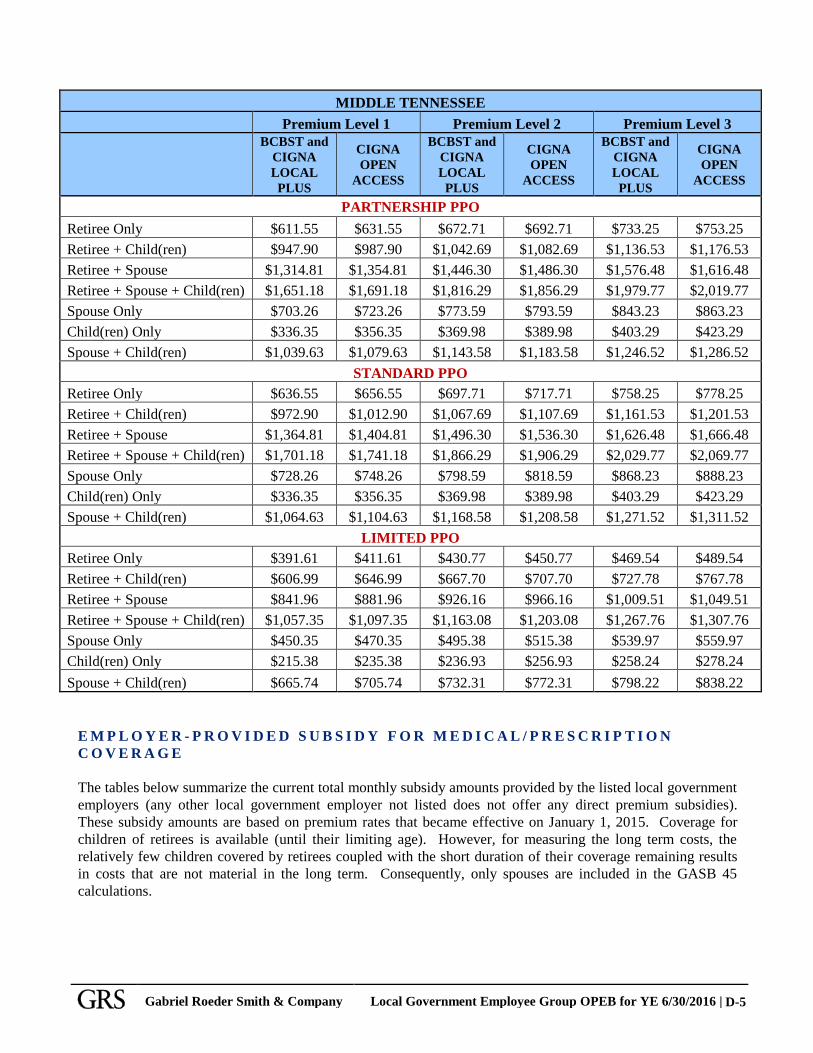
The chart below summarizes the current total monthly contribution amounts required from retirees and their
dependents to maintain medical/prescription coverage. These rates went into effect on January 1, 2015.
Coverage for children of retirees is available (until their limiting age). However, for measuring the long term
costs, the relatively few children covered by retirees coupled with the short duration of their coverage
remaining results in costs that are not material in the long term. Consequently, only spouses are included in the
Valuation.
EAST TENNESSEE
Premium Level 1 Premium Level 2 Premium Level 3
BCBST CIGNA BCBST CIGNA BCBST CIGNA
PARTNERSHIP PPO
Retiree Only $611.55 $631.55 $672.71 $692.71 $733.25 $753.25
Retiree + Child(ren) $947.90 $987.90 $1,042.69 $1,082.69 $1,136.53 $1,176.53
Retiree + Spouse $1,314.81 $1,354.81 $1,446.30 $1,486.30 $1,576.48 $1,616.48
Retiree + Spouse + Child(ren) $1,651.18 $1,691.18 $1,816.29 $1,856.29 $1,979.77 $2,019.77
Spouse Only $703.26 $723.26 $773.59 $793.59 $843.23 $863.23
Child(ren) Only $336.35 $356.35 $369.98 $389.98 $403.29 $423.29
Spouse + Child(ren) $1,039.63 $1,079.63 $1,143.58 $1,183.58 $1,246.52 $1,286.52
STANDARD PPO
Retiree Only $636.55 $656.55 $697.71 $717.71 $758.25 $778.25
Retiree + Child(ren) $972.90 $1,012.90 $1,067.69 $1,107.69 $1,161.53 $1,201.53
Retiree + Spouse $1,364.81 $1,404.81 $1,496.30 $1,536.30 $1,626.48 $1,666.48
Retiree + Spouse + Child(ren) $1,701.18 $1,741.18 $1,866.29 $1,906.29 $2,029.77 $2,069.77
Spouse Only $728.26 $748.26 $798.59 $818.59 $868.23 $888.23
Child(ren) Only $336.35 $356.35 $369.98 $389.98 $403.29 $423.29
Spouse + Child(ren) $1,064.63 $1,104.63 $1,168.58 $1,208.58 $1,271.52 $1,311.52
LIMITED PPO
Retiree Only $391.61 $411.61 $430.77 $450.77 $469.54 $489.54
Retiree + Child(ren) $606.99 $646.99 $667.70 $707.70 $727.78 $767.78
Retiree + Spouse $841.96 $881.96 $926.16 $966.16 $1,009.51 $1,049.51
Retiree + Spouse + Child(ren) $1,057.35 $1,097.35 $1,163.08 $1,203.08 $1,267.76 $1,307.76
Spouse Only $450.35 $470.35 $495.38 $515.38 $539.97 $559.97
Child(ren) Only $215.38 $235.38 $236.93 $256.93 $258.24 $278.24
Spouse + Child(ren) $665.74 $705.74 $732.31 $772.31 $798.22 $838.22

Gabriel Roeder Smith & Company Local Government Employee Group OPEB for YE 6/30/2016 |
D-4
WEST TENNESSEE
Premium Level 1 Premium Level 2 Premium Level 3
BCBST CIGNA BCBST CIGNA BCBST CIGNA
PARTNERSHIP PPO
Retiree Only $631.55 $611.55 $692.71 $672.71 $753.25 $733.25
Retiree + Child(ren) $987.90 $947.90 $1,082.69 $1,042.69 $1,176.53 $1,136.53
Retiree + Spouse $1,354.81 $1,314.81 $1,486.30 $1,446.30 $1,616.48 $1,576.48
Retiree + Spouse + Child(ren) $1,691.18 $1,651.18 $1,856.29 $1,816.29 $2,019.77 $1,979.77
Spouse Only $723.26 $703.26 $793.59 $773.59 $863.23 $843.23
Child(ren) Only $356.35 $336.35 $389.98 $369.98 $423.29 $403.29
Spouse + Child(ren) $1,079.63 $1,039.63 $1,183.58 $1,143.58 $1,286.52 $1,246.52
STANDARD PPO
Retiree Only $656.55 $636.55 $717.71 $697.71 $778.25 $758.25
Retiree + Child(ren) $1,012.90 $972.90 $1,107.69 $1,067.69 $1,201.53 $1,161.53
Retiree + Spouse $1,404.81 $1,364.81 $1,536.30 $1,496.30 $1,666.48 $1,626.48
Retiree + Spouse + Child(ren) $1,741.18 $1,701.18 $1,906.29 $1,866.29 $2,069.77 $2,029.77
Spouse Only $748.26 $728.26 $818.59 $798.59 $888.23 $868.23
Child(ren) Only $356.35 $336.35 $389.98 $369.98 $423.29 $403.29
Spouse + Child(ren) $1,104.63 $1,064.63 $1,208.58 $1,168.58 $1,311.52 $1,271.52
LIMITED PPO
Retiree Only $411.61 $391.61 $450.77 $430.77 $489.54 $469.54
Retiree + Child(ren) $646.99 $606.99 $707.70 $667.70 $767.78 $727.78
Retiree + Spouse $881.96 $841.96 $966.16 $926.16 $1,049.51 $1,009.51
Retiree + Spouse + Child(ren) $1,097.35 $1,057.35 $1,203.08 $1,163.08 $1,307.76 $1,267.76
Spouse Only $470.35 $450.35 $515.38 $495.38 $559.97 $539.97
Child(ren) Only $235.38 $215.38 $256.93 $236.93 $278.24 $258.24
Spouse + Child(ren) $705.74 $665.74 $772.31 $732.31 $838.22 $798.22
Gabriel Roeder Smith & Company Local Government Employee Group OPEB for YE 6/30/2016 |
D-5
MIDDLE TENNESSEE
Premium Level 1 Premium Level 2 Premium Level 3
BCBST and
CIGNA
LOCAL
PLUS
CIGNA
OPEN
ACCESS
BCBST and
CIGNA
LOCAL
PLUS
CIGNA
OPEN
ACCESS
BCBST and
CIGNA
LOCAL
PLUS
CIGNA
OPEN
ACCESS
PARTNERSHIP PPO
Retiree Only $611.55 $631.55 $672.71 $692.71 $733.25 $753.25
Retiree + Child(ren) $947.90 $987.90 $1,042.69 $1,082.69 $1,136.53 $1,176.53
Retiree + Spouse $1,314.81 $1,354.81 $1,446.30 $1,486.30 $1,576.48 $1,616.48
Retiree + Spouse + Child(ren) $1,651.18 $1,691.18 $1,816.29 $1,856.29 $1,979.77 $2,019.77
Spouse Only $703.26 $723.26 $773.59 $793.59 $843.23 $863.23
Child(ren) Only $336.35 $356.35 $369.98 $389.98 $403.29 $423.29
Spouse + Child(ren) $1,039.63 $1,079.63 $1,143.58 $1,183.58 $1,246.52 $1,286.52
STANDARD PPO
Retiree Only $636.55 $656.55 $697.71 $717.71 $758.25 $778.25
Retiree + Child(ren) $972.90 $1,012.90 $1,067.69 $1,107.69 $1,161.53 $1,201.53
Retiree + Spouse $1,364.81 $1,404.81 $1,496.30 $1,536.30 $1,626.48 $1,666.48
Retiree + Spouse + Child(ren) $1,701.18 $1,741.18 $1,866.29 $1,906.29 $2,029.77 $2,069.77
Spouse Only $728.26 $748.26 $798.59 $818.59 $868.23 $888.23
Child(ren) Only $336.35 $356.35 $369.98 $389.98 $403.29 $423.29
Spouse + Child(ren) $1,064.63 $1,104.63 $1,168.58 $1,208.58 $1,271.52 $1,311.52
LIMITED PPO
Retiree Only $391.61 $411.61 $430.77 $450.77 $469.54 $489.54
Retiree + Child(ren) $606.99 $646.99 $667.70 $707.70 $727.78 $767.78
Retiree + Spouse $841.96 $881.96 $926.16 $966.16 $1,009.51 $1,049.51
Retiree + Spouse + Child(ren) $1,057.35 $1,097.35 $1,163.08 $1,203.08 $1,267.76 $1,307.76
Spouse Only $450.35 $470.35 $495.38 $515.38 $539.97 $559.97
Child(ren) Only $215.38 $235.38 $236.93 $256.93 $258.24 $278.24
Spouse + Child(ren) $665.74 $705.74 $732.31 $772.31 $798.22 $838.22
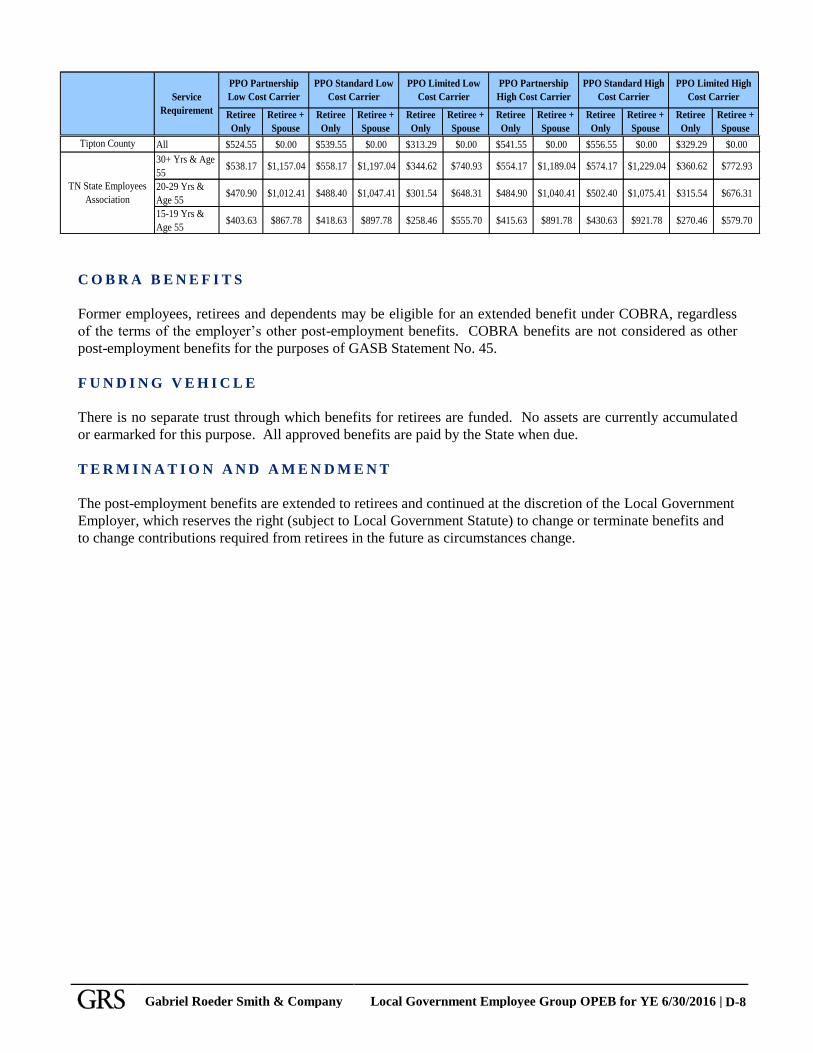
E M P L O Y E R - P R O V I D E D S U B S I D Y F O R M E D I C A L / P R E S C R I P T I O N
C O V E R A G E
The tables below summarize the current total monthly subsidy amounts provided by the listed local government
employers (any other local government employer not listed does not offer any direct premium subsidies).
These subsidy amounts are based on premium rates that became effective on January 1, 2015. Coverage for
children of retirees is available (until their limiting age). However, for measuring the long term costs, the
relatively few children covered by retirees coupled with the short duration of their coverage remaining results
in costs that are not material in the long term. Consequently, only spouses are included in the GASB 45
calculations.

Gabriel Roeder Smith & Company Local Government Employee Group OPEB for YE 6/30/2016 |
D-6
Retiree
Only
Retiree +
Spouse
Retiree
Only
Retiree +
Spouse
Retiree
Only
Retiree +
Spouse
Retiree
Only
Retiree +
Spouse
Retiree
Only
Retiree +
Spouse
Retiree
Only
Retiree +
Spouse
PPO Limited High
Cost CarrierService
Requirement
PPO Partnership
Low Cost Carrier
PPO Partnership
High Cost Carrier
PPO Standard Low
Cost Carrier
PPO Limited Low
Cost Carrier
PPO Standard High
Cost Carrier
35+ Yrs $611.55 $963.18 $0.00 $0.00 $0.00 $0.00 $0.00 $0.00 $0.00 $0.00 $0.00 $0.00
30+Yrs & Age
60$611.55 $963.18 $0.00 $0.00 $0.00 $0.00 $0.00 $0.00 $0.00 $0.00 $0.00 $0.00
10+ Yrs & Age
60$611.55 $963.18 $0.00 $0.00 $0.00 $0.00 $0.00 $0.00 $0.00 $0.00 $0.00 $0.00
35+ Yrs & Age
55-65$440.32 $946.66 $458.32 $982.66 $281.96 $606.21 $454.72 $975.46 $472.72 $1,011.46 $296.36 $635.01
30-34 Yrs &
Age 55-65$409.74 $880.92 $426.49 $914.42 $262.38 $564.11 $423.14 $907.72 $439.89 $941.22 $275.78 $590.91
25-29 Yrs &
Age 55-65$379.16 $815.18 $394.66 $846.18 $242.80 $522.02 $391.56 $839.98 $407.06 $870.98 $255.20 $546.82
<25 Yrs & Age
55$348.58 $749.44 $362.83 $777.94 $223.22 $479.92 $359.98 $772.24 $374.23 $800.74 $234.62 $502.72
Cagle-Fredonia Utility
District
1+ Yr & Age
55$0.00 $0.00 $0.00 $0.00 $375.63 $0.00 $0.00 $0.00 $0.00 $0.00 $0.00 $0.00
Caryville Jacksboro
Utility
20+ Yrs & Age
60$0.00 $0.00 $0.00 $0.00 $0.00 $0.00 $641.34 $0.00 $0.00 $0.00 $0.00 $0.00
20+ Yrs & Age
55$611.55 $611.55 $636.55 $636.55 $0.00 $0.00 $0.00 $0.00 $0.00 $0.00 $0.00 $0.00
Crockett Co. Public
Utility District
25+ Yrs & Age
55 $607.55 $1,304.81 $631.55 $1,354.81 $386.61 $831.96 $627.55 $1,344.81 $651.55 $1,394.81 $406.61 $871.96
20+Yrs & Age
62-65$611.55 $611.55 $636.55 $636.55 $391.61 $391.61 $631.55 $631.55 $656.55 $656.55 $411.61 $411.61
15-19 Yrs &
Age 62-65$489.24 $489.24 $509.24 $509.24 $313.29 $313.29 $505.24 $505.24 $525.24 $525.24 $329.29 $329.29
10-14 Yrs &
Age 62-65$366.93 $366.93 $381.93 $381.93 $234.97 $234.97 $378.93 $378.93 $393.93 $393.93 $246.97 $246.97
30+ Yrs & Age
60 $611.55 $1,314.81 $636.55 $1,364.81 $0.00 $0.00 $631.55 $1,354.81 $656.55 $1,404.81 $0.00 $0.00
20-29 Yrs &
Age 60$407.70 $875.54 $424.36 $909.88 $0.00 $0.00 $421.04 $903.20 $437.70 $936.54 $0.00 $0.00
15-19 Yrs &
Age 60$203.85 $438.27 $212.18 $454.94 $0.00 $0.00 $210.52 $451.60 $218.85 $468.27 $0.00 $0.00
First Utility District of
Hawkins CountyAll $611.55 $1,314.81 $0.00 $0.00 $0.00 $0.00 $0.00 $0.00 $0.00 $0.00 $0.00 $0.00
Franklin County15+ Yrs & Age
65 or 30+ Yrs$550.40 $550.40 $550.40 $550.40 $0.00 $0.00 $550.40 $550.40 $550.40 $550.40 $0.00 $0.00
30 + Yrs & Age
59.5 & 3 Yrs in
Ins Plan
$435.57 $435.57 $454.33 $454.33 $278.93 $278.93 $450.58 $450.58 $469.33 $469.33 $293.93 $293.93
25-29 Yrs &
Age 62 & 1 Yr
in Ins Plan
$290.39 $290.39 $302.89 $302.89 $185.95 $185.95 $300.39 $300.39 $312.89 $312.89 $195.95 $195.95
20-24 Yrs &
Age 62 & 1 Yr
in Ins Plan
$145.19 $145.19 $151.44 $151.44 $92.98 $92.98 $150.19 $150.19 $156.44 $156.44 $97.98 $97.98
Franklin County
Highway15+ Yrs & Age
65 or 30+ Yrs$550.40 $550.40 $550.40 $550.40 $0.00 $0.00 $550.40 $550.40 $550.40 $550.40 $0.00 $0.00
30+ Yrs $611.55 $0.00 $636.55 $0.00 $0.00 $0.00 $631.55 $0.00 $656.55 $0.00 $0.00 $0.00
10+ Yrs & Age
59$611.55 $0.00 $636.55 $0.00 $0.00 $0.00 $631.55 $0.00 $656.55 $0.00 $0.00 $0.00
25+ Yrs, DOH
before
7/12/2015
$498.20 $666.67 $518.57 $666.67 $319.03 $666.67 $514.49 $666.67 $534.85 $666.67 $335.31 $666.67
25+ Yrs, DOH
after 7/12/2015$489.59 $489.59 $489.59 $489.59 $319.03 $489.59 $489.59 $489.59 $489.59 $489.59 $335.31 $489.59
Alpha-Talbot Utility
District
Belle Meade, City of
Dandridge, Town of
Eastside Utility District
Franklin County Adult
Activity Center
Humboldt, City of
Johnson
Clarksville Housing
Authority

Gabriel Roeder Smith & Company Local Government Employee Group OPEB for YE 6/30/2016 |
D-7
Retiree
Only
Retiree +
Spouse
Retiree
Only
Retiree +
Spouse
Retiree
Only
Retiree +
Spouse
Retiree
Only
Retiree +
Spouse
Retiree
Only
Retiree +
Spouse
Retiree
Only
Retiree +
Spouse
PPO Limited High
Cost CarrierService
Requirement
PPO Partnership
Low Cost Carrier
PPO Partnership
High Cost Carrier
PPO Standard Low
Cost Carrier
PPO Limited Low
Cost Carrier
PPO Standard High
Cost Carrier
Vested & Age
60 & Until
Medicare
Eligible
premium
less $100
premium
less $100
premium
less $100
premium
less $100
premium
less $100
premium
less $100
premium
less $100
premium
less $100
premium
less $100
premium
less $100
premium
less $100
premium
less $100
30+ Yrs &
Until Medicare
Eligible
premium
less $100
premium
less $100
premium
less $100
premium
less $100
premium
less $100
premium
less $100
premium
less $100
premium
less $100
premium
less $100
premium
less $100
premium
less $100
premium
less $100
Lawrenceburg Housing
Authority
10+ Yrs & Age
62$611.55 $611.55 $611.55 $611.55 $391.61 $391.61 $611.55 $611.55 $611.55 $611.55 $391.61 $391.61
Lewis County Highway
Dept30+ Yrs $305.78 $305.78 $318.28 $318.28 $195.81 $195.81 $315.78 $315.78 $328.28 $328.28 $205.81 $205.81
Lexington Electric
System
10+ Yrs & Age
60, Until Age
65
$611.55 $1,354.81 $656.55 $1,404.81 $411.61 $881.96 $753.25 $1,314.81 $636.55 $1,364.81 $391.61 $841.96
Murfreesboro Electric
Department
All, 90% of
retiree, 90% of
retiree spouse
for 5 years,
Until Age 65
when Eligible
for Medicare
$605.44 $1,301.67 $627.94 $1,346.67 $387.69 $833.54 $623.44 $1,337.67 $645.94 $1,382.67 $405.69 $869.54
Oak Ridge, City ofAll, Maximum
of 7 years$305.78 $657.41 $318.28 $682.41 $195.81 $420.98 $315.78 $677.41 $328.28 $702.41 $205.81 $440.98
Professional Care
Services of West TN
15+ Yrs & Age
55$332.86 $332.86 $332.86 $332.86 $332.86 $332.86 $332.86 $332.86 $332.86 $332.86 $332.86 $332.86
Roane County All $580.97 $932.60 $604.72 $968.85 $372.03 $597.21 $599.97 $961.60 $623.72 $997.85 $391.03 $626.21
20+ Yrs & Age
62, Until Age
65
$391.61 $391.61 $391.61 $391.61 $391.61 $391.61 $411.61 $411.61 $411.61 $411.61 $411.61 $411.61
15-19 Yrs &
Age 62, Until
Age 65
$293.71 $293.71 $293.71 $293.71 $293.71 $293.71 $308.71 $308.71 $308.71 $308.71 $308.71 $308.71
10-14 Yrs &
Age 62, Until
Age 65
$195.81 $195.81 $195.81 $195.81 $195.81 $195.81 $205.81 $205.81 $205.81 $205.81 $205.81 $205.81
5-9 Yrs & Age
62, Until Age
65
$97.90 $97.90 $97.90 $97.90 $97.90 $97.90 $102.90 $102.90 $102.90 $102.90 $102.90 $102.90
15+ Yrs & Age
60, Until Age
65
$733.25 $1,576.48 $758.25 $1,626.48 $469.54 $1,009.51 $753.25 $1,616.48 $778.25 $1,666.48 $489.54 $1,049.51
15 Yrs, Until
Age 65$733.25 $733.25 $758.25 $758.25 $469.54 $469.54 $753.25 $753.25 $778.25 $778.25 $489.54 $489.54
14 Yrs, Until
Age 65 $718.59 $718.59 $743.09 $743.09 $460.15 $460.15 $738.19 $738.19 $762.69 $762.69 $479.75 $479.75
13 Yrs, Until
Age 65 $703.92 $703.92 $727.92 $727.92 $450.76 $450.76 $723.12 $723.12 $747.12 $747.12 $469.96 $469.96
12 Yrs, Until
Age 65 $689.26 $689.26 $712.76 $712.76 $441.37 $441.37 $708.06 $708.06 $731.56 $731.56 $460.17 $460.17
11 Yrs, Until
Age 65 $674.59 $674.59 $697.59 $697.59 $431.98 $431.98 $692.99 $692.99 $715.99 $715.99 $450.38 $450.38
10 Yrs, Until
Age 65$659.93 $659.93 $682.43 $682.43 $422.59 $422.59 $677.93 $677.93 $700.43 $700.43 $440.59 $440.59
Lawrence County 911
Savannah, City of
(Emergency, Firemen
& Police Officers only)
Tennessee Education
Association
Gabriel Roeder Smith & Company Local Government Employee Group OPEB for YE 6/30/2016 |
D-8
Retiree
Only
Retiree +
Spouse
Retiree
Only
Retiree +
Spouse
Retiree
Only
Retiree +
Spouse
Retiree
Only
Retiree +
Spouse
Retiree
Only
Retiree +
Spouse
Retiree
Only
Retiree +
Spouse
PPO Limited High
Cost CarrierService
Requirement
PPO Partnership
Low Cost Carrier
PPO Partnership
High Cost Carrier
PPO Standard Low
Cost Carrier
PPO Limited Low
Cost Carrier
PPO Standard High
Cost Carrier
Tipton County All $524.55 $0.00 $539.55 $0.00 $313.29 $0.00 $541.55 $0.00 $556.55 $0.00 $329.29 $0.00
30+ Yrs & Age
55$538.17 $1,157.04 $558.17 $1,197.04 $344.62 $740.93 $554.17 $1,189.04 $574.17 $1,229.04 $360.62 $772.93
20-29 Yrs &
Age 55$470.90 $1,012.41 $488.40 $1,047.41 $301.54 $648.31 $484.90 $1,040.41 $502.40 $1,075.41 $315.54 $676.31
15-19 Yrs &
Age 55$403.63 $867.78 $418.63 $897.78 $258.46 $555.70 $415.63 $891.78 $430.63 $921.78 $270.46 $579.70
TN State Employees
Association
C O B R A B E N E F I T S
Former employees, retirees and dependents may be eligible for an extended benefit under COBRA, regardless
of the terms of the employer’s other post-employment benefits. COBRA benefits are not considered as other
post-employment benefits for the purposes of GASB Statement No. 45.
F U N D I N G V E H I C L E
There is no separate trust through which benefits for retirees are funded. No assets are currently accumulated
or earmarked for this purpose. All approved benefits are paid by the State when due.
T E R M I N A T I O N A N D A M E N D M E N T
The post-employment benefits are extended to retirees and continued at the discretion of the Local Government
Employer, which reserves the right (subject to Local Government Statute) to change or terminate benefits and
to change contributions required from retirees in the future as circumstances change.
SECTION F
REQUIRED ACTUARIAL INFORMATION (GASB 45)

Gabriel Roeder Smith & Company Local Government Employee Group OPEB for YE 6/30/2016| F-1
Reporting Year 2016 2015 2014
Actuarial cost method
Projected Unit
Credit
Projected Unit
Credit
Projected Unit
Credit
Amortization method Level % closed Level % closed Level % closed
Asset valuation method Unfunded Unfunded Unfunded
Actuarial assumptions:
Investment rate of return * 3.75% 4.00% 4.00%
Projected salary increases * N/A N/A N/A
Payroll growth assumptions 3.0% 3.0% 3.0%
Initial Per Capita Cost trend rate 6.50% 7.50% 7.50%
Second Year Per Capita Cost trend rate 6.00% 7.00% 7.00%
Third Year Per Capita Cost trend rate 5.75% 6.50% 6.50%
Ultimate Per Capita Cost trend rate 4.675%** 4.69% 4.69%
Years to Ultimate rate 35 30 30
* Includes general price inflation at 2.5% 2.5% 2.5%
** Includes an additional 0.33% trend representing our estimate of the ultimate effect of the Federal Excise Tax.
Required Actuarial Information
(GASB STATEMENT NO. 45)

APPENDIX
RESULTS BY EMPLOYER
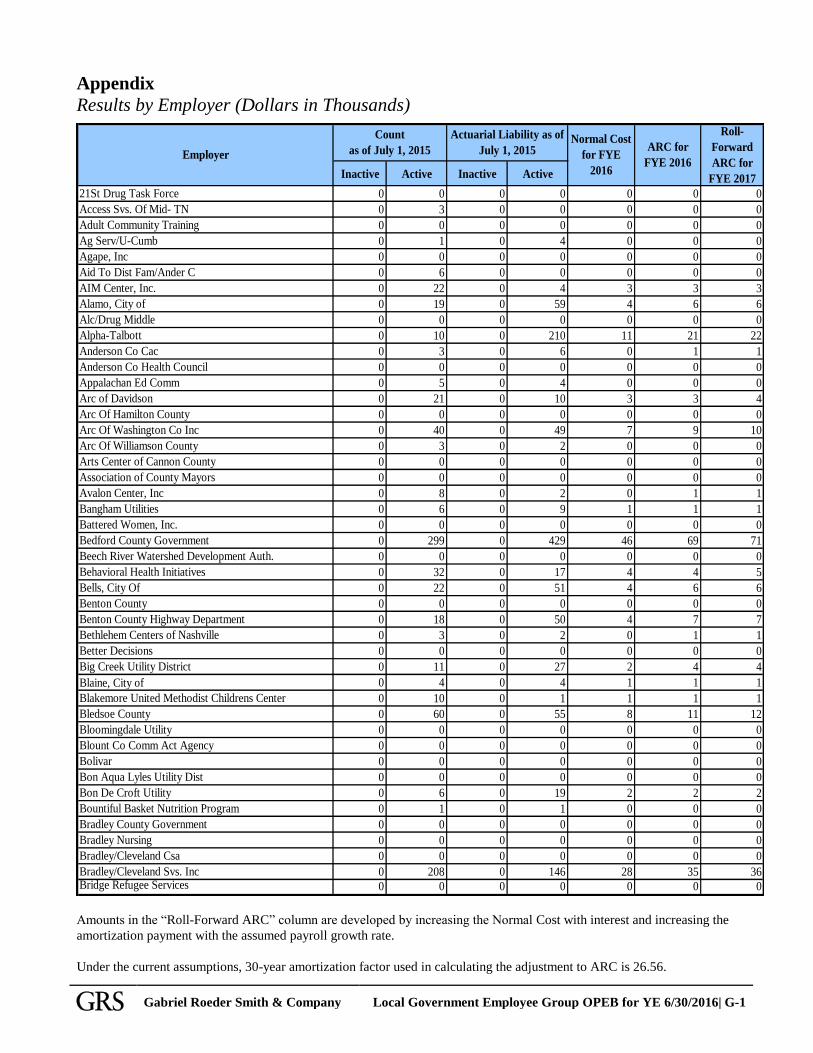
Gabriel Roeder Smith & Company Local Government Employee Group OPEB for YE 6/30/2016| G-1
Appendix
Results by Employer (Dollars in Thousands)
Inactive Active Inactive Active
21St Drug Task Force 0 0 0 0 0 0 0
Access Svs. Of Mid- TN 0 3 0 0 0 0 0
Adult Community Training 0 0 0 0 0 0 0
Ag Serv/U-Cumb 0 1 0 4 0 0 0
Agape, Inc 0 0 0 0 0 0 0
Aid To Dist Fam/Ander C 0 6 0 0 0 0 0
AIM Center, Inc. 0 22 0 4 3 3 3
Alamo, City of 0 19 0 59 4 6 6
Alc/Drug Middle 0 0 0 0 0 0 0
Alpha-Talbott 0 10 0 210 11 21 22
Anderson Co Cac 0 3 0 6 0 1 1
Anderson Co Health Council 0 0 0 0 0 0 0
Appalachan Ed Comm 0 5 0 4 0 0 0
Arc of Davidson 0 21 0 10 3 3 4
Arc Of Hamilton County 0 0 0 0 0 0 0
Arc Of Washington Co Inc 0 40 0 49 7 9 10
Arc Of Williamson County 0 3 0 2 0 0 0
Arts Center of Cannon County 0 0 0 0 0 0 0
Association of County Mayors 0 0 0 0 0 0 0
Avalon Center, Inc 0 8 0 2 0 1 1
Bangham Utilities 0 6 0 9 1 1 1
Battered Women, Inc. 0 0 0 0 0 0 0
Bedford County Government 0 299 0 429 46 69 71
Beech River Watershed Development Auth. 0 0 0 0 0 0 0
Behavioral Health Initiatives 0 32 0 17 4 4 5
Bells, City Of 0 22 0 51 4 6 6
Benton County 0 0 0 0 0 0 0
Benton County Highway Department 0 18 0 50 4 7 7
Bethlehem Centers of Nashville 0 3 0 2 0 1 1
Better Decisions 0 0 0 0 0 0 0
Big Creek Utility District 0 11 0 27 2 4 4
Blaine, City of 0 4 0 4 1 1 1
Blakemore United Methodist Childrens Center 0 10 0 1 1 1 1
Bledsoe County 0 60 0 55 8 11 12
Bloomingdale Utility 0 0 0 0 0 0 0
Blount Co Comm Act Agency 0 0 0 0 0 0 0
Bolivar 0 0 0 0 0 0 0
Bon Aqua Lyles Utility Dist 0 0 0 0 0 0 0
Bon De Croft Utility 0 6 0 19 2 2 2
Bountiful Basket Nutrition Program 0 1 0 1 0 0 0
Bradley County Government 0 0 0 0 0 0 0
Bradley Nursing 0 0 0 0 0 0 0
Bradley/Cleveland Csa 0 0 0 0 0 0 0
Bradley/Cleveland Svs. Inc 0 208 0 146 28 35 36Bridge Refugee Services 0 0 0 0 0 0 0
Employer
Normal Cost
for FYE
2016
ARC for
FYE 2016
Count
as of July 1, 2015
Actuarial Liability as of
July 1, 2015
Roll-
Forward
ARC for
FYE 2017
Amounts in the “Roll-Forward ARC” column are developed by increasing the Normal Cost with interest and increasing the
amortization payment with the assumed payroll growth rate.
Under the current assumptions, 30-year amortization factor used in calculating the adjustment to ARC is 26.56.
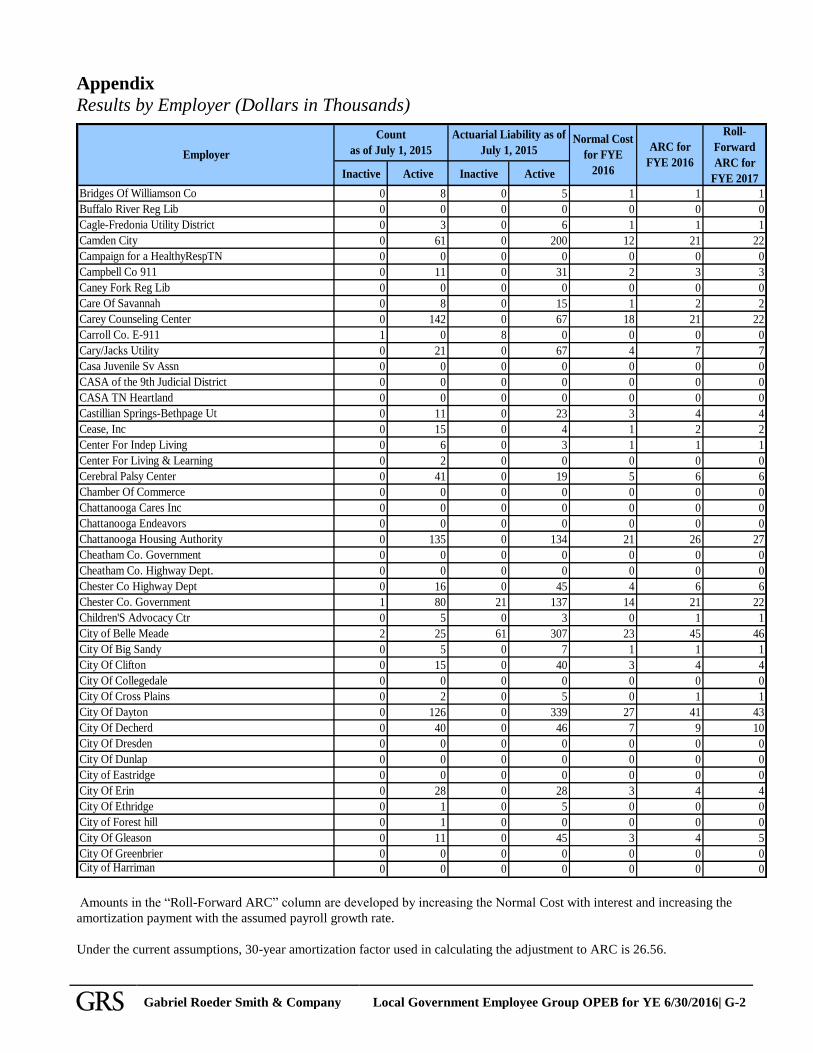
Gabriel Roeder Smith & Company Local Government Employee Group OPEB for YE 6/30/2016| G-2
Appendix
Results by Employer (Dollars in Thousands)
Inactive Active Inactive Active
Bridges Of Williamson Co 0 8 0 5 1 1 1
Buffalo River Reg Lib 0 0 0 0 0 0 0
Cagle-Fredonia Utility District 0 3 0 6 1 1 1
Camden City 0 61 0 200 12 21 22
Campaign for a HealthyRespTN 0 0 0 0 0 0 0
Campbell Co 911 0 11 0 31 2 3 3
Caney Fork Reg Lib 0 0 0 0 0 0 0
Care Of Savannah 0 8 0 15 1 2 2
Carey Counseling Center 0 142 0 67 18 21 22
Carroll Co. E-911 1 0 8 0 0 0 0
Cary/Jacks Utility 0 21 0 67 4 7 7
Casa Juvenile Sv Assn 0 0 0 0 0 0 0
CASA of the 9th Judicial District 0 0 0 0 0 0 0
CASA TN Heartland 0 0 0 0 0 0 0
Castillian Springs-Bethpage Ut 0 11 0 23 3 4 4
Cease, Inc 0 15 0 4 1 2 2
Center For Indep Living 0 6 0 3 1 1 1
Center For Living & Learning 0 2 0 0 0 0 0
Cerebral Palsy Center 0 41 0 19 5 6 6
Chamber Of Commerce 0 0 0 0 0 0 0
Chattanooga Cares Inc 0 0 0 0 0 0 0
Chattanooga Endeavors 0 0 0 0 0 0 0
Chattanooga Housing Authority 0 135 0 134 21 26 27
Cheatham Co. Government 0 0 0 0 0 0 0
Cheatham Co. Highway Dept. 0 0 0 0 0 0 0
Chester Co Highway Dept 0 16 0 45 4 6 6
Chester Co. Government 1 80 21 137 14 21 22
Children'S Advocacy Ctr 0 5 0 3 0 1 1
City of Belle Meade 2 25 61 307 23 45 46
City Of Big Sandy 0 5 0 7 1 1 1
City Of Clifton 0 15 0 40 3 4 4
City Of Collegedale 0 0 0 0 0 0 0
City Of Cross Plains 0 2 0 5 0 1 1
City Of Dayton 0 126 0 339 27 41 43
City Of Decherd 0 40 0 46 7 9 10
City Of Dresden 0 0 0 0 0 0 0
City Of Dunlap 0 0 0 0 0 0 0
City of Eastridge 0 0 0 0 0 0 0
City Of Erin 0 28 0 28 3 4 4
City Of Ethridge 0 1 0 5 0 0 0
City of Forest hill 0 1 0 0 0 0 0
City Of Gleason 0 11 0 45 3 4 5
City Of Greenbrier 0 0 0 0 0 0 0City of Harriman 0 0 0 0 0 0 0
Employer
Normal Cost
for FYE
2016
ARC for
FYE 2016
Count
as of July 1, 2015
Actuarial Liability as of
July 1, 2015
Roll-
Forward
ARC for
FYE 2017
Amounts in the “Roll-Forward ARC” column are developed by increasing the Normal Cost with interest and increasing the
amortization payment with the assumed payroll growth rate.
Under the current assumptions, 30-year amortization factor used in calculating the adjustment to ARC is 26.56.
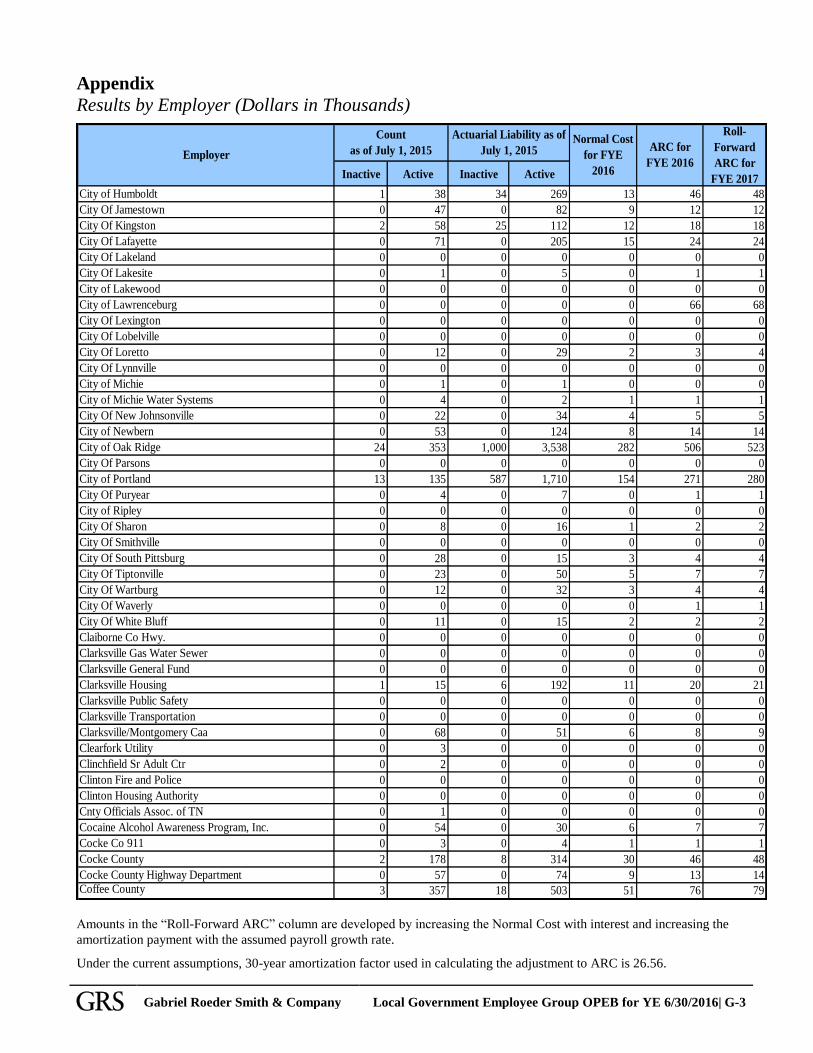
Gabriel Roeder Smith & Company Local Government Employee Group OPEB for YE 6/30/2016| G-3
Appendix
Results by Employer (Dollars in Thousands)
Inactive Active Inactive Active
City of Humboldt 1 38 34 269 13 46 48
City Of Jamestown 0 47 0 82 9 12 12
City Of Kingston 2 58 25 112 12 18 18
City Of Lafayette 0 71 0 205 15 24 24
City Of Lakeland 0 0 0 0 0 0 0
City Of Lakesite 0 1 0 5 0 1 1
City of Lakewood 0 0 0 0 0 0 0
City of Lawrenceburg 0 0 0 0 0 66 68
City Of Lexington 0 0 0 0 0 0 0
City Of Lobelville 0 0 0 0 0 0 0
City Of Loretto 0 12 0 29 2 3 4
City Of Lynnville 0 0 0 0 0 0 0
City of Michie 0 1 0 1 0 0 0
City of Michie Water Systems 0 4 0 2 1 1 1
City Of New Johnsonville 0 22 0 34 4 5 5
City of Newbern 0 53 0 124 8 14 14
City of Oak Ridge 24 353 1,000 3,538 282 506 523
City Of Parsons 0 0 0 0 0 0 0
City of Portland 13 135 587 1,710 154 271 280
City Of Puryear 0 4 0 7 0 1 1
City of Ripley 0 0 0 0 0 0 0
City Of Sharon 0 8 0 16 1 2 2
City Of Smithville 0 0 0 0 0 0 0
City Of South Pittsburg 0 28 0 15 3 4 4
City Of Tiptonville 0 23 0 50 5 7 7
City Of Wartburg 0 12 0 32 3 4 4
City Of Waverly 0 0 0 0 0 1 1
City Of White Bluff 0 11 0 15 2 2 2
Claiborne Co Hwy. 0 0 0 0 0 0 0
Clarksville Gas Water Sewer 0 0 0 0 0 0 0
Clarksville General Fund 0 0 0 0 0 0 0
Clarksville Housing 1 15 6 192 11 20 21
Clarksville Public Safety 0 0 0 0 0 0 0
Clarksville Transportation 0 0 0 0 0 0 0
Clarksville/Montgomery Caa 0 68 0 51 6 8 9
Clearfork Utility 0 3 0 0 0 0 0
Clinchfield Sr Adult Ctr 0 2 0 0 0 0 0
Clinton Fire and Police 0 0 0 0 0 0 0
Clinton Housing Authority 0 0 0 0 0 0 0
Cnty Officials Assoc. of TN 0 1 0 0 0 0 0
Cocaine Alcohol Awareness Program, Inc. 0 54 0 30 6 7 7
Cocke Co 911 0 3 0 4 1 1 1
Cocke County 2 178 8 314 30 46 48
Cocke County Highway Department 0 57 0 74 9 13 14Coffee County 3 357 18 503 51 76 79
Employer
Normal Cost
for FYE
2016
ARC for
FYE 2016
Actuarial Liability as of
July 1, 2015
Roll-
Forward
ARC for
FYE 2017
Count
as of July 1, 2015
Amounts in the “Roll-Forward ARC” column are developed by increasing the Normal Cost with interest and increasing the
amortization payment with the assumed payroll growth rate.
Under the current assumptions, 30-year amortization factor used in calculating the adjustment to ARC is 26.56.

Gabriel Roeder Smith & Company Local Government Employee Group OPEB for YE 6/30/2016| G-4
Appendix
Results by Employer (Dollars in Thousands)
Inactive Active Inactive Active
Community Anti-Drug Coalition 0 0 0 0 0 0 0
Community Development Ctr 0 24 0 9 1 2 2
Community Foundation Of Middle TN 0 33 0 15 5 5 5
Community Hlth 0 0 0 0 0 0 0
Community Network Svs. 0 0 0 0 0 0 0
Comprehensive Care Center 0 0 0 0 0 0 0
Cookville Boat Dock utility 0 6 0 1 1 1 1
Cordell Hull Utility District 0 5 0 2 1 1 1
Core Services of Northeast Tennessee 0 105 0 8 14 14 14
Cornerstone 0 32 0 43 4 6 6
County Wide Utility District 0 0 0 0 0 0 0
Court Appointed Spec. Advoc. 0 11 0 2 1 1 1
Crab Orchard Utility Dist 0 19 0 35 4 5 6
Crisis Intervention 0 0 0 0 0 0 0
Crockett County Government 0 89 0 104 9 15 16
Crockett County Highway 0 22 0 41 4 7 7
Crockett Public Utility 0 7 0 62 6 9 9
Cumberland Comm Options 0 15 0 17 2 3 3
Cumberland County 2 345 33 740 64 100 103
Cumberland Heights 0 0 0 0 0 0 0
Cumberland Utility Dist 0 13 0 43 3 4 5
Cunningham Utility 0 7 0 14 1 2 2
Dandridge, Town of 0 38 0 174 13 21 21
Decatur County Government 0 90 0 67 10 14 14
Decatur County Highway Department 0 14 0 35 3 4 4
Dekalb County 0 93 0 121 15 21 21
Dekalb County 911 0 7 0 8 1 1 1
Dewhite Utility 0 6 0 9 1 2 2
Dickson Electric System 0 0 0 0 0 7 8
Disability Resource Center 0 6 0 4 1 1 1
Dismas, Inc. 0 4 0 0 1 1 1
Downtown Ministries 0 50 0 22 7 8 9
Dyersburg Housing Authority 0 14 0 14 3 4 4
East TN Cha 0 0 0 0 0 0 0
East TN Development Dist 0 15 0 30 3 4 5
East TN Foundation 0 0 0 0 0 0 0
Easter Seals of TN 0 142 0 35 10 11 12
Eastside Util Dist 2 26 110 419 21 51 53
Elkton, City of 0 0 0 0 0 0 0
Erin Housing Authority 0 3 0 4 1 1 1
Estill Springs 0 18 0 36 3 5 5
Fairview Utility 0 7 0 16 1 2 2
Fayette County 911 0 1 0 3 0 0 0
Fayette County Government 3 177 23 295 31 46 48Fayette County Public Works Dept. 0 40 0 98 7 12 13
Employer
Normal Cost
for FYE
2016
ARC for
FYE 2016
Count
as of July 1, 2015
Actuarial Liability as of
July 1, 2015
Roll-
Forward
ARC for
FYE 2017
Amounts in the “Roll-Forward ARC” column are developed by increasing the Normal Cost with interest and increasing the
amortization payment with the assumed payroll growth rate.
Under the current assumptions, 30-year amortization factor used in calculating the adjustment to ARC is 26.56.

Gabriel Roeder Smith & Company Local Government Employee Group OPEB for YE 6/30/2016| G-5
Appendix
Results by Employer (Dollars in Thousands)
Inactive Active Inactive Active
Fayetteville Housing Authority 0 10 0 50 2 4 4
Fayetteville Li 0 0 0 0 0 0 0
Fentress Co. Government 0 155 0 162 18 26 27
Fentress County Emergency Communications 0 10 0 10 1 2 2
First Utility District of Hardin County 0 13 0 10 2 2 3
First Utility District of Hawkins Co 3 22 209 915 70 128 132
First Utlity Dist Of Tipton Co 0 13 0 24 2 3 3
Forked Deer Reg Lib 0 0 0 0 0 0 0
Former Insurance Participant 0 0 0 0 0 0 0
Four Lake Regional Ind Dev Aut 0 0 0 0 0 0 0
Franklin Co Adult Activity Ctr 0 61 0 77 8 11 12
Franklin Co Government 1 193 27 1,255 81 148 153
Franklin Co Industrial Dev Bd 0 0 0 0 0 0 0
Franklin Co. Hwy. Dept. 0 20 0 256 14 25 26
Franklin County Consolidated Housing Authority 0 10 0 42 3 4 4
Friendship City 0 5 0 9 1 1 1
Ft Loudon Reg Lib 0 0 0 0 0 0 0
Gainesboro, Town of 0 14 0 22 3 4 4
Gallatin Housing Authority 0 0 0 0 0 0 0
Galloway, City of 0 0 0 0 0 0 0
Gibson Co Mun Water Dist 0 19 0 5 1 1 1
Giles Co E-911 0 11 0 15 2 3 3
Giles County 5 218 63 368 33 54 56
Gladeville Utility Dist 0 24 0 87 5 9 9
Good Neighbor Mission & Crisis 0 1 0 1 0 0 0
Goodlettsville Board Members 0 0 0 0 0 0 0
Goodlettsville, City of 0 0 0 0 0 0 0
Goodwill-Knox 0 299 0 55 17 20 20
Gorham MacBane Library 0 5 0 2 0 1 1
Great Nashville Regional Council 0 0 0 0 0 0 0
Greeneville Fire and Police 0 0 0 0 0 0 0
Greeneville Water Comm 0 0 0 0 0 0 0
Greeneville, Town of 0 0 0 0 0 0 0
Grundy County Government 1 28 8 16 1 3 3
Grundy County Highway 0 17 0 42 3 5 5
Grundy Emergency Med Svs. 0 0 0 0 0 0 0
Grundy Housing Authority 0 4 0 5 1 1 1
Habitation and Training Services 0 68 0 27 7 8 9
Hamblen Co Courthouse 0 0 0 0 0 0 0
Hamblen County Board Members 0 0 0 0 0 0 0
Hamblen County Garbage Collectors 0 0 0 0 0 0 0
Hamblen County Highway Commish 0 0 0 0 0 0 0
Hamblen County Highway Dept 0 0 0 0 0 0 0
Hamblen County Public Safety 0 0 0 0 0 0 0Hamilton Co 911 0 0 0 0 0 0 0
Employer
Normal Cost
for FYE
2016
ARC for
FYE 2016
Count
as of July 1, 2015
Actuarial Liability as of
July 1, 2015
Roll-
Forward
ARC for
FYE 2017
Amounts in the “Roll-Forward ARC” column are developed by increasing the Normal Cost with interest and increasing the
amortization payment with the assumed payroll growth rate.
Under the current assumptions, 30-year amortization factor used in calculating the adjustment to ARC is 26.56.

Gabriel Roeder Smith & Company Local Government Employee Group OPEB for YE 6/30/2016| G-6
Appendix
Results by Employer (Dollars in Thousands)
Inactive Active Inactive Active
Hancock County Gov 0 134 0 51 11 13 13
Hardeman-Fayette Utility 0 12 0 12 1 2 2
Hardin Co Skills 0 16 0 14 1 2 2
Hardin County 911 0 10 0 13 2 3 3
Hardin County Government 1 156 3 282 28 41 43
Harpeth Valley Utilities Distr 0 0 0 0 0 0 0
Hartsville/Trousdale County Government 2 116 7 233 20 31 32
Hartsville/Trousdale Water and Sewer Utility District 0 0 0 0 0 0 0
Hatchie River Reg Lib 0 0 0 0 0 0 0
Hawkins County 0 0 0 0 0 0 0
Haywood Co Gen. 0 0 0 0 0 0 0
Health Information Partnership of Tennessee 0 0 0 0 0 0 0
Henderson City 1 55 19 143 13 19 20
Henderson County Government 0 183 0 126 15 21 22
Henderson County Highway 0 28 0 44 5 7 8
Henry County Highway Department 0 0 0 0 0 0 0
Hickman County 0 0 0 0 0 0 0
Hickman County Highway 0 0 0 0 0 0 0
Highland Rim Economic Corp 0 57 0 51 8 10 10
Hixson Util Dst 0 27 0 49 5 8 8
Hohenwald Housing Authority 0 7 0 18 1 2 2
Homeplace, Inc 0 0 0 0 0 0 0
Homesafe Of Sumner, Wilson, 0 12 0 0 0 1 1
Hope Of East Tennessee 0 12 0 4 2 2 2
Houston County Highway Department 0 24 0 0 3 3 3
Humboldt Housing Auth 0 7 0 10 1 2 2
Humboldt Utilities- Elec Co 0 0 0 0 0 0 0
Humboldt Utilities- Gas and Water 0 0 0 0 0 0 0
Humphreys County 0 0 0 0 0 0 0
Humphrey'S County 911 0 12 0 8 1 1 2
Humphrey'S County Highway 0 0 0 0 0 0 0
Impact Center, Inc. 0 84 0 66 11 14 15
Industrial Dev Brd of Blount Co, Alcoa, & Maryville 0 15 0 7 2 2 3
Jackson Alcohol/Drug 0 43 0 28 4 6 6
Jackson Ctr. Ind. Living 0 6 0 6 0 1 1
James Developmental Ctr 0 0 0 0 0 0 0
Jefferson City 0 0 0 0 0 0 0
Jefferson City Housing 0 8 0 24 1 2 2
Jefferson City Public Safety 0 0 0 0 0 0 0
Jefferson Co. 911 0 16 0 23 3 4 4
Jefferson County 5 467 61 912 84 128 133
Johnson County 4 136 83 605 62 100 103
Jubilee Community Arts 0 1 0 2 0 0 0
Kings Daughter Day Home 0 11 0 0 0 0 0Kingsport Housing Auth 0 0 0 0 0 0 0
Employer
Normal Cost
for FYE
2016
ARC for
FYE 2016
Count
as of July 1, 2015
Actuarial Liability as of
July 1, 2015
Roll-
Forward
ARC for
FYE 2017
Amounts in the “Roll-Forward ARC” column are developed by increasing the Normal Cost with interest and increasing the
amortization payment with the assumed payroll growth rate.
Under the current assumptions, 30-year amortization factor used in calculating the adjustment to ARC is 26.56.
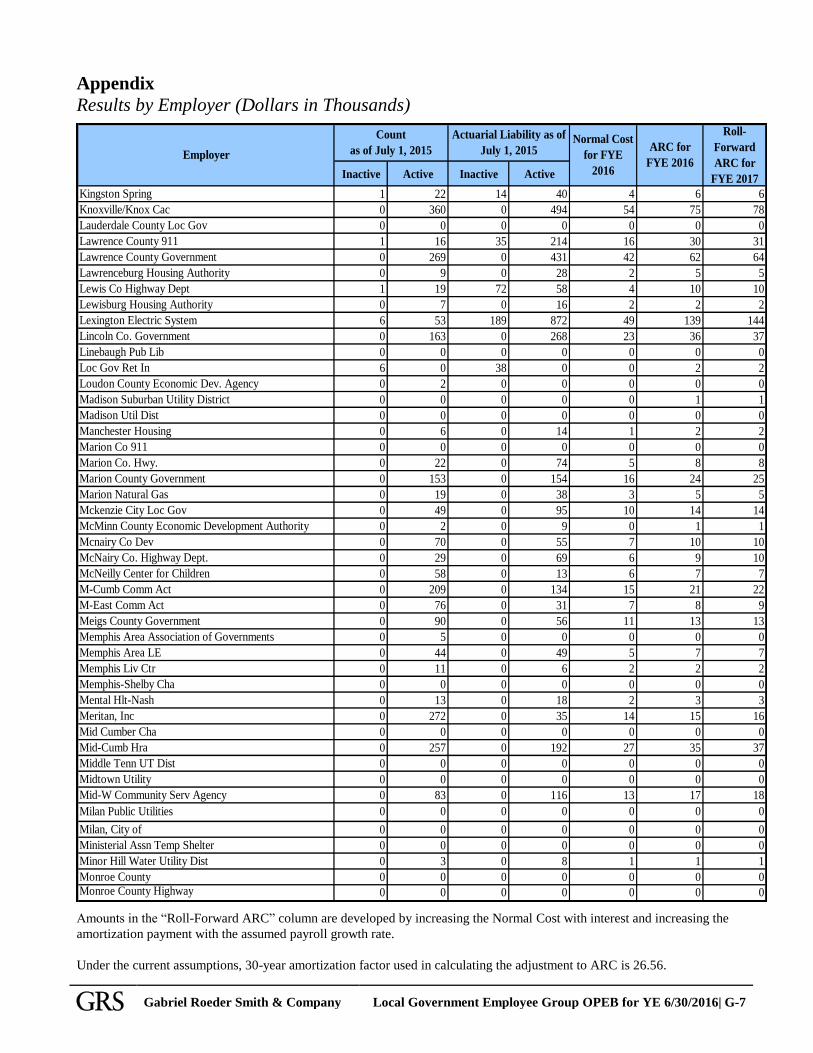
Gabriel Roeder Smith & Company Local Government Employee Group OPEB for YE 6/30/2016| G-7
Appendix
Results by Employer (Dollars in Thousands)
Inactive Active Inactive Active
Kingston Spring 1 22 14 40 4 6 6
Knoxville/Knox Cac 0 360 0 494 54 75 78
Lauderdale County Loc Gov 0 0 0 0 0 0 0
Lawrence County 911 1 16 35 214 16 30 31
Lawrence County Government 0 269 0 431 42 62 64
Lawrenceburg Housing Authority 0 9 0 28 2 5 5
Lewis Co Highway Dept 1 19 72 58 4 10 10
Lewisburg Housing Authority 0 7 0 16 2 2 2
Lexington Electric System 6 53 189 872 49 139 144
Lincoln Co. Government 0 163 0 268 23 36 37
Linebaugh Pub Lib 0 0 0 0 0 0 0
Loc Gov Ret In 6 0 38 0 0 2 2
Loudon County Economic Dev. Agency 0 2 0 0 0 0 0
Madison Suburban Utility District 0 0 0 0 0 1 1
Madison Util Dist 0 0 0 0 0 0 0
Manchester Housing 0 6 0 14 1 2 2
Marion Co 911 0 0 0 0 0 0 0
Marion Co. Hwy. 0 22 0 74 5 8 8
Marion County Government 0 153 0 154 16 24 25
Marion Natural Gas 0 19 0 38 3 5 5
Mckenzie City Loc Gov 0 49 0 95 10 14 14
McMinn County Economic Development Authority 0 2 0 9 0 1 1
Mcnairy Co Dev 0 70 0 55 7 10 10
McNairy Co. Highway Dept. 0 29 0 69 6 9 10
McNeilly Center for Children 0 58 0 13 6 7 7
M-Cumb Comm Act 0 209 0 134 15 21 22
M-East Comm Act 0 76 0 31 7 8 9
Meigs County Government 0 90 0 56 11 13 13
Memphis Area Association of Governments 0 5 0 0 0 0 0
Memphis Area LE 0 44 0 49 5 7 7
Memphis Liv Ctr 0 11 0 6 2 2 2
Memphis-Shelby Cha 0 0 0 0 0 0 0
Mental Hlt-Nash 0 13 0 18 2 3 3
Meritan, Inc 0 272 0 35 14 15 16
Mid Cumber Cha 0 0 0 0 0 0 0
Mid-Cumb Hra 0 257 0 192 27 35 37
Middle Tenn UT Dist 0 0 0 0 0 0 0
Midtown Utility 0 0 0 0 0 0 0
Mid-W Community Serv Agency 0 83 0 116 13 17 18
Milan Public Utilities 0 0 0 0 0 0 0
Milan, City of 0 0 0 0 0 0 0
Ministerial Assn Temp Shelter 0 0 0 0 0 0 0
Minor Hill Water Utility Dist 0 3 0 8 1 1 1
Monroe County 0 0 0 0 0 0 0Monroe County Highway 0 0 0 0 0 0 0
Employer
Normal Cost
for FYE
2016
ARC for
FYE 2016
Count
as of July 1, 2015
Actuarial Liability as of
July 1, 2015
Roll-
Forward
ARC for
FYE 2017
Amounts in the “Roll-Forward ARC” column are developed by increasing the Normal Cost with interest and increasing the
amortization payment with the assumed payroll growth rate.
Under the current assumptions, 30-year amortization factor used in calculating the adjustment to ARC is 26.56.

Gabriel Roeder Smith & Company Local Government Employee Group OPEB for YE 6/30/2016| G-8
Appendix
Results by Employer (Dollars in Thousands)
Inactive Active Inactive Active
MS Crockett Pud 0 0 0 0 0 0 0
Mt Carmel Hawk 0 0 0 0 0 0 0
Murfreesboro Electric Department 2 85 77 2,188 168 295 305
My Friend's House Family and Children Services, Inc. 0 6 0 1 0 0 0
N.Utility Of Dec/Ben Co 0 0 0 0 0 0 0
NAMI Davidson County 0 1 0 0 0 0 0
Nami Tennessee 0 6 0 7 1 1 1
Nashville Cares1 0 71 0 77 12 15 15
Nashville Cares2 0 13 0 6 3 3 3
Nat'L Assn. Of Social Workers 0 2 0 2 0 0 0
Nat'L Hlthcare For Homeless 0 18 0 8 2 2 2
Natural Gas Acquisition Co Clarksville 0 0 0 0 0 0 0
Ne Henry Utility 0 7 0 7 0 1 1
New Directions 0 0 0 0 0 0 0
New Horizons Corp 0 149 0 65 11 15 15
New Market Utility 0 0 0 0 0 0 0
Nolichucky Reg Lib 0 0 0 0 0 0 0
Non-TCRS Retire MS 1 0 11 0 0 0 0
Non-TCRS Retirees 3 0 12 0 0 1 1
Norris 0 0 0 0 0 0 0
Norris Fire and Police 0 0 0 0 0 0 0
North Utility District of Rhea County 0 1 0 1 0 0 0
North Overton Utility District 0 5 0 2 0 0 0
Northeast Comm Svs. Agency 0 0 0 0 0 0 0
Northwest Comm Health Agency 0 0 0 0 0 0 0
Northwest Safeline 0 0 0 0 0 0 0
Northwest TN Head Start 0 234 0 121 13 19 20
Nw Dyersburg Util 0 2 0 5 0 1 1
Nw TN Econ Dev 0 20 0 35 3 4 5
Oak Hill, City of 0 1 0 0 0 0 0
Oak Ridge Housing Authority 0 8 0 10 1 2 2
Obion County Government 0 4 0 7 0 1 1
Obion River Reg Lib 0 0 0 0 0 0 0
Old Hickory Utl Dist. 0 0 0 0 0 0 0
Old Knoxville Hwy Water Dist 0 0 0 0 0 0 0
Orange Grove Center, Inc 0 741 0 155 60 66 68
Overton County 1 158 16 161 14 27 28
Overton County 911 0 0 0 0 0 0 0
Overton County Highway Department 0 31 0 51 6 8 8
Overton County Nursing Home 0 154 0 73 10 13 14
Pathfinders 0 0 0 0 0 0 0
Perry Co. Hwy. 0 18 0 52 4 6 6
Perry County Officials 0 41 0 10 0 1 1
PerryCounty Medical CenterInc. 0 34 0 34 5 7 7Prevent Child Abuse TN 0 38 0 23 5 6 6
Employer
Normal Cost
for FYE
2016
ARC for
FYE 2016
Count
as of July 1, 2015
Actuarial Liability as of
July 1, 2015
Roll-
Forward
ARC for
FYE 2017
Amounts in the “Roll-Forward ARC” column are developed by increasing the Normal Cost with interest and increasing the
amortization payment with the assumed payroll growth rate.
Under the current assumptions, 30-year amortization factor used in calculating the adjustment to ARC is 26.56.
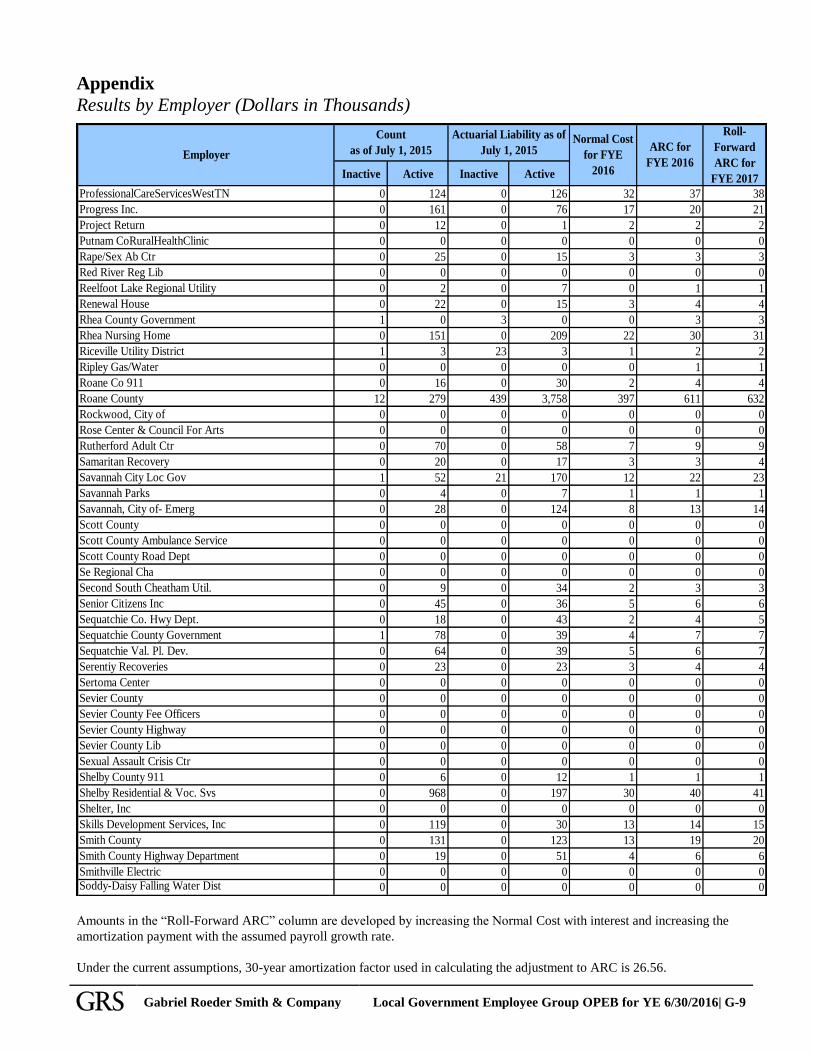
Gabriel Roeder Smith & Company Local Government Employee Group OPEB for YE 6/30/2016| G-9
Appendix
Results by Employer (Dollars in Thousands)
Inactive Active Inactive Active
ProfessionalCareServicesWestTN 0 124 0 126 32 37 38
Progress Inc. 0 161 0 76 17 20 21
Project Return 0 12 0 1 2 2 2
Putnam CoRuralHealthClinic 0 0 0 0 0 0 0
Rape/Sex Ab Ctr 0 25 0 15 3 3 3
Red River Reg Lib 0 0 0 0 0 0 0
Reelfoot Lake Regional Utility 0 2 0 7 0 1 1
Renewal House 0 22 0 15 3 4 4
Rhea County Government 1 0 3 0 0 3 3
Rhea Nursing Home 0 151 0 209 22 30 31
Riceville Utility District 1 3 23 3 1 2 2
Ripley Gas/Water 0 0 0 0 0 1 1
Roane Co 911 0 16 0 30 2 4 4
Roane County 12 279 439 3,758 397 611 632
Rockwood, City of 0 0 0 0 0 0 0
Rose Center & Council For Arts 0 0 0 0 0 0 0
Rutherford Adult Ctr 0 70 0 58 7 9 9
Samaritan Recovery 0 20 0 17 3 3 4
Savannah City Loc Gov 1 52 21 170 12 22 23
Savannah Parks 0 4 0 7 1 1 1
Savannah, City of- Emerg 0 28 0 124 8 13 14
Scott County 0 0 0 0 0 0 0
Scott County Ambulance Service 0 0 0 0 0 0 0
Scott County Road Dept 0 0 0 0 0 0 0
Se Regional Cha 0 0 0 0 0 0 0
Second South Cheatham Util. 0 9 0 34 2 3 3
Senior Citizens Inc 0 45 0 36 5 6 6
Sequatchie Co. Hwy Dept. 0 18 0 43 2 4 5
Sequatchie County Government 1 78 0 39 4 7 7
Sequatchie Val. Pl. Dev. 0 64 0 39 5 6 7
Serentiy Recoveries 0 23 0 23 3 4 4
Sertoma Center 0 0 0 0 0 0 0
Sevier County 0 0 0 0 0 0 0
Sevier County Fee Officers 0 0 0 0 0 0 0
Sevier County Highway 0 0 0 0 0 0 0
Sevier County Lib 0 0 0 0 0 0 0
Sexual Assault Crisis Ctr 0 0 0 0 0 0 0
Shelby County 911 0 6 0 12 1 1 1
Shelby Residential & Voc. Svs 0 968 0 197 30 40 41
Shelter, Inc 0 0 0 0 0 0 0
Skills Development Services, Inc 0 119 0 30 13 14 15
Smith County 0 131 0 123 13 19 20
Smith County Highway Department 0 19 0 51 4 6 6
Smithville Electric 0 0 0 0 0 0 0Soddy-Daisy Falling Water Dist 0 0 0 0 0 0 0
Employer
Normal Cost
for FYE
2016
ARC for
FYE 2016
Count
as of July 1, 2015
Actuarial Liability as of
July 1, 2015
Roll-
Forward
ARC for
FYE 2017
Amounts in the “Roll-Forward ARC” column are developed by increasing the Normal Cost with interest and increasing the
amortization payment with the assumed payroll growth rate.
Under the current assumptions, 30-year amortization factor used in calculating the adjustment to ARC is 26.56.
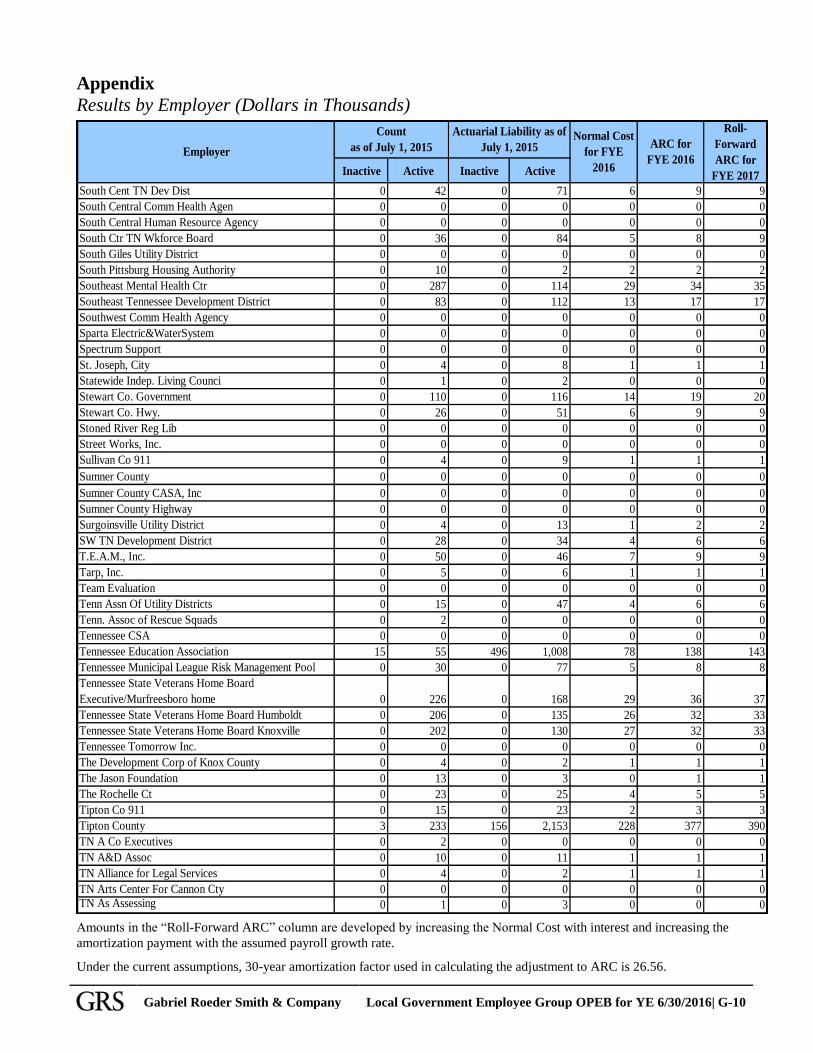
Gabriel Roeder Smith & Company Local Government Employee Group OPEB for YE 6/30/2016| G-10
Appendix
Results by Employer (Dollars in Thousands)
Inactive Active Inactive Active
South Cent TN Dev Dist 0 42 0 71 6 9 9
South Central Comm Health Agen 0 0 0 0 0 0 0
South Central Human Resource Agency 0 0 0 0 0 0 0
South Ctr TN Wkforce Board 0 36 0 84 5 8 9
South Giles Utility District 0 0 0 0 0 0 0
South Pittsburg Housing Authority 0 10 0 2 2 2 2
Southeast Mental Health Ctr 0 287 0 114 29 34 35
Southeast Tennessee Development District 0 83 0 112 13 17 17
Southwest Comm Health Agency 0 0 0 0 0 0 0
Sparta Electric&WaterSystem 0 0 0 0 0 0 0
Spectrum Support 0 0 0 0 0 0 0
St. Joseph, City 0 4 0 8 1 1 1
Statewide Indep. Living Counci 0 1 0 2 0 0 0
Stewart Co. Government 0 110 0 116 14 19 20
Stewart Co. Hwy. 0 26 0 51 6 9 9
Stoned River Reg Lib 0 0 0 0 0 0 0
Street Works, Inc. 0 0 0 0 0 0 0
Sullivan Co 911 0 4 0 9 1 1 1
Sumner County 0 0 0 0 0 0 0
Sumner County CASA, Inc 0 0 0 0 0 0 0
Sumner County Highway 0 0 0 0 0 0 0
Surgoinsville Utility District 0 4 0 13 1 2 2
SW TN Development District 0 28 0 34 4 6 6
T.E.A.M., Inc. 0 50 0 46 7 9 9
Tarp, Inc. 0 5 0 6 1 1 1
Team Evaluation 0 0 0 0 0 0 0
Tenn Assn Of Utility Districts 0 15 0 47 4 6 6
Tenn. Assoc of Rescue Squads 0 2 0 0 0 0 0
Tennessee CSA 0 0 0 0 0 0 0
Tennessee Education Association 15 55 496 1,008 78 138 143
Tennessee Municipal League Risk Management Pool 0 30 0 77 5 8 8
Tennessee State Veterans Home Board
Executive/Murfreesboro home 0 226 0 168 29 36 37
Tennessee State Veterans Home Board Humboldt 0 206 0 135 26 32 33
Tennessee State Veterans Home Board Knoxville 0 202 0 130 27 32 33
Tennessee Tomorrow Inc. 0 0 0 0 0 0 0
The Development Corp of Knox County 0 4 0 2 1 1 1
The Jason Foundation 0 13 0 3 0 1 1
The Rochelle Ct 0 23 0 25 4 5 5
Tipton Co 911 0 15 0 23 2 3 3
Tipton County 3 233 156 2,153 228 377 390
TN A Co Executives 0 2 0 0 0 0 0
TN A&D Assoc 0 10 0 11 1 1 1
TN Alliance for Legal Services 0 4 0 2 1 1 1
TN Arts Center For Cannon Cty 0 0 0 0 0 0 0TN As Assessing 0 1 0 3 0 0 0
Employer
Normal Cost
for FYE
2016
ARC for
FYE 2016
Count
as of July 1, 2015
Actuarial Liability as of
July 1, 2015
Roll-
Forward
ARC for
FYE 2017
Amounts in the “Roll-Forward ARC” column are developed by increasing the Normal Cost with interest and increasing the
amortization payment with the assumed payroll growth rate.
Under the current assumptions, 30-year amortization factor used in calculating the adjustment to ARC is 26.56.

Gabriel Roeder Smith & Company Local Government Employee Group OPEB for YE 6/30/2016| G-11
Appendix
Results by Employer (Dollars in Thousands)
Inactive Active Inactive Active
TN Assn Of Craft Artists 0 4 0 1 0 0 0
TN Bus Enterprises 0 102 0 187 11 20 21
TN Center For Nursing 0 0 0 0 0 0 0
TN Ch/Childrens Advocacy Ctr. 0 0 0 0 0 0 0
TN Co Hwy Officials Asn 0 1 0 0 0 0 0
TN Co Serv Assn 0 2 0 7 0 1 1
TN County Commissioners Assn. 0 0 0 0 0 0 0
TN Health Care Ca 0 0 0 0 0 0 0
TN Hist Society 0 1 0 1 0 0 0
TN Mental Health C.A. 0 0 0 0 0 0 0
TN Municipal Bond Fund 1 4 13 6 1 1 1
TN Municipal League 0 11 0 21 2 3 3
TN Organization Of Sch Sup. 0 1 0 3 0 0 0
TN Primary Care Association 0 17 0 13 3 3 3
TN School Board Assn 0 6 0 12 1 2 2
TN Sec Sch Ath Assn 0 16 0 41 2 6 6
TN Sports Hall of Fame 0 1 0 0 0 0 0
TN State Employees Assn. 0 18 0 307 18 33 34
TN State Museum 0 2 0 5 0 1 1
TN State Veterans Home - Clarksville 0 8 0 4 1 1 1
TN Technology Development 0 8 0 6 2 2 2
TN Voices For Children 0 69 0 3 2 2 2
Town Of Alamo 0 0 0 0 0 0 0
Town Of Atoka 0 50 0 53 9 12 12
Town Of Atwood 0 1 0 3 0 0 0
Town Of Bruceto 0 12 0 34 2 3 4
Town Of Burns 0 6 0 12 1 1 2
Town Of Carthage 0 40 0 96 9 13 13
Town Of Caryville 0 10 0 19 2 3 3
Town of Centerville 0 0 0 0 0 0 0
Town of Clinton 0 0 0 0 0 0 0
Town Of Coopertown 0 5 0 11 1 1 1
Town Of Decaturville 0 0 0 0 0 0 0
Town Of Dover 0 18 0 40 4 5 6
Town Of Gordonsville 0 13 0 31 2 4 4
Town Of Huntingdon 0 52 0 125 11 17 17
Town Of Jacksboro 0 19 0 31 3 4 4
Town Of Jasper 0 32 0 91 6 10 10
Town Of Kimball 0 17 0 41 3 5 5
Town Of Linden 0 0 0 0 0 0 0
Town of Mason 0 0 0 0 0 0 0
Town Of Monteagle 0 24 0 32 4 6 6
Town Of Mosheim 0 6 0 8 1 1 2
Town of Nolensville 0 24 0 28 5 6 6Town Of Pegram 0 3 0 5 0 1 1
Employer
Normal Cost
for FYE
2016
ARC for
FYE 2016
Roll-
Forward
ARC for
FYE 2017
Count
as of July 1, 2015
Actuarial Liability as of
July 1, 2015
Amounts in the “Roll-Forward ARC” column are developed by increasing the Normal Cost with interest and increasing the
amortization payment with the assumed payroll growth rate.
Under the current assumptions, 30-year amortization factor used in calculating the adjustment to ARC is 26.56.

Gabriel Roeder Smith & Company Local Government Employee Group OPEB for YE 6/30/2016| G-12
Appendix
Results by Employer (Dollars in Thousands)
Inactive Active Inactive Active
Town Of Petersburg 0 3 0 2 0 1 1
Town Of Pleasant View 0 7 0 17 1 2 2
Town Of Powell'S Crossroad 0 0 0 0 0 0 0
Town Of Rossville 0 0 0 0 0 0 0
Town of Rutherford 0 0 0 0 0 0 0
Town Of Scotts Hill 0 8 0 6 0 1 1
Town of Selmer 0 0 0 0 0 0 0
Town of Selmer Retirees 0 0 0 0 0 0 0
Town Of Spring City 0 0 0 0 0 0 0
Town Of Unicoi 0 8 0 3 1 1 1
Town Of Wartrace 0 6 0 7 2 2 2
Town Of Westmoreland 0 20 0 42 4 6 6
Town Of Whiteville 0 0 0 0 0 0 0
Trac, Inc 0 0 0 0 0 0 0
Tracy City Utility 0 10 0 6 1 1 1
Tri-Cities/Sullivan Utility Di 0 11 0 24 2 3 3
Troy, Town Of 0 9 0 19 2 3 3
Tuckaleechee Utility District 0 5 0 3 1 1 1
Tullahoma Housing Authority 0 12 0 30 2 3 4
Tullahoma Utilities Board 0 79 0 232 18 30 31
Union City Electric System 0 0 0 0 0 2 2
Union County EMS 0 0 0 0 0 0 0
Union County General Fund 0 0 0 0 0 0 0
Union County Highway Department 0 0 0 0 0 0 0
Union County Officials 0 0 0 0 0 0 0
United Cerebral Palsy Center 0 0 0 0 0 0 0
United Neighborhood Health Services 0 124 0 39 22 23 24
Upper Cumb Cha 0 0 0 0 0 0 0
Upper Cumb Dev Dist 0 53 0 65 8 11 11
Upper Cumberland Reg Lib 0 0 0 0 0 0 0
Upper East TN Had 0 214 0 274 28 40 41
Urban Housing Solutions 0 39 0 24 4 5 5
Vision Coordination 0 3 0 1 0 0 0
Vital Center, Inc 0 0 0 0 0 0 0
Volunteer Ctr Of Memphis 0 0 0 0 0 0 0
W&M Resource Rape Asst Prog 0 0 0 0 0 0 0
Walden, City Of 0 2 0 3 0 0 0
Warren County 0 249 0 282 26 40 42
Washington County- Johnson City 911 0 0 0 0 0 0 0
Wdvx- Cumberland Comm Corp 0 6 0 6 1 1 1
Weakley Co 911 0 2 0 5 0 1 1
Weakley Co Mun. Electric Sys 0 0 0 0 0 0 0
Weakley County 0 260 0 349 33 51 53
Webb Creek Utility 0 0 0 0 0 0 0West Cumberland Utility 0 0 0 0 0 0 0
Employer
Normal Cost
for FYE
2016
ARC for
FYE 2016
Count
as of July 1, 2015
Actuarial Liability as of
July 1, 2015
Roll-
Forward
ARC for
FYE 2017
Amounts in the “Roll-Forward ARC” column are developed by increasing the Normal Cost with interest and increasing the
amortization payment with the assumed payroll growth rate.
Under the current assumptions, 30-year amortization factor used in calculating the adjustment to ARC is 26.56.

Gabriel Roeder Smith & Company Local Government Employee Group OPEB for YE 6/30/2016| G-13
Appendix
Results by Employer (Dollars in Thousands)
Inactive Active Inactive Active
West Overton Utility 0 4 0 15 1 1 2
West Tenn Legal Services, Inc. 0 28 0 52 4 6 6
West TN Forensic SVS Inc. 0 3 0 2 0 0 0
West TN Regional Art Center 0 1 0 2 0 0 0
West Warren-Viola Utility 0 24 0 3 5 5 5
White House, City of 0 0 0 0 0 0 0
Whitehaven SW Mental Health 0 0 0 0 0 0 0
Whitwell City 0 11 0 10 1 1 1
Williamson Co Child Adv Ctr 0 7 0 4 1 1 1
Williamson County 0 0 0 0 0 0 0
Wilson County MS 0 0 0 0 0 0 0
Winchester City 0 0 0 0 0 0 0
Woodbury 0 0 0 0 0 0 0
Woodbury Housing Authority 0 3 0 0 0 1 1
Workforce Solutions 0 14 0 24 1 2 2
Youth Emergency Shelter 0 0 0 0 0 0 0Total 137 17,865 4,031 38,081 3,760 5,971 6,178
Employer
Normal Cost
for FYE
2016
ARC for
FYE 2016
Count as
of July 1, 2015
Actuarial Liability as of
July 1, 2015
Roll-
Forward
ARC for
FYE 2017
Note: Totals above may differ from other totals in the Report due to rounding.
Amounts in the “Roll-Forward ARC” column are developed by increasing the Normal Cost with interest and
increasing the amortization payment with the assumed payroll growth rate.
Under the current assumptions, 30-year amortization factor used in calculating the adjustment to ARC is 26.56.
Actuarial liability, benefit payments and normal cost results are calculated directly by individual. Unfunded
Actuarial Accrued Liability is amortized for each employer separately recognizing any outstanding amortization
bases for such employers resulting from prior valuations. The actuarial assumptions outlined in the Report were
selected for use for measurement of the obligation for the plan as a whole, rather than based on experience for any
individual employer. Thus, the results shown could be different than a calculation of the actuarial liability
performed separately for a particular employer or component.
Results by employer, as reflects on these pages, are based on data provided by State representatives (including
indicators as to what employer the employees and retirees are associated with as of June 30, 2015 and levels of
direct subsidies provided). We did not audit or validate this census data. Furthermore, while the actuarial
assumptions and methods employed are reasonable for the group as a whole, they may not be reasonable for any
individual employer.