the state of stroke and stroke systems of care in …wcm/@wsa/...the state of stroke and stroke...
TRANSCRIPT

The State of Stroke and Stroke Systems of Care in Washington
September 14, 2017
Learning Objectives
• Understand the burden of stroke and the role of public health, healthcare, EMS, and community services in preventing it and improving outcomes
• Review the Coverdell Stroke Program
• Identify tools and strategies to prevent and improve stroke in your communities
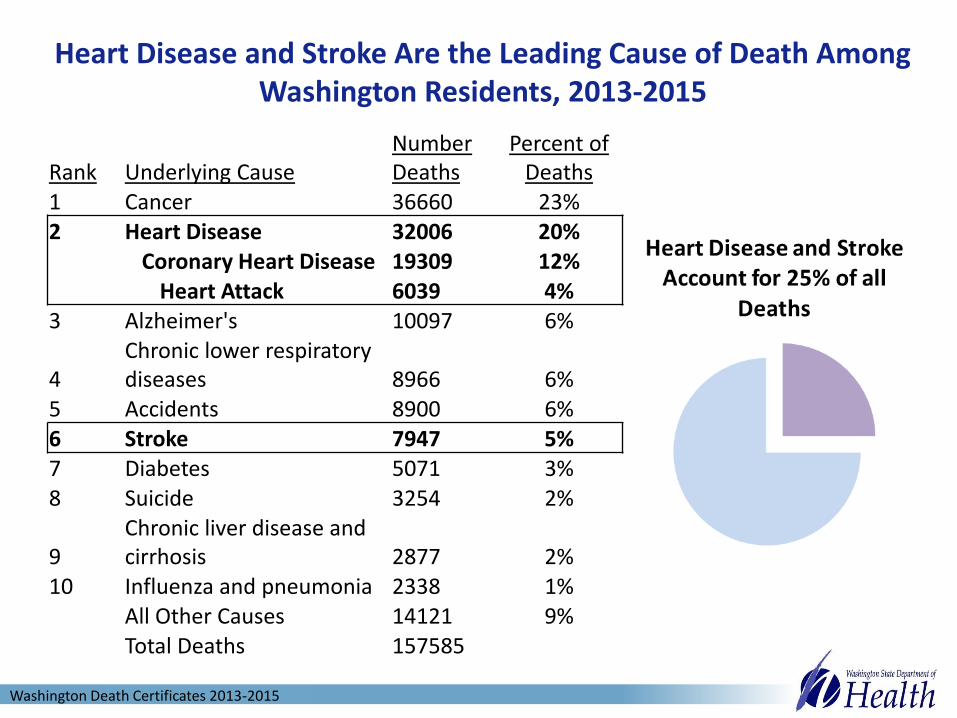
Heart Disease and Stroke Are the Leading Cause of Death Among Washington Residents, 2013-2015
Rank Underlying CauseNumber Deaths
Percent of Deaths
1 Cancer 36660 23%2 Heart Disease 32006 20%
Coronary Heart Disease 19309 12%Heart Attack 6039 4%
3 Alzheimer's 10097 6%
4Chronic lower respiratory diseases 8966 6%
5 Accidents 8900 6%6 Stroke 7947 5%7 Diabetes 5071 3%8 Suicide 3254 2%
9Chronic liver disease and cirrhosis 2877 2%
10 Influenza and pneumonia 2338 1%All Other Causes 14121 9%Total Deaths 157585
Washington Death Certificates 2013-2015

Stroke Deaths Decreasing
43.34
34.4
0
10
20
30
40
50
60
2006 2007 2008 2009 2010 2011 2012 2013 2014 2015
Age
-Ad
ust
ed
Rat
e p
er
10
0,0
00
Washington State Death from Stroke 2006-2015
Washington Death Certificates 2006-2015

Higher Rates of Death For Different RegionsAge-adjusted death rates per 100,000 persons, 2013-2015 combined
*Unstable rates not shown due to small numbers.
Lower than statewide rate Similar to statewide rate High than statewide rate
High Rate
Adams
Pacific
Pierce
Spokane
Stevens
7060
4747
4343
4139
3939
3939
3838
3737
3635
353434
33333332
3231
3029
2928
2726
24
0 50 100 150
AdamsPacific
StevensWhitmanSpokane
OkanoganClallam
GrantLewis
YakimaGrays Harbor
AsotinFranklin
PierceWhatcom
CowlitzSnohomish
Pend OreilleState Total
SkagitIsland
Walla WallaClark
ThurstonKitsapMasonChelan
KingKlickitat
JeffersonBenton
DouglasKittitas
San JuanGarfield *
Ferry*Skamania*Columbia*
Wahkiakum*Lincoln*
Rate
Stroke
Washington Death Certificates 2013-2015

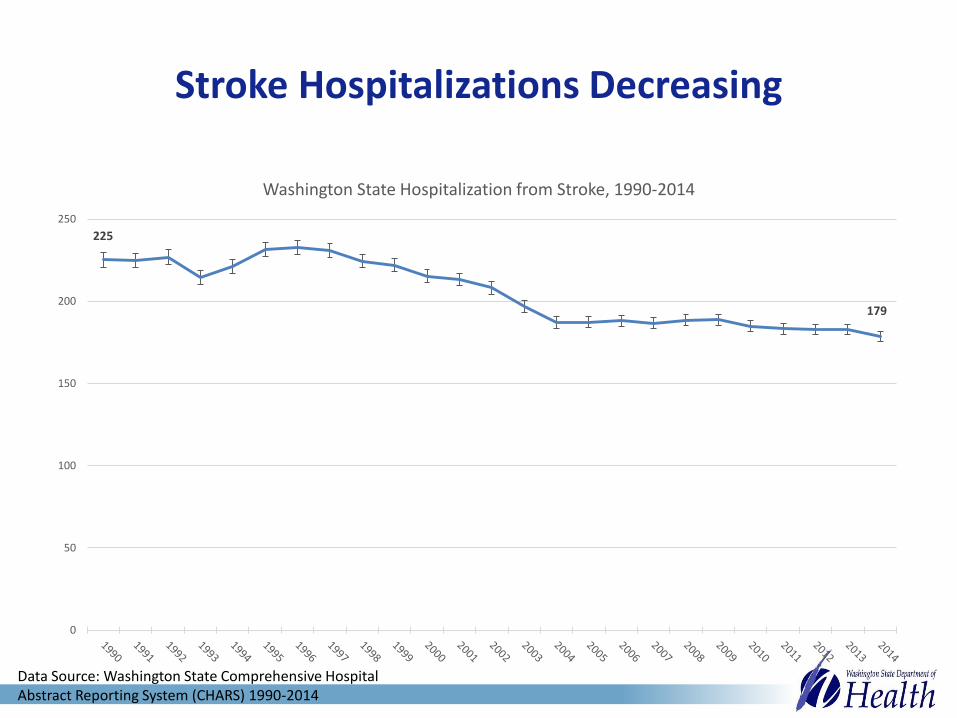
Stroke Hospitalizations Decreasing
225
179
0
50
100
150
200
250
Washington State Hospitalization from Stroke, 1990-2014
Data Source: Washington State Comprehensive Hospital Abstract Reporting System (CHARS) 1990-2014

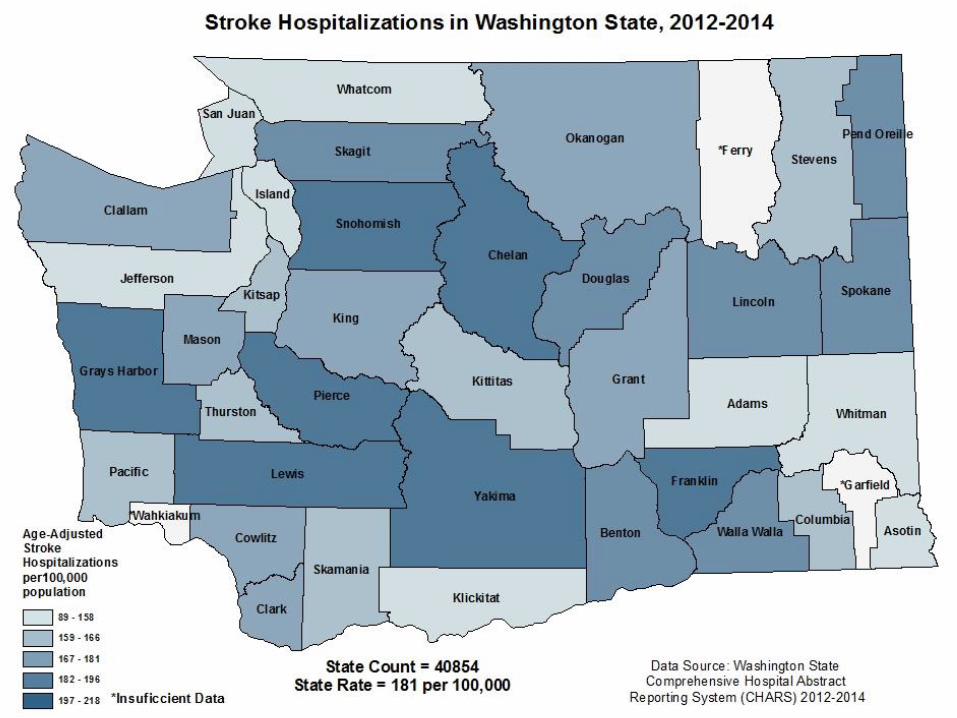
Age-adjusted hospitalization rates per 100,000 persons, 2012-2014 combined
Lower than statewide rate Similar to statewide rate High than statewide rate
High Rates
Benton
Franklin
Grays Harbor
Lewis
Pierce
Snohomish
Spokane
Yakima
Higher Rates of Hospitalizations For Different Regions
218209
205205
204202
198196
196195193191
190186
181181
181180178
173173
169166
165164
164162
159158
158146
142127122
120116
89
0 100 200 300
FranklinGrays Harbor
SnohomishLewis
YakimaPierce
ChelanLincolnBenton
Walla WallaSkagit
DouglasSpokane
Pend OreilleMason
State TotalGrantClark
ClallamCowlitz
KingOkanogan
StevensPacific
ColumbiaThurston
KittitasKitsap
SkamaniaWhatcomJefferson
IslandKlickitatAdams
San JuanWhitman
AsotinGarfield*
Wahkiakum*Ferry*
Rate
Stroke
*Unstable rates not shown due to small numbers.
Washington State Comprehensive Hospital Abstract Reporting System (CHARS) 2012-2014

Higher Rate of Hospitalizations Among Older Adults
Sex-and age-specific hospitalization rates per 100,000 persons,
2012-2014 combined
Heart Attack Stroke
0
3
23
74
150
324
581
1,024
1
10
61
215
416
640
969
1,505
0 500 1000 1500 2000 2500
15-24
25-34
35-44
45-54
55-64
65-74
75-84
85+
Rate per 100,000
Age
Gro
up
Male
Female
7
17
42
114
229
520
1,185
2,113
5
13
44
139
322
696
1,382
2,116
0 500 1000 1500 2000 2500
15-24
25-34
35-44
45-54
55-64
65-74
75-84
85+
Rate per 100,000
Age
Gro
up
Male
Female
Data Source: Washington State Comprehensive Hospital Abstract Reporting System (CHARS) 2012-2014

Washington’s Population is Aging
-
500,000
1,000,000
1,500,000
2,000,000
2,500,000
1980 1985 1990 1995 2000 2005 2010 2015 2020 2025 2030 2035 2040
-
10,000
20,000
30,000
40,000
50,000
60,000
Population Size and Annual Change for ages 65+, 1980-2040 (Real and Forecasted)
Annual Change (left) Population (right)
Forecast
Washington State Office of Financial Management, 2015

Risk Factors for Stroke in Washington
Hypertension
High Cholesterol
Diabetes
Obestiy
0
5
10
15
20
25
30
35
40
Pe
rce
nt
Data Source: Washington State Behavioral Risk Factor
Surveillance System BRFSS, 1990-2014
Methodology changes after 2010 prevent comparison between 2011 and
later to 2010 and earlier.
High Cholesterol and Hypertension asked on odd years, even years are
imputed from surrounding odd years.

Stroke Costs
Stroke Costs Reaching Trillions - Without Action, Financial Cost of Strokes to Reach $2.2 Trillion by 2050
Average cost of stroke hospitalization $20,000 + $17,000 for rehab + $5000 for medications = $42,000
Hospitalizations and nursing home care in WA in 2014 est.
$978.5 million
“Strokes will absolutely strain the healthcare system,” said Bruce Ovbiagele, M.D. Caring for survivors is expensive because stroke can cause long-term disability, he said.

But if We Take Action Now…
“Doing the right thing now ultimately could be cost-saving in the future, but we have a long way to go before all Americans receive adequate stroke prevention and emergency stroke care…If our society is not going to do it for the right reasons, perhaps we can do it because it's going to be obscenely expensive.“
Devin Brown, MD, MS, assistant professor of neurology at the University of Michigan Medical School, 2006 (WebMD)
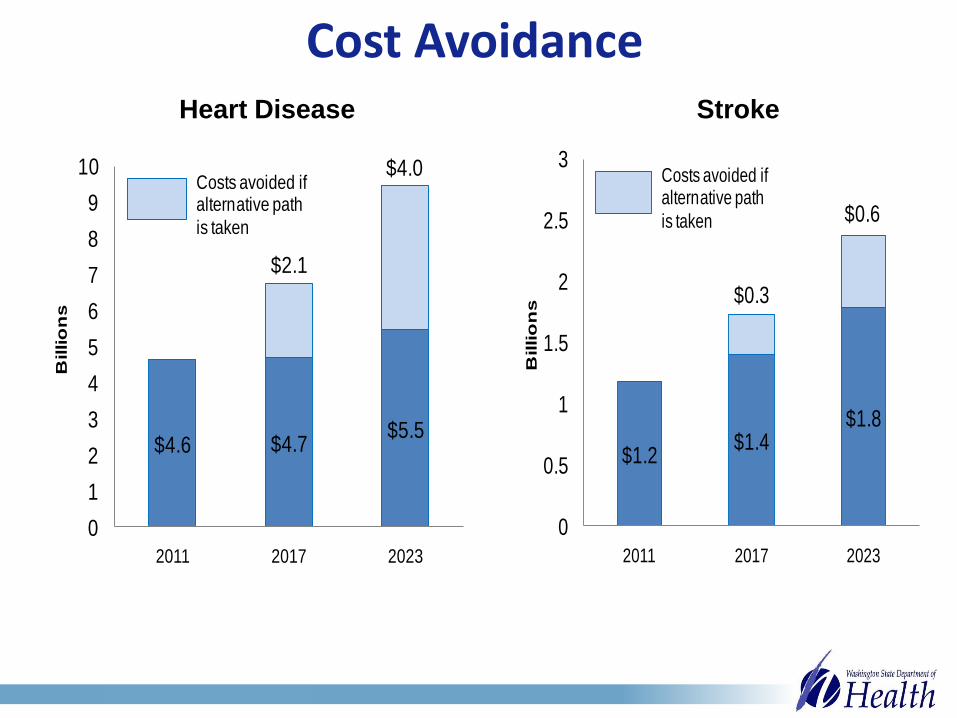
Cost Avoidance
$4.6 $4.7$5.5
$2.1
$4.0
0
1
2
3
4
5
6
7
8
9
10
2011 2017 2023
Billio
ns
Costs avoided if alternative path
is taken
$1.2$1.4
$1.8
$0.3
$0.6
0
0.5
1
1.5
2
2.5
3
2011 2017 2023
Billio
ns
Costs avoided if alternative path
is taken
Heart Disease Stroke

Cost Avoidance
Canada study shows cost of stroke care could be reduced by $682 million with optimal stroke care:
• Rapid assessment and treatment of TIA and stroke
• Thrombolytic therapies
• Stroke units
• Early home-supported discharge

State of Stroke Systems of Care in WA
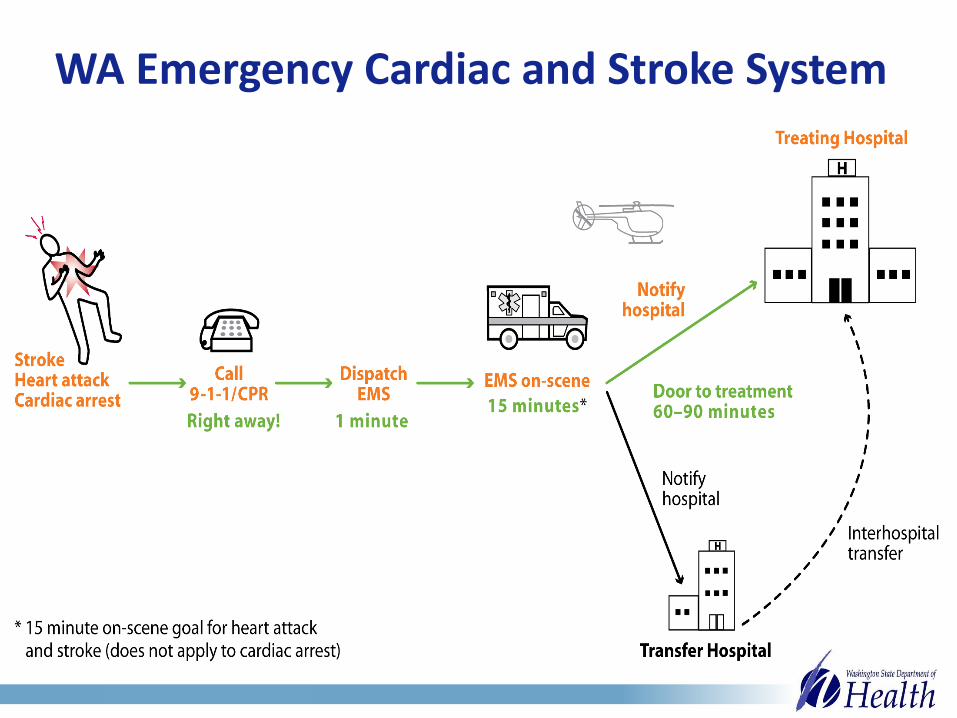
WA Emergency Cardiac and Stroke System

Saving Time Saves Lives
• Public education
• Rapid assessment and system activation
• Standard triage and transport
• Stroke centers
• Thrombolytic therapies
• Data collection and QI
STROKE IS an EMERGENCY!
Time is Brain
Call 911
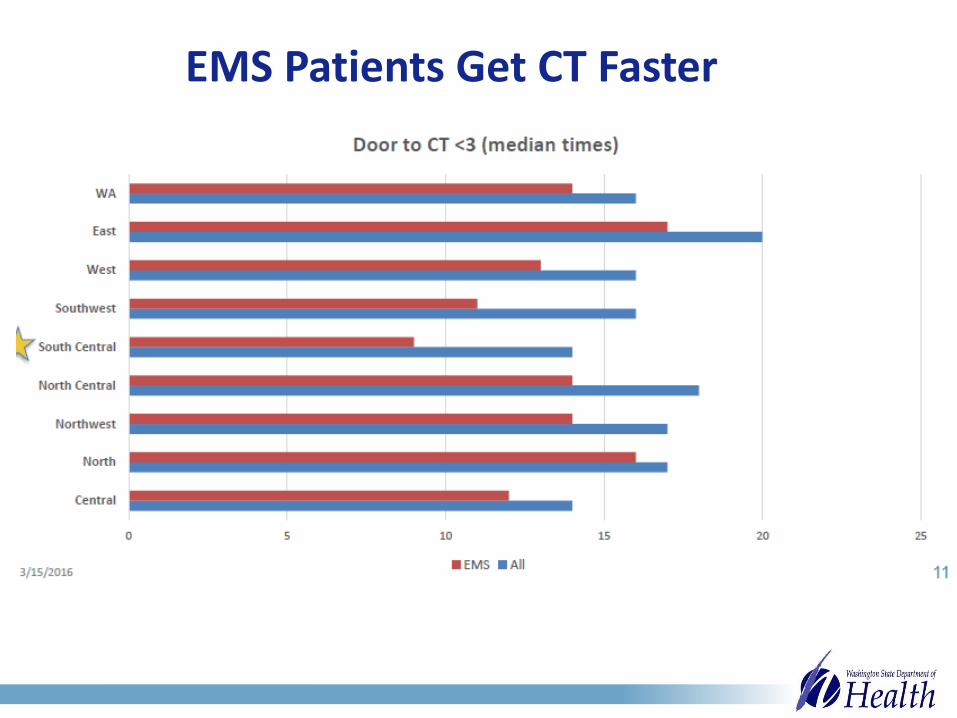
EMS Patients Get CT Faster

23%
38%
0%
5%
10%
15%
20%
25%
30%
35%
40%
2011 2012 2013 2014 2015 2016
% Patients Door to CT < 25
More Patients Get CT Under 25 Minutes
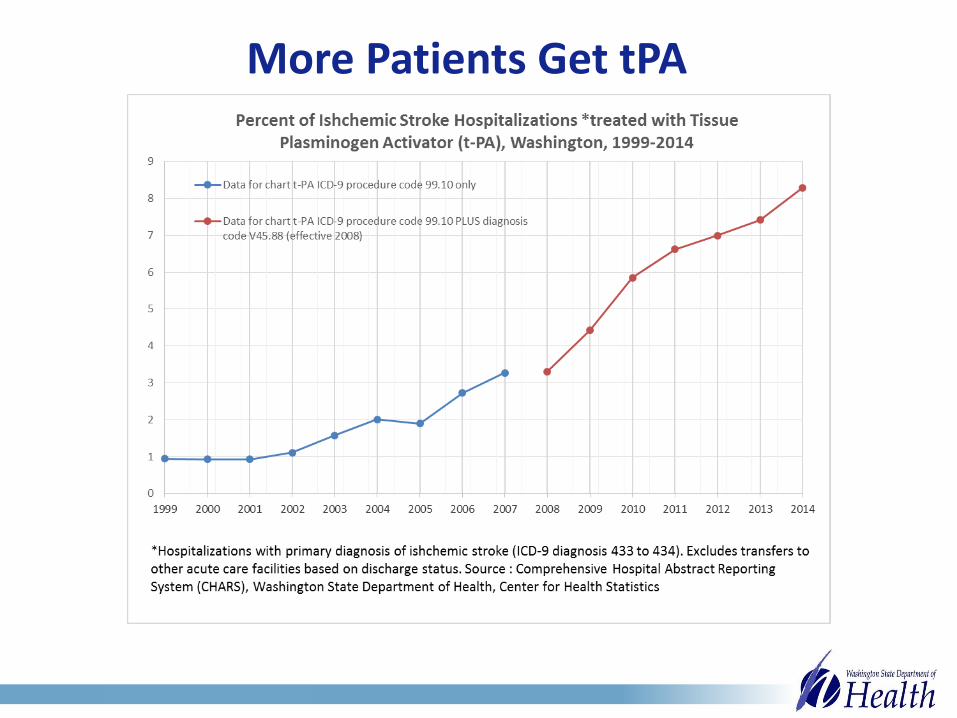
More Patients Get tPA
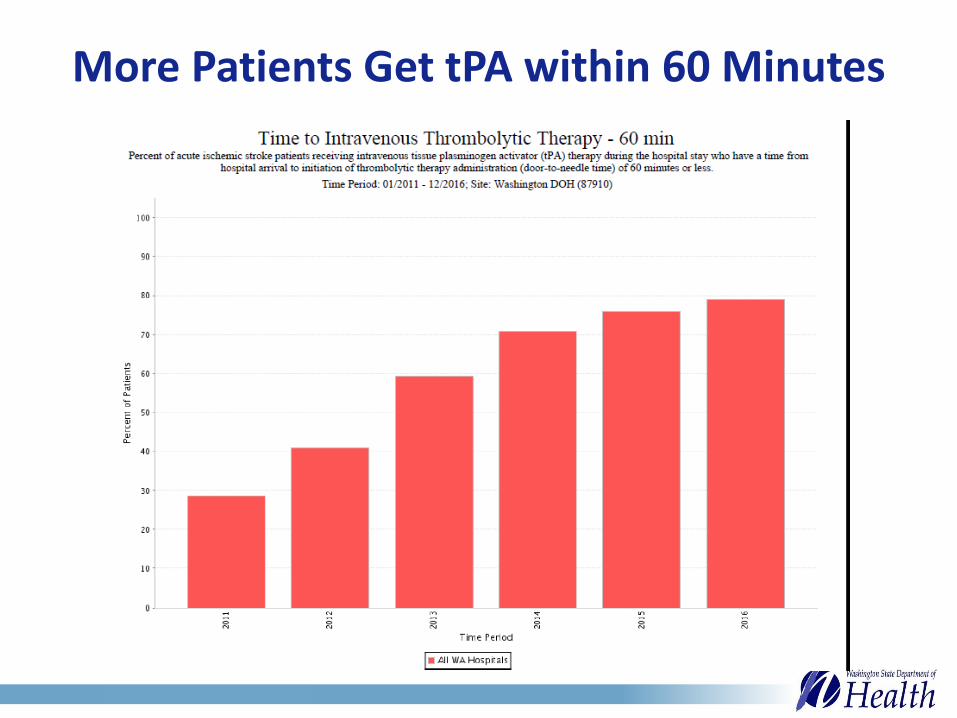
More Patients Get tPA within 60 Minutes

Time to Complete the System
Still need:• Public Education• Comprehensive Data
System• Verification • Training and Quality
Improvement Support• Pre/post
prevention/coordination

http://www.cdc.gov/dhdsp/programs/stroke_registry.htm
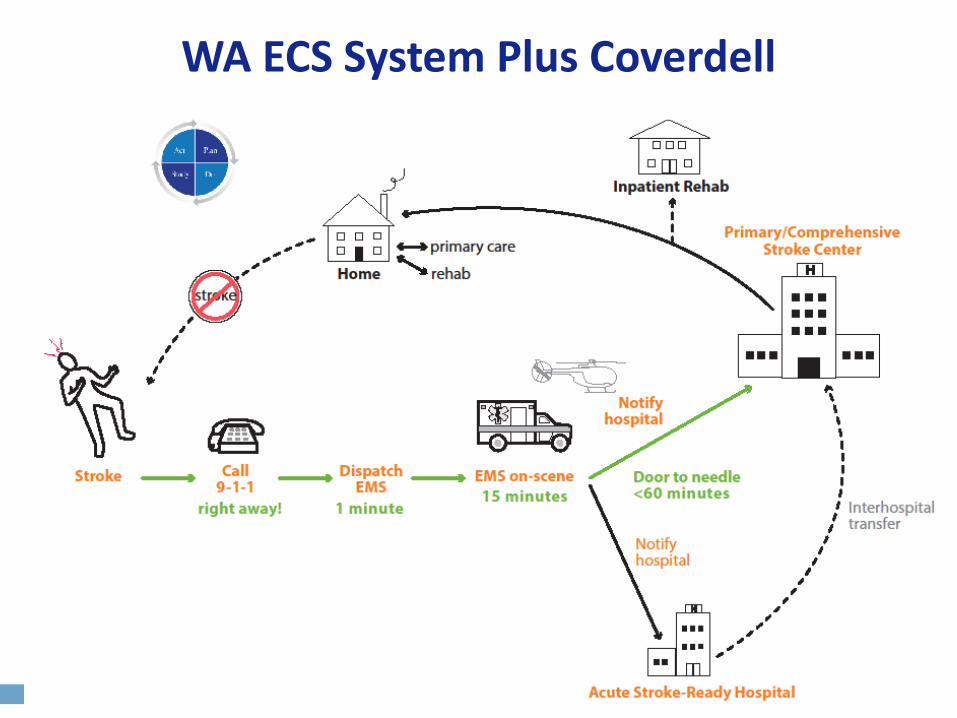
WA ECS System Plus Coverdell
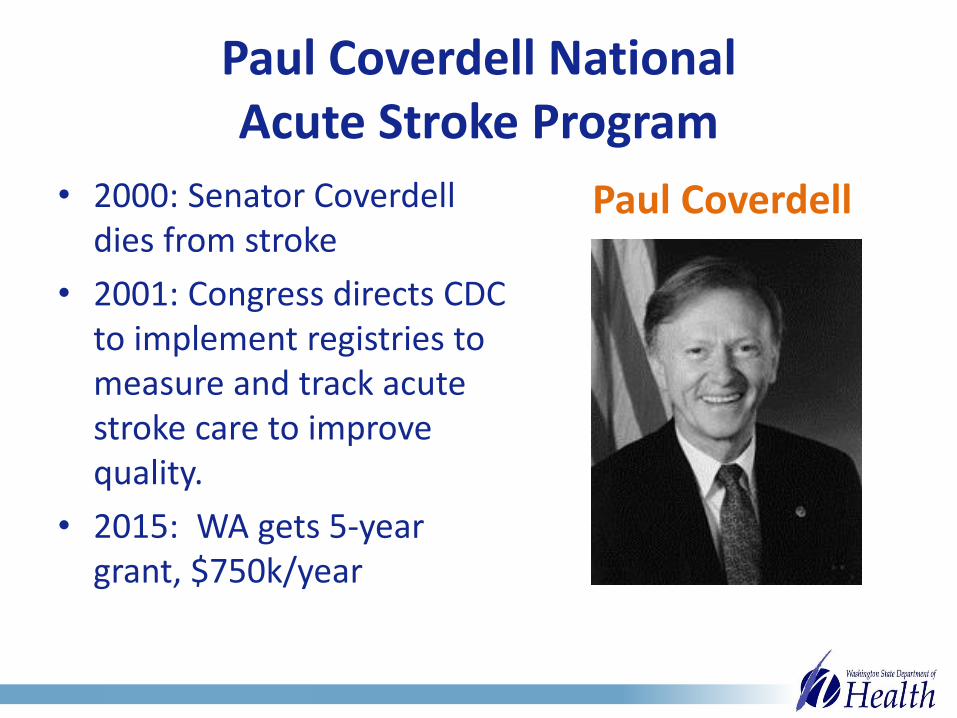
Paul Coverdell National Acute Stroke Program
• 2000: Senator Coverdell dies from stroke
• 2001: Congress directs CDC to implement registries to measure and track acute stroke care to improve quality.
• 2015: WA gets 5-year grant, $750k/year
Paul Coverdell

Coverdell Stroke Program Goals
• Prevent strokes
• Reduce death and disability
• Reduce healthcare costs
And a 1000 others goals along the way, like reduce time to treatment, reduce readmissions, improve transitions, quit smoking, lose weight, start exercising…
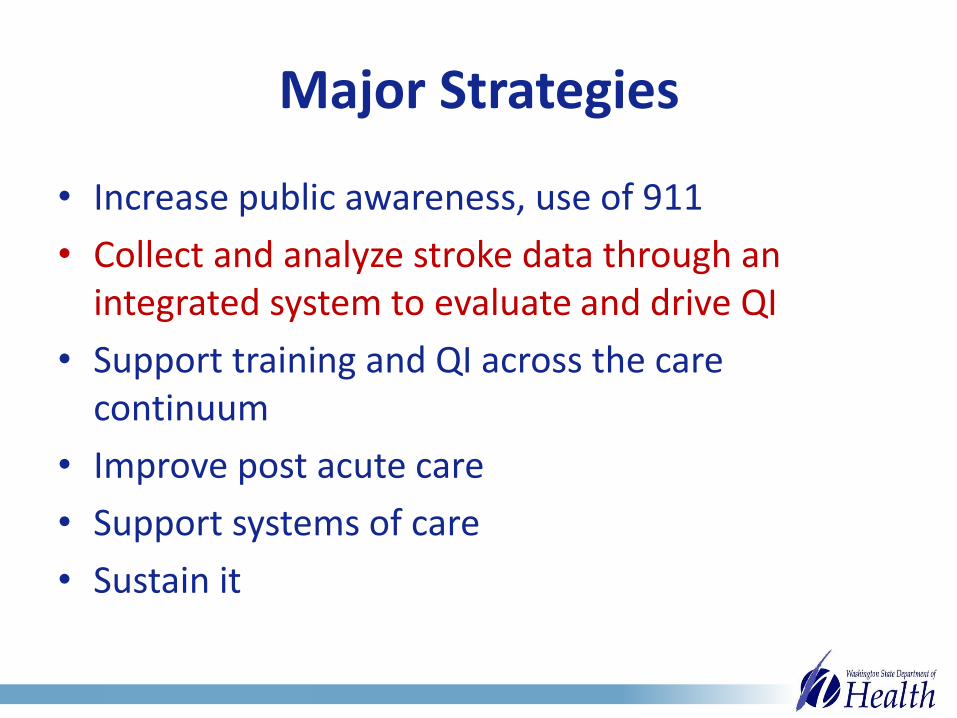
Major Strategies
• Increase public awareness, use of 911
• Collect and analyze stroke data through an integrated system to evaluate and drive QI
• Support training and QI across the care continuum
• Improve post acute care
• Support systems of care
• Sustain it

Coverdell Year 2

Partners in Prevention and Care Improvement
Community
Public Health
EMS
Rehab
Home Care
Primary Care
Hospitals
Home Health
NH/AL/AFH
Aging & Disability Services
Pharmacy
YMCA/Gyms
Recreation
Employers
SchoolsSenior Centers
Fire Stations
Community Health Workers
Parish Nurses

Start With You and Your Family
• High blood pressure? High cholesterol? Smoking? No physical activity? Love affair with donuts?
• It’s not just stroke; heart attack, diabetes, dialysis, dementia.

What’s Your Motivation?

Fire/EMS/Hospitals
• Do blood pressure readings for your community and educate on stroke risks, signs and symptoms, FAST.
• Give bags, magnets, pens.
• Join Coverdell – collect stroke data in GWTG, use it for quality improvement. EMS, collect stroke data, update to NEMSIS v3, submit to WEMSIS/Coverdell, track and improve on stroke Key Performance Indicators.
• Improve data sharing – complete run sheets to hospital, hospitals get feedback on patient dx and outcomes to EMS.
• Participate in your regional cardiac and stroke quality improvement groups.
• Start/get involved in Community Stroke Teams or care transitions groups to address primary and secondary prevention.

Reach out to your Partners
Community
Public Health
EMS
Rehab
H&C
Services
Primary Care
Hospitals
Home Health
NH/AL/AFH
Aging & Disability Services
Pharmacy
YMCA/Gyms
Recreation
Employers
Schools
Senior CentersFire Stations
Community Health Workers
Parish Nurses
Qualis Health
Accountable Communities of Health
IndustryLocal GovernmentAssociationsPayers
Falls Prevention

In Conclusion…
• We’re aging, with lots of stroke risk factors.
• Stroke is devastating, and COSTS A LOT.
• Stroke is preventable and treatable – we have and we can MAKE A DIFFERENCE.
• We have OPPORTUNITY right now.
• It’s TIME! Let’s do this thing!

Are you in?
Kim Kelley, MSW, Coverdell Stroke Program Coordinator, [email protected] 360-236-2807
Jim Jansen, MPH, Stroke Epidemiologist
[email protected] 360-236-2821
Data Sources
Deaths: Death Certificate Data—Washington State Department of Health, Center for Health Statistics. Deaths are underlying cause only.
Risk Factor Trends: Self-report survey —Washington State Department of Health, Behavioral Risk Factor Surveillance System.
Population Projections: Forecast of the State Population. 2015 Forecast. State of Washington, Forecasting Division, Office of Financial Management. Available at: www.ofm.wa.gov.
Costs: DeVol, Ross, and Armen Bedroussian, An Unhealthy America: The Economic Burden of Chronic Disease, Milken Institute, October 2007. Report prepared with support from the Pharmaceutical Research and Manufacturers of America. Report available at www.milkeninstitute.org.

Data Sources, cont.Hospitalizations: Hospitalization Discharge Data: Comprehensive Hospital Abstract
Reporting System(CHARS), Washington State Department of Health, Center for Health Statistics. Hospitalizations are primary diagnosis only.
The unit of observation in this analysis is the hospitalization episode, not the individual. Thus, one person hospitalized three times in a year counts as three hospitalizations for that year. The number of hospitalizations gives us a better picture of the public health impact of a condition. Each hospitalization for an illness or injury is an adverse event for the person who experiences it. Many hospitalizations are potentially avoidable through reductions in the factors that cause diseases and injuries or through early detection and rapid treatment.
For this analysis, the data figures do not include hospitalizations for Washington residents from U.S. Department of Veterans Affair Hospitals (VA), or federal hospitals, or Idaho hospitals service Washington residents of border counties. Hospitalization data does include Oregon hospitalizations of Washington residents. From the Office for Oregon Health Policy Research for years 1990 to 1999 and from the Oregon State Inpatient Database (SID) for years 2000 to 2014 as part of the Healthcare Cost and Utilization Project (HCUP), Agency for Healthcare Research and Quality.