the state of practice in supply- chain management… state of practice in... · the state of...
TRANSCRIPT
Chapter 1
THE STATE OF PRACTICE IN SUPPLY-CHAIN MANAGEMENT:A RESEARCH PERSPECTIVE∗
Leroy B. SchwarzKrannert Graduate School of ManagementPurdue UniversityWest Lafayette, Indiana [email protected]
Abstract In this paper, I will describe examples of state-of-the-art practice insupply-chain management; e.g., vendor-managed inventory, quick re-sponse, and other contemporary systems, such as Wal-Mart’s RetailLink.The perspective will be that of what I call the IDIB Portfolio; i.e., whatInformation (I), Decision-Making (D), Implementation (I), and Buffer(B) systems are employed in managing real-world supply chains. Mostoperations-research models consider only two components of this portfo-lio: the decision-making and the buffer systems. More specifically, mostoperations-research models involve selecting a decision-rule to minimizeexpected buffer (i.e., inventory-holding) and backorder cost given a fixedlevel of information. Implementation as a decision variable is typicallyignored. However, in the real world, with changing information, commu-nication, and implementation technologies, supply-chain managementcan – and should – be viewed as changing the nature of the entire IDIBPortfolio. After interpreting current practice from the perspective ofthe IDIB Portfolio, I will forecast future practice using CollaborativePlanning, Forecasting, and Replenishment (CPFR) as an example. Iwill describe the elements of CPFR, identify companies that are usingit, and the challenges they face in realizing its potential. Finally, I willidentify research opportunities in CPFR, and, more generally, researchopportunities involving the IDIB Portfolio.
∗Forthcoming in Applications of Supply Chain Management and E-Commerce Research inIndustry, E. Akcali, J. Geunes, P.M. Pardalos, H.E. Romeijn, and Z.J. Shen (editors), KluwerAcademic Publishers, Dordrecht, The Netherlands, 2004.
1
2
1. IntroductionWe’ve all seen one version of it or another: The consulting company’s
Power-Point slide representing the evolution of supply-chain manage-ment (SCM). A staircase ascends left to right: on the bottom step is“Basic Supply-Chain Management”, typically intra-company MRP orERP systems; and on the top step, “Advanced Supply-Chain Manage-ment”, typically described as “wireless, broad-band, web-based, trulycollaborative, etc.”. The next slide asks: “Where is your company?”
Sridhar Tayur (Carnegie Mellon University) displayed one of thesestaircase slides at a recent meeting of supply-chain thought leaders atHarvard University. Marshall Fisher (University of Pennsylvania) asked:“Does anyone know of any companies that are at or near the top step?”No one raised a hand. That slide, Marshall’s question, and no one’sanswer provided the motivation for this paper.
In what follows I will do three things: First, I will describe the state-of-the-art in supply-chain management practice. A caveat: my assess-ment will be general; no details of specific buyer-supplier practice will bedescribed. Second, I will introduce a paradigm – called the “IDIB Port-folio” – for understanding the evolution of supply-chain management todate, and for predicting its future. Third, using this framework, I willsuggest topics for research.
My focus will be on managing the link(s) between buyers and suppliersthat are independently owned and managed. Although centrally-ownedand managed links provide a valuable benchmark, the real challengesin supply-chain management involve two or more independently-ownedand managed companies. Two fundamental challenges are posed in im-proving the management of such supply chains: (1) the development oftechniques to improve overall supply-chain performance (e.g., increasingtotal supply-chain profit); and (2) the development of contracting mech-anisms that will motivate all the partners to implement these techniques.In other words: (1) how to “enlarge the pie”; and (2) how to “providelarger slices” to all the partners. I will focus on the first challenge – thedevelopment of techniques to improve overall performance. See Cachon,2004 for a review of the supply-chain literature on the management ofincentive conflicts with contracts.
This paper is organized as follows: Section 2 provides an overview ofcontemporary supply-chain management systems. In Sections 3-4 I willintroduce the IDIB Portfolio paradigm, describe what “managing theIDIB Portfolio” means, and contrast the IDIB Portfolio paradigm withthe operations-research paradigm. Section 5 uses the IDIB Portfolio toprovide a perspective on contemporary supply-chain management prac-
The state of practice in supply-chain management: a research perspective 3
tice. Section 6 describes two “Axioms of the IDIB Portfolio”. In section7, I use these axioms to forecast the future of supply-chain management.Section 8 provides an overview of Collaborative Planning, Forecasting,and Replenishment (CPFR), which, I believe, is one “contender” forthe future of supply-chain management. In Section 9, I identify sev-eral research topics in CPFR, in Section 110, several research topics insupply-chain collaboration, and, in Section 11, several research topicsrelated to the IDIB Portfolio paradigm. Section 12 cites closely-relatedreferences. Section 13 provides a summary.
2. An Overview of Contemporary Supply-ChainManagement Systems
Vendor-Managed Inventory (VMI), introduced by Kurt Solomon As-sociates in 1992 (http://www.kurtsalmon.com), is perhaps the mostwidely-known system for managing supply chains. Under VMI, thebuyer authorizes the supplier (i.e., vendor) to manage the inventory ofa set of stock-keeping units (SKUs) at the buyer’s site(s) under agreed-upon parameters (e.g., minimum and maximum inventory targets). Thebuyer provides the supplier with sales and/or inventory-status informa-tion; and the supplier makes and implements decisions about replenish-ment quantities and timings.
VMI reduces information distortion, which is one cause of the “bull-whip” effect (Lee et al., 1997). In addition, VMI provides the supplierwith the opportunity to better manage its own production, inventory,and transportation costs. (See, for example, Cetinkaya and Lee, 2000).In exchange, the buyer typically receives price discounts or improvedterms of payment from the supplier.
Quick Response (QR) was innovated by Milliken & Company (http://www.milliken.com) in the early 1990’s and subsequently codified bythe Voluntary Interindustry Commerce Standards (VICS) Association.QR has four levels of application and technology. Levels 1 and 2, forexample, involve retailer inventory-status information-sharing and au-tomatic order-processing between retailer and supplier. Levels 3 and 4include VMI and cross-docking warehouses. See Fiorito et al., 1994 formore information.
Although VMI and QR might be the “best-known” management sys-tems among both practitioners and academics, perhaps the most highly-regarded systems are proprietary systems developed by large retailers,such as Wal-Mart’s RetailLink, Kmart’s Workbench, and Target’s Part-ners Online. Although the detailed inner workings of these systems areclosely-guarded secrets, they all have two common characteristics: (1)
4
the sharing of transactions-level data among partners; and (2) the use ofagreed-upon metrics (e.g., in-stock, inventory-turnover, and on-time de-livery measures) and targets to assess partner performance. RetailLink,for example, captures sales, inventory, and delivery-related data for ev-ery SKU at every Wal-Mart facility (i.e., store and distribution center)and uploads it to a central database at least every 24 hours. These data,and metrics based upon them, are made available to every manager andevery company up or down the supply chain whose performance is re-lated to this SKU.
How this shared information is used – in particular, whether the de-cisions based on it are made centrally or decentrally – depends on thespecific partnership agreement, and the type of product(s) being man-aged. Similarly, who does the implementation and how it is done isspecific to the partnership and product(s). To illustrate: Wal-Mart gen-erally centralizes decision-making but decentralizes implementation forWal-Mart and Sam’s Club facilities, while delegating decision-makingand implementation to its suppliers. However, regardless of who makesor implements the decisions, the quality of the decisions and their im-plementation are continually monitored by all parties and compared tothe agreed-upon targets.
Before taking a closer look at current supply-chain practice, I willintroduce a simple paradigm that will be useful in interpreting it.
3. Information, Decision, Implementation, andBuffer (IDIB) Systems
Managing anything, including managing a supply chain, can be viewedas four related activities: (1) getting information for decision-making;(2) decision-making ; (3) implementing decisions; and (4) buffering a-gainst imperfections in (1)-(3). Correspondingly, every organization hassystems for performing these four activities.
The Information SystemThe role of the “information system” is to provide past, present, andfuture-oriented information for decision-making. This information mightbe about demand, costs, materials, capacities, etc. An ideal EnterpriseResource Planning (ERP) system should be capable of capturing andproviding all this information. In practice, however, information “inthe information system” is captured and stored in dozens of differentways, among them paper records and computer files. In many organiza-tions, much of this information is, literally, in the heads of managementpersonnel.
The state of practice in supply-chain management: a research perspective 5
Hence, a firm’s information system is the less “a thing” and morea collection of “things”: the collection of all business processes – for-mal and informal – plus all the information technologies and systemsthat provide information for decision-making. In this sense, informationsystems are “decision-support systems”. However, I prefer the label “in-formation system” since most decision-support systems are limited intheir domain, and, hence, are a subset of the information system.
The overall quality of an information system’s information about any-thing can be measured as some combination of: (1) its accuracy ; that is,the correspondence between past, present, and future reality and whatthe information system reports (or reported) about it; (2) its leadtime;i.e., the time between an event and when the information system reportsit; (3) its level of aggregation; i.e., the categories and units in which in-formation is provided; and (4) its horizon; i.e., how far into the future(or past) the information system looks.
At their worst, information systems provide grossly inaccurate, evenirrelevant, information. “Better” information systems typically providesome historical information and some current-status information. Stillbetter information systems provide future-oriented information, such asdemand forecasts and cost projections. A “perfect” information systemwould be the proverbial crystal ball, capable of seeing perfectly into thepast, present, or future.
Another important characteristic of a company’s information systemis its cost; that is, the cost of the people, equipment, facilities, andprocesses that, together, comprise the information system. Typically,for a given technology, the cost of an information system is an increasingand marginally-increasing function of its overall quality. In other words,improving a given information system costs more, and each additionalincrement in quality costs more than the last.
From a management perspective, of course, the value of an informa-tion system doesn’t depend on the quality of the information it provides,but on the quality of the decisions made based on this information.
The Decision-Making SystemThe role of a decision-making system, of course, is to make decisionsusing the information provided by the information system. Decision-making takes many different forms and is performed by many differentindividuals or groups. Decision-making occurs throughout every orga-nization, from the shop-floor to the executive suite. Strategic decisions(e.g., the organization of the supply-chain, product offerings) are typi-cally made at the executive level. Managerial decisions (e.g., the mas-ter schedule, order-promising) are typically made by middle managers.
6
Tactical decisions (e.g., processor assignment, workload sequencing) aretypically delegated to the shop floor. The decision-making processesthemselves might be informal, even intuitive (e.g., “Ned uses his 25years of experience to assign workloads to processors”), or they mightbe codified, even regulated. For example, in US pharmaceutical manu-facturing, most of the production decisions (e.g., the process steps andlot sizes) have been specified and approved by the FDA and, hence,must be adhered to. The corresponding decision rules might be simple– for example, in master-scheduling “run-out rules” are often used – ormathematically sophisticated (e.g., master-schedule optimization usingmathematical programming). The decision-rules might be formal andautomated; or, they might be totally within the head of some individualor group of individuals. Typically, important decisions are the resultof a complex set of activities, some logical or based on managementjudgment, some simply guess-work.
The overall quality of a decision-making system’s decisions can bemeasured as some combination of: (1) the optimality of the decisionsmade; and (2) the decision-making leadtime. “Optimality” means howdesirable the decision is – given the quality of information provided bythe information system – with respect to cost, profit, or some othermeasure of utility. The “decision-making leadtime” is the amount oftime it takes to make the decision once the appropriate information hasbeen provided. This leadtime might be short or long; it might be a fixedamount of time, or variable; it might be known or unknown in advance.
Like information systems, the cost-drivers for decision-making systemsare the people, equipment, facilities, and processes that, together, com-prise it. And, like information systems, for a given technology, the costof a decision-making system is typically an increasing, and marginally-increasing function of its overall quality. In other words, improving agiven decision-making system costs more, and each additional incrementin quality – for example, each increment in the desirability of its decisionsor each decrease in leadtime – costs more than the last.
Finally, like information systems, the value of a decision-making sys-tem doesn’t depend only on its quality characteristics. In particular, a“perfect” decision that doesn’t get implemented is of no value.
The Implementation SystemImplementation usually involves some “paperwork” to authorize or ini-tiate activity. For example, a decision to ship 200 units from Dock 4 at12 o’clock on April 5th will typically involve inventory-withdrawal au-thorizations, transportation requisitions, etc. Often, some preliminaryactions must also be taken. For example, if 200 units aren’t in inven-
The state of practice in supply-chain management: a research perspective 7
tory, then production decisions and their corresponding implementationsmust take place.
The overall quality of an implementation system can be measured assome combination of: (1) the implementation leadtime; and (2) imple-mentation accuracy. The “implementation leadtime” is the amount oftime required to make the decision happen; in other words, the timebetween making the decision and having the corresponding actions com-pleted (i.e., implemented). For example, the amount of time it actuallytakes to ship the 200 units from Dock 4 once the decision has beenmade to do it. Like decision-making leadtimes, implementation lead-times might be short or long, fixed or variable, known or unknown inadvance. “Implementation accuracy” measures how closely the imple-mentation matches the decision. Perfect accuracy means that the im-plementation perfectly matched the decision; for example, that exactly200 units were shipped from Dock 4 at 12 o’clock on April 5th. In prac-tice, implementation is seldom perfect: differences may be small, as in atightly-controlled JIT system, or large, as in high-density chip fabrica-tion, where yield losses are unpredictable and difficult to control.
Often trade-offs occur between the implementation leadtime and theaccuracy-of-implementation. The phrase “quick-and-dirty”, for exam-ple, means that decision-making and implementation are “quick” (i.e.,that their combined leadtime is short) but that the decision and/or itsimplementation are “dirty” (i.e., that the decision isn’t very desirableand/or the implementation isn’t accurate).1
Like information and decision-making systems, implementation sys-tems cost money; that is, the cost of the people, equipment, facilities, andprocesses that involve making the decision happen. And, like informa-tion and decision-making systems, for a given level of technology, the costof an implementation system is typically an increasing and marginally-increasing function of its overall quality. In other words, improving agiven implementation system – that is, making it faster or more accurate– costs more, and each additional increment in quality costs more thanthe last.
The Buffer SystemIn a perfect world, information systems would provide perfect informa-tion and decision-making systems would make perfect decisions. Imple-mentation would be perfect, too. However, in the real world, none of
1In fact, decision-making and implementation are often iterative. For example, a decisionmight be made; then, during the process of implementation, new information is revealed thatmight lead to modifying the decision, etc.
8
these three systems is ever perfect. Management systems compensatefor these imperfections using buffers and buffer systems.
What are buffers? Unlike information, decision-making, and imple-mentation systems, which can be realized in a virtual infinity of differentforms, buffers come in only three basic forms: inventory, leadtime, andcapacity. A “buffer system” is a combination of inventory, leadtime,and capacity buffers, in various amounts, located within what mightbe called the “management-system supply chain”. Often, for example,inflated leadtimes or extra capacity are imbedded in the information,decision-making, and implementation systems. Work-in-process inven-tories are typically found throughout the implementation system, withraw-material inventories at the beginning and finished goods at the endof the implementation chain. Leadtime buffers (e.g., inflated promisedates) are typically found at the interface between the points of deliveryand the customers.
Re-thinking BuffersThe best way to understand – indeed, appreciate – the roles that buffersplay in a management system is this: forget everything you’ve thoughtabout them until now. In particular, put aside any notion that buffersare inherently “bad”.
Yes, buffers are often thought to be “bad”. Why? Perhaps it’s be-cause buffers cost money. Yet, the other three components of a man-agement system cost money, too. It is also worth noting – and peculiar,I think – that despite the fact that information, decision-making, andimplementation systems also cost money, these three elements of a man-agement system are generally thought to be “good”. Further, it is gen-erally accepted that “improving” – that is, increasing the capabilities of– an information, decision-making, or implementation system is a “goodthing”. On the other hand, it is generally thought that “improving abuffer” must mean reducing its capabilities or eliminating it. Put thisnotion aside, too.
Another reason why buffer systems might be thought to be “bad” isthat whatever amount of buffering management chooses to provide, it istypically the wrong amount. In other words, the amount of buffering iseither too much – for example, leftover inventory at the end of a sellingseason – or not enough – for example, that sales were lost despite thefact that “lots” of safety stock was provided.
I believe it is more useful – and accurate – to think about buffers interms of the role they play in a management system: to compensate forimperfections in the information, decision-making, and implementationsystems. From this perspective, I believe that buffers can only rightfully
The state of practice in supply-chain management: a research perspective 9
be called “too big” if they use more resources than necessary to do whatthey are intended to do: to compensate for imperfections elsewhere inthe management system. Similarly, buffers should only be thought of as“bad” if they imperfectly compensate for those imperfections.
What would a “perfect” amount of buffering be?Consider a business scenario like that of the newsvendor model, and a
management system whose information system, I, perfectly forecast cus-tomer demand. Assume that this perfect forecast is provided to decision-making, D, and implementation, I, systems that are capable of providingexactly this number of units at the instant they are demanded in pre-cisely the right quantity. How much buffering, B, is required to perfectlysatisfy customer demand? None. In other words, the “perfect” amountof buffering in this system is zero.
Now change the management system slightly so that the informationsystem can only provide a probability distribution of future demand.Given this level of imperfection in the information system, is any man-agement system capable of always satisfying customer demand withoutlost sales or unused inventory, capacity, or leadtime?
The answer is “yes”, provided that the decision-making and imple-mentation systems are perfect; that is, provided that, once demand isknown, management is capable of deciding to provide this amount, andprovided that the implementation system is capable of producing pre-cisely this amount instantaneously. Here, too, the perfect amount ofbuffering would be zero. On the other hand, unless the decision-makingand implementation systems are perfect, some buffering will be required.How much and what kind of buffering?
Suppose that the “IDI systems” – that is, the combined informa-tion, decision-making, and implementation systems – are perfect withrespect to leadtime, but imperfect with respect to quantity. In otherwords, some amount will be provided at exactly the right time to sat-isfy demand, but that the quantity won’t necessarily equal the quantitydemanded. In order to avoid lost sales, inventory buffering will be re-quired, the amount depending on the overall imperfection, or variance,in the quantity the IDI provides. As the variance of this imperfectionincreases, in order to compensate, the corresponding amount of bufferinventory must also increase. In the extreme, as this variance increasesto infinity, the “perfect” amount of buffering also increases to infinity.
Next, suppose that IDI systems above are imperfect in quantity andleadtime. In order to satisfy demand at the time that it occurs in thequantity demanded, a leadtime buffer must be added to the inventorybuffer. And, as the uncertainty in “supply leadtime” increases, the cor-responding leadtime buffer must also increase.
10
Finally, since in many situations, the uncertainty arising from the IDIsystems is a consequence of scheduling conflicts on some constrained re-source(s), capacity buffers can usually be substituted for some of theinventory and leadtime buffers. Hence, the appropriate forms of buffer-ing – inventory, leadtime, or capacity – depend on the nature of theimperfection(s) in the IDI systems.
Finally, then, given some form of buffering, what is the “perfect”amount?
The “Perfect” Amount of Buffering?If the role of the management system – the IDIB – is to provide whatis required or demanded at the time and in the quantity that’s requiredor demanded; and if the role of a buffer is to compensate for imper-fections in the IDI systems, then the “perfect” amount of leadtime,capacity, or inventory is the amount that does just that and no more:the amount that provides precisely what’s required or demanded despitethe imperfections in the IDI systems. Hence, the “perfect” amount ofbuffering is never zero unless the IDI systems are capable of perfection.Furthermore, as the combined imperfections in the IDI increases, thecorresponding perfect amount of buffering must also increase.
An aside on the “Zero Inventory” concept often associated with Just-in-Time systems: The concept of zero inventory, or, more generally, zerobuffering can be extremely important in identifying the nature and mag-nitude of imperfections in an IDI system. In other words, reduce theamount of buffering and “see” what imperfections are revealed. Oftensuch experiments uncover imperfections in the IDI systems that areinexpensive to reduce or eliminate. If so, then this should be done andthe corresponding amount of buffering should be permanently reduced.However, to the extent that imperfections in the IDI systems remain,the perfect amount of buffering isn’t zero.
Hence, the perfect amount of buffering depends on the imperfectionsin the combined IDI systems. If the amount of imperfections – that is,the uncertainties associated with the IDI systems – increases, then theoverall level of buffering also must be “improved” – increased – in orderto compensate.
The Cost of BufferingLike all the other components of a management systems, the cost of abuffer system is typically an increasing, and marginally-increasing func-tion of its overall quality. In other words, improving – that is, increasing– the capability of any given buffer costs more, and, typically, each ad-ditional increment in quality costs more than the last.
The state of practice in supply-chain management: a research perspective 11
An Alternative Perspective: the “Optimal” Amount of Buffer-ingThe operations research (OR) paradigm provides an alternative perspec-tive on buffers, and, based on this perspective, defines the “optimal”amount of buffering. The perspective of the OR paradigm is as follows:The realized amount of buffering provided by a given management sys-tem is the difference between what reality requires or demands and whatthe management system provides. For example, if demand was 100 unitsand the management system provided 120 units, then the buffer was 20units. Or, if management provided capacity of 40 hours and capacity of50 hours was required, then the buffer was –10 units. A negative buffer,whether it’s inventory, capacity, or leadtime, means that the manage-ment system didn’t provide enough of what was required or demanded;a positive buffer means that too much was provided.
Correspondingly, the OR paradigm takes the view that the cost of thebuffer system is the cost of all the positive buffering plus all the costsassociated with negative buffering. In other words, the cost of the buffersystem is the cost of all the unused inventory, capacity, and leadtimethat the management system provided – measured after demand forthat resource occurs – plus the cost of all the corresponding shortages ofinventory, capacity, and leadtime. (e.g., lost sales, backorder, goodwillcost).
The newsvendor model is, perhaps, the best-known example of theOR paradigm. The newsvendor model chooses the optimal “target in-ventory” based on three “drivers”: the per-unit cost of “not enough”buffering (i.e., opportunity cost of lost sales), the per-unit cost of “too-much buffering” (i.e., the out-of-pocket leftover cost), and the probabil-ity distribution of demand. The expected-cost minimizing target inven-tory is provided by the well-known “newsvendor fractile” of the cumula-tive demand distribution. The corresponding “safety-stock” (inventory)buffer is measured, a priori, as the difference between the chosen targetinventory and the expected customer demand.
What’s Wrong with the OR Paradigm’s View of Buffers?There is nothing “wrong” with the OR paradigm or with its view ofbuffers. “Near-sighted” would be a better description.
In particular, the OR-paradigm’s view of the too-much and not-enoughcosts associated with the imperfections of a management system is con-sistent with the IDIB-paradigm perspective. In other words, once, say,demand occurs, the relevant costs incurred because of an imperfect IDIBPortfolio are those associated with providing too much or not enough ofwhatever was demanded.
12
But why should these too-much and not-enough costs only be associ-ated with – if you will, “blamed” on – the buffer system? Yes, buffersare typically imperfect, but what about the imperfections in the IDIsystems? More on this below.
One way of looking at the difference between the OR and the IDIBparadigms is that the IDIB paradigm generalizes the OR paradigm.Specifically, the IDIB paradigm takes the view that the quality of allfour components of a management system – not just the buffer systemquality (i.e., size) – are decision variables; second, that the underlyingquality-cost function for each of these components – that is, the cost tomove them in the direction of perfection – is increasing and marginallyincreasing. Finally, that there is a cost associated with the entire IDIBPortfolio – again, not just the buffer system – for failing to provide what-ever is required or demanded. Hence, the “optimal” IDIB Portfolio isthe IDIB Portfolio that minimizes the total costs of all of its compo-nents plus the cost of failing to provide precisely what is/was requiredor demanded.
From this point of view, the OR paradigm is “near-sighted” to theextent that it takes the IDI as fixed, and focuses only on picking theamount of buffering that minimizes the corresponding too-much andnot-enough buffer cost.
We will address the question of the optimal IDIB in Section 11. Weturn now to the concept of the “IDIB Portfolio”.
4. The IDIB PortfolioI label the combination of these four components of a management
system – the information, decision-making, implementation, and buffersystems – a “portfolio”, because, like a financial portfolio, each of thesesystems involves an investment of dollars. And, like the performanceof an investment portfolio, the performance of a management systemdepends on how well its components perform in combination, not asseparate components. Finally, in assembling an IDIB Portfolio, as inassembling a financial portfolio, an almost unlimited number of combi-nations can be chosen. As an illustration, suppose the goal is to managea supply chain to provide a 95% customer fill-rate at the retail level.This might be provided by managing every link of the chain with low-quality information, decision-making, and implementation systems, butlarge inventory buffers everywhere. Or, without changing the manage-ment of the other links in this supply chain, the manufacturer mightsubstitute buffer capacity for some of its finished-goods inventory andstill offer the same service to the distributor. Similarly, the distributor
The state of practice in supply-chain management: a research perspective 13
might choose higher cost of express delivery (from the manufacturer) inorder to reduce the expediting and inventory-holding cost on its safety-stock (buffer) inventory. Three different IDIB Portfolios all providingthe same level of customer service.
Which is best?If the goal of a management system is to maximize profit, then the
“best” IDIB Portfolio is the portfolio with the least total cost: that is,the total cost of all the people, facilities, equipment, and technologyassociated with providing information, making decisions, implementingthem, and buffering to compensate for imperfections in the IDI systems,plus the cost of lost sales, expediting, and goodwill loss resulting fromfailing to do all this perfectly.
Managing the IDIB Portfolio“Managing” the IDIB Portfolio means making decisions about the natureand quality of its four components: the information, decision-making,implementation, and buffer systems. The ideal is to select the qualityof each component, plus the cost of lost sales, etc., so that total cost isminimized. Is “managing the IDIB Portfolio” amenable to the tools ofoperations research? I think it could be, but most OR models are muchtoo myopic to be called “IDIB optimizers”, much less, “IDIB improvers”.
Consider the well-known newsvendor inventory model. In this model,the information system provides the probability distribution of customerdemand and estimates of the costs associated with buying and sellingnewspapers. Attention is focused on the decision about the number ofnewspapers to have on hand at the beginning of the day in order to max-imize the newsvendor’s expected profit. The optimal decision-rule is wellknown: set this inventory equal to the “critical fractile” of the probabil-ity distribution of customer demand. The newsvendor’s implementationleadtime is not explicitly considered. Instead, it is usually assumed thatwhatever this leadtime is, it is short enough so that, once the newsven-dor has decided how much to order, the chosen quantity will be deliveredon time. The basic newsvendor model also ignores implementation accu-racy; that is, it is implicitly assumed that whatever quantity is orderedwill be delivered. Extensions of the newsvendor model consider accu-racy; that is, the correspondence between what is ordered and what isdelivered (See Karlin, 1958 and Ehrhardt and Taube, 1987, for example;see Yano and Lee, 1995 for other references).
I believe the newsvendor model is representative of virtually everyoperations-research model of supply-chain management. That is, thequality of the information provided by the information system is as-sumed to be fixed. The costs associated with the information, decision-
14
making are typically ignored. The costs associated with implementationare sometimes represented, but in a highly-stylized manner. For ex-ample, the only implementation cost associated with the newsvendormodel is the marginal purchasing cost. Similarly, the only implemen-tation cost associated with the EOQ model is the assumed-to-be-fixedorder cost. The goal, as described above, is to determine the decision-rule that minimizes buffer-system cost. In IDIB Portfolio terms, thenewsvendor model – like most supply-chain models – selects the decision-rule for the decision-making system (“D”) that minimizes expected totalbuffer-system (“B”) cost for a fixed quality of information, “I”. The im-plementation “I” is represented either as a cost or as a constraint; notas a decision-variable.
“Managing the Newsvendor’s IDIB Portfolio” is much more complex.It does involve selecting decision rules, but the objective is to minimizetotal portfolio cost, not just the cost of the buffer system. In particular,managing the newsvendor’s IDIB Portfolio also involves assessing thecost and value of an information system that would provide more (or,possibly, even less!) precise information about customer demand. Italso involves assessing the cost and value of implementation systemswith different leadtimes and accuracies. More broadly, managing thenewsvendor’s IDIB portfolio might involve fundamental changes in thenewsvendor’s operations.
Suppose, for example, that the newsvendor was able to make andimplement her/his ordering decisions any number of times during theday and receive those newspapers instantaneously (i.e., decision and im-plementation leadtimes are zero). In such a scenario, the newsvendorwouldn’t inventory any newspapers, nor would he/she need a probabil-ity distribution of demand. Instead, the newsvendor would wait untila customer requested a newspaper and then provide it upon demand.Sound far fetched? Consider this:
For decades, the copier division of Xerox struggled with managingthe inventory of owner’s manuals for its copiers: how much inventory ofwhich manuals to have on hand, and when to replenish this inventory.Xerox eliminated this problem by developing a system for printing andbinding manuals upon demand; i.e., whenever assembly of a copier isscheduled, the printing of its manuals is also scheduled.
How was this done? By developing a system for implementing thedecision to produce manuals whose leadtime is less than or equal to thetime required to implement the decision to assemble the copier.
“Managing” the IDIB Portfolio is no easy task. First, the differentcomponents of the portfolio are often difficult to identify. For example,managers, who are nominally decision-makers, also often play a role in
The state of practice in supply-chain management: a research perspective 15
the information system; line personnel, who are nominally implementers,have roles to play in information, decision-making, and buffering. So, itis often difficult to separate the components of a firm’s IDIB Portfolio.Second, many of the costs associated with a firm’s IDIB Portfolio are“overhead” or “indirect” costs, which makes them difficult to estimate.These and other difficulties make it virtually impossible to find the trulyoptimal IDIB Portfolio; that is, the portfolio of information, decision-making, implementation, and buffering whose combined cost plus thecost of failing to provide enough of whatever was demanded or required(e.g., backordering or expediting cost) is the minimum possible cost.
Nonetheless, it is often relatively easy to verify that one given IDIBPortfolio has lower total cost than another. In the Xerox example above,it was relatively easy to verify, using back-of-the-envelope estimates, thatXerox’s “new” portfolio was an order of magnitude less expensive thanits old one.
Xerox’s old information system ignored the fact that Xerox manage-ment decided which copiers to produce and when to produce them. In-stead, it assumed that demand for a given manual was provided by aprobability distribution. Xerox’s new IDIB Portfolio uses informationthat management has scheduled a given copier to be assembled, andthen implements the decision to print its manuals in a short enoughleadtime so that the manual can be packaged with the copier at the endof the assembly line.
I believe that experienced operations researchers, practitioners, andconsultants already recognize the tradeoffs that the IDIB Portfolio makesexplicit. For example, consultants will often prescribe a less-than-perfect,heuristic decision-rule because it is less demanding of the informationsystem and/or easier to implement, particularly if these imperfectionsare relatively inexpensive to buffer against. On a broader level, sensi-tivity analysis, which is a well-founded tool of the operations researchtheorist, can be viewed assessing the impact of imperfections in the qual-ity of the information and/or decision-making systems on system per-formance, and, hence, the level of buffering that might be required. Forexample, sensitivity analyses on the basic EOQ model can be viewedas assessing the sensitivity of lot-sizing decisions to inaccuracies (i.e.,imperfections) in the information required to support it (e.g., estimatesof company inventory-holding cost or set-ups). See Lowe and Schwarz,1983, for example.
Similarly, but at a metaphysical level, operations-research theoristsoften prefer a less realistic (i.e., less perfect) model to a more realisticmodel because of the insight its analysis provides.
16
From this point of view, the fundamental difference between the IDIBparadigm and the OR paradigm is that experienced operations researchers,practitioners, and consultants make these tradeoff a priori ; that is, with-out explicitly identifying all the alternative levels of quality in informa-tion, decision-making, and implementation systems that might be cho-sen. Although this is understandable, such a priori choices necessarilylead to locally, not globally, optimal choices for the corresponding IDIBPortfolio.
The Role of Information Technology and EconomicsWhat “happened” at Xerox that led to its development of a new IDIBPortfolio for managing manuals? Was it management’s “discovery” thattheir own decisions created the demand for manuals? Not likely.
Obviously, the availability of technology played a role: printing-and-binding technology that could “quickly” produce an owner’s manual. InIDIB Portfolio terms, technology whose implementation leadtime wasshorter than the implementation leadtime to assemble a copier. Theother element, of course, is economics: Given that technology can facil-itate a “new” IDIB Portfolio, its adoption only makes sense if the totalcost of the “new” portfolio is less than the total cost of the “old” port-folio. So, obviously, technology and economics play a substantial role inthe development of “new” IDIB Portfolios.
Given the proven success of information technology (e.g., microcom-puters and the internet) as a significant facilitator of improved infor-mation, decision-making, and implementation, I believe it is inevitablethat information technology will continue to create the opportunities for“new” IDIB Portfolios. Further, to the extent that the cost of infor-mation technology continues to fall, following Moore’s Law2, these IDIsystems will continue to become less and less expensive. And, buffers,“B”s – inventory, capacity, and leadtime – are, if anything, becomingmore expensive over time.
Hence, I believe information technology and economics will continueto offer IDIB Portfolios to supply-chain managers whose total cost is
2The observation made in 1965 by Gordon Moore, co-founder of Intel, that the number oftransistors per square inch on integrated circuits had doubled every year since the integratedcircuit was invented. Moore predicted that this trend would continue for the foreseeablefuture. In subsequent years, the pace slowed down a bit, but data density has doubledapproximately every 18 months, and this is the current definition of Moore’s Law, whichMoore himself has blessed. Most experts, including Moore himself, expect Moore’s Law tohold for at least another two decades. Source: webopedia.com (definition last modified inMarch, 1998).
The state of practice in supply-chain management: a research perspective 17
less than today’s3. The challenge to supply-chain managers is: Whichnew IDIB Portfolio to adopt, and when to adopt it? The challenge tosupply-chain modelers is: What techniques and models will aid managersin choosing new IDIB Portfolios?
5. An IDIB Portfolio Perspective onSupply-Chain Management
Until fairly recently, virtually every link of every real-world supplychain was managed using a very crude IDIB Portfolio. Typically, theonly information a buyer shared with its supplier was its current order;and the most information the supplier shared with the buyer was this or-der’s planned or promised shipping date. Status information (e.g., orderstatus, inventory status) and future-oriented information (e.g., plannedorders and production) were seldom, if ever, shared, often because nei-ther partner had easy access to its own information about them. Further,in those instances when one partner did have access to this information,the technology for sharing it either wasn’t available or was very expen-sive. As a consequence, supply-chain “partners” – if we can call themthat – were figuratively blind to one another. In the absence of use-ful supplier/customer information for decision-making, each “partner”made decisions that were focused on what little information was avail-able, typically, internally-focused information, such as processor utiliza-tion, hot lists, etc. Consequently, the decision-making and implementa-tion based on this low-quality information required huge buffers: largebuffer inventories of raw materials, work-in-process, and finished goodsplus buffer leadtimes and capacity.
Given the high cost of these buffers, it’s no surprise that when low-cost technology for information-sharing between buyers and suppliersbecame available, innovators seized the opportunity to substitute low-cost information-sharing for these high-cost buffers, thereby achievedsignificant improvements in performance and/or reduced total cost.
Wal-Mart, of course, must be credited with introducing many of thetechnological innovations (e.g., bar-coding, satellite communication ofpoint-of-sale information) associated with contemporary supply-chain
3Although new technological capabilities are likely to be the primary drivers for changing anexisting IDIB Portfolio, at least in the short term, it is important to note that even if technol-ogy were held constant, any significant change in the cost of one or more of the components ofany given IDIB Portfolio is an equally-important driver. For example, holding everything elseequal, a significant decrease in the cost of capital makes inventory and equipment bufferingless expensive. Under these circumstances, increasing the quality of the buffer system anddecreasing the quality of the corresponding information, decision-making or implementationsystem should reduce total cost.
18
management, and equally important, in demonstrating that substitutingimproved information for inventory and leadtime buffers reduced totalcost.
And, so the “revolution” in supply-chain management began and con-tinues today, the state-of-the-art represented by Wal-Mart’s RetailLinksystem.
Yet, what is really different about these systems? From an IDIBperspective, these innovations are actually fairly modest, at least interms of what could be innovated. Under Vendor-Managed Inventory(VMI), for example, the buyer delegates the making and implementa-tion of inventory-replenishment decisions to the vendor. In order to doso, the buyer’s information system provides the vendor with informationabout customer demand and inventory status. Levels 1 and 2 of QuickResponse (QR) are the same, with the addition of automatic order-processing (i.e., implementation) between retailer and supplier. Levels3 and 4 of QR include cross-docking warehouses (i.e., faster implemen-tation of warehousing decisions). Even Wal-Mart’s RetailLink, althoughawesome in its scale (e.g., in the level of detail provided, in the type andnumber of partners with access to it), is fundamentally: (1) a system forrapidly sharing transactions-level data and metrics about the past andthe present with its suppliers; and (2) a centralized system for makingand implementing decisions for its own facilities.
So, why the “significant improvements” from what I describe as “mod-est innovations”? There is an old saying that: “In the land of the blind,the one-eyed man is king”. Historically, supply-chain “partners” werefiguratively blind to one another. Add just a little vision – for example,under QR, customer-demand and retailer-inventory information – and,suddenly, there is no need for much of the buffering that had been re-quired in the “land of the blind”. Reducing inventory produces cash.Reducing capacity increases productivity, and, hence, profitability. Re-ducing leadtimes attracts more customers.
Given the huge payoffs that supply-chain partners have derived fromsharing a modest amount of information or from delegating some decision-making and implementation from buyer to supplier, will more of thesame yield even larger payoffs? Where will it end? Will it end?
The “Axioms of the IDIB Portfolio” suggest that long before informa-tion-sharing and/or delegation of decision-making and implementationbecomes “total” between supply-chain partners – if it ever does – some-thing even more revolutionary will happen.
The state of practice in supply-chain management: a research perspective 19
6. The Axioms of the IDIB PortfolioThe 1st Axiom of the IDIB Portfolio is this: Given an existing
IDIB Portfolio, increasing the quality of one of its componentsfacilitates decreasing the quality of one or more of its otherthree components while maintaining the same level of customerservice (e.g., fill-rate, leadtime).
In an inventory-replenishment system, for example, reducing the lead-time to implement a replenishment decision, facilitates decreasing thesafety-stock inventory or leadtime buffer – that is, decreasing its quality– without affecting customer fill-rates, expected backorders, etc.. Or,in the same setting, decreasing the variance of the leadtime to make areplenishment decision by, say, one unit, facilitates increasing the cor-responding implementation leadtime variance by one unit.4 Many suchtradeoffs are possible.
Schneider National Trucking Company’s innovation of satellite track-ing to locate its trucks allowed Schneider to reduce two of its costlybuffers while improving customer service. Here are some details:
Before introducing its satellite-based information system for locatingits thousands of trucks, Schneider dispatchers relied on periodic tele-phone calls from its drivers in order to learn where its trucks and driverswere. The corresponding uncertainty about where and when its owntrucks would be available led to inflated promised pick-up times to cus-tomers and to a significant amount of idle capacity (i.e., “deadheading”,which is a truck moving without a load). In other words, in the absenceof accurate information about the location of its own trucks, Schneiderbuffered itself using leadtime and capacity. By adopting its satellite-tracking system, Schneider was able to reduce both these buffers andoffer improved delivery performance.
The 1st Axiom of the IDIB Portfolio might be called the “trade-offaxiom”; that is, by incurring increased cost for higher quality in onecomponent of the IDIB Portfolio it should be possible to reduce thequality and cost of another component. If the cost reduction is largerthan the cost increase, then total portfolio cost has been reduced. Further,as is often the case, some of the net savings can be invested in improvingcompetitiveness (e.g., increasing fill-rates, reducing delivery leadtimes,offering higher levels of customization, reducing prices).
Other trade-offs are possible, too. For example, a make-to-stock man-ufacturer who has made the transition from a “push” management sys-
4Assuming these processes are independent, the same safety stock will provide the samecustomer fill-rate, etc.
20
tem (e.g., MRP) to a “pull” management system (e.g., JIT) has, ev-erything else being equal, chosen to substitute buffer capacity for bufferinventory (and, often, to shift the inventory-buffering responsibilities toits suppliers and/or customers).
Sometimes, trade-offs are made to increase buffers. One example ofthis, experienced by every supply-chain manager who has replaced a do-mestic supplier with a lower-cost international supplier, is the increasein safety-stock inventory necessitated by the less-reliable transportationleadtimes from the off-shore supplier. In such cases, of course, the costsaving in implementation (i.e., delivery of items ordered from the sup-plier) isn’t typically in transportation – indeed, transportation cost mayincrease – but in the cost of acquiring the materials themselves.
I believe that virtually all of the dramatic improvements reported bycompanies in managing their own internal supply chains or by compa-nies and their partners in managing their shared supply chains can beinterpreted – indeed, could have been forecast – using the 1st Axiom ofthe IDIB Portfolio. That is, given the reduced cost of a “better” infor-mation system (as provided by innovations in information technology)and the already high cost of buffering, that information could be substi-tuted for buffers – that is, information improved in quality and bufferingreduced in quality5 – without reducing customer service and at reducedtotal cost.
What the 1st Axiom doesn’t suggest is the magnitude of improvementin cash position, productivity, and competitiveness that so many part-ners have reported. This magnitude, of course, depends on the cost ofthe buffering required by being “blind” and how much of a buffer reduc-tion (i.e., reduced inventory, capacity, and/or leadtime) a little “vision”provides.
So, will the future of supply-chain management involve even moreextensive information-sharing or delegation of decision-making and im-plementation between supply-chain partners? The 2nd Axiom suggestssome more, but, depending on the partnership, perhaps not a great dealmore.
The “2nd Axiom of the IDIB Portfolio” is this: Investment to im-prove the quality of any single component of an IDIB Portfoliowill, over some range, decrease the total cost of the portfolio;but, beyond some quality level, increase the total cost of theportfolio.
5Recall that, everything else being equal, reducing the amount of buffering reduces its capa-bility to compensate for imperfections. Hence, reducing the amount of buffering reduces its“quality”.
The state of practice in supply-chain management: a research perspective 21
Although “axioms” are supposed to be self-evident, a little discussionof the 2nd Axiom is appropriate. The 2nd Axiom considers what hap-pens to total portfolio cost if one varies the quality level of any singlecomponent of an IDIB Portfolio and adjusts the quality levels of theother three components to minimize the corresponding total portfoliocost. For example, consider varying the quality of implementation insome existing IDIB Portfolio. Applied to this example, the first halfof the proposition is that if implementation is very low in quality, forexample, that implementation leadtime has a large mean and variance,or that the accuracy of implementation is poor, then the total cost ofthis IDIB Portfolio can be reduced by: (1) increasing the quality ofimplementation; and (2) reducing the quality of the corresponding in-formation and/or decision-making systems, and/or reducing the amountof buffering (e.g., leadtime, capacity, or inventory).
The support for this proposition is that the cost of any of the four com-ponents of an IDIB Portfolio is an increasing and marginally-increasingfunction of its quality. In this instance, the proposition is that the costof a low-quality implementation system is small, and that the cost toimprove its quality is low compared to the high cost of the information,decision-making, and buffer systems required to work in combinationwith it. More specifically, given a low-quality implementation system,management would probably have been forced a very high-cost buffersystem, possibly one with large inventories, or possibly one with largeleadtime and/or capacity buffers. Hence, improving the quality of im-plementation – which should cost relatively little – and reducing thequality of its buffer system – which should save relatively more – willreduce total portfolio cost.
The second half of the proposition is that continuing to improve thequality of any single component and, correspondingly, decreasing thequality of one or more of the other three components of an IDIB Port-folio will, beyond some point, increase total portfolio cost. The supportfor this proposition, again, is that the cost of any of the four compo-nents of an IDIB Portfolio is an increasing and marginally-increasingfunction of its quality. In terms of the example, the proposition is thatif the implementation system is already operating at a very high level ofquality – e.g., nearly immediate, nearly perfect implementation – thenthe cost of any incremental improvement will be large relative to thesavings generated by the corresponding decreases in the quality levelsof buffering, information, or decision-making that this improvement inimplementation facilitates.
The 2nd Axiom might be called the “golden mean” axiom; that is, itdoesn’t make sense to invest too much in improving a single component
22
of the IDIB Portfolio without making corresponding improvements in itsother components.
7. The Future of Supply-Chain ManagementGiven that the current state-of-the-art in supply-chain management
involves some, perhaps even a great deal, of information-sharing andsome delegation of decision-making and implementation, the axiomssuggest that even if the net savings from more information-sharing anddelegation is positive, some other change in the IDIB Portfolio mayyield larger net savings. In other words, the question is not whethermore information-sharing or more delegated decision-making or moredelegated implementation will reduce total portfolio cost. Instead, thequestion is: Which changes in which components of the supply chain’sIDIB Portfolio will facilitate the largest reduction in total portfolio cost?
I believe that the most likely candidates for large cost savings arein collaborative decision-making and/or collaborative implementation.What’s “collaborative”?
Broadly speaking, “collaborative” and “shared” mean the same thing,but I use the word “collaborative” in order to make an important distinc-tion between visibility and participation. “Shared information” is aboutvisibility: that is, within some given domain, all the partners “see” thesame thing. Hence, “shared” decision-making or “shared” implementa-tion might be interpreted to mean decision-making or implementationthat is visible to all the partners. Although such visibility is impor-tant, participating in decision-making or participating in implementa-tion means something much more significant. Participation means thatboth partners’ objective functions, constraints, and relative capabilitiesare considered. From an operations-research perspective, collaborativedecision-making and implementation involve joint optimization, not in-dependent optimization.
The 2nd Axiom suggests that if partners are doing little or no collab-orative decision-making or implementation, then it is possible that thegreatest potential for improvement is in precisely these areas. Moreover,the higher the quality of the components of the supply chain’s IDIBPortfolio is in other respects, the more likely shared decision-makingand implementation are to provide the most significant total cost reduc-tions.6
6In addition, independent decision-making based on the same information, or delegateddecision-making and implementation, at best, yield locally-optimal decisions and actions.
The state of practice in supply-chain management: a research perspective 23
The IDIB Portfolio, The Goal, and the Theory of ConstraintsIn his ground-breaking book, The Goal (Goldratt and Cox, 1985), EliGoldratt introduced the concept of bottlenecks in a firm’s productioncapacity that limit its “throughput”; i.e., the rate at which a productionsystem generates money through sales. From the perspective of theIDIB paradigm, throughput is a dollar-oriented quality characteristicof a firm’s implementation (i.e., production) system. Correspondingly,Goldratt’s bottleneck concept is that this quality characteristic – thecapability of the implementation system to generate dollars through sales– is limited by the bottleneck process(es) internal to the implementationsystem.
Of course, a firm’s implementation system doesn’t generate through-put all by itself. Decisions must be made about what to produce, whento produce it, etc. This is the role of the decision-making system. And,in order to make decisions, the decision-making system requires informa-tion that’s provided by the information system. Finally, buffer systemsare there to provide throughput by compensating for whatever imper-fections might exist in the IDI systems. In other words, it is a firm’sentire IDIB Portfolio that generates money through sales, not just itsimplementation system.
Although Goldratt doesn’t recognize the IDIB Portfolio explicitly, hisprescriptions most certainly apply to it. For example, Goldratt pre-scribes that decision-making in the management system should be fo-cused on the “drum” of the implementation-system’s bottleneck(s) andthe “ropes” that feed it. Goldratt also has prescriptions about theform, location, and amount of buffering that should be provided7, andabout the nature of the information systems8 management should usein decision-making. In brief, Goldratt recommends that all four compo-nents of a firm’s IDIB Portfolio should be focused on the supply (anddemand) bottlenecks. Hence, the IDIB paradigm and the bottleneckparadigm are consistent, indeed, complementary, to one another.
Specifically, I believe that the IDIB paradigm enriches the paradigmof The Goal in several ways. For example, the IDIB paradigm suggeststhat the “goal” of making money can be achieved by virtually unlimitednumber of different IDIB Portfolios, each component contributing in itscharacteristic way (i.e., gathering information, making decisions, etc.),each imperfect in different ways, and each compensating for imperfec-
7For example, buffer inventory in front of bottlenecks and buffer leadtimes to protect deliverydates.8See Goldratt, 1991.
24
tions in the others. Second, of course, that the quality of each of thesecomponents is a decision variable.
Next, recall that Goldratt points out that the only guaranteed wayfor a firm to make money is to simultaneously increase throughput andreduce “inventory” and “operating expenses”.9 However, Goldratt offersrelatively little guidance about how to reduce inventory and operatingexpense, much less minimize them. The IDIB paradigm suggests how:select the least total-cost IDIB Portfolio. In other words, since most of afirm’s operating expenses are driven by management’s chosen IDI sys-tems and most of its inventory is in its safety-stock and capacity buffers,by carefully choosing its IDIB Portfolio, management will minimize itscombined operating expenses and inventory
Finally, note that the “bottleneck” concept is imbedded in the 2nd
Axiom. Here’s how: Consider a company with medium-to-high qualitydecision-making and implementation systems, but a low-quality infor-mation system. Under these circumstances, the overall quality of thiscompany’s IDI systems is limited by its low-quality information-system.According to the 2nd Axiom, if this company invests in a better informa-tion system, the overall quality of its IDI systems will improve. Thisimprovement facilitates the reduction in its associated buffers. Givensome (low) range of information-system quality, the effect should be toreduce the total cost of this company’s IDIB Portfolio.
Next, consider a company with an excellent implementation system,say a state-of-the-art cellular system, but with mediocre-quality infor-mation and decision-making systems. Additional improvement in thiscompany’s implementation system will yield an improvement in its over-all IDI systems, and facilitate a reduction of the corresponding buffers.However, the money saved on the buffer system may be less than theadditional cost of the improved implementation system. The result isan increase in total portfolio cost.
From Goldratt’s viewpoint, the “bottleneck” in the quality of firstcompany’s IDI systems is its information system: a dollar investedthere yielded more than a dollar saved on the buffer system, therebyreducing the firm’s total inventory and operating expenses. On the otherhand, the “bottleneck” in the quality of second company’s IDI systemswasn’t its implementation system. Hence, a dollar invested there is adollar wasted.10
9According to Goldratt, “inventory” is the dollars that a firm has invested in things thatit intends to sell, while operating expense is the cost of things that the firm does to turninventory into throughput.10Of course, neither of these improvements, whether they would reduce its total IDIB Port-folio cost or not, necessarily increases the company’s throughput. Throughput would only be
The state of practice in supply-chain management: a research perspective 25
The Future is Wow for Some Supply-Chain PartnersSome supply-chain partners are already sharing decision-making. Since1995, Heineken USA, Inc. and its independent distributors have beensharing information and decision-making about the replenishment ofHeineken’s beer products under a system called HOPS: the Heineken Op-erational Planning System (http://64.158.250.111/news/heineken.html and http://64.158.250.111/news/archive99/06091999.html).Intel and its customer computer-assemblers (e.g., IBM, Dell, Compaq)have been using a collaborative information- sharing and decision-makingsystem to manage the assembler’s inventories of computer chips underIntel’s Supply-Line Management (SLM) program.
One well–known and widely-implemented system for information-sha-ring and collaborative decision-making in supply chains is CollaborativePlanning, Forecasting, and Replenishment (CPFR).
8. Collaborative Planning, Forecasting, andReplenishment (CPFR)
CPFR is a process model, shared by a buyer and supplier, throughwhich inventory-status, forecast-, and promotion-oriented informationare shared and replenishment decisions are made. In IDIB Portfolioterms, a process model for sharing information and decision-making be-tween a buyer and supplier.
CPFR began with a pilot program between Wal-Mart and Warner-Lambert, called CFAR: “Collaborative Forecasting and Replenishment”.In 1997, the Voluntary Interindustry Commerce Standards (VICS) Asso-ciation (http://vics.org) developed the “CPFR Initiative” (http://www.cpfr.org). In 1998, VICS published the first “CPFR Guidelines”(http://www.cpfr.org/Guidelines.html). Since then, a large num-ber of partners have developed CPFR pilots. Appendix 1 provides apartial list. Several partnerships have subsequently adopted CPFR as astandard way of doing business with one another.
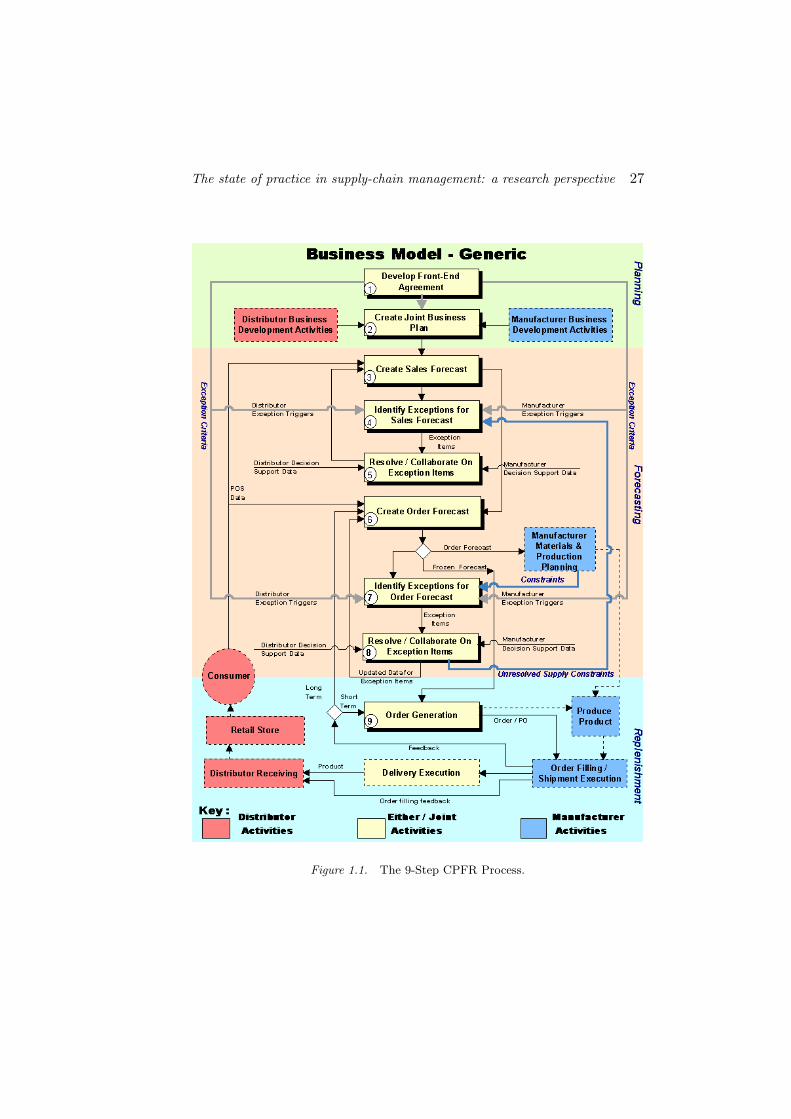
The CPFR ProcessCPFR consists of 9 process steps, as follows:
Step 1. Develop Front-End Agreement: Roles, Measurement, Readi-ness
increased if the changes to the entire IDIB Portfolio increase availability or otherwise makethe company’s products more competitive. Nonetheless, even if throughput isn’t increased,reducing the total IDIB Portfolio cost reduces a company’s operating expense, which increasesprofits; i.e., makes more money.
26
Step 2. Create Joint Business Plan: Strategies and Tactics
Step 3. Create Sales Forecasts: Buyer and supplier both create custo-mer-demand forecasts
Step 4. Identify Exceptions in Sales Forecasts
Step 5. Resolve Exceptions: Agree on single forecast or agree to dis-agree
Step 6. Create Order Forecasts: Buyer and supplier both create plansfor buyer orders
Step 7. Identify Exceptions in Order Forecasts
Step 8. Resolve Exceptions: Agree on single plan for buyer orders
Step 9. Order Generation
More details about these steps and the roles of the buyer and supplierin each step are provided in Figure 1.1 and at the VICS CPFR website(http://www.cpfr.org). However, the basics of CPFR are straightfor-ward: First, the partners share information about demand. If the buyeris a retailer – and so far, most buyers using CPFR are retailers, thendemand is retail customer demand. If the buyer is a manufacturer orassembler then demand is generated by the manufacturer or assembler’strial master-production schedule. Then, significant differences betweenthe buyer’s and seller’s demand forecast, labeled “exceptions”, are dis-cussed and resolved. These are Steps 3-5 above. Then, buyer and sup-plier share plans for orders that the buyer will place with the supplier,based on the shared demand forecasts. Again, exceptions are identifiedand resolved (Steps 6-8). Subsequently, using the shared order plan, ac-tual orders are generated (Step 9). The foundation for Steps 3-9 is theso-called “front-end agreement”, under which the roles of the buyer andsupplier, and their capabilities to perform these roles are assessed. Inthis step, targeted performance and measures are also adopted. In Step2, strategies and tactics are specified in detail.
The benefits reported by CPFR partners, as might be predicted bythe axioms, are increased inventory turns (i.e., lower buffer inventory)and increased fill-rates for the SKU’s involved; that is, higher levels ofcustomer service.
Several consulting firms offer software systems and support for CPFR,among them Logility, Inc. (http://www.logility.com) and Syncra Sys-tems, Inc. (http://www.syncrasystems.com). CPFR is also being im-plemented on B2B exchanges such as Worldwide Retail Net, Transora,and NetXchange.
The state of practice in supply-chain management: a research perspective 27
Figure 1.1. The 9-Step CPFR Process.
28
Based on the success of CPFR between single buyer-supplier pairs,thought leaders in CPFR have suggested its extension to include collab-oration with the carrier that transports goods between the buyer andsupplier. This is called “CTM”: Collaborative Transportation Manage-ment (http://www.cpfr.org/WhitePapers/CTMwhitepaper.pdf). Ithas also been suggested that in order to be truly successful, collabo-ration should involve all of the links of a supply chain, under a schemelabeled “n-Tier Collaboration” (http://www.cpfr.org/WhitePapers/nTierProposal.doc). Under such a scheme, for example, not onlywould Kimberly-Clark collaborate with Wal-Mart to plan Wal-Mart’sorders of Kimberly-Clark products, but Kimberly-Clark would, in turn,collaborate with its suppliers to determine Kimberly-Clark’s orders formaterials for its paper products. So, in effect, Wal-Mart and Kimberly-Clark’s suppliers would be collaborating with Kimberly-Clark to deter-mine plans to supply and order Kimberly-Clark’s paper products.
The Challenges of CPFRAlthough CPFR has enormous potential for reducing the total cost ofany supply chain’s IDIB Portfolio, there are also enormous challenges.At the most fundamental level, buyers and suppliers must develop trustthat each will treat the other fairly and honestly. Prerequisite for this areincentives to do so. Again, see Cachon, 2004 for a review of the supply-chain literature on the management of incentive conflicts with contracts.On a technical level, buyers and suppliers must develop a common lan-guage for identifying products and making decisions about them. (Seehttp://www.cpfr.org/WhitePapers/CollaborationDataModelingA.pdf). Similarly, systems must be developed for linking the buyer’s andsupplier’s business processes. This will involve a great deal of systemchange and training. Third, security protocols must be implementedthat will safeguard both partners from leaks of proprietary information.
Nonetheless, I believe that buyers and suppliers who find ways toovercome these challenges will achieve a competitive advantage, par-ticularly for products that complete primarily on price and availability(e.g., consumer products). This advantage will either force the competi-tors of CPFR partners to adopt similar techniques or force them out ofbusiness.
9. Research Topics in CPFRCPFR poses many interesting questions for supply-chain researchers,
questions whose answers involve models that have yet to be developed.At the broadest level, there are questions involving the “drivers” for
collaboration. For example, what are characteristics of buyers, suppliers,
The state of practice in supply-chain management: a research perspective 29
and the environments in which they operate that promotes a desire oneither of their parts to collaborate using CPFR? It is well known thatagency losses occur in decentralized supply chains that involve hiddeninformation and/or hidden actions. What is less well known are thecircumstances under which both the buyer and supplier will be betteroff by collaborating. See, for example, Monahan, 1984; Weng, 1995 andTaylor, 2001. In the absence of these circumstances or other incentivesfor it, collaboration, in general, and CPFR, in particular, seem doomed.
With respect to CPFR in particular, consider a buyer-supplier pair.Among the most interesting research questions are: First, how should the“front-end” agreement be structured in order to maximize – or merely,increase – the profits for both partners? What role will each partnerplay? How should performance improvement be measured? Perhapsmost important: how should the benefits of improved performance beshared between the buyer and the supplier so that both will be betteroff?
Another set of interesting questions involves defining the elements ofthe data to be shared. For example, given the cost of data processing andsecurity considerations, should SKU-level data be shared or should onlyaggregate information be shared? What aggregation/disaggregation pro-cedures are best?
Finally, given that there are costs and benefits associated with excep-tion-processing, regardless of how they are processed, how should excep-tions be defined? More fundamentally, what does it mean to process anexception; that is, given a significant difference between and the buyer’sand seller’s forecast (planned orders), how should the difference be re-solved?
10. Research Topics Related to Supply-ChainCollaboration
Another set of interesting research questions involves the examina-tion of supply-chain collaboration in general, whether or not the toolsused are those of CPFR. For example, given a supply chain with somegiven level of collaboration in information-sharing, decision-making, im-plementation, and buffering – including no collaboration whatsoever –then, assuming that collaboration will be increased, which links shouldbe involved, and in which components of the IDIB Portfolio will col-laboration yield the largest payoffs to the partners involved and to theentire supply chain? Further, how will be benefits of collaboration bemeasured and shared among partners and along the chain?
30
An equally interesting set of questions involves collaboration itself.For example, consider a supply chain with some given level of collab-oration in information-sharing, decision-making, implementation, andbuffering – including no collaboration whatsoever. Then, given the costsand challenges of collaboration, is collaboration the most cost-effectiveway to improve supply-chain performance? In particular, improving thequality of one or more of the components of one of the partner’s IDIBPortfolios may yield larger improvements at lower cost. If so, then,again, how will benefits be measured and shared?
11. Research on the IDIB PortfolioIn generalizing the OR paradigm, the IDIB Portfolio paradigm pro-
vides rich and challenging opportunities for operations researchers.I believe that the OR paradigm has focused almost entirely on model-
ing only a single component of supply-chain IDIB Portfolios, typically onthe decision-making component. To the extent that the associated infor-mation and implementation systems are represented at all, these modelstreat them as fixed, as costs, or as constraints, but not as decision-variables. For example, such models typically take the quality of theinformation system as given (e.g., demand is known or given by someparticular probability distribution with fixed parameters) and implemen-tation systems are represented as parameterized leadtimes or by theircost drivers (e.g., the parameterized cost of performing a set up or theunit cost of holding inventory). The form of buffering (i.e., inventory,leadtime, or capacity) is usually also fixed. In general, the objectivefunction is to select the decision (or decision-rule) that minimizes the as-sociated implementation costs plus the too-much and not-enough costsassociated with the buffer system. Other models, in particular, thosethat treat either the information system or the implementation systemas a decision variable, typically ignore the other three components ofthe IDIB Portfolio as decision variables.
That’s the “bad news”.The “good news” is that the OR paradigm’s focus has facilitated the
development of fairly sophisticated decision rules and provided limitedinsight into information and implementation systems. It is also “goodnews” that many of the techniques employed in the OR paradigm, forexample, well-proven estimation and optimization techniques, can beapplied to improving, if not optimizing, the IDIB Portfolio model of amanagement system. For example, cost-estimating techniques that arealready being applied to estimating the cost of a given implementation
The state of practice in supply-chain management: a research perspective 31
system can be applied to determining the cost of alternative information,implementation, and buffer systems.
Notwithstanding the availability of OR tools, the challenges of IDIBPortfolio optimization, even if done heuristically, are daunting. Recall,the “optimal IDIB Portfolio” is the portfolio of information, decision-making, implementation, and buffering whose combined cost plus thecost of failing to provide precisely was demanded or required (e.g., back-ordering or expediting cost) is the minimum possible cost. Hence, IDIBPortfolio optimization involves four decision-variables, not simply one.Further, in order to be useful in selecting an IDIB Portfolio, IDIB modelsmust be able to capture complex cost-quality interactions among thesecomponents, not just the cost-quality characteristic of each component.
Practice-oriented research also presents interesting research opportu-nities. For example, consider a firm’s current IDIB Portfolio and assumemanagement has the desire to “improve” it. The question is: Where(i.e., which component) is the “bottleneck” of the current IDI systemsand what improvement should be made to it? Before this question canbe answered, operations researcher must first develop techniques andmeasures to assess the capabilities of each of its components. Next, inorder to make the most cost-effective improvement, managers will re-quire a priori estimates of the marginal costs and benefits of the nextincrement in quality in their current components. Further, there arequestions relating to the timing of IDIB Portfolio changes. For example,although adopting current technology might reduce total portfolio cost,should management forego adopting it, and, instead, wait for new tech-nology that might provide even larger total cost reductions? Technologyforecasting must play a role in answering this question.
Despite the daunting nature of the challenges to improving a firm’scurrent IDIB Portfolio or optimizing a proposed IDIB portfolio, oper-ations researchers will be foregoing a tremendous opportunity if theycontinue to focus on optimizing one component of the IDIB portfolio ata time. Worse, they commit the Cardinal Sin of Operations Research:Sub-Optimization.
12. Some Related LiteratureMost of the literature in supply-chain management can be viewed from
the perspective of the IDIB Portfolio. As explained above, I believe thatmost of this literature examines the choice of the decision (e.g., orderquantity, target inventory) or decision-rule (e.g., EOQ) to minimize totaltoo-much and not-enough costs. See the discussion of the newsvendormodel above, for example. Some of this literature also examines the
32
impact of implementation issues on decision-making. For example, ina highly-stylized way the EOQ formula represents the impact of set-up (i.e., implementation) cost on the optimal order quantity. However,there are some signs of interesting developments.
A growing body of literature examines the value of information-sharingin managing a supply chain. Lee et al., 2000, for example, have shownthat information-sharing can dampen the so-called “bullwhip effect” sooften observed in supply chains. Chen et al., 2000, have shown thatthe bullwhip effect can be reduced by centralizing information. Cachonand Fisher, 2000, study the value of sharing demand and inventory-level information in a supply chain. Aviv, 2001, examines the effect ofcollaborative forecasting on supply-chain performance.
A small, but growing body of research involves collaborative replen-ishment decision-making to take advantage of shared information. Forexample, Song and Zipkin, 1996, develop an inventory-replenishmentpolicy to take advantage of information about supply conditions. Aviv,2002, examines joint forecasting and replenishment processes. Iyer andYe, 2000, develop a model to assess the value of information-sharing ina retail environment in which retailers share promotional informationwith their suppliers.
However, I am not aware of any research that addresses itself to “man-aging the IDIB Portfolio”; that is, making decisions about the natureand quality of all its four components: the information, decision-making,implementation, and buffer systems.
Nonetheless, there are two papers of particular relevance to “managingthe IDIB Portfolio” that I would like to draw attention to:
Milgrom and Roberts, 1988, develop a model of a manufacturer andthe market for its products, and, for this particular model, establishthat the optimal management system will either produce to inventoryor produce to customer order. In IDIB Portfolio terms, Milgrom andRoberts examine a model in which there is a cost to acquire informationabout market demand and a cost to produce. Their analysis concludesthat a profit-maximizing firm will either: (1) acquire no additional in-formation about customer demand and produce entirely to inventory; or(2) acquire complete information about customer demand and produceentirely to customer order.
It should be noted that Milgrom and Robert’s result is specific to theassumptions of the model they propose. Other assumptions would yielddifferent results. For example, Milgrom and Robert’s model ignores theproduction (implementation) leadtime, customer preferences, and com-petition. Given significant production leadtimes and customer prefer-ence for availability over variety, a manufacturer that might otherwise
The state of practice in supply-chain management: a research perspective 33
choose make-to-order might be forced to make to stock. Alternatively,given customer preference for variety over availability, a manufacturerthat might otherwise choose make-to-stock might be forced to make toorder. Nonetheless, Milgrom and Roberts are the first to suggest trade-offs between information and inventory (i.e., one form of buffer).
Hariharan and Zipkin, 1995 implicitly suggest tradeoffs between thecharacteristics of a company’s information system and implementationsystem. In particular, within a supply-chain setting, they establish theequivalence between the information system’s ability to “see” one more(less) period of demand into the future and the ability of the implemen-tation system to produce one period faster (slower).
The use of the “ICB Portfolio” paradigm, which is closely related tothe IDIB paradigm, in teaching operations management can be found inSchwarz, 1998.
13. SummaryIn this chapter, I have introduced a new paradigm for management in
general and for managing supply chains, in particular, called the IDIBPortfolio. The IDIB Portfolio, which can be viewed as a generalization ofthe OR paradigm, takes the view that the quality of all four componentsof a management system – not just the buffer system quality (i.e., size)– are decision variables; and that the underlying quality-cost functionfor each of these components – that is, the cost to move them in thedirection of perfection – is increasing and marginally increasing. Finally,that there is a cost associated with the entire IDIB Portfolio – again,not just the buffer system – for failing to provide whatever is requiredor demanded. Hence, the “optimal” IDIB Portfolio is the portfolio thatminimizes the total costs of all of its components plus the cost of failingto provide whatever is required or demanded.
The IDIB Portfolio and its axioms provide insight into the evolutionof supply-chain practice to date, and, I believe, suggest that the future ofsupply-chain management practice will involve a significant level of col-laborative decision-making and implementation: a level of collaborationin decision-making and implementation that is comparable to the level ofinformation-sharing in contemporary supply-chain management. I havedescribed the VICS CPFR initiative as one example of this future. Fi-nally, I have suggested several research topics involving CPFR and, morebroadly, challenging new research into the IDIB Portfolio paradigm.
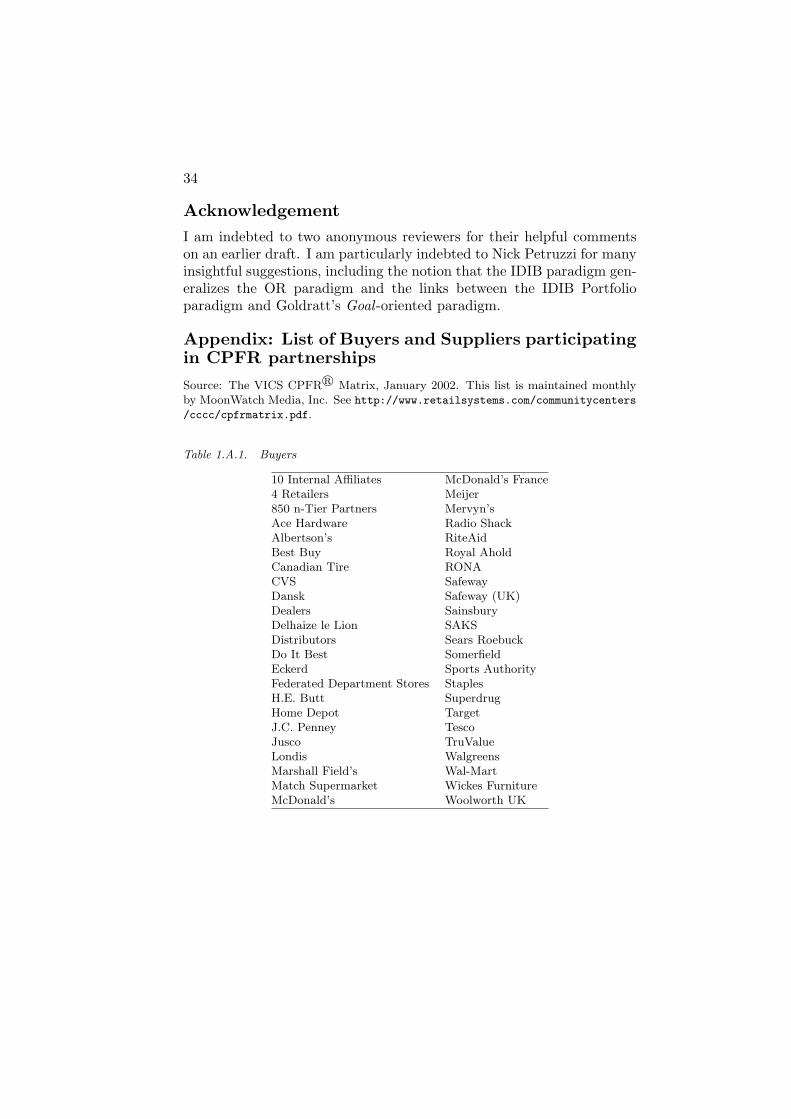
34
AcknowledgementI am indebted to two anonymous reviewers for their helpful commentson an earlier draft. I am particularly indebted to Nick Petruzzi for manyinsightful suggestions, including the notion that the IDIB paradigm gen-eralizes the OR paradigm and the links between the IDIB Portfolioparadigm and Goldratt’s Goal -oriented paradigm.
Appendix: List of Buyers and Suppliers participatingin CPFR partnerships
Source: The VICS CPFRr Matrix, January 2002. This list is maintained monthlyby MoonWatch Media, Inc. See http://www.retailsystems.com/communitycenters
/cccc/cpfrmatrix.pdf.
Table 1.A.1. Buyers
10 Internal Affiliates McDonald’s France4 Retailers Meijer850 n-Tier Partners Mervyn’sAce Hardware Radio ShackAlbertson’s RiteAidBest Buy Royal AholdCanadian Tire RONACVS SafewayDansk Safeway (UK)Dealers SainsburyDelhaize le Lion SAKSDistributors Sears RoebuckDo It Best SomerfieldEckerd Sports AuthorityFederated Department Stores StaplesH.E. Butt SuperdrugHome Depot TargetJ.C. Penney TescoJusco TruValueLondis WalgreensMarshall Field’s Wal-MartMatch Supermarket Wickes FurnitureMcDonald’s Woolworth UK
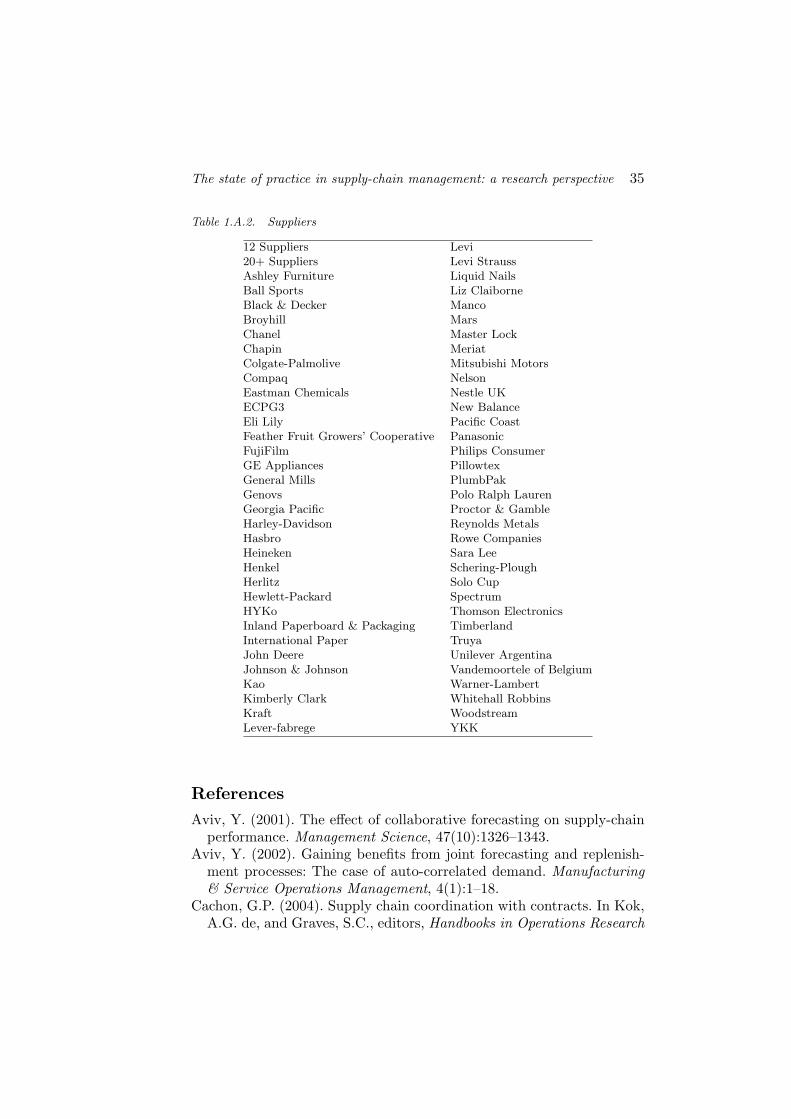
The state of practice in supply-chain management: a research perspective 35
Table 1.A.2. Suppliers
12 Suppliers Levi20+ Suppliers Levi StraussAshley Furniture Liquid NailsBall Sports Liz ClaiborneBlack & Decker MancoBroyhill MarsChanel Master LockChapin MeriatColgate-Palmolive Mitsubishi MotorsCompaq NelsonEastman Chemicals Nestle UKECPG3 New BalanceEli Lily Pacific CoastFeather Fruit Growers’ Cooperative PanasonicFujiFilm Philips ConsumerGE Appliances PillowtexGeneral Mills PlumbPakGenovs Polo Ralph LaurenGeorgia Pacific Proctor & GambleHarley-Davidson Reynolds MetalsHasbro Rowe CompaniesHeineken Sara LeeHenkel Schering-PloughHerlitz Solo CupHewlett-Packard SpectrumHYKo Thomson ElectronicsInland Paperboard & Packaging TimberlandInternational Paper TruyaJohn Deere Unilever ArgentinaJohnson & Johnson Vandemoortele of BelgiumKao Warner-LambertKimberly Clark Whitehall RobbinsKraft WoodstreamLever-fabrege YKK
ReferencesAviv, Y. (2001). The effect of collaborative forecasting on supply-chain
performance. Management Science, 47(10):1326–1343.Aviv, Y. (2002). Gaining benefits from joint forecasting and replenish-
ment processes: The case of auto-correlated demand. Manufacturing& Service Operations Management, 4(1):1–18.
Cachon, G.P. (2004). Supply chain coordination with contracts. In Kok,A.G. de, and Graves, S.C., editors, Handbooks in Operations Research
36
and Management Science: Supply Chain Management. North-Holland,Amsterdam, The Netherlands. Forthcoming.
Cachon, G.P. and Fisher, M. (2000). Supply-chain inventory manage-ment and the value of shared information. Management Science, 46(8):1032–1050.
Cetinkaya, S. and Lee, C. (2000). Stock replenishment and shipmentscheduling for vendor-managed inventory systems. Management Sci-ence, 46:217–232.
Chen, F., Drezner, Z., Ryan, J.K., and Simchi-Levi, D. (2000). Quanti-fying the bullwhip effect in a simple supply chain: The impact of fore-casting, leadtimes, and information. Management Science, 46(3):436–443.
Ehrhardt, R. and Taube, L. (1987). An inventory model with random re-plenishment quantities. International Journal of Production Research,25:1795–1804.
Fiorito, S.S., May, E.G., and Straughn, K. (1994). Quick response inretailing: Components and implementation. International Journal ofRetail and Distribution Management, 23:12–21.
Goldratt, E. (1991). The Haystack Syndrome: Sifting Information Outof the Data Ocean. North-River Press, Groton-on-Hudson, New York.
Goldratt, E. and Cox, J. (1985). The Goal. North-River Press, Groton-on-Hudson, New York.
Hariharan, R. and Zipkin, P. (1995). Customer-order information, lead-times, and inventories. Management Science, 41:1599–1607.
Iyer, A.V. and Ye, J. (2000). Assessing the value of information-sharingin a promotional retail environment. Manufacturing & Service Oper-ations Management, 2(1):128–143.
Karlin, S. (1958). One-stage models with uncertainty. In Arrow, K.J.,Karlin, S., and Scarf, H., editors, Studies in the Mathematical Theoryof Inventory and Production, chapter 8. Stanford University Press,Stanford, California.
Lee, H., Padmanabhan, V., and Whang, S. (1997). Information distor-tion in a supply chain: The bullwhip effect. Management Science,43:546–558.
Lee, H., So, K.C., and Tang, C.S. (2000). The value of information-sharing in a two-level supply chain. Management Science, 46(5):626–643.
Lowe, T. and Schwarz, L.B. (1983). Parameter estimation for the EOQlot-size model: Minimax and expected value choices. Naval ResearchLogistics, 30(2):367–376.
The state of practice in supply-chain management: a research perspective 37
Milgrom, P. and Roberts, J. (1988). Communication and inventory assubstitutes in organizing production. Scandinavian Journal of Eco-nomics, pages 275–289.
Monahan, J.P. (1984). A quantity-discount pricing model to increasevendor profits. Management Science, 30:720–726.
Schwarz, L.B. (1998). A new teaching paradigm: The information/control/buffer portfolio. Production and Operations Management, 7:125–131.
Song, J.S. and Zipkin, P.H. (1996). Inventory control with informationabout supply conditions. Management Science, 42(10):1409–1419.
Taylor, T.A. (2001). Channel coordination under price promotion, midlifereturns, and end-of-life returns in dynamic markets. Management Sci-ence, 47:1220–1234.
Weng, Z.K. (1995). Channel coordination and quantity discounts. Man-agement Science, 41:1509–1522.
Yano, C. and Lee, H. (1995). Lot sizing with random yields: A review.Operations Research, 43:311–334.