the state of north carolina urban distressed communitiesthe state of north carolina urban distressed...
TRANSCRIPT

Authored by Allen Serkin & Stephen Whitlow Prepared for the North Carolina Metropolitan Coalition
May, 2005

The State of North Carolina Urban Distressed Communities
Allen Serkin & Stephen Whitlow
Center for Urban and Regional Studies The University of North Carolina at Chapel Hill Campus Box 3410 Chapel Hill , N .C . 27599-3410 Tel: (919 ) 962 -3074 Fax : (919) 962-2518 www.unc.edu/depts/curs
February 2005
Prepared for : North Carolina Metropolitan Coalition www.ncmetros .org
CURS Report No . 2005-01

Introduction 2 Notes 24 County Comparison 3 Appendix A 25 Defining Distress 4 Appendix B 26 Statewide Distressed Tracts 5 Asheville 6 Burlington 7 Charlotte & Gastonia 8 Greenville, Goldsboro, Rocky Mount 9 Fayettevi lie 10 Hickory 11 Jacksonville & Wilmington 12 The Triad 13 The Triangle 14 Urban Tracts & Urban Counties 15 Demographics 16 Economic Characteristics 17-18
~ . ....... ,. . ... c:;:wt~~=-~=-:.11
Social Characteristics 19-20 . . r , ' ailliEuU&......;j f · • • - '
Housing Characteristics 21 -
·. 10 · w~U t-! OI'll t~ IN DfiiTH CA'ST
l~ ~ fll fE Grt~l'nsboro
Conclusion 22 Summary of findings 23
1

North Carolina is a state in the
midst of rapid change. I Portions of the state have recently experienced an anemic economy and job losses, while others remain strong engines of wealth and job creation . Population growth continues to be strong with residents moving to North Carolina from other states and countries .
The major urban areas of North Carolina- led by the Charlotte region , the Triad, and the Triangle - have experienced rapid population growth and increasing economic prosperity in recent decades , witnessed most clearly in the continued expansion of the suburban landscape .
However, there is an often overlooked underside to the rapid development of North Carolina's urban regions : pockets of decay and neglect at the cen ter of our largest cities .
Too often these areas , in dire need of relief, are neglected by decision makers at the State level for a number of reasons : 1) they may be unaware of the extent of privation in urban communitiesi 2 ) they may assume the most intense economic and social distress is found in rural
parts of the statei or 3) they may assume that the wealth of large urban areas ameliorates the distress found in the urban core.
This report challenges all of these notions . We utilize Census data at the tract level to pinpoint distressed urban communities. We adopt this method because to truly get an accurate representation of distress , the level of analysis must be more selective than the county level. County level analyses are so broad as to statistically dilute the depth of distress in urban communities because of the surrounding suburban wealth , lending support to the incorrect assumption that economic distress in North Carolina is primarily a rural problem . We present evidence to show that there are areas of extreme privation in North Carolina cities, and that these areas rival if not surpass the conditions prevalent in rural North Carolina .
Our analysis includes the following highlights:
• What county level analyses tell us -and what they miss
• A definition of distress • Maps of distressed areas • Demographic characteristics of the
urban distressed population • The economic, social , and housing
conditions faced in urban distressed communities
• A comparison of urban distressed areas to rural distressed areas within North Carolina
2

County Comparison Comparing North Carolina urban
counties to rural counties* suggests that rural counties are more distressed than urban counties in critical ways . Rural cou nties have lower per capita income and
higher rates of poverty and unemployment. Rural county residents also lag urban county residents overall on a number of factors relating to educational attainment, housing quality, and access to health care (not shown ).
However, an analysis utilizing data
at the county level may hide pockets of distress , especially those within counties where relatively wealthy urban and suburban areas are located.
We suggest geographically high
lighting these distressed urban areas to better understand their populations' posi
tion relative to North Carolina residents generally and rural North Carolina resi dents specifically.
*Rural counties are defined as those counties with a population density of Jess than 200 per square mile based on 1990 Census figures. Urban counties ore those with greater than 200 persons per square mile. Source: The North Carolina Rural Economic Development Center
N '-0 ,....
~
"' I.() ....
"'
~
3

Distress, in the context of this briefing, refers generally to a lack of the characteristics that most associate with producing quality of life . Among these are access to employment, education , quality housing, and health care .
There is no universally accepted standard for defining areas of distress . Most, however, include some combination of measures of income, poverty, and
unemployment.2 We define distressed areas as
those which met all three of the follow ing criteria in 2000:
• Unemployment rate greater than or equal to 150% of the North Carolina average unemployment rate of 3.4% (greater than or equal to 5 . 1 o/o)
• Per capita income less than or equal to 67% of the North Carolina average per capita income of $20,307 (less than or equal to $13 ,606)
• Poverty rate greater than or equal to 150% of the North Carolina average poverty rate of 12 .3 o/o (greater than or equal to 18.45% )
Our measure of distress allows us to isolate distressed urban areas at the Census tract level. The U .S Census Bureau produces the best and most consistent data at a scale below the county level.
All North Carolina distressed tracts were then classified as Urban or Rural according to whether the tract's geographic center falls inside of Census designated Urbanized Areas. An Urbanized Area is defined as "an area consisting of a central place(s) and adja cent territory with a general population density of at least 1,000 people per square mile of land area that together have a minimum residential population of at least 50,000 people ."
This method allows us to achieve a number of objectives: • Compare the attributes of urban
distressed tracts to North Carolina counties in which these tracts are located to see to what extent the wealth of urban counties overshadows the privation of distressed areas .
• Look at a number of demographic, social and economic characteristics of
residents of urban distressed areas . • Compare characteristics of urban dis
tressed tracts with North Carolina as a whole and with distressed rural tracts .
v
4
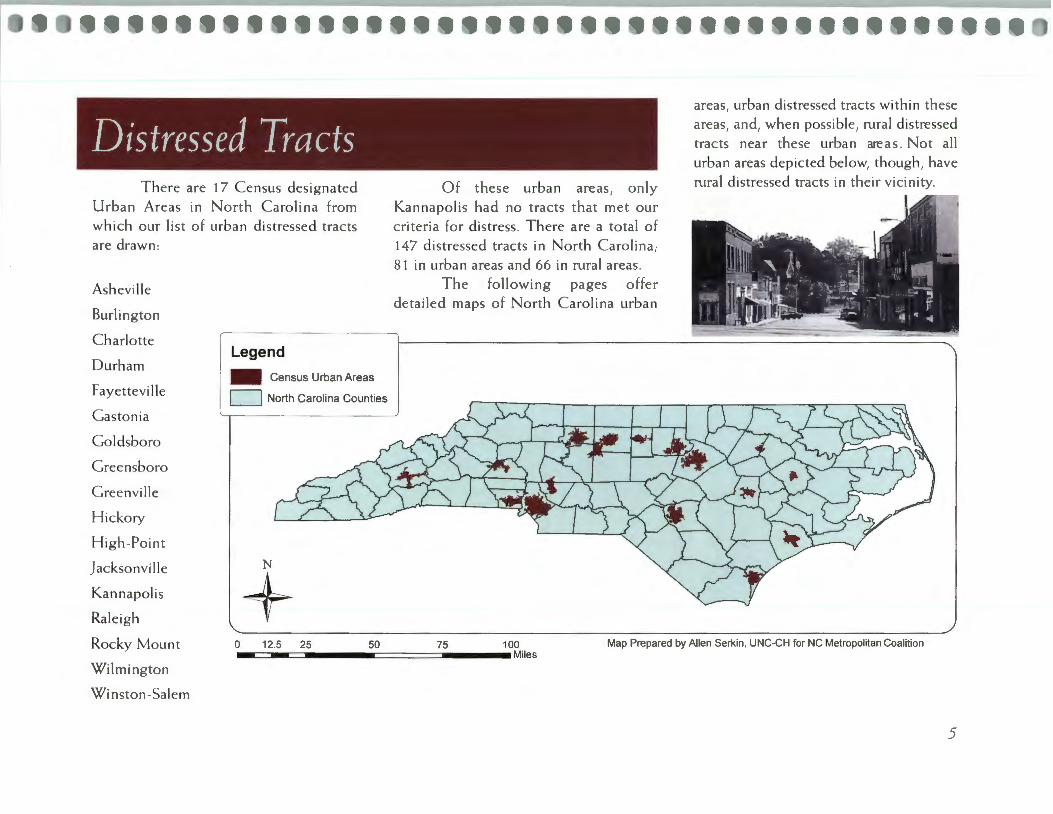
There are 17 Census designated Urban Areas in North Carolina from which our list of urban distressed tracts are drawn :
Legend
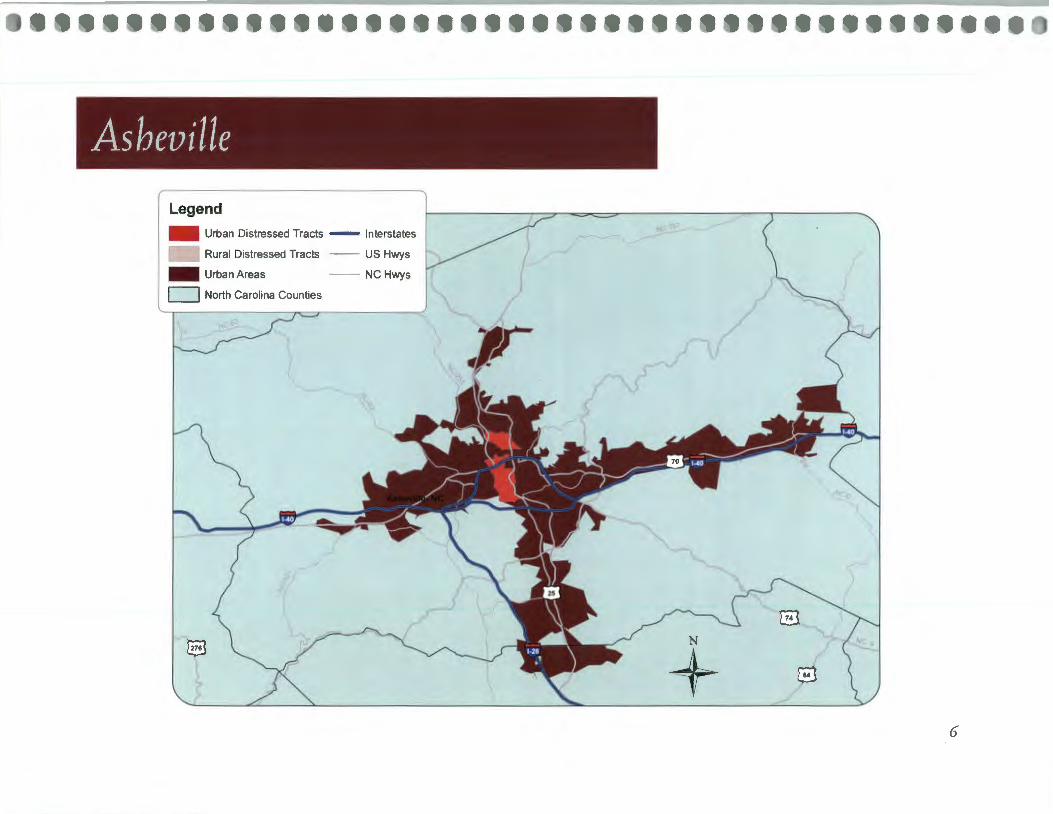
Asheville
Burlington
Charlotte
Durham
Fayetteville
Gastonia
.. Census Urban Areas
c:::=J North Carolina Counties
Goldsboro
Greensboro
Greenville
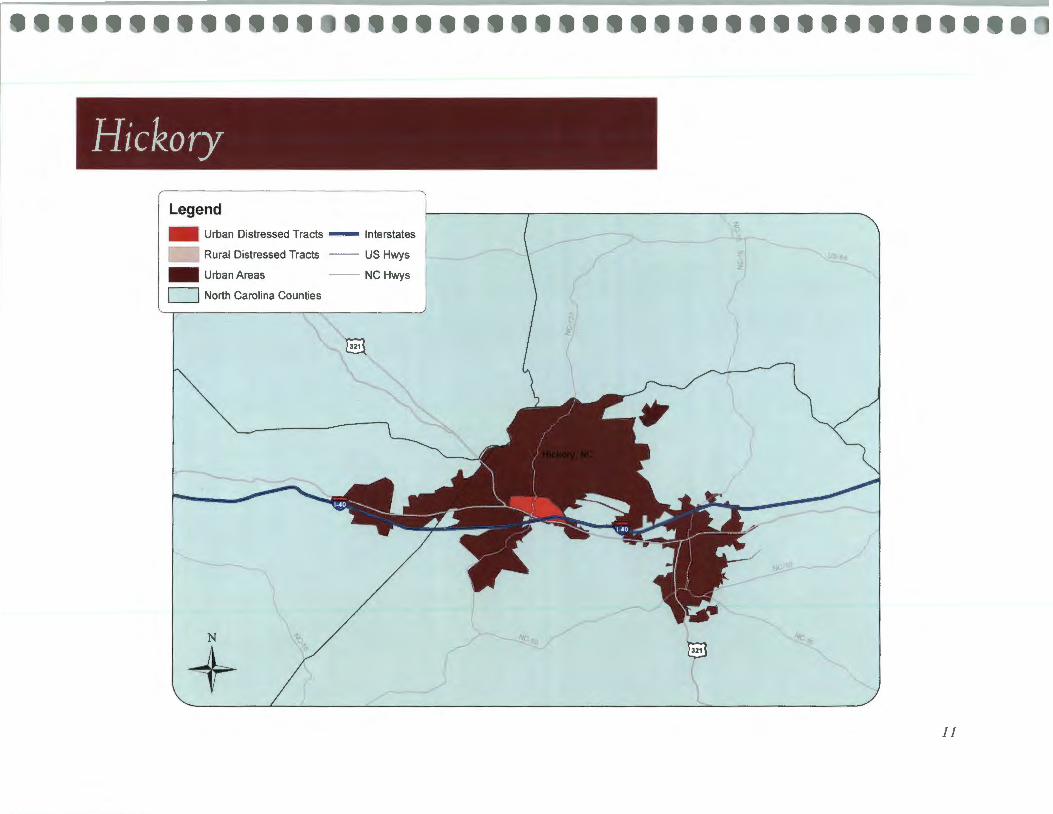
Hickory
High -Point
J acksonvi lie
Kannapolis
Raleigh
Rocky Mount
Wilmington
Winston-Salem
N
+ 0 12.5 25 50 - -
Of these urban areas , only Kannapolis had no tracts that met our criteria for distress . There are a total of 147 distressed tracts in North Carolinai 8 I in urban areas and 66 in rural areas .
The following pages offer detailed maps of North Carolina urban
areas, urban distressed tracts within these
areas, and, when possible , rural distressed tracts near these urban areas . Not all urban areas depicted below, though, have rural distressed tracts in their vicinity.
75 100 Map Prepared by Allen Serkin, UNC-CH for NC Metropolitan Coalition Miles
5
Dill
r
m
(I) co
(I)
z c
::0
c ::::s
0
a-c::
a-
a.
:::1.
~
::::T
Il
l Il
l ::
l ::
l 0
)>
0 0
Ill
ro !a:
g
Ill
ro !a'
::
l (J
) (J
) ro
Ill
(J)
(J)
0 (I
) (J
)
a.
(I)
0 a.
c::
~
-i
::l
Ill
iil ffi'
0 Cii
n. (J
) (J
)

Dill
r- CD
cc
CD
z c
::0
c ::::
J 0
a-c
a-c.
;::
:!.
Q) ~
Q)
:::T
::J
::J
()
:to
0 0
Q)
ro c;;
· c;;
· g
Q)
~ ~
::J
(/)
(/)
Q)
(/)
(/)
CD
(/)
()
a.
CD
0 a.
c
:;I
--i
~
Q)
D.l Cii
" n
n. (/
) U
i (/
)
I I
z c
::J
()
(/)
CD
:::r:
:::r:
Ul
:E :E
6i
'<
'<
CD
(/)
(/)
Z-(/
)

Legend
- Urban Distressed Tracts - Interstates
- Rural Distressed Tracts -- US Hwys
- Urban Areas NC Hwys
CJ North Carolina Counties
"1r.;7
N<
N
+ ~ ...
0 8
8

Legend
- Urban Distressed Tracts - Interstates
- Rural Distressed Tracts -- US Hwys
- Urban Areas
0 c::J North Carolina Counties
§3
§3
9

Dill
r (!)
cc
(!)
z c
:::0
c ::
I 0
a-c:
a-
c.
;::l.
~
::J"
Q)
Q)
8 :::
l :::
l ()
)>
0 0
Q)
CD
iii"
g Q
) ~ ~
·
:::l
rJI
rJI
CD
Q)
rJI
rJI
C1l
rJI
()
a.
C1l
0 a.
c:
~
-i
;:!.
iil ro·
() r;;
n. rJ
I rJ
I
"" I I
z c
5"
()
(J)
ro I
I Ul
:::
::: iii
'<
'<
rJ
I rJ
I ro rJ
I
Legend
- Urban Distressed Tracts - Interstates
- Rural Distressed Tracts
- Urban Areas
CJ North Carolina Counties
N
+
8
us Hwys
NC Hwys
tv.
8
11

Jacksonville & Wilmington
Legend
- Urban Distressed Tracts - Interstates
- Rural Distressed Tracts -- US Hwys
- Urban Areas NC Hwys
C=:J North Carolina Counties
N
+ 12

Legend
- Urban Distressed Tracts - Interstates
- Rural Distressed Tracts - US Hwys 0
- Urban Areas NC Hwys s [:=::J North Carolina Counties s
NC.\
N
,...v s +
13

"~'
N
+ GJ z ,('
NC
Legend
- Urban Distressed Tracts - Interstates
- Rural Distressed Tracts -- US Hwys
- Urban Areas NC Hwys
'lr..ga
14

Urban Tracts and Urban Counties Utilizing our measure of distress ,
we can look at key indicators to see how the 81 urban distressed tracts differ from the counties* in which they are located.
The per capita income in urban distressed tracts is less than half that of the urban counties. The poverty rate of the population living in urban distressed tracts is three times that of the urban counties as a whole . Similarly, the unemployment rate in urban distressed tracts is nearly three times that of the urban counties .
Clearly, then , distressed urban tracts lag significantly behind their more affluent countywide neighbors . Analyses using county-level data miss the depth and intensity of the poverty in these tracts because of the great wealth in other parts of these counties. Our analysis therefore proceeds using only tract-level data in order to more accurately report the state of urban distressed tracts.
*There ore 16 urban counties containing the 81 urban distressed tracts: Alamance, Buncombe, Cotowba, Cumberland, Durham, Edgecombe, Forsyth, Gaston, Guilford, Mecklenburg, Nosh, New Hanover, Onslow, Pitt, Woke, Wayne
~
15

Demographics North Carolina has over 550
thousand residents living in distressed tracts, representing nearly seven percent of the state's population . Forty seven percent of all distressed residents live in the 81 designated urban distressed tracts compared to 53 percent in 66 rural tracts .
Distress does not affect all groups of people in the state equally . Distressed tracts , urban and rural , are disproportionately black . Whereas 7 percent of all North Carolinians live in distressed tracts , nearly 19 percent of blacks do. The Iatino population is overrepresented in urban distressed tracts , but not in rural
262,331 Urban Distressed Areas
293,909 Rural Distressed Areas
distressed tracts . American Indians make up 1 I percent or the rural distressed tract population , despite making up slightly less than I percent of the total North Carolina population (not shown in figures ). Whites make up 73 percent of the total state population , but only represent 28 percent of the population living in distress .
16

Economic Characteristics By most any measure of econom
ic health, urban distressed areas lag behind North Carolina as a whole as well
as their rural counterparts. Residents of urban distressed
tracts suffer from high rates of unemployment, low per capita incomes , and a rate of public assistance qualification three times that of the state as a whole .
Poverty is an especially dire prob-
lem for the distressed population . Nearly 28 percent of the distressed population lives below the poverty line .
Poverty among urban distressed residents , though, is more intense than among the rural distressed population . Over one third of the urban distressed population lives in poverty. One quarter of the elderly population (over 65 ) lives
in poverty. For children , the problem is even worse . An astounding 44 percent of all children in urban distressed areas live below the poverty line .
Such economic instability greatly
limits the life chances of residents of urban distressed areas , restricting their access to employment, education , trans portation , quality housing, health care , and proper nutrition .
$20,307 N.C.
1$10,542 Urban
[$11/405 1 Rural
Per capita income for North
Carolina, urban distressed tracts,
and rural distressed tracts .
Source: US Bureau of the Census
17

Economic Characteristics
7 519 47 Urban Distressed Areas
78,798 Rural Distressed Areas
112.3% N.C.
133.34% Ucbon I
28.39% Rural
Poverty rate for North Carolina, urban distressed tracts, and
rural distressed tracts.
Source: US Bureau of the Census
II N.C.
143.5% Ucbon
137.6% Rucol I
Poverty rate for residents under 18: North Carolina, urban distressed tracts, and rural
distressed tracts. SoUice: US Bureau of the Census
[13.2%111 26.3% Urban
23.4% Rural
Poverty rate for residents over 65: North Carolina, urban distressed tracts, and rural
distressed tracts. Source: US Bureau of the Census
18

A number of varying social characteristics show additional ways in which
the quality of life for distressed urban residents is threatened.
First, residents in urban distressed
tracts are the least likely among the comparison groups to complete academic degrees. North Carolina residents are more than three times as likely to obtain a college degree than those in urban distressed areas . Similarly, they are 1.7 times more likely to obtain their high school diploma . Only 45 percent of the popula
tion in urban distressed areas holds this most basic degree which may greatly affect their ability to enter the workforce .
Second, urban distressed resi-
dents are 1.5 times more likely than all
North Carolinians or rural distressed res idents to live in a home where English is not the primary language spoken . Limited English skills can hinder the edu
cational advancement of children and the occupational advancement of adults .
Finally, urban distressed tracts have the highest rates of single motherhood among the comparison groups. Nearly three quarters of all families in
urban distressed areas are headed by women with no husband present, compared to roughly half the rural distressed area families and one quarter of all North
Carolina families .
78.1 % N.C.
45.25% Urban
50.45% Rural
122.5% N.C.
7.01 %
7.13% .
College graduation rates for North Carolina, urban
distressed tracts, and rural
di tressed tracts
Source: US Bureau of the Census
19


Housing Characteristics The urban distressed population
faces substandard housing and instability
in their communities . Urban distressed residents are less
likely than rural distressed residents , and half as likely as all North Carolina resi
dents , to own their homes . Such lack of ownership is yet another indicator of the economic hardships faced in distressed urban areas and represents a barrier to wealth creation for these residents.
Distressed urban residents are more likely than their rural counterparts to have moved to a new home in the past
five years. Moving may be motivated by
any number of reasons, positive and negative . Regardless , moving often disrupts important community ties- ties that are especially useful for residents living in underprivileged areas .
21
This report has highlighted the extent to which North Carolina urban areas contain within them pockets of extreme distress . Using a measure of distress based upon income, unemployment, and poverty, we find that residents in urban distressed communities face a number of social and economic constraints in their lives .
An important finding of this report is the degree to which urban dis tressed residents are worse off then their rural counterparts . Rural distress in North Carolina is marked by its breadth : there are, for example, more rural North Carolinians living in distressed areas and more living below the poverty line . Urban distress , however, is marked by its depth . Urban distressed residents have lower incomes , are more likely to be unemployed , are less likely to own a home, attain less education, and are more likely to qualify for public assistance than their rural counterparts .
Such a conclusion does not, of course, indicate that rural distress is inconsequential. Rural areas in North Carolina continue to need significant resources devoted to their needs. Rather,
this report makes clear that the needs of residents in urban distressed areas must be addressed as well.
Our analysis represents a begin ning point in better understanding the state of urban distress in North Carolina. Our results are based on one measure of distress - there are certainly additional indicators of distress that could be included to better assess the conditions present in these communities .3 This report does not, for example , address issues related to health care or crime . Furthermore, our analysis was limited by the Census data available at the tract level.
In order to achieve better analyses in the future, governments and organizations should begin collecting data on a continual basis and at geographic level more specific than the county. Future analyses should consider additional sources of information , ranging from local city agencies to resident surveys.
State policy must address the economic and social isolation of underprivileged citizens . This level of data collection and analysis is necessary to achieve such a goal.
22

Relative to North l-l-l-1-l-1-l-l-l-l-l-l-l-
Carolina -Relative to
R~~:~r~r::~s l-l-1-l-l-1-l-l-l-l-l-l + 1 -
+ Urban Distressed Tracts better than
- Urban Distressed Tracts worse than
23

1. For a detailed analysis of patterns of growth in North Carolina see :
Brookings Institution Center on Urban and Metropolitan Policy, 2000 . Adding It Up: Growth Trends and Policies in North Carolina .
2. We adopted a measure of distress consistent with that of The
Appalachian Regional Commission (see www.arc.gov) and The Delta Regional Authority (see www.dra .gov).
3. For additional sources of information on selecting indicators of urban distress , see:
O 'Hare , William and Mark Mather, 2003. "The Growing Number of Kids in Severely Distressed Neighborhoods : Evidence from the 2000 Census." The Annie E. Casey Foundation and The Population Reference Bureau.
Sawicki , DavidS., and Patrice Flynn, 1996. Neighborhood Indicators: A Review of the Literature and an Assessment of Conceptual and Methodological Issues. Journal of the American Planning Association 62 : pp. 165-183.
Ricketts , Erol R. and Isabel V. Sawhill. 1988. "Defining and Measuring the Underclass ." Journ al of Policy Analysis and Managem ent 7: pp. 316-325 .
Kasarda , John D . 1993 . "Inner-City Concentrated Poverty and Neighborhood Distress: 1970- 1990." Housing Policy Debate 4, no . 3: pp . 253 -302 .
Mincy, Ronald B. , Isabel V. Sawhill , and Douglas A Wolf. 1990 'The Underclass Definition and Measurement." Science 248: pp. 450-453.
24

Appendix A: Urban Tract Census IDs Alamance County, Census Tract 204 Buncombe County, Census Tract 2
Buncombe County, Census Tract 4
Buncombe County, Census Tract 9 Catawba County, Census Tract I 09
Cumberland County, Census Tract 1
Cumberland County, Census Tract 2
Cumberland County, Census Tract 5
Cumberland County, Census Tract I 0 Cumberland County, Census Tract I 3 Cumberland County, Census Tract 22
Durham County, Census Tract 8 .01 Durham County, Census Tract 9 Durham County, Census Tract I 0.0 I
Durham County, Census Tract II Durham County, Census Tract 12 .0 I Durham County, Census Tract 12 .02 Durham County, Census Tract 14 Durham County, Census Tract 15 .0 I Edgecombe County, Census Tract 20 I Edgecombe County, Census Tract 202 Edgecombe County, Census Tract 203 Edgecombe County, Census Tract 204 Forsyth County, Census Tract 2 Forsyth County, Census Tract 3.01 Forsyth County, Census Tract 4
Forsyth County, Census Tract 5
Forsyth County, Census Tract 6 Forsyth County, Census Tract 7 Forsyth County, Census Tract 8 .0 I
Forsyth County, Census Tract 8.02 Forsyth County, Census Tract 15 Forsyth County, Census Tract 16 .02
Forsyth County, Census Tract 17 Forsyth County, Census Tract 18 Forsyth County, Census Tract 19 .0 I Gaston County, Census Tract 318
Gaston County, Census Tract 319 Gaston County, Census Tract 320 Guilford County, Census Tract I 07 02 Guilford County, Census Tract II 0 Guilford County, Census Tract 111.0 I Guilford County, Census Tract 112 Guilford County, Census Tract 114 Guilford County, Census Tract 116.02
Guilford County, Census Tract 127.07 Guilford County, Census Tract 139 Guilford County, Census Tract 142 Guilford County, Census Tract 143 Guilford County, Census Tract 144.08 Mecklenburg County, Census Tract 8 Mecklenburg County, Census Tract 9 Mecklenburg County, Census Tract 23
Mecklenburg County, Census Tract 36 Mecklenburg County, Census Tract 37 Mecklenburg County, Census Tract 39 .0 I Mecklenburg County, Census Tract 39 .02 Mecklenburg County, Census Tract 41 Mecklenburg County, Census Tract 42 Mecklenburg County, Census Tract 45
Mecklenburg County, Census Tract 47
Mecklenburg County, Census Tract 50 Mecklenburg County, Census Tract 51 Mecklenburg County, Census Tract 52
Mecklenburg County, Census Tract 53.04 Mecklenburg County, Census Tract 56 .04 Nash County, Census Tract I 02 New Hanover County, Census Tract I 0 I
New Hanover County, Census Tract 110 New Hanover County, Census Tract Ill New Hanover County, Census Tract 114 Onslow County, Census Tract 19 Onslow County, Census Tract 20 Pitt County, Census Tract 4
Pitt County, Census Tract 7 .0 I
Pitt County, Census Tract 7.02 Pitt County, Census Tract 8 Wake County, Census Tract 507 Wake County, Census Tract 508 Wake County, Census Tract 509 Wake County, Census Tract 51 I
Wake County, Census Tract 520 .0 I Wake County, Census Tract 521 .02
Wake County, Census Tract 522 .0 I Wake County, Census Tract 524.05 Wayne County, Census Tract 18
25

Appendix A: Rural Tract Census IDs Anson County, Census Tract 9804 Beaufort County, Census Tract 9903 Bertie County, Census Tract 9603 Columbus County, Census Tract 9905 Columbus County, Census Tract 9906 Columbus County, Census Tract 9907 Columbus County, Census Tract 9912 Craven County, Census Tract 9608 Davidson County, Census Tract 614 Duplin County, Census Tract 9903 Graham County, Census Tract 9803 Halifax County, Census Tract 990 I Halifax County, Census Tract 9906 Halifax County, Census Tract 9908 Halifax County, Census Tract 9909 Halifax County, Census Tract 9910 Halifax County, Census Tract 9911 Hoke County, Census Tract 9704 Iredell County, Census Tract 602 Iredell County, Census Tract 603 Lee County, Census Tract 302 Lee County, Census Tract 303 Lenoir County, Census Tract I 02 Lenoir County, Census Tract I 03 Lenoir County, Census Tract I 04 Lenoir County, Census Tract I 05 Northampton County, Census Tract 9803 Pasquotank County, Census Tract 960 I Pasquotank County, Census Tract 9602 Pasquotank County, Census Tract 9603
Pitt County, Census Tract 20 .01 Randolph County, Census Tract 303 .02 Richmond County, Census Tract 9702 Richmond County, Census Tract 9706 Richmond County, Census Tract 9707 Robeson County, Census Tract 960 I Robeson County, Census Tract 9605 Robeson County, Census Tract 9606 Robeson County, Census Tract 9608 Robeson County, Census Tract 9611 Robeson County, Census Tract 9617 Robeson County, Census Tract 9618 Robeson County, Census Tract 9619 Robeson County, Census Tract 9620 Rockingham County, Census Tract 402 Rowan County, Census Tract 50 I Rowan County, Census Tract 504 Rowan County, Census Tract 508 Scotland County, Census Tract I 02 Scotland County, Census Tract 103 Swain County, Census Tract 9601 Vance County, Census Tract 9606 Vance County, Census Tract 9607 Warren County, Census Tract 9502 Warren County, Census Tract 9504 Watauga County, Census Tract 9805 Wilson County, Census Tract I
Wilson County, Census Tract 2 Wilson County, Census Tract 7 Wilson County, Census Tract 8.0 I
Wilson County, Census Tract 8.02
26