the state of kersten glacier and the northern icefield on mt. kilimanjaro · 2020. 4. 30. ·...
TRANSCRIPT
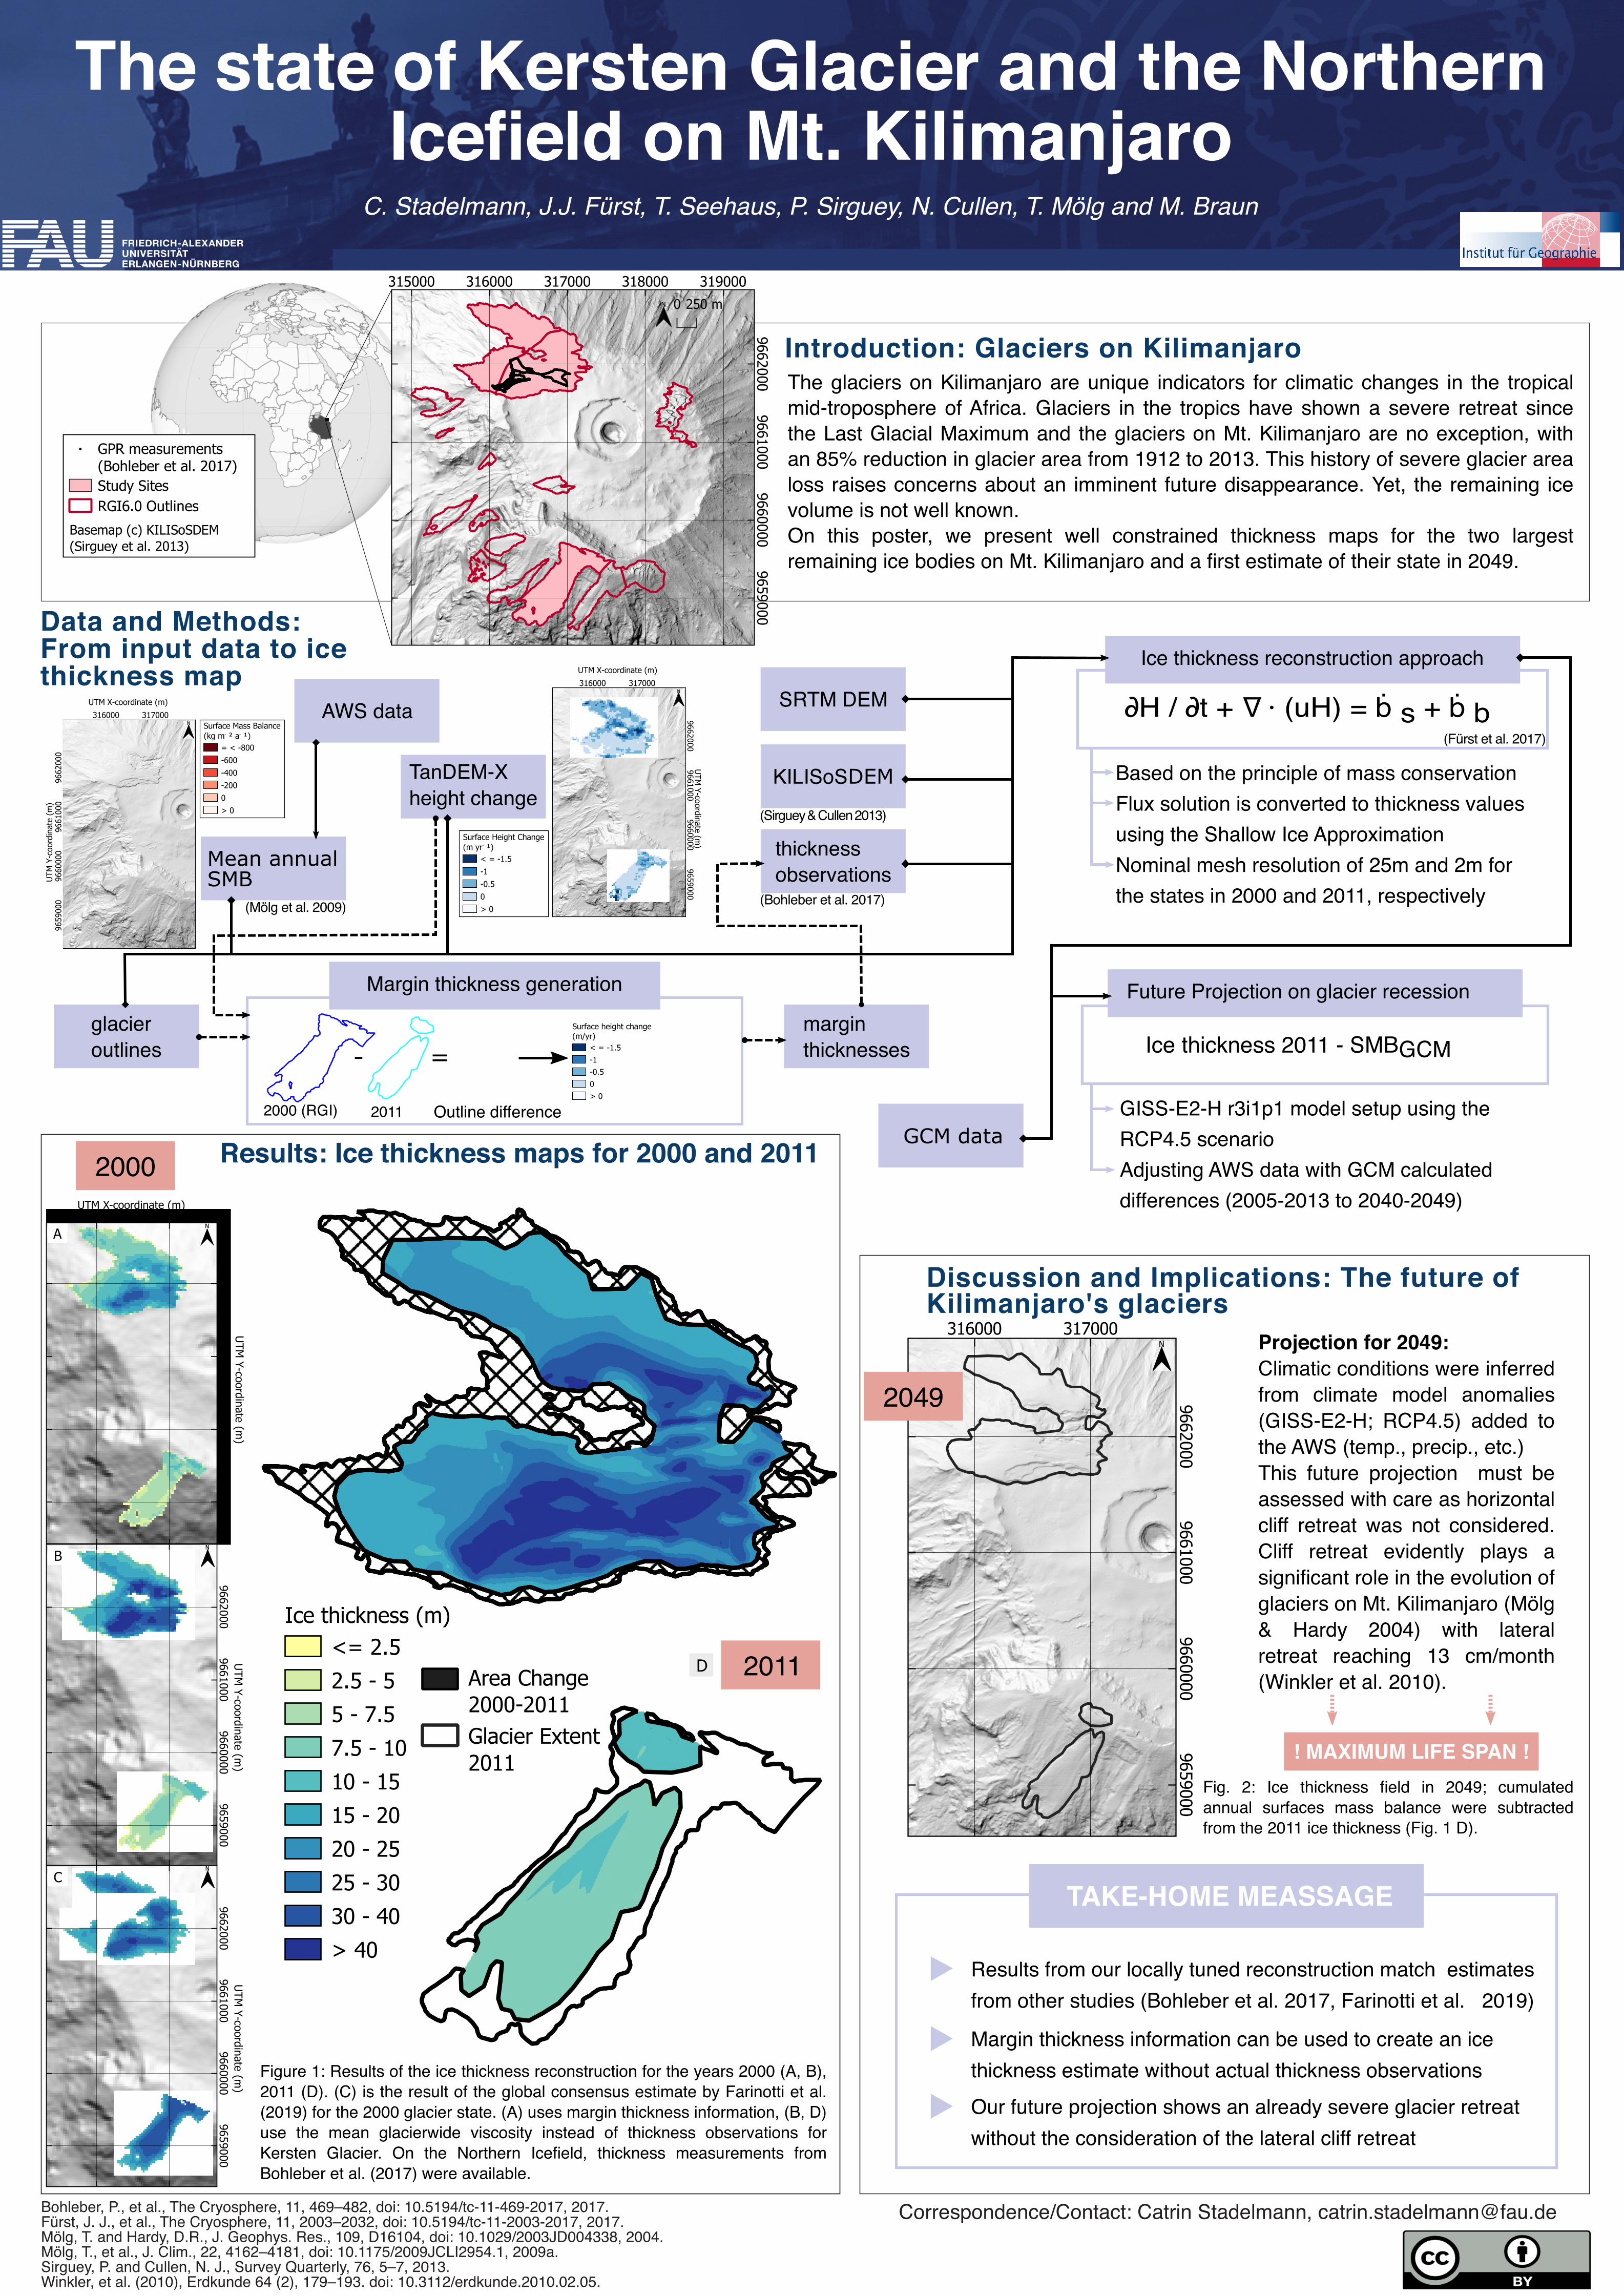
C. Stadelmann, J.J. Fürst, T. Seehaus, P. Sirguey, N. Cullen, T. Mölg and M. Braun
Introduction: Glaciers on KilimanjaroThe glaciers on Kilimanjaro are unique indicators for climatic changes in the tropical
mid-troposphere of Africa. Glaciers in the tropics have shown a severe retreat since
the Last Glacial Maximum and the glaciers on Mt. Kilimanjaro are no exception, with
an 85% reduction in glacier area from 1912 to 2013. This history of severe glacier area
loss raises concerns about an imminent future disappearance. Yet, the remaining ice
volume is not well known.
On this poster, we present well constrained thickness maps for the two largest
remaining ice bodies on Mt. Kilimanjaro and a first estimate of their state in 2049.
Results: Ice thickness maps for 2000 and 2011
Discussion and Implications: The future ofKilimanjaro's glaciers
TanDEM-X
height change
SRTM DEM
glacier
outlines
thickness
observations
KILISoSDEM
margin
thicknesses
(Bohleber et al. 2017)
(Sirguey & Cullen 2013)
Data and Methods:From input data to ice thickness map
Projection for 2049:
Climatic conditions were inferred
from climate model anomalies
(GISS-E2-H; RCP4.5) added to
the AWS (temp., precip., etc.)
This future projection must be
assessed with care as horizontal
cliff retreat was not considered.
Cliff retreat evidently plays a
significant role in the evolution of
glaciers on Mt. Kilimanjaro (Mölg
& Hardy 2004) with lateral
retreat reaching 13 cm/month
(Winkler et al. 2010).
Ice thickness (m)<= 2.5
2.5 - 5
5 - 7.5
7.5 - 10
10 - 15
15 - 20
20 - 25
25 - 30
30 - 40
> 40
Area Change2000-2011Glacier Extent 2011
96590009660000
96610009662000
316000 317000
Correspondence/Contact: Catrin Stadelmann, [email protected]
globe with east africa
GPR measurements(Bohleber et al. 2017)Study SitesRGI6.0 Outlines
Basemap (c) KILISoSDEM(Sirguey et al. 2013)
96590009660000
96610009662000
315000 316000 317000 318000 319000
∂H / ∂t + ∇ · (uH) = ḃ s + ḃ b
Ice thickness reconstruction approach
Based on the principle of mass conservation
Flux solution is converted to thickness values
using the Shallow Ice Approximation
Nominal mesh resolution of 25m and 2m for
the states in 2000 and 2011, respectively
2049
2011
Future Projection on glacier recession
GCM dataGISS-E2-H r3i1p1 model setup using the
RCP4.5 scenario
Adjusting AWS data with GCM calculated
differences (2005-2013 to 2040-2049)
96590009660000
96610009662000
B
96590009660000
96610009662000
UTM
Y-coordinate (m)
C
UTM
Y-coordinate (m)
UTM
Y-coordinate (m)
UTM X-coordinate (m)
A
D
Figure 1: Results of the ice thickness reconstruction for the years 2000 (A, B),
2011 (D). (C) is the result of the global consensus estimate by Farinotti et al.
(2019) for the 2000 glacier state. (A) uses margin thickness information, (B, D)
use the mean glacierwide viscosity instead of thickness observations for
Kersten Glacier. On the Northern Icefield, thickness measurements from
Bohleber et al. (2017) were available.
Ice thickness 2011 - SMBGCM
2000
Bohleber, P., et al., The Cryosphere, 11, 469–482, doi: 10.5194/tc-11-469-2017, 2017.Fürst, J. J., et al., The Cryosphere, 11, 2003–2032, doi: 10.5194/tc-11-2003-2017, 2017.Mölg, T. and Hardy, D.R., J. Geophys. Res., 109, D16104, doi: 10.1029/2003JD004338, 2004. Mölg, T., et al., J. Clim., 22, 4162–4181, doi: 10.1175/2009JCLI2954.1, 2009a.Sirguey, P. and Cullen, N. J., Survey Quarterly, 76, 5–7, 2013.Winkler, et al. (2010), Erdkunde 64 (2), 179–193. doi: 10.3112/erdkunde.2010.02.05.
AWS data
Margin thickness generation
The state of Kersten Glacier and the Northern Icefield on Mt. Kilimanjaro
(Fürst et al. 2017)
Mean annual SMB
(Mölg et al. 2009)
Results from our locally tuned reconstruction match estimates
from other studies (Bohleber et al. 2017, Farinotti et al. 2019)
Margin thickness information can be used to create an ice
thickness estimate without actual thickness observations
Our future projection shows an already severe glacier retreat
without the consideration of the lateral cliff retreat
Surface height change(m/yr)
< = -1.5
-1
-0.5
0
> 0
- =
2000 (RGI) 2011
Fig. 2: Ice thickness field in 2049; cumulated
annual surfaces mass balance were subtracted
from the 2011 ice thickness (Fig. 1 D).
Outline difference
96590009660000
96610009662000
316000 317000
Surface Height Change(m yr⁻ ¹)
< = -1.5
-1
-0.5
0
> 0
UTM
Y-coordinate (m)
UTM X-coordinate (m)
9659
000
9660
000
9661
000
9662
000
316000 317000Surface Mass Balance(kg m⁻ ² a⁻ ¹)
= < -800
-600
-400
-200
0
> 0
UTM
Y-c
oord
inat
e (m
)
UTM X-coordinate (m)
! MAXIMUM LIFE SPAN !
TAKE-HOME MEASSAGE