the state of impact measurement and …
TRANSCRIPT

FIRST EDITION
THE STATE OF IMPACT MEASUREMENT AND MANAGEMENT PRACTICE


1T H E S T A T E O F I M P A C T M E A S U R E M E N T A N D M A N A G E M E N T P R A C T I C E
2017 IMM SURVEY
AUTHORED BY THE GIIN RESEARCH TEAM
Abhilash Mudaliar, DirectorAliana Pineiro, ManagerRachel Bass, Senior AssociateHannah Dithrich, Associate
ABOUT THE GLOBAL IMPACT INVESTING NETWORK (GIIN)The GIIN is a nonprofit organization dedicated to increasing the scale and effectiveness of impact investing around the world. Impact investments are made into companies, organizations, and funds with the intention to generate social and environmental impact alongside a financial return. The GIIN builds critical infrastructure and supports activities, education, and research that help accelerate the development of a coherent impact investing industry. For more information, see www.thegiin.org.
ACKNOWLEDGEMENTSThis study was produced with the generous support of The Rockefeller Foundation.
RESEARCH SUPPORTThe Research Team would like to recognize the contributions of various members of the GIIN Team. For review and input, we thank Amit Bouri, Chief Executive Officer, Kelly McCarthy, Director of Impact Measurement and Management, and Laura Gustafson, Senior Associate of Communications.
BETA TESTERSThe following individuals beta-tested the survey instrument, and the Research Team is grateful for their time and input: Priscilla Boiardi of the European Venture Philanthropy Association, Eric Cooperstrom of NatureVest, Samantha Duncan of LeapFrog Investments, Michael Etzel of The Bridgespan Group, Emilie Goodall of FMO, Manuel Lewin of Zurich Insurance Group, Kurt Morriesen of the Principles for Responsible Investment, Jane Reisman, and Kristin Siegel of TONIIC.
The following GIIN team members also beta-tested the instrument: Amit Bouri, Adam Dolin, Rebecca Kurland, Kimberly Moynihan, Peter Murphy, Hannah Schiff, Sapna Shah, and Andrew Siwo.
OUTREACH PARTNERSVarious member networks and field-builders assisted in growing the sample size for this research by extending invitations to participate to their networks. More information on these outreach partners can be found in Appendix 3.
December 2017

Through coordinated
efforts to improve impact,
together we can leverage the
power of capital to address,
and ultimately solve, the
most critical social and
environmental problems
facing our world today.”

3T H E S T A T E O F I M P A C T M E A S U R E M E N T A N D M A N A G E M E N T P R A C T I C E
Letter from the CEODear reader,
Impact investors, inspired to solve global challenges through investments, wield capital as a force for transformative change. Core to their work is thus the commitment to understanding and improving impact. Impact investors have made substantial progress on this front and can capitalize on existing momentum to further strengthen their collective ability to achieve impact through impact investments, maintain the credibility of practice, and advance the industry.
The Global Impact Investing Network (GIIN) provides resources that fill knowledge gaps for impact investors to increase the scale and effectiveness of the industry. This report, The State of Impact Measurement and Management Practice, sheds light on how 169 investors targeting a broad range of social and environmental opportunities – such as economic growth, climate change, and health – use impact in investment management. While approaches vary from one impact investor to the next (depending on their investment strategy, values, and resources), findings demonstrate that impact is core to their activity. Regardless of the sophistication of an investor’s current approach to impact, the data surface opportunities for all investors to challenge themselves to advance their strategies and ultimately deepen their impact:
• Investors should recognize that every investment creates multifaceted impact. Currently, 66% of impact investors measure only the positive impact of their investments. By monitoring negative externalities as well, investors can obtain a broader understanding of the complete impact of their activities. Investors can also explore ways to better understand and address the needs of the various stakeholders affected by their investments.
• Impact investors can enhance the rigor of their impact strategies by setting targets and embedding them into business practices. Just as all investors set financial performance targets, some 60% of impact investors set targets for the impact they seek to achieve. Having specific goals can help inform clear data collection efforts, drive performance management, and ensure accountability. Investors can then motivate their staff and investees to meet such targets using similar incentives to those used to encourage strong financial performance.
• By making more of their impact data available to key stakeholders and the broader industry, investors can strengthen the evidence base of the impact of impact investments, share lessons with others, and accelerate the field’s influence over critical problems facing society and the environment. Nearly all impact investors report their impact performance in some way, with about 70% producing publicly available impact reports; the benefits of greater data transparency will increase exponentially as the industry continues to grow and mature.
Agreed-upon impact measurement conventions have already taken shape, and emerging resources provide further guidance on strategies to implement effective systems for measurement and management. Yet half of impact investors cite ongoing fragmentation in the range of approaches taken to understand and improve impact as a significant challenge facing the industry. The GIIN is committed to working alongside investors and other field-builders to further strengthen the resources available, address concerns around fragmentation and transparency, and promote best practices. Through coordinated efforts to improve impact, together we can leverage the power of capital to address, and ultimately solve, the most critical social and environmental problems facing our world today.
Amit Bouri CEO, Global Impact Investing Network
@AmitKBouri

4 G L O B A L I M P A C T I N V E S T I N G N E T W O R K
METHODOLOGY 9
EXECUTIVE SUMMARY 12
SAMPLE CHARACTERISTICS 19
Organization type ..............................................................................................................................................19Headquarters location .....................................................................................................................................19Target financial returns ....................................................................................................................................20Impact investing assets under management .........................................................................................20Portfolio concentrations ..................................................................................................................................21
MOTIVATIONS FOR MEASURING AND MANAGING IMPACT 23
Targeting social and environmental impact objectives ..................................................................... 24Target impact themes ..................................................................................................................................... 24Target beneficiaries .......................................................................................................................................... 28
PERSPECTIVES ON THE MARKET 30
Progress and challenges in IMM practice...............................................................................................30Organizational challenges with IMM ........................................................................................................31Opportunities to strengthen IMM practice ........................................................................................... 32
IMPACT MEASUREMENT PRACTICES 36
Measuring positive and negative impact ................................................................................................ 36Types of impact measured .............................................................................................................................37Tools, indicator sets, and standards for measuring impact .............................................................. 38Customizing impact metrics ........................................................................................................................ 42Selecting impact metrics ................................................................................................................................ 43Processes for collecting and reporting impact data ...........................................................................44Uses of impact data ......................................................................................................................................... 47
TABL
E O
F C
ON
TEN
TS

5T H E S T A T E O F I M P A C T M E A S U R E M E N T A N D M A N A G E M E N T P R A C T I C E
CAPACITY FOR IMPACT MEASUREMENT AND MANAGEMENT 49
Allocation of human resources to IMM ..................................................................................................49Interaction with investees ...............................................................................................................................51Use of external consultants ........................................................................................................................... 52Funding IMM capacity ................................................................................................................................... 52
ACCOUNTABILITY FOR PERFORMANCE 54
Setting and revising impact targets ...........................................................................................................54Use of incentives to achieve impact targets .......................................................................................... 55Impact reporting and auditing .....................................................................................................................58
MARKET SPOTLIGHTS
Emerging efforts for impact measurement and management ...................................................... 34Commonly used impact measurement and management tools, standards, and frameworks ............................................................................................................................ 39Impact-based investor incentives ............................................................................................................... 57
APPENDIX 1.: LIST OF RESPONDENTS 59
APPENDIX 2.: LIST OF DEFINITIONS USED FOR THIS RESEARCH 61
APPENDIX 3: : OUTREACH PARTNERS 62
APPENDIX 4: RELEVANT LITERATURE 63

6 G L O B A L I M P A C T I N V E S T I N G N E T W O R K
LIST
OF
TABL
ES A
ND
FIG
URE
S LIST OF FIGURESFigure I: Respondents with portfolio concentrations by instrument ......................................................................................... 12
Figure II: Respondents with portfolio concentrations in emerging or developed markets ............................................... 13
Figure III: Asset allocations by impact theme ........................................................................................................................................ 13
Figure IV: Target beneficiary groups .......................................................................................................................................................... 14
Figure V: Target beneficiaries along the supply chain ....................................................................................................................... 14
Figure VI: Reasons for measuring and managing impact .................................................................................................................. 14
Figure VII: Types of impact measured ....................................................................................................................................................... 15
Figure VIII: Customization/standardization of impact metrics .......................................................................................................... 15
Figure IX: Strategies to incentivize staff to achieve impact targets .............................................................................................. 16
Figure X: Strategies to incentivize investees to achieve impact targets .................................................................................... 16
Figure XI: Significant areas of progress and challenge in IMM practice ..................................................................................... 17
Figure XII: Internal challenges in implementing IMM .......................................................................................................................... 18
Figure XIII: Importance of various tools, ideas, and behaviors to advancing the practice of IMM .................................... 18
Figure 1: Organization type ......................................................................................................................................................................... 19
Figure 2: Location of sample headquarters ........................................................................................................................................... 19
Figure 3: Target financial returns principally sought ......................................................................................................................... 20
Figure 4: Distribution of sample AUM .................................................................................................................................................. 20
Figure 5: Respondents with portfolio concentrations in direct or indirect investments ..................................................... 21
Figure 6: Respondents with portfolio concentrations in emerging or developed markets ............................................... 21
Figure 7: Respondents with portfolio concentrations by sector ..................................................................................................22
Figure 8: Respondents with portfolio concentrations by instrument .......................................................................................22
Figure 9: Reasons for measuring and managing impact ..................................................................................................................23
Figure 10: Primary impact objective ...........................................................................................................................................................24
Figure 11: Number of respondents with some allocation to each impact theme ...................................................................25
Figure 12: DM- and EM-focused respondents with some allocation to each impact theme ............................................26
Figure 13: Asset allocations by impact theme ........................................................................................................................................27
Figure 14: Target beneficiary groups ..........................................................................................................................................................28
Figure 15: Target beneficiary groups among EM- and DM-focused investors .......................................................................28
Figure 16: Target investee stakeholders ....................................................................................................................................................29
Figure 17: Target investee stakeholders among primarily social investors and social and environmental investors .....................................................................................................................................................29
Figure 18: Significant areas of progress and challenge in IMM practice .................................................................................... 30
Figure 19: Severity of IMM challenges within respondent organizations ................................................................................... 31
Figure 20: Importance of various tools, ideas, and behaviors to advancing the practice of IMM ....................................32
Figure 21: Direct and indirect investors that indicated each tool, idea, or behavior as ‘very important’........................33
Figure 22: The Five Dimensions of Impact .............................................................................................................................................34
Figure 23: Measuring positive and negative impact ............................................................................................................................36
Figure 24: Measuring positive and negative impact, by sub-group ..............................................................................................36
Figure 25: Types of impact measured .......................................................................................................................................................37
Figure 26: Usage of various tools, indicator sets, and standards in IMM practice .................................................................38
Figure 27: Examples of IRIS metrics ...........................................................................................................................................................39
Figure 28: United Nations Sustainable Development Goals ........................................................................................................40

7T H E S T A T E O F I M P A C T M E A S U R E M E N T A N D M A N A G E M E N T P R A C T I C E
Figure 29: B Analytics Assessment overview ..........................................................................................................................................41
Figure 30: Customization/standardization of impact metrics ..........................................................................................................42
Figure 31: Ways of selecting impact metrics and targets ..................................................................................................................43
Figure 32: Who selects impact metrics and targets .............................................................................................................................43
Figure 33: Frequency of impact data collection and reporting ...................................................................................................... 44
Figure 34: Stage of investment at which investors collect impact data ...................................................................................... 44
Figure 35: Stage of investment at which market-rate and below-market investors collect impact data ...................... 45
Figure 36: Methods investors use to collect impact data ................................................................................................................ 46
Figure 37: Uses of impact data in investment management processes ......................................................................................47
Figure 38: Uses of impact data in investment management processes ......................................................................................47
Figure 39: Uses of impact data in impact management processes ............................................................................................. 48
Figure 40: Human resources allocated to IMM .................................................................................................................................... 49
Figure 41: Reasons to integrate IMM responsibilities into other staff roles .............................................................................. 50
Figure 42: Staff interactions with investees throughout IMM process ......................................................................................... 51
Figure 43: Tasks for which external consultants are hired...................................................................................................................52
Figure 44: Funding source for IMM capacity..........................................................................................................................................52
Figure 45: Investors that set measurable impact targets ................................................................................................................... 54
Figure 46: Factors that cause impact investors to revise impact performance targets ........................................................ 54
Figure 47: Strategies to incentivize staff to achieve impact targets ..............................................................................................55
Figure 48: Strategies to incentivize investees to achieve impact targets ....................................................................................55
Figure 49: Codification of impact targets into legal documents ................................................................................................... 56
Figure 50: Ways impact investors report the impact performance of their investments .................................................... 58
Figure 51: Ways impact investors are held accountable or audited for impact results ........................................................ 58
LIST OF TABLESTable I: Respondent sub-groups referenced in the report ...........................................................................................................10
Table II: Organizational type codes .........................................................................................................................................................11
Table III: Region codes ...................................................................................................................................................................................11
Table IV: Sector codes .....................................................................................................................................................................................11
Table 1: Level of customization of impact metrics, by sub-group .............................................................................................42
Table 2: Percent of non-IMM staff time spent on IMM ............................................................................................................... 50
Table 3: Respondents reporting ‘significant coordination’ between IMM and investment management staff throughout the investment management process .......................................................................................................... 51
Table 4: Funding sources for IMM capacity by sub-group ..........................................................................................................53

8 G L O B A L I M P A C T I N V E S T I N G N E T W O R K
169Impact InvestorRespondents

9T H E S T A T E O F I M P A C T M E A S U R E M E N T A N D M A N A G E M E N T P R A C T I C E
his report captures data from 169 impact investors collected via a survey distributed between June and August 2017. Respondents answered questions about how they
measure, manage, and report their impact.
INCLUSION CRITERIAAll respondents represent impact investing organizations with meaningful experience in the field, as defined by two key inclusion criteria. First, all respondent organizations must identify as impact investors that measure the social and/or environmental performance of their investments. The Research Team provided the GIIN’s definition of impact investing (see Appendix 2), which respondents used to self-report their eligibility as impact investors that measure the social and/or environmental performance of their investments. Second, included respondents have either: (a) committed at least USD 10 million to impact investments since their inception and/or (b) made at least five impact investments.
DATA VALIDITYWhile the GIIN Research Team conducted basic data checks and sought clarifications as appropriate prior to analysis, this report is based on self-reported data. Respondents were instructed to complete the survey with respect only to their impact investing portfolios. Respondents applied the GIIN’s definition of impact investing to their portfolios as they saw fit.
ROLE OF OUTLIERSAs is often the case, a handful of outliers in a sample can have outsized influence on aggregate findings. Some respondents to this survey manage comparatively large impact investing portfolios. Where appropriate and feasible, this report presents analysis both including and excluding outliers in order to enable more nuanced interpretation of findings.
TARGET FINANCIAL RETURNSTo understand respondents’ financial returns expectations, the Research Team cross-referenced data submitted to the GIIN’s 2016 or 2017 Annual Impact Investor Surveys.1 Of the 169 respondents to this survey, 133 had also participated in at least one of these Annual Surveys and had thus provided the GIIN with data on their target financial returns (market-rate or below-market-rate).
IMPACT REPORT HIGHLIGHTSRespondents to the survey were invited to submit impact reports to the GIIN. The Research Team used examples from some of these reports to highlight specific reporting practices of impact investors, which are shown in Impact Report Highlight boxes throughout this report.
1 Abhilash Mudaliar et al., Annual Impact Investor Survey 2017 (New York: The Global Impact Investing Network, May 2017), https://thegiin.org/knowledge/publication/annualsurvey2017; and Abhilash Mudaliar, Hannah Schiff, and Rachel Bass, Annual Impact Investor Survey 2016 (New York: The Global Impact Investing Network, May 2016), https://thegiin.org/knowledge/publication/annualsurvey2016.
Methodology

10 G L O B A L I M P A C T I N V E S T I N G N E T W O R K
CUTTING THE DATA BY SUB-GROUP TO EXTRACT NOTABLE FINDINGSMost findings in this report aggregate data from all 169 impact investors responding to the survey. The report also presents notable differences in responses by various sub-groups of respondents, such as, for example, investors with a large majority of their capital allocated to a certain asset class or geography. Table I presents a full list of these sub-groups. The statistical significance of differences between sub-groups was tested for at the 90% confidence level. The report notes when these differences are statistically significant.
TABLE I: RESPONDENT SUB-GROUPS REFERENCED IN THE REPORT
Sub-group Description of the category Number of respondents
Social and environmental investors
Respondents whose primary impact objectives are both social and environmental 99
Primarily social investors Respondents whose primary impact objective is social 60
Market-rate investors Respondents that principally target risk-adjusted, market-rate returns 81
Below-market investors
Respondents that principally target below-market-rate returns (some closer to market-rate and some closer to capital-preservation) 52
Direct investors Respondents that invest ≥ 75% of their current impact investment AUM directly into companies, projects, or real assets 119
Indirect investors Respondents that invest ≥ 75% of their impact investment AUM indirectly into funds or other intermediaries 31
EM-focused investors Respondents that allocate ≥ 75% of their current impact investment AUM to emerging markets 83
DM-focused investors Respondents that allocate ≥ 75% of their current impact investment AUM to developed markets 55
PD-focused investors
Respondents that allocate ≥ 75% of their current impact investment assets under management (AUM) to private debt 52
PE-focused investors Respondents that allocate ≥ 75% of their current impact investment AUM to private equity 44
Source: GIIN
OVERLAP BETWEEN SUB-GROUPSThe sub-groups outlined above have some notable overlap and divergence, as follows:
· Of the private equity investors in the sample, 89% are direct investors, compared to 75% of private debt investors.
· Of the investors targeting below-market-rate returns, 81% are direct investors, versus 69% of market-rate investors.

11T H E S T A T E O F I M P A C T M E A S U R E M E N T A N D M A N A G E M E N T P R A C T I C E
REGION AND SECTOR CODESOrganizational types, regions, and sectors referenced in the report are given shorter names for brevity, where appropriate, as defined in Tables II through IV. The survey instrument did not offer region definitions or lists of countries by region, so responses reflect respondents’ interpretations of each region’s boundaries.
TABLE II: ORGANIZATIONAL TYPE CODES
Code Name of organization type
Bank/diversified financial institution
Bank/diversified financial institution
DFI Development finance institution (a government-backed institution investing in the private sector)
Family office Family office
Foundation Foundation
For-profit fund manager Fund manager: for-profit
Nonprofit fund manager Fund manager: not-for-profit
Pension fund/insurance company Pension fund or insurance company
Permanent investment company Permanent investment company
Source: GIIN
TABLE III: REGION CODES
Code Name of region
DM Developed Markets
East Asia East Asia
Oceania Oceania
U.S. & Canada United States and Canada
WNS Europe Western, Northern, and Southern Europe
EM Emerging Markets
EECA Eastern Europe, Russia, and Central Asia
LAC Latin America and the Caribbean (including Mexico)
MENA Middle East and North Africa
SE Asia Southeast Asia
South Asia South Asia
SSA Sub-Saharan Africa
Source: GIIN
TABLE IV: SECTOR CODES
Code Name of sector
Arts & culture Arts and culture
Education Education
Energy Energy
Financial services Financial services (including microfinance)
Food & ag Food and agriculture
Forestry & timber Forestry and timber
Healthcare Healthcare
Housing Housing
ICT Information and communication technologies
Infrastructure Infrastructure
Manufacturing Manufacturing
WASH Water, sanitation, and hygiene
Source: GIIN

12 G L O B A L I M P A C T I N V E S T I N G N E T W O R K
Executive Summaryhis report presents findings from the Global Impact Investing Network’s first comprehensive survey of the state of impact measurement and management (IMM)
in the impact investing industry. A hallmark of impact investing is the commitment to measure – and increasingly to manage – impact. Impact management is the process by which impact investors can understand the effects of their investments on people and the planet, and set goals to adapt processes and improve outcomes. Over the years, the impact investing industry has dedicated increasing resources to IMM, deepening the sophistication of practice as the industry has developed. This report provides critical data and transparency regarding IMM practice, enabling investors to better understand this core element of impact investing. The nuanced insights presented here shed light on various approaches, expose challenges, and identify areas for improvement, encouraging investors to deepen their impact practice and improve their ability to generate positive social and environmental change. In addition to the survey findings, the report highlights notable developments in the field of IMM in three Market Spotlight sections based on secondary research.
FOUR KEY FINDINGS
Impact investors seek to create many different types of impact
Impact investors actively seek to understand and manage their impact
Impact investors embed IMM into the core of their activities
The industry has made significant progress, yet challenges in IMM persist
OVERVIEW OF RESPONDENTSThe 169 respondents to this survey represent a wide range of organizational types and investment strategies.
· Nearly two-thirds of respondents are fund managers. The other third comprises banks, foundations, development finance institutions, and family offices, among others.
· Nearly one in three respondents invests primarily via private debt, and about one quarter invests primarily via private equity (Figure I).
· About half of respondents focus on emerging markets; one third focus on developed markets (Figure II).
31%
26%
32%
Private debt
Private equity
No instrument concentration
3%
3%
2%
2%
1%
Public debt
Equity-like debt
Public equity
Real assets
Deposits & cash equivalents 26%
32% 31%
11%
Percent of respondents
FIGURE I: RESPONDENTS WITH PORTFOLIO CONCENTRATIONS BY INSTRUMENTn = 169
Note : The threshold for a portfolio concentration is 75% of AUM. Source: GIIN
1
2
3
4

13T H E S T A T E O F I M P A C T M E A S U R E M E N T A N D M A N A G E M E N T P R A C T I C E
49%
33%
18%
Emerging markets-focused investors
Developed markets-focused investors
No geographic concentration
18%
49%
33%
Percent of respondents
Note : The threshold for a portfolio concentration is 75% of AUM. Source: GIIN
FIGURE II: RESPONDENTS WITH PORTFOLIO CONCENTRATIONS IN EMERGING OR DEVELOPED MARKETSn = 169
IMPACT THEMESRespondents indicated which impact themes they target, as aligned with the U.N. Sustainable Development Goals (SDGs).2 Most investors target more than one impact theme and the average investor targets four. Perhaps unsurprisingly, the highest proportion of sample AUM is allocated to ‘decent work and economic growth’ (24%). Sixteen percent of AUM is allocated to ‘climate action’, followed by ‘sustainable cities and communities’ (11%) (Figure III).
Note: ‘Other’ includes impact themes such as affordable housing, sustainable agriculture, and financial inclusion. Additionally, some respondents intend to generate impact across many different themes and do not track AUM allocations to specific impact themes. Source: GIIN
FIGURE III: ASSET ALLOCATIONS BY IMPACT THEMEn = 124 (optional question); respondents could select multiple options.
Sample excluding outliers: n = 120; AUM = USD 38.3 billion Outliers: n = 4; AUM = USD 40.2 billion
% of AUMexcl. outliers
% of totalAUM n USD millionsImpact themes
Partnerships for sustainable development
Responsible consumption and production
Industry, innovation, and infrastructure
Clean water and sanitation
A�ordable and clean energy
Good health and well-beingSustainable cities and communities
Decent work and economic growth
Quality education
No poverty
Zero hunger
Climate action
Gender equality
Life on land
Life below water
Other
Reduced inequalities
Peace, justice, and strong institutions
74
27
38
54
16
48
39
28
32
34
48
24
29
9 915
14
5 287
10
27
18,635
12,586
8,495
5,830
3,359
3,286
2,740
2,725
2,647
1,430
1,309
1,264
1,134
850
260
10,698
24%
5%
10%
3%
0%
4%
7%
2%
3%
3%
3%
3%
3%
2%
2%
0%
1%
24%
24%
16%
11%
7%
4%
4%
3%
3%
3%
2%
2%
2%
1%
1%
1%
0%
0%
14%
2 The U.N. Sustainable Development Goals are an ambitious set of 17 goals to which the U.N. member states agreed unanimously for the eradication of global poverty and sustainable development by 2030. “Sustainable Development Goals,” United Nations Sustainable Development Knowledge Platform.
1 Impact investors seek to create many different types of impact

14 G L O B A L I M P A C T I N V E S T I N G N E T W O R K
TARGET BENEFCIARIESImpact investors seek to effect positive change for various groups of beneficiaries through their investments (Figure IV). Approximately five in six impact investors target individuals based on their socioeconomic bracket. Over half target women and girls, and just under half target the unemployed. These beneficiaries are typically reached through investees, who themselves have various stakeholders along the supply chain. Over 90% of respondents intentionally target the customers or clients of their investees (Figure V). Nearly three-quarters target investee employees, and 45% target investee suppliers.
FIGURE IV: TARGET BENEFICIARY GROUPSn = 140 (optional question); respondents could select multiple options.
Source: GIIN Source: GIIN
FIGURE V: TARGET BENEFICIARIES ALONG THE SUPPLY CHAINn = 149 (optional question); respondents could select multiple options.
Other
LGBTQ individuals
Refugees or displaced individuals
Disabled individuals
Racial, ethnic, or religious minorities
Youth and children
Unemployed individuals
Women and girls
Individuals of a certainsocioeconomic status
Other
Distributors of investees
Suppliers of investees
Employees of investees
Customers / clientsof investees Number of respondentsNumber of respondents
22
33
39
51
66
81
116
31
27
44
67
109
137
9
MOTIVATIONSImpact investors measure and manage their impact for several reasons, the most important of which are to better understand their impact, report their impact to key stakeholders, and manage or improve their impact (Figure VI).
Note: ‘Other’ reasons for doing IMM include helping investees improve their impact, using it as a risk mitigation strategy, and because it is core to respondents’ strategies (such as in the case of mission-led investors like foundations). Source: GIIN
168
n
167
169
168
158
150
145
113
44
78%
75%
63%
50%
45%
21%
16%
43%
83%Percent reporting very important To better understand our impact
To proactively report our impact to key stakeholders
To manage or improve our impact
We believe that impact data have business value
We need to communicate our impact for marketing and/or fundraising purposes
We are required by our investors or donors to measure and report our impact
There is client demand or pressure from changing cultural norms to measure and report our impact
We are required by government regulations to measure and report our impact
Other
FIGURE VI: REASONS FOR MEASURING AND MANAGING IMPACTChart shows percent of respondents selecting 'very important'; respondents could select multiple options.

15T H E S T A T E O F I M P A C T M E A S U R E M E N T A N D M A N A G E M E N T P R A C T I C E
MEASURESThe many ways investors understand impact are manifested in the different aspects of impact they seek to measure. Most respondents measure the outputs (91%) – the direct products of an organization’s activities – and outcomes (77%) – the changes that result from activities and outputs – of their investments (Figure VII). Roughly 40% of respondents each measure the breadth (the reach of impact across groups of people or ecosystems), additionality (the positive impact that would not have occurred anyway without the investment), or depth (the significance of the impact for the people or ecosystems impacted) of their impact.
FIGURE VII: TYPES OF IMPACT MEASURED n = 169; respondents could select multiple options.
Source: GIIN
130
72
64
62
58
51
34
Measure social / environmental outputs
Measure social / environmental outcomes
Measure the breadth of our impact
Measure whether our impact is additional
Measure the depth of our impact
Benchmark our social / environmental performance
Measure whether our impact is attributable
Measure the longevity of our impact
153Number of respondents
TOOLSImpact investors use various available tools, indicator sets, and standards in their IMM practice, the most commonly used of which are IRIS metrics (62%). Others include the SDGs (42%), B Analytics (41%)3, and the Principles for Responsible Investment (26%).4
CUSTOMIZATIONRespondents noted that selecting appropriate metrics can be challenging, especially when examining portfolio-wide impact across different sectors or themes. Thus, investors use varying levels of customization and standardization in selecting metrics across their portfolios, ranging from using standardized metrics across all of a portfolio’s investments to using specific metrics for each investment (Figure VIII). The most common approach is to use a combination of some standard portfolio-wide metrics and some metrics customized per investment (37%).
FIGURE VIII: CUSTOMIZATION/STANDARDIZATION OF IMPACT METRICSn = 169
Source: GIIN
19%
37%
24%
20%
37%
24%
20%
19% We select a specific set of metrics for each investment.
We customize some metrics for each investment and use some metrics across our entire portfolio.
We use a set of standardized metrics across all investments within our portfolio.
We select a set of metrics for each sector and/or impact objective within our portfolio.
Percent of respondents
3 B Analytics, http://b-analytics.net/.
4 U.N. Principles for Responsible Investment, UNEP Finance Initiative and UN Global Compact, https://www.unpri.org/.
2 Impact investors actively seek to understand and manage their impact

16 G L O B A L I M P A C T I N V E S T I N G N E T W O R K
TARGETS AND INCENTIVESFifty-nine percent of impact investors set targets to measure their progress on social and/or environmental indicators. Most (71% of those that set targets) note that their employees are intrinsically motivated to achieve these impact targets, and 56% note the same for their investees (Figures IX and X). Some further incentivize their employees by factoring the achievement of impact targets into employee performance evaluations (16%) or tying their compensation to the achievement of impact targets (13%). To incentivize investees, some investors require the achievement of impact targets to disburse follow-on capital (31%), to receive the initial investment (23%), or to meet loan covenants (23%).
FIGURE IX: STRATEGIES TO INCENTIVIZE STAFF TO ACHIEVE IMPACT TARGETSn = 100; respondents could cite multiple incentive strategies.
Source: GIIN
35
16
13
6
71Number of respondentsOur team is intrinsically motivated by impact
There is no explicit incentive for sta� to achieve impact targets
One of the factors in employee performance evaluations is the achievement of impact targets
A proportion of compensation is tied to the achievement of impact targets for all sta�
A proportion of compensation is tied to the achievement of impact targets for some sta�
FIGURE X: STRATEGIES TO INCENTIVIZE INVESTEES TO ACHIEVE IMPACT TARGETSn = 100; respondents could cite multiple incentive strategies.
Source: GIIN
32
31
23
23
15
9
8
12
The investee teams are intrinsically motivated by impact
We do not have explicit incentives for investees linked to the achievement of impact targets
Ongoing impact targets must be met in order to receive follow-on capital
Baseline impact targets must be met in order to receive the initial investment
In the case of a debt investment, impact targets are written into a loan covenant
Achievement of impact targets may lead to better investment terms (e.g., reduced cost of capital) Governance and/or management changes can be made if impact targets are not met
In the case of an equity investment, management team compensation or bonuses are linked to impact targets
Other
56Number of respondents
REPORTINGAll respondents but one report their impact to internal or external stakeholders in some fashion. Specifically, 69% report their impact to donors or investors, and 56% include impact performance results in their standard financial reports. Additionally, 40% or more of respondents produce impact reports for management and staff, or produce impact reports available to the public, or share impact performance results on an ad-hoc basis.
3 Impact investors embed IMM into the core of their activities

17T H E S T A T E O F I M P A C T M E A S U R E M E N T A N D M A N A G E M E N T P R A C T I C E
STAFFINGIMM is also core to the staffing and operations of impact investor organizations. Most commonly, respondents assign the responsibility of IMM to the broader investment team (46%) or implement IMM through both dedicated IMM staff and the broader investment team (42%).5
PERSPECTIVES ON THE STATE OF IMM PRACTICE Respondents offered their opinions on the state of IMM practice across the industry (Figure XI). About a quarter of respondents believe that the industry has made significant progress over the past three years in the areas of investor and/or donor understanding of IMM practice and reporting (27%), sophistication of IMM tools and frameworks (26%), and addressing of ESG risk (25%).6 However, several challenges remain, such as fragmentation of approaches to IMM (50% believing this is a significant challenge), integration of impact management and financial management decisions (35%), and transparency of impact performance (34%).
FIGURE XI: SIGNIFICANT AREAS OF PROGRESS AND CHALLENGE IN IMM PRACTICEN varies from 104-126 for each answer choice; optional question.
Source: GIIN
34%
35%
17%
50%
18%
20%
13%
26%
26%
Transparency on impact performance, including targets and results
Integration of impact management and financial management
Addressing impact risk
Addressing fragmentation in approaches to IMM
Availability of professionals with IMM-relevant skill sets
Availability of research and data on IMM practice
Addressing ESG risk
Sophistication of IMM tools and frameworks
Investor and/or donor understanding of IMM practice and reportingPercent reporting significant challenge
11%
11%
12%
14%
21%
23%
25%
26%
27%Percent reporting significant progress
INTERNAL CHALLENGESRespondents also reported on the challenges that they face when implementing IMM within their own organizations. In most aspects of IMM, such as selecting metrics and targets, using data for decision-making and aligning expectations with investors and investees, respondents generally do not note significant challenges. However, the two areas in which many respondents did indicate challenges concern measurement (rather than management), with 43% of respondents citing significant challenges in collecting quality data and 32% citing aggregating, analyzing, and/or interpreting data across a portfolio (Figure XII).
5 IMM staff are those with no other core responsibilities besides IMM.
6 ESG risk is derived from noncompliance with environmental, social, or governance criteria.
4 The industry has made significant progress, yet challenges in IMM persist

18 G L O B A L I M P A C T I N V E S T I N G N E T W O R K
FIGURE XII: INTERNAL CHALLENGES IN IMPLEMENTING IMMN varies from 155-167 (optional question); some respondents chose ‘not sure/not applicable’ and these responses are not included.
Source: GIIN
32%
17%
15%
13%
11%
10%
9%
Collecting quality data
Aggregating, analyzing, and/or interpreting data across a portfolio
Identifying/selecting appropriate impact metrics
Identifying/selecting appropriate impact targets
Using impact data for decision-making
Aligning expectations with our investors and investees
Understanding and/or defining our impact strategy and/or impact thesis
Ensuring buy-in for IMM among key decision-makers at our organization
43%Percent reporting significant challenge
FUTURE OPPORTUNITIESFinally, respondents reported their perspectives on the most valuable tools, ideas, and behaviors to advance IMM practice and overcome its various challenges. Seventy-six percent of respondents felt that transparency in impact data and results is very important to advancing IMM practice, and over half of respondents cited common impact-based principles for investing, consideration of impact data in decision-making with equal emphasis and rigor to financial risk and return, development of an impact benchmark, and integration of impact data into financial accounting standards and reports as very important (Figure XIII).
FIGURE XIII: IMPORTANCE OF VARIOUS TOOLS, IDEAS, AND BEHAVIORS TO ADVANCING THE PRACTICE OF IMMN varies from 128-136 for each answer choice. Some respondents chose ‘not sure/not applicable,’ and these responses are not included. Ranked by percent selecting 'very important.'
Source: GIIN
Common impact-based principles for investing
Consideration of impact data with equal emphasis and rigor to financial risk and return in decision-making
Development of an impact benchmark
76%Percent of respondents
58%
53%
53%
53%
46%
39%
36%
34%
21%
32%
41%
38%
37%
43%
41%
52%
47%
2%
10%
6%
9%
11%
11%
20%
13%
19%
Very important Somewhat important Not important
Transparency in impact data and results
Integration of impact data into financial accounting standards and reports
Tools to strengthen impact screening
Impact measurement certification and credentialing for impact funds and/or analysts
Third-party audit and validation of impact data and performance
Standard term sheets that include impact targets or incentives
The rest of this report contains more detailed analyses and further exploration of insights including investor motivations, IMM methods, and perspectives on IMM.

19T H E S T A T E O F I M P A C T M E A S U R E M E N T A N D M A N A G E M E N T P R A C T I C E
Sample Characteristics he report findings presented are based on a sample of 169 impact investing organizations. To help contextualize the research findings, the sample is described
by organization type, location of headquarters, size of impact investing assets under management (AUM), target returns, and various portfolio concentrations.
ORGANIZATION TYPEFund managers comprise 63% of the sample, with for-profit fund managers accounting for just over half of the total sample (and not-for-profit fund managers accounting for the remaining 12%). Banks and foundations represent 8% and 7% of the sample, respectively. Development finance institutions, family offices, pension funds and insurance companies, permanent investment companies, and other types of organizations also participated (Figure 1).
FIGURE 1: ORGANIZATION TYPEn = 169
Note: ‘Other’ organization types include community development finance institutions, nonprofit organizations, non-governmental organizations, and others. Source: GIIN
51%
12%
8%
7%
5%
For-profit fund manager
Percent of respondents
Nonprofit fund manager
Bank / Diversified financial institution
Foundation
DFI
51%
12%
8%
7%
5%
4%
3%3%
8%
4%
3%
3%
8%
Family o�ce
Pension fund / Insurance company
Permanent investment company
Other
HEADQUARTERS LOCATIONA large majority (80%) of respondents are headquartered in developed markets, with 46% headquartered in the U.S. and Canada and almost a third headquartered in WNS Europe (Figure 2). Seventeen percent of the sample is headquartered in various emerging markets, including SSA, LAC, South or Southeast Asia, and MENA. Two percent reported having no single headquarters location.
FIGURE 2: LOCATION OF SAMPLE HEADQUARTERSn = 169
Source: GIIN
46% U.S. & Canada
Percent of respondents
31% WNS Europe 8% SSA 5% LAC
1% South Asia
3% Oceania
0% East Asia 0% EECA 2% No single
headquarters location
1% MENA2% SE Asia
n = 2
n = 9
n = 2
n = 0
n = 0
n = 53n = 78
n = 13n =3
n = 5

20 G L O B A L I M P A C T I N V E S T I N G N E T W O R K
TARGET FINANCIAL RETURNSOf the 133 respondents for which this information was available, 61% principally target risk-adjusted, market-rate returns, and 39% target below-market-rate returns (Figure 3). Twenty-six percent target below-market-rate returns that are ‘closer to market rate’ and 13% principally target below-market-rate returns that are ‘closer to capital preservation.'
FIGURE 3: TARGET FINANCIAL RETURNS PRINCIPALLY SOUGHTn = 133
Note: These data are sourced from the GIIN’s 2016 Annual Impact Investor Survey and 2017 Annual Impact Investor Survey. Source: GIIN
61%
26%
13%
Market-rate returns
Percent of respondents
Below-market-rate returns: closer to market rateBelow-market-rate returns: closer to capital preservation
61%26%
13%
IMPACT INVESTING ASSETS UNDER MANAGEMENTRespondents in the sample collectively manage USD 107 billion in impact investing assets. The average respondent manages USD 632 million in impact investing assets, while the median respondent manages USD 97 million—indicating that a few respondents manage particularly large pools of capital. In fact, the four respondents with the largest impact investing AUM manage 38% (USD 40 billion) of the total sample AUM. Excluding these four large outliers, the average respondent manages USD 404 million.
Looking at the overall AUM distribution, 75% of respondents manage USD 440 million or less, half manage USD 97 million or less, and 25% manage USD 29 million or less (Figure 4).
FIGURE 4: DISTRIBUTION OF SAMPLE AUMn = 169; USD millions
Source: GIIN
Mean: USD 632 millionsMean excluding outliers: USD 404 millions
Median
USD millions
5TH Percentile
3 29 97 440 2,840
25TH Percentile 75TH Percentile 95TH Percentile
0 500 1,000 2,500 3,000
The Research Team asked respondents whether they make conventional investments in addition to impact investments. Most (69%) exclusively make impact investments.

21T H E S T A T E O F I M P A C T M E A S U R E M E N T A N D M A N A G E M E N T P R A C T I C E
PORTFOLIO CONCENTRATIONSThe following analyses show characteristics of the sample by factors such as geographic or sector focus. Respondents indicated whether their impact investing portfolios were concentrated in any one area (for example in direct investments or a particular sector). The Research Team used a threshold of 75% of impact investing AUM to signify a portfolio concentration. This information helps contextualize findings and better understand the nature of respondents’ investment and IMM activity. Further explanation of portfolio concentrations and a full list of respondent sub-groups may be found in the Methodology section starting on Page 9.
Most of the sample (71%) allocates 75% or more of their impact investing portfolios directly into companies, projects, or real assets (Figure 5), while 18% percent invest primarily indirectly, through funds or other intermediaries.
FIGURE 5: RESPONDENTS WITH PORTFOLIO CONCENTRATIONS IN DIRECT OR INDIRECT INVESTMENTSn = 169
Note: The threshold for portfolio concentration is 75% of AUM. Source: GIIN
71%
18%
11%
Direct investors
Percent of respondents
Indirect investors
No concentration in direct or indirect investments71%
18%
11%
Just under half of the sample (49%) allocates 75% or more of their impact investing portfolios to holdings in emerging markets (Figure 6). A third of respondents allocate primarily to developed markets, while 18% are more balanced between both.
FIGURE 6: RESPONDENTS WITH PORTFOLIO CONCENTRATIONS IN EMERGING OR DEVELOPED MARKETSn = 169
Note: The threshold for portfolio concentration is 75% of AUM. Source: GIIN
49%
33%
18%
EM-focused investors
DM-focused investors
No geographic concentration
49%
33%
18%
Percent of respondents

22 G L O B A L I M P A C T I N V E S T I N G N E T W O R K 22I M M S U R V E Y 2 0 1 7
Overall, respondents in the sample have diversified sector allocations; most (69%) have no strong concentration in any one sector (Figure 7). Respondents’ most common sector focus is financial services, with 12% of the sample allocating 75% or more of their AUM to investments to this sector.
FIGURE 7: RESPONDENTS WITH PORTFOLIO CONCENTRATIONS BY SECTOR n = 169
Note: The threshold for portfolio concentration is 75% of AUM. No respondents are concentrated in arts & culture, infrastructure, or manufacturing. ‘Other’ sectors include commercial real estate, media, businesses with positive climate materiality, and others. Source: GIIN
69%
31%
12%
6%
2%
2%
2%
69% No sector concentrationFinancial services
Food & ag
Education
Forestry & timber
Housing
1%
1%
1%
1%
4%
Healthcare
Energy
ICT
WASH
Other
Percent of respondents
Thirty-one percent of respondents in the sample allocate 75% or more of their AUM to private debt investments, and just over a quarter allocate primarily to private equity investments (Figure 8). Almost one-third of the sample has no strong instrument concentration.
FIGURE 8: RESPONDENTS WITH PORTFOLIO CONCENTRATIONS BY INSTRUMENT n = 169
31%
26%
32%
Private debt
Private equity
No instrument concentration
3%
3%
2%
2%
1%
Public debt
Equity-like debt
Public equity
Real assets
Deposits & cash equivalents 26%
32% 31%
11%
Percent of respondents
Note: The threshold for portfolio concentration is 75% of AUM. Source: GIIN

23T H E S T A T E O F I M P A C T M E A S U R E M E N T A N D M A N A G E M E N T P R A C T I C E
Motivations for Measuring and Managing Impact
ne hallmark of impact investing is investors’ commitment to measuring and understanding the positive impact they generate for people and the planet. Through the
following questions, the Research Team delved deeper into respondents’ specific motivations for measuring and managing positive impact. The section explores which themes or issue areas investors seek to positively impact, and investors with social impact objectives reported which groups of society they seek to benefit.
A large majority of respondents indicated that measuring and managing impact is central to furthering their impact goals. For example, 83% agree impact measurement and management (IMM) is very important for better understanding their impact, and 75% report that IMM is very important to managing or improving their impact (Figure 9). Another large majority (78%) feel IMM is very important for proactively reporting impact to key stakeholders, yet fewer than half (45%) find that requirements from investors or donors present a very important reason for IMM. Interestingly, almost half (48%) of direct investors say IMM is very important because investors or donors require them to report on impact, while only 29% of indirect investors share this view.
Sixty-three percent feel IMM is very important because impact data have business value, a notion echoed by 6 in 10 respondents to the GIIN’s 2016 Annual Impact Investor Survey.7 Interestingly, U.S. and Canada-headquartered respondents were more likely to select this motivation (very important for 74%) than were WNS Europe-headquartered respondents (45%).
Few respondents report IMM being very important because of client demand or changing cultural norms (21%) or because of government regulations (16%). A greater share of U.S. and Canada-based respondents feel these reasons are very important (31% feel client demand is very important and almost a quarter cite government regulations) than do WNS Europe-headquartered respondents (12% and 11%, respectively). Overall, the findings suggest that internal motivations for measuring and managing impact are much stronger than external ones.
FIGURE 9: REASONS FOR MEASURING AND MANAGING IMPACTNumber of respondents shown beside each bar; respondents could select multiple options.
To proactively report our impact to key stakeholders
To manage or improve our impact
We believe that impact data have business value
168
n
167
169
168
158
150
145
113
44
Very important Somewhat important Neutral Not important
To better understand our impact
We need to communicate our impact for marketing and/or fundraising purposes
We are required by our investors or donors to measure and report our impact
There is client demand or pressure from changing cultural norms to measure and report our impact
We are required by government regulations to measure and report our impact
Other
83%
78%
75%
63%
50%
45%
21%
16%
43%
15%
18%
20%
29%
39%
31%
40%
13%
11%
1%
4%
5%
7%
4%
18%
21%
28%
41%
1%
7%
5%
18%
42%
5%
Percent of respondents
Note: ‘Other’ reasons for measuring and managing impact include helping investees improve their impact, using it as a risk mitigation strategy, and that it is core to respondents’ strategies (such as in the case of mission-led investors like foundations). Source: GIIN
7 Abhilash Mudaliar, Hannah Schiff, and Rachel Bass, Annual Impact Investor Survey 2016 (New York: The Global Impact Investing Network, May 2016), https://thegiin.org/knowledge/publication/annualsurvey2016.

24 G L O B A L I M P A C T I N V E S T I N G N E T W O R K
TARGETING SOCIAL AND ENVIRONMENTAL IMPACT OBJECTIVESMost respondents (59%) make investments in order to have both social and environmental impact (Figure 10). Just over a third of respondents (36%) primarily target social impact, while only 6% focus primarily on environmental impact.
FIGURE 10: PRIMARY IMPACT OBJECTIVEn = 169
Source: GIIN
59%
36%
6%
Social & environmental
Social
Environmental59%
36%
6%
Percent of respondents
Interestingly, 18% of DM-focused respondents are primarily focused on environmental impact, while no EM-focused respondents are, a statistically significant difference. About 10% of PE-focused respondents primarily target environmental impact, compared to 2% of PD-focused respondents.
TARGET IMPACT THEMESTo gain insight on the types of positive impact investors seek to create, the Research Team asked respondents to report which impact themes they target, as aligned with the U.N. Sustainable Development Goals (SDGs).8 On average, respondents allocate capital to between four and five of these themes. The most commonly targeted impact theme is ‘decent work and economic growth,’ which 60% of respondents pursue (Figure 11). Forty-four percent target ‘good health and well-being,' and 39% target each of ‘affordable and clean energy’ and ‘quality education.’
8 Refer to page 40 for more information on the U.N. Sustainable Development Goals (SDGs).

25T H E S T A T E O F I M P A C T M E A S U R E M E N T A N D M A N A G E M E N T P R A C T I C E
FIGURE 11: NUMBER OF RESPONDENTS WITH SOME ALLOCATION TO EACH IMPACT THEMEn = 124 (optional question); respondents could select multiple options.
54
48
48
39
38
34
32
Decent work and economic growth
Good health and well-being
Quality education
A�ordable and clean energy
No poverty
Sustainable cities and communities
Industry, innovation, and infrastructure
Responsible consumption and production
74
29
28
27
24
16
14
10
Reduced inequalities
Clean water and sanitation
Climate action
Gender equality
Zero hunger
Life on land
Partnerships for sustainable development
9
5
27
Peace, justice, and strong institutions
Life below water
Other
Number of respondents
Note: ‘Other’ includes impact themes such as affordable housing, sustainable agriculture, and financial inclusion. Additionally, some respondents intend to generate impact across many different themes and do not track AUM allocations to specific impact themes. Source: GIIN
EM- and DM-focused investors target somewhat different impact objectives. A higher percentage of DM-focused investors reported targeting ‘sustainable cities and communities,’ ‘responsible consumption and production,’ and ‘climate action,’ while a higher proportion of EM-focused investors target ‘no poverty,’ ‘decent work and economic growth,’ ‘good health and well-being,’ and ‘quality education’ (Figure 12).9 These priorities likely reflect the most persistent and acute needs in their respective target geographies.
The impact themes that market-rate and below-market-rate investors target also differ somewhat. A greater share of market-rate investors allocate capital to environmentally related themes, such as ‘climate action’ (31% have some allocation versus 8% of below-market-rate investors, a statistically significant difference) and ‘clean water and sanitation’ (26% versus 15% of below-market-rate investors). A majority (69%) of market-rate investors allocate capital to ‘decent work and economic growth,’ versus fewer than half (44%) of below-market investors – also a statistically significant difference.
9 Differences were found to be statistically significant for these impact themes: ‘sustainable cities and communities’, ‘climate action’, and ‘no poverty’.

26 G L O B A L I M P A C T I N V E S T I N G N E T W O R K
FIGURE 12: DM- AND EM-FOCUSED RESPONDENTS WITH SOME ALLOCATION TO EACH IMPACT THEMEOptional question; respondents could select multiple options. Ranked in order of total number of respondents with some allocation to each impact theme.
EM-focused investors: n = 63 DM-focused investors: n = 41
44%29%
40%24%
37%29%
41%15%
16%44%
29%22%22%
32%
Decent work and economic growth
Good health and well-being
Quality education
A�ordable and clean energy
No poverty
Sustainable cities and communities
Industry, innovation, and infrastructure
Responsible consumption and production
59%46%
19%17%
24%20%
10%32%
27%7%
14%7%
5%15%
14%
10%
Reduced inequalities
Clean water and sanitation
Climate action
Gender equality
Zero hunger
Life on land
Partnerships for sustainable development5%
7%0%
0%
11%34%
Peace, justice, and strong institutions
Life below water
Other
Percent of respondents
Note: ‘Other’ includes impact themes such as affordable housing, sustainable agriculture, and financial inclusion. Additionally, some respondents intend to generate impact across many different themes and do not track AUM allocations to specific impact themes. Source: GIIN
Respondents also reported the percentage of their impact investing AUM allocated to each impact theme. As the Research Team expected, the highest proportion of sample AUM is directed at ‘decent work and economic growth’ (24%). The impact theme with the next-largest allocation is ‘climate action’ (16% of AUM), followed by ‘sustainable cities and communities’ (11%; Figure 13).

27T H E S T A T E O F I M P A C T M E A S U R E M E N T A N D M A N A G E M E N T P R A C T I C E
Impact Report Highlight: WHEB Asset ManagementWHEB is a UK-based fund manager that primarily invests in public equity in developed markets. In its 2016 Annual Impact Report,10 it details how its Sustainability Fund directly and indirectly contributes to several U.N. SDGs. WHEB has mapped its impact themes and metrics to the SDGs, from which it calculated its fund allocations to companies directly contributing to specific goals:
Note: ‘Other’ includes impact themes such as affordable housing, sustainable agriculture, and financial inclusion. Additionally, some respondents intend to generate impact across many different themes and do not track AUM allocations to specific impact themes. Source: GIIN
FIGURE 13: ASSET ALLOCATIONS BY IMPACT THEMEn = 124 (optional question); respondents could select multiple options.
Sample excluding outliers: n = 120; AUM = USD 38.3 billion Outliers: n = 4; AUM = USD 40.2 billion
% of AUMexcl. outliers
% of totalAUM n USD millionsImpact themes
Partnerships for sustainable development
Responsible consumption and production
Industry, innovation, and infrastructure
Clean water and sanitation
A�ordable and clean energy
Good health and well-beingSustainable cities and communities
Decent work and economic growth
Quality education
No poverty
Zero hunger
Climate action
Gender equality
Life on land
Life below water
Other
Reduced inequalities
Peace, justice, and strong institutions
74
27
38
54
16
48
39
28
32
34
48
24
29
9 915
14
5 287
10
27
18,635
12,586
8,495
5,830
3,359
3,286
2,740
2,725
2,647
1,430
1,309
1,264
1,134
850
260
10,698
24%
5%
10%
3%
0%
4%
7%
2%
3%
3%
3%
3%
3%
2%
2%
0%
1%
24%
24%
16%
11%
7%
4%
4%
3%
3%
3%
2%
2%
2%
1%
1%
1%
0%
0%
14%
10 WHEB, Performance Through Positive Impact (May 2017), http://www.whebgroup.com/media/2017/05/WHEB-Impact-Report-2016-1.pdf.
35% Good Health and Well-Being
19% Industry, Innovation, and Infrastructure
15% Clean Water and Sanitation
15% Affordable and Clean Energy
12% Responsible Consumption and Production
3% Sustainable Cities and Communities
1% Quality Education

28 G L O B A L I M P A C T I N V E S T I N G N E T W O R K
TARGET BENEFICIARIESRespondents pursuing social impact objectives indicated which groups of people they seek to impact. Many organizations noted that positive impact on the end beneficiaries is an important factor in IMM, among which a handful shared how they incorporate these beneficiaries’ voices; these quotes are incorporated throughout the report. On average, respondents target around three beneficiary groups. Most respondents target individuals of a certain socioeconomic status (83%), and 58% seek to impact women and girls (Figure 14). Almost half target unemployed individuals, and over a third target youth and children.
FIGURE 14: TARGET BENEFICIARY GROUPSn = 140 (optional question); respondents could select multiple options.
81
66
51
39
33
22
9
31
116
Other
LGBTQ individuals
Refugees or displaced individuals
Disabled individuals
Racial, ethnic, or religious minorities
Youth and children
Unemployed individuals
Women and girls
Individuals of a certain socioeconomic status Number of respondents
Note: ‘Other’ includes beneficiary groups such as former inmates, veterans, elderly people, and small businesses. Source: GIIN
DM- and EM-focused investors differ considerably in terms of beneficiaries. On average, DM-focused investors seek to impact a wider array of beneficiary groups, while EM-focused investors are slightly more concentrated. About sixty percent of EM-focused investors target women and girls (Figure 15), versus 46% of DM-focused investors. On the other hand, DM-focused respondents seek to benefit youth and children, minorities, disabled individuals, and refugees in much greater proportions than do EM-focused investors, differences which are statistically significant.
Note: ‘Other’ includes beneficiary groups such as former inmates, veterans, elderly people, and small businesses. Source: GIIN
84%
61%
38%
23%13% 9% 8%
3%
17%
81%
46% 49%57%
43% 43%
24%
8%
24%
Perce
nt of
respo
nden
ts
Individuals of a certain
socioeconomic status
Women and girls Unemployed individuals
Youth and children
Racial, ethnic, or religious minorities
Disabled individuals
Refugees or displaced
individuals
LGBTQ individuals
Other
EM-focused investors: n = 77 DM-focused investors: n = 37
FIGURE 15: TARGET BENEFICIARY GROUPS AMONG EM- AND DM-FOCUSED INVESTORSOptional question; respondents could select multiple options.

29T H E S T A T E O F I M P A C T M E A S U R E M E N T A N D M A N A G E M E N T P R A C T I C E
Depending on an investee’s business model, an investment can drive impact for a variety of groups connected to the business, including customers, employees, suppliers, distributors, among others. Respondents indicated which stakeholders along the supply chain they seek to benefit. Over 90% seek to benefit their investees’ customers or clients, and almost three-quarters seek to impact their investees’ employees (Figure 16). A fund manager commented, “We engage with portfolio company employees to obtain a better understanding of how the company provides opportunities for career development and growth for its workforce.”
FIGURE 16:TARGET INVESTEE STAKEHOLDERSn = 149 (optional question); respondents could select multiple options.
109
67
44
27
137Number of respondents
Other
Distributors of investees
Suppliers of investees
Employees of investees
Customers / clients of investees
Note: ‘Other’ includes groups such as shareholders and wider communities – where both customers and clients live. Source: GIIN
Primarily social investors and social and environmental investors both tend to target their positive impact toward clients or customers, but social and environmental investors are more likely to additionally target suppliers, employees, and distributors of investees, all statistically significant differences. (Figure 17).
Note: ‘Other’ includes groups such as shareholders and wider communities – where both customers and clients live. Source: GIIN
Perce
nt of
respo
nden
ts
Customers / clients of investees
Employees of investees Suppliers of investees Distributors of investees
Other
Social and environmental investors: n = 92 Primarily social investors: n = 57
92%
79%
57%
35%23%
91%
63%
26%21%
11%
FIGURE 17: TARGET INVESTEE STAKEHOLDERS AMONG PRIMARILY SOCIAL INVESTORS AND SOCIAL AND ENVIRONMENTAL INVESTORSOptional question; respondents could select multiple options.

30 G L O B A L I M P A C T I N V E S T I N G N E T W O R K
Perspectives on the MarketPROGRESS AND CHALLENGES IN IMM PRACTICEImpact measurement and management (IMM) is a core characteristic of impact investing and is a practice that has evolved significantly over the past several years. Given the importance of IMM and the progress the field has experienced, survey respondents were asked to offer their opinions on the state of IMM practice in the broader industry. The survey presented several elements of IMM practice, and respondents reported both how much progress had been made in each area over the past three years and the extent to which each aspect remains a challenge today.
While respondents generally reported some progress across most indicators over the past three years, many indicators remain significant challenges, according to respondents (Figure 18). Twenty percent or more of respondents felt that significant progress had been made in the past three years in five areas: ‘investor and/or donor understanding of IMM practice and reporting,’ ‘sophistication of IMM tools and frameworks,’ ‘addressing ESG risk,’ ‘availability of research and data on IMM practice,’ and ‘availability of professionals with IMM-relevant skill sets.’
Meanwhile, half of respondents report fragmentation in approaches to IMM as a significant challenge today, with 9% of respondents indicating that progress in this area had actually ‘worsened’ over the past three years. Over a third of respondents cited two other key challenge areas: ‘integration of impact management and financial decisions’ (35%) and ‘transparency on impact performance, including targets and results’ (34%).
FIGURE 18: SIGNIFICANT AREAS OF PROGRESS AND CHALLENGE IN IMM PRACTICEN varies from 104-126 for each answer choice; optional question.
Source: GIIN
34%
35%
17%
50%
18%
20%
13%
26%
26%
Transparency on impact performance, including targets and results
Integration of impact management and financial management
Addressing impact risk
Addressing fragmentation in approaches to IMM
Availability of professionals with IMM-relevant skill sets
Availability of research and data on IMM practice
Addressing ESG risk
Sophistication of IMM tools and frameworks
Investor and/or donor understanding of IMM practice and reportingPercent reporting significant challenge
11%
11%
12%
14%
21%
23%
25%
26%
27%Percent reporting significant progress

31T H E S T A T E O F I M P A C T M E A S U R E M E N T A N D M A N A G E M E N T P R A C T I C E
As a group, EM-focused investors cited greater progress against most indicators than did DM-focused investors, most notably in ‘addressing ESG risk’ (30% versus 19%), ‘availability of research and data on IMM practice’ (30% versus 19%), and ‘addressing impact risk’ (17% versus 6%). Direct investors were also more likely to cite progress than were indirect investors, with the greatest disparity in ‘sophistication of IMM tools and frameworks’ (30% versus 9%) and ‘availability of research and data on IMM practice’ (23% versus 9%). Across segments, respondents indicated generally consistent levels of challenge remaining for the industry.
ORGANIZATIONAL CHALLENGES WITH IMMIn addition to commenting on progress and challenges across the industry, respondents shared the specific challenges they face in implementing IMM within their organizations. Overall, respondents found issues pertaining to measurement more challenging than those concerning management (Figure 19). Forty-three percent of respondents noted ‘collecting quality data’ as a significant challenge, while another third cited ‘aggregating, analyzing, and/or interpreting data across a portfolio.’ In all other aspects of IMM—whether selecting metrics and targets, using data for decision-making, or aligning expectations with investors and investees—more respondents reported these aspects as not being challenges than reported them as being significant challenges. Promisingly, 65% of respondents indicated that ‘ensuring buy-in for IMM among key decision-makers at our organization’ was not a challenge.
FIGURE 19: SEVERITY OF IMM CHALLENGES WITHIN RESPONDENT ORGANIZATIONSN varies from 155-167 (optional question); some respondents chose ‘not sure/not applicable,’ and these responses are not included. Ranked by percent selecting ‘significant challenge.’
Source: GIIN
Percent of respondents
Significant challenge Moderate challenge Not a challenge
43%
32%
17%
15%
13%
11%
10%
9%
49%
47%
56%
54%
44%
52%
51%
26%
9%
21%
26%
31%
43%
36%
39%
65%
Collecting quality data
Aggregating, analyzing, and/or interpreting data across a portfolio
Identifying/selecting appropriate impact metrics
Identifying/selecting appropriate impact targets
Using impact data for decision-making
Aligning expectations with our investors and investees
Understanding and/or defining our impact strategy and/or impact thesis
Ensuring buy-in for IMM among key decision-makers at our organization

32 G L O B A L I M P A C T I N V E S T I N G N E T W O R K
OPPORTUNITIES TO STRENGTHEN IMM PRACTICERespondents’ answers about the most necessary tools, ideas, and behaviors to advance IMM reflect the challenges described above at both the industry and organizational levels. Respondents identified ample opportunity to strengthen the industry’s approach to IMM, with a particular focus on transparency, shared understanding, and rigor (Figure 20). Over three-quarters of respondents felt that ‘transparency in impact data and results’ is very important to advancing IMM practice, and over half of respondents cited each of ‘common impact-based principles for investing,’ ‘consideration of impact data with equal emphasis and rigor to financial risk and return in decision-making,’ ‘development of an impact benchmark,’ and ‘integration of impact data into financial accounting standards and reports’ as being ‘very important’. With regard to principles, one respondent noted, “It is difficult to create a common standard, but principles for impact investing are just as important as reporting financial performance.” By contrast, roughly one in five respondents considered either ‘impact measurement certification and credentialing for impact funds and/or analysts’ or ‘standard term sheets that include impact targets or incentives’ to be ‘not important’ to advancing IMM practice.
FIGURE 20: IMPORTANCE OF VARIOUS TOOLS, IDEAS, AND BEHAVIORS TO ADVANCING THE PRACTICE OF IMMN varies from 128-136 for each answer choice. Some respondents chose ‘not sure/not applicable,’ and these responses are not included. Ranked by percent selecting 'very important.'
Source: GIIN
Common impact-based principles for investing
Consideration of impact data with equal emphasis and rigor to financial risk and return in decision-making
Development of an impact benchmark
76%Percent of respondents
58%
53%
53%
53%
46%
39%
36%
34%
21%
32%
41%
38%
37%
43%
41%
52%
47%
2%
10%
6%
9%
11%
11%
20%
13%
19%
Very important Somewhat important Not important
Transparency in impact data and results
Integration of impact data into financial accounting standards and reports
Tools to strengthen impact screening
Impact measurement certification and credentialing for impact funds and/or analysts
Third-party audit and validation of impact data and performance
Standard term sheets that include impact targets or incentives
Direct investors placed greater importance than did indirect investors on nearly every tool, idea, and behavior for advancing IMM practice (Figure 21), with the greatest divergence on ‘tools to strengthen impact screening’—52% of direct investors cited this as very important compared to just 21% of indirect investors. Direct and indirect investors also indicated substantially different views on the importance of ‘third-party audit and validation of impact data and performance,’ ‘common impact-based principles for investing,’ and ‘transparency in impact data and results.’ These differences reflect, in part, their disparate levels of involvement in selecting portfolio companies, projects, or real assets, and in measuring impact firsthand.

33T H E S T A T E O F I M P A C T M E A S U R E M E N T A N D M A N A G E M E N T P R A C T I C E
FIGURE 21: DIRECT AND INDIRECT INVESTORS THAT INDICATED EACH TOOL, IDEA, OR BEHAVIOR AS ‘VERY IMPORTANT’Optional question.
Direct investors: n = 89-95 Indirect investors: n = 24-26
Transparency in impact data and results
Common impact-based principles for investing
Consideration of impact data with equal emphasis and rigor to financial risk and return in decision-making
Development of an impact benchmark
Integration of impact data into financial accounting standards and reports
Tools to strengthen impact screening
Impact measurement certification and credentialing for impact funds and/or analysts
Third-party audit and validation of impact data and performance
Standard term sheets that include impact targets or incentives
80%
60%
53%
59%
57%
52%
42%
41%
37%
62%
42%
58%
44%
44%
21%
36%
21%
19%
Percent of respondents
Source: GIIN

34 G L O B A L I M P A C T I N V E S T I N G N E T W O R K
MARKET SPOTLIGHT: EMERGING EFFORTS FOR IMPACT MEASUREMENT AND MANAGEMENTAs IMM practice has advanced over the last few years, it has engendered increasingly sophisticated approaches for investors to understand the impact of their investments. The efforts outlined below seek to help investors frame their overall approach to measuring and managing their impact.
The Impact Management Project, launched in late 2016, is a multi-stakeholder initiative designed to identify appropriate conventions in impact expectations, communications, and management.11 A multi-stakeholder process including over 700 practitioners has identified five dimensions of impact: what, how much, who, contribution, and risk (Figure 22). These dimensions can help investors frame their thinking about how people and the planet directly experience impact, which the Impact Management Project proposes as the foundation of impact management. Investors can use their existing measurement methods and metrics with this impact management initiative.
FIGURE 22: THE FIVE DIMENSIONS OF IMPACT
WHAT HOW MUCH CONTRIBUTION RISKWhat outcomes does the e�ect
relate to, and how important are they
to the people (or planet)
experiencing it?
How much of the e�ect occurs in the time period?
Who experiences the e�ect and how
underserved are they in relation to
the outcome?
How does the e�ect compare and contribute to what is likely to occur
anyway?
Which risk factors are
significant and how likely is it
that the outcome is di�erent from the expectation?
Important negative outcome(s)
Important positive
outcome(s)
Much worse than what is likely to occur
Much better than what is
likely to occur
Neutral outcome(s)
Marginale�ect
Deepe�ect
Well-served
Under-served Low risk High riskFor few For many
Short-term Long-term
Slowly Quickly
WHO
Source: The Impact Management Project
11 “Understand Impact,” Impact Management Project (2017), http://www.impactmanagementproject.com/understand-impact/.

35
The Investment Leaders Group (ILG) framework, launched in 2016, was developed by the University of Cambridge Institute for Sustainability Leadership in collaboration with the ILG, a network of investment managers and asset owners.12 The overarching framework categorizes the 17 U.N. SDGs according to six broad impact themes to help investors understand and communicate the impact of their investments: basic needs, well-being, decent work, resource security, healthy ecosystems, and climate stability. The framework proposes one representative metric for each impact theme and provides a methodology for categorizing the impact contribution of an investment or fund to these themes, from highly positive to highly negative. Currently, specific methodologies for using the framework to categorize impact are available for the themes of ‘decent work’ and ‘climate stability.’ Its creators posit that the framework’s simplicity allows investors to communicate about impact in factsheets and dashboards with ease and hope it will enable consumers to make decisions that incorporate the social and environmental impacts of various financial products and services.
The GIIN developed the Navigating Impact13 project in 2017, to help investors select impact strategies and adopt metrics that indicate performance toward their goals. The project was created in consultation with industry experts, impact investors, and standards setters. The materials are designed to align to emerging industry conventions and norms and provide an on-ramp to setting and streamlining impact strategy. Navigating Impact resources help impact investors to frame their goals and expectations; select impact strategies according to research-based evidence; select metrics; and access curated resources highlighting existing methods, tools, and guidance to measure and report impact. Navigating Impact is organized by investment theme allowing the investor to either take a deep dive into one, such as Affordable Housing in Developed Markets, or to look at the probable outcomes across multiple investment themes and assemble a number of strategies that fit their goals. At launch, resources will be available for the following themes: affordable housing in developed markets, smallholder agriculture in emerging markets, and access to clean energy in emerging markets.
The Impact Management Principles, published in September 2017, is a guide to IMM provided by the European Venture Philanthropy Association and Social Value International.14 It describes five steps for investors to follow when conducting IMM: (1) set objectives, (2) analyze stakeholders, (3) measure results, (4) verify and value impact, and (5) monitor and report. Each step is guided and informed by principles, such as ‘involve stakeholders,’ ‘understand what changes,’ ‘only include what is material,’ and ‘verify results.’ The framework additionally lists tools, resources, and notes for the practical application of each step in the process.
These efforts represent significant progress for the industry as they provide detailed guidance on impact management and offer new ways to conceive of an organization’s impact. While these initiatives demonstrate the growing number of resources that are helping to advance IMM practice, there has also been an increasing call for coordination and collaboration between the various developers to ensure that new initiatives are not fueling the perceived fragmentation that remains a challenge for impact investors (see Perspectives on the Market on page 30 for more information). One project that aims to reduce IMM fragmentation is the GIIN’s Investors’ Council leadership initiative on IMM. Investors’ Council members, who are leaders of the impact investing industry, are piloting the Impact Management Project to test, refine, and solidify a shared set of fundamentals for impact investing, as a first step in establishing norms for the industry.
12 University of Cambridge Institute for Sustainability Leadership (CISL), In Search of Impact: Measuring the Full Value of Capital (Cambridge, UK: CISL, May 2016), https://www.cisl.cam.ac.uk/publications/publication-pdfs/impact-report.pdf.
13 The Global Impact Investing Network, Navigating Impact: A guide to selecting evidence-based impact strategies and aligned metrics (New York: The Global Impact Investing Network, October 2017) https://thegiin.org/knowledge/publication/navigating-impact.
14 Priscilla Boiardi and Jeremy Nicholls, Impact Management Principles (Brussels: European Venture Philanthropy Association and Social Value International, September 2017), https://evpa.eu.com/knowledge-centre/publications/impact-management-principles.
MA
RKET SPO
TLIGH
T
T H E S T A T E O F I M P A C T M E A S U R E M E N T A N D M A N A G E M E N T P R A C T I C E

36 G L O B A L I M P A C T I N V E S T I N G N E T W O R K
Impact Measurement Practices
espondents answered detailed questions about the different methods they use for impact measurement and management (IMM), specifically regarding what they
measure (e.g., outputs or outcomes); how they select impact targets and metrics; and which tools, indicator sets, or standards they apply.
MEASURING POSITIVE AND NEGATIVE IMPACTWhile impact investors centrally focus on driving positive social and environmental impact, investments of all kinds can also generate negative impact, such as greenhouse gas emissions or the loss of jobs. Respondents indicated the extent to which they measure the positive and negative and/or net impact generated by their investments.15 About two-thirds of respondents only track the positive impact associated with their investments (Figure 23). The other third track negative and/or net impact, either exclusively or in addition to positive impact, for some (15% of respondents) or all (18%) of their investments.
FIGURE 23: MEASURING POSITIVE AND NEGATIVE IMPACTn = 169
Source: GIIN
66%
15%
18%
We only measure positive impact.
Percent of respondents
We measure negative and/or net impact for some of our investments.We measure negative and/or net impact for all of our investments.
66%
15%
18%
Investors with primarily social impact objectives are more likely to only track positive impact than are those seeking both social and environmental impact (77% versus 59%; Figure 24). DM-focused investors are also more likely to measure only positive impact than are EM-focused investors (75% versus 59%). Both of these differences are statistically significant.
FIGURE 24: MEASURING POSITIVE AND NEGATIVE IMPACT, BY SUB-GROUPn = 169
Source: GIIN
Perce
nt of
respo
nden
ts
DM-focused investorsEM-focused investorsPrimarily social investorsSocial and environmental investors
n = 60 n = 99 n = 83 n = 55
We only measure positive impact.
We measure negative and/or net impact for some of our investments.
We measure negative and/or net impact for all of our investments.
23% 13%25%
13%
18%10%
16%13%
59%77%
59%75%
15 Negative impact considers the detrimental effects and externalities of an investment. Net impact is a separate concept that compares those negative effects to other, positive effects of that investment to calculate the total, or net, impact.

37T H E S T A T E O F I M P A C T M E A S U R E M E N T A N D M A N A G E M E N T P R A C T I C E
TYPES OF IMPACT MEASUREDRespondents indicated the different aspects of impact that they seek to measure. The vast majority (91%) measure the social and/or environmental outputs associated with their investments, while over 75% measure the social and/or environmental outcomes of their investments (Figure 25).
Fewer than half of respondents measure the breadth of their impact across different groups of people or the environment, and 38% measure whether they created impact that is additional. Over a third of respondents also measure the depth of their impact or benchmark their impact to that of their peers (37% and 34%, respectively).
FIGURE 25: TYPES OF IMPACT MEASURED n = 169; respondents could select multiple options.
Source: GIIN
Numb
er of
respo
nden
ts
Measure the longevity of our
impact
Measure whether our impact is attributable
Benchmark our social/environmental
performance
Measure the depth of our impact
Measure whether our impact is
additional
Measure the breadth of our
impact
Measure social/environmental
outcomes
Measure social/environmental
outputs
153
130
72 64 62 58 5134
A greater share of direct investors measures whether their impact is additional than do indirect investors (41% versus 32%); the proportion of direct investors measuring attribution is roughly double (34% versus 16%, a statistically significant difference).
Outputs are the direct products of an organization’s activities, such as client-provided services, goods produced, or trainings delivered.Outcomes are the changes that result from these activities and outputs, such as client savings, higher student graduation rates, or improved health.Breadth is the reach of impact across groups of people or ecosystems.Additionality is whether the positive impact would not have occurred anyway, without the investment.
Depth is the significance of the impact for the people or ecosystems impacted.To benchmark is to compare performance to that of peers.Attribution is evidence that positive impact results from the investment, not from other factors (such as market growth or another party’s investment).Longevity is the durability of impact over time.

38 G L O B A L I M P A C T I N V E S T I N G N E T W O R K
TOOLS, INDICATOR SETS, AND STANDARDS FOR MEASURING IMPACTA wealth of resources, much of it publicly available, can help investors measure impact. These resources encompass various tools, frameworks, standards, and rating systems used at varying levels of specificity (Figure 26). Some, like IRIS, span most sectors, while others are sector-specific, like the SPI4, which focuses on financial inclusion. On average, respondents use three such resources, sometimes in addition to customized measurement methods. IRIS is the most commonly used standard (62%).16 About 40% of respondents use the SDGs and B Analytics and/or GIIRS.17 The most commonly used resources are described on Page 39.
FIGURE 26: USAGE OF VARIOUS TOOLS, INDICATOR SETS, AND STANDARDS IN IMM PRACTICE n = 137 (optional question); respondents could select multiple options.
Note: ‘Other’ includes Sustainalytics, the Pinchot Impact Index, CSRHub, MSCI ESG Ratings, the Global Real Estate Sustainability Benchmark (GRESB), and the Green Star rating system. Source: GIIN
57
56
35
19
18
18
16
14
85
8
7
3
3
28
Number of respondents
Other
Total Impact Measurement and Management (TIMM)
PRISM
Social Return on Investment (SROI)
Global Alliance for Banking on Values (GABV)
Sustainability Accounting Standards Board (SASB)
Leadership in Energy and Environmental Design (LEED) ratings system
Global Reporting Initiative (GRI)
Aeris CDFI ratings system
SPI4 / Social Performance Task Force (SPTF)
Principles for Responsible Investment (PRI)
B Analytics / GIIRS
United Nations Sustainable Development Goals (SDGs)
IRIS
A higher proportion of EM-focused investors use IRIS (67%) and the SDGs (42%) than do DM-focused investors (50% and 31%, respectively), both statistically significant differences. On the other hand, a greater proportion of DM-focused investors use B Analytics and/or GIIRS ratings (45%) than do EM-focused investors (38%).
16 The GIIN offers IRIS, developed in 2009, as a free public good to support transparency, credibility, and accountability in impact measurement practices across the impact investing industry. “IRIS,” The Global Impact Investing Network, https://iris.thegiin.org/; and “Guide to Getting Started with IRIS,” The Global Impact Investing Network, https://iris.thegiin.org/guide/getting-started-guide/summary.
17 For more information, refer to the websites of the U.N. Sustainable Development Goals (SDGs), B Analytics, and GIIRS, respectively. “Sustainable Development Goals,” United Nations Sustainable Development Knowledge Platform, https://sustainabledevelopment.un.org/sdgs; “B Analytics,” http://b-analytics.net/; and “GIIRS Funds,” B Analytics, http://b-analytics.net/giirs-funds.

39T H E S T A T E O F I M P A C T M E A S U R E M E N T A N D M A N A G E M E N T P R A C T I C E
MA
RKET SPO
TLIGH
TMARKET SPOTLIGHT: COMMONLY USED IMPACT MEASUREMENT AND MANAGEMENT TOOLS, STANDARDS, AND FRAMEWORKSBecause strong impact measurement is so essential to impact investing, field builders have prioritized developing tools to support impact investors in measuring their social and environmental impact. Impact investors take no single approach to IMM, using various tools, frameworks, and standards according to their preferences and capabilities. The following resources were the most commonly used by the respondents (Figure 26).
IRISIn 2008, the Rockefeller Foundation, Acumen, and B Lab developed IRIS18 in response to the lack of a common language to describe investments’ social and environmental performance. The GIIN became the steward of IRIS in 2009 and the catalog now contains over 500 generally accepted metrics for measuring social, environmental, and financial performance. Standardized metrics increase the credibility of impact measurement and reporting and enable better comparisons of impact performance. IRIS is aligned to many widely used standards, combining metrics across different industries into one central system in an effort to address fragmentation in impact measurement. For example, IRIS links to well-established tools such as GIIRS, the Global Reporting Initiative (GRI), the United Nations Principles for Responsible Investment (UNPRI), and the SP14 Social Performance Task Force standards for microfinance.19 Sixty-two percent of respondents to this survey use IRIS metrics in their IMM practice.
The GIIN has also developed Navigating Impact to support investors in developing and refining their IMM strategy for specific impact themes or sectors. For more information, see Market Spotlight: Emerging Efforts for Impact Measurement and Management on page 34.
FIGURE 27: EXAMPLES OF IRIS METRICS
Target Beneficiary SocioeconomicsSocioeconomic groups of beneficiaries targeted by the organization’s operations. Choose all that apply.
VERY POOR
POOR
LOW INCOME
OTHER
Standard definition
IRIS ID for verifiability and reporting citation
Common terms included in IRIS glossary
Potable Water ProducedAmount of potable water produced during the reporting period. Footnote assumptions.
THESE ARE ALSO IRIS METRICSTHIS IS AN IRIS METRIC
Permanent EmployeesNumber of people employed by the organization at the end of the reporting period. This is the sum of all paid full-time and part-time employees.
Greenhouse Gas EmissionsGreenhouse gases emitted through organization’s operations in tonnes of CO2 equivilent during the reporting period. Refer to the International Panel on Climate Changes (IPCC) emission factors. Leverage Global Reporting Initiative (GRI) guidance for this calculation. Footnote calculations and assumptions.
18 For help selecting metrics from the IRIS catalogue, refer to the following guide. “Guide to Getting Started with IRIS,” The Global Impact Investing Network, https://iris.thegiin.org/guide/getting-started-guide/summary.
19 For a full list of metrics sets to which IRIS is aligned, visit the IRIS website. “Aligned Metrics Sets,” IRIS, https://iris.thegiin.org/metrics/sets.
Source: IRIS catalogue
39T H E S T A T E O F I M P A C T M E A S U R E M E N T A N D M A N A G E M E N T P R A C T I C E

40 G L O B A L I M P A C T I N V E S T I N G N E T W O R K
UNITED NATIONS SUSTAINABLE DEVELOPMENT GOALS (SDGS)In 2015, the United Nations member states unanimously agreed to an agenda for eradicating global social and environmental problems by 2030. This shared vision includes seventeen Sustainable Development Goals (SDGs),20 which build upon the Millennium Development Goals and encompass objectives ranging from ending poverty to achieving gender equality or conserving marine resources. Each SDG is accompanied by a set of specific targets and indicators for measuring progress towards those targets.
Forty-two percent of respondents reported using the SDGs in their IMM practice, including by aligning their impact objectives to the SDGs or using them to report impact. In one example, a respondent noted that after selecting IRIS-aligned impact metrics, they work with investees to identify which SDGs their work helps to advance. The GIIN published a collection of case profiles in 2016 on how impact investors incorporate the SDGs into their work.21 One respondent noted that “our investees select their impact metrics based on their theories of change, and we work with them to identify IRIS definitions that match their metrics. We also identify, with [our] investees, which SDGs their work supports.”
FIGURE 28: UNITED NATIONS SUSTAINABLE DEVELOPMENT GOALS
20 More information on the U.N. Sustainable Development Goals (SDGs) can be found on its website. “Sustainable Development Goals,” United Nations Sustainable Development Knowledge Platform, https://sustainabledevelopment.un.org/sdgs.
21 The Global Impact Investing Network, Achieving the Sustainable Development Goals: The Role of Impact Investing (New York: The Global Impact Investing Network, September 2016), https://thegiin.org/knowledge/publication/sdgs-impinv.
Source: United Nations
40 G L O B A L I M P A C T I N V E S T I N G N E T W O R K

41T H E S T A T E O F I M P A C T M E A S U R E M E N T A N D M A N A G E M E N T P R A C T I C E
B ANALYTICS B Analytics,22 managed by the nonprofit organization B Lab, is a platform that aggregates and analyzes data on over 40,000 companies’ positive impact practices and performance. B Analytics data are sourced from the B Impact Assessment, which analyzes private company practices in the areas of governance, employee well-being, community engagement, environmental impact, and positive impact on customers. B Analytics enables comparison and benchmarking, since companies that complete the assessment receive a B Impact Score, which is also used to certify B Corporations.23 B Analytics data are also used to inform the GIIRS Ratings,24 a system for rating companies and funds on their social and environmental practices.
The B Impact Assessment not only allows companies and funds to evaluate their impact but also includes tools to manage and improve their impact performance, such as improvement reports, case studies, and guides to best practice.25 Forty-one percent of respondents incorporate B Analytics or GIIRS data into their IMM practice.
FIGURE 29: B ANALYTICS ASSESSMENT OVERVIEW
PRINCIPLES FOR RESPONSIBLE INVESTMENT (PRI)Just over a quarter of respondents reported using the Principles for Responsible Investment (PRI) in their IMM practice.26 The PRI are a framework to guide institutional investors to consider matters
of environmental, social, and corporate governance (ESG). In 2005, then-U.N. Secretary General Kofi Annan convened the world’s largest investors to discuss the ways that factors like human rights and climate degradation affect investment performance and how such factors might be considered in investment decisions, leading to six principles that investors can voluntarily pledge to incorporate into their practice to address ESG issues. The Principles are intended to be relevant for large investors with traditional fiduciary duties and include commitments like adding ESG issues into investment analysis and seeking appropriate disclosure on ESG practices from investees. The voluntary network now has over 1,700 signatories.
22 For more information, refer to the websites of B Analytics and GIIRS, respectively. “B Analytics,” http://b-analytics.net/; and “GIIRS Funds,” B Analytics, http://b-analytics.net/giirs-funds.
23 B Corp Certification is a certification for high standards of social and environmental performance, transparency, and accountability. Any company that scores an 80 or above on the B Impact Assessment is eligible to become a Certified B Corp. B Corporation, https://www.bcorporation.net/.
24 More information on the GIIRS Rating methodology may be found on the GIIRS website. “GIIRS Fund Rating Methodology,” B Analytics, http://b-analytics.net/products/giirs-ratings/how-giirs-works/fund-rating-methodology.
25 “Step 3. Improve Your Impact,” B Impact Assessment, B Analytics, http://www.bimpactassessment.net/how-it-works/improve-your-impact.
26 Principles for Responsible Investment, UNEP Finance Initiative and UN Global Compact, https://www.unpri.org/.
Source: B Analytics
MA
RKET SPO
TLIGH
T
41T H E S T A T E O F I M P A C T M E A S U R E M E N T A N D M A N A G E M E N T P R A C T I C E

42 G L O B A L I M P A C T I N V E S T I N G N E T W O R K
CUSTOMIZING IMPACT METRICSUnderstanding impact often involves setting goals and expectations, and then selecting metrics and targets against which to measure progress. Selecting appropriate metrics can be challenging, especially when examining portfolio-wide impact across different sectors or themes. Respondents indicated the extent to which they use standard or tailored impact metrics across their portfolios, with investors reporting varying levels of customization, ranging from using metrics standardized across all of a portfolio’s investments to using specific metrics for each investment (Figure 30). The most common approach (reported by 37% of respondents) is a combination of certain standard, portfolio-wide metrics with other metrics customized by investment.
FIGURE 30: CUSTOMIZATION/STANDARDIZATION OF IMPACT METRICSn = 169
Source: GIIN
19%
37%
24%
20%
37%
24%
20%
19% We select a specific set of metrics for each investment.
We customize some metrics for each investment and use some metrics across our entire portfolio.
We use a set of standardized metrics across all investments within our portfolio.
We select a set of metrics for each sector and/or impact objective within our portfolio.
Percent of respondents
Different segments of respondents indicated notable differences in their customization of impact metrics (Table 1). A higher proportion of direct investors use standardized metrics than do indirect investors (27% versus 19%), while indirect investors are more likely to customize impact metrics for each investment (29%) than are direct investors (16%), a statistically significant difference. PD-focused investors are more likely than PE-focused investors to use a standardized set of metrics across their portfolio (31% versus 16%, also a statistically significant difference), while a greater proportion of PE-focused investors customize their metrics.
TABLE 1: LEVEL OF CUSTOMIZATION OF IMPACT METRICS, BY SUB-GROUP
Source: GIIN
Direct investors 27% 21% 36% 16%119
Indirect investors
Perce
nt of
respo
nden
ts
19% 10% 42% 29%31
PD-focused investors 31% 31% 23% 15%52
PE-focused investors 16% 7% 55% 23%44
We use a set of standardized metrics across all investments within our portfolio
We select a set of metrics for each sector and/or impact objective within our portfolio
We customize some metrics for each investment and use some metrics across our entire portfolio
We select a specific set of metrics for each investment n
A target is a goal against which progress is measured.
A metric is a quantitative or qualitative unit of measure used to track progress towards a target.

43T H E S T A T E O F I M P A C T M E A S U R E M E N T A N D M A N A G E M E N T P R A C T I C E
SELECTING IMPACT METRICSInvestors reported various ways they select impact metrics and targets, but more reported on selecting metrics (n=146) than targets (n=106). Nearly three-quarters select metrics based on the existing evidence used to develop their strategy (such as a logic model or theory of change), and the same proportion use this approach to develop impact targets (Figure 31). Meanwhile, although just over half of respondents use a rating system, index, analytics tool, or other system (such as those described on page 38) to select impact metrics, only 20% use these tools to develop impact targets.
Note: ‘Other’ includes using proprietary data collection methods and tools, using field experience, and working with investees to select target and metrics. Source: GIIN
Perce
nt of
respo
nden
ts
We select them based on the existing evidence we used to
develop our strategy (e.g., theory of change or logic model)
We select them based on a rating system, index, analytics
tool, or other system (e.g., IRIS)
We select them based on the Sustainable
Development Goals
We select them based on regulatory and/or tax credit
requirements
Other
Impact metrics: n = 146 Impact targets: n = 106
73%
51%
25%
10%18%
74%
20% 16%7%
20%
FIGURE 31: WAYS OF SELECTING IMPACT METRICS AND TARGETSOptional question; respondents could select multiple options.
Respondents also indicated who selects these impact metrics or targets. A large majority of respondents select both impact metrics and targets themselves (88% and 82%, respectively; Figure 32). About 30% of respondents said that either their investee companies or the funds in which they invest select impact metrics, and 25% say that investees (companies or funds) select impact targets. Twenty percent said their investors select their impact metrics, and 17% said their investors select their targets. Very few respondents reported that their donors select impact metrics or targets.
Source: GIIN
Perce
nt of
respo
nden
ts
We select them ourselves Our investees or the funds in which we invest select them
Our investors select them Our donors select them Other
Impact metrics: n = 155 Impact targets: n = 127
88%
29%20%
5% 8%
82%
25%17%
2%8%
FIGURE 32: WHO SELECTS IMPACT METRICS AND TARGETSOptional question; respondents could select multiple options.

44 G L O B A L I M P A C T I N V E S T I N G N E T W O R K
PROCESSES FOR COLLECTING AND REPORTING IMPACT DATA
FREQUENCYMost commonly, respondents collect and report impact data quarterly (54% and 42%, respectively) or annually (52% and 66%, respectively; Figure 33). Forty-eight percent of respondents that collect annually also report annually. Twenty percent of respondents collect, and 17% report, on an ad-hoc basis.
Source: GIIN
Perce
nt of
respo
nden
ts
Quarterly Bi-annually Annually On an ad-hoc basis Never
Collect: n = 157 Report: n = 151
54%
14%
52%
20%
1%
42%
12%
66%
17%
1%
FIGURE 33: FREQUENCY OF IMPACT DATA COLLECTION AND REPORTINGOptional question; respondents could select multiple options.
PE-focused investors are more likely to collect and report bi-annually (26% and 32%, respectively) than are PD-focused investors (4% and 8%, respectively), a statistically significant difference. A larger share of PD-focused investors collect and report on an ad-hoc basis (31% and 27%, respectively) than of PE-focused investors (18% and 13%, respectively), also a statistically significant difference.
STAGE A large majority of respondents collect data both before investing (i.e., during due diligence) and while they are invested (86% and 93%, respectively; Figure 34). A third of respondents collect impact data at exit, and 11% collect impact data after exit. One fund manager noted, “In the due diligence process, we want to understand the beneficiaries’ assessment of the quality of the product or service that is being delivered.”
Source: GIIN
Numb
er of
respo
nden
ts
Post-exitExitPost-investment and pre-exitDue diligence
145 158
56
18
FIGURE 34: STAGE OF INVESTMENT AT WHICH INVESTORS COLLECT IMPACT DATAn = 169; respondents could select multiple investment stages.
Interestingly, below-market-rate investors collect impact data at exit at higher rates (56%) than do market-rate investors (27%; Figure 35), a statistically significant difference.

45T H E S T A T E O F I M P A C T M E A S U R E M E N T A N D M A N A G E M E N T P R A C T I C E
Source: GIIN
Market-rate investors: n = 81 Below-market investors: n = 52
Perce
nt of
respo
nden
ts
Post-exitExitPost-investment and pre-exitDue diligence
89% 94%
27%
7%
88%98%
56%
17%
FIGURE 35: STAGE OF INVESTMENT AT WHICH MARKET-RATE AND BELOW-MARKET INVESTORS COLLECT IMPACT DATAOptional question; respondents could select multiple investment stages.
Impact Report Highlight: Quadia Quadia is a Switzerland-based fund manager that notably invests private equity in food and clean energy. In its 2015 Performance Report,27 it explains how impact data drive its investment management process, from setting an investment strategy to exiting an investment. • Strategy setting - Select sectors that align with impact goals
• Deal origination - Vet potential investments based on sustainability
• Due diligence - Assess impact of product or service and scalability of business
• Post-investment - Evaluation of impact progress towards objectives agreed upon between investor and investee
• Exit - Final evaluation to establish if impact value is priced correctly and understand how investee impact will continue post-exit
27 Quadia, Performance Report 2015, (2016), http://www.quadia.ch/wp-quadia/mobile/index.html#p=1.

46 G L O B A L I M P A C T I N V E S T I N G N E T W O R K
COLLECTION METHODSTo collect impact data, 60% of respondents use surveys and 57% use interviews (Figure 36). A little over a quarter (27%) conduct observational studies and/or model performance using an existing evidence base, such as academic studies, impact evaluations, census data, and other secondary sources. Reflecting on data collection, a fund manager wrote, “We use surveys to track our impact on the beneficiaries and end-users.” Perhaps unsurprisingly, only 6% of respondents use more resource-intensive experimental methods to collect data, such as randomized control trials.
FIGURE 36: METHODS INVESTORS USE TO COLLECT IMPACT DATA n = 169; respondents could select multiple methods.
Note: ‘Other’ data collection methods included investee reported data, internal scorecards and dashboards, and operations and customer data collected for business reporting. Source: GIIN
Numb
er of
respo
nden
ts
OtherNot sureExperimental methods
Performance modeling/predicting via
an existing evidence base
Observational studies
InterviewsSurveys
101 97
45 45
103
62
Direct investors reported using surveys (66% of direct-investor respondents) and observational studies (29%) more than indirect investors did (45% and 19%, respectively). Thirty-nine percent of PE-focused investors use observational studies and 30% use performance modeling, compared to 21% and 15%, respectively, of PD-focused investors.
Impact Report Highlight: Overseas Private Investment Corporation (OPIC) OPIC, the U.S. government’s development finance institution, supports investments in emerging markets. The agency monitors its portfolio by requiring annual surveys to be completed by active OPIC-supported projects and conducting site visits to certain projects. The surveys collect information on the impact of the projects and on relevant environmental, social, labor, and health and safety issues. OPIC reports in its 2016 Annual Report on Development Impact28 that the response rate for these surveys was 81%. Site visits are also conducted. Projects selected for site visits are chosen in one of two ways: some of the site visits are randomly selected, while others are selected because of potential impact on the U.S. economy, labor rights, human rights, the environment, or local communities. In 2016, OPIC conducted 45 site visits to collect impact data.
28 Overseas Private Investment Corporation, Annual Report on Development Impact: Fiscal year 2016, (August 2017), https://www.opic.gov/sites/default/files/files/FY16_Annual_Development_Report_Final.pdf.

47T H E S T A T E O F I M P A C T M E A S U R E M E N T A N D M A N A G E M E N T P R A C T I C E
USES OF IMPACT DATAMany investors use the impact data they collect to inform both investment and impact management decisions across their practice (Figure 37). Around three-quarters of respondents use impact data to pre-screen investments or inform due diligence (76%) and to inform investment selection or portfolio allocations (74%). Forty-five percent use these data to inform portfolio modeling and strategy.
Impact data can also inform the ways in which investors engage with investees. Just under half (48%) use impact data to identify opportunities to provide investees with capacity-building support or technical assistance. Investors also use this data to improve investees’ operational efficiency (37%) and help investees design or refine products and services (31%). Sixteen percent of investors use impact data to inform their exit decisions. A fund manager noted, “Impact metrics that directly enable business decisions have the most value. Continuous measurement of impact has helped portfolio companies with customer acquisition and retention.”
FIGURE 37: USES OF IMPACT DATA IN INVESTMENT MANAGEMENT PROCESSESn = 148 (optional question); respondents could select multiple uses.
110
71
66
55
46
23
10
112Number of respondentsFor pre-screening or due diligence
Inform investment selection / portfolio allocation decisions
Identify opportunities for capacity-building support or technical assistance
Inform portfolio modeling and strategy
Improve investees’ operational e�ciency
Help design or refine products / services of our investees
Inform exit decisions and / or exit timing
Other
Note: ‘Other’ included risk assessment and overall assessment of impact investments. Source: GIIN
A larger share of EM-focused investors than DM-focused investors reported using impact data to inform their interactions with investees, especially in the following ways: to identify opportunities for capacity-building support or technical assistance (56% of EM-focused investors, versus 36% of DM-focused investors) and to improve investees’ operational efficiency (48% versus 23% respectively; Figure 38), both statistically significant differences.
FIGURE 38: USES OF IMPACT DATA IN INVESTMENT MANAGEMENT PROCESSES
77%
74%
36%
43%
23%
26%
11%
11%
74%Percent of respondents
74%
56%
44%
48%
38%
17%
4%
Geographic focus Investment focusPercent of respondents
83%
78%
59%
41%
61%
49%
27%
2%
74%
74%
50%
50%
28%
28%
11%
7%
For pre-screening or due diligence
Inform portfolio modeling and strategy
Improve investees’ operational e�ciency
Help design or refine products /services of our investees
Inform exit decisions and/or exit timing
Other
For pre-screening or due diligence
Inform investment selection / portfolio allocation decisions
Inform investment selection / portfolio allocation decisions
Identify opportunities for capacity-building support or technical assistance
Identify opportunities for capacity-building support or technical assistance
Inform portfolio modeling and strategy
Improve investees’ operational e�ciency
Help design or refine products /services of our investees
Inform exit decisions and / or exit timing
Other
EM-focused investors: n = 78 DM-focused investors: n = 50 PD-focused investors: n = 48 PE-focused investors: n = 41
Note: ‘Other’ included risk assessment and overall assessment of impact investments. Source: GIIN

48 G L O B A L I M P A C T I N V E S T I N G N E T W O R K
Some of the differences between the ways PE- and PD-focused investors reported using impact data in investment management were also notable. Eighty-three percent of PE-focused investors use impact data to pre-screen investments or for due diligence and over a quarter (27%) use impact data to inform exit decisions, while 74% and 11% of PD-focused investors, respectively, do the same. PE-focused investors are also much more likely to use these data to improve investee operational efficiency (61%) and to help investees design or refine their products and services (49%) than are PD-focused investors (28% each), both statistically significant differences.
Of course, impact investors also use impact data to inform the various processes involved in managing their impact, such as selecting impact goals, targets, and metrics; improving and deepening their impact; and streamlining data collection and analysis. In fact, over half of respondents indicated using impact data for every aspect of impact management shown in the chart (Figure 39). The most common use of impact data in impact management is to communicate results to stakeholders (85%). Almost three-quarters of respondents also use these data to identify or refine appropriate metrics (72%), and over 60% use them to improve processes for analyzing and interpreting impact data (67%), assess impact and ESG risk factors (64%), and set or revise impact targets (62%).
FIGURE 39: USES OF IMPACT DATA IN IMPACT MANAGEMENT PROCESSES n = 144 (optional question); respondents could select multiple uses.
Source: GIIN
Numb
er of
respo
nden
ts
OtherIdentify which stakeholders are a�ected
by our investments
Refine our data collection process
Set or revise impact expectations and / or
impact targets
Assess impact and ESG risk factors
Improve our process for analyzing and
interpreting impact data
Identify or refine appropriate metrics
Communicate results to stakeholders
123
103 96 92 89 8375
2

49T H E S T A T E O F I M P A C T M E A S U R E M E N T A N D M A N A G E M E N T P R A C T I C E
Capacity for Impact Measurement and Management
emand for suitable resources to execute IMM effectively has grown alongside the impact investing industry. This section describes the various staffing structures and
funding models respondents use to implement IMM.
ALLOCATION OF HUMAN RESOURCES TO IMMAlthough impact investors employ various formal staffing structures, many respondents view IMM as a central component of their work, noting that all employees contribute to IMM. Most commonly, respondents assign the responsibility of IMM to the broader investment team (46%) or have both dedicated IMM staff and the broader investment team conduct IMM (42%; Figure 40).29 Fifteen percent of respondents contract IMM work out to external consultants, 9% rely only on staff members who are solely responsible for IMM, and 9% integrate IMM into the responsibilities of other staff members.
Below-market-rate investors are more likely than are market-rate investors to assign responsibility for IMM to both dedicated staff and to the broader investment team (52% versus 36%, a statistically significant difference). A greater proportion also contract IMM work to external consultants, with 21% of below-market-rate investors using consultants versus 9% of market-rate investors, also a statistically significant difference.
Note: ‘Other’ includes incorporating IMM into the responsibilities of staff on other teams, such as operations, grant management, communications, finance, risk management, marketing, and business development. Source: GIIN
Numb
er of
respo
nden
ts
IMM is a responsibility only of our investment team
IMM is a responsibility of both dedicated sta� and our
investment team
We contract out our IMM work to external
consultant(s)
IMM is a responsibility only of one or more sta� dedicated
to that purpose
Other
7871
251615
FIGURE 40: HUMAN RESOURCES ALLOCATED TO IMMn = 169; respondents could select multiple options.
Impact investors have several reasons to integrate the responsibilities of IMM into the roles of investment management or other staff (Figure 41). Among those that do so, most (77%) believe it is more effective to integrate IMM responsibilities with investment management responsibilities. Meanwhile, 25% indicated that they do not currently have the resources to hire wholly dedicated IMM staff, and 11% believe that since other staff have sufficient time and capacity to dedicate to IMM, they do not need wholly dedicated IMM staff. One fund manager that integrates IMM responsibilities commented, “Impact is at the core of our business, and therefore every staff member is responsible for its achievement.”
29 IMM staff have no other core responsibilities besides IMM.

50 G L O B A L I M P A C T I N V E S T I N G N E T W O R K
Note: ‘Other’ includes several respondents that noted that because they are impact investors, all staff work on IMM. Source: GIIN
36
16
15
We believe it is more e�ective to integrate IMM with investment responsibilities
We do not currently have the resources to hire wholly dedicated IMM sta�
Our other sta� have su�cient time and capacity to dedicate to IMM, and therefore we do not need wholly dedicated IMM sta�
Other
110Number of respondents
FIGURE 41: REASONS TO INTEGRATE IMM RESPONSIBILITIES INTO OTHER STAFF ROLESn = 143; respondents could select multiple options.
For respondents integrating IMM into other staff roles—such as investment/portfolio management, investment sourcing, or investor relations, among others—general trends in terms of percent of time spent on IMM stand out across the various teams. Around half of such respondents noted that those staff members spend up to 10% of their time on IMM responsibilities (Table 2). Around a quarter of such respondents noted that these staff members spend 11-20% of their time on IMM activities, and around 15% said these staff dedicate between 31-40% of their time. For no respondents do these staff spend more than half of their time on IMM responsibilities.
TABLE 2: PERCENT OF NON-IMM STAFF TIME SPENT ON IMM
Note: ‘Other staff’ includes communications, financial analysis, sustainability, research, and management teams. Source: GIIN
0%
1 - 10%
11 - 20%
21 - 30%
31 - 40%
41 - 50%
> 50%
Percent ofsta� time
Investment / portfolio management sta�
n = 123
2%
44%
25%
14%
9%
7%
0%
Investment sourcing sta�
n = 111
11%
48%
19%
14%
7%
2%
0%
Investor relations sta�
n = 85
5%
45%
24%
16%
6%
5%
0%
Other sta�
n = 37
0%
57%
22%
16%
5%
0%
0%
Perce
nt of
respo
nden
ts
For the 71 respondents that have staff solely dedicated to IMM, the median is two staff members per organization. Respondents reported high levels of coordination between these IMM staff and the investment management staff, with over half of respondents reporting significant cross-team coordination on IMM at each stage of the investment process (Table 3). Over three-quarters of respondents noted significant coordination on organizational IMM planning, which includes defining the organization’s broader impact thesis (81%) and setting the organization’s impact investment strategy (77%). These high levels of coordination are consistent with the centrality of IMM to impact investing.
A greater proportion of PE-focused than PD-focused investors reported significant coordination between IMM and investment management staff across the investment process. Around 90% of PE-focused investors reported significant coordination among staff to define impact theses and set investment strategy (87%), while somewhat less than 70% of PD-focused investors reported significant coordination on these aspects (69% and 68%, respectively). Around two-thirds of PE-focused investors reported significant coordination to analyze impact performance (63%) and report impact to external stakeholders (67%), whereas fewer than half of PD-focused investors reported the same (44% and 34%, respectively).

51T H E S T A T E O F I M P A C T M E A S U R E M E N T A N D M A N A G E M E N T P R A C T I C E
TABLE 3: RESPONDENTS REPORTING ‘SIGNIFICANT COORDINATION’ BETWEEN IMM AND INVESTMENT MANAGEMENT STAFF THROUGHOUT THE INVESTMENT MANAGEMENT PROCESS
Source: GIIN
Overall sample
n = 99
PD-focused investors
n = 32
PE-focused investors
n = 24
To define the organization's broader impact thesis 81% 69% 91%To set the organization's impact investment strategy 77% 68% 87%To assess the impact potential of an investee during due diligence 72% 69% 78%To collect data on the impact of investees 71% 59% 78%To improve impact via investment management 65% 62% 83%To set impact expectations for a specific transaction 65% 55% 85%To analyze impact performance 58% 44% 63%To report on impact to external stakeholders 58% 34% 67%
Perce
nt of
respo
nden
ts
INTERACTION WITH INVESTEESRespondents indicated how their staff interact with investees throughout the IMM process (Figure 42). The highest proportions of respondents do so during due diligence to evaluate impact potential (90%) and after investment to collect data on impact performance (88%). Most also interact with investees to align impact, risk, and return expectations (65%), set impact performance targets (58%), and deliver capacity-building support designed to improve impact (53%). Only 2% of respondents reported that their staff do not interact directly with investees about IMM.
FIGURE 42: STAFF INTERACTIONS WITH INVESTEES THROUGHOUT IMM PROCESSn = 144 (optional question); respondents could select multiple options.
127
93
84
76
3
129Number of respondentsThey interact during due diligence to evaluate the impact potential of an investee
They interact post-investment to collect data on impact performance
They interact to align impact, risk, and return expectations
They collaborate to set impact performance targets
They deliver capacity-building support or technical assistance designed to improve impact
They do not interact directly
Source: GIIN
EM-focused investors reported more interaction between staff and investees throughout the IMM process than did DM-focused investors. Most notably, EM-focused investors are more likely to collaborate to set targets and deliver capacity-building support (67% and 59%, respectively) than are DM-focused investors (49% and 44%, respectively), both statistically significant differences. PE-focused investors also interact more with investees than do PD-focused investors, with collaboration to set impact performance targets the largest difference between them (72% compared to 55%, respectively, a statistically significant difference).

52 G L O B A L I M P A C T I N V E S T I N G N E T W O R K
USE OF EXTERNAL CONSULTANTSOf the 25 respondents that hire external consultants for IMM, most reported hiring consultants to conduct evaluations and assessments (such as impact evaluations, randomized control trials, or other in-depth impact assessments; 60%) and to collect, analyze, and/or report routine impact performance data (56%; Figure 43). Fewer respondents hire consultants for services such as identifying appropriate metrics (25%), developing impact targets (16%), or defining their impact strategy, logic model, or theory of change (12%).
FIGURE 43: TASKS FOR WHICH EXTERNAL CONSULTANTS ARE HIREDn = 25; respondents could select multiple options.
14
7
4
3
4
15Number of respondentsConducting impact evaluations, randomized control trials, or other in-depth impact assessments
Routine impact performance data collection, analysis, and / or reporting
Identifying appropriate metrics
Developing impact targets
Defining our impact strategy, logic model, and / or theory of change
Other
Note: ‘Other’ includes qualitative data collection, such as photos and stories, and case studies. Source: GIIN
FUNDING IMM CAPACITYIn addition to staffing, funding is another important resource required for impact investors to execute efficient IMM. Including staff time, hiring external consultants, and any other costs associated with IMM, the majority of respondents (69%) fund IMM capacity through management fees, cash flows, or profits from impact investments. Smaller proportions of respondents fund their IMM capacity through management fees, cash flows, or profits from broader investment activities (18%) or through donor funding (16%; Figure 44). Just 4% of respondents fund their IMM capacity through a full or partial cost-share with investees.
FIGURE 44: FUNDING SOURCE FOR IMM CAPACITYn = 160 (optional question)
31
25
7
10
110Number of RespondentsThrough management fees, cash flows, or profits from our impact investments
Through management fees, cash flows, or profits from our broader investment activities
Through donor funding
Through a full or partial cost-share with our investees
Other
Notes: ‘Other’ includes operations budget and pro-bono or volunteer support. Source: GIIN

53T H E S T A T E O F I M P A C T M E A S U R E M E N T A N D M A N A G E M E N T P R A C T I C E
Sub-groups fund IMM in somewhat different ways (Table 4). Most notably, 35% of below-market-rate investors access donor funding for IMM, compared to just 1% of market-rate investors, a statistically significant difference. EM-focused investors are less likely to fund their IMM capacity through resources from broader investment activities (12%) than are DM-focused investors (27%), while EM-focused investors are more likely to access donor funding (19% versus 7%), both statistically significant differences. Primarily social investors reported funding IMM through donor funding at a higher rate (25%) than social and environmental investors (9%), a statistically significant difference.
TABLE 4: FUNDING SOURCES FOR IMM CAPACITY BY SUB-GROUP
Source: GIIN
Through management fees, cash flows, or profits from our impact investments
Through management fees, cash flows, or profits from our broader investment activities Through donor funding
Through a full or partial cost-share with our investeesn
EM-focused investors 83 70% 12% 19% 7%DM-focused investors 55 67% 27% 7% 0%
Social and environmental investors 99 68% 22% 9% 5%Primarily social investors 60 60% 13% 25% 3%
Market-rate investors 81 73% 15% 1% 2%Below-market investors 52 58% 19% 35% 10%

54 G L O B A L I M P A C T I N V E S T I N G N E T W O R K
Accountability for Performance
any impact investors employ accountability mechanisms to ensure that their impact is achieved, including setting targets and providing incentives to achieve them.
SETTING AND REVISING IMPACT TARGETSRespondents were asked whether they set specific impact targets for their investments. Fifty-nine percent of respondents do so (Figure 45). Respondents focused on emerging markets were somewhat more likely to set targets than their DM-focused counterparts (66% and 55%, respectively). Roughly half of respondents targeting both social and environmental objectives set targets, while 73% of respondents targeting only social impact objectives do so, a statistically significant difference.
FIGURE 45: INVESTORS THAT SET MEASURABLE IMPACT TARGETSn = 169
Source: GIIN
41% No
Percent of respondents
59% Yes
59%
41%
Impact investors revise their impact performance targets for a variety of reasons (Figure 46). Among the 100 respondents that set targets, 81% cited revising them upon discovering new information or evidence. Interestingly, the exact same proportions of respondents—36% each—revise their impact targets upon either exceeding or falling short of their original targets. A similar proportion (37%) also revises targets at fixed, pre-set intervals. A smaller share of respondents revises impact targets if they underperform their financial expectations (19%).
FIGURE 46: FACTORS THAT CAUSE IMPACT INVESTORS TO REVISE IMPACT PERFORMANCE TARGETSn = 100 (optional question); respondents could cite multiple factors.
81
37
36
36
19Underperforming against financial expectations
Falling short of existing impact performance targets
Exceeding existing impact performance targets
Updating impact performance targets is time-bound (e.g., done on an annual, bi-annual, quarterly, or monthly basis)
Discovering new information or evidence Number of respondents
Source: GIIN

55T H E S T A T E O F I M P A C T M E A S U R E M E N T A N D M A N A G E M E N T P R A C T I C E
Direct investors are more likely than indirect investors to revise targets upon discovering new information or evidence (85% compared to 63%, a statistically significant difference). Conversely, 31% of indirect investors revise impact targets in response to underperformance against financial expectations, compared to just 18% of direct investors who do the same.
USE OF INCENTIVES TO ACHIEVE IMPACT TARGETSAmong the 100 impact investors that set impact targets, 71% indicated that their team is intrinsically motivated by impact, perhaps unsurprisingly since many individuals seek careers in impact investing for mission-related reasons. However, several impact investing organizations also provide their staff with specific incentives to achieve impact targets (Figure 47), including embedding the achievement of impact targets in employee evaluations or tying their achievement to a proportion of compensation for some or all staff. Among the 35% of respondents that do not offer any explicit incentives to their staff to achieve targets, about half indicated that their team is intrinsically motivated by impact.
FIGURE 47: STRATEGIES TO INCENTIVIZE STAFF TO ACHIEVE IMPACT TARGETSn = 100; respondents could cite multiple incentive strategies.
35
16
13
6
71Number of respondentsOur team is intrinsically motivated by impact
There is no explicit incentive for sta� to achieve impact targets
One of the factors in employee performance evaluations is the achievement of impact targets
A proportion of compensation is tied to the achievement of impact targets for all sta�
A proportion of compensation is tied to the achievement of impact targets for some sta�
Source: GIIN
In addition to incentivizing staff, impact investors can also provide incentives to investees to achieve impact targets. Again, the highest proportion of respondents cited intrinsic motivations among investee teams to achieve impact targets (56%, Figure 48). Among the 32 respondents that have no explicit incentives for investees linked to the achievement of impact targets, 12 (38%) indicated that their investee teams have intrinsic motivations to reach these targets.
FIGURE 48: STRATEGIES TO INCENTIVIZE INVESTEES TO ACHIEVE IMPACT TARGETSn = 100; respondents could cite multiple incentive strategies.
32
31
23
23
15
9
8
12
The investee teams are intrinsically motivated by impact
We do not have explicit incentives for investees linked to the achievement of impact targets
Ongoing impact targets must be met in order to receive follow-on capital
Baseline impact targets must be met in order to receive the initial investment
In the case of a debt investment, impact targets are written into a loan covenant
Achievement of impact targets may lead to better investment terms (e.g., reduced cost of capital) Governance and/or management changes can be made if impact targets are not met
In the case of an equity investment, management team compensation or bonuses are linked to impact targets
Other
56Number of respondents
Note: ‘Other’ includes provision of operational team bonuses, setting of impact action plans, and ongoing dialogue and engagement with portfolio companies. Source: GIIN

56 G L O B A L I M P A C T I N V E S T I N G N E T W O R K
Additionally, some impact investors incentivize their investees to achieve impact targets by making these targets requirements to receive capital (either follow-on capital or the initial investment), incorporating targets into the terms of the investment, or enacting governance changes if the targets are not met. Nineteen percent of respondents set targets but neither offer explicit incentives nor perceive intrinsic motivations among their investees to achieve them. Other respondents indicated following incentive strategies such as operational team bonuses, development of an impact action plan, and incentives related to measurement. Many respondents noted that their incentive strategies vary by investee or sector.
Seventy-two percent of respondents that set impact targets codify them in legal documents with either investors or investees (Figure 49). Forty-one percent of respondents codify impact targets in loan agreements and term sheets. Respondents also report a range of strategies to include impact targets in agreements with investors or shareholders, including LP and investor agreements (25%), private placement memoranda (PPMs; 24%), and shareholder agreements (18%). Others codify targets in by-laws or other documents, such as side letters, Community Benefits Agreements, and investment policy statements.
FIGURE 49: CODIFICATION OF IMPACT TARGETS INTO LEGAL DOCUMENTSn = 100; respondents could select multiple options.
28
25
24
18
5
8
41Number of respondentsLoan agreements / term sheets
Our impact targets are not codified in any legal documents
LP / investor agreements
PPMs
Shareholder agreements
By-laws
Other
Note: ‘Other’ documents include side letters and Community Benefits Agreements. Source: GIIN

57T H E S T A T E O F I M P A C T M E A S U R E M E N T A N D M A N A G E M E N T P R A C T I C E
MARKET SPOTLIGHT: IMPACT-BASED INVESTOR INCENTIVESBoth financial and impact performance are core to impact investing. As in conventional markets, most impact investors offer both staff and investees incentives tied to financial performance, but far fewer investors provide incentives based on impact performance, largely relying instead on the intrinsic motivations of both staff and investees. As discussed throughout this section, only 30% of respondents that set impact targets provide extrinsic incentives to achieve them.
For private equity funds, such incentive structures are embedded into the determination of carried interest, which then shapes staff compensation. Below are four such examples of impact-based incentives:
· Core Innovation Capital calculates total carry as a function of both impact and financial performance. Ten percent of the carry is determined based on impact performance, and 90% is based on financial performance.30 At the time of a liquidation event, Core’s Impact Audit Committee determines a final “impact score” for the investment as an average of the yearly impact scores, which reflect performance against both short- and long-term performance metrics. Additionally, GP’s are paid an annual bonus based on the impact score.
· GAWA Capital scores its impact performance at a deal level against 25 metrics related to the Smart Campaign’s Client Protection Principles.31 This score is then weighted to reflect the portfolio’s overall performance to fall between 0 and 1. Its carry is determined by both financial performance (which accounts for a maximum 15% carry) and impact performance (which accounts for up to 5% additional carry). The impact component is determined by weighting its impact score against the maximum 5% of potential additional carry.
· The Media Development Investment Fund (MDIF) provides impact-based incentives to the Emerging Media Opportunity Fund under its management. The fund develops an impact score based on performance in five key areas: country mission fit, investee mission fit, increased reach, impact on society, and sustainable exit.32 Each area is assessed on a range of 0–20 for a total score out of 100. MDIF then multiplies the fraction of the total possible score by its standard base carry of 20% to determine the fund’s actual carry.
· UBS develops an impact coefficient, a number between 0 and 1 that weights the impact performance of its fund manager investees.33 This impact coefficient is based on five key components: investment policy targets, implementation of ESG policy, employment growth within investee companies, sector-specific indicators, and quality of reporting. UBS then multiplies the maximum GP carry of 10% by the resulting impact coefficient to determine the final GP carry, thus explicitly linking the fund’s IMM practice to fund-management compensation.
As the impact investing industry’s approach to IMM grows increasingly sophisticated, one would expect the use of impact-based incentive structures to become more common. As the industry matures, investors are well-positioned to ensure that impact remains central by sharing best practices and further integrating impact into key management decisions, governance structures, and operational policies, such as incentive structures.
30 The GIIN, “Impact-Based Incentive Structures.”
31 Transform Finance, Tying Fund Manager Compensation to Impact Outcomes, Issue Brief (Transform Finance Investor Network, September 2016), http://transformfinance.org/blog/2016/9/21/tying-fund-manager-compensation-to-impact.
32 Transform Finance, Tying Compensation to Impact Outcomes.
33 The Global Impact Investing Network, Impact-Based Incentive Structures: Aligning Fund Manager Compensation with Social and Environmental Performance, Issue Brief (New York: The Global Impact Investment Network, December 2011), https://thegiin.org/assets/documents/pub/impact-based-incentive-structures-aligning-fund-manager-comp.pdf.
MA
RKET SPO
TLIGH
T
57T H E S T A T E O F I M P A C T M E A S U R E M E N T A N D M A N A G E M E N T P R A C T I C E

58 G L O B A L I M P A C T I N V E S T I N G N E T W O R K
IMPACT REPORTING AND AUDITINGHow and to whom do impact investors report their impact performance? First, nearly all impact investors responding to the survey report their impact performance (with only one exception; Figure 50). Respondents most commonly produce impact reports for key stakeholders, such as donors or investors (69%), or include impact performance results in their standard financial reports (56%), and 40% of respondents do both. Additionally, 40% or more of respondents produce impact reports for management and staff, produce impact reports available to the public, or share impact performance results on an ad-hoc basis.
Investors focused on emerging markets were slightly more likely to report their impact performance to key stakeholders (75%) or in standard financial reports (60%) than were their DM-focused counterparts (65% and 49%, respectively).
FIGURE 50: WAYS IMPACT INVESTORS REPORT THE IMPACT PERFORMANCE OF THEIR INVESTMENTSn = 169
94
73
70
68
10
1
116Number of respondentsWe produce impact reports for key stakeholders, such as our donors or investors
We include impact performance results in our standard financial reports (such as annual reports)
We produce impact reports for management and sta�
We produce impact reports available to the public
We share impact performance results on an ad-hoc basis
Other
We do not report on impact performance
Note: ‘Other’ includes quarterly reports, blog posts, reports shared with investees, and plans to report impact results publicly in the future. Source: GIIN
Forty-four percent of impact investors use external audits or other external accountability mechanisms to track their impact results (Figure 51). Among those investors using such tools or mechanisms, 37 reported using external audits or validation (49%) and 32 reported using ratings systems or indices (43%). Perhaps unsurprisingly, direct investors are much more likely to hold themselves accountable or be audited by a third party for their impact results than are indirect investors (54% versus 16%, a statistically significant difference).
FIGURE 51: WAYS IMPACT INVESTORS ARE HELD ACCOUNTABLE OR AUDITED FOR IMPACT RESULTSn = 169; respondents could select multiple options.
37
32
1113
External audit/validation
Ratings systems / indices(e.g., GIIRS, Aeris)
Certification of investees(e.g., FSC, SFI, LEED, Rainforest Alliance, Fair Trade)
Other
56% 44%
Audited or held accountable by a third party
Perce
nt of
respo
nden
ts
Number of respondents
Not audited or held accountable by a third party
Note: ‘Other’ includes accountability and monitoring by investors, B Corp and PRI assessments, CRA examinations, review of metrics by ESG experts, and certification of social finance and SRI funds. Source: GIIN

59T H E S T A T E O F I M P A C T M E A S U R E M E N T A N D M A N A G E M E N T P R A C T I C E
APPENDIX 1. LIST OF RESPONDENTS 3Sisters Sustainable Management, LLC
ABN AMRO Social Impact Fund
ACTIAM
Adenia
Adobe Capital
Advance Global Capital Ltd.
Aegon
Alterfin
Althelia Ecosphere
Annie E. Casey Foundation
Anonymous 1
Anonymous 2
Anonymous 3
Anonymous 4
Anonymous 5
Anonymous 6
Anthem Asia
Ascension Investment Management, LLC
Asian Development Bank
Ashburton
ASN Bank
Athena Capital Advisors
Australian Ethical Investment
Avanath Capital Management
Beyond Capital Fund
Big Society Capital
BIO
BlackRock
Blue Haven Initiative
BlueOrchard Finance Ltd.
BNP Paribas
Boston Community Capital
Bridges Fund Management
Business Partners Ltd.
Caisse Solidaire
California Fisheries Fund, Inc.
Calvert Social Investment Foundation, Inc.
Candide Group
Capital Impact Partners
Capricorn Investment Group
CDC Group (Impact Fund / Impact Accelerator)
Christian Super
Citizen Capital
City Light Capital
Clearinghouse CDFI
Closed Loop Partners
Coastal Enterprises, Inc.
Community Capital Management
Community Investment Management
Conservation Forestry
Cordaid
Core Innovation Capital
CoreCo Private Equity
Creas
Creation Investments Capital Management, LLC
Credit Suisse
Dalio Family Office
DBL Partners
Deutsche Bank
Dev Equity
DOB Equity
DOEN Participaties
Developing World Markets (DWM)
EFTA
Elevar Equity
ENGIE Rassembleurs d’Energies
Epiqus Ltd
APPEN
DIC
ES

60 G L O B A L I M P A C T I N V E S T I N G N E T W O R K
Esmée Fairbairn Foundation
F.B. Heron Foundation
Farmland LP
FIS Ameris
Fledge
FMO
Ford Foundation
France Active
Futuregrowth Asset Management
Gates Foundation
GAWA Capital
Generation Investment Management
Global Innovation Fund
Global Partnerships
Grassroots Business Fund
Grassroots Capital Management & Caspian Impact Investment Advisors
Gray Ghost Ventures
GroFin
HCAP Partners
Hooge Raedt Social Venture (HRSV)
ICCO Investments
IDP Foundation, Inc.
Impact Community Capital
Impact Engine
Impact Finance Management
Impact Investment Group
Incofin Investment Management
IntelleGrow
Invest in Visions
Investisseurs & Partenaires (I&P)
JCS Investments, Ltd.
JW McConnell Family Foundation
Kois Invest
Kukula Capital Plc
Lafise Investment Management
Living Cities
Local Enterprise Assistance Fund (LEAF)
Lok Capital
Lombard Odier
Lyme Timber Company
MacArthur Foundation
MainStreet Partners
Media Development Investment Fund (MDIF)
Medical Credit Fund
Mercy Corps
Michael & Susan Dell Foundation
MicroVest Capital Management
New Forests
New Market Funds
New Summit Investments
Northern California Community Loan Fund
Obviam
OMTRIX
Overseas Private Investment Corporation (OPIC)
Patient Capital Collaborative (PCC) Funds
Pearl Capital
Pearson Affordable Learning Fund
PGGM
Phatisa
Prudential
Promotora Social México (PSM)
Quadia
RBC Global Asset Management US, Inc.
Renewal Funds
responsAbility Investments AG
RobecoSAM AG
Root Capital
Sarona Asset Management
Shared Interest
Silicon Badia
SITAWI
SJF Ventures
SME Impact Fund CV, managed by Match Maker Fund Management Ltd
Social Ventures Australia
Sonen Capital
SPF Beheer
SUD Fund
Sustainable Insight Capital Management
Symbiotics
The Climate Trust
The McKnight Foundation
Threshold Group
TIAA Investments
Treehouse Investments
TriLinc Advisors, LLC
Triodos Investment Management
Unitus Seed Fund
Upaya Social Ventures
Vancity
Venture Capital Trust Fund
Veris Wealth Partners
Vermont Community Loan Fund
VilCap Investments
Virginia Community Capital
Vital Capital
Vox Capital
Voxtra
WaterEquity
WHEB
Women’s World Banking Asset Management
XSML Capital
Yunus Social Business
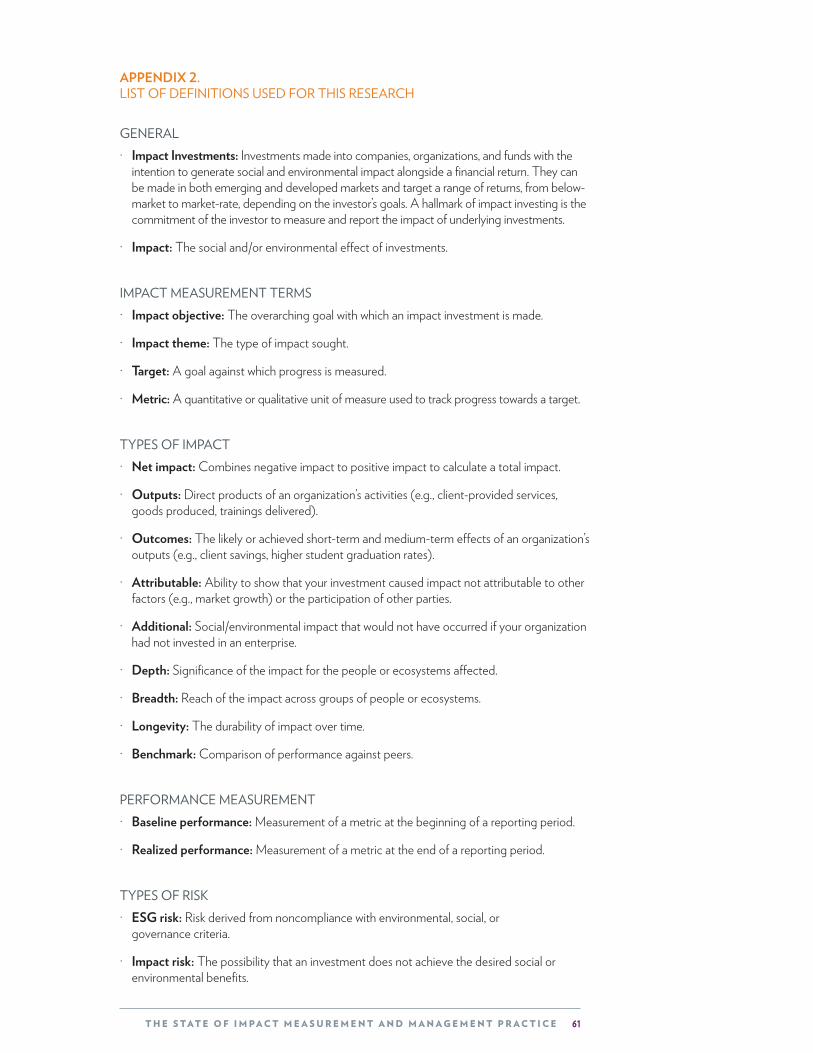
61T H E S T A T E O F I M P A C T M E A S U R E M E N T A N D M A N A G E M E N T P R A C T I C E
APPENDIX 2. LIST OF DEFINITIONS USED FOR THIS RESEARCH
GENERAL · Impact Investments: Investments made into companies, organizations, and funds with the
intention to generate social and environmental impact alongside a financial return. They can be made in both emerging and developed markets and target a range of returns, from below-market to market-rate, depending on the investor’s goals. A hallmark of impact investing is the commitment of the investor to measure and report the impact of underlying investments.
· Impact: The social and/or environmental effect of investments.
IMPACT MEASUREMENT TERMS· Impact objective: The overarching goal with which an impact investment is made.
· Impact theme: The type of impact sought.
· Target: A goal against which progress is measured.
· Metric: A quantitative or qualitative unit of measure used to track progress towards a target.
TYPES OF IMPACT· Net impact: Combines negative impact to positive impact to calculate a total impact.
· Outputs: Direct products of an organization’s activities (e.g., client-provided services, goods produced, trainings delivered).
· Outcomes: The likely or achieved short-term and medium-term effects of an organization’s outputs (e.g., client savings, higher student graduation rates).
· Attributable: Ability to show that your investment caused impact not attributable to other factors (e.g., market growth) or the participation of other parties.
· Additional: Social/environmental impact that would not have occurred if your organization had not invested in an enterprise.
· Depth: Significance of the impact for the people or ecosystems affected.
· Breadth: Reach of the impact across groups of people or ecosystems.
· Longevity: The durability of impact over time.
· Benchmark: Comparison of performance against peers.
PERFORMANCE MEASUREMENT· Baseline performance: Measurement of a metric at the beginning of a reporting period.
· Realized performance: Measurement of a metric at the end of a reporting period.
TYPES OF RISK· ESG risk: Risk derived from noncompliance with environmental, social, or
governance criteria.
· Impact risk: The possibility that an investment does not achieve the desired social or environmental benefits.

62 G L O B A L I M P A C T I N V E S T I N G N E T W O R K
APPENDIX 3: OUTREACH PARTNERSThe GIIN appreciates the assistance of the following organizations, which helped to encourage impact investors in their networks to participate in the survey.
Acrux Partners is an advisory firm focused on responsible and impact investing in South America. In addition to consulting work, Acrux Partners promotes and advocates for the development and consolidation of the responsible and impact investment sector in South America.
www.acruxpartners.com
The Bertha Centre is a specialized unit at the UCT Graduate School of Business. It aims to achieve social justice and impact in Africa through teaching, research, events and practice in systems innovation and innovative business models. Established in partnership with the Bertha Foundation in 2011, it has become a leading academic center dedicated to advancing social innovation and entrepreneurship on the continent.
www.gsb.uct.ac.za
The Dutch Association of Investors for Sustainable Development (VBDO) is a not-for-profit multi-stakeholder organization. Its mission is to make capital markets more sustainable. Members include asset managers, non-governmental organizations, consultancies, trade unions, insurance companies, banks, pension funds, and individual investors. VBDO believes that we can no longer afford not to have sustainability embedded in capital markets. VBDO is the Dutch member of the international network of social investment fora (SIFs).
www.vbdo.nl

63T H E S T A T E O F I M P A C T M E A S U R E M E N T A N D M A N A G E M E N T P R A C T I C E
APPENDIX 4: RELEVANT LITERATURE
WHY MEASURE AND MANAGE IMPACT?Dichter, Sasha, Tom Adams, and Alnoor Ebrahim. The Power of Lean Data. Stanford Social Innovation Review. Winter 2016. http://ssir.org/articles/entry/the_power_of_lean_data.
GIIN Webinar Series on the Social Impact Investment Taskforce and Working Groups. December 17, 2014. https://thegiin.org/knowledge/publication/giin-webinar-series-on-the-social-impact-investment-taskforce-and-working-groups.
Impact performance management. Chapter on Impact Measurement from Eyes on the Horizon: The Impact Investor Survey. May 4, 2015. https://thegiin.org/knowledge/publication/eyes-on-the-horizon.
Schiff, Hannah, Rachel Bass, and Ariela Cohen. The Business Value of Impact Measurement. The GIIN. August 2016. https://thegiin.org/assets/GIIN_ImpactMeasurementReport_webfile.pdf.
So, Ivy and Alina Staskevicius. Harvard Business School. Measuring the “impact” in impact investing. July 2015. http://www.hbs.edu/socialenterprise/Documents/MeasuringImpact.pdf.
Targeting and Measuring Social and Environmental Impact. Chapter on Impact Measurement from the GIIN’s 2016 Annual Survey. May 18, 2016. https://thegiin.org/knowledge/publication/annualsurvey2016.
HOW TO MEASURE AND MANAGE IMPACT?Accion, Apis Partners. Financial Services Impact Measurement Framework. Q3 2015. http://apis.pe/wp-content/uploads/2015/08/Apis-Accion-FS-Impact-Measurement-Framework.pdf.
Collecting Impact Data Using Mobile Technology. June 11, 2013. https://thegiin.org/knowledge/publication/collecting-impact-data-using-mobile-technology.
Edens, Genevieve and Saurabh Lall. The State of Measurement Practice in the SGB Sector. Aspen Network of Development Entrepreneurs. June 2014. https://www.aspeninstitute.org/publications/state-measurement-practice-sgb-sector/.
Getting Started with IRIS. September 3, 2013. https://thegiin.org/knowledge/publication/getting-started-with-iris.
Health Metrics Rationale - Full Report. Standardizing and Improving Performance Measurement for Healthcare Organizations. March 2014. http://healthmarketinnovations.org/document/standardizing-and-improving-performance-measurement-healthcare-organizations.
Hehenberger, Lisa, Anna-Marie Harling, and Peter Scholten. A Practical Guide to Measuring and Managing Impact. European Venture Philanthropy Association. June 2015. https://evpa.eu.com/knowledge-centre/publications/measuring-and-managing-impact-a-practical-guide.
Impact-Based Incentive Structures: Aligning Fund Manager Compensation with Social and Environmental Performance. December 8, 2011. https://thegiin.org/knowledge/publication/impact-based-incentive-structures-aligning-fund-manager-compensation-with-soci.
In search of impact: Measuring the full value of capital. Investment Leaders Group. 2016. https://www.cisl.cam.ac.uk/publications/sustainable-finance-publications/in-search-of-impact-measuring-the-full-value-of-capital.
IRIS and PPI Overview. Collecting and Reporting Poverty Data: Using the Progress out of Poverty Index Toolkit with IRIS. February 2012. https://iris.thegiin.org/documents/whitepapers/iris-and-ppi-overview.pdf.

64 G L O B A L I M P A C T I N V E S T I N G N E T W O R K
IRIS Data Briefs:
Data Driven: A Performance Analysis for the Impact Investing Industry. August 31, 2011. https://iris.thegiin.org/research/data-driven-a-performance-analysis-for-the-impact-investing-industry/summary.
Focus on Employment. June 5, 2013. https://thegiin.org/knowledge/publication/iris-data-brief-focus-on-employment.
Focus on Beneficiaries. March 20, 2014. https://thegiin.org/knowledge/publication/iris-data-brief-focus-on-beneficiaries.
Focus on Impact Objectives. September 29, 2015. https://thegiin.org/knowledge/publication/iris-data-brief-focus-on-impact-objectives.
Land Conservation Metrics Working Group - Full Report. Land Conservation Impact Metrics. June 1, 2013. https://iris.thegiin.org/documents/whitepapers/land-conservation-metrics-working-group-paper.pdf.
McCreless, Mike, CJ Fonzi, Genevieve Edens, and Saurabh Lall. Metrics 3.0: A New Vision for Shared Metrics. Stanford Social Innovation Review. June 2014. http://ssir.org/articles/entry/metrics_3.0_a_new_vision_for_shared_metrics.
NCIF and the GIIN. Collaborating to Harmonize Standardized Metrics for Impact investors. February 2014. https://thegiin.org/assets/documents/pub/collaborating-to-harmonize-standardized-metrics-for-impact-i.pdf.
PWC. Measuring and managing total impact: A new language for business decisions. 2013. https://www.pwc.com/gx/en/sustainability/publications/total-impact-measurement-management/assets/pwc-timm-report.pdf.
Saltuk, Yasemin and Ali El Idrissi. J.P. Morgan. Impact Assessment in Practice: Experience from leading impact investors. May 2015. https://www.jpmorgan.com/jpmpdf/1320674289368.pdf.
Social Impact Investment Taskforce. Measuring Impact: Subject paper of the Impact Measurement Working Group. September 2014. http://www.socialimpactinvestment.org/reports/Measuring%20Impact%20WG%20paper%20FINAL.pdf.
For more information
Please contact Aliana Pineiro at [email protected] with any comments or questions about this report.
To download industry research by the GIIN and others, please visit www.thegiin.org/knowledge-center.
Disclosures
The Global Impact Investing Network (“GIIN”) is a nonprofit 501c(3) organization dedicated to increasing the scale and effectiveness of impact investing. The GIIN builds critical infrastructure and supports activities, education, and research that help accelerate the development of a coherent impact investing industry.
Readers should be aware that the GIIN has had and will continue to have relationships with many of the organizations identified in this report, through some of which the GIIN has received and will continue to receive financial and other support.
The GIIN has collected data for this report that it believes to be accurate and reliable, but the GIIN does not make any warranty, express or implied, regarding any information, including warranties as to the accuracy, validity or completeness of the information.
This material is not intended as an offer, solicitation, or recommendation for the purchase or sale of any financial instrument or security.

More information about the Global Impact Investing NetworkThis brief is a publication of the Global Impact Investing Network (GIIN), the leading
The GIIN builds critical market infrastructure and supports activities, education, and research that help accelerate the development of the impact investing field.
Membership
If your organization is interested in deepening its engagement with the impact investing market by joining a global community of like-minded peers, please consider GIIN membership. To learn more about membership and to access interviews with leading impact investors, research from the field, and more examples of impact investments, visit www.thegiin.org.
IRIS
ImpactBase
GIIN Training Program Career Center
ImpactBase is the GIIN's searchable, online database of impact investment funds and products designed for investors. Fund or product profiles on ImpactBase gain exposure to the global impact investing community.
impactbase.org
IRIS is the catalog of generally-accepted performance metrics that leading impact investors use to measure social, environmental, and financial success, evaluate deals, and grow the credibility of the impact investing industry.
iris.thegiin.org
The GIIN Career Center is a source for job openings from members of the GIIN Investors’ Council and other impact investing leaders.
jobs.thegiin.org
The GIIN training program o�ers practical coursework for investors looking to develop and deepen their practice, especially in the area of impact measurement and management.
thegiin.org/training

GLOBAL IMPACT INVESTING NETWORK
@theGIIN