the state of health of mumbai - praja on the state of... · annexure 1 –list of government...
TRANSCRIPT

1
WHITE PAPER
Report on
The STATE of HEALTH of
MUMBAI
July 2017

2
I. Foreword ...................................................................................................................................................... 4
II. Acknowledgements ..................................................................................................................................... 6
III. Note on Public Health Department Data ..................................................................................................... 7
IV. Data on Diseases/Ailments & Health Personnel in Mumbai (Data got through RTI) ......................... 13
V. Citizen Survey Data........................................................................................................................................ 27
VI. Deliberations by Municipal Councillors and MLAs on Health Issues .......................................................... 33
VII. Ward-wise Occurrence of Diseases .......................................................................................................... 39
Annexure 1 –List of Government dispensaries/hospitals ................................................................................. 47
Annexure 2 – Registration of Birth and Death Act 1969 ................................................................................... 51
Annexure 3 – Socio Economic Classification (SEC) Note ................................................................................... 54
Annexure 4 – Guidelines for dispensaries ......................................................................................................... 55
Annexure 5 – Letter from Senior Medical Officer M/E ward ........................................................................... 56
Annexure 6 – Letter from Senior Medical officer of K/W ward ....................................................................... 57
Annexure 7 – Process flow for Forecasting of Cause of Death data ............................................................. 58
Table 1: Malaria number of cases in government dispensaries/hospital and total deaths in Mumbai from April’2012-
March’2017 ...................................................................................................................................................................... 13
Table 2: Dengue number of cases in government dispensaries/hospital and total deaths in Mumbai from April’2012-
March’2017 ...................................................................................................................................................................... 14
Table 3: Tuberculosis number of cases in government dispensaries/hospital and total deaths in Mumbai from
April’2012-March’2017.................................................................................................................................................... 16
Table 4: Budget for Revised National Tuberculosis Control Programme (RNTCP) (Figures are in lakh)........................ 18
Table 5: Defaulters cases from Directly Observed Treatment, Short Course (DOTS) programme for calendar year ... 19
Table 6: Diarrhoea number of cases in government dispensaries/hospital and total deaths in Mumbai from
April’2012-March’2017.................................................................................................................................................... 20
Table 7: Cholera number of cases in government dispensaries/hospital and total deaths in Mumbai from April’2012-
March’2017 ...................................................................................................................................................................... 21
Table 8: Typhoid number of cases in government dispensaries/hospital and total deaths in Mumbai from April’2012-
March’2017 ...................................................................................................................................................................... 21
Table 9: Diabetes number of cases in government dispensaries/hospital and total deaths in Mumbai from
April’2012-March’2017.................................................................................................................................................... 22
Table 10: Hypertension number of cases in government dispensaries/hospital and total deaths in Mumbai from
April’2012-March’2017.................................................................................................................................................... 22
Table 11: Causes of death in Mumbai from April’2012-March’2017 ............................................................................. 23
Table 12: Age-wise percentage of causes of death in the year April’16-March’17* ..................................................... 23
Table 13: Gender-wise percentage of causes of death in the year April’16-March’17* ............................................... 24
Table 14: Top 10 causes of death in Mumbai ................................................................................................................. 24
Table 15: Data shown in below table is as per, per capita income from 2016-17 .............................................. 30
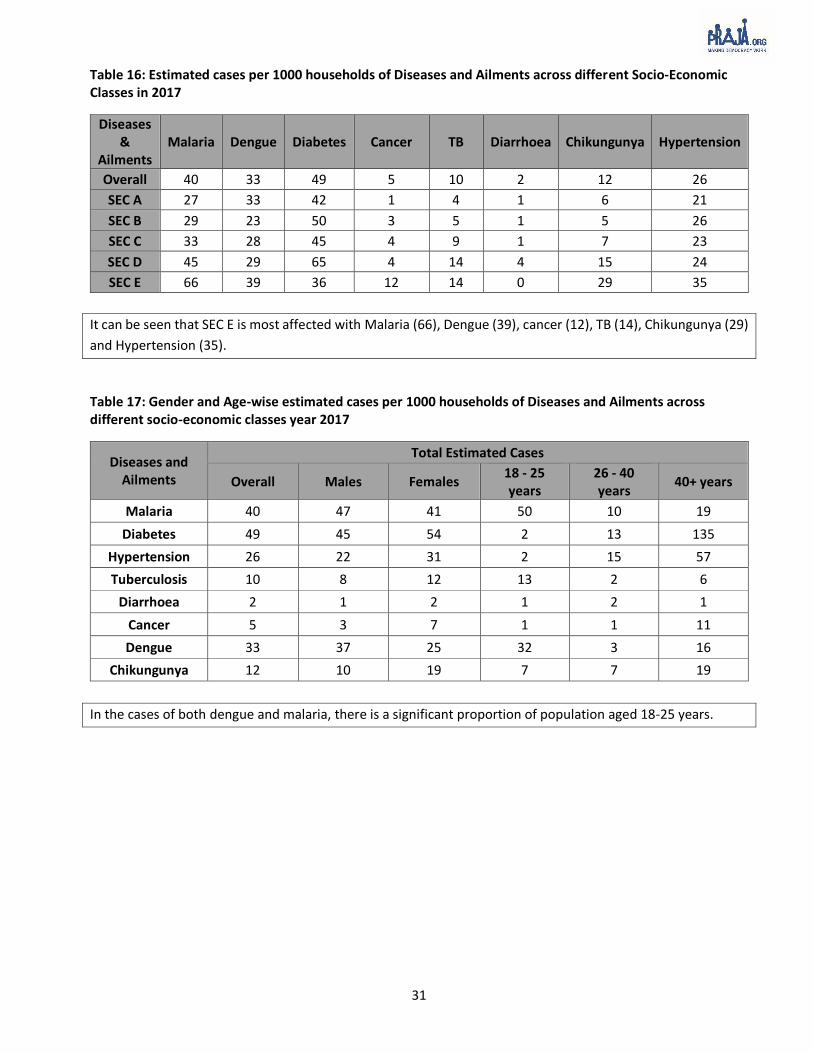
Table 16: Estimated cases per 1000 households of Diseases and Ailments across different Socio-Economic
Classes in 2017 ................................................................................................................................................... 31

3
Table 17: Gender and Age-wise estimated cases per 1000 households of Diseases and Ailments across
different socio-economic classes year 2017 ....................................................................................................... 31
Table 18: Type of Facilities used by the citizens by diseases per 1000 households ............................................ 32
Table 19: Number of Members who have visited Government and Private hospitals ....................................... 32
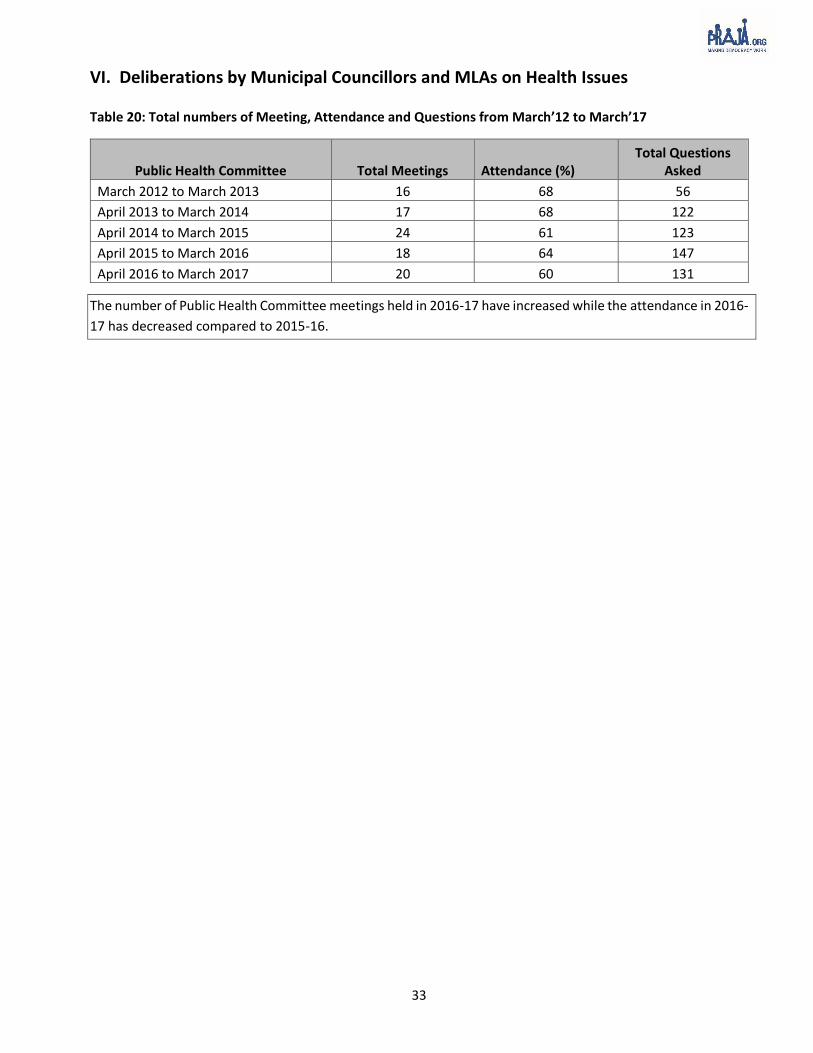
Table 20: Total numbers of Meeting, Attendance and Questions from March’12 to March’17 ......................... 33
Table 21: Health issues raised by Public Health Committee Councillors from March’12 to March’17 ............... 34
Table 22 : Number of questions asked on Health by Municipal Councillors ward-wise in All Committees from
April 2012 to March 2017 ................................................................................................................................... 35
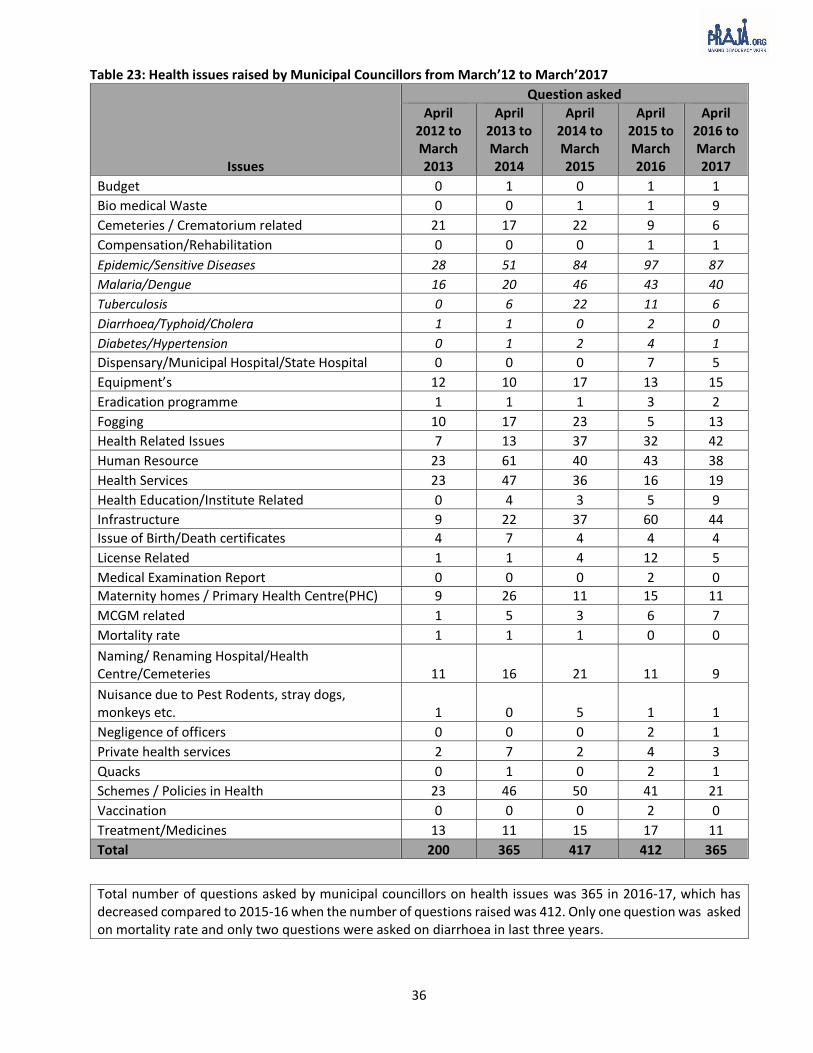
Table 23: Health issues raised by Municipal Councillors from March’12 to March’2017 ................................... 36
Table 24: Health issues raised by MLAs from following sessions: Monsoon Sessions 2015, Winter sessions 2015
and Budget sessions 2016 .................................................................................................................................. 37
Table 25: Questions asked on health issues by MLAs from: Monsoon Sessions 2015, Winter Sessions 2015 &
Budget Session 2016 .......................................................................................................................................... 38
Table 26: Estimated proportion of usage of various Dispensaries/Hospitals from April’2016 to March’2017 ... 39
Table 27: Ward wise Malaria Data...................................................................................................................... 40
Table 28: Ward wise Dengue Data ..................................................................................................................... 41
Table 29: Positive dengue cases as per rapid kit test ......................................................................................... 42
Table 30: Ward wise Tuberculosis Data .............................................................................................................. 43
Table 31: Ward wise Diabetes Data .................................................................................................................... 44
Table 32: Ward wise Diarrhoea Data .................................................................................................................. 45
Table 33: Ward wise Hypertension Data ............................................................................................................ 46
Table 34: Ward wise dispensary requirements for dispensaries in MCGM ........................................................ 55
Figure 1 : Discrepancy in reporting system of Malaria death (data is as per calendar year) .............................. 15
Figure 2 : Discrepancy in reporting system of Tuberculosis deaths (data is as per calendar year) ..................... 17
Figure 3 : Shortage of staff in MCGM's dispensaries/hospitals .......................................................................... 25
Figure 4 : Shortage of staff in State hospitals ..................................................................................................... 26
Figure 5: Type of Facilities used by the citizens across different Socio-Economic Classes (SEC), 2017 ............... 27
Figure 6: Estimated percentage of Annual Family Income spent on hospital/medical costs across Socio-
Economic Classes (SEC) ...................................................................................................................................... 28
Figure 7: Medical Insurance across Socio-Economic Classes’ family with no Medical Insurance ....................... 28
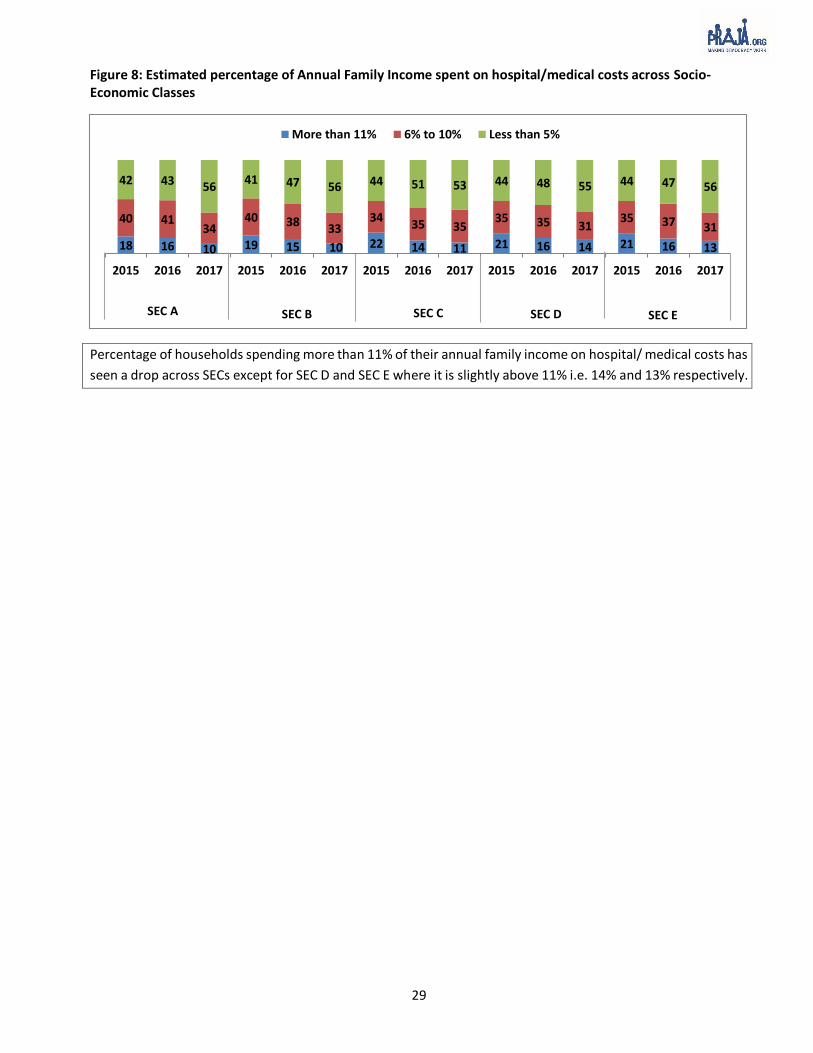
Figure 8: Estimated percentage of Annual Family Income spent on hospital/medical costs across Socio-
Economic Classes ................................................................................................................................................ 29

4
I. Foreword Despite its claims of being a world-class metropolis, Mumbai is a decidedly unhealthy city. It is characterised by rising cases of dengue and tuberculosis, including drug-resistant strains of the latter. Child malnutrition is rampant, and some parts of the city have even seen malnutrition deaths in the recent past. Such a situation does not portend well for the urbs prima of the country.
The authorities in charge of running the city have not managed to check the spread of various major diseases. The following statistics make this amply clear—
The number of dengue cases rose from 4,867 in 2012-13 to 17,771 in 2016-17—a 265% increase.
When it comes to tuberculosis, the number of cases rose from 36,417 in 2012-13 to 50,001 in 2016-17. However, the number of cases treated through Directly Observed Treatment Short-course (DOTS) nearly halved in five years—from 30,828 in 2012 to 15,767 in 2016.
At the same time, the percentage of defaulters in DOTS treatment increased from 9% (2,638 out of 30,828) in 2012 to 19% (2,927 out of 15,767) in 2016, at a time when the government is actively promoting the ‘TB haarega, desh jeetega’ campaign.
This indicates that various government initiatives to check such diseases have not had the desired effect. In spite of this, elected representatives have not adequately addressed these major public concerns, as is evident from the following—
Municipal councillors asked only 45 questions in the past five years on TB, compared to 68 questions on naming/renaming of hospitals/health centres/cemeteries in the same period.
It is estimated that 225 people died of diarrhoea in 2016-17, out of which 33% were children 4 years of age or younger. However, public health committee councillors did not raise even a single issue on it in 2016-17.
For Mumbai, money is most definitely not the problem. The city’s health budget in 2017-18 is a massive Rs. 3,312 crores, only marginally less than the Thane Municipal Corporation’s total budget (Rs. 3,390 crores) for 2017-18. If these monetary resources are channelized better, then improving the state of health would not be as uphill a task as it appears at present. Here is what can be done to ensure this—
Firstly, there is an urgent need to revamp and improve the primary health care mechanism so that the common people can access the best quality services in their own neighbourhood. Municipal dispensaries suffer from inadequate resources, so much so—if we go by the official word—that even diagnosis of common diseases is a challenge. M/E ward, for instance, claims that confirmed diagnosis of dengue is not done at the dispensary level, although every ward is equipped with the Rapid Test Kit, which is used to diagnose dengue. Across the city, the number of patients seeking treatment for dengue in dispensaries has increased by 40 times from 26 (2012-13) to 1039 (2016-17). If these patients are able to get clearer information about the status of their own health, they would be less likely to shift to the private sector for treatment.
Secondly, the health management information system needs to be much better maintained. Cause-specific death data must be available with the Medical Officer Health (MOH). At present, this data is not available, due to a change in software from System Application Protocol (SAP) to the centrally managed Civil Registration System (CRS). If this data is available, the MCGM will be able to gauge the seriousness of various diseases and formulate policies accordingly.

5
For this white paper, we have not received data for cause-specific deaths from January 2016. Hence, for the first time, we have extrapolated this data using the Autoregressive Integrated Moving Average (ARIMA). Through this method, we have achieved the closest possible accuracy of 95.5%
There is no way that any government can confront public health challenges if it has no idea about the magnitude of the problem at hand. Consider this: on one hand, RTI data suggests that there were 17,771 dengue cases in 2016-17. However, the total estimated cases of dengue, as per a household survey of over 20,000 households, were as high as 1,09,443. These would include cases in government hospitals/dispensaries as well as in private hospitals/clinics. One wonders how the authorities would formulate a policy to tackle dengue, if there is such a huge gap between government figures and overall estimates.
Thus, there is a need for systemic change at different levels of the administration to achieve a public health system which is accountable to the people it serves. Building such a culture of accountability is the first step towards creating world-class government health services. As India’s financial capital, Mumbai must take the lead in this. The ‘city of dreams’, as it is called, can ill afford a public health nightmare.
Nitai Mehta
Managing Trustee, Praja Foundation
6
II. Acknowledgements Praja has obtained the data used in compiling this white paper through Right to Information Act, 2005. Hence it
is very important to acknowledge the RTI Act and everyone involved, especially the officials who have provided
us this information diligently.
We would like to appreciate our stakeholders; particularly, our Elected Representatives & government officials,
the Civil Society Organizations (CSOs) and the journalists who utilize and publicize our data and, by doing so,
ensure that awareness regarding various issues that we discuss is distributed to a wide-ranging population. We
would like to take this opportunity to specifically extend our gratitude to all government officials for their
continuous cooperation and support.
Praja Foundation appreciates the support given by our supporters and donors, namely European Union Fund,
Friedrich Naumann Foundation, Ford Foundation, Dasra, Narotam Sekhsaria Foundation and Madhu Mehta
Foundation and numerous other individual supporters. Their support has made it possible for us to conduct our
study & publish this white paper.
We would like to thank Hansa Cequity team for helping us with extrapolating the cause of death data and the
team at Hansa Research for the citizen survey.
We would also like to thank our group of Advisors & Trustees and lastly but not the least, we would like to
acknowledge the contributions of all members of Praja’s team, who worked to make this white paper a reality.

7
III. Note on Public Health Department Data
i. RTI data
In the sections given below, we have analysed data of diseases and ailments from April 2012 to March 2017
from Municipal/Government hospitals and dispensaries. Through this data, we have attempted to assess the
performance of health services provided at various levels of government using government’s own data. We
have collected this information through the Right to Information Act (RTI), 2005.
a. Occurrences of diseases and ailments in municipal dispensaries and government hospitals
We received data from (171) municipal dispensaries, (26) municipal hospitals and (5) state hospitals from April
2012 to March 2017. Also, RTI data was obtained from (8) other government hospitals [which include Central
Railway, Bombay Port Trust Hospital, Western Railway Hospital, Police Hospital (Nagpada and Naigaon), ESIS –
Worli, Mulund, Kandivali, Marol)] and (12) Police Dispensaries from April’2012 to March’2017. Kindly refer to
Annexure 1 for the list of Hospitals and dispensaries. This data relates to Out Patient Department (OPD) of
dispensaries and In-Patient Department (IPD) of hospitals of MCGM. Data from J.J. hospital has not been
received from December’16 to March’17.
It must be noted that the data in this section includes only government dispensaries/hospitals and does not
include data on occurrences of various diseases/ailments treated in private and charitable
dispensaries/hospitals. According to our survey (details of which are in section V of this report), 33% households
in Mumbai use only government dispensaries/hospitals. The data on cases of diseases/ailments treated in
private and charitable dispensaries/hospitals was not available under RTI. Hence, we have conducted the survey
to estimate certain parameters to monitor status of health of Mumbai.
a. i) Dispensary Level: Issues related to functioning
Data on availability and reach of dispensaries is important as dispensaries are often the first point of contact for
citizens. If dispensaries function effectively, then citizens can access health services closer to their homes. This
will also ensure that a greater number of diseases are treated at an early stage, preventing them from assuming
more serious proportions.
However, as of now, it is seen that the resources at the disposal of the municipal dispensaries are not being
used to the fullest possible extent. For instance, the Senior Medical Officer of M/E ward stated that confirmed
diagnosis of dengue cases does not happen at the dispensary level (please refer to annexure 5). Furthermore,
the Senior Medical Officer of K/W ward mentioned that the cases which test positive are sent for ELISA (Enzme
Linked Immunosorbent Assay) or Polymerase Chain Reaction (PCR) tests to diagnose dengue as the Rapid kit
test does not give confirmatory result (Refer annexure 6).
This is surprising, considering the fact that every municipal dispensary is supposed to be equipped with the
Rapid Test Kit, which is used to diagnose dengue. If the public health department is investing on Rapid Test Kits,
then why is the diagnosis claimed to be suspected or probable and not confirmed? How are patients put on
dengue treatment on the basis of the results of this kit, if it cannot be relied upon to provide a correct diagnosis?
Dengue is a preventable disease, the diagnosis and treatment of which should be done at primary level of public
health.
8
Apart from the above points, some major improvements which need to be made are proper maintenance of
patient records and strengthening of the civic body’s health management information system (HMIS) at the
dispensary level. This way, hospitals and dispensaries will be able to view an individual patient’s medical history
when the patient comes with a health complaint, thus providing a better diagnosis of the ailment. Proper
maintenance of the HMIS will enable various authorities to analyse the macro picture with respect to the state
of health in the city.
b. Causes of death
Data on cause of death is crucial to understand the extent to which various diseases pose a threat to public
health. It can help set the policy agenda for the government in terms of identifying the diseases which need
urgent attention and fix gaps in the public health delivery mechanism.
However, for several years after independence, there was no unified system for registering births and deaths in
the country. Such a system only came into being in 1969 with enactment of the Registration of Births and Deaths
Act. This legislation made registration of births and deaths mandatory and fixed the responsibility of co-
ordinating the activities of registration throughout the country of the Registrar General, India. Implementation,
however, is to be done by the state governments.
In Mumbai, each municipal ward has a Medical officer of health (MOH) who is the sub-registrar as provided
under RBD Act 1969 and Maharashtra Rules 2000. MOH is responsible for births and deaths certificates in their
wards. Data on causes of death in Mumbai helps to plan a city-level strategy for maintaining public health. When
this data is disaggregated at the ward level, it can indicate what measures need to be taken in which localities.
For example, if the number of diarrhoea deaths is high in a particular area, then it could call for an investigation
into the quality of water there.
b. ii) Medical Certification of Cause of Death (MCCD)
The scheme of Medical Certification of Cause of Death (MCCD) under the registration of Births and Deaths (RBD)
Act, 1969 provides information on causes of death, a prerequisite to monitoring health trends of the population.
This scheme analyses data on causes of death according to age and sex. Data received in prescribed forms is
tabulated as per the National List of Causes of Death based on Tenth Revision of International Classification of
Disease (ICD- 10). ICD is the foundation for the identification of health trends and statistics globally, and the
international standard for reporting diseases and health conditions. It is the diagnostic classification standard
for all clinical and research purposes.
Until December 2015, information on cause of death was made available by all 24 wards of MCGM in System
Application Protocol (SAP) software. SAP was a locally managed software by Public Health Department of
MCGM. Due to the change in software from SAP to the centrally managed Civil Registration System (CRS), the
information on cause of death is not available with the MOH of all 24 wards of Mumbai. Being the sub registrar,
MOH should have access to the information on cause of death for their own ward. The information consists of
cause specific deaths with ICD-10 coding and has age and gender wise segregation. This information is vital for
understanding the mortality and disease trends in wards of MCGM. It was an excellent step taken to make the
birth and death registration centralised under CRS wherein information could be accessed through single portal
accessible to the administration as well as citizens, but the accessibility of this information was given in the form

9
of D-1 report at the sub registrar level which does not have information in terms of ICD-10 coding, age and
gender, but only the total number of deaths. If such is the case, then how are policy makers and researchers
in health care going to get the demographics for planning and implementation? CRS showed a lack of planning
in terms of building this software.
According to the Registration of Births and Deaths Act, 1969, this data should have been made available at the
Medical Officer Health (MOH) level who is the local registrar for births and deaths in Mumbai district, but since
the data is now centrally managed, ward level data of cause of death is not available for Mumbai district.
c. Extrapolation of cause of death data for 2016-17:
As explained above, ward-wise information on cause of death was available till December 2015. However, after
the change in software change from SAP to CRS, data is not available at the sub-registrar level in the form of the
D-10 report from January 2016.Therefore, as this data was not available, Praja along with Hansa Cequity
Solutions, an organisation working in data analytics, has extrapolated the cause of death data from January 2016
to March 2017.
Praja had filed RTIs in all wards of Mumbai to gather the information on cause of death in Mumbai; classified
age wise, gender wise, ICD code wise. In SAP, this information was available in the form of the D-10 report.
However, as of now, the sub-registrar can only access the D-1 report, which shows only the gender wise deaths.
In order to achieve closest possible accuracy, for the extrapolation, parameters such as gender, age, ICD coding
and population have been used. We have also taken even seasonality into consideration. Through this we have
attained the closest possible accuracy of up to 95.5%. The data made available to Praja through RTI by MOH of
24 wards in D-1 format for 2016 was 84,265 while the predicted data for the same period was 85,329.
c. i) Process of extrapolation1:
Data for each disease was extracted, converted into time series, further stationarity of data was checked, and it
was transformed to make it stationary by differencing wherever required. Data was further treated for outliers.
Tested models include Moving Average, Exponential Smoothing and Autoregressive Integrated Moving Average
(ARIMA). ARIMA was used for forecasting values as error terms were minimum and this model considers trends
and seasonality for forecasting values. ARIMA2 models are, in theory, the most general class of models for
forecasting a time series which can be made to be “stationary” by differencing (if necessary), perhaps in
conjunction with nonlinear transformations such as logging or deflating (if necessary). A random variable that
in a time series is stationary if its statistical properties are all constant over time. An ARIMA model can be
viewed as a “filter” that tries to separate the signal from the noise, and the signal is then extrapolated into the
future to obtain forecasts. To give some examples for the accuracy of ARIMA, predicted deaths due to diarrhoea
in 2015 as per this method were 185, while the number of actual deaths was 169. For hypertension, the actual
deaths were 4,486 and the predicted deaths were 4,511 for the year 2015.
1 Please refer annexure 6 2 https://people.duke.edu/~rnau/411arim.htm

10
d. Deliberations by councillors and MLAs
This section comprises of deliberations by elected representatives in Mumbai. Data in this section has been
collected through the Right to Information (RTI), Act 2005. The information includes issues raised by MLAs in
the monsoon session 2015, winter session 2015 and budget session 2016; while the issues raised by councillors
are from Public Health Committee meetings held between April 2016 and March 2017. Issues raised by
councillors in Statutory and Special Committees meetings have also been taken. We have incorporated
attendance of councillors from public health committee meetings for each financial year from 2012-13 to 2016-
17.
d. i) MCGMs Public Health Committee
a) The Corporation under Section 38A (1) of the M.M.C. (Mumbai Municipal Corporation) Act, appoints the
Public Health Committee out of its own body consisting of 36 members in their meeting after general elections
and delegate any of their power and duties to such Committee and also define the sphere of business of
Committee so appointed and direct that all matters and questions included in any such sphere shall be
submitted to the Corporation with such Committee’s recommendation.
b) Sphere of Business
Sphere of Business of Special Committees defined by the Corporation vide Corporation Resolution No.46, dated
11th May 1999 in exercise of the powers vested in them by Sub-Section (1) of Section 38A of the Mumbai
Municipal Corporation Act, 1888, as amended up to date.
b. i) All questions relating to the King Edward VII Memorial Hospital and Seth Gordhandas Sunderdas
Medical College, Kasturba Hospital for infectious diseases, Medical Relief in the Municipal outdoor
dispensaries, Medical and Nursing assistance to the poor in their homes, Venereal Diseases
Dispensaries, Anti Tuberculosis League and any Medical Institution to which monetary assistance is
given by the Corporation.
b. ii) Health Department (including Street Cleaning, Conservancy, etc.) with the exception of questions
pertaining to the Mechanical Branch so far as they fall within the province of the Works Committee.
At present, there are 36 members (out of which 3 are nominated) in the Public Health Committee.

11
ii. Citizen Survey
Praja Foundation collects information on cases reported of diseases/ailments and causes of death from all 24
wards of Mumbai. This is government data collected under the Right to Information (RTI) Act, 2005. In this
section, we are presenting a household survey mapping diseases and ailments, which should ideally be done by
the Public Health Department to understand the perception of citizens about health care facilities.
The information received under RTI from various government institutions shows that dengue cases in
Mumbai were 17,771 & 11,607 of dengue and malaria respectively while the survey data across all 24 wards
of Mumbai showed that the cases of dengue were as high as 1,09,443 and cases of malaria were 90,703. As
per the government data collected through RTI, the total number of occurrences for Dengue and Malaria as
exceedingly low, when compared to the data collected by the housing survey. Information under RTI is for
government facilities, but if the public Health department starts mapping diseases and ailments, then these
numbers would certainly come closer.
Hence, apart from the mapping of diseases and ailments Public Health department should also be responsible
for maintaining of patient records and strengthening of the civic body’s health management information system
(HMIS) at the dispensary level. This way, hospitals and dispensaries will be able to view an individual patient’s
medical history when the patient comes with a health complaint, thus providing a better diagnosis of the
ailment. Proper maintenance of the HMIS will enable various authorities to analyse the macro picture with
respect to the state of health in the city.
Survey Methodology
Praja Foundation had commissioned the household survey to Hansa Research and the survey methodology
followed is as below:
In order to meet the desired objectives of the study, we represented the city by covering a sample from
each of its 227 wards. The target Group for the study was:
Both Males & Females
18 years and above
Belonging to that particular ward.
Sample quotas were set for representing gender and age groups on the basis of their split available through
Indian Readership Study (Large scale baseline study conducted nationally by Media Research Users Council
(MRUC) for Mumbai Municipal Corporation Region.
The required information was collected through face to face interviews with the help of structured
questionnaire.
In order to meet the respondent within a ward, following sampling process was followed:
5 prominent areas in the ward were identified as the starting point
In each starting point about 20 individuals were selected randomly and the questionnaire was
administered with them.

12
Once the survey was completed, sample composition of age & gender was corrected to match the
population profile using the baseline data from IRS. This helped us to make the survey findings more
representatives in nature and ensured complete coverage.
To get more accurate estimates of disease incidence, we have increased the depth of probing to ask further
questions about each individual member of the household, the disease they have contracted, whether
testing was sought and the nature of the hospital care availed of. This is a more robust method. What was
being done earlier was that information was sought at a general household level and then this information
was extrapolated to all household members.
The numbers in the table 17 & 18 refer to the number of cases where testing was conducted and was
positive for the disease in question.
Instead of asking for details about the household in general, this year we asked for information about each
member in a household who suffered from a particular disease. As a result, the overlap between private
and government hospitals has reduced – this is because, now if two different members of a household
visited two different types of hospitals, they are now being covered separately.
Due to the change in methodology from a generalised household feedback to individual specific feedback,
the overlap between private and government hospitals has reduced. Previously, a household where one
member may have received treatment from a private hospital and another from a government hospital
would be counted under ‘both’. Now, with individual data being captured for each member of the
household, only those members who went to both government and private hospitals would be counted
under ‘both’.
The total study sample was 20,317.

13
IV. Data on Diseases/Ailments & Health Personnel in Mumbai (Data got through RTI)
Table 1: Malaria number of cases in government dispensaries/hospital and total deaths in Mumbai from April’2012-March’2017
Years 2012-13 2013-14 2014-15 2015-16 2016-17
Number of Malaria Cases in government dispensaries/hospitals in Mumbai
MCGM dispensaries/hospitals 18296 15987 13865 12516 9679
State hospitals 1280 1052 854 1233 1312
Other government dispensaries/hospitals 2363 1359 964 882 616
Total Cases 21939 18398 15683 14631 11607
Population /Total Cases 567 676 793 850 1072
Number of Deaths due to Malaria in Mumbai
Total Deaths 238 202 103 1163* 1274*
Total Cases/Total Deaths 92 91 152 126 91
Malaria cases have decreased by 47% from 2012-13 to 2016-17, which could be the result of MCGM’s
Fight the Bite campaign
In 2016-17, probable deaths cases were 127. Although malaria cases have reduced by 47% in last five
years, MCGM is still far from achieving the UN’s Sustainable Development Goal of eradicating malaria
by year 2030.
Note: (*) This is the extrapolated data.
3 & 4 In January 2016, the MCGM’s locally managed software for registration of births and deaths changed from System Application Protocol (SAP) to the centrally managed
Civil Registration Systems (CRS). Therefore, the Medical Officer of Health (MOH) who is the sub-registrar under the Registration of Births & Deaths Act, 1969, has access to only
the D-1 report i.e. gender-wise total deaths, but not D-10 which is cause-specific death since January 2016. Hence, we have extrapolated the cause of death data from January
2016 to March 2017 using time series to understand the information on cause of death for this period.
14
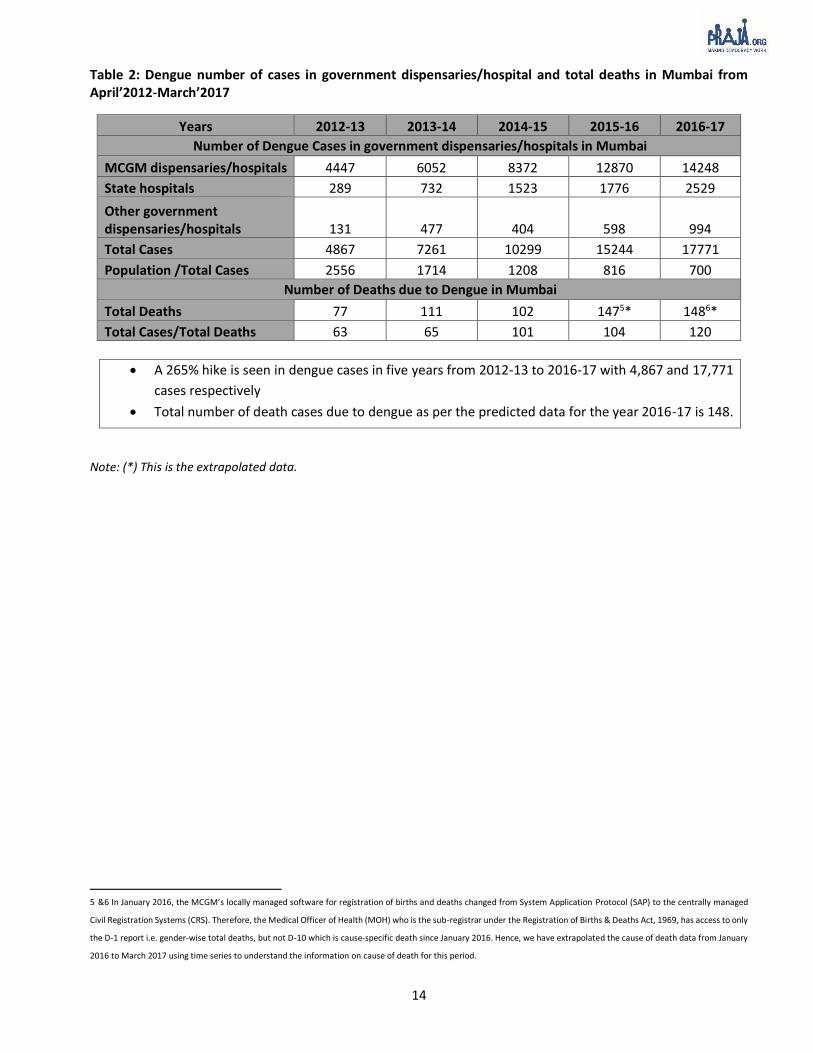
Table 2: Dengue number of cases in government dispensaries/hospital and total deaths in Mumbai from April’2012-March’2017
Years 2012-13 2013-14 2014-15 2015-16 2016-17
Number of Dengue Cases in government dispensaries/hospitals in Mumbai
MCGM dispensaries/hospitals 4447 6052 8372 12870 14248
State hospitals 289 732 1523 1776 2529
Other government dispensaries/hospitals 131 477 404 598 994
Total Cases 4867 7261 10299 15244 17771
Population /Total Cases 2556 1714 1208 816 700
Number of Deaths due to Dengue in Mumbai
Total Deaths 77 111 102 1475* 1486*
Total Cases/Total Deaths 63 65 101 104 120
A 265% hike is seen in dengue cases in five years from 2012-13 to 2016-17 with 4,867 and 17,771
cases respectively
Total number of death cases due to dengue as per the predicted data for the year 2016-17 is 148.
Note: (*) This is the extrapolated data.
5 &6 In January 2016, the MCGM’s locally managed software for registration of births and deaths changed from System Application Protocol (SAP) to the centrally managed
Civil Registration Systems (CRS). Therefore, the Medical Officer of Health (MOH) who is the sub-registrar under the Registration of Births & Deaths Act, 1969, has access to only
the D-1 report i.e. gender-wise total deaths, but not D-10 which is cause-specific death since January 2016. Hence, we have extrapolated the cause of death data from January
2016 to March 2017 using time series to understand the information on cause of death for this period.

15
Figure 1 : Discrepancy in reporting system of Malaria death (data is as per calendar year)
According to the malaria surveillance department of MCGM, registered number of death cases were 10 in 2016,
while death cases as per the predicted data for 2016 were 1147.
Note: (*) This is the extrapolated data.
7 In January 2016, the MCGM’s locally managed software for registration of births and deaths changed from System Application Protocol (SAP) to the centrally managed Civil
Registration Systems (CRS). Therefore, the Medical Officer of Health (MOH) who is the sub-registrar under the Registration of Births & Deaths Act, 1969, has access to only
the D-1 report i.e. gender-wise total deaths, but not D-10 which is cause-specific death since January 2016. Hence, we have extrapolated the cause of death data from
January 2016 to March 2017 using time series to understand the information on cause of death for this period.

16
Table 3: Tuberculosis number of cases in government dispensaries/hospital and total deaths in Mumbai from April’2012-March’2017
Years 2012-13 2013-14 2014-15 2015-16 2016-17
Number of Tuberculosis Cases in government dispensaries/hospitals
MCGM dispensaries/hospitals 34873 39644 40525 39060 47672
State hospitals 946 1216 1829 1645 1890
Other government dispensaries/hospitals 598 619 483 467 439
Total Cases 36417 41479 42837 41172 50001
Population /Total Cases 342 300 290 302 249
Number of Deaths due to Tuberculosis in Mumbai
Total Deaths 7170 7319 6501 54008* 64729*
Total Cases/Total Deaths 5 6 7 8 8
50,001 Tuberculosis cases were registered at government institutions in 2016-17. Tuberculosis cases
have increased by 37% in five years from 2012-13 to 2016-17
Deaths due to tuberculosis as per the predicted data were 6,472 in the year 2016-17.
Note: (*) This is the extrapolated data.
8 & 9 In January 2016, the MCGM’s locally managed software for registration of births and deaths changed from System Application Protocol (SAP) to the centrally managed
Civil Registration Systems (CRS). Therefore, the Medical Officer of Health (MOH) who is the sub-registrar under the Registration of Births & Deaths Act, 1969, has access to only
the D-1 report i.e. gender-wise total deaths, but not D-10 which is cause-specific death since January 2016. Hence, we have extrapolated the cause of death data from January
2016 to March 2017 using time series to understand the information on cause of death for this period.

17
Figure 2 : Discrepancy in reporting system of Tuberculosis deaths (data is as per calendar year)
Tuberculosis deaths reported by Tuberculosis Control unit from 2016 are 1,240 while death cases as per the
predicted data for 2016 were 4,74910.
Note: (*) This is the extrapolated data.
10 In January 2016, the MCGM’s locally managed software for registration of births and deaths changed from System Application Protocol (SAP) to the centrally managed Civil
Registration Systems (CRS). Therefore, the Medical Officer of Health (MOH) who is the sub-registrar under the Registration of Births & Deaths Act, 1969, has access to only the
D-1 report i.e. gender-wise total deaths, but not D-10 which is cause-specific death since January 2016. Hence, we have extrapolated the cause of death data from January
2016 to March 2017 using time series to understand the information on cause of death for this period.
18
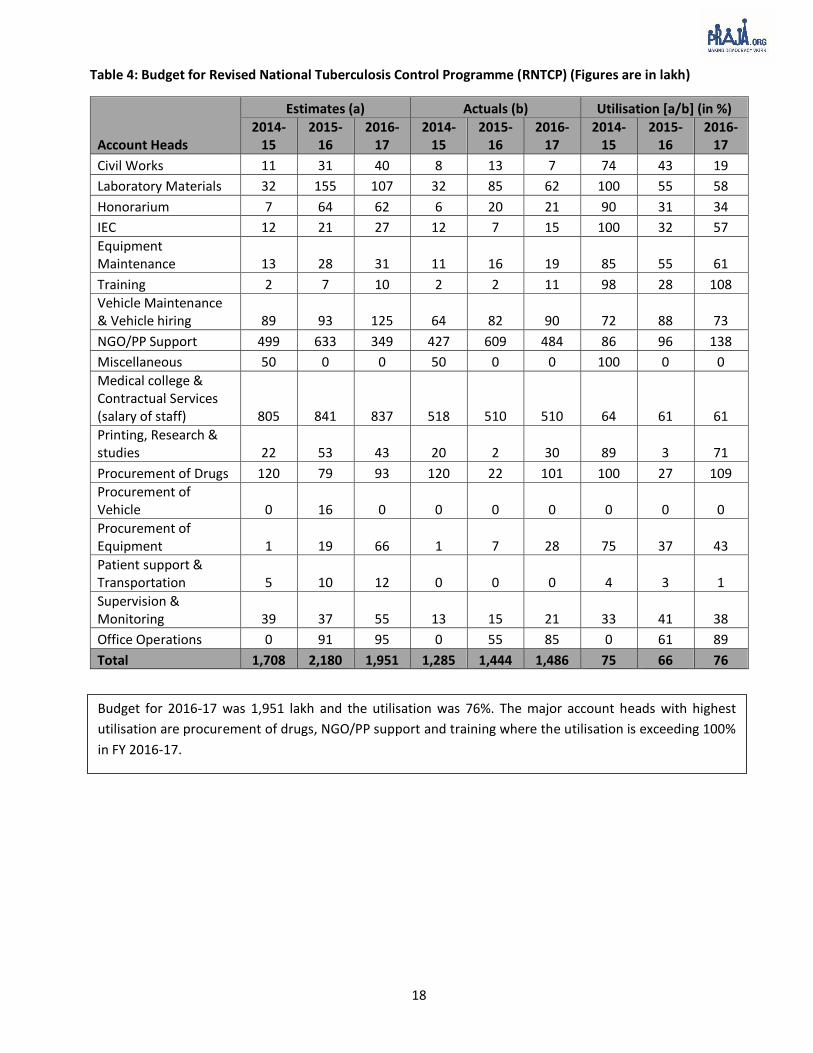
Table 4: Budget for Revised National Tuberculosis Control Programme (RNTCP) (Figures are in lakh)
Account Heads
Estimates (a) Actuals (b) Utilisation [a/b] (in %)
2014-15
2015-16
2016-17
2014-15
2015-16
2016-17
2014-15
2015-16
2016-17
Civil Works 11 31 40 8 13 7 74 43 19
Laboratory Materials 32 155 107 32 85 62 100 55 58
Honorarium 7 64 62 6 20 21 90 31 34
IEC 12 21 27 12 7 15 100 32 57
Equipment Maintenance 13 28 31 11 16 19 85 55 61
Training 2 7 10 2 2 11 98 28 108
Vehicle Maintenance & Vehicle hiring 89 93 125 64 82 90 72 88 73
NGO/PP Support 499 633 349 427 609 484 86 96 138
Miscellaneous 50 0 0 50 0 0 100 0 0
Medical college & Contractual Services (salary of staff) 805 841 837 518 510 510 64 61 61
Printing, Research & studies 22 53 43 20 2 30 89 3 71
Procurement of Drugs 120 79 93 120 22 101 100 27 109
Procurement of Vehicle 0 16 0 0 0 0 0 0 0
Procurement of Equipment 1 19 66 1 7 28 75 37 43
Patient support & Transportation 5 10 12 0 0 0 4 3 1
Supervision & Monitoring 39 37 55 13 15 21 33 41 38
Office Operations 0 91 95 0 55 85 0 61 89
Total 1,708 2,180 1,951 1,285 1,444 1,486 75 66 76
Budget for 2016-17 was 1,951 lakh and the utilisation was 76%. The major account heads with highest
utilisation are procurement of drugs, NGO/PP support and training where the utilisation is exceeding 100%
in FY 2016-17.

19
Table 5: Defaulters cases from Directly Observed Treatment, Short Course (DOTS) programme for calendar
year11
2012 2013 2014 2015 2016
No. of case from Hospitals/Dispensaries (a) 34548 40149 42573 41825 46422
Cases registered under DOTS (b) 30828 21550 21703 19115 15767
Defaulters from DOTS Programme (c) 2638 2575 2264 2823 2927
Defaulter cases in % (c*100/b) 9% 12% 10% 15% 19%
Total number of Tuberculosis cases has increased in from 34,548 in 2012 to 46422 in 2016.
Enrolment of Tuberculosis patients has decreased in DOTS programme by 49%. In 2012, 30,828 cases
were enrolled under DOTS, and in 2016 these cases were 15,767.
The number of defaulters from DOTS programme has increased by 10% in last 5 years.
11 This information related to tuberculosis is calendar year-wise, while the information in Table 3 is financial year-wise. This is because the information for defaulters was
provided by the TB control unit in calendar year-wise.

20
Table 6: Diarrhoea number of cases in government dispensaries/hospital and total deaths in Mumbai from April’2012-March’2017
Years 2012-13 2013-14 2014-15 2015-16 2016-17
Number of Diarrhoea Cases in government dispensaries/hospitals in Mumbai
MCGM dispensaries/hospitals 97563 114666 113236 115759 97392
State hospitals 785 1561 1129 1741 1162
Other government dispensaries/hospitals 1479 1953 2392 1842 2089
Total Cases 99827 118180 116757 119342 100643
Population /Total Cases 125 105 107 104 124
Number of Deaths due to Diarrhoea in Mumbai
Total Deaths 250 260 260 17712* 22513*
Total Cases/Total Deaths 399 455 449 674 447
In 2016-17, reported cases of diarrhoea were 1,00,643, but the existing trend shows that diarrhoea cases are
as high as previous years. Death cases as per the predicted data were 225 in the year 2016-17.
Note: (*) This is the extrapolated data.
12 &13 In January 2016, the MCGM’s locally managed software for registration of births and deaths changed from System Application Protocol (SAP) to the centrally managed
Civil Registration Systems (CRS). Therefore, the Medical Officer of Health (MOH) who is the sub-registrar under the Registration of Births & Deaths Act, 1969, has access to only
the D-1 report i.e. gender-wise total deaths, but not D-10 which is cause-specific death since January 2016. Hence, we have extrapolated the cause of death data from January
2016 to March 2017 using time series to understand the information on cause of death for this period.
21
Table 7: Cholera number of cases in government dispensaries/hospital and total deaths in Mumbai from April’2012-March’2017
Years 2012-13 2013-14 2014-15 2015-16 2016-17
Number of Cholera Cases in government dispensaries/hospitals in Mumbai
MCGM dispensaries/hospitals 187 89 19 187 104
State hospitals 11 7 11 6 5
Other government dispensaries/hospitals 0 0 1 14 0
Total Cases 198 96 31 207 109
Population /Total Cases 62840 129608 401367 60108 114150
Number of Deaths due to Cholera in Mumbai
Total Deaths 10 7 3 514* 815*
Total Cases/Total Deaths 20 14 10 41 14
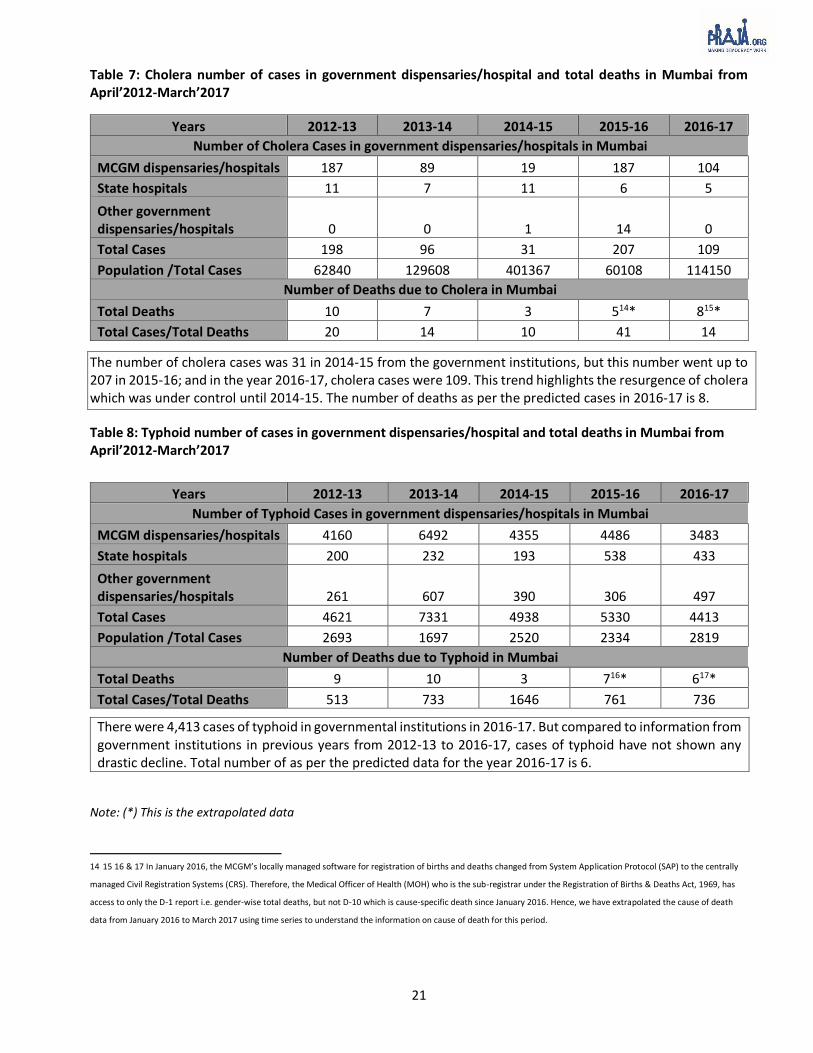
The number of cholera cases was 31 in 2014-15 from the government institutions, but this number went up to 207 in 2015-16; and in the year 2016-17, cholera cases were 109. This trend highlights the resurgence of cholera which was under control until 2014-15. The number of deaths as per the predicted cases in 2016-17 is 8.
Table 8: Typhoid number of cases in government dispensaries/hospital and total deaths in Mumbai from April’2012-March’2017
Years 2012-13 2013-14 2014-15 2015-16 2016-17
Number of Typhoid Cases in government dispensaries/hospitals in Mumbai
MCGM dispensaries/hospitals 4160 6492 4355 4486 3483
State hospitals 200 232 193 538 433
Other government dispensaries/hospitals 261 607 390 306 497
Total Cases 4621 7331 4938 5330 4413
Population /Total Cases 2693 1697 2520 2334 2819
Number of Deaths due to Typhoid in Mumbai
Total Deaths 9 10 3 716* 617*
Total Cases/Total Deaths 513 733 1646 761 736
There were 4,413 cases of typhoid in governmental institutions in 2016-17. But compared to information from government institutions in previous years from 2012-13 to 2016-17, cases of typhoid have not shown any drastic decline. Total number of as per the predicted data for the year 2016-17 is 6.
Note: (*) This is the extrapolated data
14 15 16 & 17 In January 2016, the MCGM’s locally managed software for registration of births and deaths changed from System Application Protocol (SAP) to the centrally
managed Civil Registration Systems (CRS). Therefore, the Medical Officer of Health (MOH) who is the sub-registrar under the Registration of Births & Deaths Act, 1969, has
access to only the D-1 report i.e. gender-wise total deaths, but not D-10 which is cause-specific death since January 2016. Hence, we have extrapolated the cause of death
data from January 2016 to March 2017 using time series to understand the information on cause of death for this period.

22
Table 9: Diabetes number of cases in government dispensaries/hospital and total deaths in Mumbai from April’2012-March’2017
Years 2012-13 2013-14 2014-15 2015-16 2016-17
Number of Diabetes Cases in government dispensaries/hospitals in Mumbai
MCGM dispensaries/hospitals 19423 35118 43265 20449 22669
State hospitals 728 742 1135 832 957
Other government dispensaries/hospitals 4794 4981 4310 9415 8894
Total Cases 24945 40841 48710 30696 32520
Population /Total Cases 499 305 255 405 383
Number of Deaths due to Diabetes in Mumbai
Total Deaths 2575 2421 2493 230818* 267519
Total Cases/Total Deaths 10 17 20 13 12
Diabetes cases have increased from 30,696 in 2015-16 to 32,520 in 2016-17. Diabetes cases have increased 30% in five years from 2012-13 to 2016-17. These are the new cases registered in government institutions. Deaths due to diabetes as per the predicted data are 2,675 in 2016-17.
Table 10: Hypertension number of cases in government dispensaries/hospital and total deaths in Mumbai from April’2012-March’2017
Years 2012-13 2013-14 2014-15 2015-16 2016-17
Number of Hypertension Cases in government dispensaries/hospitals in Mumbai
MCGM dispensaries/hospitals 21005 26901 31960 22499 24261
State hospitals 921 821 1039 865 1199
Other government dispensaries/hospitals 6798 7915 5671 12597 11297
Total Cases 28724 35637 38670 35961 36757
Population /Total Cases 433 349 322 346 339
Number of Deaths due to Hypertension in Mumbai
Total Deaths 4034 4618 5061 423220* 443821*
Total Cases/Total Deaths 7 8 8 8 8
Registered number of hypertension cases in government institutions is 36,757 in 2016-17. In five years from 2012-13 to 2016-17 hypertension cases have increased by 28%. It is a cause of concern that more than 4,000 people die of hypertension every year. The total number of deaths due to hypertension as per the extrapolated data is 4,438 in 2016-17.
18 19 20 & 21 In January 2016, the MCGM’s locally managed software for registration of births and deaths changed from System Application Protocol (SAP) to the centrally
managed Civil Registration Systems (CRS). Therefore, the Medical Officer of Health (MOH) who is the sub-registrar under the Registration of Births & Deaths Act, 1969, has
access to only the D-1 report i.e. gender-wise total deaths, but not D-10 which is cause-specific death since January 2016. Hence, we have extrapolated the cause of death
data from January 2016 to March 2017 using time series to understand the information on cause of death for this period.
23
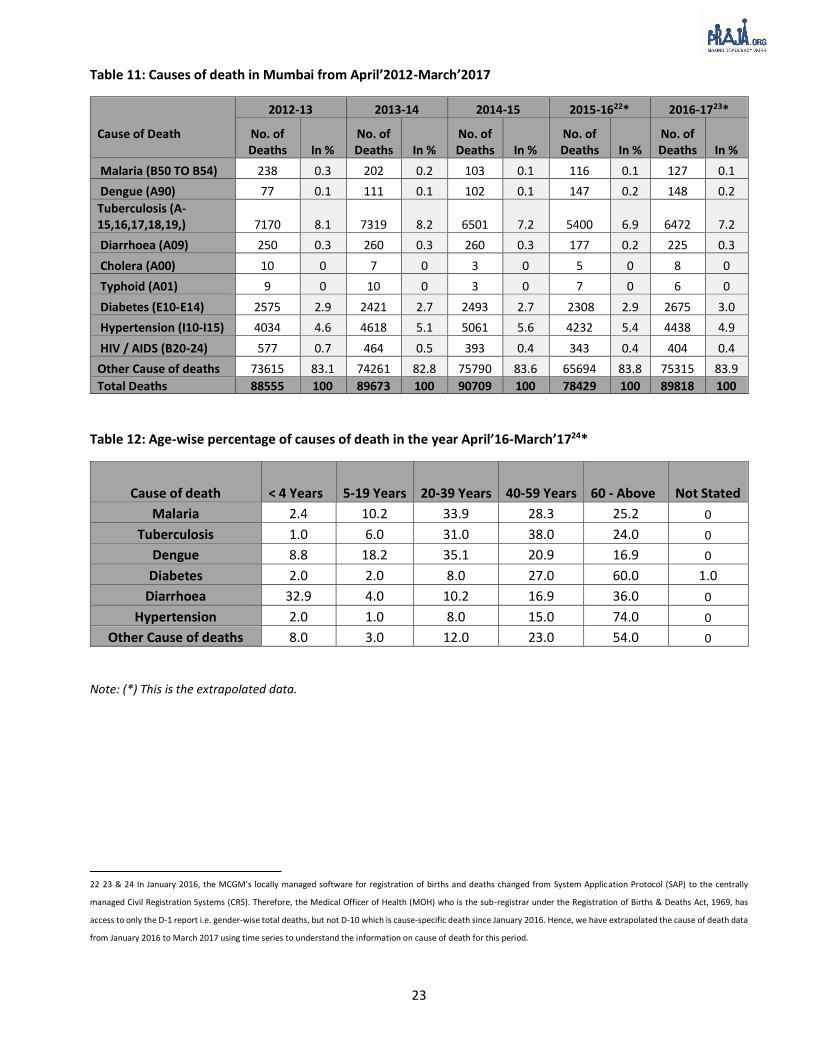
Table 11: Causes of death in Mumbai from April’2012-March’2017
Cause of Death
2012-13 2013-14 2014-15 2015-1622* 2016-1723*
No. of Deaths In %
No. of Deaths In %
No. of Deaths In %
No. of Deaths In %
No. of Deaths In %
Malaria (B50 TO B54) 238 0.3 202 0.2 103 0.1 116 0.1 127 0.1
Dengue (A90) 77 0.1 111 0.1 102 0.1 147 0.2 148 0.2
Tuberculosis (A-15,16,17,18,19,) 7170 8.1 7319 8.2 6501 7.2 5400 6.9 6472 7.2
Diarrhoea (A09) 250 0.3 260 0.3 260 0.3 177 0.2 225 0.3
Cholera (A00) 10 0 7 0 3 0 5 0 8 0
Typhoid (A01) 9 0 10 0 3 0 7 0 6 0
Diabetes (E10-E14) 2575 2.9 2421 2.7 2493 2.7 2308 2.9 2675 3.0
Hypertension (I10-I15) 4034 4.6 4618 5.1 5061 5.6 4232 5.4 4438 4.9
HIV / AIDS (B20-24) 577 0.7 464 0.5 393 0.4 343 0.4 404 0.4
Other Cause of deaths 73615 83.1 74261 82.8 75790 83.6 65694 83.8 75315 83.9
Total Deaths 88555 100 89673 100 90709 100 78429 100 89818 100
Table 12: Age-wise percentage of causes of death in the year April’16-March’1724*
Cause of death < 4 Years 5-19 Years 20-39 Years 40-59 Years 60 - Above Not Stated
Malaria 2.4 10.2 33.9 28.3 25.2 0
Tuberculosis 1.0 6.0 31.0 38.0 24.0 0
Dengue 8.8 18.2 35.1 20.9 16.9 0
Diabetes 2.0 2.0 8.0 27.0 60.0 1.0
Diarrhoea 32.9 4.0 10.2 16.9 36.0 0
Hypertension 2.0 1.0 8.0 15.0 74.0 0
Other Cause of deaths 8.0 3.0 12.0 23.0 54.0 0
Note: (*) This is the extrapolated data.
22 23 & 24 In January 2016, the MCGM’s locally managed software for registration of births and deaths changed from System Application Protocol (SAP) to the centrally
managed Civil Registration Systems (CRS). Therefore, the Medical Officer of Health (MOH) who is the sub-registrar under the Registration of Births & Deaths Act, 1969, has
access to only the D-1 report i.e. gender-wise total deaths, but not D-10 which is cause-specific death since January 2016. Hence, we have extrapolated the cause of death data
from January 2016 to March 2017 using time series to understand the information on cause of death for this period.

24
Table 13: Gender-wise percentage of causes of death in the year April’16-March’1725*
Cause of death Male Female Not Stated
Malaria 68 32 0
Tuberculosis 67 33 0
Dengue 55 45 0
Diabetes 52 48 0
Diarrhoea 46 54 0
Hypertension 50 50 0
Other Cause of deaths 59 41 0
Table 14: Top 10 causes of death in Mumbai
Cause of Death 2011-12 2012-13 2013-14 2014-15 2015-1626* 2016-1727*
Acute Myocardial Infarction (I21-I22)
10475 9897 10187 10263 8955 8961
Other Forms of Heart Diseases (I30-I51)
7690 7488 7507 8781 6696 5659
Septicaemia (A40-A41) 6024 5611 5650 6014 5117 3787
Tuberculosis (A15-A19) 8375 7170 7319 6501 5181 6472
All Other Ischemic Heart Diseases (I20 & I23-I25)
4590 4375 4366 4554 4298 4249
All Other Hypertensive Diseases (I10,I12-I15)
3541 3585 4118 4604 3998 3407
All Other Diseases of the Respiratory System (J60-J86, J92-J98)
3934 4078 4131 4336 3674 3674
Pneumonia (J12-J18) 4072 3330 2937 3215 3129 3034
Renal Failure (N17-N19) 3734 3431 3377 3308 3065 3160
Diseases of the Liver (K70-K76) 2859 2751
Note: (*) This is the extrapolated data.
25 26 & 27 In January 2016, the MCGM’s locally managed software for registration of births and deaths changed from System Application Protocol (SAP) to the centrally
managed Civil Registration Systems (CRS). Therefore, the Medical Officer of Health (MOH) who is the sub-registrar under the Registration of Births & Deaths Act, 1969, has
access to only the D-1 report i.e. gender-wise total deaths, but not D-10 which is cause-specific death since January 2016. Hence, we have extrapolated the cause of death data
from January 2016 to March 2017 using time series to understand the information on cause of death for this period.
25
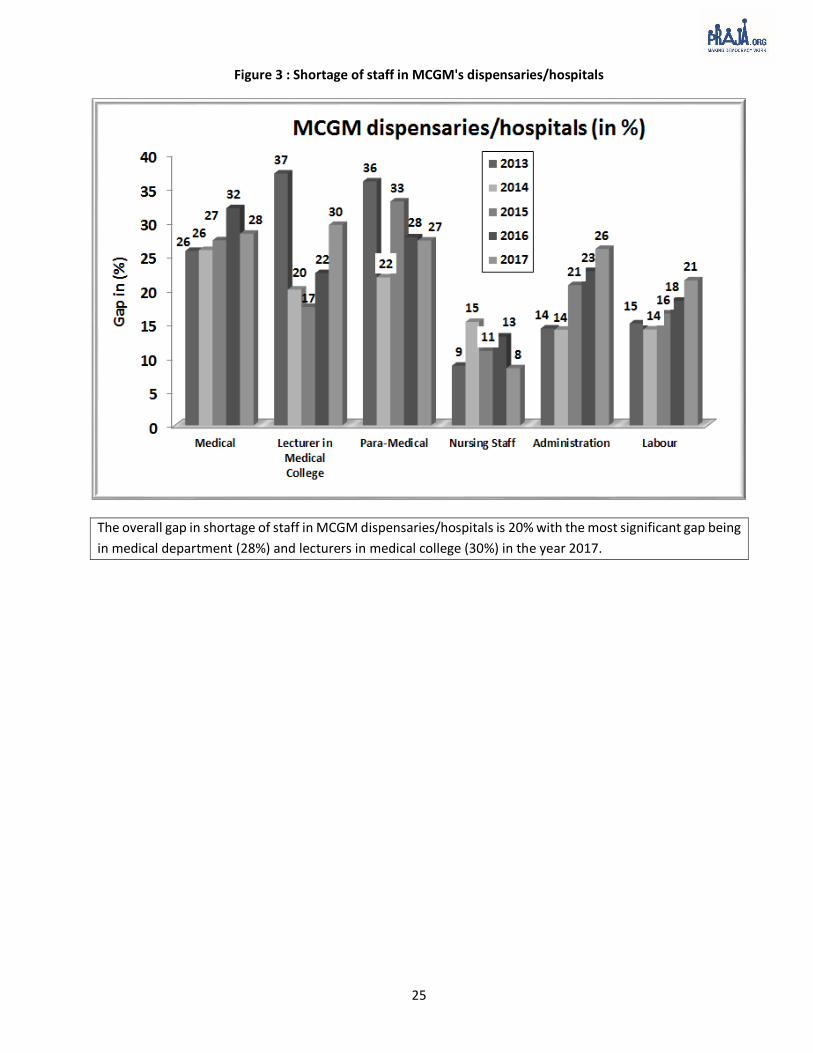
Figure 3 : Shortage of staff in MCGM's dispensaries/hospitals
The overall gap in shortage of staff in MCGM dispensaries/hospitals is 20% with the most significant gap being
in medical department (28%) and lecturers in medical college (30%) in the year 2017.
26
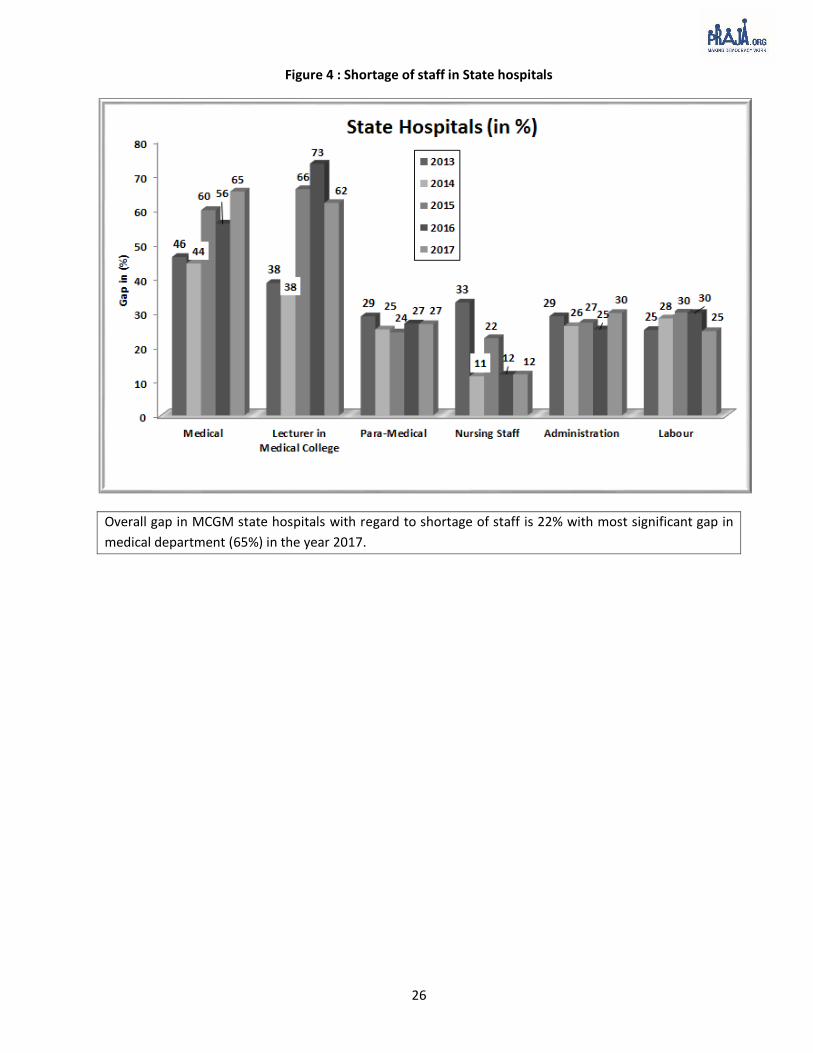
Figure 4 : Shortage of staff in State hospitals
Overall gap in MCGM state hospitals with regard to shortage of staff is 22% with most significant gap in
medical department (65%) in the year 2017.

27
V. Citizen Survey Data
Figure 5: Type of Facilities used by the citizens across different Socio-Economic Classes (SEC), 201728
28 As of March 2016
32 34 33
23 25
11
28 2622
30 31 31 3438 41
4540
43
5247
51
68
57
79
5753
66
53 50 5348
39 4337
48
39
16 1915
9
1811
1522
1217 19 16 19
2216 17
1318
0
20
40
60
80
100
2015 2016 2017 2015 2016 2017 2015 2016 2017 2015 2016 2017 2015 2016 2017 2015 2016 2017
Only Government dispensaries/ hospitals Only Private or charitable clinics/ hospitals
Using both private and government hospitals
Overall SEC A SEC B SEC C SEC D SEC E
In 2017, 51% households accessed private or charitable clinic/hospitals from the overall SECs. On the other
hand, in the same year only 33% households had accessed government dispensaries/hospitals

28
Figure 6: Estimated percentage of Annual Family Income spent on hospital/medical costs across Socio-Economic Classes (SEC)29
The percentage of annual family income spent on hospital/ medical expenses has gone down across SECs from
2015 to 2017. Estimated annual income spent on hospital/medical costs was 7.8% across all SECs in 2017.
Figure 7: Medical Insurance across Socio-Economic Classes’ family with no Medical Insurance
There has been little to no fluctuation in the number of families with no medical insurance from 2015,2016 and
2017. Incidentally the fluctuation has been on the higher percentage side with 71% being the average.
29 Refer Annexure 3 for Socio-Economic Classification
9.28.8
9.19.4 9.4 9.3
8.4 8.5 8.2 8.18.6 8.6
7.87.5 7.5 7.7
8.1 8.0
0
1
2
3
4
5
6
7
8
9
10
All SEC A SEC B SEC C SEC D SEC E
2015 2016 2017
7167 71
57 54 5965
6166
71 69 7180
7077 79 76 77
0
20
40
60
80
100
2015 2016 2017 2015 2016 2017 2015 2016 2017 2015 2016 2017 2015 2016 2017 2015 2016 2017
No Member Has Medical Insurance
Overall SEC A SEC B SEC C SEC D SEC E
29
Figure 8: Estimated percentage of Annual Family Income spent on hospital/medical costs across Socio-Economic Classes
Percentage of households spending more than 11% of their annual family income on hospital/ medical costs has
seen a drop across SECs except for SEC D and SEC E where it is slightly above 11% i.e. 14% and 13% respectively.
18 16 10 19 15 10 22 14 11 21 16 14 21 16 13
40 4134
40 3833
3435 35
35 35 3135 37 31
42 43 5641 47 56 44 51 53 44 48 55 44 47 56
2015 2016 2017 2015 2016 2017 2015 2016 2017 2015 2016 2017 2015 2016 2017
More than 11% 6% to 10% Less than 5%
SEC A SEC B SEC C SEC D SEC E

30
Table 15: Data shown in below table is as per, per capita income from 2016-17
2014-15 2015-16 2016-17
Annual Per Capita Income in Mumbai
Rs. 2,49,99230
Annual Per Capita Income in Mumbai
Rs. 2,71,04631 Annual Per Capita Income in Mumbai
Rs. 2,96,20832
Less 25% (accounting for savings and taxation)
Rs. 1,87,494
Less 25% (accounting for savings and taxation)
Rs. 1,66,617
Less 25% (accounting for savings and taxation)
Rs. 2,22,156
Annual Income per household = Per Capita X 4.58
Rs. 8,58,723
Annual Income per household = Per Capita X 4.58
Rs. 7,63,106 Annual Income per household = Per Capita X 4.58
Rs. 10,17,474
Annual Expenditure on Health per household = 9.2%
Rs. 79,002
Annual Expenditure on Health per household = 8.4%
Rs. 64,101
Annual Expenditure on Health per household = 7.8%
Rs. 79,363
Overall Household Annual Expenditure on Health = Rs. 79,002/- X 2,830,000
Rs. 22,358 crores
Overall Household Annual Expenditure on Health = Rs. 64,101/- X 2,830,000
Rs.18,141 crores
Overall Household Annual Expenditure on Health = Rs. 79,363/- X 2,830,000
Rs. 22,460 crores
As per the Economic Survey of Maharashtra, 2016-17, people intimated that annually the average spent on
medical costs was 7.8% of their family income. Therefore, the above table translates into Rs 22,460 Crores spent
on hospital/medical costs in Mumbai.
30 31 32 Gross value added as per the Economic Survey of Maharashtra 2016-17 for the years 2015-16, 2014-15 and 2013-14 respectively. The directorate of Economics and
statistics revised the Gross value added and the above numbers.
31
Table 16: Estimated cases per 1000 households of Diseases and Ailments across different Socio-Economic Classes in 2017
Diseases &
Ailments Malaria Dengue Diabetes Cancer TB Diarrhoea Chikungunya Hypertension
Overall 40 33 49 5 10 2 12 26
SEC A 27 33 42 1 4 1 6 21
SEC B 29 23 50 3 5 1 5 26
SEC C 33 28 45 4 9 1 7 23
SEC D 45 29 65 4 14 4 15 24
SEC E 66 39 36 12 14 0 29 35
It can be seen that SEC E is most affected with Malaria (66), Dengue (39), cancer (12), TB (14), Chikungunya (29)
and Hypertension (35).
Table 17: Gender and Age-wise estimated cases per 1000 households of Diseases and Ailments across different socio-economic classes year 2017
Diseases and Ailments
Total Estimated Cases
Overall Males Females 18 - 25 years
26 - 40 years
40+ years
Malaria 40 47 41 50 10 19
Diabetes 49 45 54 2 13 135
Hypertension 26 22 31 2 15 57
Tuberculosis 10 8 12 13 2 6
Diarrhoea 2 1 2 1 2 1
Cancer 5 3 7 1 1 11
Dengue 33 37 25 32 3 16
Chikungunya 12 10 19 7 7 19
In the cases of both dengue and malaria, there is a significant proportion of population aged 18-25 years.

32
Table 18: Type of Facilities used by the citizens by diseases per 1000 households
Year Malaria Dengue Chikungunya Cancer Tuberculosis
Only Government dispensaries/ hospitals
2015 40 24 34 27 49
2016 36 37 32 58 48
2017 44 31 53 58 52
Only Private or Charitable clinics/
hospitals
2015 47 63 56 36 31
2016 38 49 56 21 31
2017 51 66 39 32 42
Using both private and government hospitals
2015 13 13 11 37 21
2016 26 15 12 21 21
2017 5 3 8 9 6
Table 19: Number of Members who have visited Government and Private hospitals
Malaria Dengue
Only Government dispensaries/ hospitals 39,811 33,653
Only Private or Charitable clinics/ hospitals 46,104 72,343
Using both private and government hospitals
4,788 3,447
Total 90,703 1,09,443
The information received under RTI from various government institutions shows that dengue cases in
Mumbai were 17,771 & 11,607 of dengue and malaria respectively while the survey data across all 24 wards
of Mumbai showed that the cases of dengue were as high as 1,09,443 and cases of malaria were 90,703.
33
VI. Deliberations by Municipal Councillors and MLAs on Health Issues Table 20: Total numbers of Meeting, Attendance and Questions from March’12 to March’17
Public Health Committee Total Meetings Attendance (%) Total Questions
Asked
March 2012 to March 2013 16 68 56
April 2013 to March 2014 17 68 122
April 2014 to March 2015 24 61 123
April 2015 to March 2016 18 64 147
April 2016 to March 2017 20 60 131
The number of Public Health Committee meetings held in 2016-17 have increased while the attendance in 2016-
17 has decreased compared to 2015-16.

34
Table 21: Health issues raised by Public Health Committee Councillors from March’12 to March’17
Issues
Question asked
March 2012 to March 2013
April 2013 to March 2014
April 2014 to March 2015
April 2015 to March 2016
April 2016
to March 2017
Budget 0 0 0 0 1
Cemeteries /Crematorium related 3 1 4 3 1
Epidemic/Sensitive Diseases 2 2 7 15 12
Malaria/Dengue 3 7 3 14 6
Diabetic/Hypertension 0 2 0 0 0
Diarrhoea/Typhoid/Cholera 1 0 0 0 0
Tuberculosis 0 1 0 1 3
Dispensary/Municipal Hospital/State Hospital 0 0 0 3 5
Equipment’s 8 2 11 9 11
Eradication programme 0 1 0 0 2
Fogging 0 0 1 0 1
Health Education/institute 0 1 1 3 2
Health Service Related 12 32 14 6 11
Human Resource 10 31 17 22 23
Health Infrastructure 2 11 18 28 29
Issue of Birth/Death certificates 2 0 1 2 1
License 1 2 1 1 3
Maternity homes / Primary Health Centre(PHC) 2 6 4 8 1
MCGM Related 1 1 2 5 7
Mortality rate 0 1 0 0 0
Medical Examination of Students 0 0 0 2 0
Naming/ Renaming Hospital/Health Centre/Cemeteries 2 4 4 7 5
Nuisance due to stray dogs, monkeys etc. 1 0 1 0 1
Pest Control Related 0 0 3 0 0
Private Health Services 0 0 0 3 1
Quacks 0 1 0 2 1
Schemes / Policies in Health 4 17 20 15 5
Social Cultural Concerns Related 0 0 6 0 0
Treatment/Medicines 6 9 8 13 8
Total 56 122 123 147 131
The number of issues raised by councillors in Health Committee meetings has decreased from 147 in 2015-16
to 131 in 2016-17. The highest number of issues was raised on health infrastructure (29) in 2017 while no
issues were raised on diarrhoea and only four issues were raised on tuberculosis from April 2014-March 2017

35
Table 22 : Number of questions asked on Health by Municipal Councillors ward-wise in All Committees from April 2012 to March 2017
Ward No. of
Councillors April 2012 to March 2013
April 2013 to March 2014
April 2014 to March 2015
April 2015 to March 2016
April 2016 to March 2017
A 4 0 1 2 11 19
B 3 0 1 1 3 2
C 4 0 3 5 0 1
D 7 3 8 9 7 4
E 8 6 11 13 8 4
F/N 10 5 6 14 13 8
F/S 7 9 4 8 4 12
G/N 11 8 4 7 7 12
G/S 9 18 14 8 13 11
H/E 11 8 10 10 21 12
H/W 6 1 2 2 5 1
K/E 15 11 10 11 12 10
K/W 13 13 12 11 7 15
L 15 50 100 122 97 99
M/E 13 5 26 26 13 8
M/W 8 6 13 13 10 13
N 12 6 8 15 18 9
P/N 16 11 35 48 21 20
P/S 8 4 7 8 22 14
R/C 10 8 11 8 11 13
R/N 7 5 29 26 36 21
R/S 11 14 34 30 42 34
S 13 8 12 9 24 14
T 6 1 4 11 7 9
Total 227 200 365 417 412 365
Municipal councillors in wards B, C, D, E and H/W asked less than five questions during the year 2016-17.
More number of questions were raised from L ward accounting to 27% of the total number of questions
raised.
36
Table 23: Health issues raised by Municipal Councillors from March’12 to March’2017
Issues
Question asked
April 2012 to March 2013
April 2013 to March 2014
April 2014 to March 2015
April 2015 to March 2016
April 2016 to March 2017
Budget 0 1 0 1 1
Bio medical Waste 0 0 1 1 9
Cemeteries / Crematorium related 21 17 22 9 6
Compensation/Rehabilitation 0 0 0 1 1
Epidemic/Sensitive Diseases 28 51 84 97 87
Malaria/Dengue 16 20 46 43 40
Tuberculosis 0 6 22 11 6
Diarrhoea/Typhoid/Cholera 1 1 0 2 0
Diabetes/Hypertension 0 1 2 4 1
Dispensary/Municipal Hospital/State Hospital 0 0 0 7 5
Equipment’s 12 10 17 13 15
Eradication programme 1 1 1 3 2
Fogging 10 17 23 5 13
Health Related Issues 7 13 37 32 42
Human Resource 23 61 40 43 38
Health Services 23 47 36 16 19
Health Education/Institute Related 0 4 3 5 9
Infrastructure 9 22 37 60 44
Issue of Birth/Death certificates 4 7 4 4 4
License Related 1 1 4 12 5
Medical Examination Report 0 0 0 2 0
Maternity homes / Primary Health Centre(PHC) 9 26 11 15 11
MCGM related 1 5 3 6 7
Mortality rate 1 1 1 0 0
Naming/ Renaming Hospital/Health Centre/Cemeteries 11 16 21 11 9
Nuisance due to Pest Rodents, stray dogs, monkeys etc. 1 0 5 1 1
Negligence of officers 0 0 0 2 1
Private health services 2 7 2 4 3
Quacks 0 1 0 2 1
Schemes / Policies in Health 23 46 50 41 21
Vaccination 0 0 0 2 0
Treatment/Medicines 13 11 15 17 11
Total 200 365 417 412 365
Total number of questions asked by municipal councillors on health issues was 365 in 2016-17, which has decreased compared to 2015-16 when the number of questions raised was 412. Only one question was asked on mortality rate and only two questions were asked on diarrhoea in last three years.
37
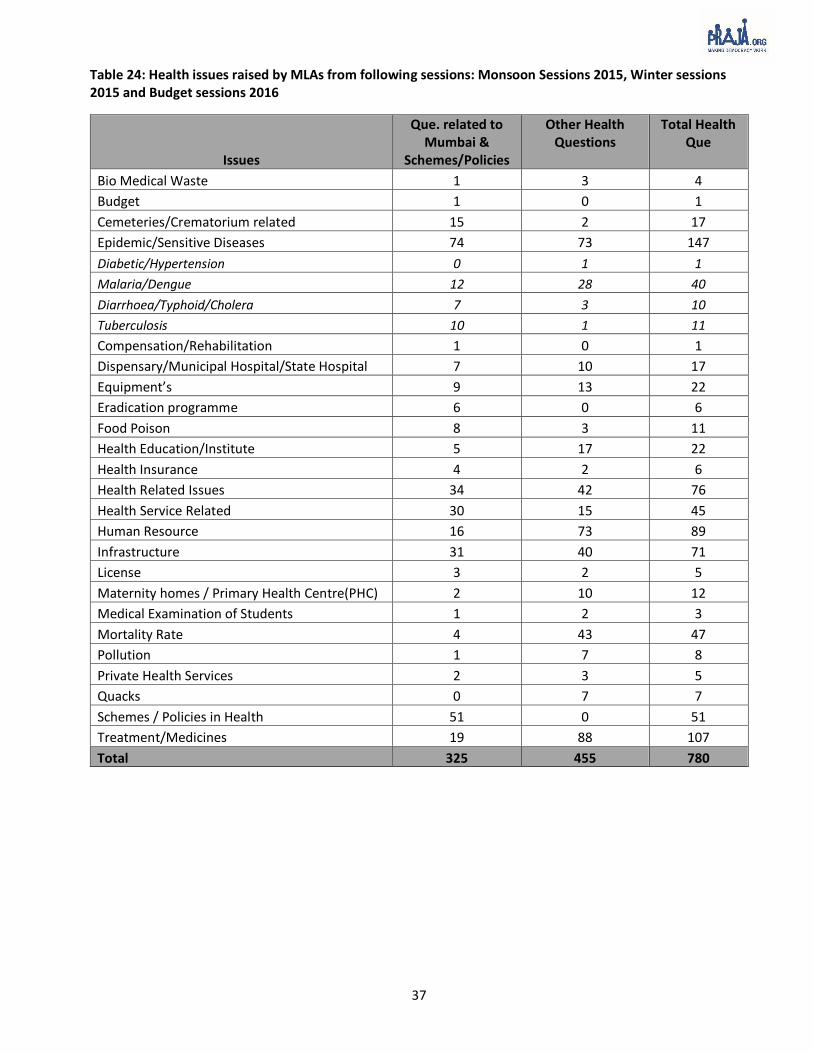
Table 24: Health issues raised by MLAs from following sessions: Monsoon Sessions 2015, Winter sessions 2015 and Budget sessions 2016
Issues
Que. related to Mumbai &
Schemes/Policies
Other Health Questions
Total Health Que
Bio Medical Waste 1 3 4
Budget 1 0 1
Cemeteries/Crematorium related 15 2 17
Epidemic/Sensitive Diseases 74 73 147
Diabetic/Hypertension 0 1 1
Malaria/Dengue 12 28 40
Diarrhoea/Typhoid/Cholera 7 3 10
Tuberculosis 10 1 11
Compensation/Rehabilitation 1 0 1
Dispensary/Municipal Hospital/State Hospital 7 10 17
Equipment’s 9 13 22
Eradication programme 6 0 6
Food Poison 8 3 11
Health Education/Institute 5 17 22
Health Insurance 4 2 6
Health Related Issues 34 42 76
Health Service Related 30 15 45
Human Resource 16 73 89
Infrastructure 31 40 71
License 3 2 5
Maternity homes / Primary Health Centre(PHC) 2 10 12
Medical Examination of Students 1 2 3
Mortality Rate 4 43 47
Pollution 1 7 8
Private Health Services 2 3 5
Quacks 0 7 7
Schemes / Policies in Health 51 0 51
Treatment/Medicines 19 88 107
Total 325 455 780

38
Table 25: Questions asked on health issues by MLAs from: Monsoon Sessions 2015, Winter Sessions 2015 & Budget Session 2016
Constituency
No. Name of MLA Party Area
Que. related to Mumbai &
Schemes/Policies
Other Health Que.
Total Health
Que
153 Manisha Chaudhari BJP Dahisar 7 22 29
154 Prakash Surve SS Magathane 11 2 13
155 Sardar Tara Singh BJP Mulund 8 22 30
156 Sunil Rajaram Raut SS Vikhroli 11 9 20
157 Ashok Patil SS Bhandup West 4 1 5
159 Sunil Prabhu SS Dindoshi 11 18 29
160 Atul Bhatkhalkar BJP Kandivali East 8 17 25
161 Yogesh Sagar BJP Charkop 11 24 35
162 Aslam Shaikh INC Malad West 47 67 114
164 Bharati Lavekar BJP Versova 0 0 0
165 Ameet Satam BJP Andheri West 5 4 9
166 Ramesh Latke SS Andheri East 0 0 0
167 Parag Alavani BJP Vile Parle 9 12 21
168 Md. Arif (Naseem) Khan INC Chandivali 17 16 33
169 Ram Kadam BJP Ghatkopar West 0 0 0
171 Abu Azmi SP Mankhurd shivaji Nagar 8 9 17
172 Tukaram Kate SS Anushakti Nagar 5 0 5
173 Prakash Phaterpekar SS Chembur 3 4 7
174 Mangesh Kudalkar SS Kurla 0 2 2
175 Sanjay Potnis SS Kalina 11 6 17
176 Trupti Sawant SS Vandre (East) 2 5 7
177 Ashish Shelar BJP Vandre West 11 25 36
178 Varsha Gaikwad INC Dharavi 17 16 33
179 Captain R. Tamil Selvan BJP Sion Koliwada 0 0 0
180 Kalidas Kolambkar INC Wadala 20 17 37
181 Sada Sarvankar SS Mahim 6 6 12
182 Sunil Shinde SS Worli 7 13 20
183 Ajay Choudhari SS Shivadi 11 12 23
184 Waris Pathan AIME
IM Byculla 3 5 8
185 Mangal Prabhat Lodha BJP Malabar Hill 2 7 9
186 Amin Patel INC Mumbadevi 67 107 174
187 Raj K. Purohit BJP Colaba 3 7 10
Total 325 455 780
Captain R. Tamil Selvan, Ram Kadam and Bharati Hemant Lavekar have asked zero questions in all Monsoon
Sessions 2015, Winter Sessions 2015 & Budget Session 2016.
39
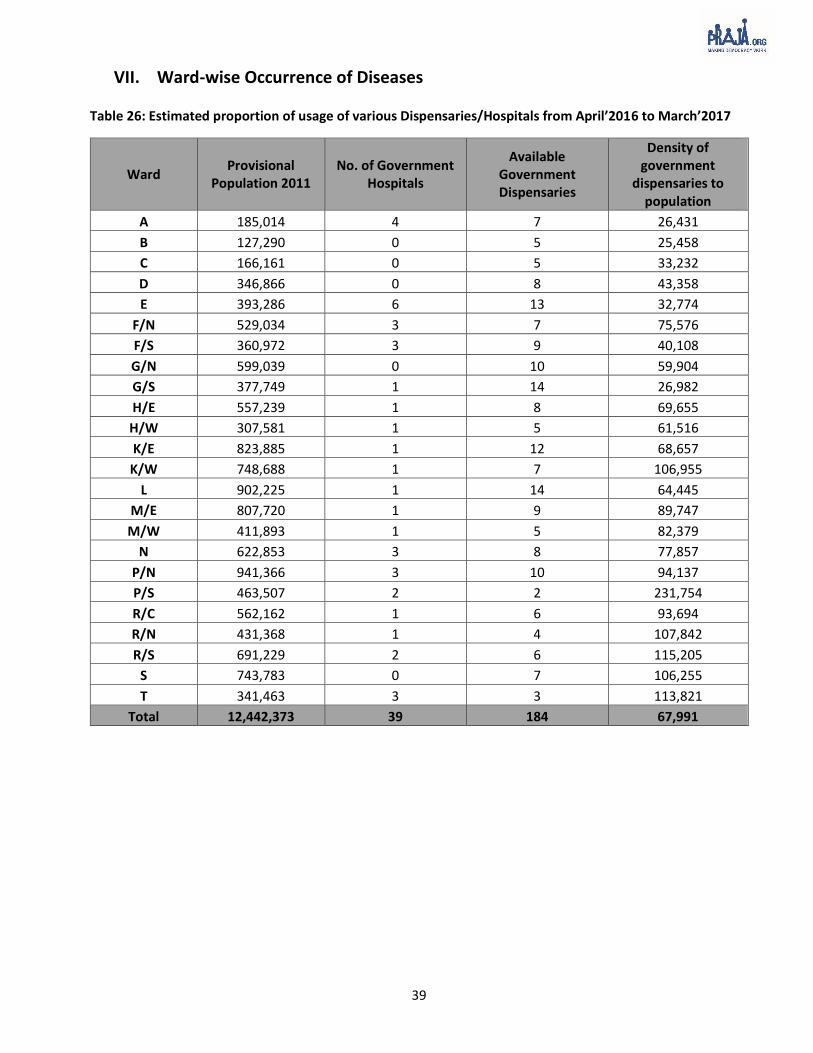
VII. Ward-wise Occurrence of Diseases Table 26: Estimated proportion of usage of various Dispensaries/Hospitals from April’2016 to March’2017
Ward Provisional
Population 2011 No. of Government
Hospitals
Available Government Dispensaries
Density of government
dispensaries to population
A 185,014 4 7 26,431
B 127,290 0 5 25,458
C 166,161 0 5 33,232
D 346,866 0 8 43,358
E 393,286 6 13 32,774
F/N 529,034 3 7 75,576
F/S 360,972 3 9 40,108
G/N 599,039 0 10 59,904
G/S 377,749 1 14 26,982
H/E 557,239 1 8 69,655
H/W 307,581 1 5 61,516
K/E 823,885 1 12 68,657
K/W 748,688 1 7 106,955
L 902,225 1 14 64,445
M/E 807,720 1 9 89,747
M/W 411,893 1 5 82,379
N 622,853 3 8 77,857
P/N 941,366 3 10 94,137
P/S 463,507 2 2 231,754
R/C 562,162 1 6 93,694
R/N 431,368 1 4 107,842
R/S 691,229 2 6 115,205
S 743,783 0 7 106,255
T 341,463 3 3 113,821
Total 12,442,373 39 184 67,991

40
Table 27: Ward wise Malaria Data
Ward33 Population
2011 2012-13 2013-14 2014-15 2015-16 2016-17 A 1,85,014 602 303 183 156 139
B 1,27,290 99 33 31 25 31
C 1,66,161 162 113 92 97 76
D 3,46,866 112 100 90 94 67
E 3,93,286 213 160 89 44 93
F/N 5,29,034 362 238 176 168 152
F/S 3,60,972 846 568 960 812 441
G/N 5,99,039 312 310 272 141 162
G/S 3,77,749 201 100 64 76 150
H/E 5,57,239 223 179 186 114 152
H/W 3,07,581 170 205 177 121 125
K/E 8,23,885 831 381 368 315 172
K/W 7,48,688 308 205 132 133 170
L 9,02,225 512 386 285 232 145
M/E 8,07,720 178 112 149 87 209
M/W 4,11,893 131 78 53 58 37
N 6,22,853 353 228 186 130 102
P/N 9,41,366 104 83 79 127 153
P/S 4,63,507 56 43 54 42 29
R/C 5,62,162 106 84 103 97 89
R/N 4,31,368 88 73 78 90 52
R/S 6,91,229 230 130 99 88 107
S 7,43,783 162 137 117 128 122
T 3,41,463 154 79 37 42 52
Municipal Hospital 12408 11918 9961 9150 6741
State Hospital 1280 1052 854 1233 1312
Other Government Hospital 1736 1100 808 831 527
Total 1,24,42,373 21939 18398 15683 14631 11607
33 Data for dispensaries has been obtained ward wise from the Medical Officer of Health (MOH) of all 24 wards of MCGM.
Malaria cases have reduced by 47% from 2012-13 to 2016-17.
In the last 5 consecutive years, F/S and K/E has been amongst the highest in malaria occurrences.
F/S (441), M/E (209) and K/E (172) have the highest number of malaria cases in the year 2016-17.

41
Table 28: Ward wise Dengue Data
Ward34 Population
2011 2012-13 2013-14 2014-15 2015-16 2016-17 A 1,85,014 0 0 47 137 42
B 1,27,290 0 27 51 43 25
C 1,66,161 0 3 17 14 26
D 3,46,866 0 0 35 60 84
E 3,93,286 0 1 25 42 3
F/N 5,29,034 3 2 54 29 35
F/S 3,60,972 0 0 34 22 11
G/N 5,99,039 0 10 64 35 21
G/S 3,77,749 0 0 0 1 9
H/E 5,57,239 1 0 22 67 1
H/W 3,07,581 0 3 11 13 16
K/E 8,23,885 16 29 67 198 224
K/W 7,48,688 0 3 35 12 0
L 9,02,225 0 12 11 43 144
M/E 8,07,720 0 0 24 2 0
M/W 4,11,893 1 14 4 2 27
N 6,22,853 1 2 38 155 70
P/N 9,41,366 0 0 12 56 3
P/S 4,63,507 1 11 2 15 3
R/C 5,62,162 0 0 19 31 53
R/N 4,31,368 0 0 26 132 108
R/S 6,91,229 2 24 81 30 39
S 7,43,783 1 0 28 308 95
T 3,41,463 0 6 1 4 0
Municipal Hospital 4441 5952 7710 11484 13323
State Hospital 289 732 1523 1776 2529
Other Government Hospital 111 430 358 533 880
Total 1,24,42,373 4867 7261 10299 15244 17771
Reporting of Dengue cases has increased three times in L ward from 43 in 2015-16 to 144 in 2016-17.
From the last five years (2012-13 to 2016- 17) the overall dengue occurrences have increased by 265%.
34 Data for dispensaries has been obtained ward wise from the Medical Officer of Health (MOH) of all 24 wards of MCGM.

42
Table 29: Positive dengue cases as per rapid kit test
Ward Dengue Cases in Dispensary 2016-17 - Dengue Positive Cases
A 42 51
B 25 6
C 26 26
D 82 73
E 3 18
F/N 33 79
F/S 11 31
G/N 12 62
G/S 9 176
H/E 1 20
H/W 16 29
K/E 182 179
K/W 0 5
L 124 134
M/E 0 41
M/W 27 0
N 70 76
P/N 3 30
P/S 3 5
R/C 53 38
R/N 108 96
R/S 0 38
S 95 105
T 0 3
Total 925 1321
H/E ward, M/E and R/S wards had stated dengue cases in their wards were one, zero and zero respectively.
However, the results of Rapid Test Kits showed the number of positive dengue cases as 20, 41 and 38 cases
in these wards respectively.

43
Table 30: Ward wise Tuberculosis Data
Ward35 Population
2011 2012-13 2013-14 2014-15 2015-16 2016-17 A 1,85,014 342 452 369 274 238
B 1,27,290 117 110 121 95 252
C 1,66,161 120 115 141 134 73
D 3,46,866 250 237 233 234 201
E 3,93,286 748 572 561 408 376
F/N 5,29,034 382 255 307 375 161
F/S 3,60,972 185 14 438 239 176
G/N 5,99,039 457 510 396 444 434
G/S 3,77,749 178 174 198 402 229
H/E 5,57,239 539 485 549 532 659
H/W 3,07,581 757 245 237 236 205
K/E 8,23,885 1069 616 663 491 327
K/W 7,48,688 398 292 264 242 162
L 9,02,225 994 1037 1182 1422 1254
M/E 8,07,720 135 228 102 82 148
M/W 4,11,893 111 282 136 165 95
N 6,22,853 140 143 203 158 143
P/N 9,41,366 120 200 238 219 310
P/S 4,63,507 58 97 48 43 21
R/C 5,62,162 183 206 180 188 195
R/N 4,31,368 98 103 118 158 201
R/S 6,91,229 613 611 532 411 493
S 7,43,783 440 675 485 448 369
T 3,41,463 246 216 386 200 108
Municipal Hospital 26198 31782 32439 31463 40849
State Hospital 946 1216 1829 1645 1890
Other Government Hospital
593 606 482 464 432
Total 1,24,42,373 36417 41479 42837 41172 50001
From 2012-13 to 2016-17, L ward has seen one of the highest occurrence for tuberculosis. In 2016-2017, the total number of occurrences is 1,254
From 2012-13 to 2016-17, there has been a 37% increase in the occurrences of tuberculosis.
35 Data for dispensaries has been obtained ward wise from the Medical Officer of Health (MOH) of all 24 wards of MCGM.

44
Table 31: Ward wise Diabetes Data
Ward36 Population 2011 2012-13 2013-14 2014-15 2015-16 2016-17
A 1,85,014 327 493 449 433 639
B 1,27,290 756 447 439 759 823
C 1,66,161 47 149 115 151 334
D 3,46,866 413 293 277 2034 2058
E 3,93,286 327 600 411 704 936
F/N 5,29,034 618 505 1113 821 807
F/S 3,60,972 216 81 68 169 302
G/N 5,99,039 1068 1247 1963 2687 1470
G/S 3,77,749 168 197 158 333 619
H/E 5,57,239 220 409 273 668 1157
H/W 3,07,581 168 248 101 215 148
K/E 8,23,885 1770 1972 1018 1008 1134
K/W 7,48,688 1146 1760 1105 569 1700
L 9,02,225 1402 1222 878 1592 1175
M/E 8,07,720 592 448 606 1699 1805
M/W 4,11,893 303 267 178 222 268
N 6,22,853 579 715 558 573 2353
P/N 9,41,366 155 176 132 582 494
P/S 4,63,507 311 272 107 143 125
R/C 5,62,162 367 324 201 560 1333
R/N 4,31,368 78 135 129 1158 387
R/S 6,91,229 2420 5390 7540 831 1512
S 7,43,783 586 858 329 1710 1154
T 3,41,463 177 291 239 99 127
Municipal Hospital 7424 18901 27319 4898 4605
State Hospital 728 742 1135 832 957
Other Government Hospital 2579 2699 1869 5246 4098
Total 1,24,42,373 24945 40841 48710 30696 32520
N and D wards show the highest number of diabetes cases with 2,353 and 2,058 respectively. The least cases
of diabetes were reported from P/S ward with 125 cases.
36 Data for dispensaries has been obtained ward wise from the Medical Officer of Health (MOH) of all 24 wards of MCGM.

45
Table 32: Ward wise Diarrhoea Data
Ward37 Population
2011 2012-13 2013-14 2014-15 2015-16 2016-17
A 1,85,014 1449 2002 2092 1620 1310
B 1,27,290 1077 1545 1783 1766 870
C 1,66,161 1946 2431 3085 2972 2630
D 3,46,866 4649 4865 5302 6510 6927
E 3,93,286 2208 2474 2758 3414 2848
F/N 5,29,034 1547 1507 1695 1837 2500
F/S 3,60,972 4259 4120 3634 4085 4827
G/N 5,99,039 3073 2881 2923 3553 5673
G/S 3,77,749 4036 4691 4792 5387 5659
H/E 5,57,239 4224 6006 6884 7368 6396
H/W 3,07,581 1878 2028 2104 2204 1522
K/E 8,23,885 6641 7169 10428 7970 5841
K/W 7,48,688 3011 3792 2774 2325 1724
L 9,02,225 11967 9659 10143 12311 11535
M/E 8,07,720 2565 3248 5894 11805 4908
M/W 4,11,893 2656 2262 1856 1918 1896
N 6,22,853 5972 7079 8140 10239 8121
P/N 9,41,366 2790 3582 2911 3384 3415
P/S 4,63,507 949 1073 949 692 658
R/C 5,62,162 2633 3454 3851 3599 2576
R/N 4,31,368 580 785 823 2329 1836
R/S 6,91,229 1925 1375 1606 1625 1674
S 7,43,783 3822 3507 4108 5070 4322
T 3,41,463 3252 2534 2067 3052 1873
Municipal Hospital 19358 31718 21857 9677 6947
State Hospital 785 1561 1129 1741 1162
Other Government Hospital 575 832 1169 889 993
Total 1,24,42,373 99827 118180 116757 119342 100643
Diarrhoea cases have increased consistently in D ward in last 5 years, with 6,927 cases in 2016-17 compared to
4,649 in 2012-13. L ward, which comprises of Kurla, has the highest number of diarrhoea cases.
37 Data for dispensaries has been obtained ward wise from the Medical Officer of Health (MOH) of all 24 wards of MCGM.
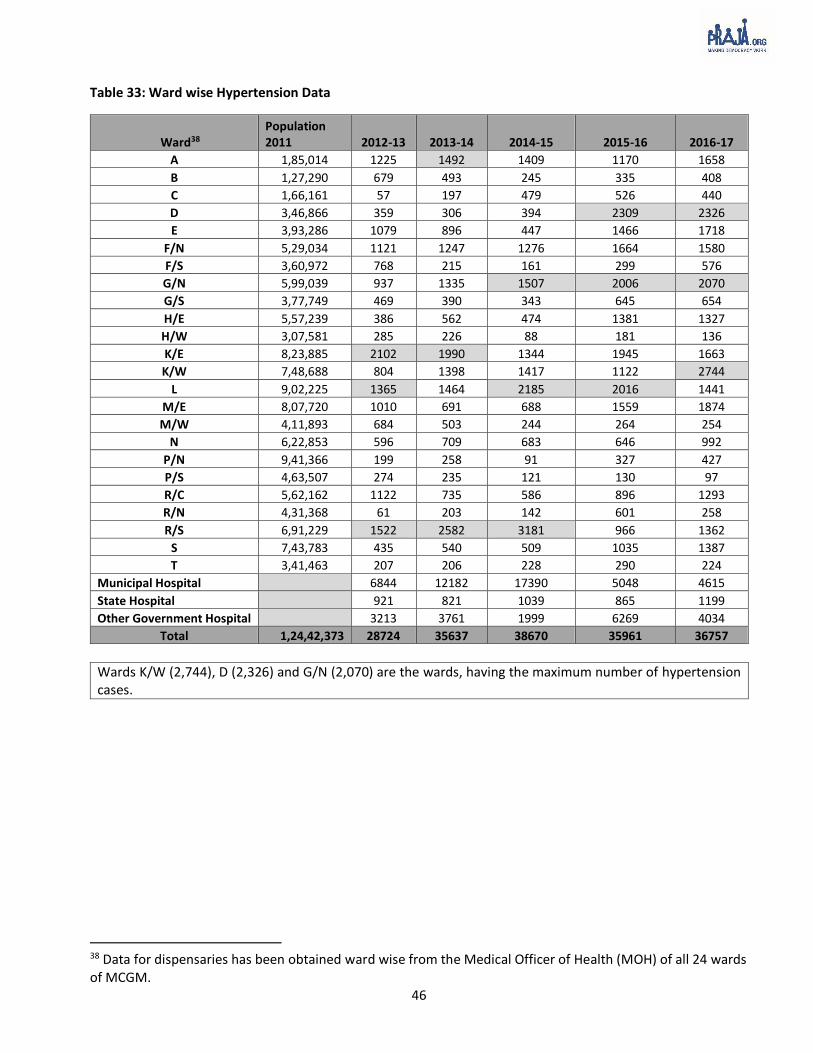
46
Table 33: Ward wise Hypertension Data
Ward38 Population 2011 2012-13 2013-14 2014-15 2015-16 2016-17
A 1,85,014 1225 1492 1409 1170 1658
B 1,27,290 679 493 245 335 408
C 1,66,161 57 197 479 526 440
D 3,46,866 359 306 394 2309 2326
E 3,93,286 1079 896 447 1466 1718
F/N 5,29,034 1121 1247 1276 1664 1580
F/S 3,60,972 768 215 161 299 576
G/N 5,99,039 937 1335 1507 2006 2070
G/S 3,77,749 469 390 343 645 654
H/E 5,57,239 386 562 474 1381 1327
H/W 3,07,581 285 226 88 181 136
K/E 8,23,885 2102 1990 1344 1945 1663
K/W 7,48,688 804 1398 1417 1122 2744
L 9,02,225 1365 1464 2185 2016 1441
M/E 8,07,720 1010 691 688 1559 1874
M/W 4,11,893 684 503 244 264 254
N 6,22,853 596 709 683 646 992
P/N 9,41,366 199 258 91 327 427
P/S 4,63,507 274 235 121 130 97
R/C 5,62,162 1122 735 586 896 1293
R/N 4,31,368 61 203 142 601 258
R/S 6,91,229 1522 2582 3181 966 1362
S 7,43,783 435 540 509 1035 1387
T 3,41,463 207 206 228 290 224
Municipal Hospital 6844 12182 17390 5048 4615
State Hospital 921 821 1039 865 1199
Other Government Hospital 3213 3761 1999 6269 4034
Total 1,24,42,373 28724 35637 38670 35961 36757
Wards K/W (2,744), D (2,326) and G/N (2,070) are the wards, having the maximum number of hypertension cases.
38 Data for dispensaries has been obtained ward wise from the Medical Officer of Health (MOH) of all 24 wards of MCGM.
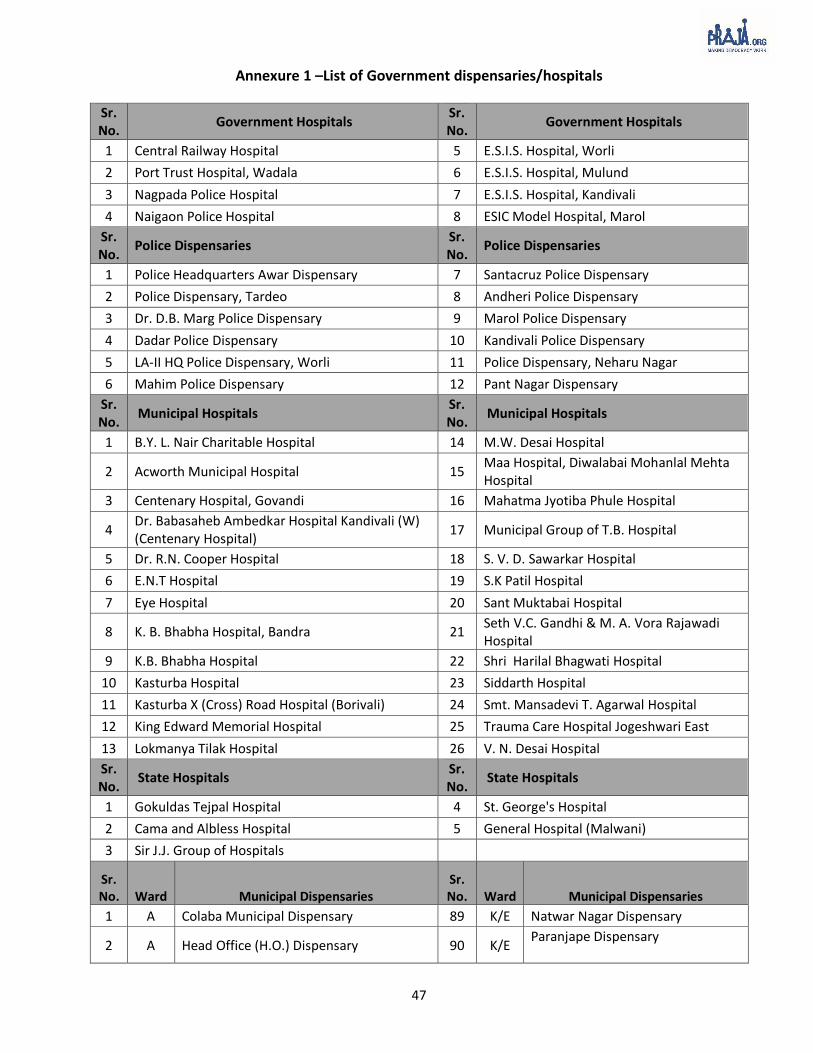
47
Annexure 1 –List of Government dispensaries/hospitals
Sr. No.
Government Hospitals Sr. No.
Government Hospitals
1 Central Railway Hospital 5 E.S.I.S. Hospital, Worli
2 Port Trust Hospital, Wadala 6 E.S.I.S. Hospital, Mulund
3 Nagpada Police Hospital 7 E.S.I.S. Hospital, Kandivali
4 Naigaon Police Hospital 8 ESIC Model Hospital, Marol
Sr. No.
Police Dispensaries Sr. No.
Police Dispensaries
1 Police Headquarters Awar Dispensary 7 Santacruz Police Dispensary
2 Police Dispensary, Tardeo 8 Andheri Police Dispensary
3 Dr. D.B. Marg Police Dispensary 9 Marol Police Dispensary
4 Dadar Police Dispensary 10 Kandivali Police Dispensary
5 LA-II HQ Police Dispensary, Worli 11 Police Dispensary, Neharu Nagar
6 Mahim Police Dispensary 12 Pant Nagar Dispensary
Sr. No.
Municipal Hospitals Sr. No.
Municipal Hospitals
1 B.Y. L. Nair Charitable Hospital 14 M.W. Desai Hospital
2 Acworth Municipal Hospital 15 Maa Hospital, Diwalabai Mohanlal Mehta Hospital
3 Centenary Hospital, Govandi 16 Mahatma Jyotiba Phule Hospital
4 Dr. Babasaheb Ambedkar Hospital Kandivali (W) (Centenary Hospital)
17 Municipal Group of T.B. Hospital
5 Dr. R.N. Cooper Hospital 18 S. V. D. Sawarkar Hospital
6 E.N.T Hospital 19 S.K Patil Hospital
7 Eye Hospital 20 Sant Muktabai Hospital
8 K. B. Bhabha Hospital, Bandra 21 Seth V.C. Gandhi & M. A. Vora Rajawadi Hospital
9 K.B. Bhabha Hospital 22 Shri Harilal Bhagwati Hospital
10 Kasturba Hospital 23 Siddarth Hospital
11 Kasturba X (Cross) Road Hospital (Borivali) 24 Smt. Mansadevi T. Agarwal Hospital
12 King Edward Memorial Hospital 25 Trauma Care Hospital Jogeshwari East
13 Lokmanya Tilak Hospital 26 V. N. Desai Hospital
Sr. No.
State Hospitals Sr. No.
State Hospitals
1 Gokuldas Tejpal Hospital 4 St. George's Hospital
2 Cama and Albless Hospital 5 General Hospital (Malwani)
3 Sir J.J. Group of Hospitals
Sr. No. Ward Municipal Dispensaries
Sr.No. Ward Municipal Dispensaries
1 A Colaba Municipal Dispensary 89 K/E Natwar Nagar Dispensary
2 A Head Office (H.O.) Dispensary 90 K/E Paranjape Dispensary

48
Sr. No. Ward Municipal Dispensaries
Sr. No. Ward Municipal Dispensaries
3 A Maruti Lane Dispensary 91 K/E Sambhaji Nagar Dispensary
4 A Saboo Siddhique Road Dispensary, Paltan Road (S.S. Road)
92 K/E Sambhji Nagar Ayurvedic Dispensary
5 A Shahid Bhagat Singh Road Dispensary 93 K/E Sunder Nagar Dispensary*
6 A Ayurvedic Head Office (H.O.) Dispensary 94 K/W Banana Leaf Dispensary*
7 B Jail Road municipal Dispensary 95 K/W Juhu Dispensary
8 B Jail Road Unani Dispensary 96 K/W Millat Nagar Dispensary*
9 B Kolsa Mohalla Unani Dispensary 97 K/W N.J. Wadiya Dispensary
10 B S.V.P. Road Municipal Dispensary 98 K/W Oshivara Dispensary
11 B Walpakhadi Muncipal Dispensary 99 K/W Vileparle Market Dispensary
12 C Chandanwadi Dispensary 100 K/W Vrasova Dispensary
13 C Duncan Road Dispensary 101 L Asalpha Village Dispensary
14 C Ghogari Mohalla Dispensary 102 L Bail Bazar Mun. Dispensary
15 C Panjarapol Mun. Dispensary 103 L Budda Colony Dispensary
16 C Thakurdwar Dispensary 104 L Chandivali M.N.P. Dispensary
17 D Banganga Municipal Dispensary 105 L Christain Municipal Dispensary*
18 D Nana Chowk Dispensary 106 L Chunnabhatti Dispensary
19 D R.S. Nimkar Marg Dispensary 107 L Himalaya Society Municipal Dispensary*
20 D Raja Rammohan Roy Marg Dispensary (R.R.R Marg)
108 L Kajupada Muncipal Dispensary
21 D Tardeo Flat Municipal Dispensary 109 L Mohill Village Dispensary
22 D Tulsiwadi Dispensary (Bane Compound) 110 L Nehru Nagar Dispensary
23 E D.P.Wadi Municipal Dispensary 111 L Qureshi Nagar Dispensary
24 E ES Pathanwala Municipal Dispensary 112 L Safad Pool Dispensary
25 E Gaurabhai Dispensary 113 L Tilak Nagar Dispensary
26 E Huzaria Street Dispensary 114 M/E Anik Nagar Dispensary*
27 E Motishah Dispensary 115 M/E Ayodhya Nagar Dispensary
28 E N.M. Joshi Marg Dispensary 116 M/E Deonar Colony Dispensary
29 E Nawab Tank Municipal Dispensary 117 M/E Gavanpada Dispensary
30 E R.J. Compound Dispensary* 118 M/E Kamala Raman Nagar Municipal Dispensary/Baiganwadi Dispensary
31 E Siddarth Nagar Dispensary 119 M/E Lallubhai Compound Municipal Dispensary*
32 E Souter Street Dispensary* 120 M/E Maharashtra Nagar Municipal Dispensary
33 E Tadwadi Municipal Dispensary 121 M/E R.B.K. International Municipal Dispensary*
34 E Tank Square Garden Municipal Dispensary
122 M/E Trombay Municipal Dispensary
35 F/N Antop Hill Municipal Dispensary 123 M/W Chembur Colony Dispensary

49
Sr. No. Ward Municipal Dispensaries
Sr. No. Ward Municipal Dispensaries
36 F/N Korba Mithagar Dispensary 124 M/W Chembur Naka Municipal Dispensary*
37 F/N L. B. Shastri Dispensary 125 M/W Labour Camp Dispensary
38 F/N Raoli Camp Dispensary 126 M/W Lal Dongar Dispensary
39 F/N Transit Camp Dispensary* 127 M/W Mahul Dispensary
40 F/N Wadala Dispensary 128 N Kirol Dispensary
41 F/S A.D. Marg Dispensary 129 N Pant Nagar Dispensary
42 F/S Abhyday Nagar Dispensary 130 N Parksite Dispensary
43 F/S Ambewadi Dispensary 131 N Parshiwadi Dispensary
44 F/S Gautam Nagar Dispensary 132 N Ramabai Colony Dispensary
45 F/S Kidwai Nagar Dispensary* 133 N Sainath Nagar Dispensary
46 F/S Naigaon Dispensary 134 N Sarvodaya Pantnagar Dispensary*
47 F/S Parel Dispensary 135 N Nath Pai Nagar, Garodia Nagar Dispensary (Started from June 2017)*
48 F/S Sewree Cross Road Dispensary 136 P/N Choksey Municipal Dispensary
49 F/S Triveni Sadan Dispensary 137 P/N Goshala Municipal Dispensary
50 G/N Dharavi Main Road Dispensary* 138 P/N Kurar Village Municipal Dispensary
51 G/N Dharavi Transit Camp Dispensary 139 P/N Malvani Municipal Dispensary
52 G/N Gulbai Dispensary 140 P/N Manori Dispensary
53 G/N Kumbharwada Dispensary 141 P/N Nimani Municipal Dispensary
54 G/N Matunga Labour camp Dispensary 142 P/N Pathanwadi Dispensary
55 G/N Pilla Bunglow Dispensary 143 P/N Riddhi Garden Mun Dispensary*
56 G/N Shahu Nagar Dispensary 144 P/N School Road Municipal Dispensary
57 G/N Welfare Camp (Shri Cinema) Dispensary 145 P/N Valnai Municipal Dispensary
58 G/N Welkarwadi Dispensary 146 P/S Chincholi Square Garden Dispensary*
59 G/S B.D.D. Chawl Dispensary 147 P/S Topiwala Lane Dispensary
60 G/S Beggar Home Dispensary 148 P/S Ram Mandir Road, Jogeshwari Dispensary (Purposed)*
61 G/S Curry Road Dispensary 149 R/C Charkop Sector 5 Dispensary
62 G/S Fergusson Road Dispensary 150 R/C Eksar Road Dispensary*
63 G/S Jijamata Nagar K. Moses Dispensary 151 R/C Gorai MHADA Dispensary
64 G/S Maharashtra High school Compound Dispensary
152 R/C Gorai Village Dispensary
65 G/S Prabhadevi Dispensary 123 R/C K.K. Municipal Dispensary
66 G/S Prbhadevi Ayurvedic Municipal Dispensary
153 R/C M.H.B. Dispensary
67 G/S Sasmira Dispensary 154 R/N
Anand Nagar Municipal Dispensary*

50
Sr. No. Ward Municipal Dispensaries
Sr. No. Ward Municipal Dispensaries
68 G/S Senapati Bapat Marg, Hilly Cross, 633 Dispensary
155 M/W Chembur Naka Municipal Dispensary*
69 G/S Welfare Center Dispensary 156 R/N L.T. Road Dispensary
70 G/S Worli Koliwada Dispensary* 157 R/N Shastri Nagar Municipal Dispensary*
71 G/S Zandu Ayurvedic Mun. Dispensary 158 R/N Y.R. Tawade Nagar Dispensary*
72 H/E Bharat Nagar Dispensary 159 R/S Akurli Road Municipal Dispensary
73 H/E Jawahar Nagar Dispensary 160 R/S Babrekar Nagar Municipal Dispensary
74 H/E Kalina Dispensary* 161 R/S Charcop Sector- I Muncipal Dispensary
75 H/E Kherwadi Dispensary 162 R/S Dahanuwadi Municipal Dispensary
76 H/E Kolekalyan Dispensary* 163 R/S Hanuman Nagar Dispensary*
77 H/E Prabhat Colony Municipal Dispensary 164 R/S Sambhaji Nagar Dispensary (Purposed)*
78 H/E S.V. Nagar Dispensary 165 S Kanjur Village Dispensary
79 H/W G.N. Station Road Dispensary 166 S M.V. R Shinde Dispensary
80 H/W Guru Nanak (Dr. Ambedkar Road) Dispensary
167 S Shivaji Talav Mumbai Dispensary*
81 H/W Khar-Danda Dispensary 168 S Tagor Nagar Dispensary
82 H/W Old Khar Dispensary* 169 S Tebhipada Shivaji Nagar Dispensary
H/W Shastri Nagar Linking Road Dispensary 170 S Tirandaz Village Dispensary
83 171 S Tulshetpada Dispensary
84 K/E Caves Road Dispensary 172 S Nahur East Dispensary (Purposed)*
85 K/E Gundawali Dispensary 173 T Dindayal Upadhyay (DDU) Dispensary
86 K/E Hari Nagar Dispensary 174 T Mulund Colony Dispensary*
87 K/E Koldongari Dispensary 175 T P.J.K. Dispensary
88 K/E Marol Dispensary
Note: (*) Upgraded dispensaries with laboratories. The total number of upgraded dispensaries is 33.

51
Annexure 2 – Registration of Birth and Death Act 1969
• Provides for registration of births and deaths and for matters connected.
• ‘Source of demographic data for socio-economic planning, development of health systems and
population control’ (as per 2012 Training Manual for Civil Registration Functionaries in India, Office of
Register General of India, Ministry of Home Affairs, Government of India).
Medical Certification of Causes of Death (MCCD)
In Maharashtra, on every 10th of the month, monthly reports are received at state office of Deputy Chief
Registrar of Birth and Death at Pune.
The strategy they follow:
• It is the duty of Registrar (in the case of Mumbai it is Executive Health Officer of MCGM), to ask about
form No.4 & 4A according to occurrence of death, while entering the death event.
• Deputy Director is responsible for compilation, coding & analysis of data received through MCCD
according to ICD (International Cause of Death) – 10 (http://www.who.int/whosis/icd10/).
Source: http://www.maha-arogya.gov.in/programs/other/sbhivs/strategy.htm
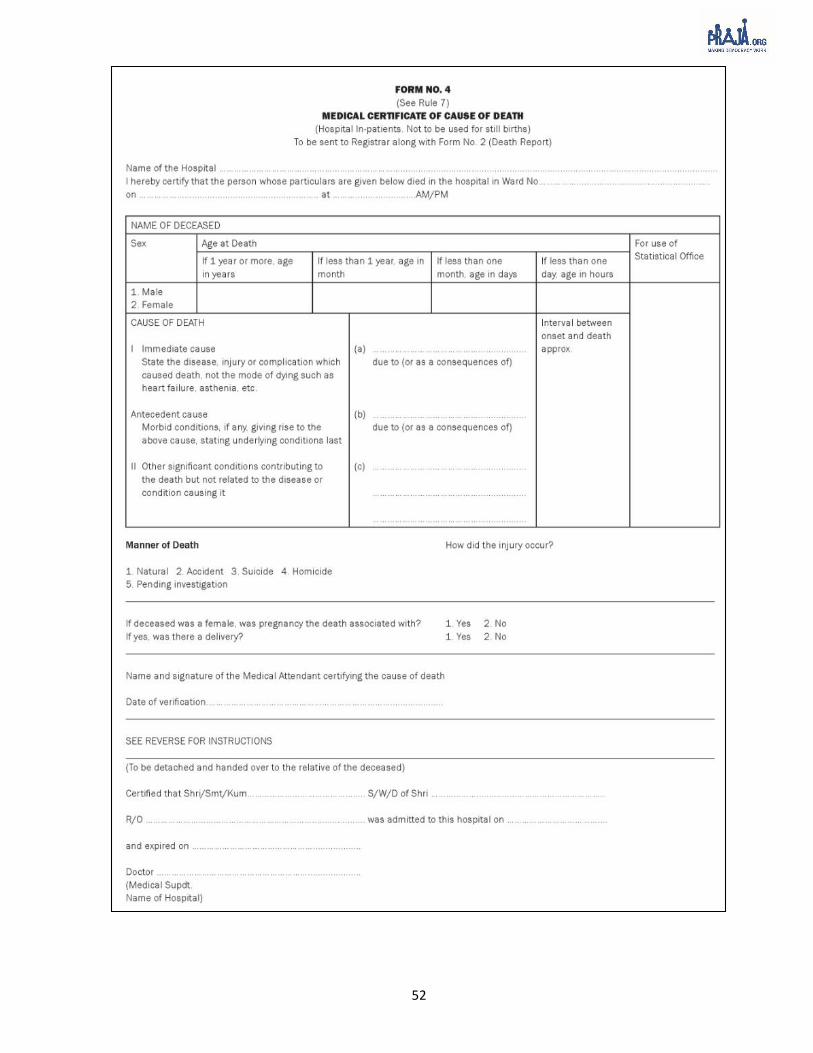
52

53
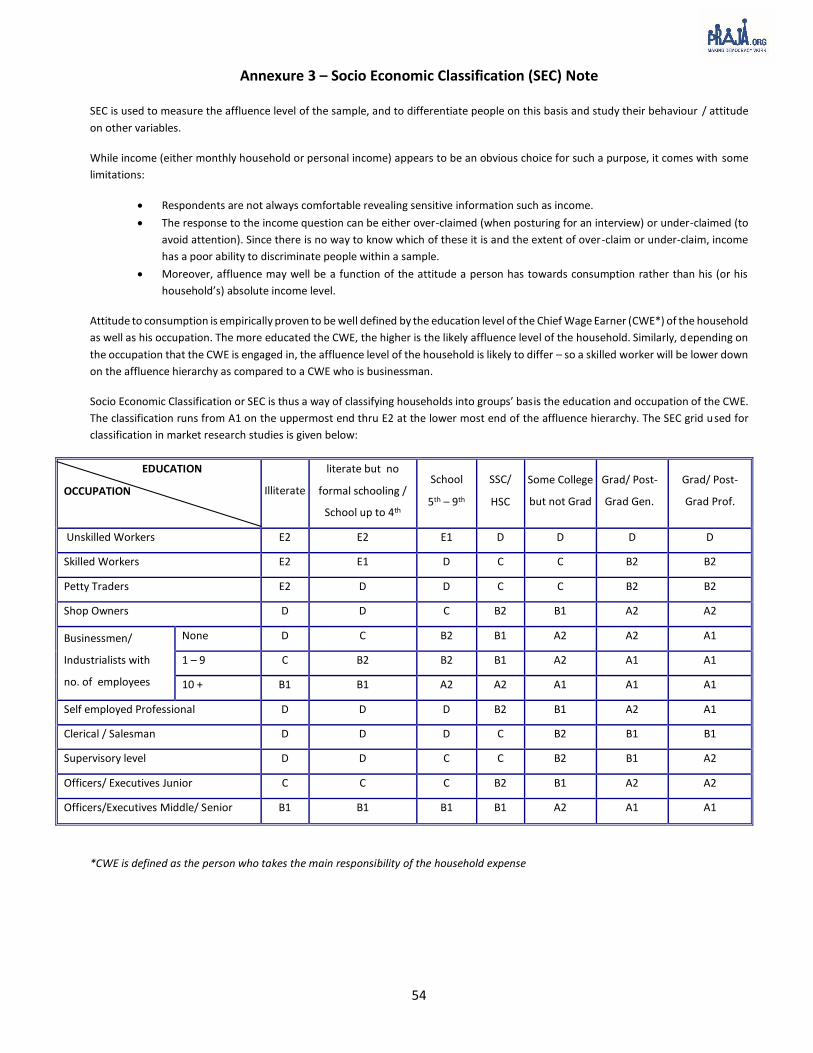
54
Annexure 3 – Socio Economic Classification (SEC) Note SEC is used to measure the affluence level of the sample, and to differentiate people on this basis and study their behaviour / attitude
on other variables.
While income (either monthly household or personal income) appears to be an obvious choice for such a purpose, it comes with some
limitations:
Respondents are not always comfortable revealing sensitive information such as income.
The response to the income question can be either over-claimed (when posturing for an interview) or under-claimed (to
avoid attention). Since there is no way to know which of these it is and the extent of over-claim or under-claim, income
has a poor ability to discriminate people within a sample.
Moreover, affluence may well be a function of the attitude a person has towards consumption rather than his (or his
household’s) absolute income level.
Attitude to consumption is empirically proven to be well defined by the education level of the Chief Wage Earner (CWE*) of the household
as well as his occupation. The more educated the CWE, the higher is the likely affluence level of the household. Similarly, depending on
the occupation that the CWE is engaged in, the affluence level of the household is likely to differ – so a skilled worker will be lower down
on the affluence hierarchy as compared to a CWE who is businessman.
Socio Economic Classification or SEC is thus a way of classifying households into groups’ basis the education and occupation of the CWE.
The classification runs from A1 on the uppermost end thru E2 at the lower most end of the affluence hierarchy. The SEC grid used for
classification in market research studies is given below:
EDUCATION
OCCUPATION Illiterate
literate but no
formal schooling /
School up to 4th
School
5th – 9th
SSC/
HSC
Some College
but not Grad
Grad/ Post-
Grad Gen.
Grad/ Post-
Grad Prof.
Unskilled Workers E2 E2 E1 D D D D
Skilled Workers E2 E1 D C C B2 B2
Petty Traders E2 D D C C B2 B2
Shop Owners D D C B2 B1 A2 A2
Businessmen/
Industrialists with
no. of employees
None D C B2 B1 A2 A2 A1
1 – 9 C B2 B2 B1 A2 A1 A1
10 + B1 B1 A2 A2 A1 A1 A1
Self employed Professional D D D B2 B1 A2 A1
Clerical / Salesman D D D C B2 B1 B1
Supervisory level D D C C B2 B1 A2
Officers/ Executives Junior C C C B2 B1 A2 A2
Officers/Executives Middle/ Senior B1 B1 B1 B1 A2 A1 A1
*CWE is defined as the person who takes the main responsibility of the household expense

55
Annexure 4 – Guidelines for dispensaries
Table 34: Ward wise dispensary requirements for dispensaries in MCGM
Ward Ward Name Population
census 2011 Dispensary (1 for 50,000)39
Dispensary (1 For 15,000)40
Available Municipal
Dispensaries
A Colaba 1,85,014 4 12 6
B Sandhurst 1,27,290 3 8 5
C Marine Lines 1,66,161 3 11 5
D Grant Road 3,46,886 7 23 6
E Byculla 3,93,286 8 26 12
F/N Matunga 5,29,034 11 35 6
F/S Parel 3,60,972 7 24 9
G/N Dadar 5,99,039 12 40 9
G/S Elphinstone 3,77,749 8 25 13
H/E Santa Cruz 5,57,239 11 37 7
H/W Bandra 3,07,581 6 21 5
K/E Andheri East 8,23,885 16 55 10
K/W Andheri West 7,48,688 15 50 7
L Kurla 9,02,225 18 60 13
M/E Govandi 8,07,720 16 54 9
M/W Chembur 4,11,893 8 27 5
N Ghatkopar 6,22,853 12 42 7
P/N Malad 9,41,366 19 63 10
P/S Goregaon 4,63,507 9 31 2
R/C Borivali 5,62,162 11 37 6
R/N Dahisar 4,31,368 9 29 4
R/S Kandivali 6,91,229 14 46 5
S Bhandup 7,43,783 15 50 7
T Mulund 3,41,463 7 23 3
Total 1,24,42,393 249 830 171
39 The Rindani committee report of 1977 suggested that there has to be one dispensary for a population of 50,000 or 1.5 km radius. 40 The National Urban Health Mission (NUHM) and National Building Code (NBC) suggests that one dispensary is required for a population of 15,000.

56
Annexure 5 – Letter from Senior Medical Officer M/E ward

57
Annexure 6 – Letter from Senior Medical officer of K/W ward

58
Annexure 7 – Process flow for Forecasting of Cause of Death data Extracted data for each ward: Praja had cause of death data age wise, ward wise, gender wise and ICD
code wise since 2010 to December 2015 of all 24 wards of MCGM. These were made available by the
sub-registrar of each ward. This data was extracted for forecasting values for cause of death for 15
months i.e. from January 2016 to March 2017.
Converted data into time series: Time series is used to extrapolate the information available in past
into future. This extracted data was converted into time series.
Checked the stationarity of the data: A stationary time series has properties wherein mean, variance
etc. are constant over time for data sets which are being extrapolated. Stationarity of the data was
checked and later this was transformed to make it stationary wherever required.
Treated data for outliers: This data was then treated for outliers. Outliers are observations that do not
fit into the tendency of time series observed as they differ dramatically from the patterns of the trends
of the data.
Model tested: Models tested for forecasting the cause of death data of 15 months (January 2016 to
March 2017) include Moving Average, Exponential Smoothing and Autoregressive Integrated Moving
Average (ARIMA).
ARIMA model was used for forecasting as the error terms were minimum: ARIMA was used for the
forecast as the errors noted were minimum. ARIMA41 models are, in theory, the most general class of
models for forecasting a time series which can be made to be “stationary” by differencing (if necessary),
perhaps in conjunction with nonlinear transformations such as logging or deflating (if necessary). A
random variable that in a time series is stationary if its statistical properties are all constant over time.
An ARIMA model can be viewed as a “filter” that tries to separate the signal from the noise, and the
signal is then extrapolated into the future to obtain forecasts.
This model considers trends and seasonality in data for forecasting values: Hence, for the forecast of
cause specific death, this model was best suited.
41 https://people.duke.edu/~rnau/411arim.htm