the state of education for columbus students preschool - college a briefing for mayor michael b....
TRANSCRIPT

The State of Education for Columbus StudentsPreschool - College
A briefing for Mayor Michael B. Coleman
Columbus City Council President Andrew Ginther
Honorable Eric Fingerhut, Vice President of Education and STEM Learning, Battelle
October 18, 2012Mark Real, KidsOhio.orgErika Braunginn, KidsOhio.org

KidsOhio.org2
Key Points
1. City of Columbus growth. 131,000 City of Columbus students attend 6 types of schools
2. Comparing students in Columbus City Schools and charter schools with the Ohio Urban 8 and suburban districts.
3. Academic achievement Kindergarten readiness 3rd grade reading
4. College readiness Remediation College graduation rates College graduates

KidsOhio.org3
The City of Columbus is growing, but the rate of growth is stronger in neighborhoods served by
suburban schools

KidsOhio.org4
Columbus City Planning to provide
Older Columbus,
Newer Columbus & Suburban
Franklin County,1950 and 2010
Franklin County population grew 40% from 833,000 in 1970 to 1,163,000 in 2010.

KidsOhio.org5
The City of Columbus is growing, while Cleveland and Cincinnati are shrinking
Columbus: 15th largest city in the country with a population nearing 800,000 in 2012. 1950 Columbus had a population of 350,000 and was the 28th largest
U.S. city. The city grew from 40 square miles to 233 square miles from 1950 to
2012.
Between 1950 and 2010, the Ohio Urban 8 lost 42% of its population. In that same time period, the population of Columbus City grew to nearly 800,000. Cleveland lost 57% of its population from 1950 (914,808 residents) to
2010 (396,815 residents). Cincinnati lost 41% of its population from 1950 (503,998 residents) to
2010 (296,943 residents).
U.S. Census 2010. City of Columbus, Development Department, Planning Division, 2012. Community Research Partners 2012.

KidsOhio.org6
City of Columbus boundaries include14 suburban school districts in four counties
City of Columbus, Development Department, Planning Division, 2012

KidsOhio.org7
Columbus growth neighborhoods served by Columbus City Schools are growing faster than those in 1950 Columbus
City of Columbus, Planning Division, 2012
Columbus 1950 boundary with Columbus City Schools
Columbus growth areas 1951-on with
Columbus City Schools
2000to
2010-6.2% 16.3%
• From 2000 to 2010, population declined in 1950 Columbus boundaries from 240,000 to 225,000, or 6.2%.
• In the Columbus growth area served by Columbus City Schools, the population rose from 238,000 to 277,000 from 2000 to 2010, or 16.3%.

KidsOhio.org8
More Columbus students attend suburban schools than Columbus City SchoolsCity neighborhoods served by suburban schools grew four times faster than neighborhoods served by Columbus City Schools.
The neighborhood school for 53,000 Columbus children is in one of 14 suburban school districts in four counties; 49,000 attend Columbus City Schools.
Between 2000 and 2010, the population in the Columbus City Schools part of the city grew from 478,000 to 502,000, or 5%.
Between 2000 and 2010, the population living in areas of the city served by a suburban district grew from 232,000 to 284,000, or 22%.
City of Columbus, Development Department, Planning Division, 2012
KidsOhio.org9
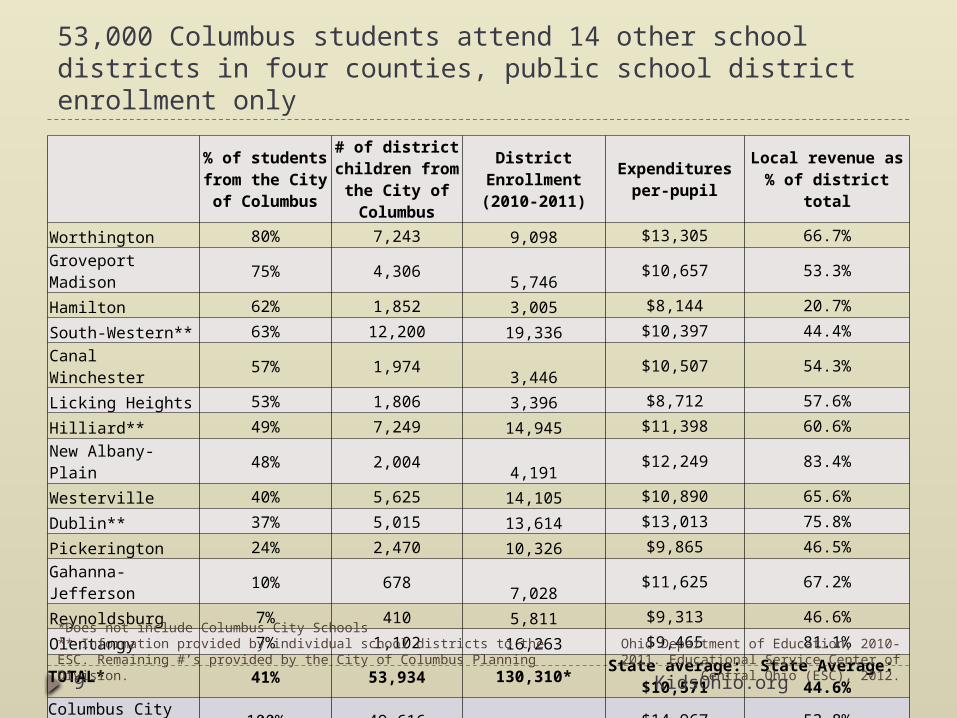
53,000 Columbus students attend 14 other school districts in four counties, public school district enrollment only
% of students from the City of Columbus
# of district children from the City of Columbus
District Enrollment (2010-2011)
Expenditures per-pupil
Local revenue as % of district total
Worthington 80% 7,243 9,098 $13,305 66.7%
Groveport Madison 75% 4,306 5,746 $10,657 53.3%
Hamilton 62% 1,852 3,005 $8,144 20.7%
South-Western** 63% 12,200 19,336 $10,397 44.4%
Canal Winchester 57% 1,974 3,446 $10,507 54.3%
Licking Heights 53% 1,806 3,396 $8,712 57.6%
Hilliard** 49% 7,249 14,945 $11,398 60.6%
New Albany-Plain 48% 2,004 4,191 $12,249 83.4%
Westerville 40% 5,625 14,105 $10,890 65.6%
Dublin** 37% 5,015 13,614 $13,013 75.8%
Pickerington 24% 2,470 10,326 $9,865 46.5%
Gahanna-Jefferson 10% 678 7,028 $11,625 67.2%
Reynoldsburg 7% 410 5,811 $9,313 46.6%
Olentangy 7% 1,102 16,263 $9,465 81.1%
TOTAL* 41% 53,934 130,310* State average: $10,571
State Average:44.6%
Columbus City Schools 100% 49,616 49,616 $14,967 53.8%
Ohio Department of Education, 2010-2011. Educational Service Center of Central Ohio
(ESC), 2012.
*Does not include Columbus City Schools** Information provided by individual school districts to the ESC. Remaining #’s provided by the City of Columbus Planning Division.

KidsOhio.org10
131,000 students in the City of Columbus attend 6 types of schools
Ohio Department of Education, 2011. Educational Service Center of Central Ohio, 2012.* Public charter, private, private with a voucher, and homeschool students are those who live in the area served by the Columbus City Schools serving Columbus children. Numbers are rounded to the nearest whole number.
14 Suburban Districts41%
Columbus City Schools38%
Pub-lic
Char-ter
Schools
10%
Pri-vate/Nonpub-lic
Schools
10%
Voucher2%
Homeschool0%
Percentage of Enrollment in Schools Serving City of Columbus Students
14 Suburban DistrictsColumbus City SchoolsPublic Charter SchoolsPrivate/Nonpublic SchoolsVoucherHomeschool

KidsOhio.org11
Where are the 131,000 children in Columbus going to school?
Ohio Department of Education, 2011. Educational Service Center of Central Ohio, 2012.* Public charter, private, private with a voucher, and homeschool students are those who live in the area served by the Columbus City Schools. Numbers are rounded to the nearest whole number.
Kind of School # of students enrolled
% of City of Columbus students
14 Suburban Districts 53,455 41%
Columbus City Schools 49,616 38%
Public Charter Schools 13,028 10%
Private/Nonpublic Schools 12,778 10%
Voucher 2,424 2%
Home Schooled 500 0%
TOTAL 131,801 100%

KidsOhio.org12
Number of publicly-funded students was stable; but more students enrolled in charter and voucher schools, fewer enrolled in Columbus / Columbus City Schools
Ohio Department of Education, 2012
Columbus Public
Schools60,088
Public Charters3,485
2004 Enrollment: 63,573
Columbus Public
Schools48,449
Public Char-ters
12,971
Voucher2,424
2012 Enrollment: 63,844
Columbus Public Schools
Public Char-ters
Voucher

KidsOhio.org13
Comparing students in Columbus City Schools and Columbus Public Charter schools with Ohio Urban 8
and Franklin County

KidsOhio.org14
District Enrollment:Columbus ranks #1 in the Ohio Urban 8 and Franklin County
School District Enrollment
1. Columbus 49,616
2.Cleveland 43,202
3. Cincinnati 32,009
4. Akron 22,603
5. Toledo 22,277
6. Dayton 14,174
7. Canton 9,750
8. Youngstown 6,088
Urban 8 199,719
State Average 2,812
Ohio Urban 8 Franklin County
School District Enrollment
1. Columbus 49,616
2. South-Western 19,336
3. Hilliard 14,945
4. Westerville 14,105
5. Dublin 13,614
6. Worthington 9,098
7. Gahanna-Jefferson 7,028
8. Reynoldsburg 5,811
9. Groveport Madison 5,746
10. Upper Arlington 5,542
11. New Albany-Plain 4,191
12. Canal Winchester 3,446
13. Hamilton Local 3,005
14. Whitehall 2,818
15. Bexley 2,130
16. Grandview Heights 1,092
Franklin County 161,523Ohio Department of Education, 2010-2011
Ohio’s Department of Education does not include 1,200 Columbus preschool students in enrollment.

KidsOhio.org15
7 of Ohio’s 15 districts with the largest student enrollments are in Central Ohio
Columbus (1st) – 49,616 South-Western (6th) – 19,336 Olentangy (8th) – 16,263 Hilliard (9th) – 14,945 Westerville (11th) – 14,105 Dublin (12th) – 13,614 Pickerington (15th) – 10,236
Ohio Department of Education, 2011

KidsOhio.org16
Percentage of economically disadvantaged district students: Columbus ranks #5 in Ohio Urban 8, #1 in Franklin County
School District % of Students Economically
Disadvantaged
1. Columbus 82%2. Whitehall 76%3. Hamilton Local 62%4. Groveport Madison 58%5. South-Western 55%6. Reynoldsburg 42%7. Westerville 28%8. Canal Winchester 27%9. Gahanna-Jefferson 26%10. Worthington 23%11. Hilliard 22%12. Grandview Heights 18%13. Dublin 14%14. Bexley 9%15. New Albany-Plain 7%16. Upper Arlington 1%Franklin County 47%
Ohio Urban 8 Franklin County
School District % of Students Economically
Disadvantaged
1. Cleveland 100%2. Dayton 93%3. Youngstown 91%4. Akron 85%5. Columbus 82%6. Canton 81%7. Toledo 77%8. Cincinnati 70%Urban 8 84%State Average 45%
Ohio Department of Education, 2010-2011
*11 of the 16 Franklin County districts have more than 20% economically disadvantaged students.
Economically disadvantaged students are eligible for free or reduced price school meals or other public aid programs.

KidsOhio.org17
Percentage of district students with special needs:Columbus ranks #6 in Ohio Urban 8, #2 in Franklin County
School District % of Students
w/Special Education Needs
1. Groveport Madison 17.3%
2. Columbus 17.1%3. Gahanna-Jefferson 15.3%
4. South-Western 14.5%
5. Whitehall 14.3%
6. Reynoldsburg 14.0%
7. Westerville 12.8%
8. Canal Winchester 12.4%
9. Worthington 11.8%
10. Grandview Heights 11.5%
11. Hilliard 11.4%
12. New Albany-Plain 11.3%
13. Bexley 10.8%
14. Hamilton Local 10.6%
15. Upper Arlington 8.8%
16. Dublin 8.7%
Franklin County 13.9%
Ohio Urban 8 Franklin County
School District % of Students
w/Special Education Needs
1. Cleveland 22.9%
2. Youngstown 21.8%
3. Cincinnati 21.0%
4. Dayton 19.8%
5. Akron 18.8%
6. Columbus 17.1%
7. Toledo 15.8%
8. Canton 15.7%
Urban 8 19.3%
State Average 14.8%
Ohio Department of Education, 2010-2011

KidsOhio.org18
Students with Special Needs in Columbus City Schools: Enrollment by Disability Type
Columbus City Schools: Enrollment by Disability Type, School Year 2010-2011
Disability Enrollment % of Total Enrollment
Specific Learning Disabilities 3,402 7%
Speech and Language Impairments 1,096 2%
Other Health Impaired – Minor 888 2%
Cognitive Disabilities 799 2%
Emotional Disturbances (SBH) 797 2%
Autism 413 1%
Multiple Disabilities (other than Deaf-Blind)
367 1%
Developmental Delay 248 1%
Deafness (hearing impairments) 219 0%
Orthopedic Impairments 88 0%
Traumatic Brain Injury (TBI) 79 0%
Visual Impairments 63 0%
Other Health Impaired – Major 15 0%
No Disability 41,142 83%Ohio Department of Education, 2011

KidsOhio.org19
Percentage of district students with Limited English Proficiency: Columbus ranks #1 in Ohio Urban 8, #3 in Franklin County
School District % of Students
w/Limited English Proficiency
1. Whitehall 13.1%
2. South-Western 10.9%
3. Columbus 9.7%4. Dublin 8.0%
5. Westerville 7.3%
6. Hilliard 7.3%
7. Reynoldsburg 4.9%
8. Worthington 4.8%
9. Groveport Madison 3.1%
10. Canal Winchester 2.5%
11. Gahanna-Jefferson 2.4%
12. New Albany-Plain 1.9%
13. Hamilton Local 1.1%
14. Upper Arlington 1.1%
15. Bexley 1.0%
16. Grandview Heights NC
Franklin County 13.9%
Ohio Urban 8 Franklin County
School District % of Students
w/Limited English Proficiency
1. Columbus 9.7%
2. Cleveland 6.1%
3. Cincinnati 3.7%
4. Akron 3.5%
5. Dayton 3.2%
6. Youngstown 2.9%
7. Toledo 1.5%
8. Canton 0.8%
Urban 8 5.2%
State Average 2.1%
Ohio Department of Education, 2010-2011
Immigrants are attracted by the strong Columbus economy.

KidsOhio.org20
What are Public Charter schools? Public Charter Schools
Must accept all students. Independent public schools subject to state audit,
governed by their own school board. Principals choose staff and hours of operation. Students required to take the same state
achievement tests as district students. Enrollment: 13,028 in Columbus, 19,332 in
Franklin County, nearly 100,000 in Ohio.
Ohio Association of Public Charter Schools, 2012. Ohio Department of Education, 2012.

KidsOhio.org21
What are Ohio’s private school voucher programs? Voucher-accepting Private Schools / Ohio EdChoice Program
Limited to students in “persistently underperforming district schools”.
Eligibility is based upon school report card rating, not the performance of individual students.
Students may apply to private schools; but need to meet the same admission standards as the other students.
Began in Ohio in 2006; as of 2011 vouchers were available in four other states and the District of Columbia.
Enrollment: 2,424 in Columbus schools, 2,539 in Franklin County, 20,228 in Ohio.
In Columbus, almost 20,000 students are eligible for vouchers for school year 2012-2013.
Two other voucher programs serve about 3,000 children statewide with special needs and autism.
Ohio Department of Education, 2012. School Choice Ohio, 2012.

KidsOhio.org22
Charter & voucher school enrollment:Columbus ranks #2 in Ohio Urban 8, #1 in Franklin County
School District Charter School Enrollment Voucher Enrollment Voucher and Charter
Enrollment
1. Columbus 13,028 2,424 24%2. South-Western 1,909 48 9%3. Groveport Madison 1,224 55 19%4. Westerville 544 0 4%5. Upper Arlington 532 0 9%6. Reynoldsburg 475 0 7%7. Whitehall 287 12 10%8. Hilliard 285 0 2%9. Gahanna 282 0 4%10. Hamilton Local 211 0 7%11. Worthington 185 0 2%12. Dublin 158 0 1%13. Canal Winchester 115 0 3%14. New Albany 62 0 1%15. Bexley 28 0 1%16. Grandview Heights 7 0 1%Franklin County 19,332 2,539 12%
Ohio Urban 8 Franklin County
School DistrictCharter School
Enrollment Voucher
Enrollment Voucher and
Charter Enrollment
1. Cleveland 14,310 5,026 23%
2. Columbus 13,028 2,424 24%3. Toledo 7,721 1,606 27%
4. Cincinnati 6,642 2,611 22%
5. Dayton 5,995 1,635 34%
6. Akron 3,218 551 14%
7. Youngstown 2,527 688 30%
8. Canton 593 220 7%
Urban 8 54,034 9,735 23%
Ohio Department of Education PASS Reports, 2011

KidsOhio.org23
Cincinnati Public Schools
Minneapolis Public Schools
Milwaukee Public Schools
Columbus City School District
Indianapolis Public Schools
Cleveland Metropolitan School District
Kansas City, Missouri School District
0% 5% 10% 15% 20% 25% 30% 35% 40%
Charter Enrollment as Percent of District Total
Charter schools enrollment in Columbus’ benchmark cities: Cities that have over 10% of their pubic school enrollment in charters
National Alliance for Public Charter Schools, October, 2011. Benchmark cities selected by Columbus 2020.

KidsOhio.org24
Demographics of Columbus students: District & Charter Schools
Demographic Columbus City Schools
Public Charter
Schools in Columbus
Economically Disadvantaged 82% 82%
Students w/Special Needs 17% 9%
Racial Minorities 73% 85%
Number of students 49,616 21,132
Ohio Department of Education, 2010-2011.*Charter schools in the City of Columbus served 21,132 but only 13,028 were residents living in areas served by the Columbus City Schools
Economically Disadvantaged
Students w/Special Needs
Racial Minority0%
10%
20%
30%
40%
50%
60%
70%
80%
90%
Student Demographics: Columbus City Schools & Charter Schools in Columbus
Columbus City Schools
Public Charter Schools in Columbus

KidsOhio.org25
Franklin County and Columbus children are diverse 47.5% of preschoolers in Franklin County are
children of color: 27.2% Black 9.3% Hispanic or Latino 8.1% Multiracial 4% Asian
Nearly half of Franklin County’s students of color are enrolled in a suburban school district.
73% of Columbus City Schools students are children of color, as are 85% of students in Columbus charter schools.
Action for Children/Community Research Partners, April 2012. KidsOhio.org, 2010

KidsOhio.org26
How are Columbus-area students achieving academically?
KidsOhio.org27
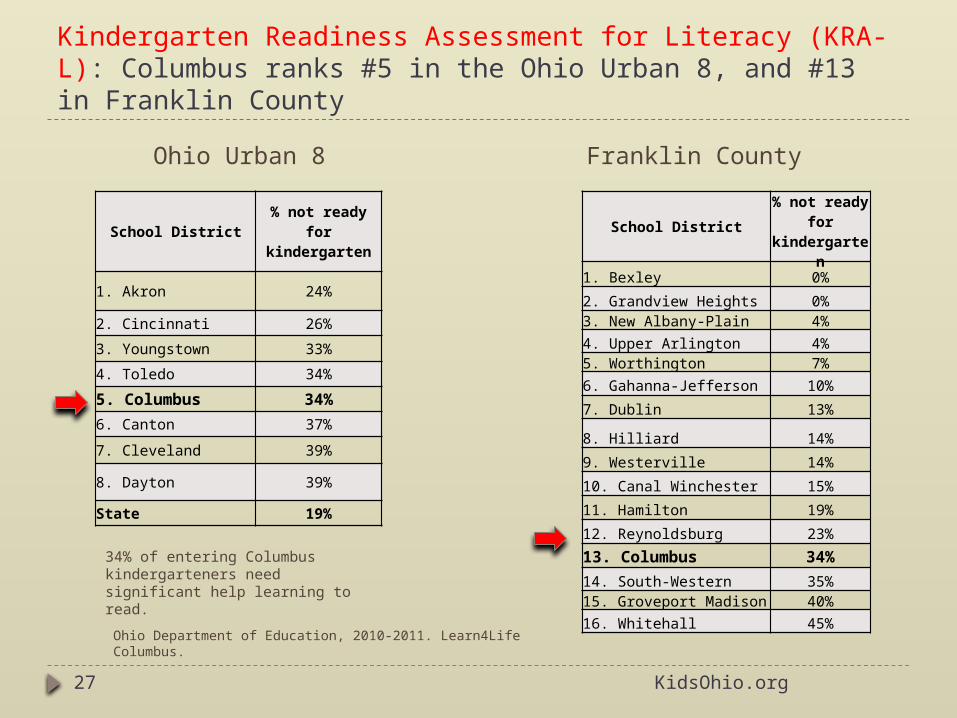
Kindergarten Readiness Assessment for Literacy (KRA-L): Columbus ranks #5 in the Ohio Urban 8, and #13 in Franklin County
School District % not ready for kindergarten
1. Akron 24%
2. Cincinnati 26%
3. Youngstown 33%
4. Toledo 34%
5. Columbus 34%
6. Canton 37%
7. Cleveland 39%
8. Dayton 39%
State 19%
Ohio Urban 8 Franklin County
School District% not ready
for kindergarten
1. Bexley 0%
2. Grandview Heights 0%3. New Albany-Plain 4%
4. Upper Arlington 4%5. Worthington 7%
6. Gahanna-Jefferson 10%
7. Dublin 13%
8. Hilliard 14%
9. Westerville 14%
10. Canal Winchester 15%
11. Hamilton 19%
12. Reynoldsburg 23%
13. Columbus 34%14. South-Western 35%15. Groveport Madison 40%
16. Whitehall 45%
Ohio Department of Education, 2010-2011. Learn4Life Columbus.
34% of entering Columbus kindergarteners need significant help learning to read.

KidsOhio.org28
Value of Preschool 87% of 4-year-olds whose mother has a
college degree are in a preschool. 55% of 4-year-olds whose mother is a high
school dropout are in a preschool. Columbus has efforts to improve kindergarten
readiness that include: Columbus Kids’ Ready, Set, Learn!, Learn4Life Columbus, United Way of Central Ohio, and Head Start preschool programs.
The RAND Corporation, 2012

KidsOhio.org29
Ohio’s 3rd Grade Reading Guarantee Students in grades K-3 were assessed by
September 30, 2012. Schools are now providing intervention for all
students identified as reading below grade level. State education officials say that this new law
aligns with Ohio’s Race to the Top plan to close achievement gaps, improve overall academic achievement, and increase college attendance.
Four Franklin County districts with poverty rates above 40% met the state standard rate of 75% passing.
If, by the end of third grade, a student is not assessed as reading at grade level, the student may be retained in third grade.
Ohio Department of Education, 2012.

KidsOhio.org30
Ohio 3rd grade reading assessment pass rates:Columbus ranks #5 in Ohio Urban 8, #16 in Franklin County
School District % Passed
1. New Albany 94%
2. Grandview Heights 93%
3. Upper Arlington 93%
4. Bexley 91%
5. Dublin 91%
6. Worthington 91%
7. Westerville 90%
8. Gahanna 89%
9. Hilliard 88%
10. Canal Winchester 84%
11. Reynoldsburg* 84%
12. Hamilton Local* 80%
13. Groveport Madison* 78%
14. South-Western* 75%
15. Whitehall* 65%
16. Columbus* 61%
Franklin County 78%
Ohio Urban 8 Franklin County
School District% Passed the 3rd
Grade Reading Assessment
1. Cincinnati 70%
2. Toledo 69%
3. Akron 67%
4. Canton 66%
5. Columbus 61%6. Youngstown 59%
7. Cleveland 55%
8. Dayton 55%
Urban 8 63%
State of Ohio 80%
Ohio Department of Education, 2010-2011
*40% or more of students are economically disadvantaged

KidsOhio.org31
Ohio's Third Grade Reading Test:Proficiency Levels of Columbus City Schools Compared to Charter Schools in Columbus
Ohio Department of Education, 2011.*Brick and mortar charter schools in Columbus
Public Charter Schools in Columbus
• Schools w/third grade: 28• Total third grade test takers:
913• Pass rate: 65.7%
Columbus City Schools• Schools w/third grade: 75• Total third grade test takers:
3,581 • Pass rate: 61%
Did not pass Passed
State standard is 75% of students scoring “proficient” or above.Limited Basic Proficient Accelerated Advanced
0.0%
5.0%
10.0%
15.0%
20.0%
25.0%
30.0%
Percentage of Students Achieving at each Proficiency Level for Third Grade Reading
Columbus City Schools
Public Charter Schools*

KidsOhio.org32
3rd Grade Reading Test in 15 districts attended by City of Columbus students:Percent of Economically Disadvantaged students passing
% Economically Disadvantaged third graders
% of Economically Disadvantaged
students passing the 3rd grade reading assessment
% of students not Economically
Disadvantaged passing the 3rd grade reading
assessment
Gap in percentage points between Economically and not-Economically-
Disadvantaged students
% of all students passing the 3rd grade reading assessment
Pickerington 20% 83% 89% 6 87%
Gahanna-Jefferson 29% 79% 93% 14 89%
Westerville 34% 79% 95% 16 90%
Worthington 27% 79% 95% 16 91%
Hamilton Local 74% 77% 87% 10 80%
Oletangy 7% 77% 96% 19 95%
Licking Heights 44% 76% 86% 10 82%
New Albany 7% 76% 95% 19 94%
Reynoldsburg 45% 76% 90% 14 84%
Canal Winchester 31% 74% 88% 14 84%
Dublin 15% 74% 94% 20 91%
Groveport Madison 64% 72% 87% 15 78%
Hilliard 24% 71% 93% 22 88%
South-Western 61% 67% 87% 20 75%
Columbus City Schools 84% 57% 82% 25 61%*State passing rate = 75% of students scoring proficient or above. Ohio's Race to the Top goals include "reducing performance gaps by 50%”**Numbers are for all students enrolled in the districts, not just the students living in the City of Columbus and attending a suburban district.

KidsOhio.org33
Performance Index rankings:Columbus ranks #5 in Ohio Urban 8, #16 in Franklin County
School District Performance Index
Score Rank out of 611 districts
1. Dublin 36
2. Upper Arlington 40
3. New Albany-Plain 44
4. Grandview Heights 58
5. Bexley 66
6. Hilliard 113
7. Worthington 127
8. Westerville 171
9. Gahanna-Jefferson 201
10. Canal Winchester 232
11. Reynoldsburg 249
12. Hamilton Local 429
13. South-Western 515
14. Groveport Madison 550
15. Whitehall 581
16. Columbus 600
Ohio Urban 8 Franklin County
School District Performance
Index Score Rank out of 611
1. Cincinnati 584
2. Akron 592
3. Canton 593
4. Toledo 596
5. Columbus 600
6. Dayton 607
7. Cleveland 608
8. Youngstown 610
Ohio Department of Education, 2010-2011
Performance Index: A composite of student performance on all state tests.

KidsOhio.org34
Graduation rates:Columbus ranks #5 in Ohio Urban 8, #16 in Franklin County
School District Graduation Rate*
1. New Albany-Plain 98.5%
2. Bexley 98.2%
3. Dublin 98.2%
4. Grandview Heights 98.0%
5. Upper Arlington 97.9%
6. Canal Winchester 97.4%
7. Reynoldsburg 97.0%
8. Worthington 95.0%
9. Gahanna-Jefferson 94.9%
10. Hilliard 94.9%
11. Hamilton Local 93.5%
12. Westerville 93.3%
13. Whitehall 90.4%
14. South-Western 88.5%
15. Groveport Madison 87.8%
16. Columbus 77.6%
Ohio Urban 8 Franklin County
School District Graduation Rate*
1. Dayton 84.4%2. Cincinnati 81.9%3. Toledo 80.5%4. Canton 80.1%5. Columbus 77.6%6. Akron 76.4%7. Youngstown 67.8%8. Cleveland 62.8%State 84.3%
Ohio Department of Education, 2010 – there is a one-year lag in graduation rates.
*This is the five-year graduation rate.

KidsOhio.org35
Student Enrollment:Number of students in Columbus City Schools by grade level and number of graduates
Grade Level Enrollment
Kindergarten 4,4851st Grade 4,3362nd Grade 4,2323rd Grade 4,2484th Grade 4,1595th Grade 4,0846th Grade 3,6547th Grade 3,5738th Grade 3,5629th Grade 4,67110th Grade 3,62911th Grade 3,33412th Grade 2,913Graduates(4-year) 2,798
Kindergarten
1st Grade
2nd Grade
3rd Grade
4th Grade
5th Grade
6th Grade
7th Grade
8th Grade
9th Grade
10th Grade
11th Grade
12th Grade
0
500
1,000
1,500
2,000
2,500
3,000
3,500
4,000
4,500
5,000
Enrollment in Columbus City Schools by Grade 2009-2010
Ohio Department of Education, 2009-2010

KidsOhio.org36
Measurable academic goals Measurable academic goals
Columbus City Schools goals for 2013 Increase graduation rate to 90%, up from 77.6% in
2010. 75% of 4th graders will pass the state reading
assessment, up from 67% in 2011. 69.7% of 4th graders will pass the state math
assessment, up from 59.4% in 2011. 75% of 8th graders will pass the state reading
assessment, up from 69% in 2011. 68.2% of 8th graders will pass the state math
assessment, up from 47.4% in 2011.
Columbus City Schools, 2012

KidsOhio.org37
New Common Core State Academic Standards for pre-K - 12 These standards were developed by state and
local officials on a voluntary basis. The standards are intended to be fewer,
clearer, and deeper. Schools are now implementing these
standards. Beginning in 2014, state tests will be more
challenging. In 2014, the state report card will likely have a
more rigorous grading system.
Ohio Department of Education, 2012
KidsOhio.org38
College Readiness in Columbus

KidsOhio.org39
College Readiness, Mean ACT score:Columbus ranks #5 in Ohio Urban 8, #16 in Franklin County
School District Mean ACT Score(scale 1-36)
1. Upper Arlington 26
2. Bexley 25
3. Dublin 25
4. Grandview Heights 25
5. Worthington 25
6. New Albany-Plain 24
7. Hilliard 23
8. Gahanna-Jefferson 22
9. South-Western 22
10. Westerville 22
11. Canal Winchester 21
12. Reynoldsburg 21
13. Hamilton Local 20
14. Groveport Madison 19
15. Whitehall 18
16. Columbus 17
Ohio Urban 8 Franklin County
School District Mean ACT Score (scale 1-36)
1. Akron 19
2. Cincinnati 19
3. Canton 18
4. Toledo 18
5. Columbus 17
6. Dayton 17
7. Youngstown 17
8. Cleveland 16
Statewide 21.8
Ohio Department of Education, 2009-2010. ACT.
ACT test results are one key predictor of college success. An ACT score report includes scores for each of the four subject-area tests (English, Mathematics, Reading, and Science). Scores range from 0-36.

KidsOhio.org40
Ohio’s College Readiness compared to the U.S.: ACT composite score of the top 10 ranking states, Ohio ranks #7
ACT Composite Scores by State, 2012
State Average Composite Score
% of Graduates Tested
1. Minnesota 22.8 74%
2. Iowa 22.1 63%
3. Wisconsin 22.1 71%
4. Montana 22.0 61%
5. Nebraska 22.0 78%
6. Kansas 21.9 81%
7. Ohio 21.8 71%
8. South Dakota 21.8 81%
9. Idaho 21.6 67%
10. Missouri 21.6 75%
Minnesota Office of Higher Education, 2012
*28 states had 50% or more of graduates take the ACT.

KidsOhio.org41
Local educators lead effort to increase the number of adults with 2-year degrees
Central Ohio Compact, educators and community leaders have set goals: Increase the percentage of Franklin County adults who
have earned a certificate, such as nursing, or an associate’s degree from 44% to 60% by 2025.
Improve college readiness by integrating high school and college curriculum and encouraging more high school students to earn college credit while in high school.
High school graduates who are prepared for college-level work without remediation are more likely to succeed in and complete college.
The majority of students taking remedial courses do not complete these courses or college.Columbus State Community College, 2012

KidsOhio.org42
Percent of entering college students taking remedial math or English in Ohio:Columbus ranks #4 in Ohio Urban 8, #16 in Franklin County
School District
% Taking Remedial Math or English
(students enrolled in public colleges in Ohio)
1. Upper Arlington 16%2. Bexley 19%3. Dublin 20%4. New Albany-Plain 23%5. Worthington 23%6. Grandview Heights 27%7. Westerville 36%8. Hilliard 42%9. Reynoldsburg 42%10. Canal Winchester 43%11. Gahanna-Jefferson 43%12. South-Western 51%13. Groveport Madison 57%14. Hamilton Local 63%15. Whitehall 64%16. Columbus 65%
Ohio Urban 8 Franklin County
School District
% Taking Remedial Math or English
(students enrolled in public colleges)
1. Cincinnati 41%
2. Akron 52%
3. Canton 64%
4. Columbus 65%
5. Toledo 65%
6. Dayton 68%
7. Youngstown 73%
8. Cleveland 80%
Statewide 41%
Ohio Board of Regents: Fall 2007
Students entering a post-secondary institution are required to take remediation classes when they are assessed below grade level in a specific subject. The students must pay college-level tuition to take these courses.

KidsOhio.org43
National comparison:How do Ohio students compare with the U.S. average?
National Assessment of Educational Progress: Math data is from 2011, Reading data is from 2011, Science data is from 2011 for grade 8 and from 2009 for grade 4, Writing data is from 2002 for grade 4 and 2007 for grade 8.
National Assessment of
Education ProgressOhio’s score
U.S. Average(public schools
only)
4th grade math (scale 0-500)
244 239
4th grade reading (scale 0-500)
226 220
4th grade science (scale 0-300)
157 149
4th grade writing (scale 0-300)
157 153
8th grade math (scale 0-500)
289 283
8th grade reading (scale 0-500)
268 264
8th grade science (scale 0-300)
158 151
8th grade writing (scale 0-300)
156 154
Ohio’s 4th and 8th graders scored slightly higher than the national average on all four of the National Assessment of Education Progress assessments: math, reading, science, and writing.

KidsOhio.org44
Adults with a 2-year or 4-year degree or higher:Columbus ranks #9 out of 16 benchmarked cities, 15 percentage points lower in 2-year degrees and 14 percentage points lower in 4-year degrees than Raleigh
City% of adults with 2-year degrees or
higher% of adults with 4-year degrees or
higher
1. Raleigh 54% 46%
2. Minneapolis 52% 45%
3. Austin 49% 44%
4. Portland 49% 42%
5. San Diego 49% 40%
6. Charlotte 45% 39%
7. Nashville 40% 34%
8. Chicago 39% 33%
9. Columbus 39% 32%
10. Cincinnati 38% 31%
11. Louisville 34% 27%12. Indianapolis 34% 27%
13. Jacksonville 33% 24%
14. Milwaukee 27% 21%
15. Kansas City 21% 15%
16. Cleveland 20% 13%United States 36% 28%
U.S. Census, 2010. Percentage rounded to nearest whole number. Benchmark cities selected by Columbus 2020.

KidsOhio.org45
International comparison:How do U.S. students compare with the other G-8 Nations?
National Center for Education Statistics, Institute of Education Sciences: Comparative Indicators of Education in the United State and Other G-8 Countries: 2011.
G-8 countries include: Canada, France, Germany, Italy, Japan, Russian Federation, United Kingdom, United States.

KidsOhio.org46
Summary
1. City of Columbus growth. 131,000 City of Columbus students attend 6 types of schools
2. Comparing students in Columbus City Schools and charter schools with the Ohio Urban 8 and suburban districts.
3. Academic achievement Kindergarten readiness 3rd grade reading
4. College readiness Remediation College graduation rates College graduates

KidsOhio.org47
Summary – City of Columbus growth City of Columbus growth. The City of Columbus grew
from 350,000 people in 40 square miles in 1950 to nearly 800,000 people in 233 square miles in 2012. The population in the area of Columbus served by Columbus City Schools grew by 5% from 2000 to 2010 while the population in areas in Columbus served by suburban schools grew by 22%, or four times faster. 53,000 students living in Columbus attend 14 suburban districts and 49,000 attend Columbus City Schools (CCS).
131,000 City of Columbus students attend 6 types of schools. 40% attend suburban district schools, 38% attend CCS, 10% attend public charter schools, 10% attend private/nonpublic schools, 2% use vouchers, and 500 are home-schooled.

KidsOhio.org48
Summary – Columbus City Schools, Ohio Urban 8 and suburban districts Diversity. Franklin County is growing more diverse: 47% of
preschool children in Franklin County are children of color; nearly half of Franklin County’s K-12 students of color attend a suburban school district.
Economically disadvantaged students. In 11 suburban districts, more than 20% of students are economically disadvantaged. Statewide, the rate grew from 35% in 2006 to 45% in 2011. CCS’s rate is 82%.
Students with special needs. 15% of Ohio students have a special education need. In Franklin County, rates range from 9% in Dublin City Schools to 17% in CCS.
English Language Learners. 2.1% of Ohio students are English Language Learners; 11 Franklin County districts have rates above the state average; 9.7% of CCS’s students are English Language Learners and the district ranks third in Franklin County.
Public charter schools. Charter school students in Columbus have the same high rate of poverty (82%) as CCS students and more charter school students are children of color.

KidsOhio.org49
Summary – Academic achievement Kindergarten readiness. 19% of Ohio preschool
children are unprepared for kindergarten; in CCS, it is 34%.
3rd grade reading. Ohio’s new 3rd grade reading guarantee requires that students be assessed in grades K-3 and helped so they do not have to repeat 3rd grade; 61% of CCS 3rd graders passed the 3rd grade reading test compared to 80% statewide, 78% in Franklin County, and 65% in Columbus charter schools. 57% of economically disadvantaged 3rd graders passed in CCS, the lowest rate among the 15 districts attended by Columbus students.

KidsOhio.org50
Summary – College readiness College readiness. CCS’s students’ average ACT
score was 17; the average statewide score was 21.8. Remediation. 41% of students entering a public
college in Ohio had to take remedial math or English; graduates in 9 Franklin County districts have rates above the state average, led by CCS at 65%.
High school graduation rate. The statewide graduation rate was 84.3%; CCS had a rate of 77.6% in 2010 and ranked 5th among the Ohio Urban 8 and 16th among Franklin County districts.
College graduates. 39% of Columbus adults earned a 2-year degree or higher; Columbus ranks 9th among 16 benchmark cities selected by Columbus 2020.

KidsOhio.org51
Thank you
This presentation and other education information are available at www.KidsOhio.org