the state of dutch banks in 2015 - kpmg us llp · the state of dutch banks in 2015 . adjusting to...
TRANSCRIPT

© 2015 KPMG Adsisory N.V.
ADVISORY
The state of Dutch banks in 2015
Adjusting to the new reality
An update of the 2012 study on the cumulative impact
of regulation on the Dutch banking sector
FINANCIAL SERVICES

Regulators and politicians have rightly designed and implemented new measures and frameworks aimed at improving the banking industry and its robustness. The effects are beginning to show. At the same time, new measures come at a cost to the economy and society at large: bank loans have become more expensive, lending products are being rationalized and the available lending capacity of banks is under pressure.
Unlike countries such as the US that enjoy the benefits of an active and diversified capital market, Dutch banks have always been the predominant if not only financing source for consumers and SMEs and smaller corporations (large corporates are able to tap the capital markets). The harsh reality is that, although new funding solutions from non-traditional players have recently emerged, considering the limited capacity these initiatives offer, there are still no real alternatives to bank lending at this particular point in time, especially for SMEs and smaller corporates. Until new alternatives have matured and gained in market relevance, banks will continue to be of critical importance to the Dutch economy and its’ growth prospects. So in addition to ensuring that the banking sector is safe and operates within a sound regulatory environment, we also need to monitor if banks can keep up with the demand for credit in this new post-crisis regulatory regime. Failing to do so would put growth constraints on the still fragile and recovering economy.
The banking debate is far from over. History has shown that regulatory reform was necessary. Banks will have to take their responsibility, and credibility and confidence need to be restored. At the same time as a society we need to consider that without real alternatives it is important to find a careful balance between reform (pace, quantity and complexity) and the role banks are expected to play in our economy. As it relates to credit, many of our clients (private or public domain) are exclusively dependent from banks for their businesses and increasingly we see that obtaining a corporate loan is not as straight forward as it used to be. By providing quantitative context to several regulatory and accounting changes relevant to the sector we hope this report will contribute to a balanced debate going forward.
July 2015
© 2015 KPMG Advisory
The state of Dutch banks in 2015 | 2
© 2015 KPMG Advisory
Preface
A special thank you goes out to the co-authors of this report: Murat Bozdemir, director Risk Consulting, Siebe Groenveld, Associate Director Deal Advisory and Romain Wigny, Associate Deal Advisory.
The state of Dutch banks in 2015 | 3The state of Dutch banks in 2015 | 2
Ferdinand Veenman Head of Debt Advisory and Head of Banking
Carola SteenmeijerPartner Risk Consulting
Roland SmeetsHead of National Practice
Anna van PouckeHead of Healthcare
The state of Dutch banks in 2015 | 5
Contents
Executive summary 6
1 Introduction and 2012 conclusions 10
2.1 Dutch banks now meet their target ratios but at a cost 12 2.2 De-leveraging occurred at a greater rate than expected 13 2.3 Capital ratios significantly improved due to de-leveraging, de-risking and retention of earnings 16 2.4 Liquidity Coverage Ratios already well above minimum requirements 16 2.5 Profitability recovered 17
3.1 Key challenges facing the sector 18 3.2 Impact of a potential higher target leverage ratio 19 3.3 Introducing an maximum asset encumbrance ratio 20 3.4 The European Banking Union: challenges & opportunities ahead 20 3.5 Change in IFRS accounting rules forces banks to alter view of losses 22 3.6 There’s more to come: 24 3.6.1 Revisions to the standardised approach for credit risk 24 3.6.2 Bail-in: MREL & TLAC 25 3.7 The impact of a sudden implementation of all the new regulations 26 3.8 The impact of a gradual implementation of all the new regulations 28
2 The state of Dutch banks in 2015 12
3 Outlook 18
Abbreviations 30
Publications 31
The state of Dutch banks in 2015 | 4
© 2015 KPMG Adsisory N.V.© 2015 KPMG Advisory N.V.

© 2015 KPMG Adsisory N.V.© 2015 KPMG Advisory N.V.
The state of Dutch banks in 2015 | 6
Executive summary
The state of Dutch banks in 2015 | 7
This 2015 impact analysis report is a follow-up to the 2012 “Cumulative effect of Regulatory changes in the Dutch banking sector” report which was commissioned by the Dutch employers’ organisation VNO/NCW. Its objective was to identify how the new regulatory framework might affect availability and cost of credit for consumers and businesses.
For that purpose, KPMG developed a financial model in 2012 that estimated the potential effects of one single measure and the likely effects of all measures combined at a consolidated level. It proved to be a useful tool to help frame the financial dimensions of various regulatory and accounting measures. Although crude in its design, the model provided valuable insights into the likely impact of a single measure and in the effect of the measures combined.
This 2015 impact analysis report was initiated by KPMG in order to assess whether and to what extent the 2012 report expectations actually had materialized and to assess the impact of the new regulatory measures on the Dutch banking sector since 2012.
Main conclusions of the 2015 impact analysis report:
1. Development of the Dutch banking sector is consistent with the 2012 report:
1. Capital ratios have improved significantly as a result of retained earnings and a decrease in risk weighted assets;
2. The consolidated balance sheet capacity of Dutch banks has decreased by € 220 Bn (10%) whereas a reduction of € 200 Bn (9%) was expected;
3. Banks have been able to meet minimum LCR and NSFR requirements as expected;
4. The Cost Income ratio has been neutral to negative for most banks;
5. ROE (“Return on Equity”) has decreased to below 2011 levels for most banks and are well below historical industry levels.
The state of Dutch banks in 2015 | 6
© 2015 KPMG Advisory N.V. © 2015 KPMG Adsisory N.V.
The state of Dutch banks in 2015 | 8
At first sight, the outcome is a positive one because capital ratios have improved and banks are compliant with NSFR and LCR requirements. Yet, looking closer, it appears that improvements have been achieved through asset reduction (although non-core) and retention of earnings instead of new capital raising. This, combined with the still high cost structure of banks and a lack of revenue growth, will affect the long-term viability of banks, especially when the impact of a potentially higher Leverage Ratio, the Single Resolution Fund, the Single Deposit Guarantee System, the increased cost of supervision and IFRS 9 is taken into account.
2. New regulatory and accounting measures will affect bank operating models
The second section of the 2015 report describes the context of the measures and gives an analysis of one-off effects (as if implemented on the 2014 figures). It concludes that without balance sheet adjustments, significant cost reductions and/or margin increases, the consolidated core tier 1 capital (“CET1”) amount will decrease by 11.1 Bn or 12.8%. If the leverage ratio is also raised to 4% (instead of 3% as is currently the case), this can only be achieved by raising additional capital or further asset reductions (110 Bn or 5.0% of current balance sheet size). Should all measures be implemented suddenly and instantaneously, the sector’s profitability would be reduced to close to or below zero. In either scenario, Dutch banks need to adjust their operating model to the new reality. This will undoubtedly lead to:
1. An increase in capital requirements;
2. Smaller balance sheets (and hence reduced lending and earnings capacity);
3. Higher margins for consumers and businesses on loans and bank services;
4. Significant and vigorous cost reduction programmes by banks to adjust to less earnings capabilities;
5. An RoE level that is still below historical levels and below the expected cost of capital.
There’s more to come…
The effects of the BCBS document “Revisions to the standardised approach for credit risk”, currently under consultation, have not been included in the analysis. If the proposed language is fully accepted, KPMG estimates an additional requirement of approx. 6 Bn for CET 1 capital for the Dutch banking sector, based on an average mortgage portfolio with an LTV of 82% and Debt Servicing Capacity Ratio (DSCR) of <35%, assuming that the revised SA would be the floor for IRB banks. The average risk weight of Dutch mortgages portfolio based on the current SA is 30% (considering the risk mitigating effect of mortgages guaranteed by the Nationale Hypotheek Garantie). Under the revised SA, the average risk weight for assets would increase to 40%-a 33% increase or 10 percentage points compared to the current situation.
Also bail-in regulations such as MREL and TLAC although they have not been finalized yet are expected to result into a higher cost of capital for the banks.
The state of Dutch banks in 2015 | 9
ConclusionOver the past two years, Dutch banks have managed to improve their capital ratios. Driven by a low demand for credit and the disposal of non-core activities, banks have been de-risking and de-leveraging their balance sheets. During the same period, however, Dutch banks have not managed to restore profitability to pre-crisis levels. Income has decreased as a result of the decreasing balance sheets, while costs have been high due to restructuring, increased regulation and loan impairments.
Although banks have improved their capital ratios, the current low level of profitability combined with additional regulatory reform has given rise to new challenges. As the leverage ratio limits balance sheet growth, banks may restore profitability by investing in riskier assets and by further increasing the cost of credit. The extent to which banks will increase the cost of credit will depend largely on their ability to lower their cost structures. In the KPMG scenario analysis, the cost of credit is expected to increase by between 20bps and 45bps, assuming that banks are able to achieve targeted cost reductions and reduce loan impairments.
By increasing the cost of credit, the restoration of profitability in the Dutch financial sector will come at a price for the real economy. Moreover, it remains to be seen whether banks will be able to support full economic recovery. If the target leverage ratio is set at 4% and the economy fully recovers, banks will need to raise additional capital. In such a scenario, the availability and accessibility of alternative financing sources may become vital for Dutch corporates.

© 2015 KPMG Advisory N.V. © 2015 KPMG Adsisory N.V.
The state of Dutch banks in 2015 | 10 The state of Dutch banks in 2015 | 11
In 2012, KPMG Advisory performed an assessment of the effects of cumulated regulation on the Dutch banking services sector. The assessment was initiated by the Confederation of Netherlands Industry and Employers (“VNO-NCW”) and showed the analysis of 38 new rules and initiatives which were to be levied on the Dutch banking sector. The purpose of the assessment was to provide insight into the potential impact of new regulations, in particular on the lending capacity of banks and hence their capacity to finance the Dutch economy.
The 2012 study showed that the new regulations would negatively impact every aspect of bank operations.
• Banks would have to hold substantially more capital, precisely in a period when capital market financing was under pressure and bank performance was relatively weak;
• Banks would face higher cost of funding as they would be forced to fund at longer tenors due to tighter liquidity matching, and
• All the new legislation combined would result in a structural increase in reporting requirements, leading to increased pressure on organisational and operational costs.
The study concluded that if banks were not making any changes in their operating models or service offerings, the combined effects of new regulations would result in non-compliance with the regulatory and/or market-imposed (minimum) requirements set for 2015.
The analysis showed that cost cutting measures would not suffice to comply with the requirements and that it would be very difficult (if not impossible) to find new shareholders in the 2012 market conditions.
1 The defined target ratios were: Core Tier 1 Ratio, Leverage Ratio, Net Stable Funding Ratio, Liquidity Coverage Ratio, Return on Equity, Cost to Income Ratio.
1 Introduction and2012 conclusions
In KPMG’s view, the only solution would be to deleverage the balance sheet, re-price new loans and attract long-term financing to replace the so-called unsecured short-term financing, or take similar measures.
In this update of the 2012 study, KPMG performed an analysis based on the 2014
financial results to assess the position of the largest Dutch banks and six target ratios1. Over the last two years, there were no major changes in the relative size of these banks; ING, Rabobank and ABN AMRO still dominate the Dutch banking landscape. Hence, a fair comparison can be made with the state of Dutch banks in 2012.
The state of Dutch banks in 2015 | 10
Source: Annual reports
ING
ABN AMRO
Rabobank
SNS Bank
NIBC
Van Lanschot
41%43%
19%18%
34%33%
4%4% 1% 1%1% 1%
Relative size of Dutch banks by balance sheet
2011 2014
Breakdown of Dutch financial sector by balance sheet
Six banks
Other financial institutions87% 82%
13% 18%
Source: Annual reports and De Nederlandsche Bank
2011 2014
The remainder of this report is as follows:
• The next section holds a description of the current state of the six largest banks in the Netherlands.
• The third section presents an impact analysis of key short-term developments
that are expected to affect the Dutch banking sector in the coming years. It also presents a quantification of the standalone and cumulative impact of these developments on the supply of bank lending and on the Dutch economy.

© 2015 KPMG Advisory N.V. © 2015 KPMG Adsisory N.V.
Development of aggregate balance sheet
Source: Annual reports
2.500
2.000
1.500
1.000
500
0
Assets2011
Asset2014
Liabilities2011
Liabilities2014
Other assets
Commercial loans
Retail Mortages
Other Retail loans
Other Liabilities
Wholesalefunding
Customer Deposits
Capital
272547
1086
100
436
610
1082
97
683
566
701
55
848
566
769
42
EUR billion 10% 10%
The state of Dutch banks in 2015 | 12
2 The state of Dutch banks in 2015
The state of Dutch banks in 2015 | 12 The state of Dutch banks in 2015 | 13The state of Dutch banks in 2015 | 12
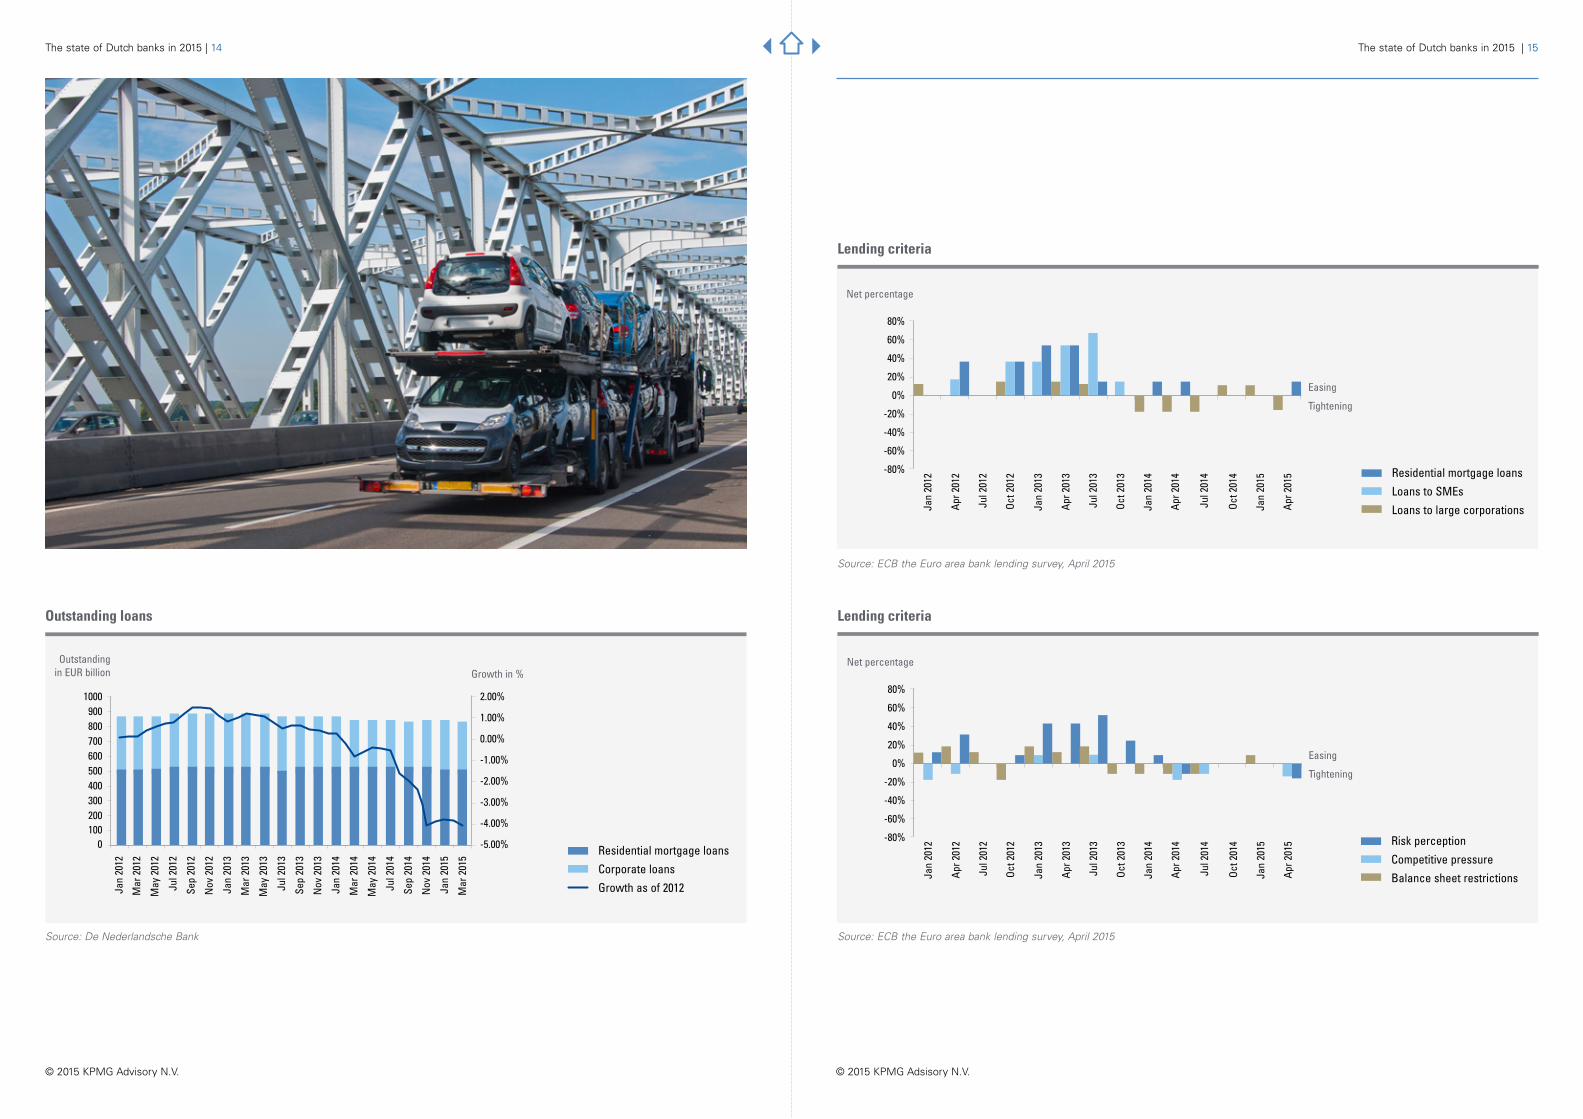
In the 2012 study, KPMG concluded that, without management intervention, six target ratios, defined in close consultation with industry experts, would not meet the regulatory minimum requirements applicable for year-end 20152. In order to meet the capital requirements, a cumulative balance sheet reduction of EUR 200 billion would be required while banks would need to retain their 2012 net profit level in order to strengthen their solvency and liquidity. In addition, operating efficiency needed to improve by increasing margins with 0.80% to 0.90% and operating costs needed reducing by 5%. In order to improve liquidity ratios, a long-term funding of EUR 50 billion would be required to replace short-term funding.
Following the economic downturn and the corresponding lower demand for retail and corporate loans, banks have been able to deleverage at a higher pace than expected. Loan portfolios have been reduced and non-core assets and activities divested. Both aspects have also contributed to the de-risking of balance sheets seen among all banks. In addition, liquidity ratios have improved and long-term funding has been attracted in line with earlier predictions. The profitability of Dutch banks has developed in line with the economic environment, decreasing as of 2012 due to high loan impairments and decreasing income, but slowly recovering since the end of 2014.
2 The defined target ratios were: Core Tier 1 Ratio, Leverage Ratio, Net Stable Funding Ratio, Liquidity Coverage Ratio, Return on Equity, Cost to Income Ratio.
The six Dutch banks have managed to realise a larger balance sheet reduction than EUR 200 billion in a shorter time period as their aggregate balance sheet decreased by EUR 220 billion (-10%) during the period 2011 to 2014.
The balance sheet reduction was predominantly achieved by the disposal of non-core activities.
While assets relating to non-core activities decreased by 20%, assets relating to core lending activities remained fairly stable. The lack of loan portfolio growth can be largely attributed to the strong headwind the Dutch economy experienced during 2011 to 2013, as evidenced by a continuous decline in GDP3. As demand for loans from retail and
small and medium-sized enterprises (SMEs) is highly correlated to movements in GDP, the decline in GDP lasting recent years resulted in a significant decrease in retail and SME loans. In addition to lower credit demand, the supply of credit decreased as banks applied more stringent lending criteria.
3 Statistics Netherlands (CBS.)
Banks have been able to deleverage at a higher pace than expected.
Growth in lending
-5.0%-4.0%
-6.0%
-3.0%-2.0%-1.0%0.0%1.0%2.0%3.0%4.0%
Jan
2012
Mar
201
2
May
201
2
Jul 2
012
Sep
2012
Nov
201
2
Jan
2013
Mar
201
3
May
201
3
Jul 2
013
Sep
2013
Nov
201
3
Jan
2014
Mar
201
4
May
201
4
Jul 2
014
Sep
2014
Nov
201
4
Jan
2015
Mar
201
5
Growth y-o-y
Growth in mortgage lending
Growth in corporate lending
2.1 Dutch banks now meet their target ratios but at a cost
2.2 De-leveraging occurred at greater rate than expected
Source: De Nederlandsche Bank
The state of Dutch banks in 2015 | 15
© 2015 KPMG Advisory N.V. © 2015 KPMG Adsisory N.V.
The state of Dutch banks in 2015 | 14
Outstanding loans
100200
0
300
-5.00%
400
-4.00%
500
-3.00%
600
-2.00%
700
-1.00%
8000.00%
900 1.00%
1000 2.00%
Jan
2012
Mar
201
2
May
201
2
Jul 2
012
Sep
2012
Nov
201
2
Jan
2013
Mar
201
3
May
201
3
Jul 2
013
Sep
2013
Nov
201
3
Jan
2014
Mar
201
4
May
201
4
Jul 2
014
Sep
2014
Nov
201
4
Jan
2015
Mar
201
5
Growth in %Outstanding
in EUR billion
Residential mortgage loans
Corporate loans
Growth as of 2012
Lending criteria
-80%
-60%
-40%
-20%
0%
20%
40%
60%
80%
Jan
2012
Apr 2
012
Jul
201
2
Oct 2
012
Jan
2013
Apr 2
013
Jul 2
013
Oct 2
013
Jan
2014
Apr 2
014
Jul 2
014
Oct 2
014
Jan
2015
Apr 2
015
Net percentage
Easing
Tightening
Residential mortgage loans
Loans to SMEs
Loans to large corporations
Source: ECB the Euro area bank lending survey, April 2015
Lending criteria
Source: ECB the Euro area bank lending survey, April 2015Source: De Nederlandsche Bank
-80%
-60%
-40%
-20%
0%
20%
40%
60%
80%
Jan
2012
Apr 2
012
Jul
201
2
Oct 2
012
Jan
2013
Apr 2
013
Jul 2
013
Oct 2
013
Jan
2014
Apr 2
014
Jul 2
014
Oct 2
014
Jan
2015
Apr 2
015
Net percentage
Easing
Tightening
Risk perception
Competitive pressure
Balance sheet restrictions

© 2015 KPMG Advisory N.V. © 2015 KPMG Adsisory N.V.
The state of Dutch banks in 2015 | 17The state of Dutch banks in 2015 | 16
All Dutch banks have started to disclose their Net Stable Funding Ratio (“NSFR”) and Liquidity Coverage Ratio (“LCR”) levels. From the disclosures in their annual reports and investor presentations, it can be seen that their funding and liquidity ratios are already well above the minimum requirements.
Banks have significantly increased their LCR by increasing their buffers of high-quality liquid assets (HQLA) and lowering their short-term wholesale funding. In October 2014, the European Commission published a delegated act detailing the final requirements
for LCR and defining which assets were to be recognised as HQLA as a buffer against potential net cash outflow over a 30- day stressed period. In this act, the definition of level 2B assets was broadened. As a result, more investment categories were recognised as HQLA.
From 2011 to 2014, NSFR levels increased further. Banks diversified their funding and reduced their dependency on short-term wholesale funding. During this period, KPMG funding, that was achieved as a result of growth in short-term retail deposits.
2.4 Liquidity Coverage Ratios already well above minimum requirements
Banks have significantly increased their LCR by increasing their buffers of high-quality liquid assets (HQLA) and lowering their short-term wholesale funding.
In 2014, profitability recovered due to increasing net interest income (with a de-leveraged balance sheet) and decreasing costs
On an aggregate level, the Return on Equity (“RoE”) remained fairly stable from 2011 to 2014.
In 2014, profitability recovered due to increasing net interest income (with a de-leveraged balance sheet) and decreasing costs. Operating costs reduced as a result of
restructurings and cost savings programmes while risk costs started to decline. In terms of RoE, increasing profitability was offset by an increase in retained earnings.
2.5 Profitability recovered
In 2011, two banks (ING and SNS) out of six had a CET1 ratio (“Common Equity Tier 1”) ratio below their target CET1 ratio level of 10% (9.6% and 9.2%, respectively). At year-end 2014, all six banks were well above the minimum target ratio, ING being the exception with a CET1 ratio just below 12% (11.4%).
The result of the management actions that were taken was that all six banks improved their CET1 and leverage ratio
significantly during the period 2011-2014. The aggregate CET1 ratio increased to 13.1% due to an increase in CET1 capital, as a result of retained earnings (dividend cuts), and because of a decrease in risk weighted assets due to declining credit risk exposures, which was achieved by disposing of or transferring high risk assets. The levarage ratio increased to 4.3% as a result of balance sheet reductions as discussed above, while the nominal amount of equity remained fairly stable.
Source: Annual reports and investor presentations of ING, Rabo, ABN AMRO, SNS, NIBC and Van Lanschot
6 NL Banks
ING Rabo ABN AMRO
SNS NIBC Van Lanschot
Leverage Ratio 2011
Leverage Ratio 2014
2.0%
1.0%
4.0%
2.0%-
-
6.0%
3.0%
8.0%
4.0%
10.0%
5.0%
12.0%
6.0%
14.0%
7.0%
16.0%
8.0%
18.0%
6 NL Banks
ING Rabo ABN AMRO
SNS NIBC Van Lanschot
Core Tier 1 Equity Ratio Leverage Ratio
Source: Annual reports and investor presentations of ING, Rabo, ABN AMRO, SNS, NIBC and Van Lanschot
Core Tier 1 Ratio 2011
Core Tier 1 Ratio 2014
20.0% 20.0%40.0% 40.0%
- -
60.0% 60.0%80.0% 80.0%
100.0% 100.0%120.0% 120.0%140.0% 140.0%
160.0%180.0%200.0%
6 NL Banks
6 NL Banks
ING INGRabo RaboABN AMRO
ABN AMRO
SNS SNSNIBC NIBCVan Lanschot
Van Lanschot
Net Stable Funding Ratio Liquidity Coverage Ratio
NSFR 2011
NSFR 2014LCR 2011
LCR 2014
Source: Annual reports and investor presentations of ING, Rabo, ABN AMRO, SNS, NIBC and Van Lanschot
2.0% 10.0%4.0% 20.0%
- -
6.0% 30.0%8.0% 40.0%
10.0% 50.0%12.0% 60.0%
70.0%80.0%90.0%
6 NL Banks
6 NL Banks
ING INGRabo RaboABN AMRO
ABN AMRO
SNS SNSNIBC NIBCVan Lanschot
Return on Equity Cost/income Ratio
RoE 2011
RoE 2014Cost/Income Ratio 2011
Cost/Income Ratio 2014
2.3 Capital ratios significantly improved due to de-leveraging, de-risking and retention of earnings

© 2015 KPMG Advisory N.V. © 2015 KPMG Adsisory N.V.
The state of Dutch banks in 2015 | 18
3 Outlook
The state of Dutch banks in 2015 | 18 The state of Dutch banks in 2015 | 19The state of Dutch banks in 2015 | 18
In Section 2, it was concluded that Dutch banks currently meet most of their target ratios. However, new regulation will affect the Dutch banking sector and its lending capacity (i.e. loan supply). In this section, the impact of the following key challenges will be assessed:
• A higher target Leverage Ratio of 4% which is currently still under discussion.
• The introduction of a maximum encumbrance ratio of 25%.
• Changes brought about by the European Banking Union and corresponding Single Supervision Mechanism (SSM), Single Resolution Mechanism (SRM), Single Resolution Fund (SRF) and Single Deposit Guarantee Scheme (SDGS).
• Increased cost of supervision resulting from increased data-driven supervision, changes required in IT and improvements in data quality.
• Change in IFRS accounting rules (IFRS9) forcing banks to alter their view on (future) losses.
• Revision of the standardised approach (SA) for credit risk resulting in changes to the risk weighting of assets held by banks.
From a loan demand perspective, the Dutch economy is slowly picking up. However, what will happen when the economy gains steam and loan demand increases? Will there be a large gap between demand and supply that hampers potential economic growth? Do companies, particularly SMEs, have access to sufficient alternatives to traditional bank loans?
The following sections show estimates of the sudden and gradual impact of new regulation on the banks’ financials. In Sections 3.7 and 3.8, the cumulative impact of new regulation on the capitalisation, profitability and loan supply of banks is estimated.
Basel III introduced a non-risk weighted capital measure called the leverage ratio which aims to to constrain the build-up of leverage. In its CRR, the BCBS agreed a leverage ratio of 3% for banks. This minimum requirement of 3% will be tested permanently by the European Banking Authority (“EBA”) during the parallel run period from 1 January 2013 until 1 January 2017. The leverage ratio will become mandatory as of 1 January 2018. Each EU country can decide to increase the leverage ratio target for banks operating in its jurisdiction. The Dutch government is currently contemplating an increase of the leverage ratio target to 4%. This would have a significant impact on the balance sheets of Dutch banks. Assuming constant capital levels, a 1% (additional) increase in the leverage ratio would result in a (further) reduction in total assets of EUR 110.0 billion for the six Dutch banks combined. The reduction in total assets can only be achieved by the banks by shrinking the banks’ main asset class, its loan book. In order to reduce the loan book, less new loans will be provided.
Currently, only ABN AMRO and SNS Bank fail to meet the 4% leverage ratio hurdle. Based on the year-end 2014 figures, the six banks reported a combined leverage ratio of 4.2%. This combined figure would be sufficient to meet the higher level for Dutch banks. However, as ABN AMRO and SNS Bank did not meet the 4% leverage target, they would have to lower their asset base by EUR 110.0 billion. This reduction in total assets is likely to be achieved by reducing the loan portfolio, which is typically achieved by tightening credit acceptance criteria. A smaller loan portfolio would negatively impact the profitability of both banks. Over 2014, ABN AMRO and SNS Bank realised an average net interest margin of 153bps and 143bps respectively. Hence, a EUR 110.0 billion decrease in assets would result in a EUR 1.6 billion lower net interest income for ABN AMRO and SNS Bank combined.
A higher minimum leverage ratio could also have two other effects. First, the leverage ratio is regarded as a relatively crude measure that weighs low-risk assets and riskier assets equally. Banks with 3.1 Key challenges facing the sector
3.2 Impact of a potential higher target leverage ratio
What will happen when the economy gains steam and loan demand increases?
500
1.000
-
1.500
2.000
2.500
6 NL Banks
ING Rabo ABN AMRO
SNS NIBC Van Lanschot
Sensitised leverage ratio
Reported total assets
Sensitised total assets
Target leverage ratio
Reported leverage ratio-1.0%2.0%3.0%4.0%5.0%6.0%7.0%8.0%
Source: Annual reports and investor presentations of ING, Rabo, ABN AMRO, SNS, NIBC and van Lanschot. KPMG analysis.
© 2015 KPMG Advisory N.V. © 2015 KPMG Adsisory N.V.
The state of Dutch banks in 2015 | 21The state of Dutch banks in 2015 | 20
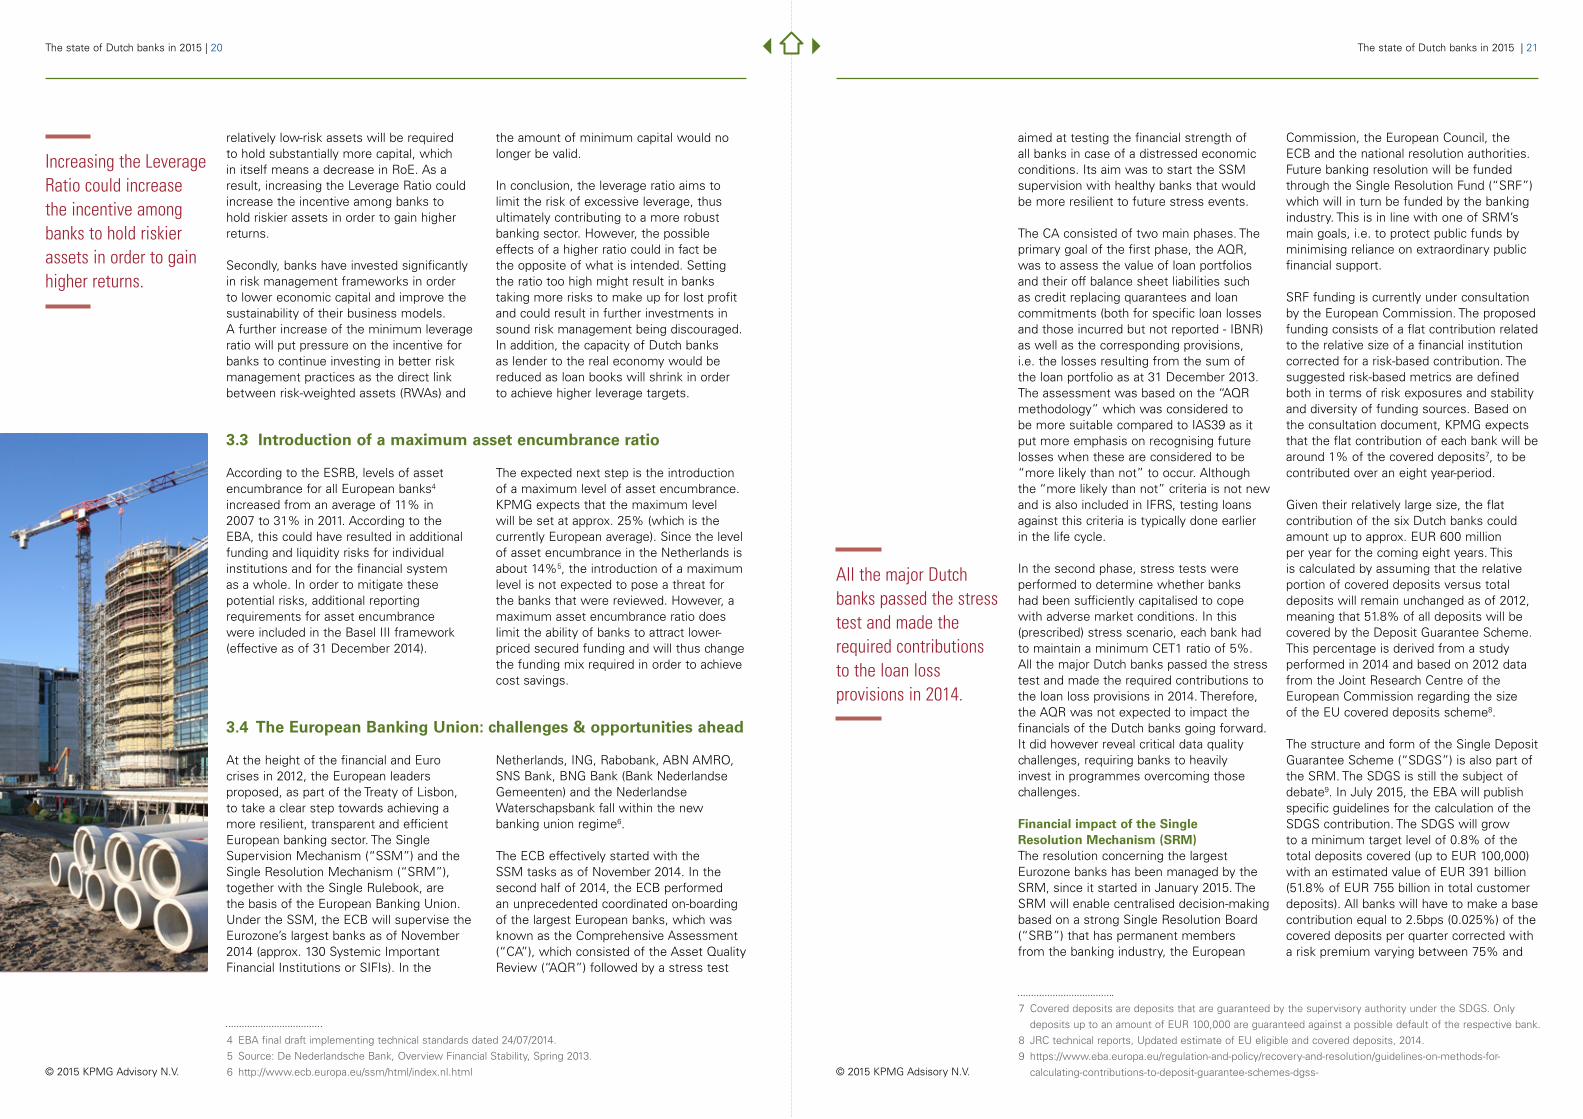
relatively low-risk assets will be required to hold substantially more capital, which in itself means a decrease in RoE. As a result, increasing the Leverage Ratio could increase the incentive among banks to hold riskier assets in order to gain higher returns.
Secondly, banks have invested significantly in risk management frameworks in order to lower economic capital and improve the sustainability of their business models. A further increase of the minimum leverage ratio will put pressure on the incentive for banks to continue investing in better risk management practices as the direct link between risk-weighted assets (RWAs) and
the amount of minimum capital would no longer be valid.
In conclusion, the leverage ratio aims to limit the risk of excessive leverage, thus ultimately contributing to a more robust banking sector. However, the possible effects of a higher ratio could in fact be the opposite of what is intended. Setting the ratio too high might result in banks taking more risks to make up for lost profit and could result in further investments in sound risk management being discouraged. In addition, the capacity of Dutch banks as lender to the real economy would be reduced as loan books will shrink in order to achieve higher leverage targets.
According to the ESRB, levels of asset encumbrance for all European banks4 increased from an average of 11% in 2007 to 31% in 2011. According to the EBA, this could have resulted in additional funding and liquidity risks for individual institutions and for the financial system as a whole. In order to mitigate these potential risks, additional reporting requirements for asset encumbrance were included in the Basel III framework (effective as of 31 December 2014).
The expected next step is the introduction of a maximum level of asset encumbrance. KPMG expects that the maximum level will be set at approx. 25% (which is the currently European average). Since the level of asset encumbrance in the Netherlands is about 14%5, the introduction of a maximum level is not expected to pose a threat for the banks that were reviewed. However, a maximum asset encumbrance ratio does limit the ability of banks to attract lower-priced secured funding and will thus change the funding mix required in order to achieve cost savings.
At the height of the financial and Euro crises in 2012, the European leaders proposed, as part of the Treaty of Lisbon, to take a clear step towards achieving a more resilient, transparent and efficient European banking sector. The Single Supervision Mechanism (“SSM”) and the Single Resolution Mechanism (“SRM”), together with the Single Rulebook, are the basis of the European Banking Union. Under the SSM, the ECB will supervise the Eurozone’s largest banks as of November 2014 (approx. 130 Systemic Important Financial Institutions or SIFIs). In the
Netherlands, ING, Rabobank, ABN AMRO, SNS Bank, BNG Bank (Bank Nederlandse Gemeenten) and the Nederlandse Waterschapsbank fall within the new banking union regime6.
The ECB effectively started with the SSM tasks as of November 2014. In the second half of 2014, the ECB performed an unprecedented coordinated on-boarding of the largest European banks, which was known as the Comprehensive Assessment (“CA”), which consisted of the Asset Quality Review (“AQR”) followed by a stress test
Increasing the Leverage Ratio could increase the incentive among banks to hold riskier assets in order to gain higher returns.
All the major Dutch banks passed the stress test and made the required contributions to the loan loss provisions in 2014.
3.3 Introduction of a maximum asset encumbrance ratio
3.4 The European Banking Union: challenges & opportunities ahead
aimed at testing the financial strength of all banks in case of a distressed economic conditions. Its aim was to start the SSM supervision with healthy banks that would be more resilient to future stress events.
The CA consisted of two main phases. The primary goal of the first phase, the AQR, was to assess the value of loan portfolios and their off balance sheet liabilities such as credit replacing quarantees and loan commitments (both for specific loan losses and those incurred but not reported - IBNR) as well as the corresponding provisions, i.e. the losses resulting from the sum of the loan portfolio as at 31 December 2013. The assessment was based on the “AQR methodology” which was considered to be more suitable compared to IAS39 as it put more emphasis on recognising future losses when these are considered to be “more likely than not” to occur. Although the “more likely than not” criteria is not new and is also included in IFRS, testing loans against this criteria is typically done earlier in the life cycle.
In the second phase, stress tests were performed to determine whether banks had been sufficiently capitalised to cope with adverse market conditions. In this (prescribed) stress scenario, each bank had to maintain a minimum CET1 ratio of 5%. All the major Dutch banks passed the stress test and made the required contributions to the loan loss provisions in 2014. Therefore, the AQR was not expected to impact the financials of the Dutch banks going forward. It did however reveal critical data quality challenges, requiring banks to heavily invest in programmes overcoming those challenges.
Financial impact of the Single Resolution Mechanism (SRM)The resolution concerning the largest Eurozone banks has been managed by the SRM, since it started in January 2015. The SRM will enable centralised decision-making based on a strong Single Resolution Board (“SRB”) that has permanent members from the banking industry, the European
Commission, the European Council, the ECB and the national resolution authorities. Future banking resolution will be funded through the Single Resolution Fund (“SRF”) which will in turn be funded by the banking industry. This is in line with one of SRM’s main goals, i.e. to protect public funds by minimising reliance on extraordinary public financial support.
SRF funding is currently under consultation by the European Commission. The proposed funding consists of a flat contribution related to the relative size of a financial institution corrected for a risk-based contribution. The suggested risk-based metrics are defined both in terms of risk exposures and stability and diversity of funding sources. Based on the consultation document, KPMG expects that the flat contribution of each bank will be around 1% of the covered deposits7, to be contributed over an eight year-period.
Given their relatively large size, the flat contribution of the six Dutch banks could amount up to approx. EUR 600 million per year for the coming eight years. This is calculated by assuming that the relative portion of covered deposits versus total deposits will remain unchanged as of 2012, meaning that 51.8% of all deposits will be covered by the Deposit Guarantee Scheme. This percentage is derived from a study performed in 2014 and based on 2012 data from the Joint Research Centre of the European Commission regarding the size of the EU covered deposits scheme8.
The structure and form of the Single Deposit Guarantee Scheme (“SDGS”) is also part of the SRM. The SDGS is still the subject of debate9. In July 2015, the EBA will publish specific guidelines for the calculation of the SDGS contribution. The SDGS will grow to a minimum target level of 0.8% of the total deposits covered (up to EUR 100,000) with an estimated value of EUR 391 billion (51.8% of EUR 755 billion in total customer deposits). All banks will have to make a base contribution equal to 2.5bps (0.025%) of the covered deposits per quarter corrected with a risk premium varying between 75% and
4 EBA final draft implementing technical standards dated 24/07/2014.5 Source: De Nederlandsche Bank, Overview Financial Stability, Spring 2013.6 http://www.ecb.europa.eu/ssm/html/index.nl.html
7 Covered deposits are deposits that are guaranteed by the supervisory authority under the SDGS. Only deposits up to an amount of EUR 100,000 are guaranteed against a possible default of the respective bank.
8 JRC technical reports, Updated estimate of EU eligible and covered deposits, 2014. 9 https://www.eba.europa.eu/regulation-and-policy/recovery-and-resolution/guidelines-on-methods-for-
calculating-contributions-to-deposit-guarantee-schemes-dgss-

The state of Dutch banks in 2015 | 23
© 2015 KPMG Advisory N.V. © 2015 KPMG Adsisory N.V.
The state of Dutch banks in 2015 | 22 The state of Dutch banks in 2015 | 23
200%, which depends on the risk profile of the assets of the respective bank. The contribution for Dutch banks is expected to amount to between 10bps and 20bps per annum.
Assuming an average contribution to the SDGS of 15bps per annum of the total covered deposits and assuming that all deposits are covered by the SDGS, annual costs for the SRF for the six Dutch banks will amount to EUR 586 million.
Increased costs of supervisionIt is expected that the ECB will have a far stricter data-driven reporting approach than is currently the case under the local prudential supervision of the Dutch Central Bank. Capital Requirements Regulation (CRD) requires that banks have a robust data and system environment in place to support sound risk management, with the BCBS 239 paper “Principles for effective risk data aggregation and risk reporting” setting the minimum requirement for SIFIs.
The SSM puts significant pressure on Dutch banks to further improve their regulatory reporting processes, risk and finance system integration and data quality and granularity.
In 2013, KPMG performed a study in Germany on the expected additional cost that could be associated with operational compliance with all the new regulations. The study concluded that significant investments in staff and (IT) systems would be required in order to be able to fulfil the increasing burden of information demands from the supervisory authority if the additional operational costs and expected CapEx levels were extrapolated to the Dutch banks based on the size of their balance sheets. It summarised that the banks combined would need to invest a combined amount of EUR 1.2 billion between 2013 and 2015. The increased operational costs were estimated at EUR 65 million for the six Dutch banks in total.
The increased operational costs were estimated at EUR 65 million for the six Dutch banks in total.
In July 2014, the IASB issued IFRS 9 Financial Instruments, the fourth and final version of its new standard on financial instruments accounting, which included revised guidance on the classification and measurement of financial assets, including impairment, and supplements regarding the new hedge accounting principles published in 2013. One of the new requirements was the method for assessing impairments. Instead of looking solely at incurred losses, banks will have to take into account the expected losses. In the past, concerns have been raised about ‘too little, too late’ provisioning for loan losses. The new expected credit losses model aims to address these concerns, and accelerates the recognition of losses by requiring provisions to cover both already-incurred losses and certain losses expected in the future.
A difference between the impairment calculated pursuant IFRS 9 versus IAS 39 will lead to a difference (in this case lower) in book value of the loan book. The difference in book value of the loan book is booked directly in the banks’ equity (a so-called retrospective application). Based on the IASB proposed implementation date, the banks’ equity will be corrected as of 1 January 2018 . It is important to note that the EU will need to endorse the final IFRS 9 standard prior to its implementation.
Estimating its impact is difficult since the new standard requires an increased need for judgement by banks. In KPMG’s opinion, assessing the level of impairment is an art rather than a science. It requires profound judgement about whether loans will be paid as due – and, if not, how much will be recovered and when. The new model widens the scope of these judgements10.
3.5 Change in IFRS accounting rules forces banks to alter view of losses
Under the expected loss method, an impairment is directly calculated for the expected loss in the next 12 months at the moment of loan origination. Regarding loans for which the credit risk has risen, the initial impairment is increased by the expected loss for the loan until maturity.
According to a KPMG survey11 (Septembere 2014), more than half of the banks surveyed expected that the new IFRS 9 expected loss accounting rules would increase the loan loss provision by approx. 50%. An IASB study indicated that the impact on the expected additional impairment provision was particularly high for mortgage loan portfolios. The analysis demonstrated that
the impairment provision under IFRS 9 for mortgage loan portfolios would increase by 30%-250% compared to IAS 39. For all other asset portfolios, the increase would be between 25% and 60%. Ultimately, differences in assessing impairments depended on the banks’ prudence in assessing impairments under IAS 39 and hence the impact would differ for each bank. KPMG analysed the impact on the capital ratio and balance sheet for Dutch banks assuming a 25%-60% as the total loan loss provision range of additional (one-time) impairments based on the 2014 year-end total loan loss provision.
The cumulative loan loss provision for the six Dutch banks as per year-end 2014 amounted to EUR 21.1 billion. If this amount increased by 25% or 60% for one year, the total provision would increase to EUR 26.4
billion and EUR 33.8 billion, respectively. Together with the one-off additional impairment, the combined year-end 2014 CET1 ratio would decrease by 82bps and 196bps, respectively.
10 http://www.kpmg.com/uk/en/issuesandinsights/articlespublications/newsreleases/pages/big-changes-ahead-for-banks-accounts-as-new-standard-on-bad-debts-completes-response-to-the-financial-crisis-says-kpmg.aspx 11 KPMG publication: First Impressions: IFRS 9 Financial Instruments, September 2014, kpmg.com/ifrs
Increase in loan loss provision resulting from IFRS 9
2014
loan
loss
pro
visi
on
Incr
ease
ING
Incr
ease
Rab
oban
k
Incr
ease
ABN
AM
RO
Incr
ease
SN
S Ba
nk
Incr
ease
NIB
C
Incr
ease
NIB
C
Incr
ease
Van
Lan
scho
t
Incr
ease
Van
Lan
scho
t
2014
loan
loss
pro
visi
on +
25%
2014
loan
loss
pro
visi
on +
60%
Incr
ease
ING
Incr
ease
Rab
oban
k
Incr
ease
ABN
AM
RO
Incr
ease
SN
S Ba
nk
5,0
10,0
-
15,0
20,0
25,0
30,0
35,0
40,0
1.52.4 1.2 0.1 0.0 0.1
2.13.3 1.7 0.2 0.1 0.1
26.4
33.8
Loan loss provision
Source: Annual reports and investor presentations of ING, Rabo, ABN AMRO, SNS, NIBC and van Lanschot. KPMG analysis.

The state of Dutch banks in 2015 | 25
© 2015 KPMG Advisory N.V. © 2015 KPMG Adsisory N.V.
The state of Dutch banks in 2015 | 24 The state of Dutch banks in 2015 | 25
3.6.1 Revisions to the standardised approach for credit riskThe KPMG analysis did not consider the effect of upcoming changes in minimum capitalisation for credit risk that are currently in consultation by the BCBS in its proposal ‘Revisions to the standardised approach for credit risk’.
In this proposal, the risk weighting of exposures to mortgages, banks, corporates and real estate (including residential
mortgages) will increase significantly (i.e. predominantly for mid-sized and smaller banks). Indirectly, banks that employ internal IRB models for the estimation of capital for credit risk (i.e. larger, internationally active banks) may also be affected, as the capital relief coming from these internal models will be limited to a ‘floor’ derived directly from the standardised approach.
3.6 There’s more to come:
The introduction of a floor would have a disproportionate impact on high-quality, low-risk IRB portfolios, particularly for banks carrying large mortgage books. This could adversely affect mortgage lending for consumers, both in terms of the supply and price of mortgages. It would also affect the risk return allocation of banks, i.e. switching lending from low-risk mortgages to higher-risk portfolios.
For Dutch banks with their relatively large (and high LTV) mortgage portfolios these reforms will have a significant impact. For residential mortgages with a LTVs above 60%, the risk weighting would increase substantially compared to the current standardised approach to credit risk. This is depicted below:
Another major adjustment is that the current SA allows tranching of a mortgage exposure, with the part of the exposure up to an LTV of 80% being allocated a risk weighting of 35% for ‘mortgages exposure’, while the part of the exposure above 80% LTV is treated as retail exposure and is allocated a risk weighting of 75%. Under the proposed revised SA, each mortgage exposure would be assigned to a LTV bucket. For mortgages
with high LTVs this could have a major impact on the risk weighting.
If the proposed formulation is accepted in full, KPMG estimated an additional requirement of approx. EUR 6 bn for CET 1 capital for the Dutch banking sector, based on an average mortgage portfolio with an LTV of 82% and a Debt Servicing Capacity Ratio (DSCR) of <35%, assuming that the revised SA would be the floor for IRB banks. The average risk weighting of Dutch mortgages portfolio based on the current SA is 30% (taking into account the risk mitigating effect of the mortgages guaranteed by the Nationale Hypotheek Garantie). Under the revised SA, the average risk weighting for assets would increase to 40%, thus representing a 33% or 10 percentage points increase compared to the current situation.
3.6.2 Bail-in: MREL & TLAC Following the Bank Recovery and Resolution Directive (BRRD) bail-in-able debt is an important element in a bank’s future resolution strategy. Since August 2013 bank state-aid rules already stipulate that subordinated debt must be converted into equity before state-aid is granted. More
If the proposed formulation is accepted in full, KPMG estimated an additional requirement of approx. EUR 6 bn for CET 1 capital for the Dutch banking sector.
Risk weight per LTV ratio: Current SA vs. Revised SA
20%
0%
40%
60%
80%
100%
125%
122%
119%
116%
113%
110%
107%
104%
101% 98
%95
%92
%89
%86
%83
%80
%77
%74
%71
%68
%65
%62
% 5%59%
56%
53%
50%
47%
44%
41%
38% 2%35%
32%
29%
26%
23%
20%
17%
14%
11% 8%
Risk weight
LTV ratio
SA Revised DSC <35% SA Revised DSC >35% SA Current
Break-even 60% LTV with current SA 35% RW
Sovereigns / Central Banks / PSE
No change with CRR: Not in scope of revision of SA: BCBS plans to revise the sovereign-related risk at a later stage
Current SA Revised SA
Exposure class Exposure class Risk Weight Risk Drivers
Securisation No change with CRR: part of the Securitisation framework Basel 2.5
Institutions Banks
Corporates
Capital instruments
Retail
Real estate
MDB
Past-due loans
Off-balance sheet items
30% - 300%
60% - 300%
250% - 400%
75% - 100%
25% - 120%
20% - 150%
Still in consideration, BCBS will come with a proposal in later stadium
Change in conversion credit factors (CCF): more in line with IRB
CET 1 ratio
LTV ratio
Revenue
External credit rating
Fixed weights based on the type of instrument
Fixed weights based on criteria
Non-performing assets (NPA) ratio
Debt service coverage (DSC) ratio
LeverageCorporates
Equity
Retail
Secured by mortgageson immovable property
MDB
Exposure in default
Off-balance sheet items
Covered bonds
Not a separate exposure class in revised SA: in definition of exposure class “banks”Collective Investment
Undertaking
Source: KPMG analysis.
Source: KPMG analysis.
The state of Dutch banks in 2015 | 27
© 2015 KPMG Advisory N.V. © 2015 KPMG Adsisory N.V.
The state of Dutch banks in 2015 | 26 The state of Dutch banks in 2015 | 27
impactful for banks’ strategies are however the bail-in requirements.These bail-in rules are expected to apply as of 1 January 2016 whereby banks’ liabilities, with some exceptions, will be bail-in-able. The Directive introduces depositor preference in the sense that deposits from individuals and SMEs rank higher than corporate deposits and unsecured creditors. Banks will be required to meet the loss-absorption capital levels expressed as minimum required eligible liabilities (MREL). MREL-levels will be bank specific, but based on EBA guidelines, and set by the resolution authority.
Closely related to MREL is the total loss absorption capacity (TLAC). The Financial Stability Board (FSB) will require Global Systematically Important Banks (G-SIBs)
to hold a minimum amount of regulatory capital plus ‘junior’ long-term liabilities that together, under the current proposal, are at least 16% - 20% of its risk weighted assets. The FSB proposals are limited to G-SIBs excluding those from emerging economies and will not apply until 2019. Although TLAC only applies to G-SIBs, which in the Netherlands is only ING Bank, the requirements might become a de facto standard also for Domestic Systematically Important Banks or D-SIBs.
At this point it is difficult to quantify the exact impact these measures will generate but considering investors in Bank debt will face the possibility that their debt is converted to equity under certain conditions, it is likely to result into a higher cost of capital for banks.
The identified developments all have an impact on either profitability (measured as the expected impact on profit before tax) and/or total assets (which is the key driver of the size of the loan portfolio). The cumulative impact of the developments will exceed the sum of the parts as the various initiatives will reinforce each other. Examples of this effect are the SRM and leverage ratio measures. Due to the leverage ratio, a bank has to reduce its loan portfolio if the bank’s CET1 capital is insufficient compared to the size of its balance sheet. The contributions to be made with regards to the SRM will further reduce the net profit level of banks and thus lower their contribution to CET1 capital, as a result of which the loan portfolio needs to be further reduced.
However, the actual impact of the measures on the banks’ profitability and ability to meet their strategic objectives is highly dependent on the timing of the implementation. If these regulations are implemented suddenly and simultaneously, the impact on banks’ balance sheets and their ability to provide loans will be tremendous. If implemented gradually, banks would have time to adapt their business model to the new reality.
First, KPMG calculated the impact of a sudden implementation of all the new regulations at year-end 2014. The impact of the revised standardised approach (EUR 6 bn for Dutch Banks) has been allocated to the six Dutch banks based on the size of their mortgage portfolios (though homogenous portfolios are assumed). KPMG calculated the impact of the measures on the banks’ lending capacity by adjusting their 2014 net profits and hence retained earnings and thus CET1 capital. The adjusted CET1 capital levels reduced the banks’ lending capacities, because of the 4% leverage ratio restriction. The outcome of calculations is as follows:
If all requirements were to be implemented instantly, the size of the CET1 capital held by the six analysed Dutch banks would be reduced by a total amount of EUR 11.1 billion. As a result of this lower level of CET1 capital, banks would have to further reduce their assets by approximately EUR 407 bn. The drivers of the reduction in assets are the revised SA, with RWAs for the sale amount of assets increasing, and the introduction of a maximum leverage ratio of 4%.
3.7 The impact of a sudden implementation of all the new regulations
In addition, the banks’ strategic objectives, as defined in their cost/income ratio and return on equity ratio (RoE), would also be affected. However, as the new regulations will come into effect gradually over time, the impact on the banks’ profitability differs from the “one-off implementation” analysis presented earlier. Consequently, the (gradual) impact of new regulation on the banks’ profitability going forward should be considered when assessing the impact of new regulations on the ability of banks to meet their strategic objectives. The impact of the leverage ratio on RoE is calculated differently as this measure results in a reduction of assets instead of CET1 capital. The costs associated with the initiatives will reduce the reported net profit and thus RoE, although income is also reduced by the lower asset base. This combined effect will have a significant impact on the banks’ reported RoE. The table above shows that IFRS 9, in combination with the leverage ratio will in particular have a significant impact on equity and thus RoE. The impact of the leverage ratio is huge and indicates that banks would currently fail to cope with a sudden implementation.
Secondly, KPMG estimated the impact of the (one-off) implementation of all the new regulations on the reported 2014 cost income (C/I) ratio. The C/I ratio is hit twice
as the cost level is impacted by the costs associated with the new regulation, and income is reduced by the smaller asset base resulting from the leverage ratio. The impact of the new regulations on the 2014 efficiency ratios is tremendous. All the banks that were analysed would suffer huge losses if the measures were to be implemented simultaneously. Profitability ratios would deteriorate. The RoE would decrease by 5.8 percent point towards an average of 2.4%, whereas cost/income would increase towards a high 92.5%. All the banks would be confronted with unsustainably high cost/income levels, thus demonstrating that a sudden implementation of all the measures in a market steadily recovering from the banking crisis, would pose an excessive burden on banks. The effect of gradual implementation in combination with higher income levels and improved profitability resulting from e.g. lower contributions for the loan loss provision, would change the picture and result in a more sustainable cost base.
In the analysis above the impact of new regulation on the profitability ratios of the six Dutch banks is estimated if it were to be implemented instantaneously. The benefit of a gradual implementation and its expected actual impact is addressed below.

The state of Dutch banks in 2015 | 29
© 2015 KPMG Advisory N.V. © 2015 KPMG Adsisory N.V.
In this section, KPMG quantified the impact of the measures as if they were implemented during the years 2015-2018. Assuming that the banks’ profitability will remain at 2014 levels, total assets would remain stable with a dividend pay-out ratio of 40% during 2015-201812. The expected impact of the SDGS, SRF, SA and IFRS 9 was also analysed.
As expected, the implementation of the new regulations has a negative impact on profitability, especially in 2017 where the impact of the implementation of IFRS 9 is visible, and in 2018 when the revision of the Standardised Approach has its effect on the CET 1 Ratio. As the first scenario does not assume economic growth, there is no
balance sheet growth and the leverage ratio increases due to the addition of capital via retained earnings.
In the second scenario, a projection is made of the banks’ financial ambitions as derived from investor presentations and annual reports. Dutch banks aim to restore profitability and further improve capital levels through balance sheet growth, increasing net interest margin, further cost savings and normalisation of risk costs. This scenario is based on the following assumptions: balance sheet growth of 3% per annum, annual re-pricing of 20% of assets with 0.20%, a decrease in the C/I ratio of 1% per annum and risk costs slowly returning to pre-crisis levels13.
As a result of management actions, the RoE of Dutch banks would gradually recover and banks should be able to meet their RoE targets in 2018.
While an 3% annual balance sheet growth is expected by banks, the Dutch Central Bank estimated that the demand for bank credit would increase by 4.2% per annum in an economic growth scenario14. This assumption for economic growth is reflected in the third scenarios. Compared to the second scenario, the capital ratios slightly decrease but this will not restrict banks in their lending capacity. To improve their ratios, banks could retain an additional 15% of their earnings or increase their pricing with an average of 10bps.
The impact of the new regulations is huge. Nevertheless, the gradual implementation of measures and proposed management actions would enable Dutch banks to meet the regulatory requirements. Ultimately, the extent to which additional capital is required is highly dependent on future economic growth and the availability and accessibility of alternative financing sources for Dutch corporates. In any case, meeting the regulatory requirements will come at a price for the real economy as both existing and new loans will become more expensive. Furthermore, the proposed target leverage ratio and the resulting search for yield will encourage banks to invest in riskier assets.
The state of Dutch banks in 2015 | 28 The state of Dutch banks in 2015 | 29
The implementation of the new regulations has a negative impact on profitability.
Meeting the regulatory requirements will come at a price for the real economy.
12 Target dividend pay-out ratio of Dutch banks. Source: investor presentations.13 Assumptions based on investor presentations and annual reports.
14 Growth in demand for loans according to DNB in economic growth scenario. Source: DNB Occasional Studies: kredietverlening en bancair kapitaal.
10.50%11.00%
10.00%
11.50%12.00%12.50%13.00%13.50%14.00%14.50%
2014 2015 2016 2017 2018
Core tier 1 ratio
Scenario 1
Scenario 2
Scenario 3
Target
2.0%4.0%
-
6.0%8.0%
10.0%12.0%14.0%
2014 2015 2016 2017 2018
Return on equity
Scenario 1
Scenario 2
Scenario 3
Target
3.50% 55.0%3.75% 57.0%
- 53.0%
4.00% 59.0%4.25% 61.0%4.50% 63.0%4.75% 65.0%5.00% 67.0%
2014 20142015 20152016 20162017 20172018 2018
Leverage ratio Cost / income ratio
Scenario 1
Scenario 2
Scenario 1
Scenario 2
Scenario 3
Target
Scenario 3
Obviously not all the new regulations will be implemented instantly as the impact would result in an immediate shutdown of bank lending. Instead, the measures will be implemented gradually over a
number of years. Some regulation is still under consultation and will have a phased implementation after introduction in the near future.
3.8 The impact of a gradual implementation of all the new regulations
Regulation embedded in law (clear)
Regulation proposed
Regulation in consulation (unclear)
LCR/NSFRIFRS9
Leverage ratio
SRF
SDGS
MREL Revision SA credit risk
2015 2016 2017 2018
Proposed Implementation date
Source: KPMG analysis.
Source: KPMG analysis.Source: KPMG analysis.

The state of Dutch banks in 2015 | 31
© 2015 KPMG Advisory N.V. © 2015 KPMG Adsisory N.V.
AQR Asset Quality Review
BCBS Basel Committee on Banking Supervision
BNG Bank Nederlandse Gemeenten N.V.
BPS Basis Points
CA Comprehensive Assessment
CET1 Common Equity Tier 1
CRD Capital Requirements Directive
CRR Capital Requirements Regulation
DNB De Nederlandsche Bank
DSCR Debt Servicing Capacity Ratio
EBA European Banking Authority
ECB European Central Bank
ESRB European Systemic Risk Board
GDP Gross Domestic Product
HQLA High-quality Liquid Assets
IBNR Incurred But Not Reported
IRB Internal Ratings Based Approach
LCR Liquidity Coverage Ratio
LTV Loan to Value
NSFR Net Stable Funding Ratio
NWB Nederlandse Waterschapsbank
RoE Return on Equity
RoA Return on Assets
SA Standardised Approach
SDGS Single Deposit Guarantee Scheme
SIFI Systemically Important Financial Institution
SRB Single Resolution Board
SRF Single Resolution Fund
SRM Single Resolution Mechanism
SSM Single Supervision Mechanism
Abbreviations Publications
The state of Dutch banks in 2015 | 30
KPMG provides a wide-ranging offering of studies, analysis and insights on regulation in the banking industry. For more information, please go to www.kpmg.com/regulatorychallenges.
The cumulative impact of regulation
September 2012
At the request of the Confederation of Netherlands Industry and Employers (known as VNO-NCW), KPMG analysed the effects of the cumulation of regulations on the Dutch banking services sector. From the research into the effects of 38 measures follows that the banking sector is faced with regulation, which touches every aspect of the banking business.
Evolving Banking Regulation – Part 2
April 2015
Part Two of the Evolving Banking Regulation 2015 series: Bank Structure: The Search for a Viable Strategy looks at bank structure, and the search by many banks for a viable and sustainable future in a world where regulatory and commercial pressures are driving business model change.
Evolving BankingRegulation – Part 1
March 2015
The 2015 edition of Europe, Middle East and Africa’s (EMA’s) Evolving Banking Regulation will be published as a series of papers, beginning with Part One: From Design to Implementation. This report looks at recent and forthcoming banking regulation to set the stage for further chapters focusing on specific issues.
Moving on
May 2013
This publication focuses on the cumulative impact of regulatory change on the wider economy – in particular, economic growth. The priority of many governments and regulators since the financial crisis – particularly in the US and Europe – has been first and foremost to make the financial system safe. However, the waves of regulatory reforms seem to have taken economies beyond the ‘tipping point’ – the costs of ever more regulation have begun to exceed the benefits. Regulatory reforms have exercised a substantial drag on economic growth, while their impact on the safety of the financial system remains uncertain.
The information contained herein is of a general nature and is not intended to address the circumstances of any particular individual or entity. Although we endeavor to provide accurate and timely information, there can be no guarantee that such information is ac-curate as of the date it is received or that it will continue to be accurate in the future. No one should act on such information without appropriate professional advice after a thorough examination of the particular situation.
© 2015 KPMG Advisory N.V., registered with the trade register in the Netherlands under number 33263682, is a member firm of the KPMG network of independent member firms affiliated with KPMG International Cooperative (‘KPMG International’), a Swiss entity. All rights reserved. The name KPMG, logo and ‘cutting through complexity’ are registered trademarks of KPMG International.
Publication date: July 2015
Contact us
Ferdinand VeenmanPartner KPMG AdvisoryT.: +31 20 656 8586E.: [email protected]
Carola SteenmeijerPartner KPMG AdvisoryT.: +31 20 656 8283E.: [email protected]
KPMGLaan van Langerhuize 11186 DS Amstelveen Postbus 74555 1070 DC Amsterdam
www.kpmg.nl