the state of discipline in loudoun county public schools
TRANSCRIPT
The State of Discipline in Loudoun County Public Schools
June 2013
Loudoun County Public Schools
Discipline Task Force

Contents
• Background on the Discipline Task Force
• The Discipline Task Force Goals
• General Information About LCPS
• The Guiding Questions
• A Review of Discipline in LCPS
• Next Steps

The Discipline Task Force
• Members of the School Board, individually and collectively, and staff of Loudoun County Public Schools (LCPS) received concerns from parents of students about the discipline policy.
• In response to the concerns, the Loudoun County School Board created a Task Force (a select committee) to review its discipline policies in Chapter 8, Students, of the School Board Policy Manual.

The Discipline Task Force Goals
The Task Force had four main goals. These goals are, but are not limited to, the following:
1. Review the LCPS Discipline Policy to ensure conformance with Virginia Code; and
2. Develop recommendations to improve LCPS communication to parents and students about the discipline policy; and
3. Develop recommendations to improve data collection and reporting of incidents requiring disciplinary action; and
4. Develop recommendations to ensure the LCPS discipline policy incorporates “Best Discipline Practices” based on a review of relevant research, data, and experience of other school divisions.
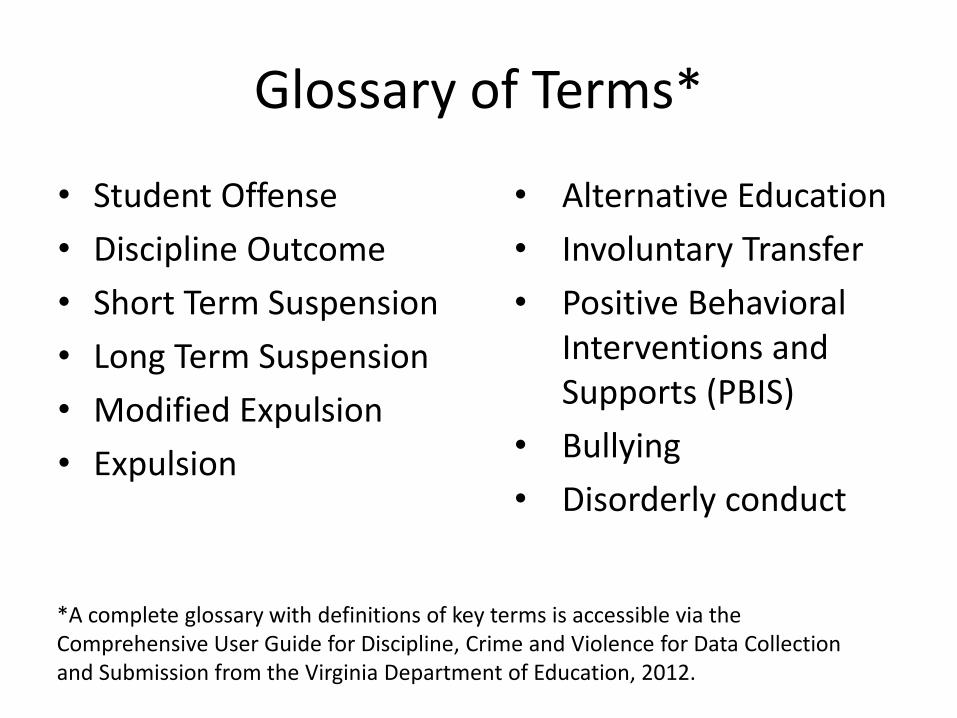
Glossary of Terms*
• Student Offense
• Discipline Outcome
• Short Term Suspension
• Long Term Suspension
• Modified Expulsion
• Expulsion
• Alternative Education
• Involuntary Transfer
• Positive Behavioral Interventions and Supports (PBIS)
• Bullying
• Disorderly conduct
*A complete glossary with definitions of key terms is accessible via the Comprehensive User Guide for Discipline, Crime and Violence for Data Collection and Submission from the Virginia Department of Education, 2012.

Review of Preliminary Data
• Review relevant data regarding each of the proposed Guiding Questions.
• The data are presented in table and/or graph formats.
• The enrollment and discipline data are from the 2009-10, 2010-11 and 2011-12 school years and are official as of August 2012.
• The comparison data across the Loudoun County, Fairfax County and Prince William County school districts are from the 2008-09, 2009-10 and 2010-11 school years.

The Guiding Questions What are the characteristics of our school population?
• Student Population Information
– Total Student population
– Population by School Type
– Population by Student demographics
How frequently do suspensions and expulsions occur? Why are students suspended or expelled?
• Total number of incidents
• Incident by category
• LCPS comparison to other districts
Are there patterns in suspensions by school type or student group?
• Suspensions or Expulsions issued
– Total number issued by school level
– Data by racial group
– Data by special education designation
How prevalent are the cases of students who have been suspended multiple times?
• % of HS seniors who have been suspended at least once during their school years
• % of students who have been suspended more than one time during their school years

Guiding Question #1
What are the characteristics of our school population?
– Total Student population
– Population by School Type
– Population by Student demographics
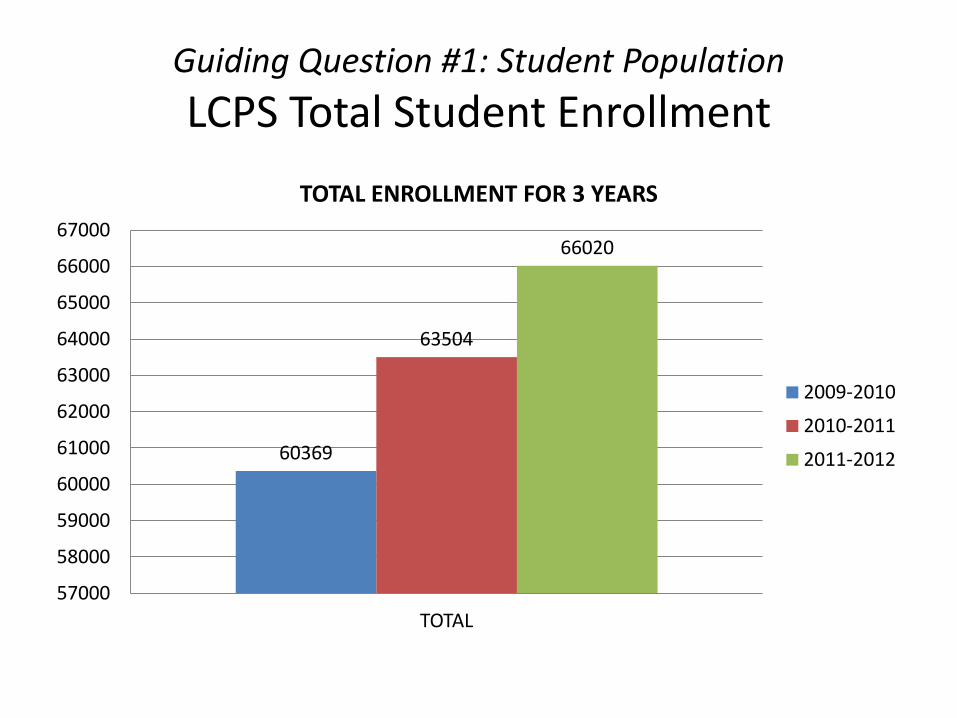
Guiding Question #1: Student Population
LCPS Total Student Enrollment
60369
63504
66020
57000
58000
59000
60000
61000
62000
63000
64000
65000
66000
67000
TOTAL
TOTAL ENROLLMENT FOR 3 YEARS
2009-2010
2010-2011
2011-2012

Guiding Question #1: Student Population
LCPS Total Student Enrollment
TOTAL ENROLLMENT BY SCHOOL LEVEL FOR 3 YEARS
SCHOOL YEAR ELEM MID HIGH TOTAL
2009-2010 30780 13292 16297 60369
2010-2011 32243 14042 17219 63504
2011-2012 33186 14896 17938 66020
Source: EOY SRC
0
20000
40000
60000
80000
ELEM MID HIGH TOTAL
TOTAL ENROLLMENT BY SCHOOL LEVEL FOR 3 YEARS
2009-2010
2010-2011
2011-2012
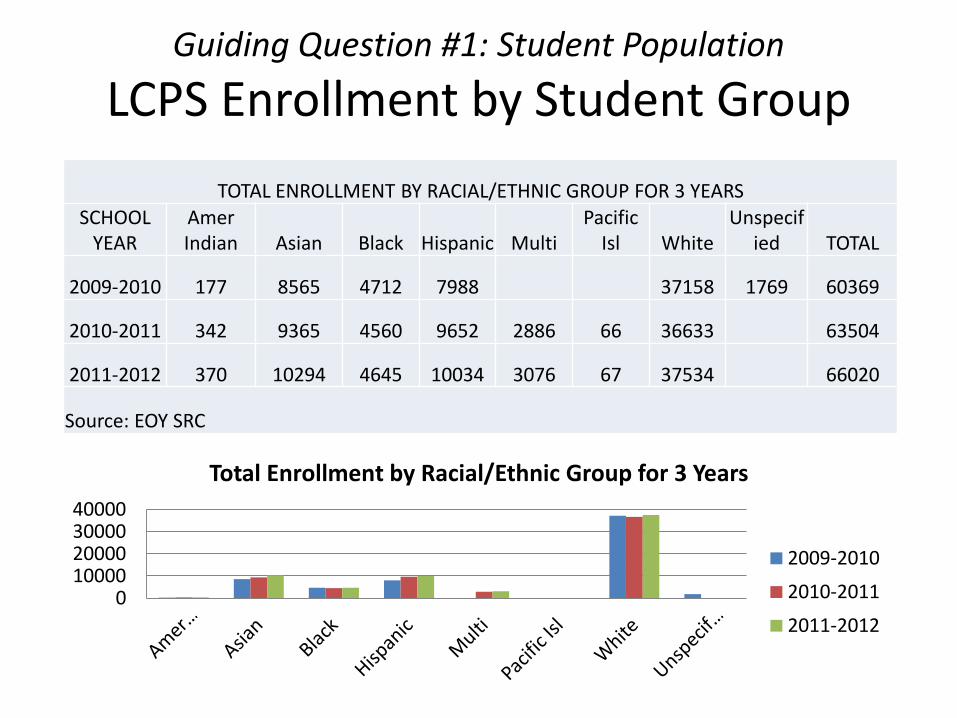
Guiding Question #1: Student Population
LCPS Enrollment by Student Group
TOTAL ENROLLMENT BY RACIAL/ETHNIC GROUP FOR 3 YEARS SCHOOL
YEAR Amer Indian Asian Black Hispanic Multi
Pacific Isl White
Unspecified TOTAL
2009-2010 177 8565 4712 7988 37158 1769 60369
2010-2011 342 9365 4560 9652 2886 66 36633 63504
2011-2012 370 10294 4645 10034 3076 67 37534 66020
Source: EOY SRC
0 10000 20000 30000 40000
Total Enrollment by Racial/Ethnic Group for 3 Years
2009-2010
2010-2011
2011-2012

Guiding Question #1: Student Population
LCPS Enrollment by Student Group
0%
10%
20%
30%
40%
50%
60%
70%
% of Total Enrollment by Racial/Ethnic Group for 3 Years
2009-2010
2010-2011
2011-2012

Guiding Question #1: Student Population
LCPS Enrollment by Special Education
TOTAL ENROLLMENT BY IEP STATUS FOR 3 YEARS
SCHOOL YEAR IEP NO IEP TOTAL % IEP
2009-2010 6883 53486 60369 11.4%
2010-2011 7079 56425 63504 11.1%
2011-2012 7494 58526 66020 11.4%
Source: EOY SRC
0
20000
40000
60000
80000
IEP NO IEP
Total Enrollment by IEP Status for 3 years
2009-2010
2010-2011
2011-2012

Observations
• LCPS enrollment is growing at a rate of about 4-5% each year.
• The percentage of students who are racial/ethnic minorities has increased from 38% to 43% in the past three years.
• The percentage of students with an IEP has remained steady.

Guiding Question #2
How frequently do suspensions and expulsions occur?
Why are students suspended or expelled?
• Total number of incidents
• Incident by category
• Comparison of LCPS to other districts
Guiding Question #2: Incidents & Outcomes Frequency
Summary
• The Code of Virginia (§ 22.1-279.3:1) requires school divisions statewide to submit data to the Virginia Department of Education (VDOE) on incidents of discipline, crime, and violence (DCV).
• http://www.doe.virginia.gov/statistics_reports/school_climate/index.shtml
• LCPS compiles a yearly report of student offenses and discipline outcomes for the district, which is submitted to the Virginia Department of Education.
• This report includes data on out-of-school suspensions and expulsions.

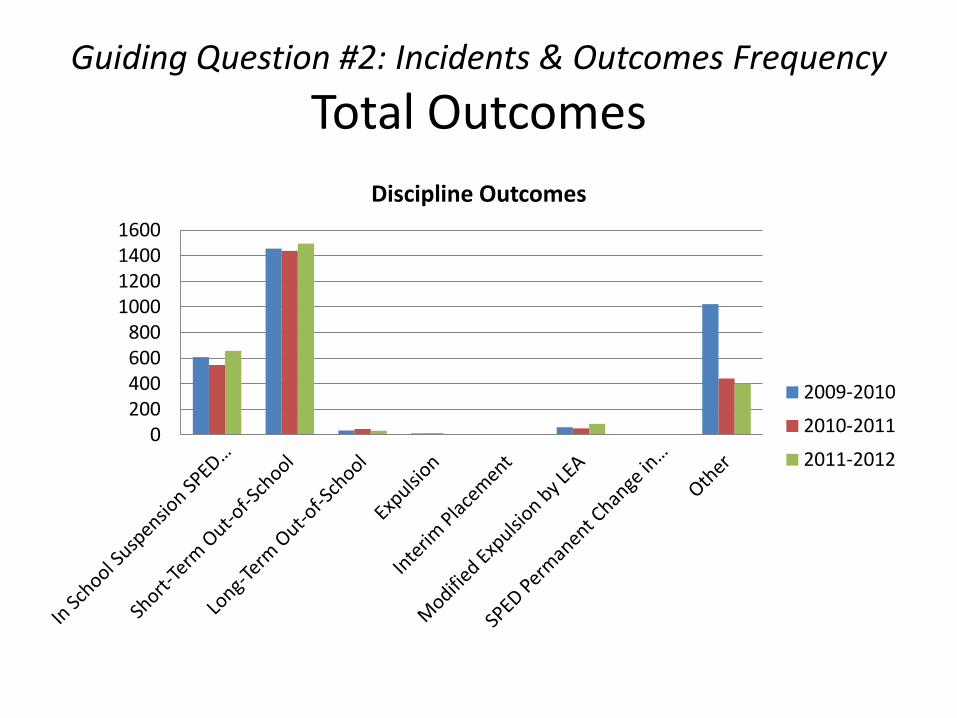
Guiding Question #2: Incidents & Outcomes Frequency Total Outcomes
School
Year In School
Suspension
SPED Only
Short-
Term Out-
of-School
Long-Term
Out-of-
School Expulsion
Interim
Placement
Modified
Expulsion
by LEA
SPED
Permanent
Change in
Placement Other Total
2009-2010
608 1456 34 11 0 60 0 1022 3191
2010-2011
546 1438 46 11 1 51 0 440 2533
2011-2012
656 1494 32 5 2 86 1 400 2676
Guiding Question #2: Incidents & Outcomes Frequency
Total Outcomes
0 200 400 600 800
1000 1200 1400 1600
Discipline Outcomes
2009-2010
2010-2011
2011-2012

Guiding Question #2: Incidents and Outcomes Frequency
Suspension/Expulsion Data/Rates School Year Total
Enrollment # of
Suspensions/ Expulsions
# of Students Suspended or
Expelled
Total % of Students
Suspended or Expelled
2009-2010 60369 1561 1015 1.7%
2010-2011 63504 1546 1059 1.7%
2011-2012 66020 1617 1091 1.7%

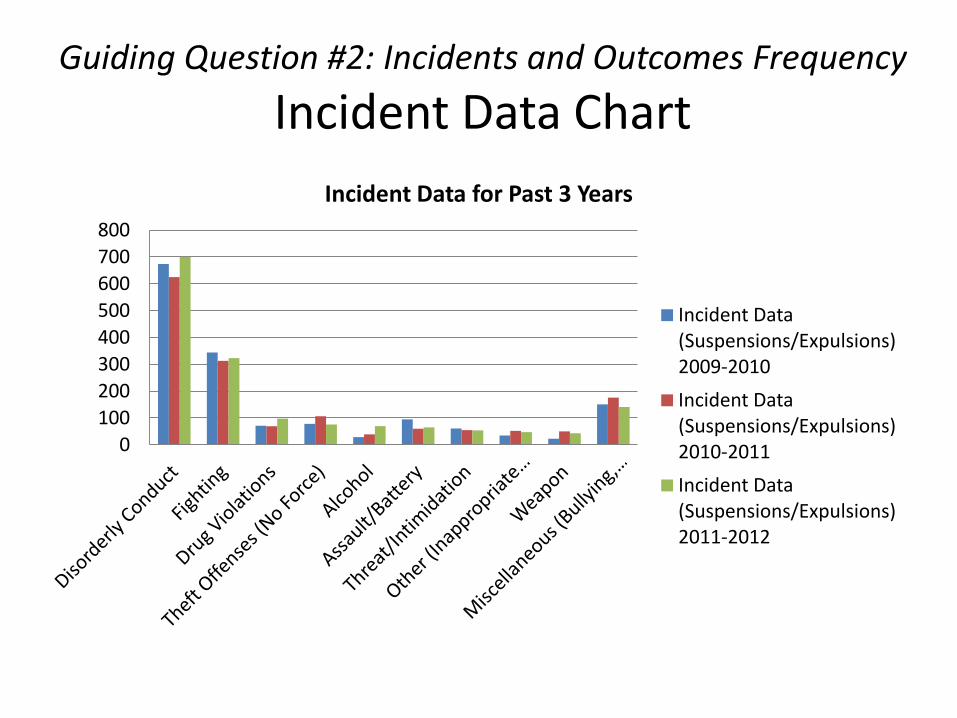
Guiding Question #2: Incidents and Outcomes Frequency
Incident Data
Description of Incident Incident Data
(Suspensions/Expulsions) 2009-2010 2010-2011 2011-2012
Disorderly Conduct 674 625 700 Fighting 344 313 323 Drug Violations 71 69 98 Theft Offenses (No Force) 78 107 76 Alcohol 29 39 70 Assault/Battery 95 60 65 Threat/Intimidation 61 55 54 Other (Inappropriate Personal Property, Misrepresentation, Other Code of Conduct 35 52 47 Weapon 23 50 43 Miscellaneous (Bullying, Harassment, Vandalism, etc.) 151 176 141
Total 1561 1546 1617
Guiding Question #2: Incidents and Outcomes Frequency
Incident Data Chart
0
100
200
300
400
500
600
700
800
Incident Data for Past 3 Years
Incident Data (Suspensions/Expulsions) 2009-2010
Incident Data (Suspensions/Expulsions) 2010-2011
Incident Data (Suspensions/Expulsions) 2011-2012
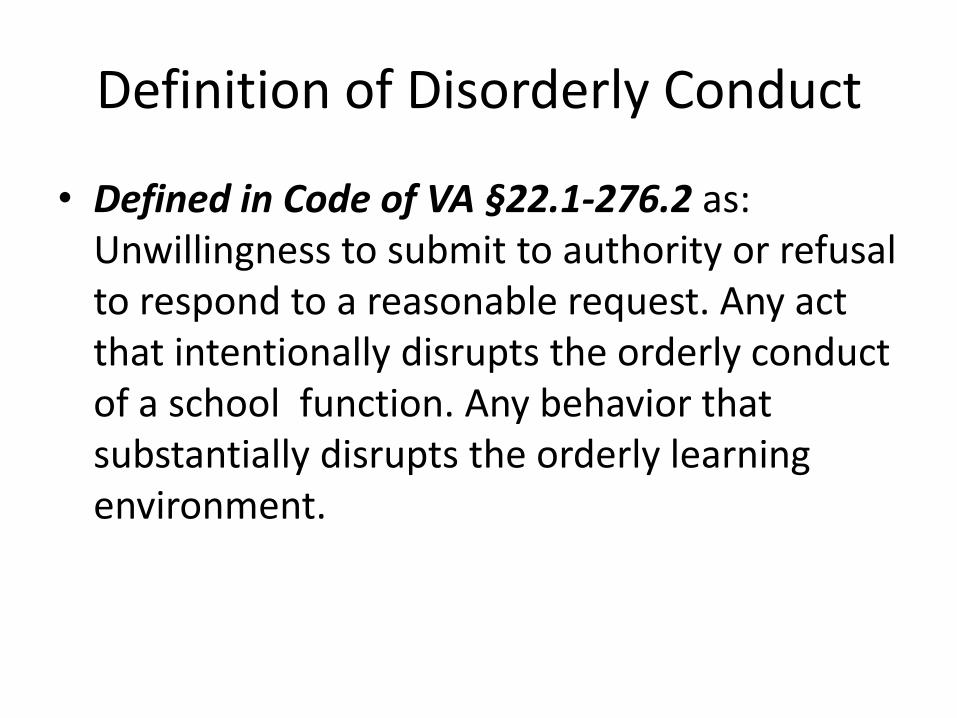
Definition of Disorderly Conduct
• Defined in Code of VA §22.1-276.2 as: Unwillingness to submit to authority or refusal to respond to a reasonable request. Any act that intentionally disrupts the orderly conduct of a school function. Any behavior that substantially disrupts the orderly learning environment.
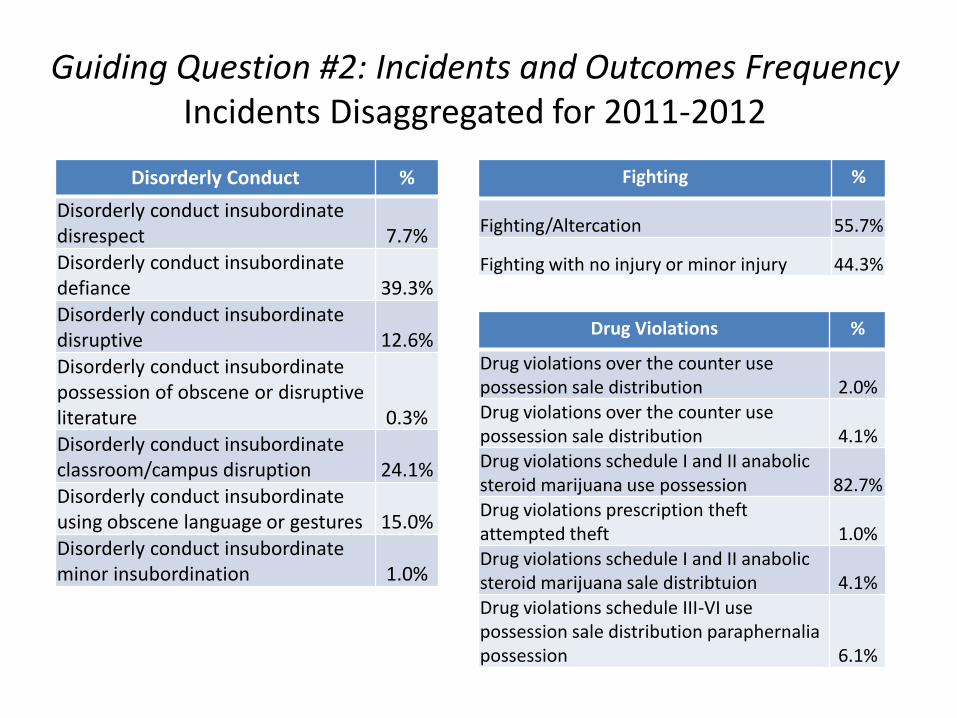
Guiding Question #2: Incidents and Outcomes Frequency Incidents Disaggregated for 2011-2012
Disorderly Conduct %
Disorderly conduct insubordinate disrespect 7.7%
Disorderly conduct insubordinate defiance 39.3% Disorderly conduct insubordinate disruptive 12.6% Disorderly conduct insubordinate possession of obscene or disruptive literature 0.3%
Disorderly conduct insubordinate classroom/campus disruption 24.1% Disorderly conduct insubordinate using obscene language or gestures 15.0% Disorderly conduct insubordinate minor insubordination 1.0%
Drug Violations %
Drug violations over the counter use possession sale distribution 2.0% Drug violations over the counter use possession sale distribution 4.1% Drug violations schedule I and II anabolic steroid marijuana use possession 82.7% Drug violations prescription theft attempted theft 1.0%
Drug violations schedule I and II anabolic steroid marijuana sale distribtuion 4.1% Drug violations schedule III-VI use possession sale distribution paraphernalia possession 6.1%
Fighting %
Fighting/Altercation 55.7%
Fighting with no injury or minor injury 44.3%
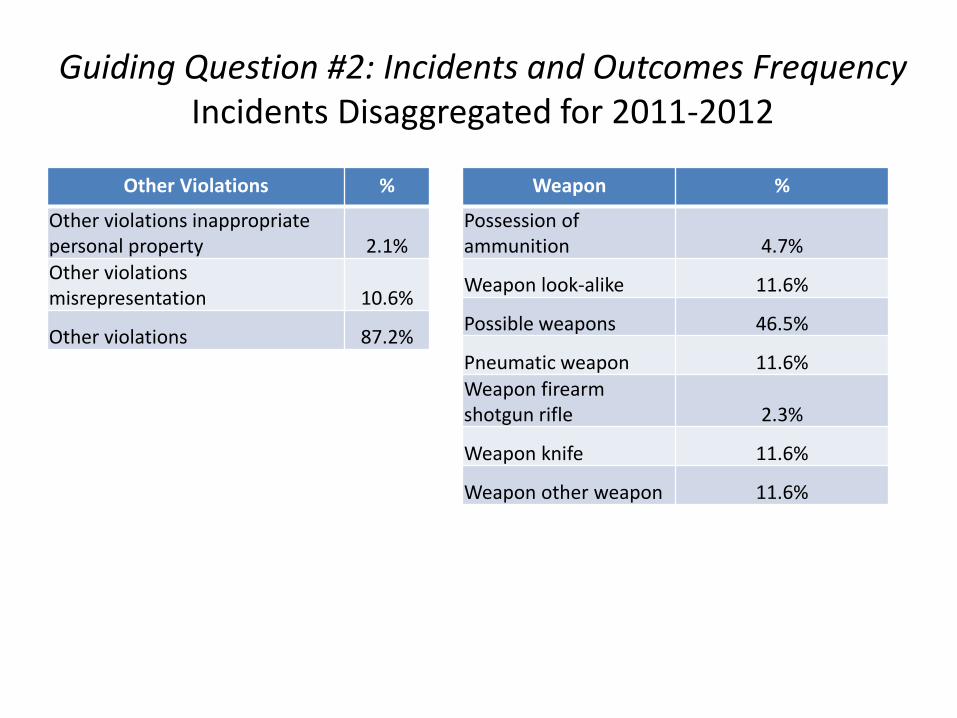
Guiding Question #2: Incidents and Outcomes Frequency Incidents Disaggregated for 2011-2012
Other Violations %
Other violations inappropriate personal property 2.1% Other violations misrepresentation 10.6%
Other violations 87.2%
Weapon %
Possession of ammunition 4.7%
Weapon look-alike 11.6%
Possible weapons 46.5%
Pneumatic weapon 11.6%
Weapon firearm shotgun rifle 2.3%
Weapon knife 11.6%
Weapon other weapon 11.6%
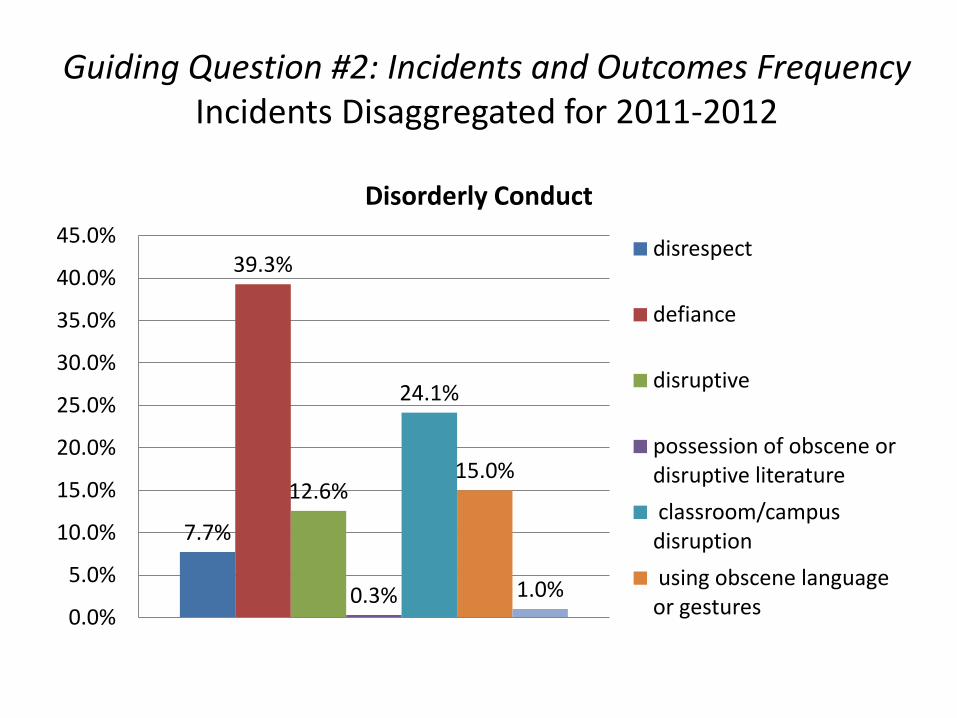
Guiding Question #2: Incidents and Outcomes Frequency Incidents Disaggregated for 2011-2012
7.7%
39.3%
12.6%
0.3%
24.1%
15.0%
1.0% 0.0%
5.0%
10.0%
15.0%
20.0%
25.0%
30.0%
35.0%
40.0%
45.0%
Disorderly Conduct
disrespect
defiance
disruptive
possession of obscene or disruptive literature
classroom/campus disruption
using obscene language or gestures

Guiding Question #2: Incidents and Outcomes Frequency
Incidents Disaggregated for 2011-2012
55.7%
44.3%
0.0%
10.0%
20.0%
30.0%
40.0%
50.0%
60.0%
Fighting
Fighting/Altercation
Fighting with no injury or minor injury

Guiding Question #2: Incidents and Outcomes Frequency
Incidents Disaggregated for 2011-2012
2.0% 4.1%
82.7%
1.0% 4.1% 6.1%
0.0%
10.0%
20.0%
30.0%
40.0%
50.0%
60.0%
70.0%
80.0%
90.0%
Drug Violations Drug violations over the counter use possession sale distribution
Drug violations over the counter use possession sale distribution
Drug violations schedule I and II anabolic steroid marijuana use possession Drug violations prescrption theft attempted theft
Drug violations schedule I and II anabolic steroid marijuana sale distribtuion Drug violations schedule III-VI use possession sale distribution paraphernalia possession

Guiding Question #2: Incidents and Outcomes Frequency
Incidents Disaggregated for 2011-2012
2.1%
10.6%
87.2%
0.0%
10.0%
20.0%
30.0%
40.0%
50.0%
60.0%
70.0%
80.0%
90.0%
100.0%
Other
Other violations inappropriate personal property
Other violations misrepresentation
Other violations
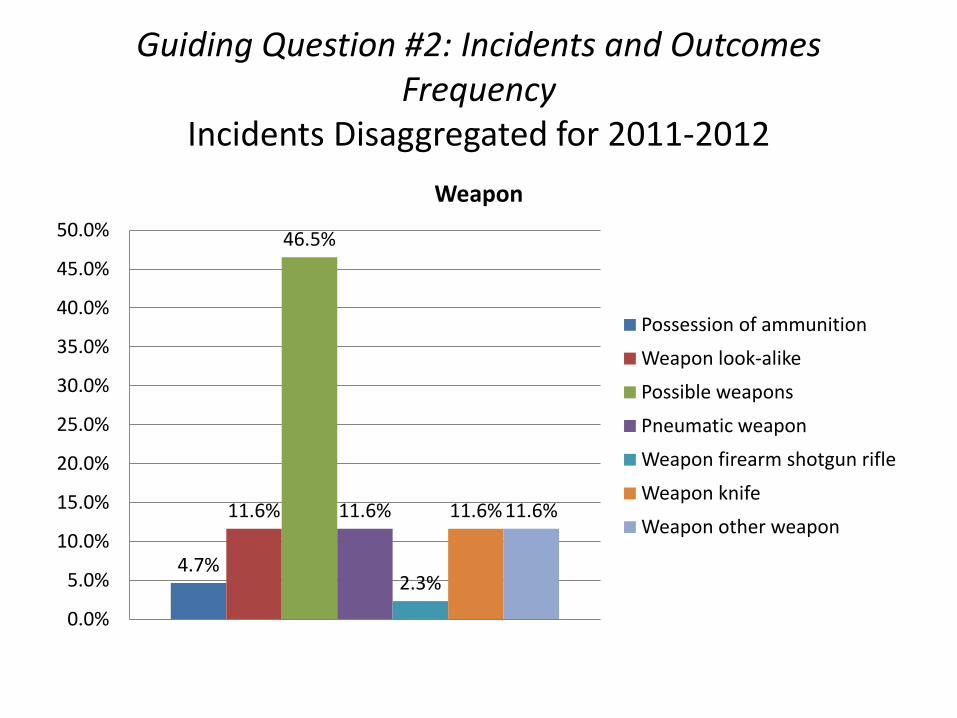
Guiding Question #2: Incidents and Outcomes Frequency
Incidents Disaggregated for 2011-2012
4.7%
11.6%
46.5%
11.6%
2.3%
11.6% 11.6%
0.0%
5.0%
10.0%
15.0%
20.0%
25.0%
30.0%
35.0%
40.0%
45.0%
50.0%
Weapon
Possession of ammunition
Weapon look-alike
Possible weapons
Pneumatic weapon
Weapon firearm shotgun rifle
Weapon knife
Weapon other weapon
Guiding Question #2: Incidents and Outcomes Frequency
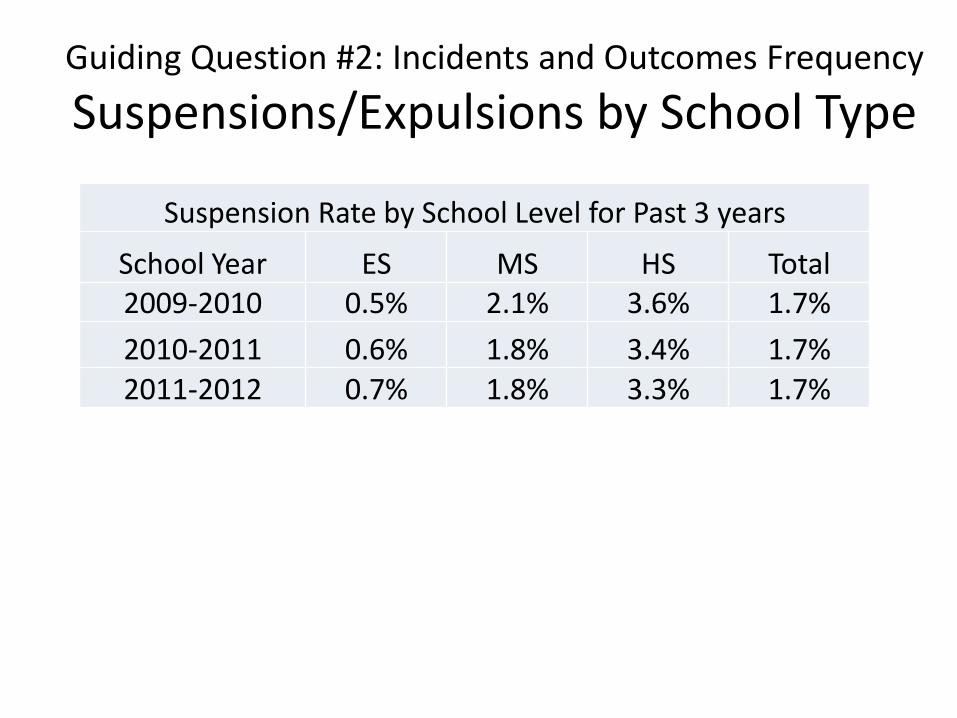
Suspensions/Expulsions by School Type
Suspension Rate by School Level for Past 3 years
School Year ES MS HS Total 2009-2010 0.5% 2.1% 3.6% 1.7%
2010-2011 0.6% 1.8% 3.4% 1.7% 2011-2012 0.7% 1.8% 3.3% 1.7%
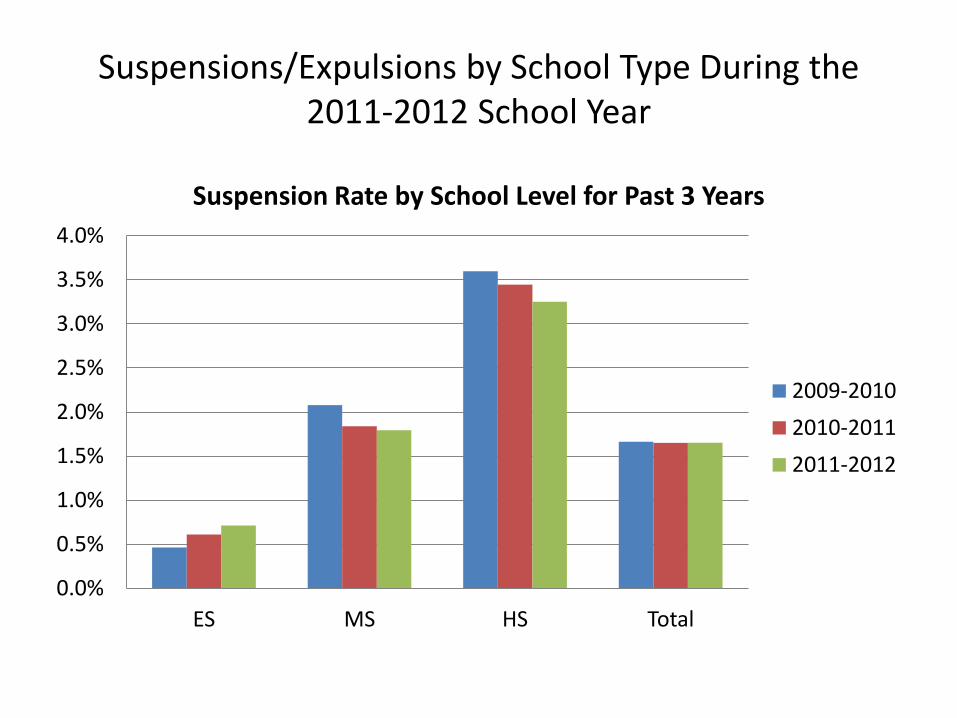
Suspensions/Expulsions by School Type During the 2011-2012 School Year
0.0%
0.5%
1.0%
1.5%
2.0%
2.5%
3.0%
3.5%
4.0%
ES MS HS Total
Suspension Rate by School Level for Past 3 Years
2009-2010
2010-2011
2011-2012

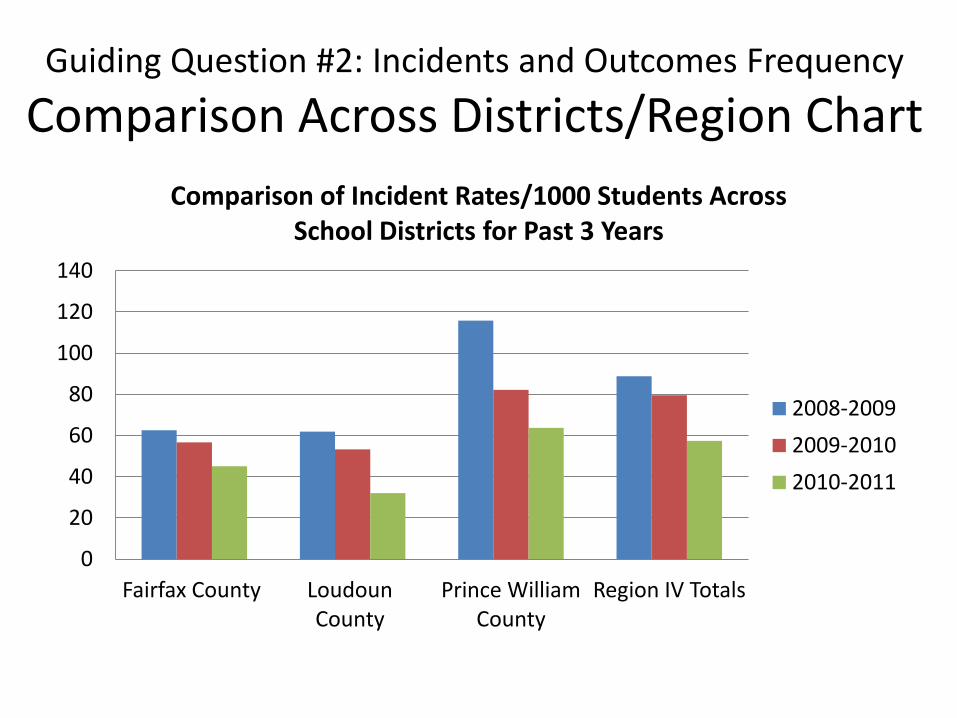
Guiding Question #2: Incidents and Outcomes Frequency
Comparison Across Districts/Region*
*2010-11 was the most recent year with available data across the districts.
Comparison of Incident Rates/1000 Students Across School Districts for Past 3 Years
School Year Fairfax County
Loudoun County
Prince William County
Region IV Totals
2008-2009 62.5 61.9 115.8 88.7 2009-2010 56.7 53.2 82.1 79.5 2010-2011 45.0 32.0 63.7 57.4
Guiding Question #2: Incidents and Outcomes Frequency
Comparison Across Districts/Region Chart
0
20
40
60
80
100
120
140
Fairfax County Loudoun County
Prince William County
Region IV Totals
Comparison of Incident Rates/1000 Students Across School Districts for Past 3 Years
2008-2009
2009-2010
2010-2011
Observations
• The overall number of discipline outcomes has decreased from nearly 3200 to 2676 cases over the last three years.
• The percentage of students who are suspended on a yearly basis has remained steady over the past three years at 1.7%.
• Among the student behaviors that resulted in suspension and expulsion, disorderly conduct and fighting constitute the majority (63%) of the cases.

Observations
• Among the student behaviors that resulted in suspension and expulsion, there is a trend towards increases in the cases of disorderly conduct, drug violations, alcohol and weapons.
• Among the student behaviors that resulted in suspension and expulsion, there is a trend towards decreases in the cases of fighting and assaults.

Observations
• Over the past three years, the suspension rates for middle and high schools have decreased.
• Over the past three years, the suspension rate for elementary schools has increased slightly, although the rate remains below that of middle and high schools.
• In comparison to neighboring districts, the suspension rate for LCPS is significantly lower.

Guiding Question #3
Are there patterns in suspensions by school type
or student group? – For this question, we are reviewing the data to
determine the level of equity in discipline outcomes by student group.
– Equity occurs when the % of enrollment is equal to % of incidents or suspended students for any particular group.
– Are certain groups more likely to be suspended than others?
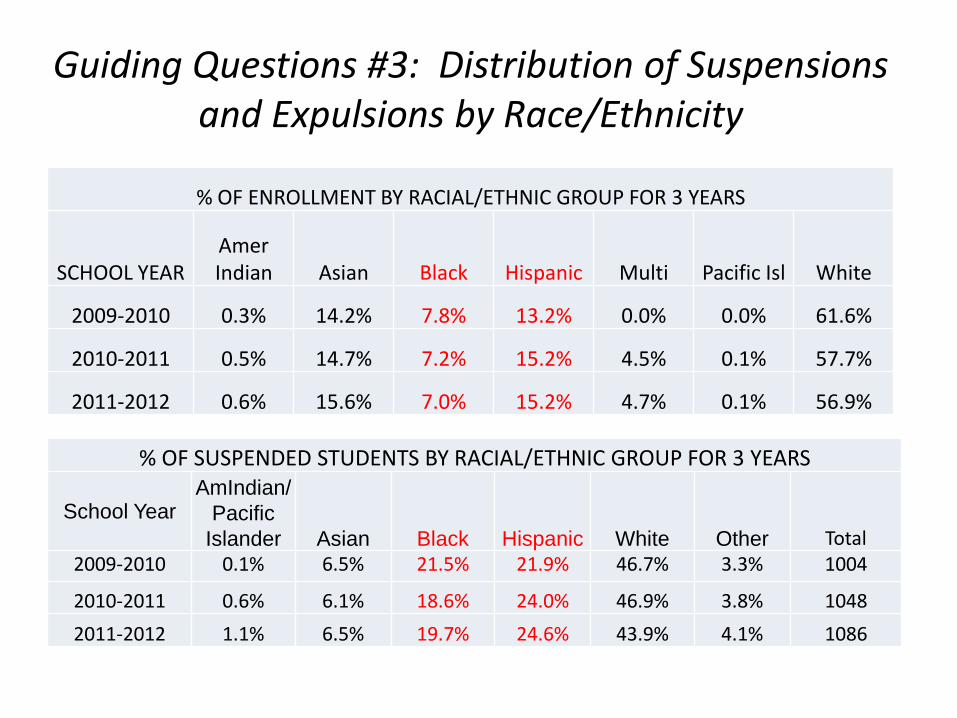
Guiding Questions #3: Distribution of Suspensions and Expulsions by Race/Ethnicity
% OF ENROLLMENT BY RACIAL/ETHNIC GROUP FOR 3 YEARS
SCHOOL YEAR Amer Indian Asian Black Hispanic Multi Pacific Isl White
2009-2010 0.3% 14.2% 7.8% 13.2% 0.0% 0.0% 61.6%
2010-2011 0.5% 14.7% 7.2% 15.2% 4.5% 0.1% 57.7%
2011-2012 0.6% 15.6% 7.0% 15.2% 4.7% 0.1% 56.9%
% OF SUSPENDED STUDENTS BY RACIAL/ETHNIC GROUP FOR 3 YEARS
School Year AmIndian/
Pacific
Islander Asian Black Hispanic White Other Total 2009-2010 0.1% 6.5% 21.5% 21.9% 46.7% 3.3% 1004
2010-2011 0.6% 6.1% 18.6% 24.0% 46.9% 3.8% 1048
2011-2012 1.1% 6.5% 19.7% 24.6% 43.9% 4.1% 1086

Guiding Questions #3: Distribution of Suspensions and Expulsions by Race/Ethnicity
7.8% 7.2% 7.0%
21.5%
18.6% 19.7%
0.0%
5.0%
10.0%
15.0%
20.0%
25.0%
2009-2010 2010-2011 2011-2012
Comparison of % of Enrollment and Suspended Students for Black Students for Last 3 Years
% Black of Enrollment
% Black of Suspended Students
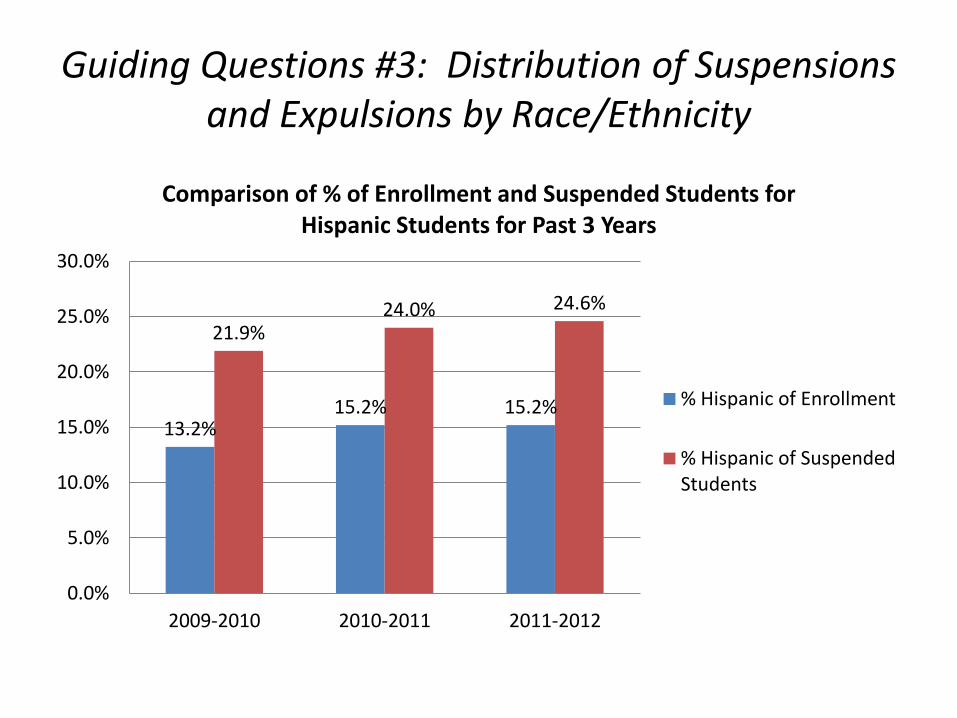
Guiding Questions #3: Distribution of Suspensions and Expulsions by Race/Ethnicity
13.2% 15.2% 15.2%
21.9% 24.0% 24.6%
0.0%
5.0%
10.0%
15.0%
20.0%
25.0%
30.0%
2009-2010 2010-2011 2011-2012
Comparison of % of Enrollment and Suspended Students for Hispanic Students for Past 3 Years
% Hispanic of Enrollment
% Hispanic of Suspended Students

Suspension Rates by Race/Ethnicity
School Year AmIndian
/Pacific Islander
Asian Black Hispanic White Other Total
2009-2010 0.6% 0.8% 4.6% 2.8% 1.3% 1.9% 1.7%
2010-2011 1.5% 0.7% 4.3% 2.6% 1.3% 1.4% 1.7%
2011-2012 2.7% 0.7% 4.6% 2.7% 1.3% 1.5% 1.6%
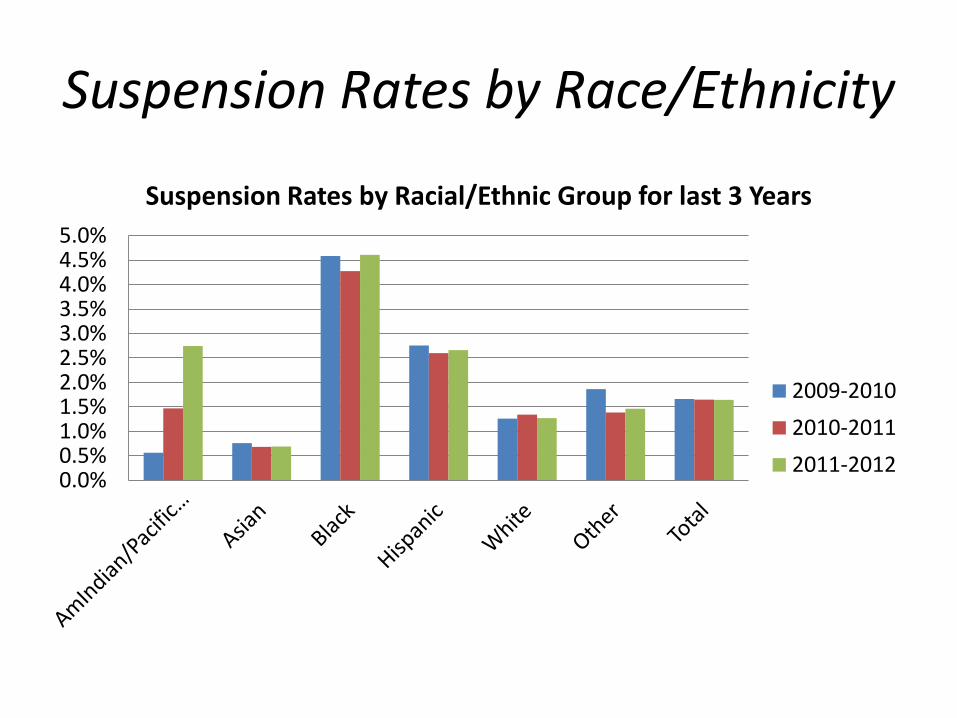
Suspension Rates by Race/Ethnicity
0.0% 0.5% 1.0% 1.5% 2.0% 2.5% 3.0% 3.5% 4.0% 4.5% 5.0%
Suspension Rates by Racial/Ethnic Group for last 3 Years
2009-2010
2010-2011
2011-2012
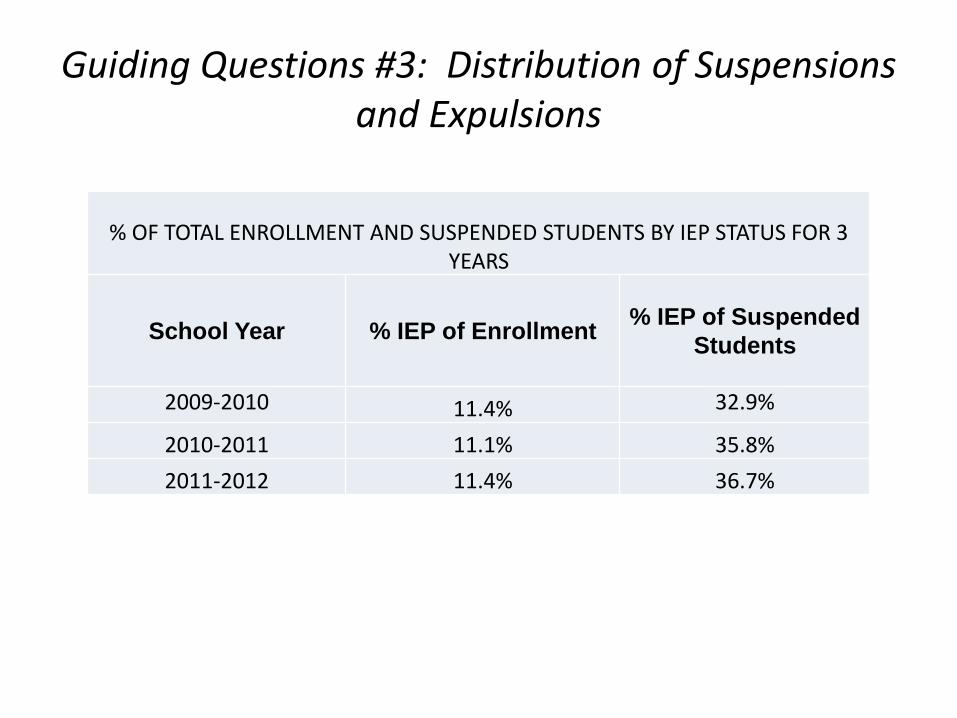
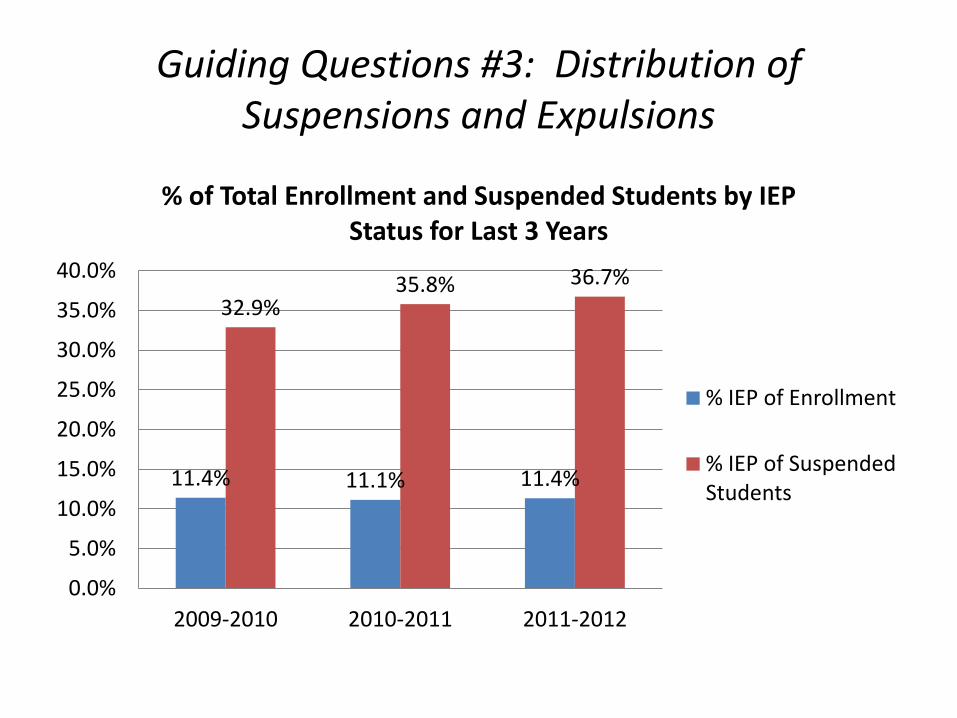
Guiding Questions #3: Distribution of Suspensions and Expulsions
% OF TOTAL ENROLLMENT AND SUSPENDED STUDENTS BY IEP STATUS FOR 3 YEARS
School Year % IEP of Enrollment % IEP of Suspended
Students
2009-2010 11.4% 32.9%
2010-2011 11.1% 35.8%
2011-2012 11.4% 36.7%
Guiding Questions #3: Distribution of Suspensions and Expulsions
11.4% 11.1% 11.4%
32.9% 35.8% 36.7%
0.0%
5.0%
10.0%
15.0%
20.0%
25.0%
30.0%
35.0%
40.0%
2009-2010 2010-2011 2011-2012
% of Total Enrollment and Suspended Students by IEP Status for Last 3 Years
% IEP of Enrollment
% IEP of Suspended Students

Suspension Rates by IEP Status
School Year IEP Non IEP Total
2009-2010 4.8% 1.3% 1.7%
2010-2011 5.3% 1.2% 1.7%
2011-2012 5.3% 1.2% 1.6%

Suspension Rates by IEP Status
4.8% 5.3% 5.3%
1.3% 1.2% 1.2% 1.7% 1.7% 1.6%
0.0%
1.0%
2.0%
3.0%
4.0%
5.0%
6.0%
2009-2010 2010-2011 2011-2012
Suspension Rate by IEP Status for Last 3 Years
IEP
Non IEP
Total

Observations
• Hispanic students are 1 ½ times more likely to be suspended relative to their percentage of the overall population.
• Black students are nearly three times more likely to be suspended relative to their percentage of the overall population.
• Students with an IEP are 3 ½ times more likely to be suspended relative to their percentage of the overall population.
Explanations for Disproportionality
• Are Black and Hispanic students and students with IEPs engaging in behaviors that are more serious in nature, which may lead to higher suspension levels?
• Are Black and Hispanic students are students with IEPs engaging in more incidents that may lead to higher suspension levels?
• Are teachers and other school staff who interact with the students making decisions that are influenced by cultural differences or knowledge of practice for students with IEPs?
Explanations for Disproportionality
• Are Black and Hispanic students and students with IEPs engaging in behaviors that are more serious in nature, which may lead to higher suspension levels?
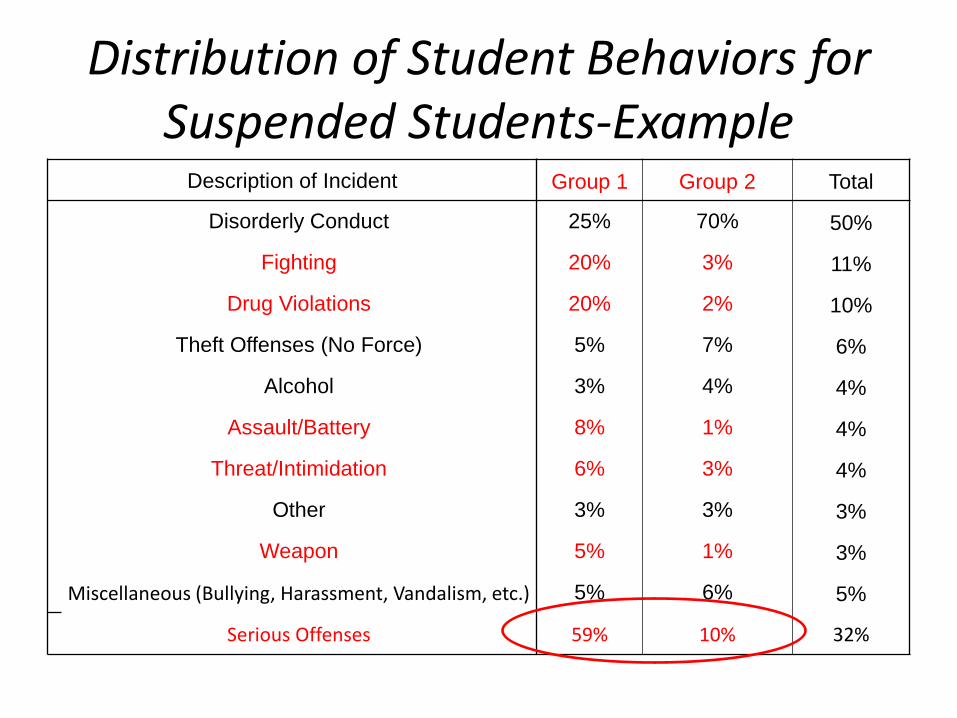
Distribution of Student Behaviors for Suspended Students-Example
Description of Incident Group 1 Group 2 Total
Disorderly Conduct 25% 70% 50%
Fighting 20% 3% 11%
Drug Violations 20% 2% 10%
Theft Offenses (No Force) 5% 7% 6%
Alcohol 3% 4% 4%
Assault/Battery 8% 1% 4%
Threat/Intimidation 6% 3% 4%
Other 3% 3% 3%
Weapon 5% 1% 3%
Miscellaneous (Bullying, Harassment, Vandalism, etc.) 5% 6% 5%
Serious Offenses 59% 10% 32%

Distribution of Student Behaviors by Ethnicity for Suspended Students
Description of Incident AmIndian Asian Black Hispanic White Other Total
Disorderly Conduct 35% 45% 50% 44% 39% 39% 43%
Fighting 15% 24% 21% 18% 20% 21% 20%
Drug Violations 10% 6% 5% 7% 7% 3% 6%
Theft Offenses (No Force) 15% 6% 5% 7% 4% 0% 5%
Alcohol 5% 1% 3% 4% 6% 8% 4%
Assault/Battery 0% 6% 4% 1% 4% 12% 4%
Threat/Intimidation 0% 2% 2% 3% 4% 3% 3%
Other 0% 1% 3% 3% 3% 3% 3%
Weapon 5% 2% 1% 4% 3% 0% 3%
Miscellaneous (Bullying, Harassment, Vandalism, etc.)
15% 7% 5% 9% 10% 11% 9%
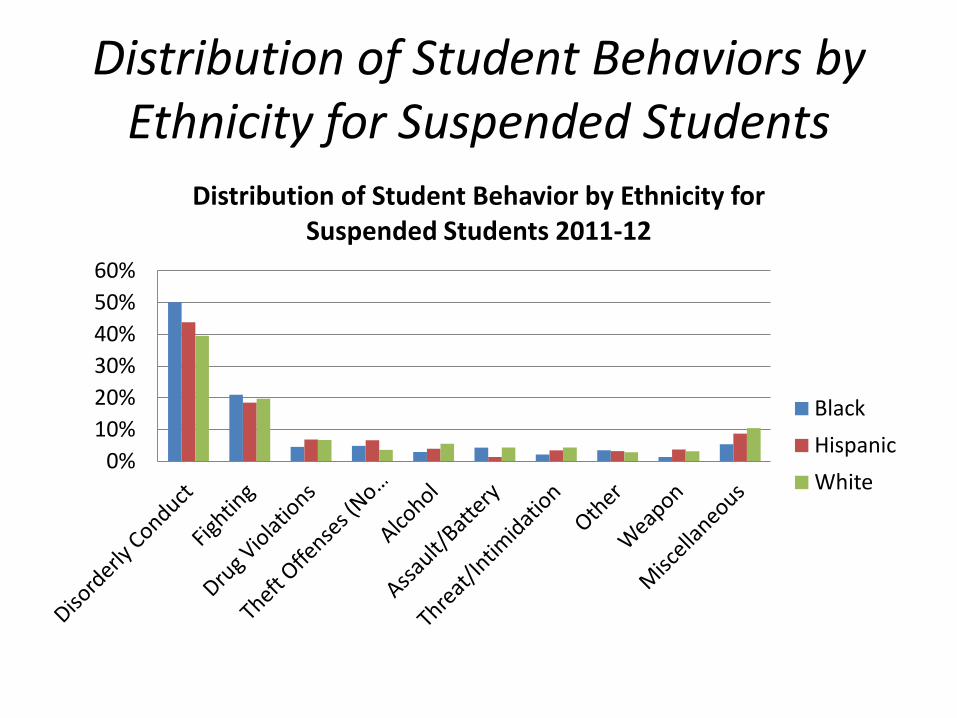
Distribution of Student Behaviors by Ethnicity for Suspended Students
0%
10%
20%
30%
40%
50%
60%
Distribution of Student Behavior by Ethnicity for Suspended Students 2011-12
Black
Hispanic
White

Distribution of Student Behaviors by IEP Status for Suspended Students
Description of Incident IEP Non-IEP
Disorderly Conduct 53% 37%
Fighting 19% 21%
Drug Violations 2% 9%
Theft Offenses (No Force) 3% 6%
Alcohol 1% 7%
Assault/Battery 6% 3%
Threat/Intimidation 5% 2%
Other 2% 4%
Weapon 3% 3%
Miscellaneous (Bullying, Harassment, Vandalism, etc.) 7% 10%

Distribution of Student Behaviors by IEP Status for Suspended Students
0%
10%
20%
30%
40%
50%
60%
Distribution of Student Behavior for Suspension by IEP Status 2011-12
IEP
Non-IEP
Explanations for Disproportionality
• Are Black and Hispanic students and students with IEPs engaging in more incidents that may lead to higher suspension levels?
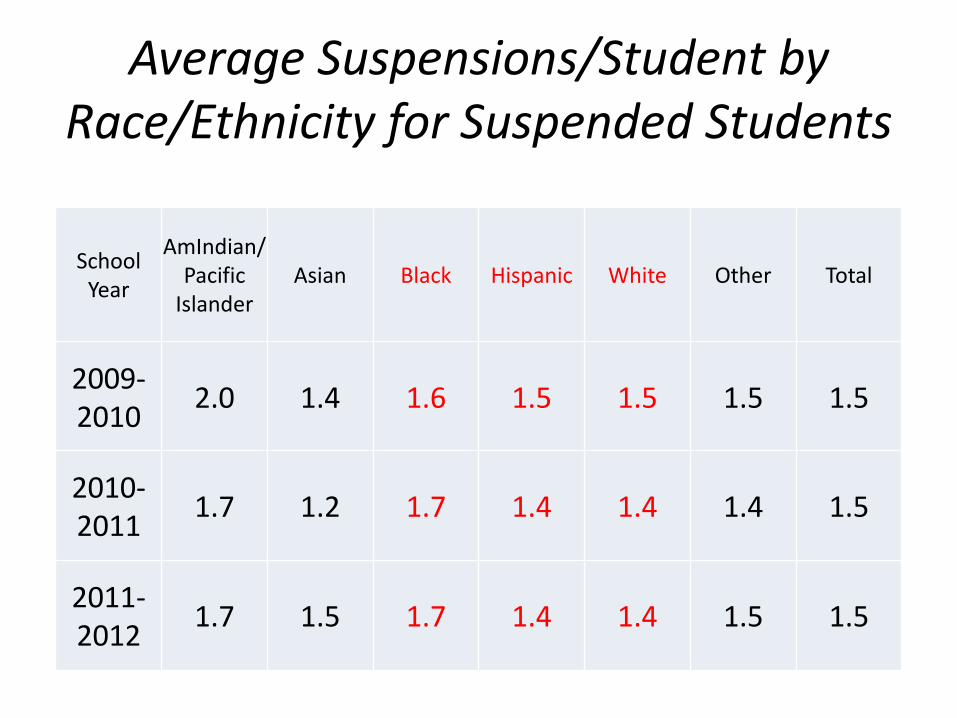
Average Suspensions/Student by Race/Ethnicity for Suspended Students
School Year
AmIndian/Pacific
Islander Asian Black Hispanic White Other Total
2009-2010
2.0 1.4 1.6 1.5 1.5 1.5 1.5
2010-2011
1.7 1.2 1.7 1.4 1.4 1.4 1.5
2011-2012
1.7 1.5 1.7 1.4 1.4 1.5 1.5
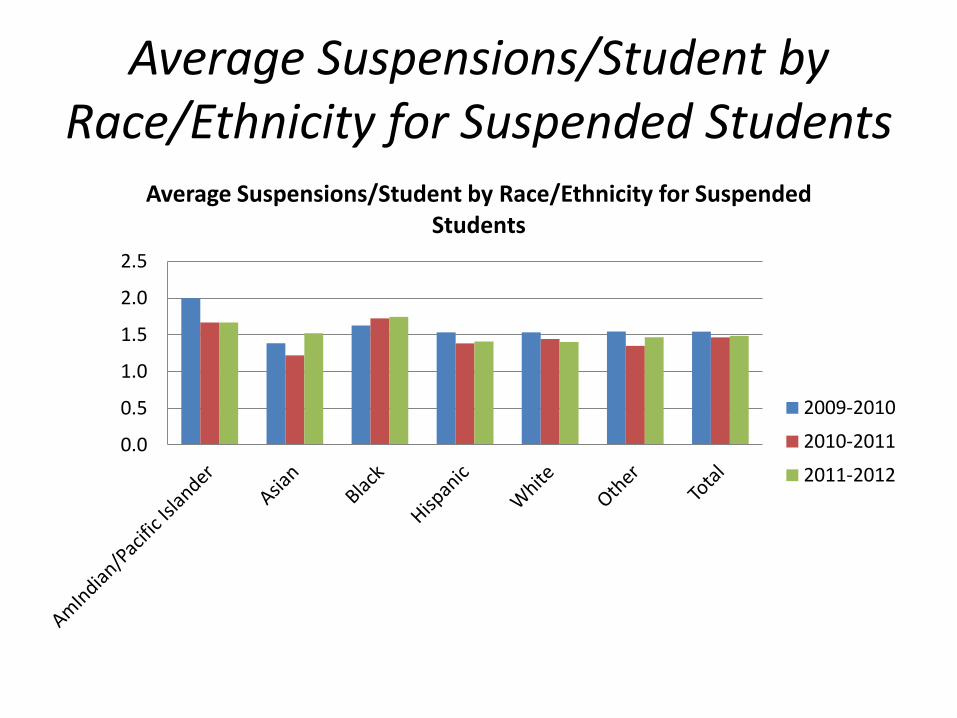
Average Suspensions/Student by Race/Ethnicity for Suspended Students
0.0
0.5
1.0
1.5
2.0
2.5
Average Suspensions/Student by Race/Ethnicity for Suspended Students
2009-2010
2010-2011
2011-2012
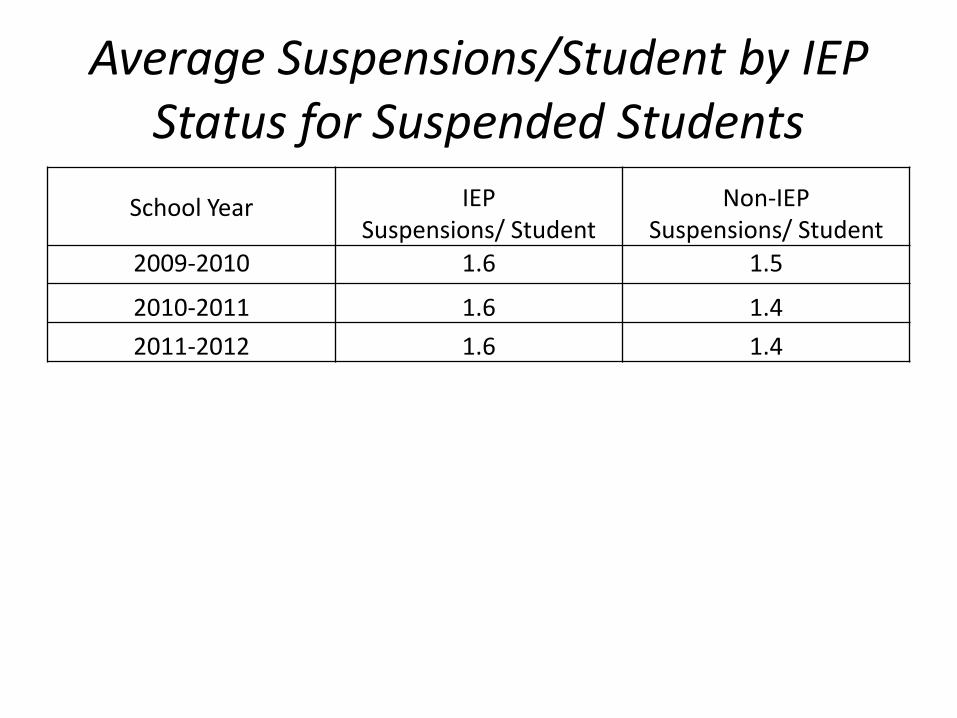
Average Suspensions/Student by IEP Status for Suspended Students
School Year IEP Suspensions/ Student
Non-IEP Suspensions/ Student
2009-2010 1.6 1.5
2010-2011 1.6 1.4
2011-2012 1.6 1.4

Average Suspensions/Student by IEP Status for Suspended Students
0.0
0.5
1.0
1.5
2.0
2.5
3.0
2009-2010 2010-2011 2011-2012
Average Suspensions/Student by IEP Status for Suspended Students
School Year IEP Suspensions/ Student
School Year Non IEP Suspensions/ Student

Explanations for Disproportionality
• Among the suspended students, Black and Hispanic students and students with IEPs do not appear to have engaged in higher percentages of the more serious offenses.
• Among the suspended students, Black and Hispanic students and students with IEPs have a higher average number of suspensions. This finding does not provide evidence as to whether these students are engaging in more suspendable behaviors.

Explanations for Disproportionality
• Are teachers and other school staff who interact with the students making decisions that are influenced by cultural differences or knowledge of practice for students with IEPs?
• We may need to conduct a case study to address the practice question.

Guiding Question #4
How prevalent are the cases of students who have been suspended multiple times?
• Percentage of HS seniors who have been suspended at least once during their school years.
• Percentage of students who have been suspended more than one time during their school years.
• This question will require additional analysis of the discipline data.
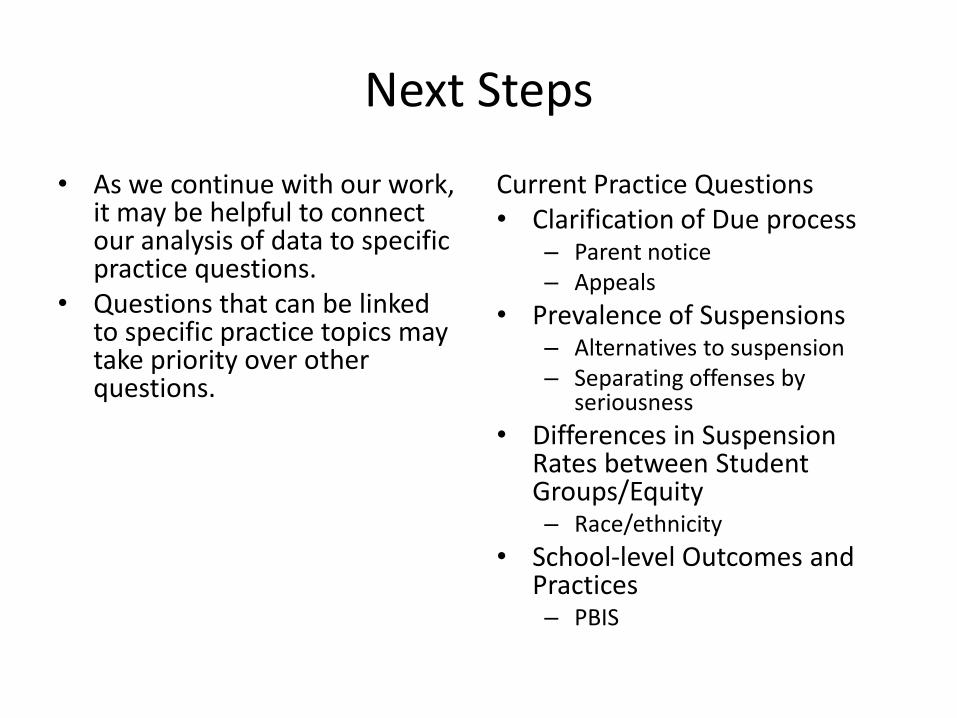
Next Steps
• As we continue with our work, it may be helpful to connect our analysis of data to specific practice questions.
• Questions that can be linked to specific practice topics may take priority over other questions.
Current Practice Questions • Clarification of Due process
– Parent notice – Appeals
• Prevalence of Suspensions – Alternatives to suspension – Separating offenses by
seriousness
• Differences in Suspension Rates between Student Groups/Equity – Race/ethnicity
• School-level Outcomes and Practices – PBIS