the state of biomanufacturing capacity – do we finally have …€¦ · 2008 – 29+ commercial...
TRANSCRIPT

The State of Biomanufacturing Capacity –Do We Finally Have Enough?
Howard L. Levine, Ph.D.IBC’s 10th International
Production and Economics of Biopharmaceuticals Boston, MA
September 19 – 22, 2005

From Clone to Clinic®
Biopharmaceutical Industry Growth Through 2015
$-
$200
$400
$600
$800
$1,000
$1,200
$1,400
$1,600
2002 2003 2004 2005 2006 2007 2008 2009 2010 2011 2012 2013 2014 2015
Year
Tota
l Sal
es ($
B)
Biopharma Total Pharma
Sources for BPTC Estimate: IMS Health, Arthur D. Little, and Woods-Mackenzie
2004 sales approaching 10% of almost $450B pharmaceutical market, growing to approximately 15% by 2015Biopharmaceutical sales growth approximately double that of the pharmaceutical marketAt 85% gross margin manufacturing sector forecast to grow to $30B by 2015

From Clone to Clinic®
Biomanufacturing Market Segmentation
CommercialMicrobial:2004 – 162008 – 19
Clinical Microbial:2004 – 25
2008 – 29+
Commercial Cell Culture:2004 – 162008 – 19
Clinical Cell Culture:2004 – 23
2008 – 25+
Product Development Companies (PDC)

From Clone to Clinic®
Biomanufacturing Market Segmentation
CommercialMicrobial:2004 – 72008 – 8
Clinical Microbial:2004 – 312008 – 34
Commercial Cell Culture:
2004 – 82008 – 10
Clinical Cell Culture:2004 – 352008 – 38
Contract Manufacturing Organizations (CMO)

From Clone to Clinic®
Biopharma CMO Market Growth
Biopharma$29 B
Biopharma CMO$1 B
Total pharma market$390 B
Biopharma CMO$3 B
Biopharma$70 B
Total pharma market$690 B
2001 2007
Sources for BPTC Estimate: IMS Health, Arthur D. Little, and Woods-Mackenzie
Outsourcing of commercial manufacturing accounts for approximately 3.5% of biopharmaceutical product revenuesCMO percentage of market to remain relatively flat through 2007

From Clone to Clinic®
Mammalian Cell Culture Capacity
Amgen8%
Biogen Idec14%
Genentech32%Novartis
10%
Wyeth8%
Others28%
Boehringer Ingelheim
40%
Abgenix8%
Baxter Biosciences
8%
Lonza22%
Diosynth6%
Others16%
Distribution by Company – 2004
Contract ManufacturersTotal installed capacity ~400,000 L
Product Development Cos.Total installed capacity ~950,000 L
Will decrease with sale of
NIMO & NICO

From Clone to Clinic®
Cell Culture Bioreactor Capacity Distribution
Current expansion projects are adding larger volume bioreactorsat current manufacturersBy 2008, over 10 companies will have >100,000 L installed capacity
0
5
10
15
20
<1000 L 1000L - <10000L 10000L - 100000L >100000L
Total Reactor Volume
Num
ber o
f Com
pani
es
CMO (2004) CMO (2008) PDC (2004) PDC (2008)

From Clone to Clinic®
BPTC Approach to Capacity Analysis
Bottom-up methodology• Plant-by-plant estimation of capacity “supply”• Product-by-product and dose-driven estimation of
“demand”Probability weighting factors• Accounting for multiple products targeting same
indication• Assumptions for probability of success and time to
marketMarket differentiation• Microbial and mammalian cell culture markets• Clinical and commercial markets
Apply Monte-Carlo analysis to quantify probability of predicted outcomes

From Clone to Clinic®
Microbial Volume Capacity – Existing and Forecast
Clinical supply represents approximately 7- 12% of installed capacityPDCs control the majority of total installed capacity• Approximately 80% in 2003• Contracting to approximately 70% by 2009
0
200
400
600
800
1000
1200
Estim
ated
Inst
alle
d Fe
rmen
ter V
olum
e('0
00 L
)
2003 2004 2005 2006 2007 2008 2009Year
PDCCMO

From Clone to Clinic®
Cell Culture Volume Capacity – Existing and Forecast
Perfusion capacity adjusted to equivalent fed-batch capacityClinical supply represents approximately 5 – 10% of installed capacityPDCs control the majority of total installed capacity• Approximately 80% in 2003• Moderate growth to approximately 85% by 2009
0
500
1000
1500
2000
2500
3000
3500
Estim
ated
Inst
alle
d B
iore
acto
r Vol
ume
('000
L)
2003 2004 2005 2006 2007 2008 2009Year
PDCCMO
From Clone to Clinic®
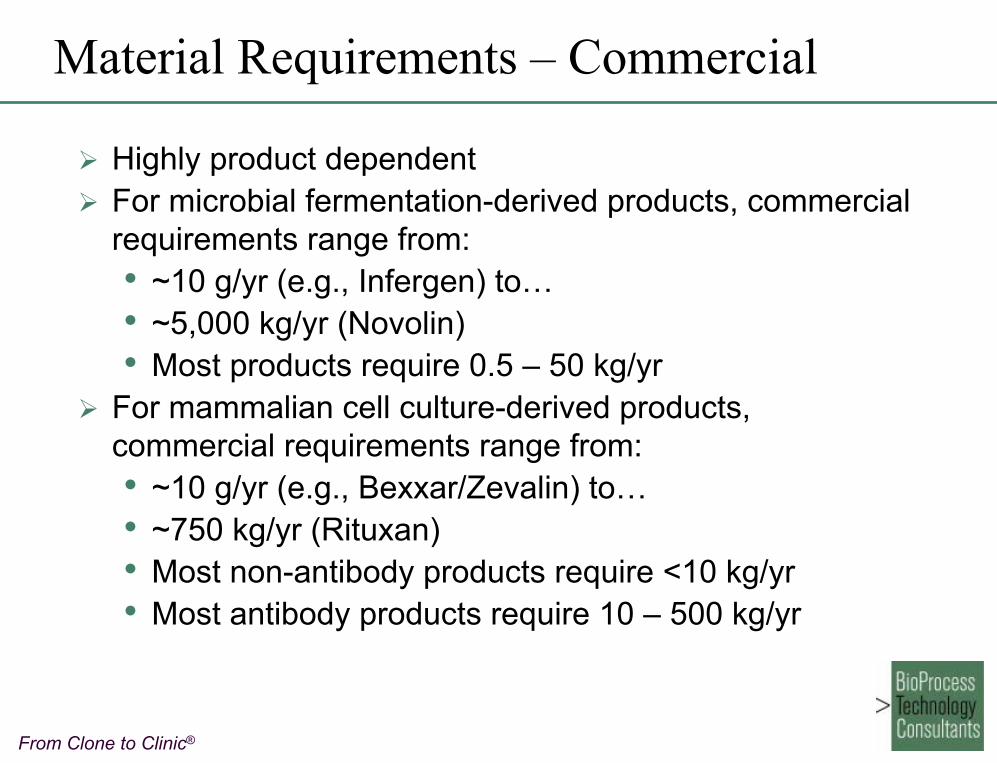
Material Requirements – Commercial
Highly product dependentFor microbial fermentation-derived products, commercial requirements range from:• ~10 g/yr (e.g., Infergen) to…• ~5,000 kg/yr (Novolin)• Most products require 0.5 – 50 kg/yr
For mammalian cell culture-derived products, commercial requirements range from:• ~10 g/yr (e.g., Bexxar/Zevalin) to…• ~750 kg/yr (Rituxan)• Most non-antibody products require <10 kg/yr• Most antibody products require 10 – 500 kg/yr

From Clone to Clinic®
Trends in Commercial Product Requirements
Fastest growing segment is monoclonal antibodies• Growth rate > 40% per year
Trend for commercial products is from agonists to antagonists• Larger volume, less expensive ($/g) products
2004 Sales by Mfg Technology/Prod Type
Mammalian Mab, $13.1
Mammalian rProtein, $17.8
Microbial rProtein, $15.4
Mammalian Products
0.0
500.0
1000.0
1500.0
2000.0
2500.0
3000.0
Amount Required (kg/yr) N Ave. Sales Price ($/mg)
rProteinsMAbs

From Clone to Clinic®
Product-by-Product Analysis Methodology: Commercial Products
Product sales (2004 WW sales $/yr)Source: Industry and co. financial reports
Product pricing ($/mg)Source: 2004 Red Book
Product amount required (kg/yr)
Expression level/overall yield (g/L)Source: Published data and estimates Cell Culture volume required (L/yr)
Mfg site determined where possibleTechnology for manufactureSource: Literature and internal evaluation
Per patient dosing (g/pt/yr)Source: Prescribing info, reg. documents
Treatment population (pt/yr)
}}
Inputs Outputs

From Clone to Clinic®
2004 Bulk Product Requirements (Kg/yr) –Mammalian Commercial Products
Total estimated bulk product requirements for mammalian cell culture commercial products (2004):
• All mammalian products – 2,875 kg/yr• Monoclonal antibodies – 2,810 kg/yr• rProteins – 65 kg/yr
Significant growth in monoclonal antibody product requirements:• Approximately 65% per year over last 3 years • ~ 1,000 kg/yr (2002); ~ 1,700 kg/yr (2003)
Estimated requirements for top selling biopharmaceutical products:• Rituxan 784 Kg• Remicade 615 Kg• Enbrel 577 Kg• Herceptin 287 Kg• Avastin 150 Kg• Erbitux 107 Kg• All others (38) 357 Kg

From Clone to Clinic®
0
500
1,000
1,500
2,000
2,500
3,000
3,500
Ritu
xan
Enb
rel
Her
cepti
n
Rem
icade
*
Erb
itux
Rec
ombin
ate
Ava
stin
Pulm
ozym
e
Kog
enate
* A
ll othe
rs (3
5)
Product
Estd
CC
Vol
200
4 ('0
00 L
/yr)
2004 Cell Culture Volume Requirements –Mammalian Commercial Products
Total estimated cell culture volume requirements for mammalian cell culture commercial products (2004):
• All mammalian products – 11.2 M L/yr• Monoclonal antibodies – 9.0 M L/yr• rProteins – 2.2 M L/yr
Significant growth from previous years:• Approximately 35% per year over last 3 years • ~ 6.2 M L/yr (2002); ~ 8.5 M L/yr (2003)
* Perfusion adjusted to equivalent batch/fed batch volume

From Clone to Clinic®
Growth of Current Commercial Cell Culture Products
Worldwide sales shown for each productAverage CAGR for products on market 3 years or more is >45%Growth of existing products represents significant driver for future capacity demand
$-
$500
$1,000
$1,500
$2,000
$2,500
$3,000
2000 2001 2002 2003 2004
Year
Sale
s ($
M)
EnbrelRituxanRemicadeHerceptinRecombinateAvastinSynagisHumiraErbitux

From Clone to Clinic®
Forecast Cell Culture Volume Requirements –Existing Commercial Products Only
0.0
5.0
10.0
15.0
20.0
25.0
30.0
35.0
2005 2006 2007 2008 2009 2010
Year
Cel
l Cul
ture
Vol
ume
(ML/
yr)
Capacity shown based on equivalent fed-batch basis for perfusion productsBase analysis assumes no changes in current volumetric productivitiesPotential 3X process improvements for Enbrel, Erbitux, and Rituxan could result in 35% decrease in demand by 2010• 29.4 ML (no improvement) vs. 19.0 ML (predicted improvement)
Further process improvements in other products could decreasedemand for existing products even further

From Clone to Clinic®
Why Invest in Process Improvement?
Regulatory environment becoming more supportive• Risk-based GMP initiatives• Comparability protocols• Increasing number of post-approval process changes
Significant technical advances enable dramatic increases in volumetric productivities for mammalian cell culture processes• High expressing cell lines• Media development and optimization• Improvements in downstream processing• Increases in basic operating efficiencies can improve
volumetric productivities without requiring major process changes

From Clone to Clinic®
Why Invest in Process Improvement?
Financial returns are compelling for improvements to older large volume processes• At $400/g, manufacturing costs for a 500 kg/yr MAb
represent $200 Million per year or more• A significant increase in volumetric productivity can
easily be expected to provide savings of 20% or more− 3X process improvements could lower bioreactor
capacity demand by 35%• Payback time for a successful $30 Million
comparability program to implement a higher yielding process could be less than one year.

From Clone to Clinic®
Product-by-Product Analysis Methodology: Pipeline (Phase II/III) Products
* Launch date & probability weight determined by development phase -BPTC estimates
Inputs OutputsPer patient dosing (g/pt/yr)Source: Literature, databases, press releases
Indication Prevalence (pt/yr)Source: Databases
Product amount required post-launch* (kg/yr)
Expression level/overall yield (g/L)Source: Published data and estimates
Cell Culture volume required post-launch* (L/yr)
Technology for manufactureSource: Literature and internal evaluation
Market Penetration (% prev/yr)Based on indication & # products per indication
}
}

From Clone to Clinic®
Success Rate and Turnover Data
90%
64%
45%
86%
30%
40%
100%
56%
56%
0% 20% 40% 60% 80% 100% 120%
BLA
Phase III
Phase II
Success rate (to next stage)
2004 Performance2003 performanceBPTC model values
Turnover statistics (2003/2004)No BLA products remained in the same stage• All either approved or rejected
60 – 65% of Phase III products remained in Phase III• ≤40% moved forward or failed
61 – 67% of Phase II products remained in Phase II

From Clone to Clinic®
Distribution of Pipeline by Production Technology
Pipeline Number of Products
0
10
20
30
40
50
60
70
Market BLA Phase III Phase II Phase I
Stage
Num
ber o
f Pro
duct
s
MammalianMicrobial
Pipeline Fraction MAb-based
0%10%20%30%40%50%60%70%80%90%
100%
Market BLA Phase III Phase II Phase I
Stage
Perc
ent M
Ab-
base
d
MammalianMicrobial
Pipeline is 70% mammalian cell cultureSignificant trend towards antibody-based products is leveling off at ~ 85% of mammalian cell culture pipelineSuccess of Fabs coupled with improvements in antibody expression in microbial systems may shift balance

From Clone to Clinic®
Forecast Cell Culture Volume Requirements –Commercial and Pipeline Products
Top 5 pipeline drivers fail:46.8 ML
0.0
10.0
20.0
30.0
40.0
50.0
60.0
70.0
2004 2005 2006 2007 2008 2009
Year
CC
Vol
ume
Req
d (M
L/y
r)
Commercial Pipeline
Other factors that may affect future demand include variation in time to approval, market penetration, and process yield
Top 5 pipeline drivers succeed:68.5 ML~ 50% demand
from new products

From Clone to Clinic®
Comparison Mammalian Cell Culture Supply & Demand
2004 2005 2006 20072008 2009
2010
0
500
1,000
1,500
2,000
2,500
3,000
3,500
4,000
Inst
alle
d R
xr V
olum
e ('0
00 L
)
Year
Forecast Demand (Y+1) Forecast Supply

From Clone to Clinic®
Cell Culture Supply & Demand – Conclusions
Slight excess of supply for coming 2 – 3 yearsAccess to capacity may cause temporary isolated shortagesPotential shortages may occur in 2009 and beyond if additional capacity is not installed or processes improvedUnusually high success or fail rates may result in dramatic fluctuations in supply and demand

From Clone to Clinic®
Capacity Utilization Scenarios – 2009 Forecast
112%92%76%No commercial process yield improvements
95%75%59%
Commercial yield improvement for three large volume products
Top 5 Pipeline Volume Drivers
Succeed
MostProbable
Case
Top 5 Pipeline Volume Drivers
FailScenario

From Clone to Clinic®
Monte Carlo Simulation – Assumptions and Methods
Using data from most probable scenario as starting point, calculate a probable range of output scenarios based on 3,000 independent calculations using random values from within the defined probability ranges for each of the following input variables
• Approval - Yes/No− Yes frequency based on stage of development
• Overall Yield− Includes expression level and purification yield− Normal distribution using standard deviation
• Patient population− Normal distribution with increasing standard deviation
year to yearOutput shows distribution of total capacity demand foreach year based on selected variables

From Clone to Clinic®
Total Capacity Demand – Distribution By Year
3,000 5,000
2,400 4,000
1,800 3,000
1,200 2,000
600 1,000
0 0
2002 2003 2004 2005 2006 2007 2010
Annual Pipeline Mean
+/- Standard Dev (nml)
Projected Supply
Rea
ctor
Vol
ume
(‘000
L)
Year
5,000
4,000
3,000
2,000
1,000
0
2003 projection2005 projection

From Clone to Clinic®
What’s Next?10 Year Forecast Requires a Different Approach
totalpatients
year#doses
Patient/yeargramsdose
Lgramx % patients
treated x x x
time
L/gm
time
Dose/Pt/yr
PER INDICATION
time
%biol
Vs. total %biol
Product-by-product approach unlikely to successfully predict outcome:• 10 years ago (1995), OKT-3 and ReoPro were the only approved
antibody products• Most meaningful products from a manufacturing capacity
perspective were in pre-clinical/early clinical developmentDevelop new model based on indication and treatment prevalence to forecast manufacturing requirements over a longer time horizon

From Clone to Clinic®
Overall ConclusionsSupply expansion will result in more large-scale players with a broader distribution of capacity• PDCs retain approximately 75 – 80% of total industry
capacityAs volumetric productivities increase, bioreactor capacity may no longer be throughput-limiting in many facilities• Future efforts should focus on improving downstream
processingOverall, the demand for cell culture volumetric capacity will likely continue to grow for the foreseeable future• Process improvements will act to reduce demand• Sales growth and new product approvals will act to increase
demand• On industry-wide aggregate basis, capacity supply meets
demand requirements; however, absent significant process yield improvements, utilization industry-wide is likely to increase

From Clone to Clinic®
Overall ConclusionsThe range of supply-demand scenarios over the next 5 – 10 years is significant, influenced by:
− Process yields− Time to approval−Market penetration− Success rates−Operational efficiency
Development of effective manufacturing strategies requires methods for defining the risk of supply shortages and anticipating demand increases• Monte Carlo simulations provide one means of
defining this risk

From Clone to Clinic®
Acknowledgements
Tom Ransohoff
• Supply/demand analysis; production yields
James Blackwell, PhD
• Supply/demand analysis; Monte-Carlo simulations
Susan Dana Jones, PhD
• Patient populations; market penetration
Robert Mittendorff, II, MBA, MD
• Monte-Carlo simulations
Richard Stock, PhD (BioPharm Services)
• Clinical products database