the state of alternative investments: a global view investments.pdf · the state of alternative...
TRANSCRIPT
The State of Alternative
Investments: A Global View
Keith Black, PhD, CFA, CAIA
Showcase your Knowledge @CAIA_Keith Black @CAIAAssociation
State of Alternative Investment – 2
About CAIA Association
The global leader in alternative investment education
Non-profit established in 2002, based in Amherst, MA, with
offices in Hong Kong, Singapore, Geneva, and London
Over 8,700 current charterholders in more than 85 countries
28 vibrant chapters located in financial centers around the
world
More than 150 educational and networking events each year
Excellence in AI education through the CAIA designation and
the Fundamentals of Alternatives certificate program

State of Alternative Investment – 3
Alternative Investment Education
Alternatives currently represent over $14 trillion in assets
under management, while assets in liquid alternatives
have grown substantially.
The CAIA Association Mission: Establish the CAIA designation as the benchmark for alternative
investment education worldwide
Promote professional development through continuing education,
innovative research and thought leadership
Advocate high standards of professional ethics
Connect industry professionals globally
State of Alternative Investment – 4
The CAIA Charter Designation
Globally recognized credential for professionals
managing, analyzing, distributing, or regulating
alternative investments.
Highest standard of achievement in alternative
investment education.
Comprehensive program comprised of a two-tier
exam process: Level I assesses understanding of various alternative asset classes
and knowledge of the tools and techniques used to evaluate the
risk-return attributes of each one.
Level II assesses application of the knowledge and analytics
learned in Level I within a portfolio management context.
Both levels include segments on ethics and professional conduct.
State of Alternative Investment – 5
Fundamentals of Alternative Investments
The Fundamentals of Alternative Investments certificate program provides a foundation of core concepts in alternative investments.
Fundamentals fills a critical education gap for those who need to understand the evolving landscape of alternative investments.
Online, 20-hour, self-paced course
Earns CE hours for the CIMA®, CIMC®, CPWA®, CPA ®, and CFP® designations
Understand the core concepts in alternative investments
Gain confidence in discussing and positioning alternatives

State of Alternative Investment – 6
Are US Equity Markets Rich?
0.00
5.00
10.00
15.00
20.00
25.00
30.00
35.00
S&
P 5
00
P/E
Ra
tio
S&P 500 P/E Ratio
Source: CAIA and Bloomberg

State of Alternative Investment – 7
Fixed Income 30+ Year Bull Market
-2
0
2
4
6
8
10
12
14
16
18
Yie
ld
German Bund 10 Year US 10 Year
Source: CAIA and Bloomberg
State of Alternative Investment – 8
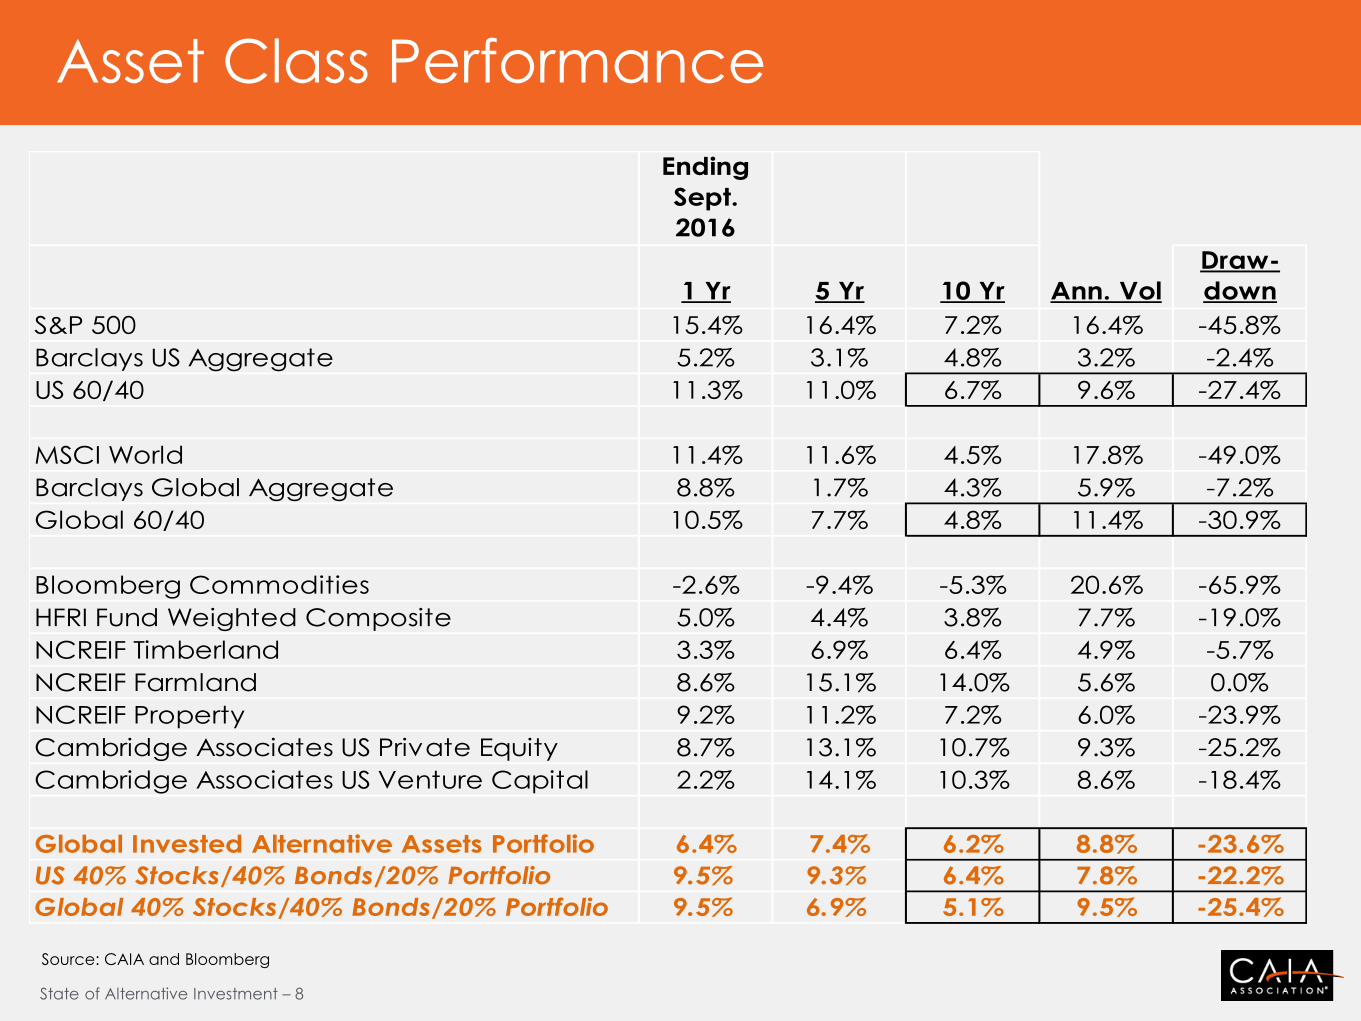
Ending
Sept.
2016
1 Yr 5 Yr 10 Yr Ann. Vol
Draw-
down
S&P 500 15.4% 16.4% 7.2% 16.4% -45.8%
Barclays US Aggregate 5.2% 3.1% 4.8% 3.2% -2.4%
US 60/40 11.3% 11.0% 6.7% 9.6% -27.4%
MSCI World 11.4% 11.6% 4.5% 17.8% -49.0%
Barclays Global Aggregate 8.8% 1.7% 4.3% 5.9% -7.2%
Global 60/40 10.5% 7.7% 4.8% 11.4% -30.9%
Bloomberg Commodities -2.6% -9.4% -5.3% 20.6% -65.9%
HFRI Fund Weighted Composite 5.0% 4.4% 3.8% 7.7% -19.0%
NCREIF Timberland 3.3% 6.9% 6.4% 4.9% -5.7%
NCREIF Farmland 8.6% 15.1% 14.0% 5.6% 0.0%
NCREIF Property 9.2% 11.2% 7.2% 6.0% -23.9%
Cambridge Associates US Private Equity 8.7% 13.1% 10.7% 9.3% -25.2%
Cambridge Associates US Venture Capital 2.2% 14.1% 10.3% 8.6% -18.4%
Global Invested Alternative Assets Portfolio 6.4% 7.4% 6.2% 8.8% -23.6%
US 40% Stocks/40% Bonds/20% Portfolio 9.5% 9.3% 6.4% 7.8% -22.2%
Global 40% Stocks/40% Bonds/20% Portfolio 9.5% 6.9% 5.1% 9.5% -25.4%
Asset Class Performance
Source: CAIA and Bloomberg
State of Alternative Investment – 9
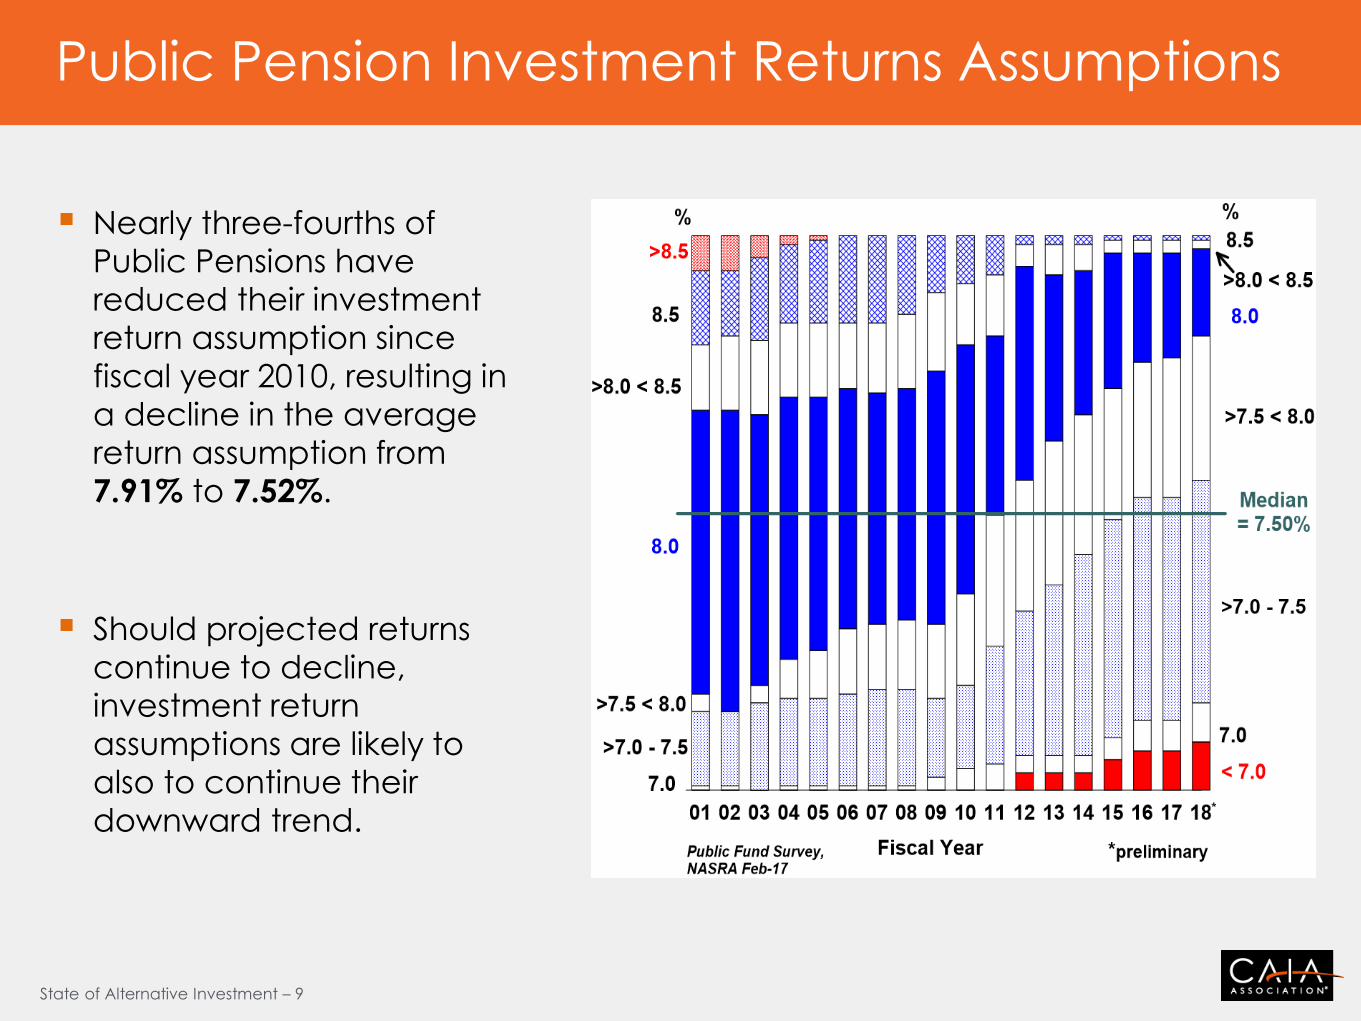
Public Pension Investment Returns Assumptions
Nearly three-fourths of
Public Pensions have
reduced their investment
return assumption since
fiscal year 2010, resulting in
a decline in the average
return assumption from
7.91% to 7.52%.
Should projected returns
continue to decline,
investment return
assumptions are likely to
also to continue their
downward trend.
State of Alternative Investment – 10
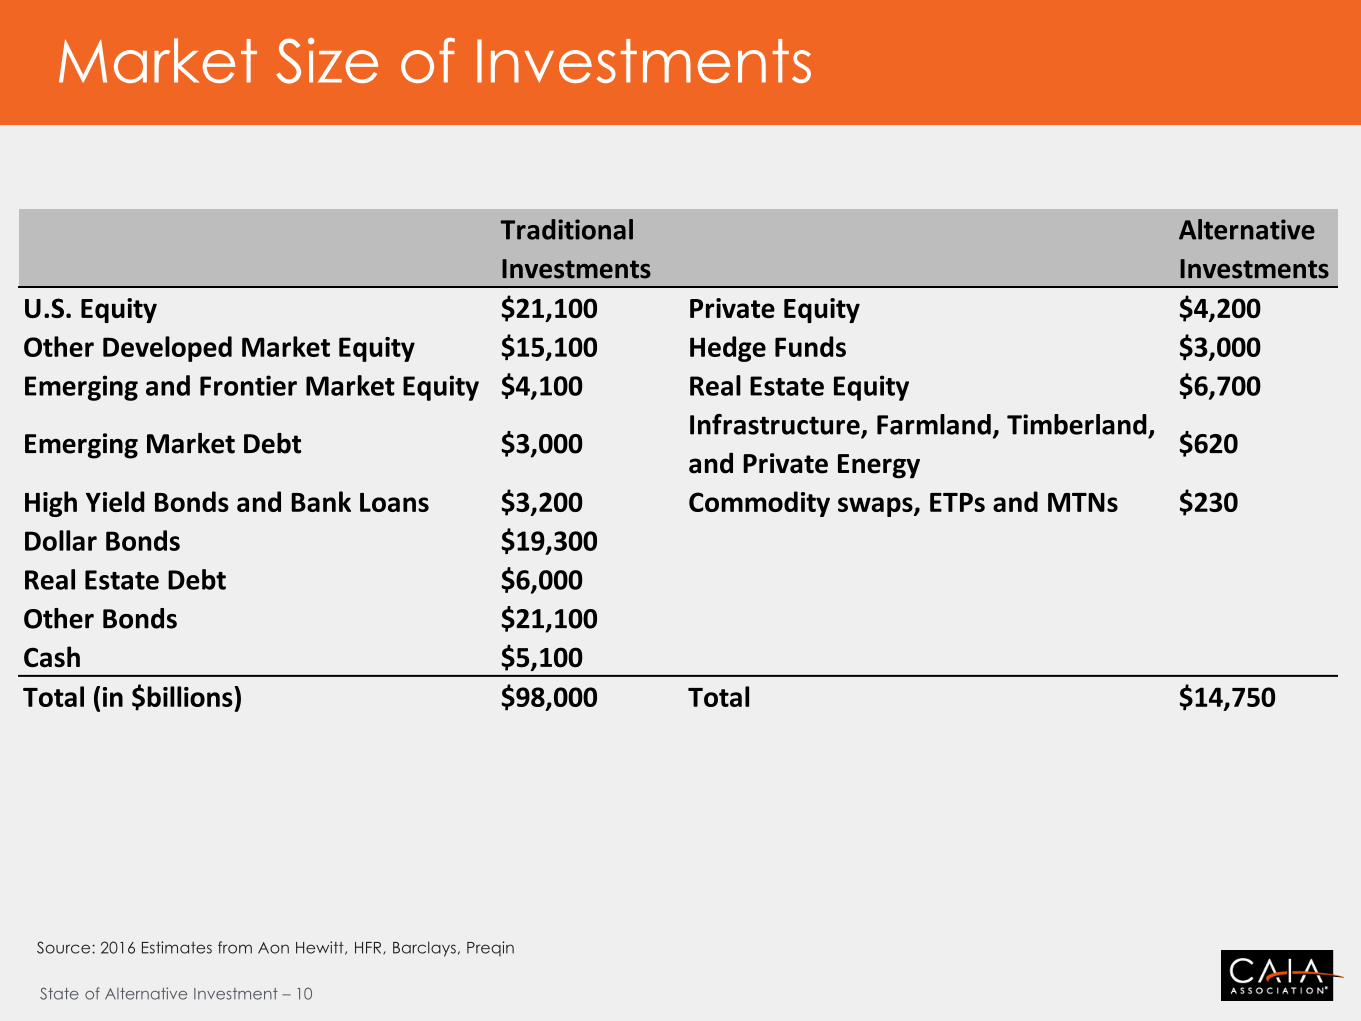
Market Size of Investments
Source: 2016 Estimates from Aon Hewitt, HFR, Barclays, Preqin
Traditional
Investments
Alternative
Investments
U.S. Equity $21,100 Private Equity $4,200
Other Developed Market Equity $15,100 Hedge Funds $3,000
Emerging and Frontier Market Equity $4,100 Real Estate Equity $6,700
Emerging Market Debt $3,000 Infrastructure, Farmland, Timberland,
and Private Energy$620
High Yield Bonds and Bank Loans $3,200 Commodity swaps, ETPs and MTNs $230
Dollar Bonds $19,300
Real Estate Debt $6,000
Other Bonds $21,100
Cash $5,100
Total (in $billions) $98,000 Total $14,750

State of Alternative Investment – 11
Participation In Alternatives
Source: Preqin
State of Alternative Investment – 12
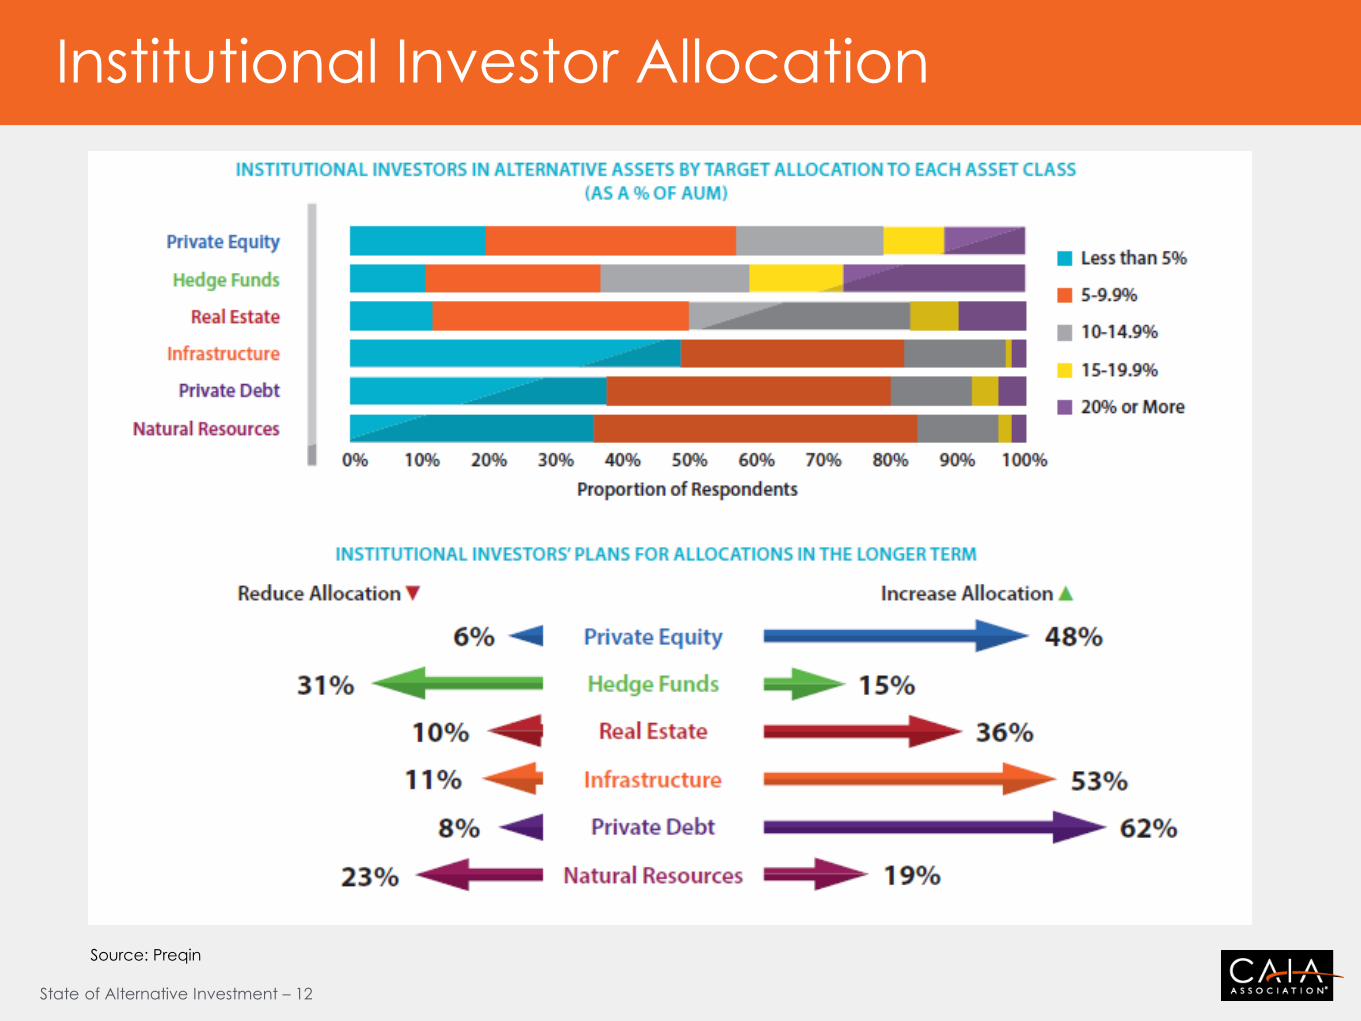
Institutional Investor Allocation
Source: Preqin
State of Alternative Investment – 13
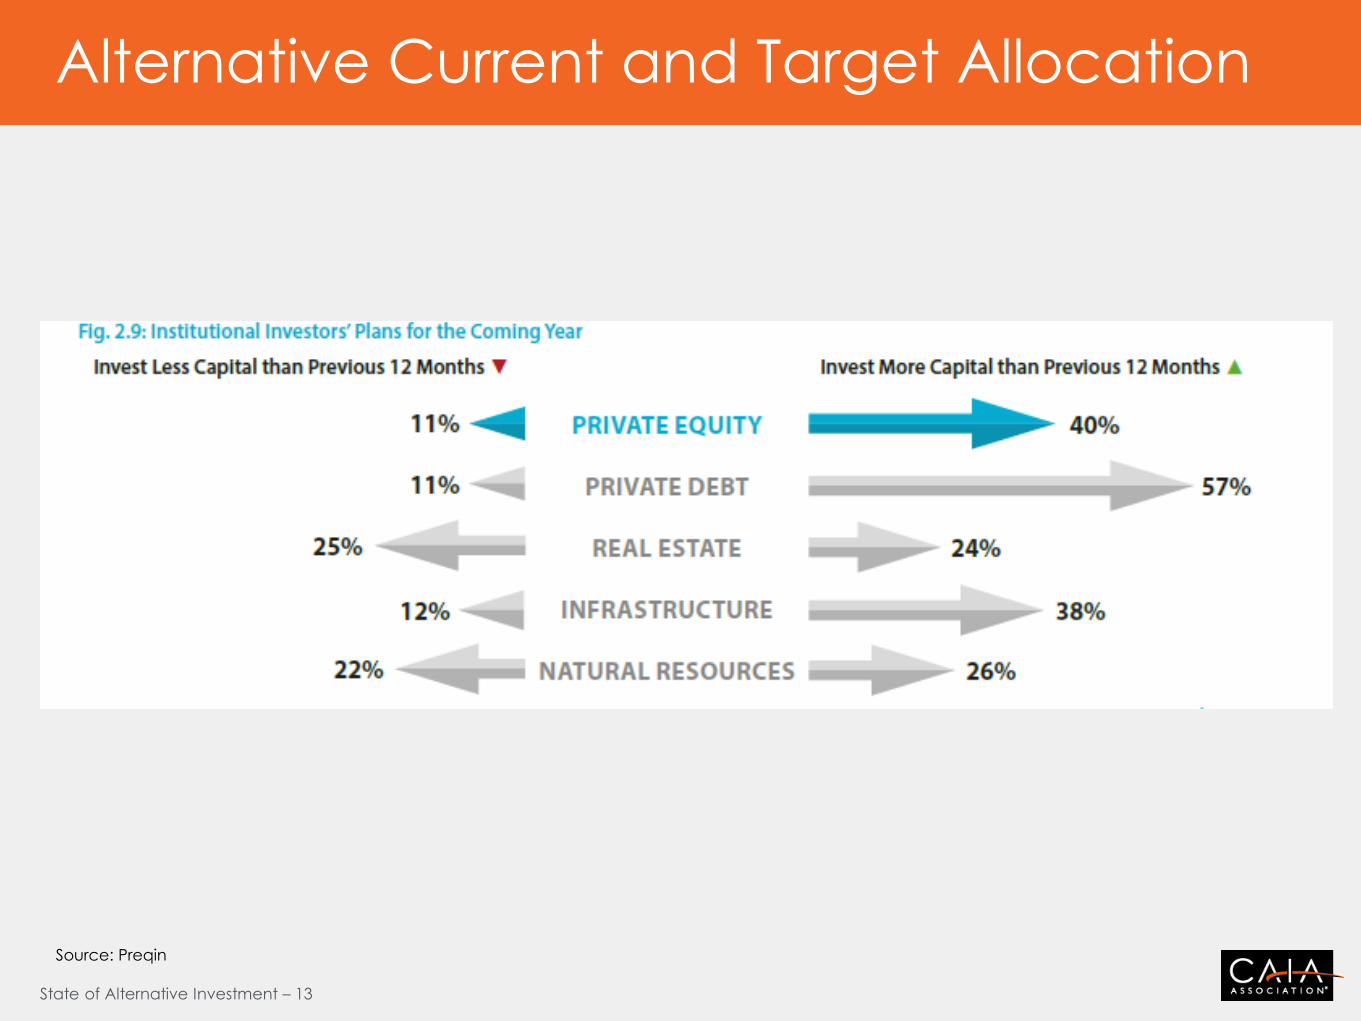
Alternative Current and Target Allocation
Source: Preqin
State of Alternative Investment – 14
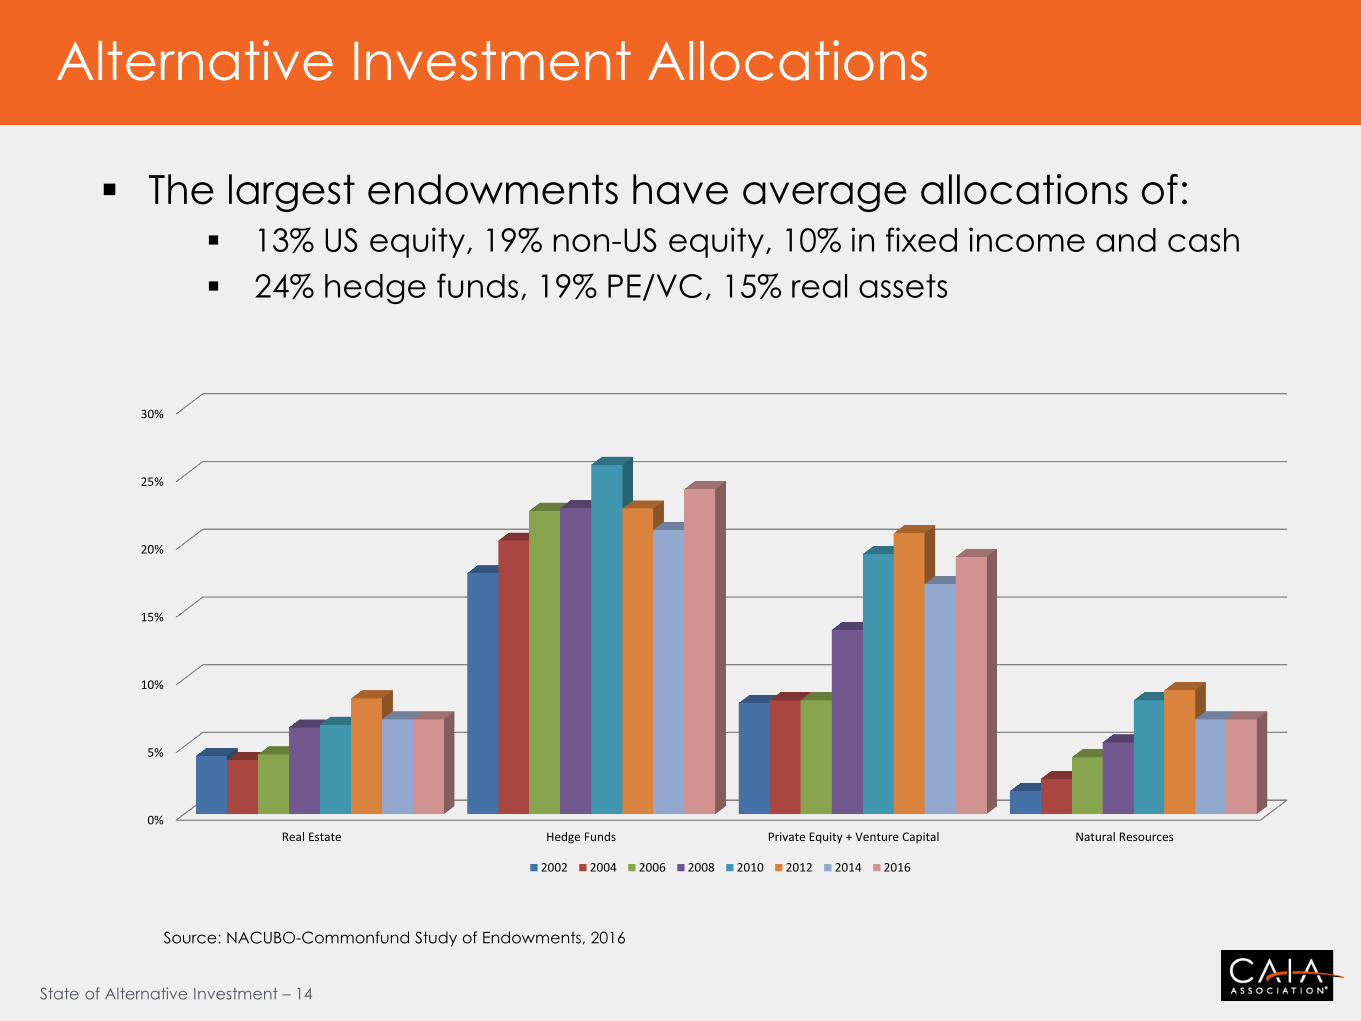
Alternative Investment Allocations
The largest endowments have average allocations of: 13% US equity, 19% non-US equity, 10% in fixed income and cash
24% hedge funds, 19% PE/VC, 15% real assets
Source: NACUBO-Commonfund Study of Endowments, 2016
0%
5%
10%
15%
20%
25%
30%
Real Estate Hedge Funds Private Equity + Venture Capital Natural Resources
2002 2004 2006 2008 2010 2012 2014 2016
State of Alternative Investment – 15
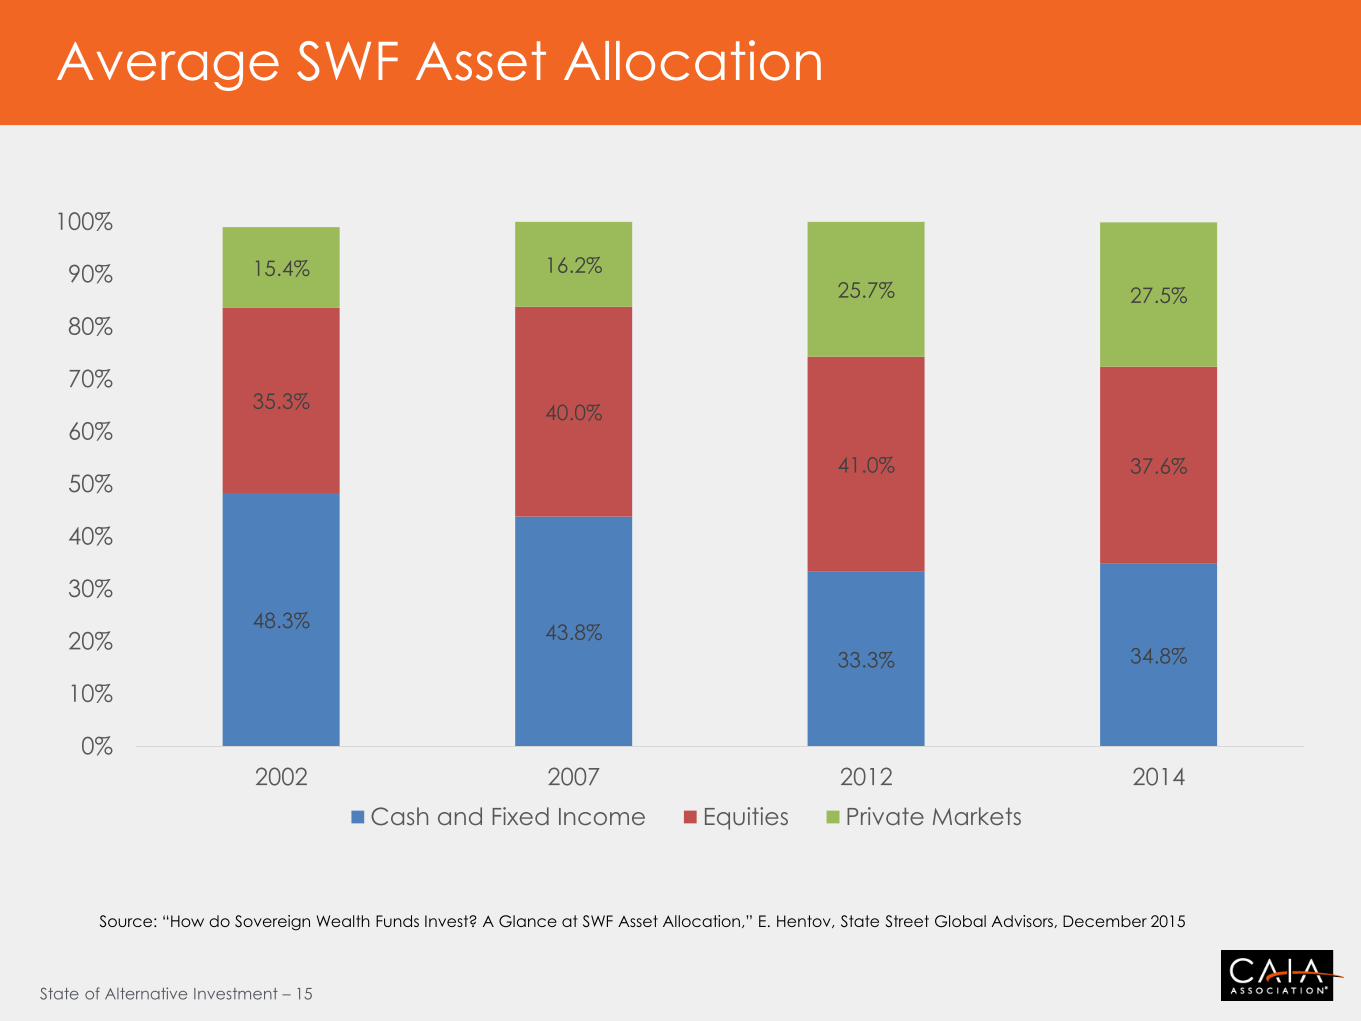
Average SWF Asset Allocation
Source: “How do Sovereign Wealth Funds Invest? A Glance at SWF Asset Allocation,” E. Hentov, State Street Global Advisors, December 2015
48.3% 43.8%
33.3% 34.8%
35.3% 40.0%
41.0% 37.6%
15.4% 16.2% 25.7% 27.5%
0%
10%
20%
30%
40%
50%
60%
70%
80%
90%
100%
2002 2007 2012 2014
Cash and Fixed Income Equities Private Markets
State of Alternative Investment – 16
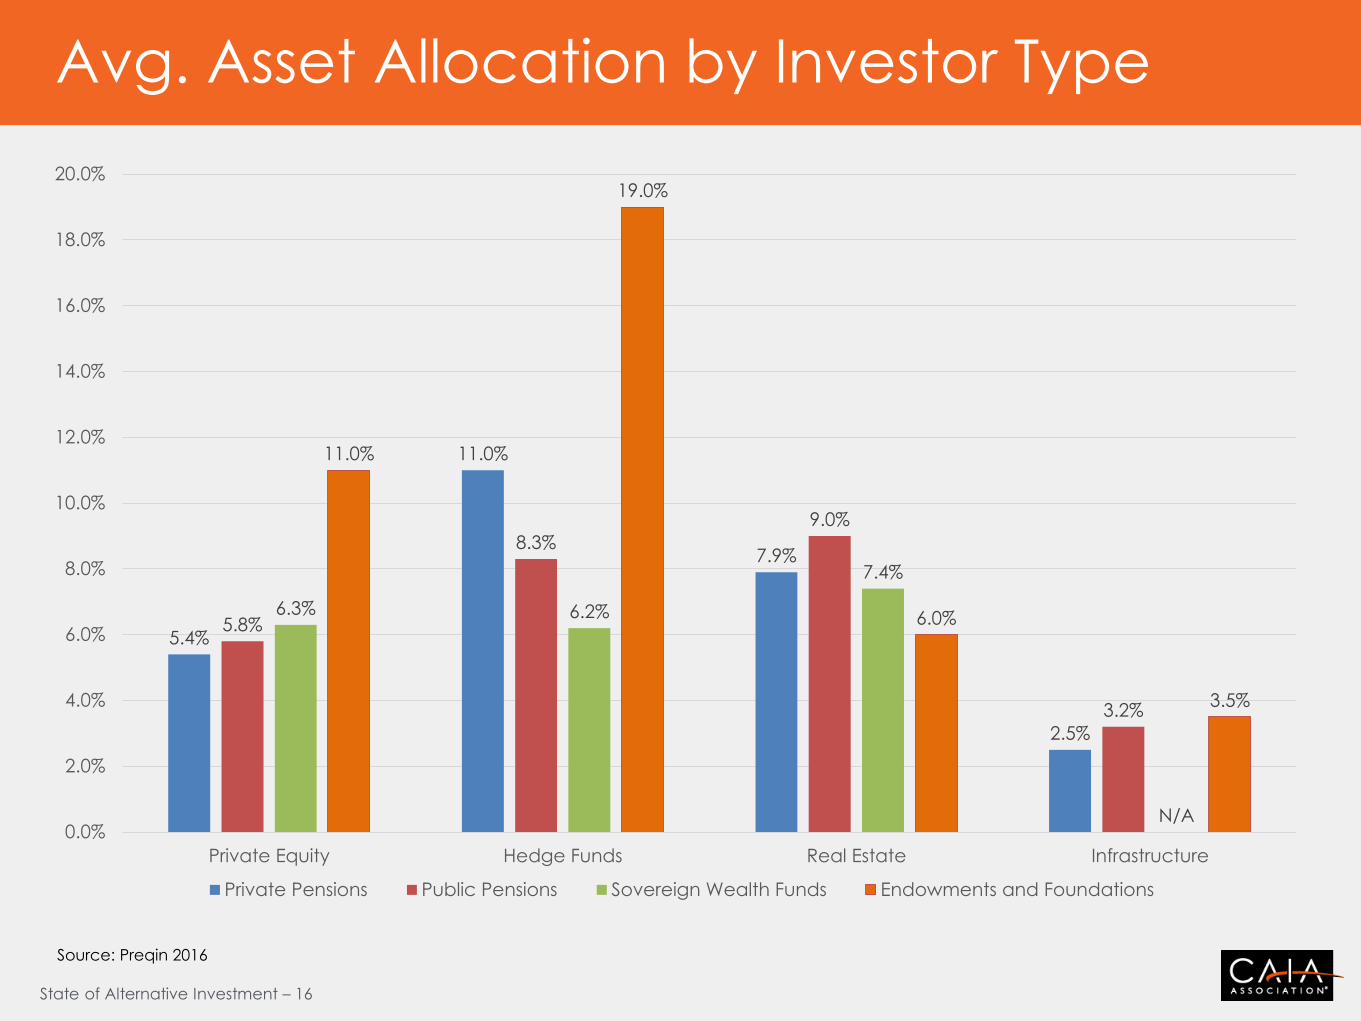
Avg. Asset Allocation by Investor Type
Source: Preqin 2016
5.4%
11.0%
7.9%
2.5%
5.8%
8.3%
9.0%
3.2%
6.3% 6.2%
7.4%
N/A
11.0%
19.0%
6.0%
3.5%
0.0%
2.0%
4.0%
6.0%
8.0%
10.0%
12.0%
14.0%
16.0%
18.0%
20.0%
Private Equity Hedge Funds Real Estate Infrastructure
Private Pensions Public Pensions Sovereign Wealth Funds Endowments and Foundations

State of Alternative Investment – 17
Alternative Current and Target Allocation
10.3%
9.6% 9.5% 9.6% 9.6%
11.0%
10.6% 10.7% 10.7% 10.7%
8.5%
9.0%
9.5%
10.0%
10.5%
11.0%
11.5%
2013 2014 2015 2016 2017 YTD
Average Allocation to Private Equity (As a % of AUM)
Average Current Allocation Average Target Allocation
13.0%
13.3%
13.8%
13.1%
14.7%
13.8%
14.1%
14.4%
13.7%
13.5%
12.0%
12.5%
13.0%
13.5%
14.0%
14.5%
15.0%
2013 2014 2015 2016 2017 YTD
Average Allocation to Hedge Funds (As a % of AUM)
Average Current Allocation Average Target Allocation
9.3% 9.2%
9.3%
9.9%
9.0%
10.5% 10.3% 10.4%
10.6% 10.6%
8.0%
8.5%
9.0%
9.5%
10.0%
10.5%
11.0%
2013 2014 2015 2016 2017 YTD
Average Allocation to Real Estate (As a % of AUM)
Average Current Allocation Average Target Allocation
3.6%
4.3% 4.3%
3.9% 4.2%
5.1%
5.7% 5.7%
5.2% 5.4%
0.0%
1.0%
2.0%
3.0%
4.0%
5.0%
6.0%
2013 2014 2015 2016 2017 YTD
Average Allocation to Infrastructure (As a % of AUM)
Average Current Allocation Average Target Allocation
Source: Preqin
State of Alternative Investment – 18
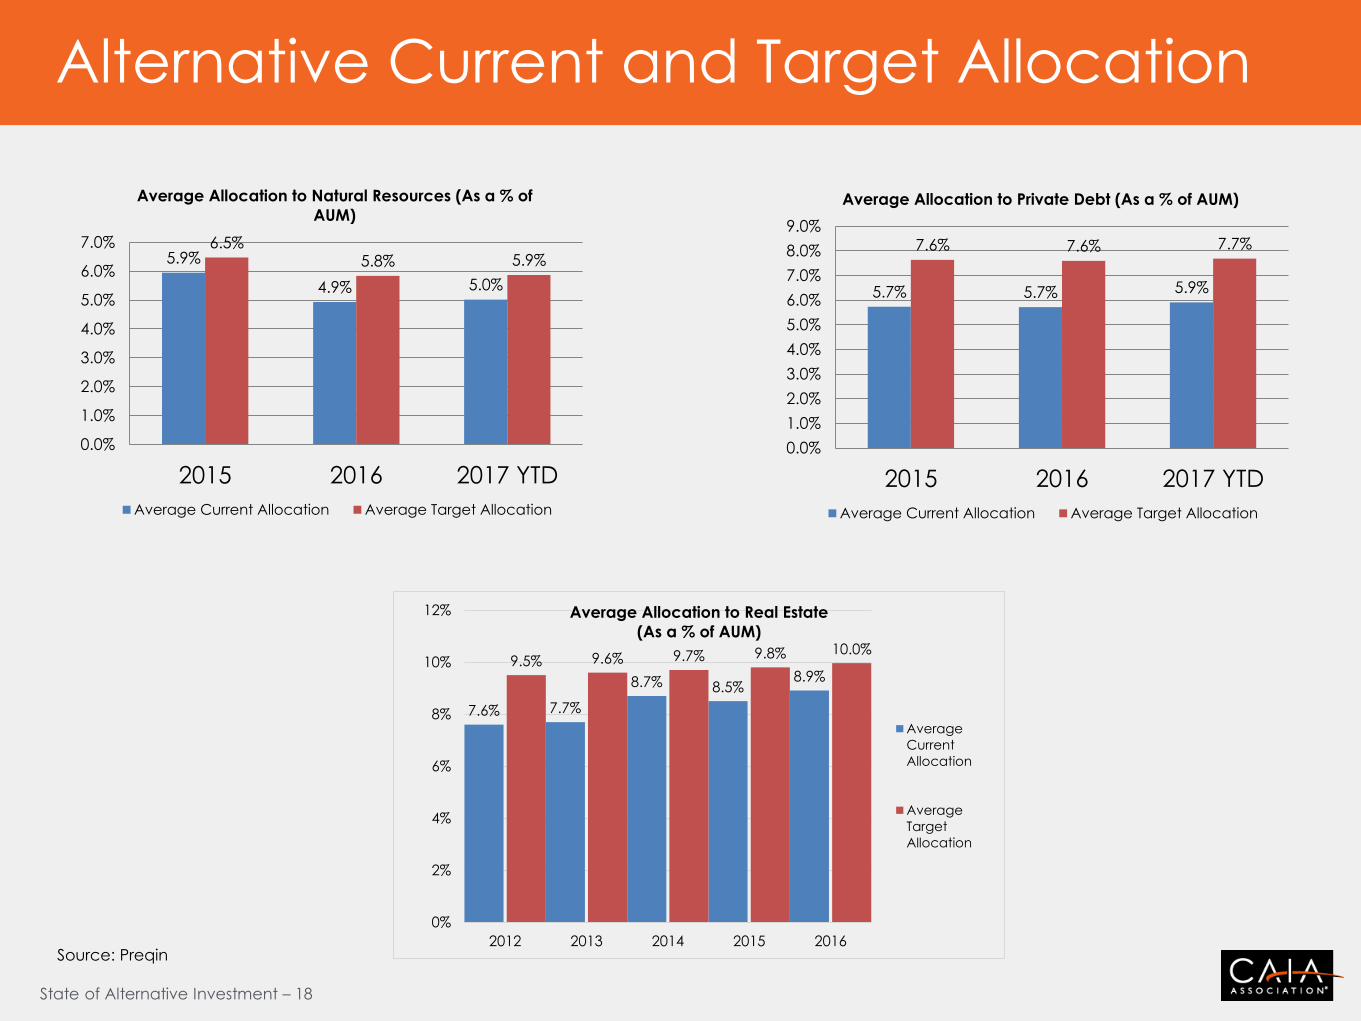
Alternative Current and Target Allocation
5.9%
4.9% 5.0%
6.5% 5.8% 5.9%
0.0%
1.0%
2.0%
3.0%
4.0%
5.0%
6.0%
7.0%
2015 2016 2017 YTD
Average Allocation to Natural Resources (As a % of
AUM)
Average Current Allocation Average Target Allocation
5.7% 5.7% 5.9%
7.6% 7.6% 7.7%
0.0%
1.0%
2.0%
3.0%
4.0%
5.0%
6.0%
7.0%
8.0%
9.0%
2015 2016 2017 YTD
Average Allocation to Private Debt (As a % of AUM)
Average Current Allocation Average Target Allocation
Source: Preqin
7.6% 7.7%
8.7% 8.5% 8.9%
9.5% 9.6% 9.7% 9.8% 10.0%
0%
2%
4%
6%
8%
10%
12%
2012 2013 2014 2015 2016
Average Allocation to Real Estate
(As a % of AUM)
Average
Current
Allocation
Average
Target
Allocation
State of Alternative Investment – 19
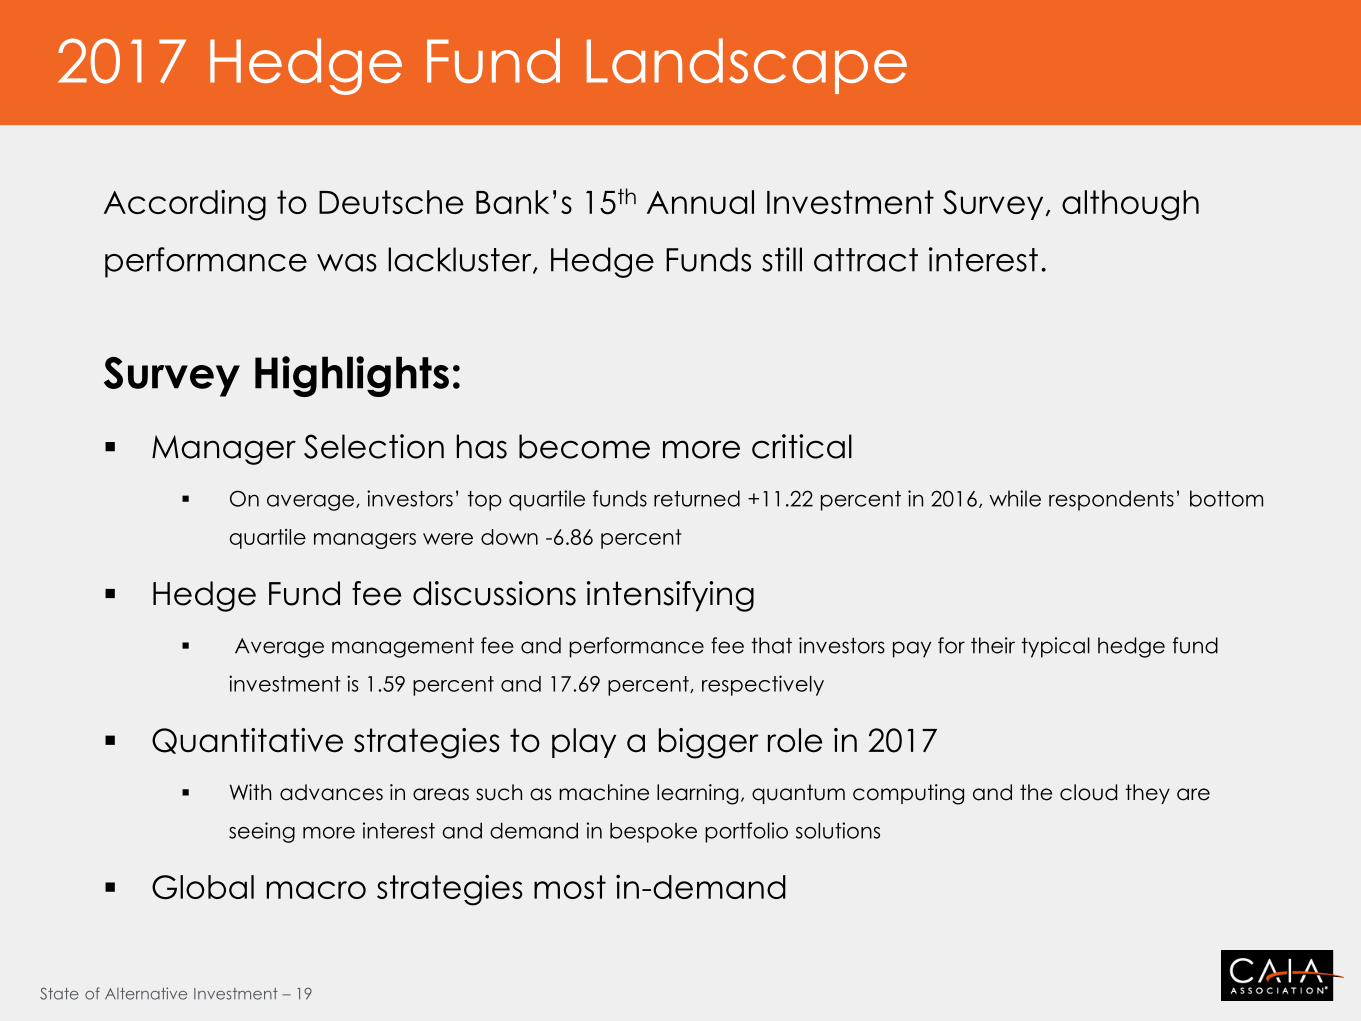
2017 Hedge Fund Landscape
According to Deutsche Bank’s 15th Annual Investment Survey, although
performance was lackluster, Hedge Funds still attract interest.
Survey Highlights:
Manager Selection has become more critical
On average, investors’ top quartile funds returned +11.22 percent in 2016, while respondents’ bottom
quartile managers were down -6.86 percent
Hedge Fund fee discussions intensifying
Average management fee and performance fee that investors pay for their typical hedge fund
investment is 1.59 percent and 17.69 percent, respectively
Quantitative strategies to play a bigger role in 2017
With advances in areas such as machine learning, quantum computing and the cloud they are
seeing more interest and demand in bespoke portfolio solutions
Global macro strategies most in-demand
State of Alternative Investment – 20
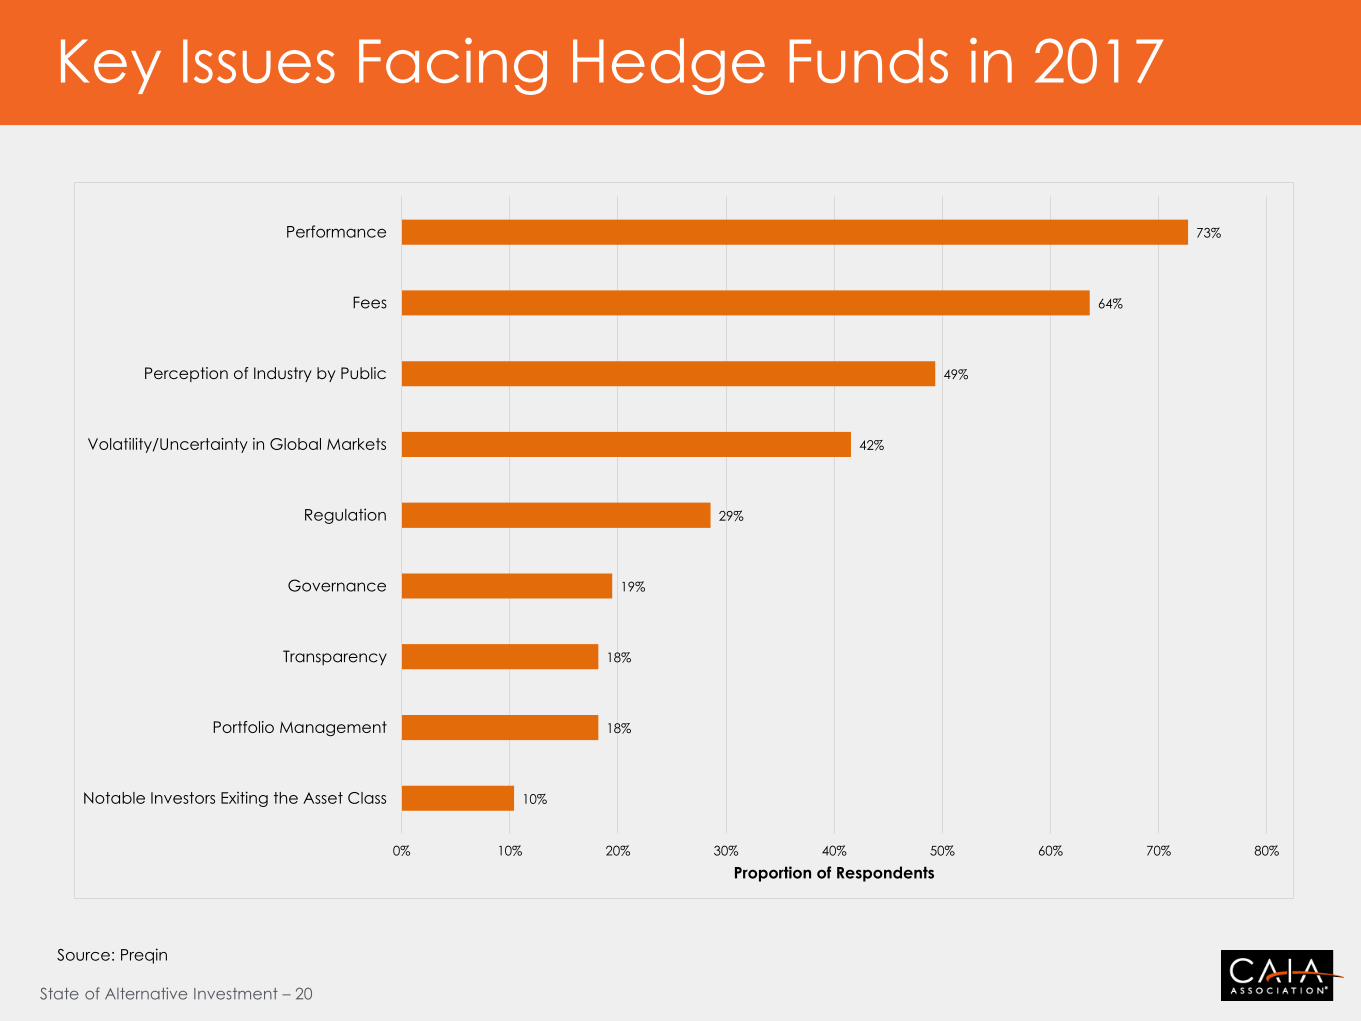
Key Issues Facing Hedge Funds in 2017
10%
18%
18%
19%
29%
42%
49%
64%
73%
0% 10% 20% 30% 40% 50% 60% 70% 80%
Notable Investors Exiting the Asset Class
Portfolio Management
Transparency
Governance
Regulation
Volatility/Uncertainty in Global Markets
Perception of Industry by Public
Fees
Performance
Proportion of Respondents
Source: Preqin
State of Alternative Investment – 21
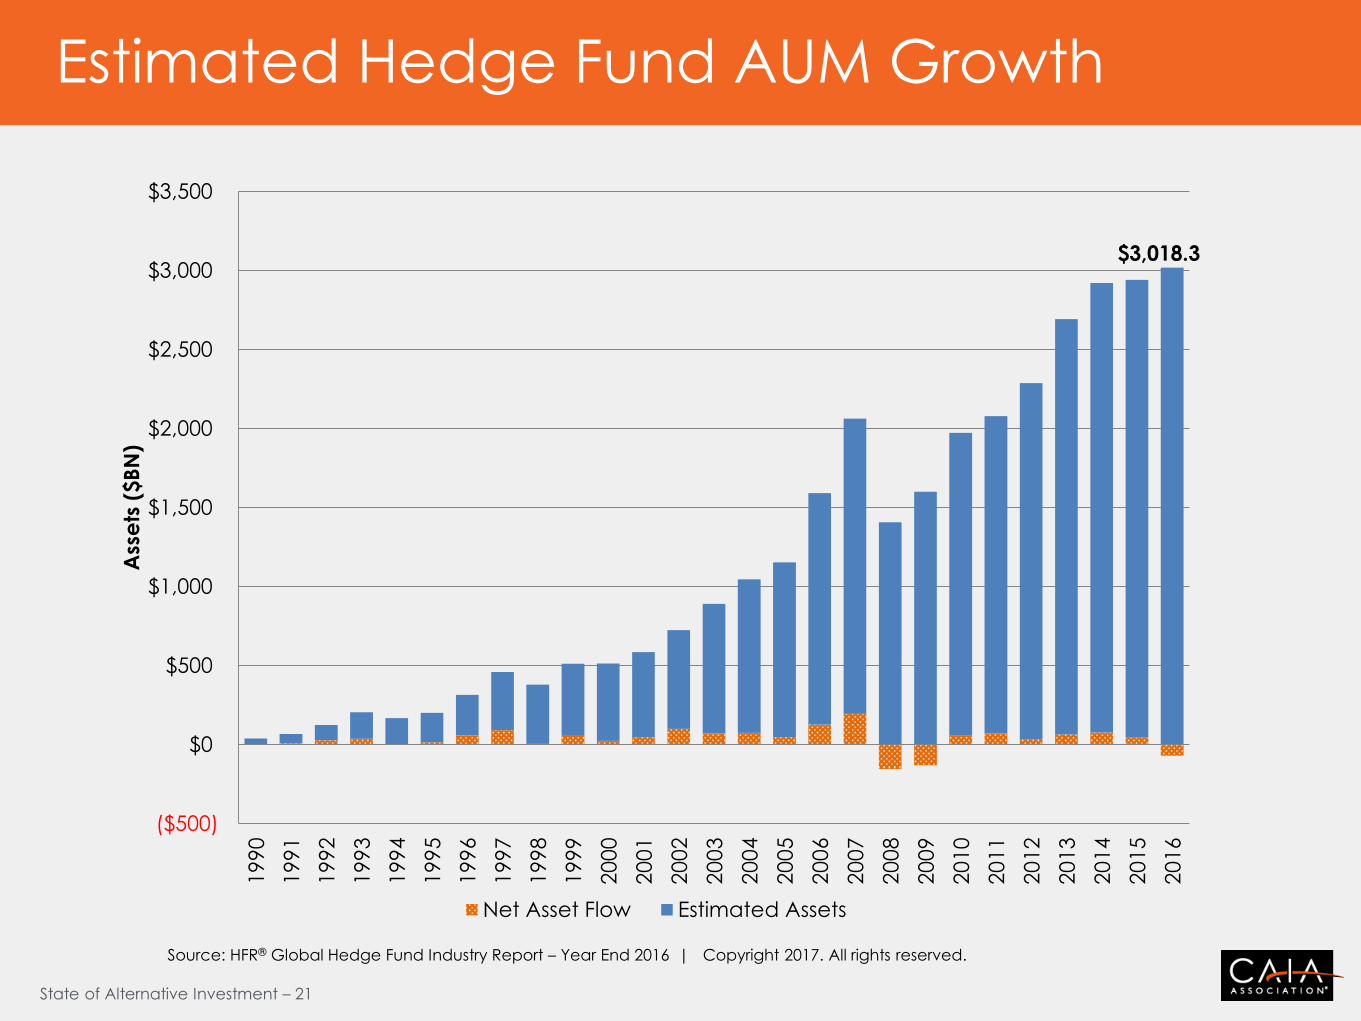
Estimated Hedge Fund AUM Growth
$3,018.3
($500)
$0
$500
$1,000
$1,500
$2,000
$2,500
$3,000
$3,500
19
90
19
91
19
92
19
93
19
94
19
95
19
96
19
97
19
98
19
99
20
00
20
01
20
02
20
03
20
04
20
05
20
06
20
07
20
08
20
09
20
10
20
11
20
12
20
13
20
14
20
15
20
16
Ass
ets
($B
N)
Net Asset Flow Estimated Assets
Source: HFR® Global Hedge Fund Industry Report – Year End 2016 | Copyright 2017. All rights reserved.
State of Alternative Investment – 22
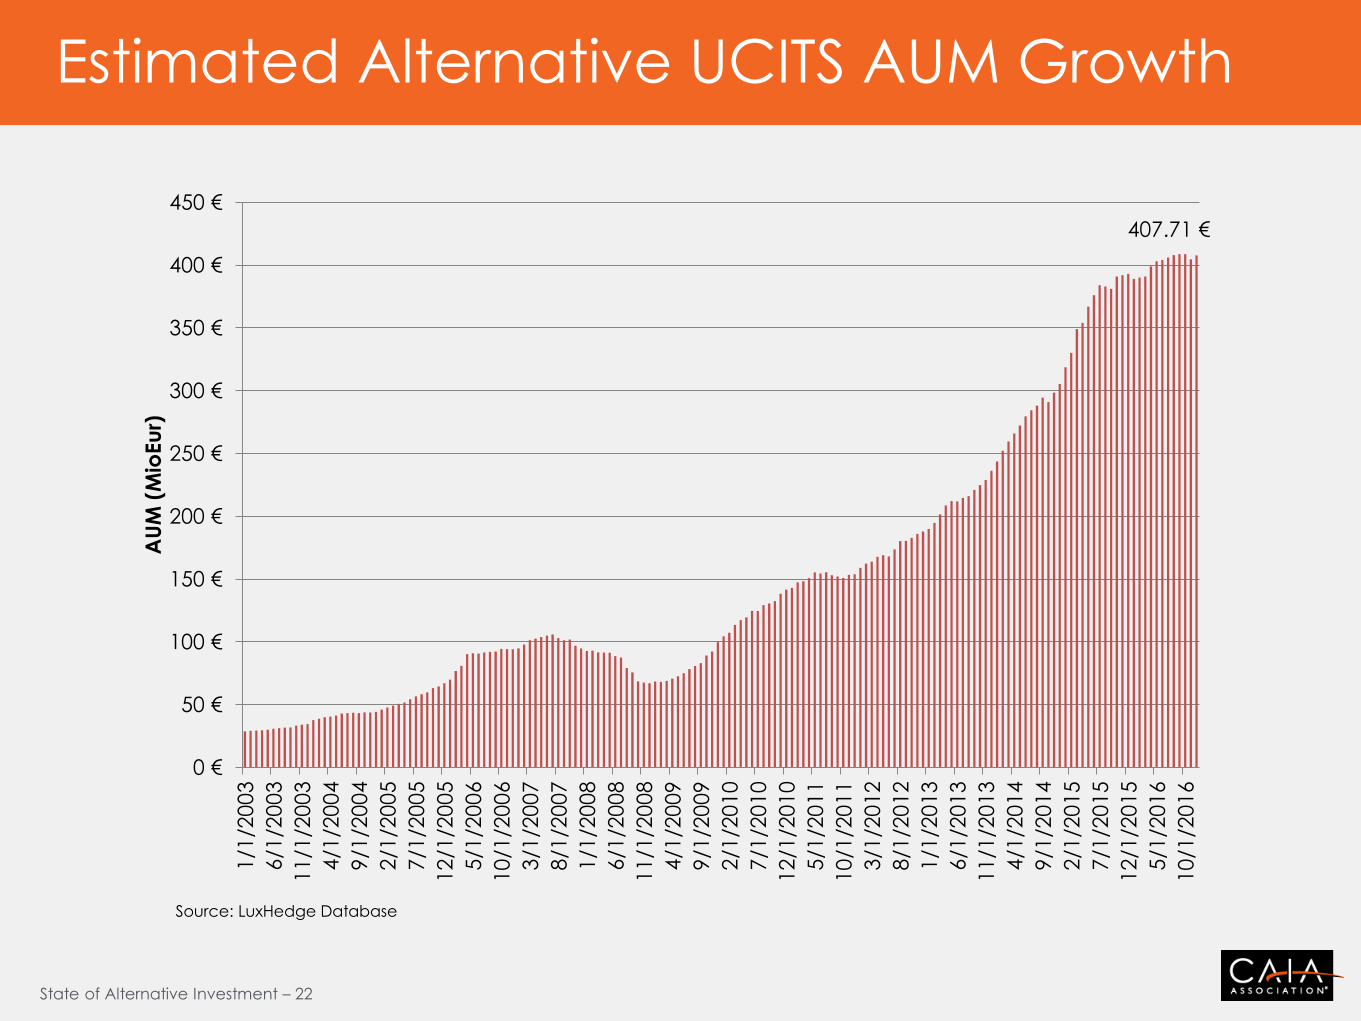
Estimated Alternative UCITS AUM Growth
407.71 €
0 €
50 €
100 €
150 €
200 €
250 €
300 €
350 €
400 €
450 €
1/1
/20
03
6/1
/20
03
11
/1/2
003
4/1
/20
04
9/1
/20
04
2/1
/20
05
7/1
/20
05
12
/1/2
005
5/1
/20
06
10
/1/2
006
3/1
/20
07
8/1
/20
07
1/1
/20
08
6/1
/20
08
11
/1/2
008
4/1
/20
09
9/1
/20
09
2/1
/20
10
7/1
/20
10
12
/1/2
01
0
5/1
/20
11
10
/1/2
011
3/1
/20
12
8/1
/20
12
1/1
/20
13
6/1
/20
13
11
/1/2
013
4/1
/20
14
9/1
/20
14
2/1
/20
15
7/1
/20
15
12
/1/2
015
5/1
/20
16
10
/1/2
016
AU
M (
Mio
Eu
r)
Source: LuxHedge Database
State of Alternative Investment – 23
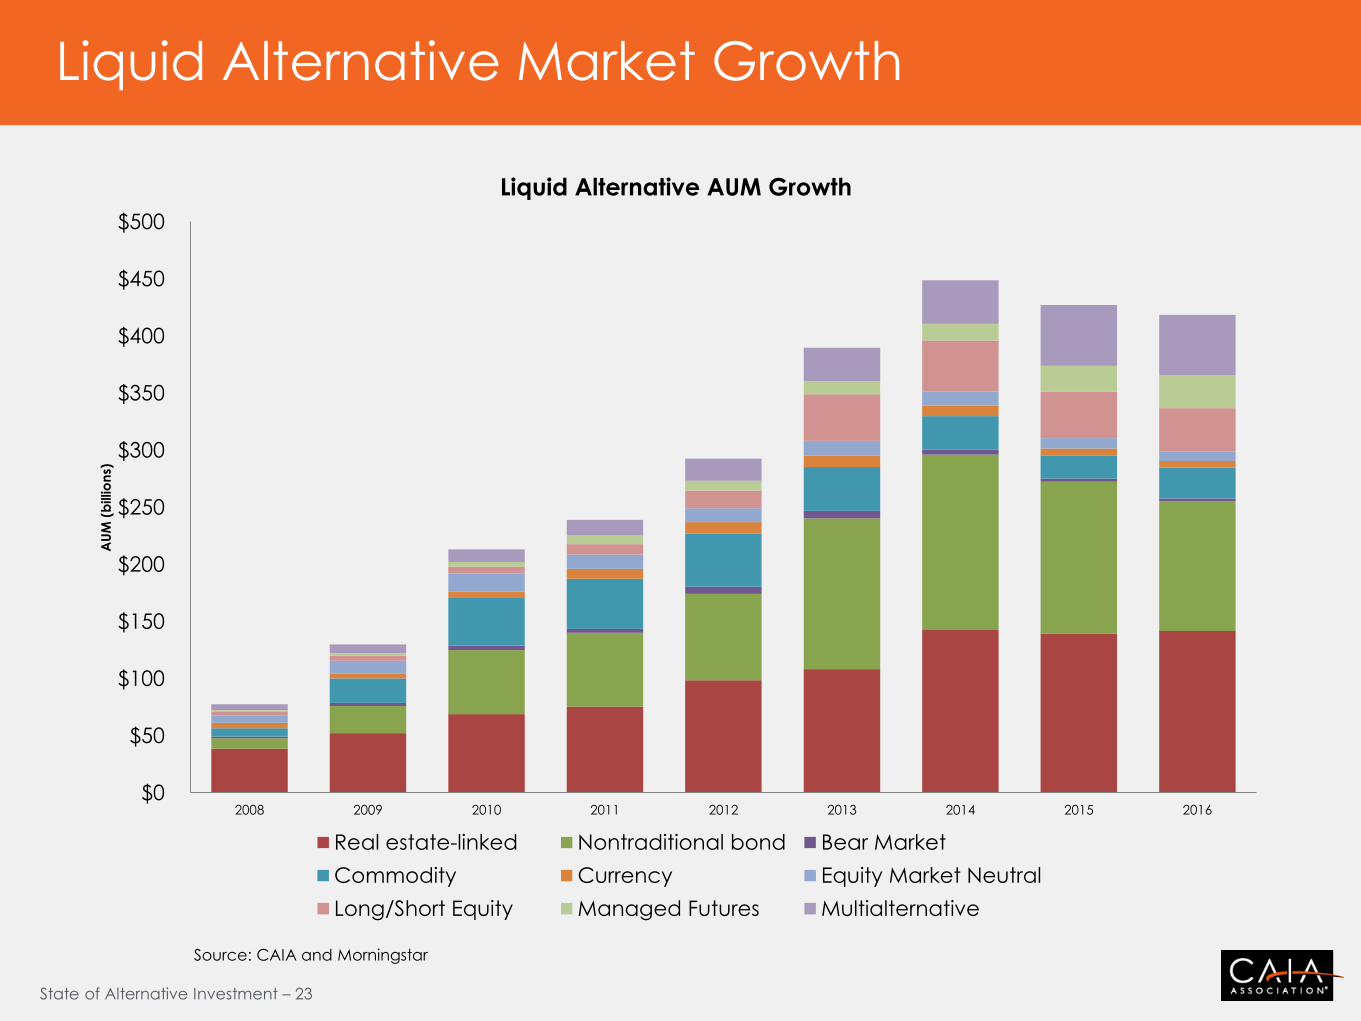
Liquid Alternative Market Growth
$0
$50
$100
$150
$200
$250
$300
$350
$400
$450
$500
2008 2009 2010 2011 2012 2013 2014 2015 2016
AU
M (
billio
ns)
Liquid Alternative AUM Growth
Real estate-linked Nontraditional bond Bear Market
Commodity Currency Equity Market Neutral
Long/Short Equity Managed Futures Multialternative
Source: CAIA and Morningstar
State of Alternative Investment – 24
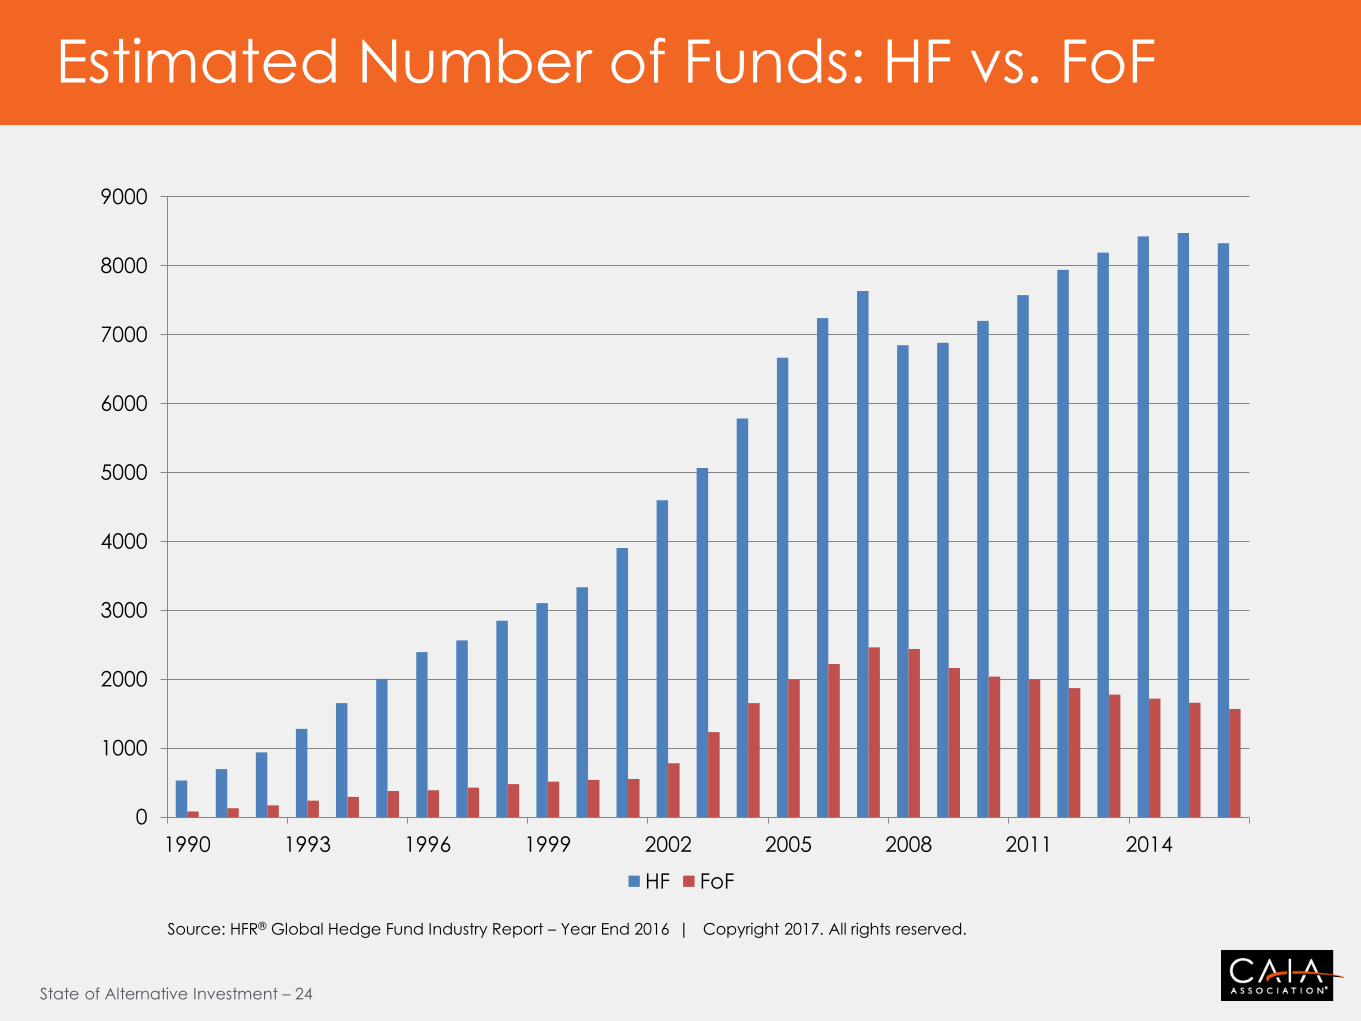
Estimated Number of Funds: HF vs. FoF
0
1000
2000
3000
4000
5000
6000
7000
8000
9000
1990 1993 1996 1999 2002 2005 2008 2011 2014
HF FoF
Source: HFR® Global Hedge Fund Industry Report – Year End 2016 | Copyright 2017. All rights reserved.
State of Alternative Investment – 25
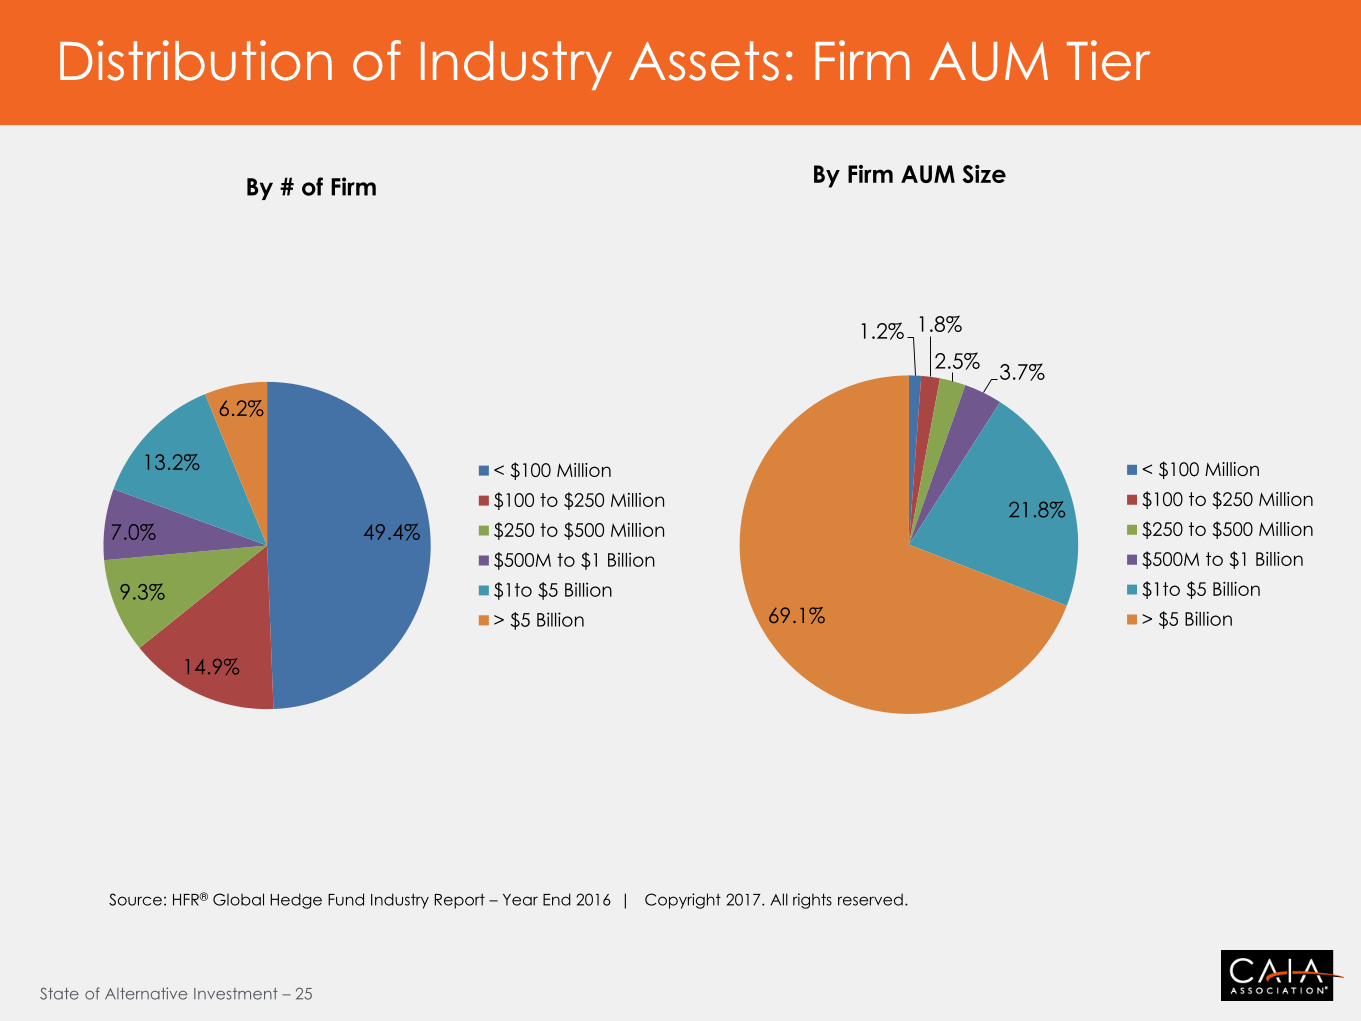
Distribution of Industry Assets: Firm AUM Tier
49.4%
14.9%
9.3%
7.0%
13.2%
6.2%
By # of Firm
< $100 Million
$100 to $250 Million
$250 to $500 Million
$500M to $1 Billion
$1to $5 Billion
> $5 Billion
1.2% 1.8%
2.5% 3.7%
21.8%
69.1%
By Firm AUM Size
< $100 Million
$100 to $250 Million
$250 to $500 Million
$500M to $1 Billion
$1to $5 Billion
> $5 Billion
Source: HFR® Global Hedge Fund Industry Report – Year End 2016 | Copyright 2017. All rights reserved.
State of Alternative Investment – 26
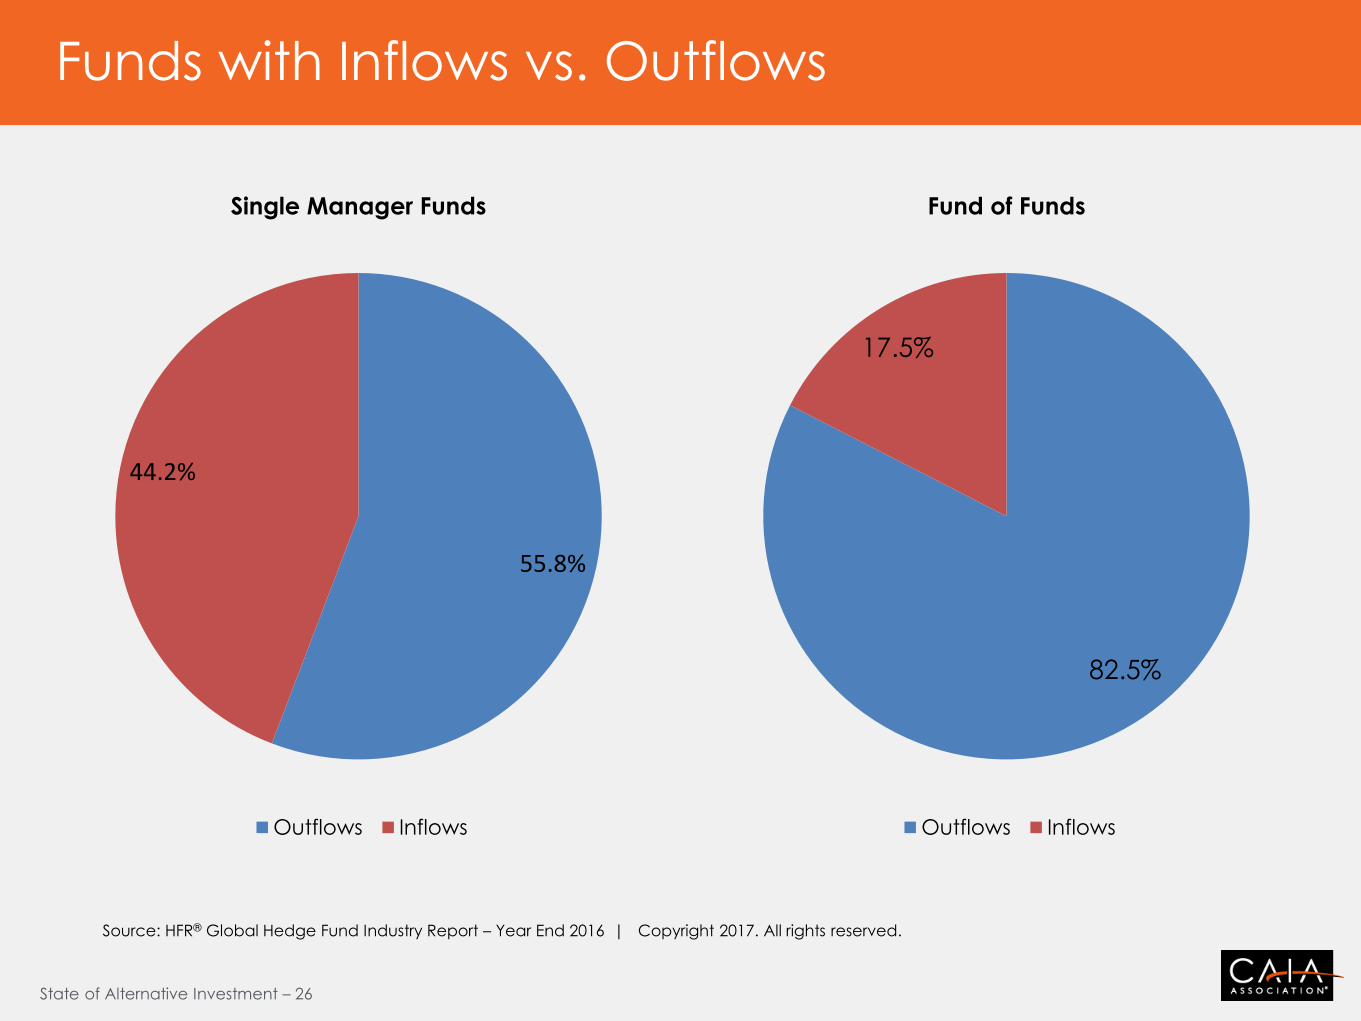
Funds with Inflows vs. Outflows
55.8%
44.2%
Single Manager Funds
Outflows Inflows
82.5%
17.5%
Fund of Funds
Outflows Inflows
Source: HFR® Global Hedge Fund Industry Report – Year End 2016 | Copyright 2017. All rights reserved.
State of Alternative Investment – 27
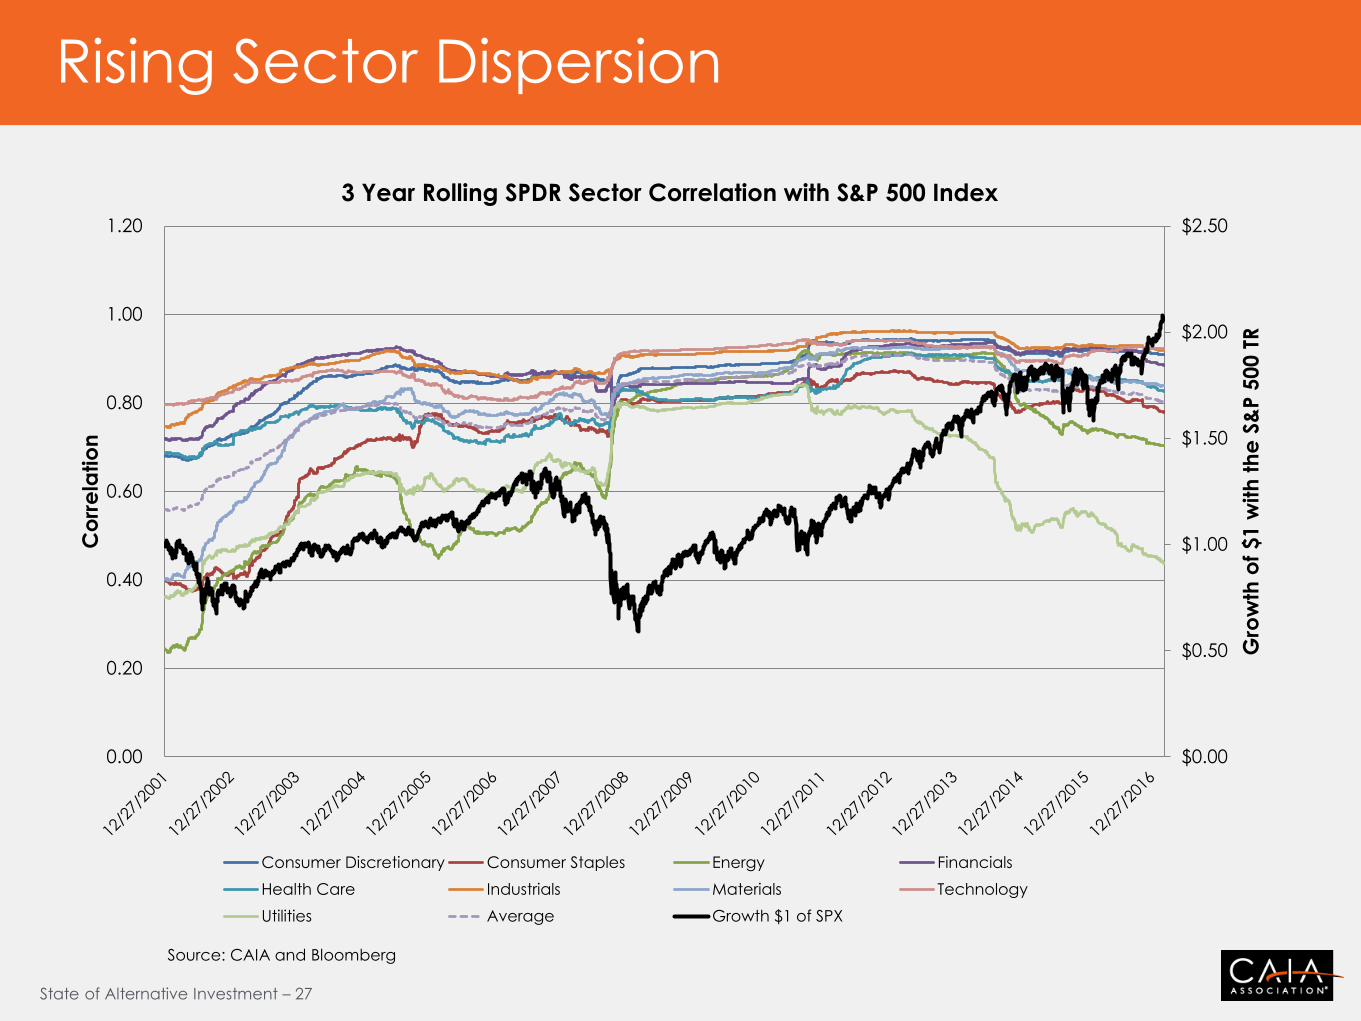
Rising Sector Dispersion
$0.00
$0.50
$1.00
$1.50
$2.00
$2.50
0.00
0.20
0.40
0.60
0.80
1.00
1.20
Gro
wth
of
$1 w
ith
th
e S
&P 5
00 T
R
Co
rre
latio
n
3 Year Rolling SPDR Sector Correlation with S&P 500 Index
Consumer Discretionary Consumer Staples Energy Financials
Health Care Industrials Materials Technology
Utilities Average Growth $1 of SPX
Source: CAIA and Bloomberg

State of Alternative Investment – 28
Private Capital AUM by Asset Class
0
500
1,000
1,500
2,000
2,500
3,000
3,500
4,000
4,500
5,000
De
c-0
5
De
c-0
6
De
c-0
7
De
c-0
8
De
c-0
9
De
c-1
0
De
c-1
1
De
c-1
2
De
c-1
3
De
c-1
4
De
c-1
5
Ju
n-1
6
Ass
ets
un
de
r M
an
ag
em
en
t ($
bn
)
Private Equity Private Debt Real Estate Infrastructure Natural Resources
Source: Preqin Online Products
State of Alternative Investment – 29
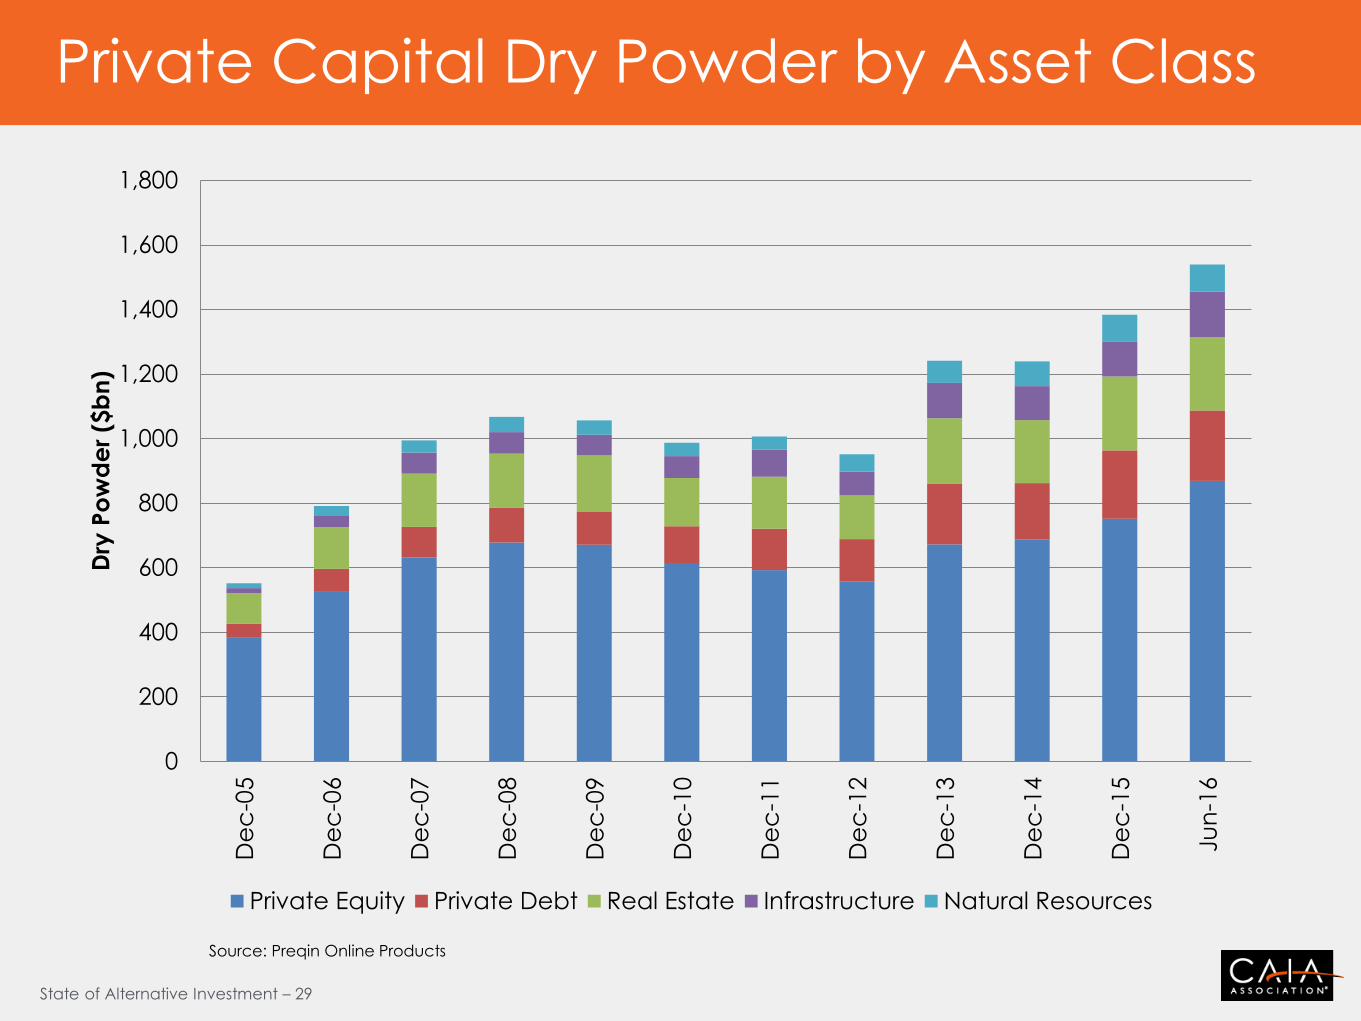
Private Capital Dry Powder by Asset Class
0
200
400
600
800
1,000
1,200
1,400
1,600
1,800
De
c-0
5
De
c-0
6
De
c-0
7
De
c-0
8
De
c-0
9
De
c-1
0
De
c-1
1
De
c-1
2
De
c-1
3
De
c-1
4
De
c-1
5
Ju
n-1
6
Dry
Po
wd
er
($b
n)
Private Equity Private Debt Real Estate Infrastructure Natural Resources
Source: Preqin Online Products
State of Alternative Investment – 30
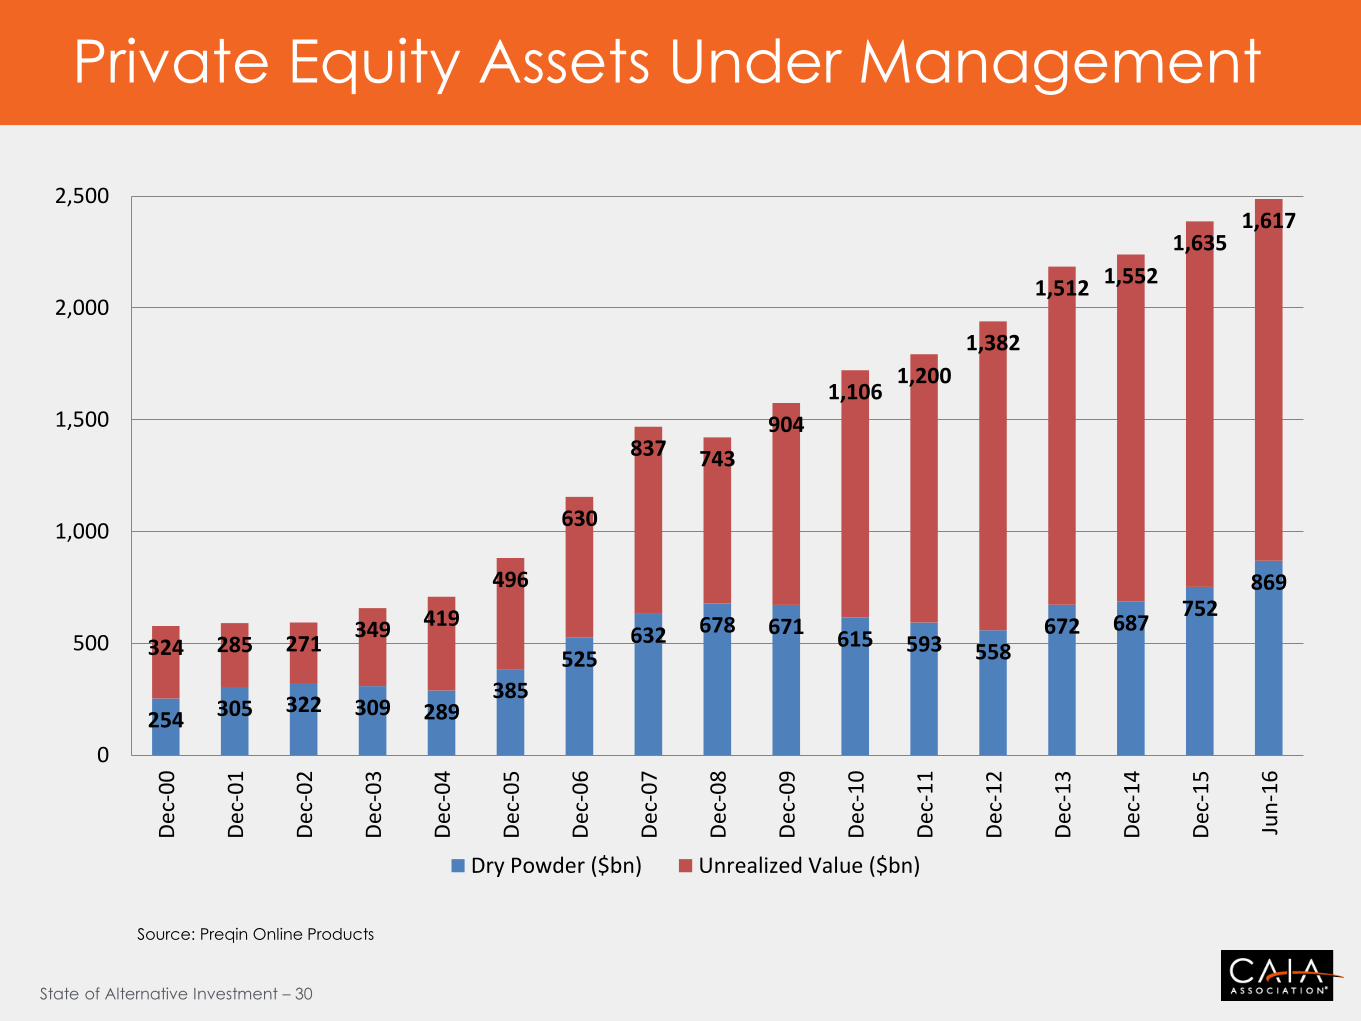
Private Equity Assets Under Management
254 305 322 309 289 385
525 632 678 671
615 593 558 672 687
752 869
324 285 271 349 419
496
630
837 743
904
1,106 1,200
1,382
1,512 1,552
1,635 1,617
0
500
1,000
1,500
2,000
2,500D
ec-0
0
Dec
-01
Dec
-02
Dec
-03
Dec
-04
Dec
-05
Dec
-06
Dec
-07
Dec
-08
Dec
-09
Dec
-10
Dec
-11
Dec
-12
Dec
-13
Dec
-14
Dec
-15
Jun
-16
Dry Powder ($bn) Unrealized Value ($bn)
Source: Preqin Online Products
State of Alternative Investment – 31
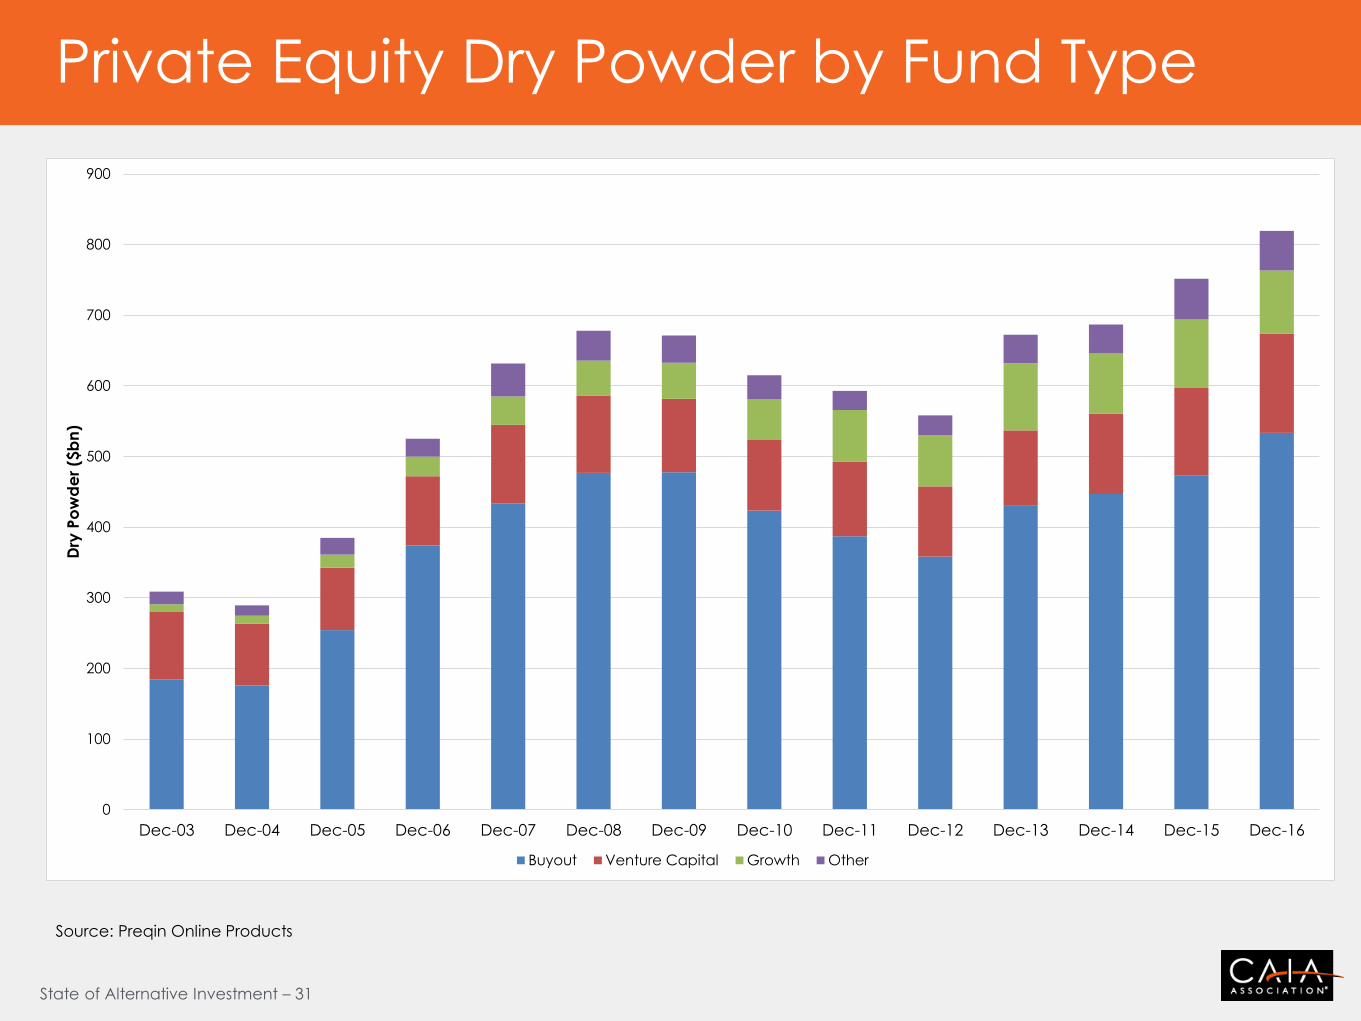
Private Equity Dry Powder by Fund Type
0
100
200
300
400
500
600
700
800
900
Dec-03 Dec-04 Dec-05 Dec-06 Dec-07 Dec-08 Dec-09 Dec-10 Dec-11 Dec-12 Dec-13 Dec-14 Dec-15 Dec-16
Dry
Po
wd
er
($b
n)
Buyout Venture Capital Growth Other
Source: Preqin Online Products
State of Alternative Investment – 32
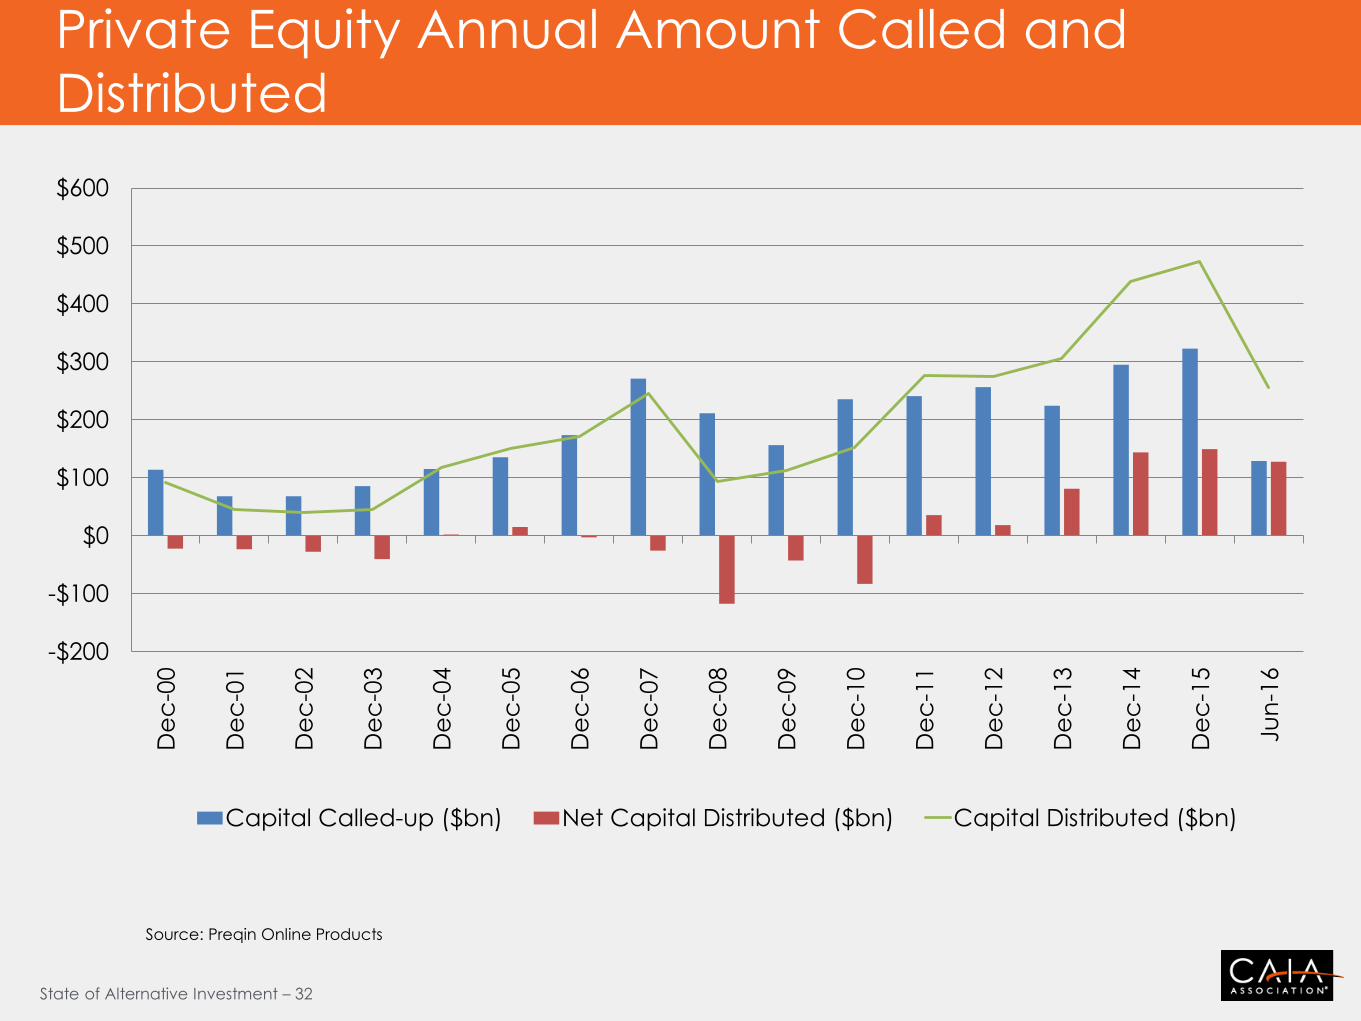
Private Equity Annual Amount Called and
Distributed
-$200
-$100
$0
$100
$200
$300
$400
$500
$600D
ec
-00
De
c-0
1
De
c-0
2
De
c-0
3
De
c-0
4
De
c-0
5
De
c-0
6
De
c-0
7
De
c-0
8
De
c-0
9
De
c-1
0
De
c-1
1
De
c-1
2
De
c-1
3
De
c-1
4
De
c-1
5
Ju
n-1
6
Capital Called-up ($bn) Net Capital Distributed ($bn) Capital Distributed ($bn)
Source: Preqin Online Products
State of Alternative Investment – 33
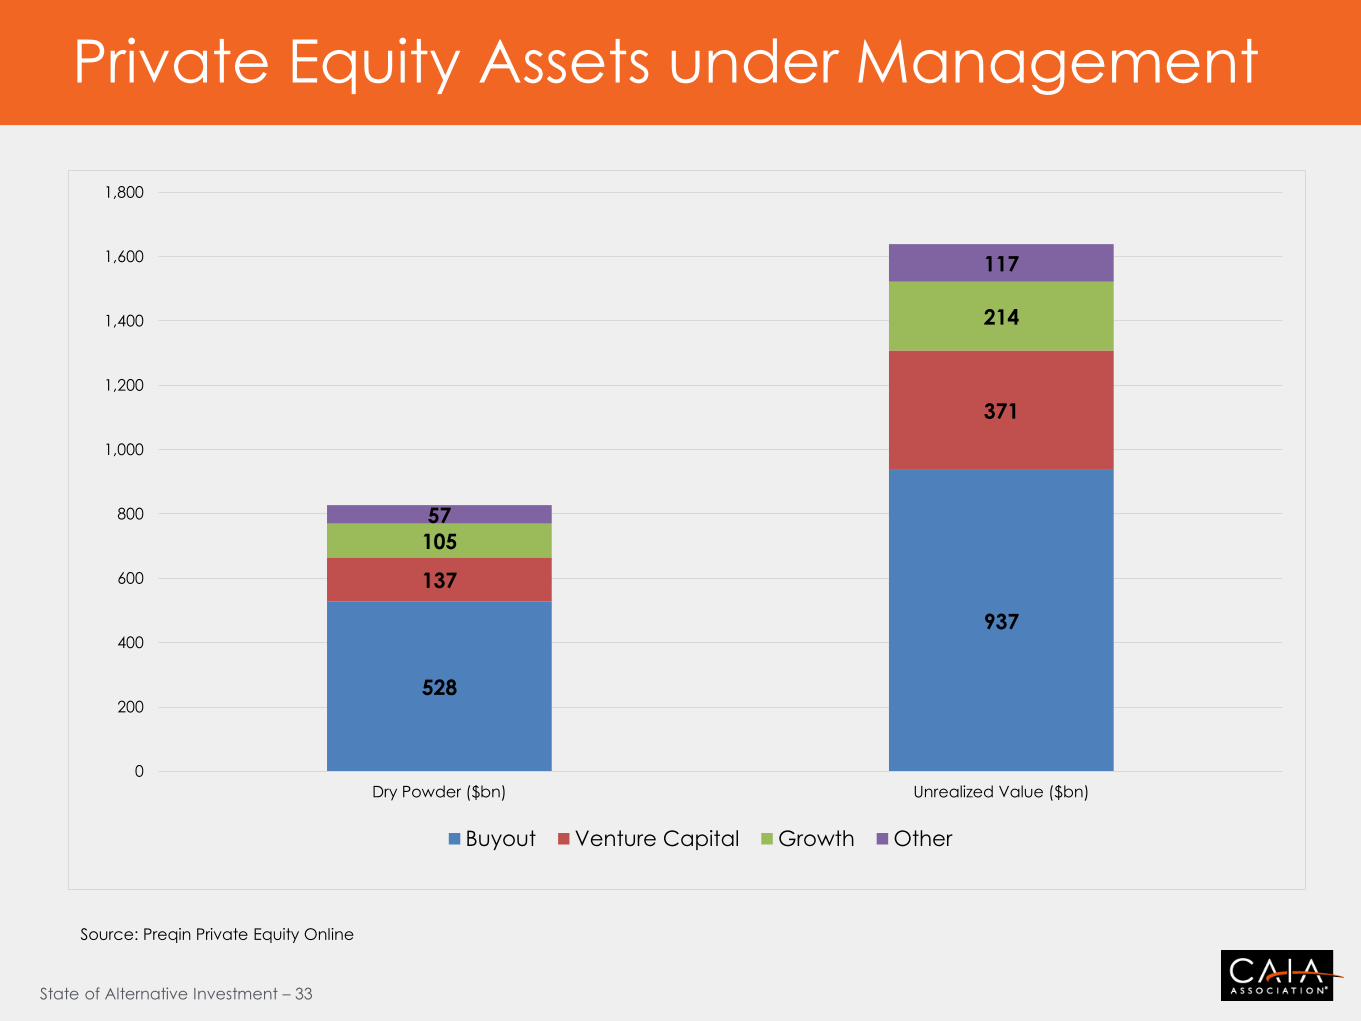
Private Equity Assets under Management
528
937
137
371
105
214
57
117
0
200
400
600
800
1,000
1,200
1,400
1,600
1,800
Dry Powder ($bn) Unrealized Value ($bn)
Buyout Venture Capital Growth Other
Source: Preqin Private Equity Online
State of Alternative Investment – 34
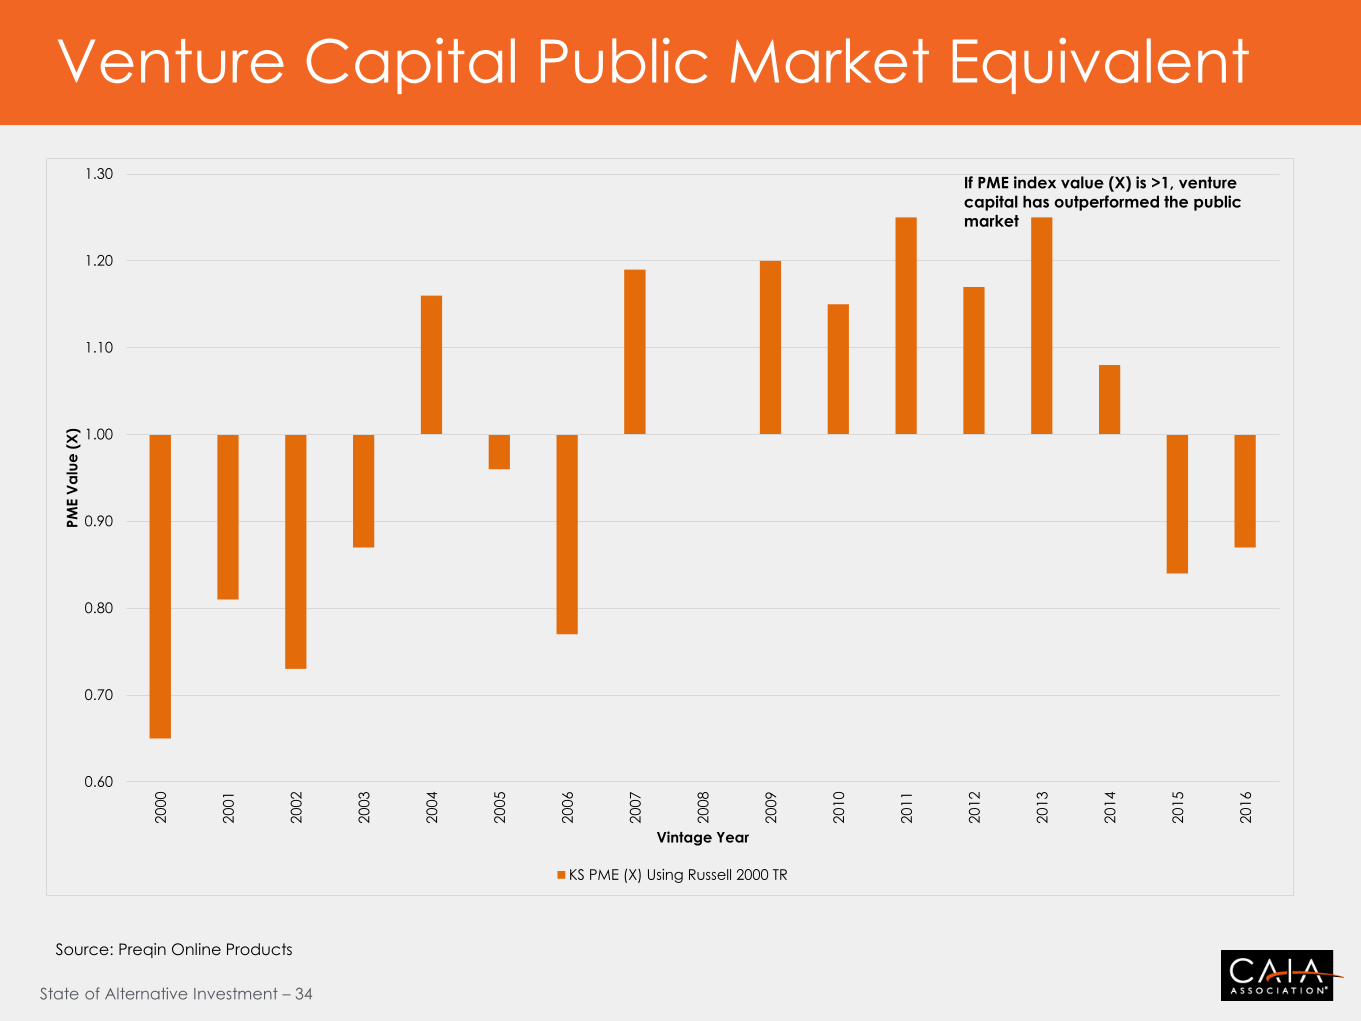
Venture Capital Public Market Equivalent
0.60
0.70
0.80
0.90
1.00
1.10
1.20
1.302
000
20
01
20
02
20
03
20
04
20
05
20
06
20
07
20
08
20
09
20
10
20
11
20
12
20
13
20
14
20
15
20
16
PM
E V
alu
e (
X)
Vintage Year
KS PME (X) Using Russell 2000 TR
If PME index value (X) is >1, venture
capital has outperformed the public
market
Source: Preqin Online Products
State of Alternative Investment – 35
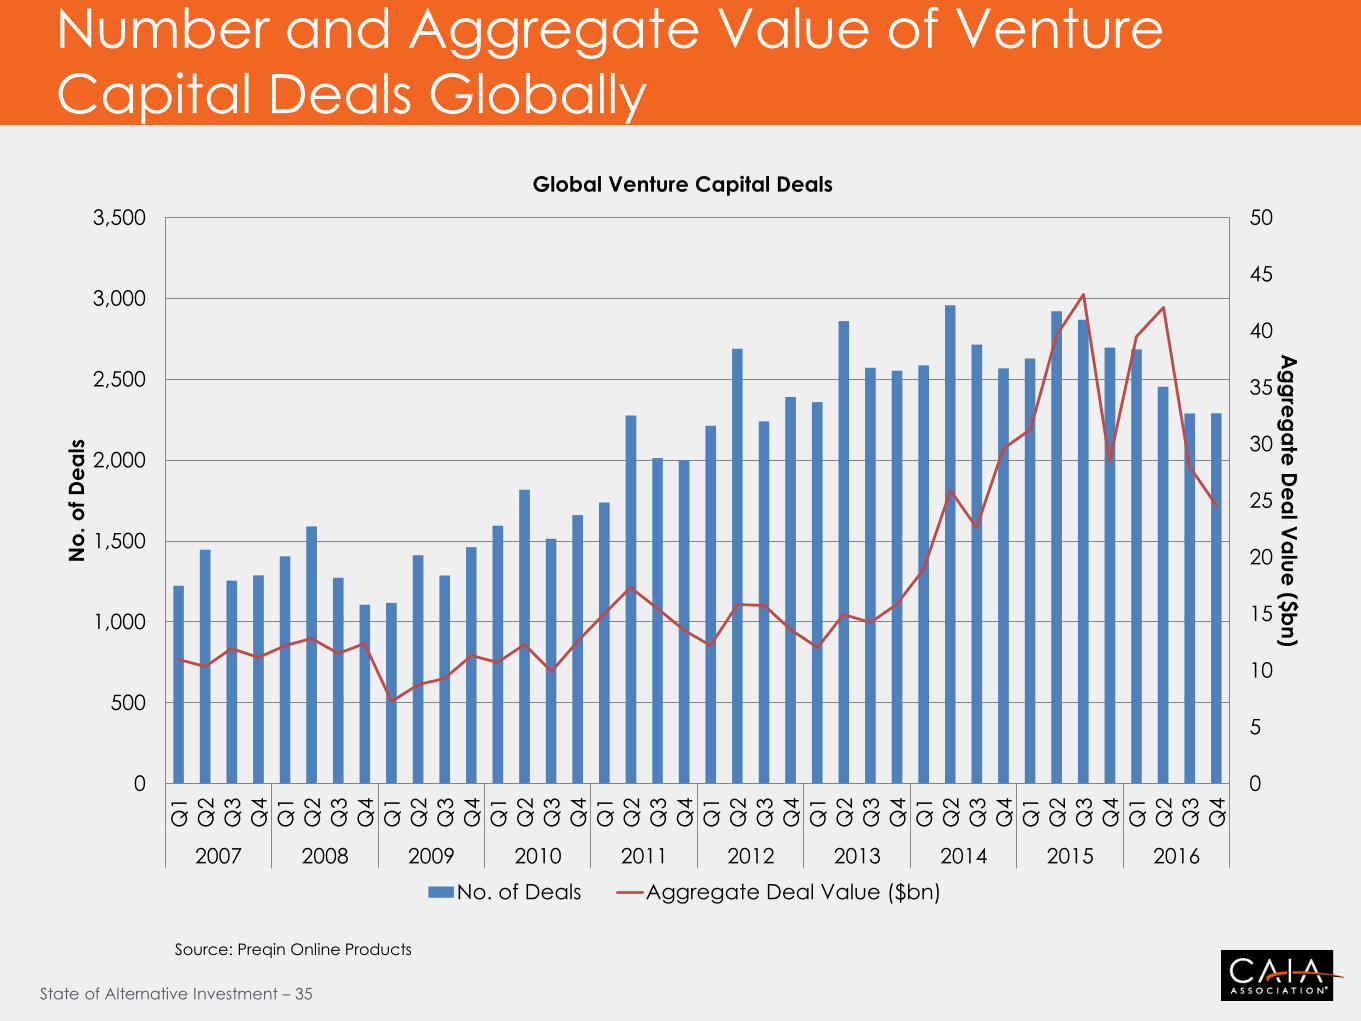
Number and Aggregate Value of Venture
Capital Deals Globally
0
5
10
15
20
25
30
35
40
45
50
0
500
1,000
1,500
2,000
2,500
3,000
3,500
Q1
Q2
Q3
Q4
Q1
Q2
Q3
Q4
Q1
Q2
Q3
Q4
Q1
Q2
Q3
Q4
Q1
Q2
Q3
Q4
Q1
Q2
Q3
Q4
Q1
Q2
Q3
Q4
Q1
Q2
Q3
Q4
Q1
Q2
Q3
Q4
Q1
Q2
Q3
Q4
2007 2008 2009 2010 2011 2012 2013 2014 2015 2016
Ag
gre
ga
te D
ea
l Va
lue
($b
n)
No
. o
f D
ea
ls
Global Venture Capital Deals
No. of Deals Aggregate Deal Value ($bn)
Source: Preqin Online Products
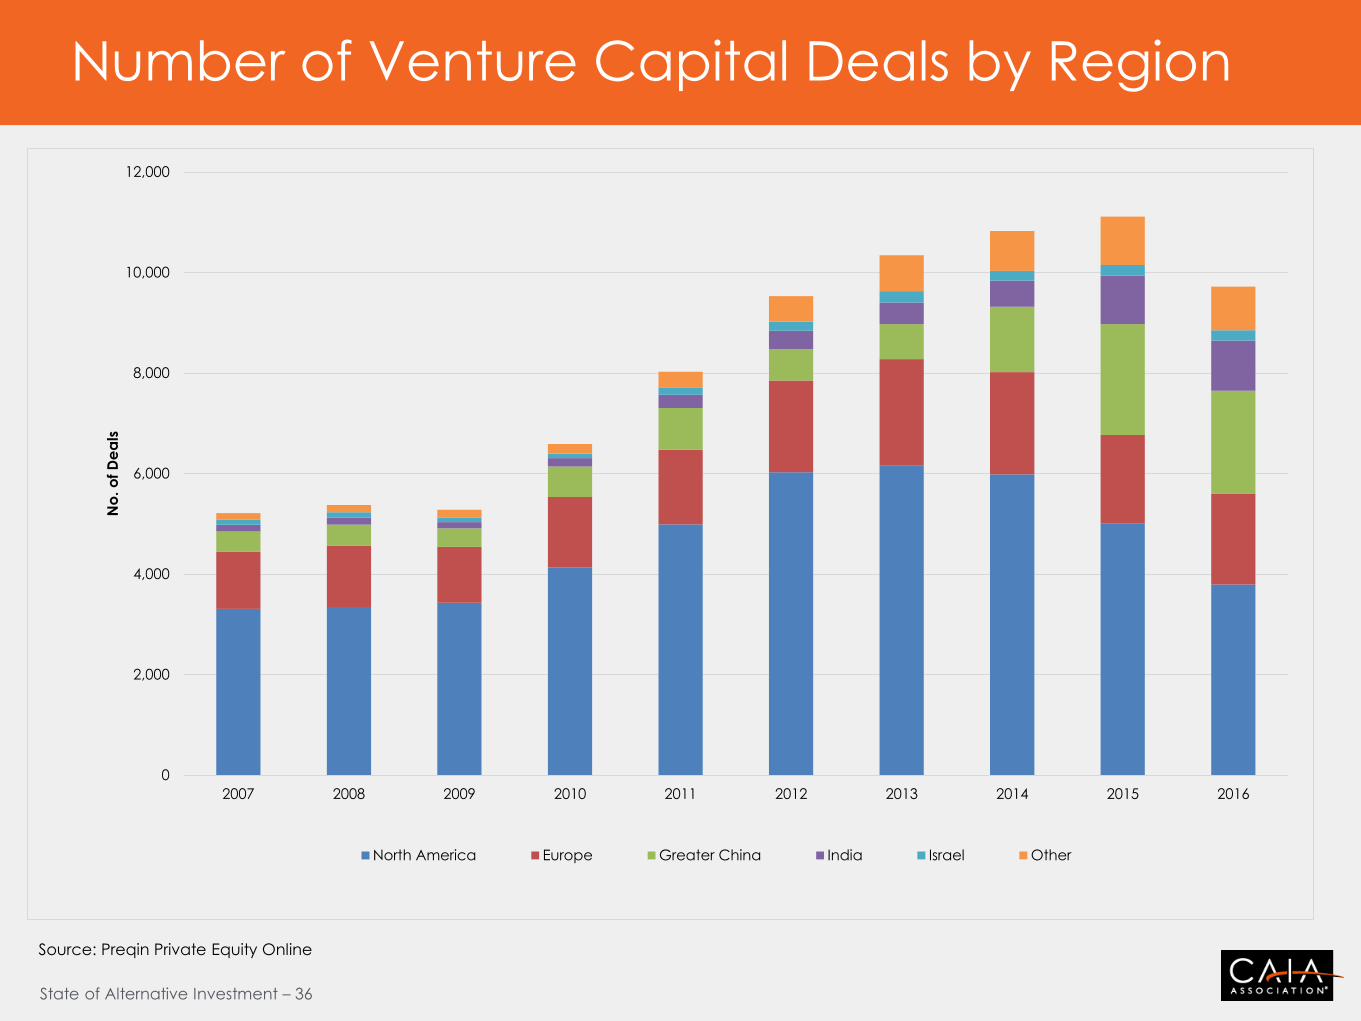
State of Alternative Investment – 36
Number of Venture Capital Deals by Region
0
2,000
4,000
6,000
8,000
10,000
12,000
2007 2008 2009 2010 2011 2012 2013 2014 2015 2016
No
. o
f D
ea
ls
North America Europe Greater China India Israel Other
Source: Preqin Private Equity Online
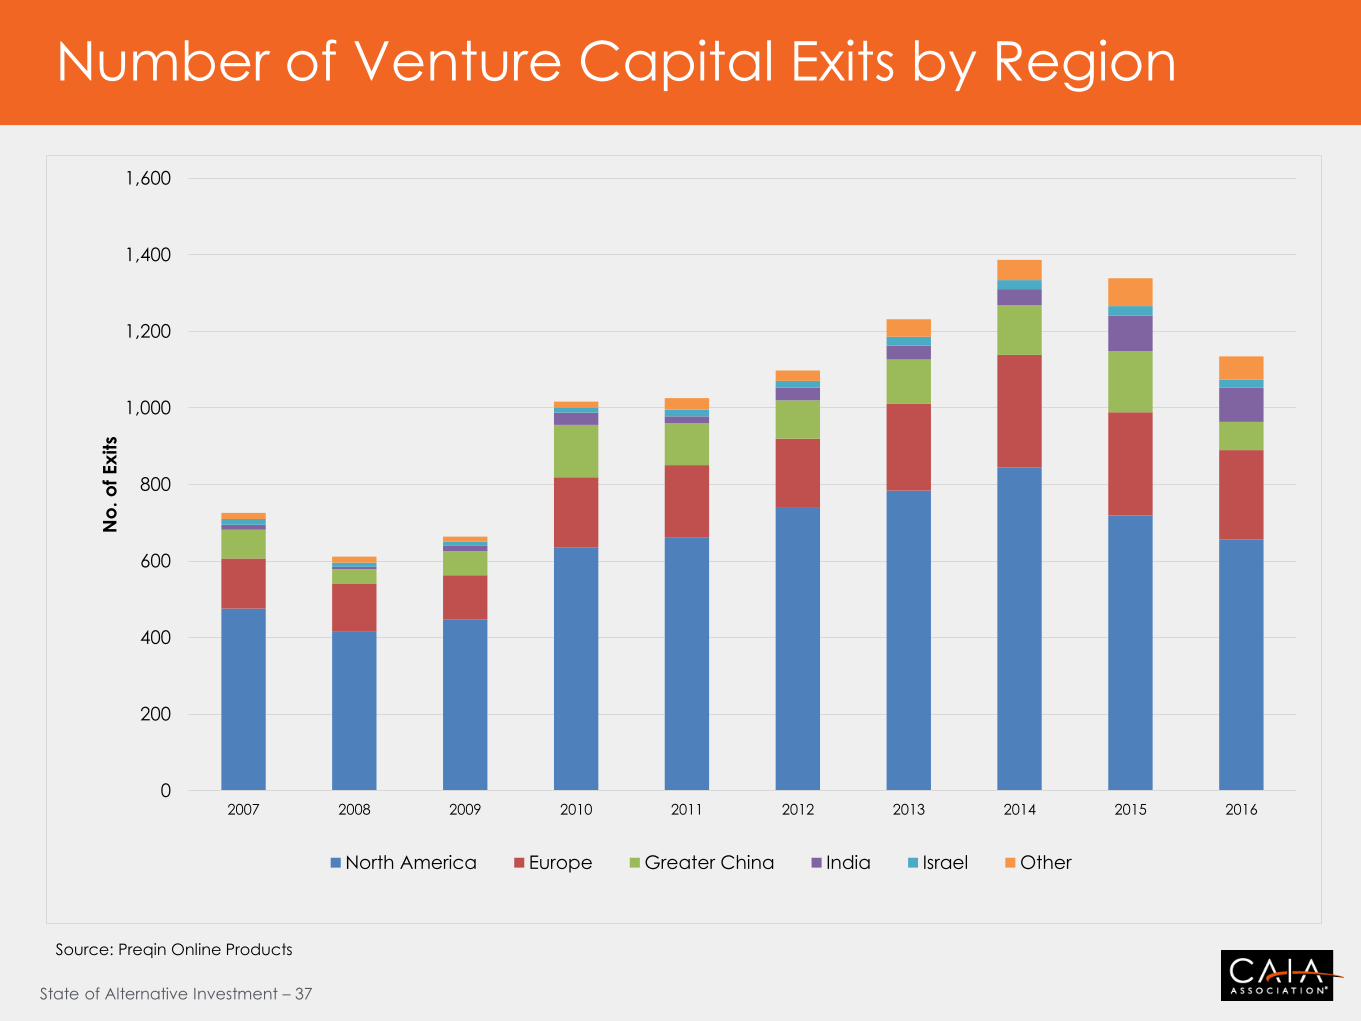
State of Alternative Investment – 37
Number of Venture Capital Exits by Region
0
200
400
600
800
1,000
1,200
1,400
1,600
2007 2008 2009 2010 2011 2012 2013 2014 2015 2016
No
. o
f Ex
its
North America Europe Greater China India Israel Other
Source: Preqin Online Products
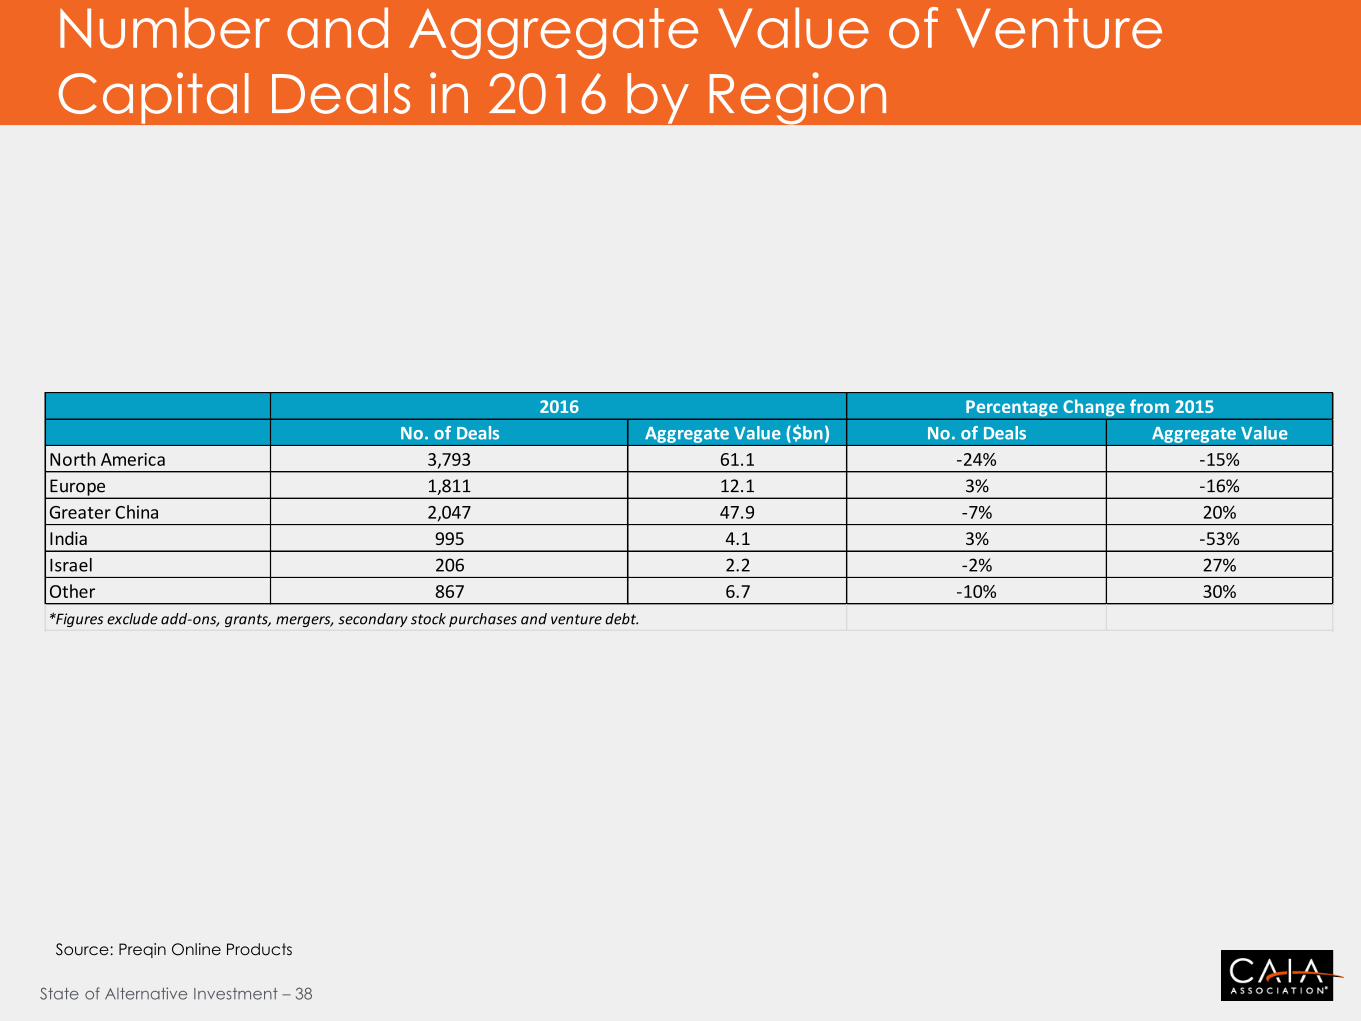
State of Alternative Investment – 38
Number and Aggregate Value of Venture
Capital Deals in 2016 by Region
No. of Deals Aggregate Value ($bn) No. of Deals Aggregate Value
North America 3,793 61.1 -24% -15%
Europe 1,811 12.1 3% -16%
Greater China 2,047 47.9 -7% 20%
India 995 4.1 3% -53%
Israel 206 2.2 -2% 27%
Other 867 6.7 -10% 30%
*Figures exclude add-ons, grants, mergers, secondary stock purchases and venture debt.
2016 Percentage Change from 2015
Source: Preqin Online Products
State of Alternative Investment – 39
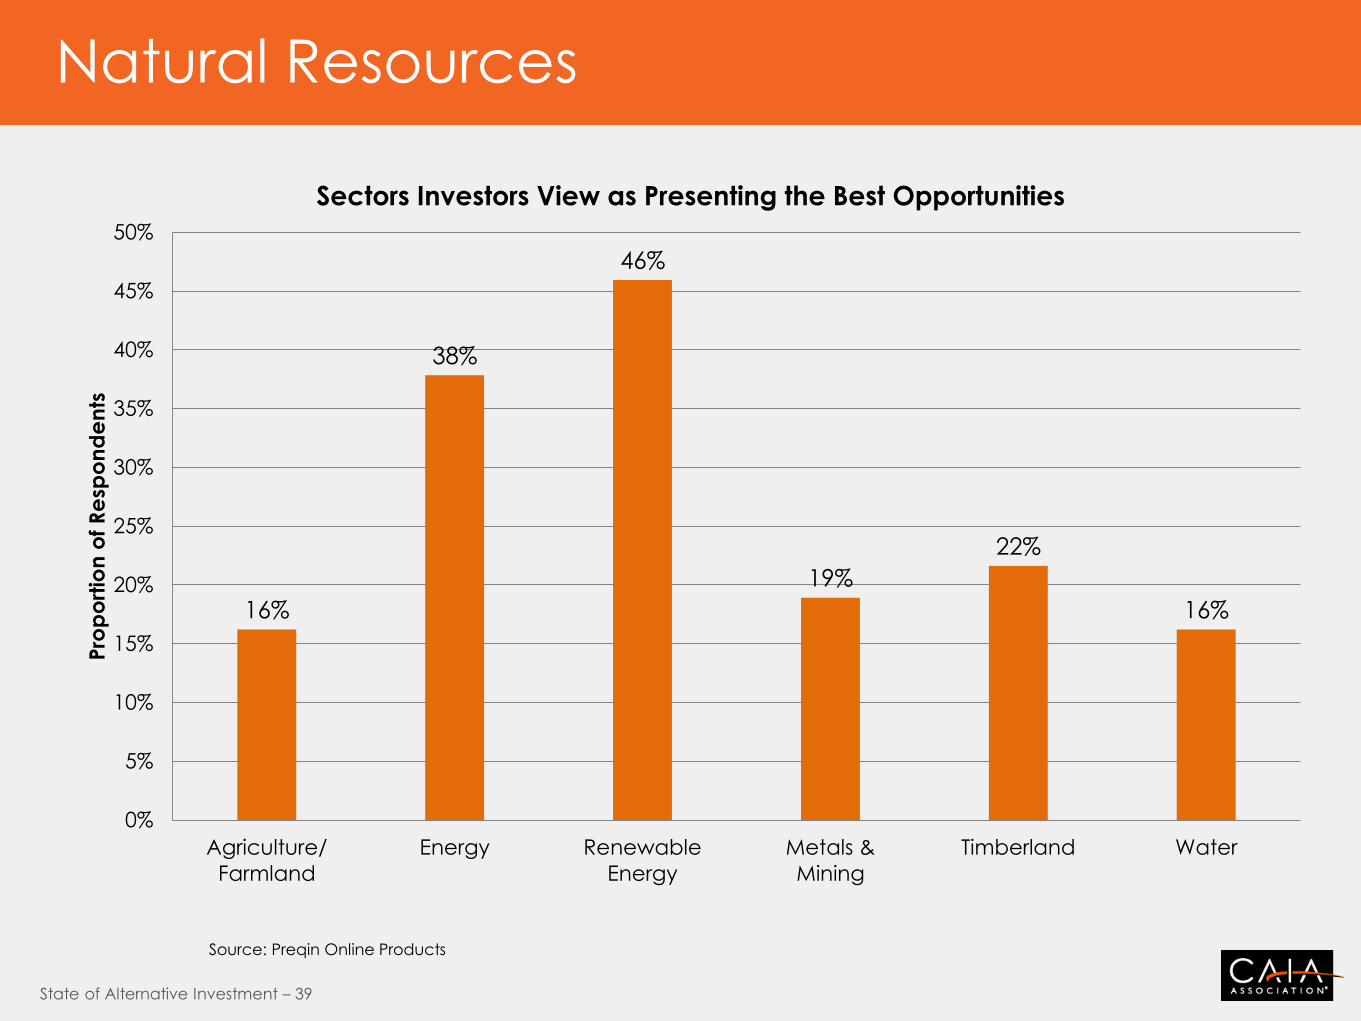
Natural Resources
16%
38%
46%
19%
22%
16%
0%
5%
10%
15%
20%
25%
30%
35%
40%
45%
50%
Agriculture/
Farmland
Energy Renewable
Energy
Metals &
Mining
Timberland Water
Pro
po
rtio
n o
f R
esp
on
de
nts
Sectors Investors View as Presenting the Best Opportunities
Source: Preqin Online Products

State of Alternative Investment – 40
Natural Resources
5%
14%
16%
21%
23%
30%
37%
77%
5%
9%
23%
32%
16%
36%
30%
77%
0% 10% 20% 30% 40% 50% 60% 70% 80% 90%
Brexit Vote
Stock Market Volatility
Currency Market Volatility
Low Interest Rates
Central Bank Intervention
Geopolitical Landscape
Slowdown in China's Economy
Commodity Price Volatility
Proportion of Respondents
Investor Views on the Macroeconomic Factors that Had the Biggest Impact on Their Natural Resources Portfolios in 2016 vs. Predictions for 2017
2016 2017
Source: Preqin Online Products
State of Alternative Investment – 41
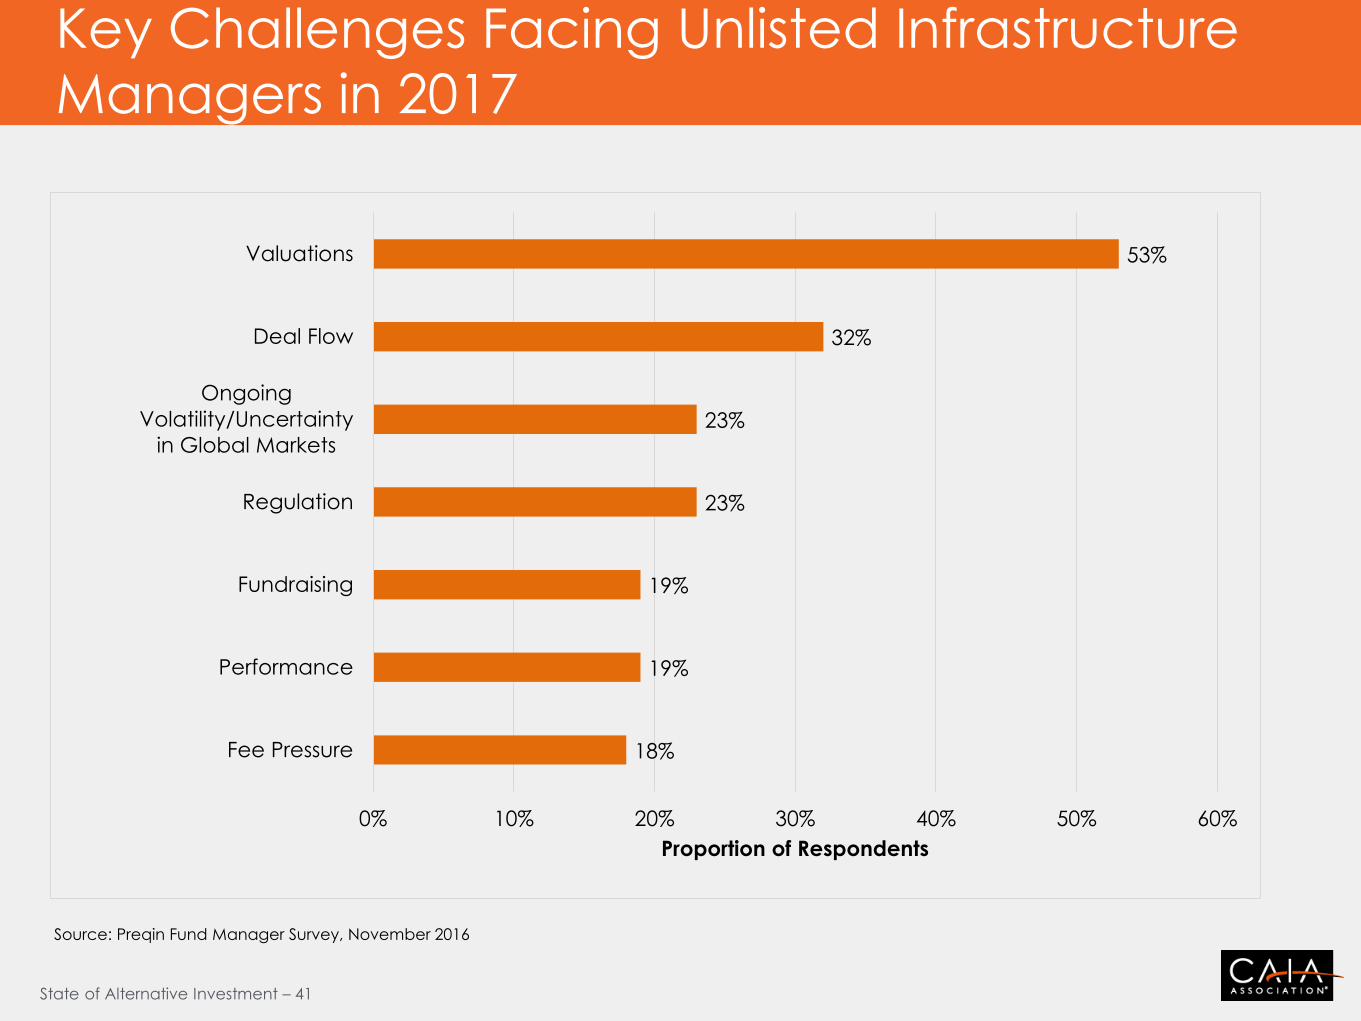
Key Challenges Facing Unlisted Infrastructure
Managers in 2017
18%
19%
19%
23%
23%
32%
53%
0% 10% 20% 30% 40% 50% 60%
Fee Pressure
Performance
Fundraising
Regulation
Ongoing
Volatility/Uncertainty
in Global Markets
Deal Flow
Valuations
Proportion of Respondents
Source: Preqin Fund Manager Survey, November 2016
State of Alternative Investment – 42
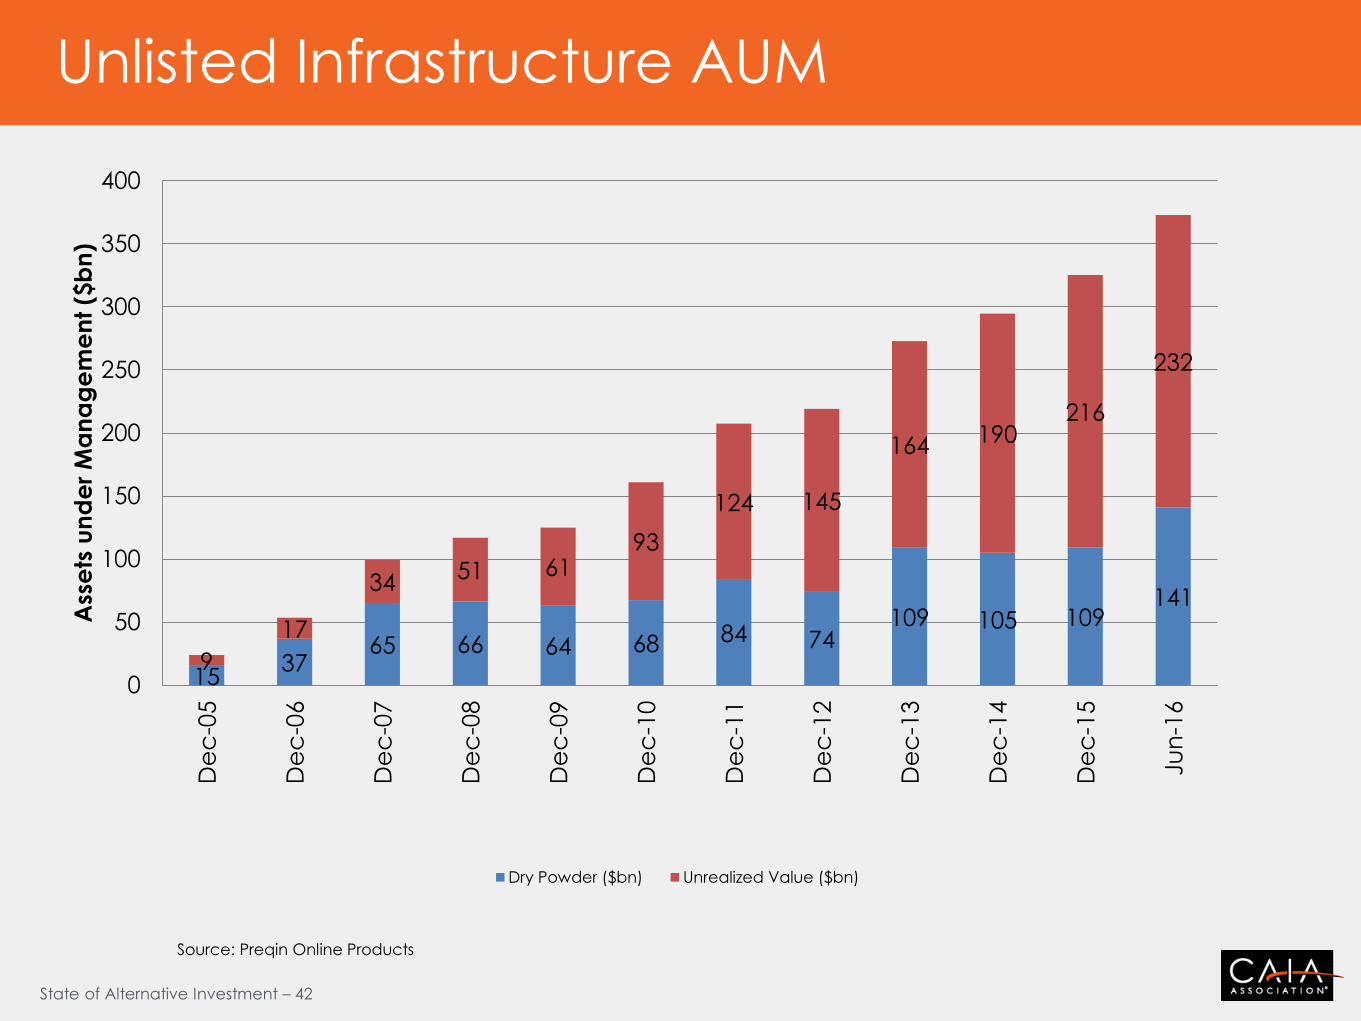
Unlisted Infrastructure AUM
15 37
65 66 64 68 84 74 109 105 109
141
9
17
34 51 61
93
124 145
164 190 216
232
0
50
100
150
200
250
300
350
400D
ec
-05
De
c-0
6
De
c-0
7
De
c-0
8
De
c-0
9
De
c-1
0
De
c-1
1
De
c-1
2
De
c-1
3
De
c-1
4
De
c-1
5
Ju
n-1
6
Ass
ets
un
de
r M
an
ag
em
en
t ($
bn
)
Dry Powder ($bn) Unrealized Value ($bn)
Source: Preqin Online Products
State of Alternative Investment – 43
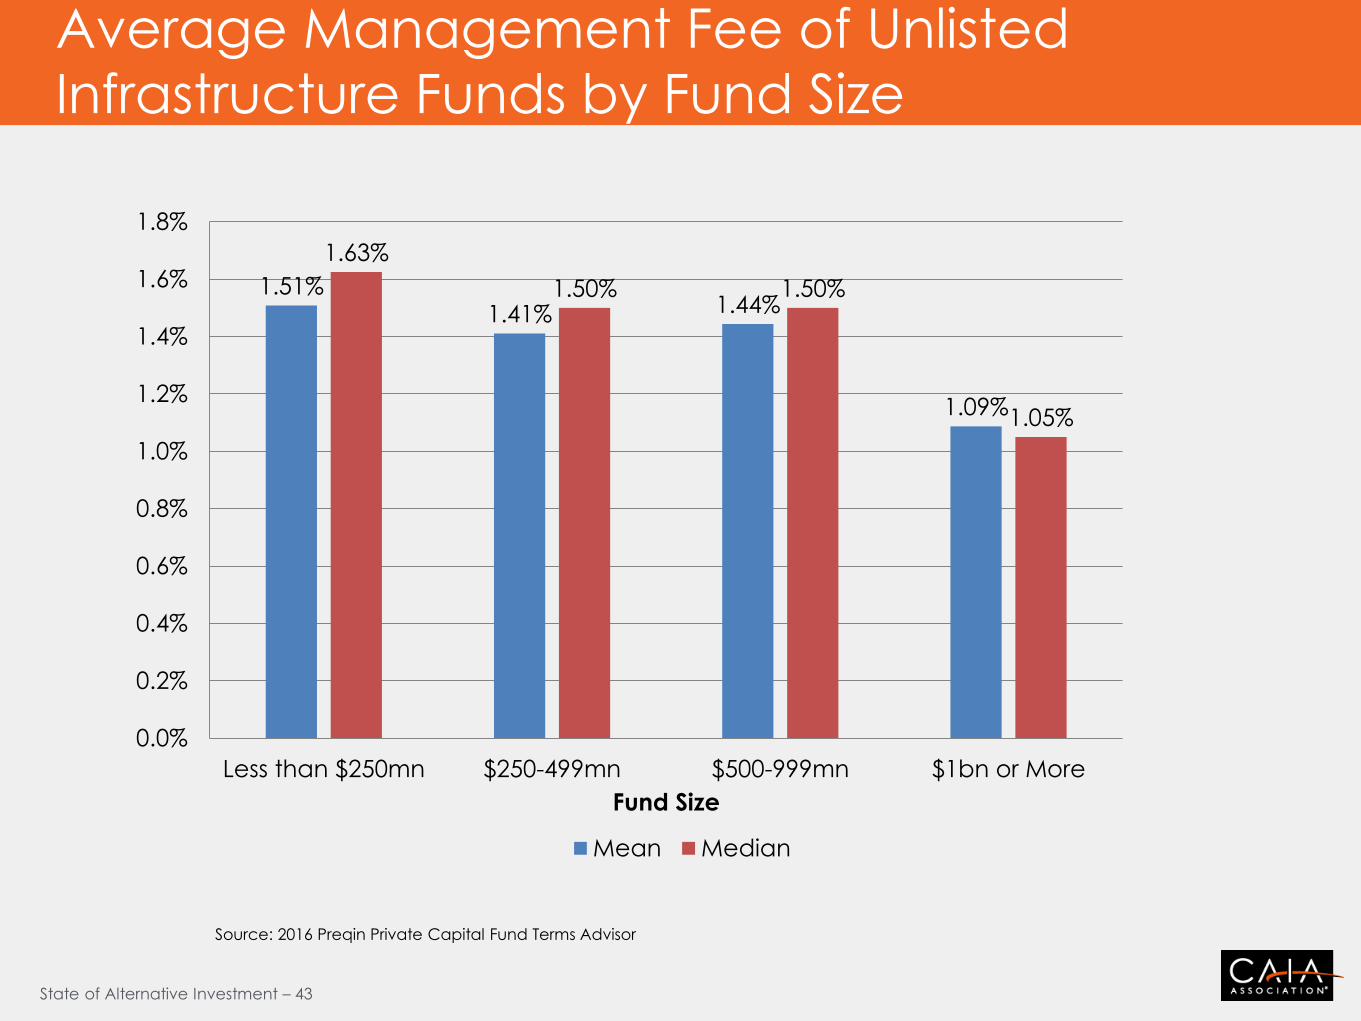
Average Management Fee of Unlisted
Infrastructure Funds by Fund Size
1.51% 1.41% 1.44%
1.09%
1.63%
1.50% 1.50%
1.05%
0.0%
0.2%
0.4%
0.6%
0.8%
1.0%
1.2%
1.4%
1.6%
1.8%
Less than $250mn $250-499mn $500-999mn $1bn or More
Fund Size
Mean Median
Source: 2016 Preqin Private Capital Fund Terms Advisor
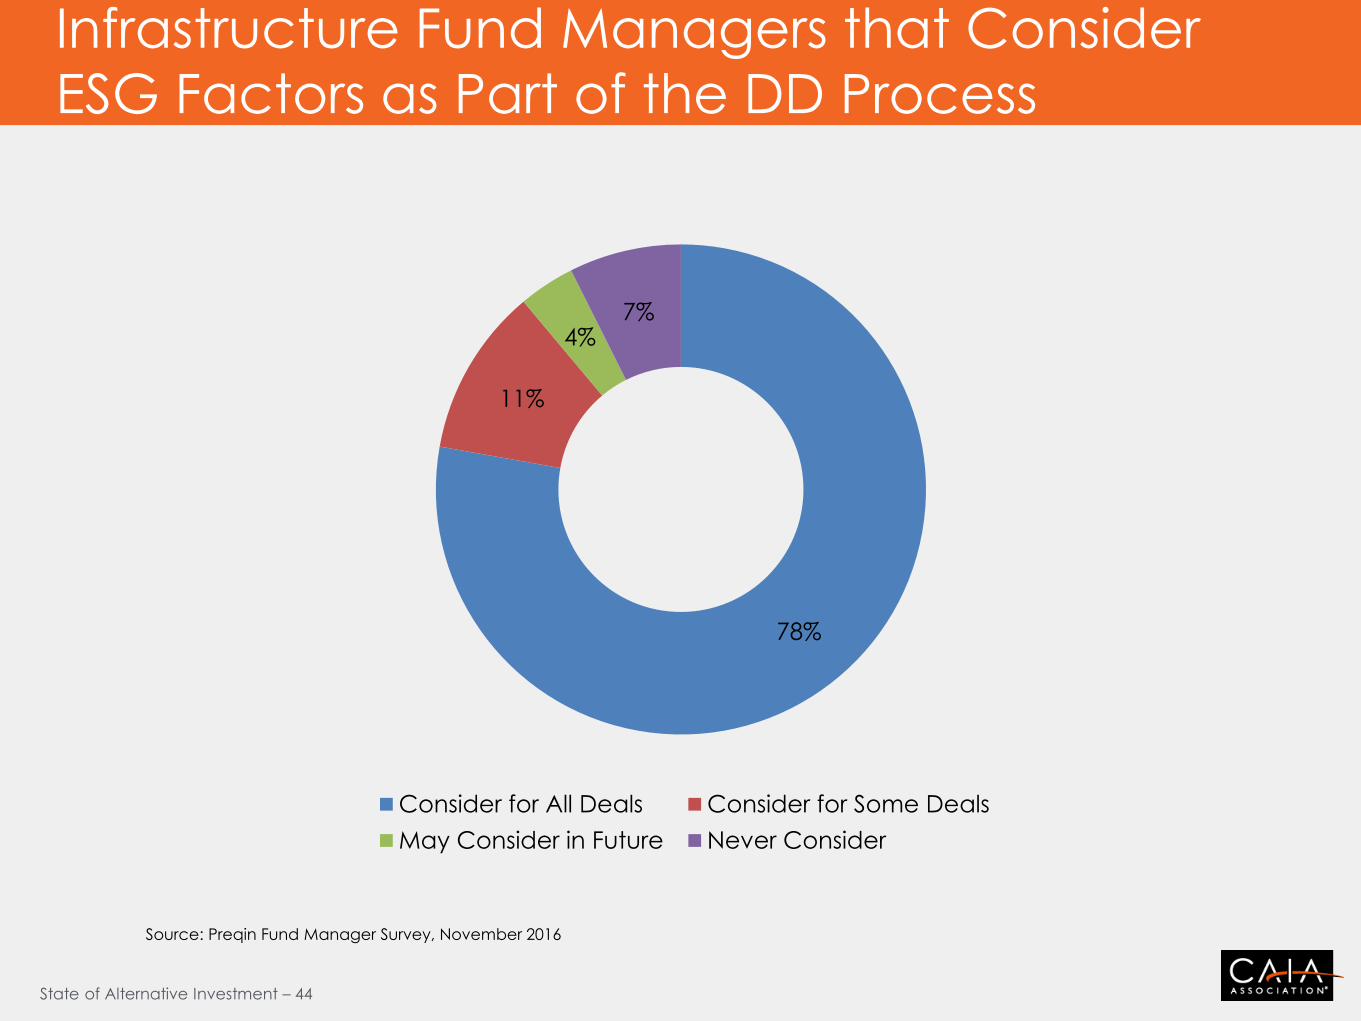
State of Alternative Investment – 44
Infrastructure Fund Managers that Consider
ESG Factors as Part of the DD Process
78%
11%
4% 7%
Consider for All Deals Consider for Some Deals
May Consider in Future Never Consider
Source: Preqin Fund Manager Survey, November 2016
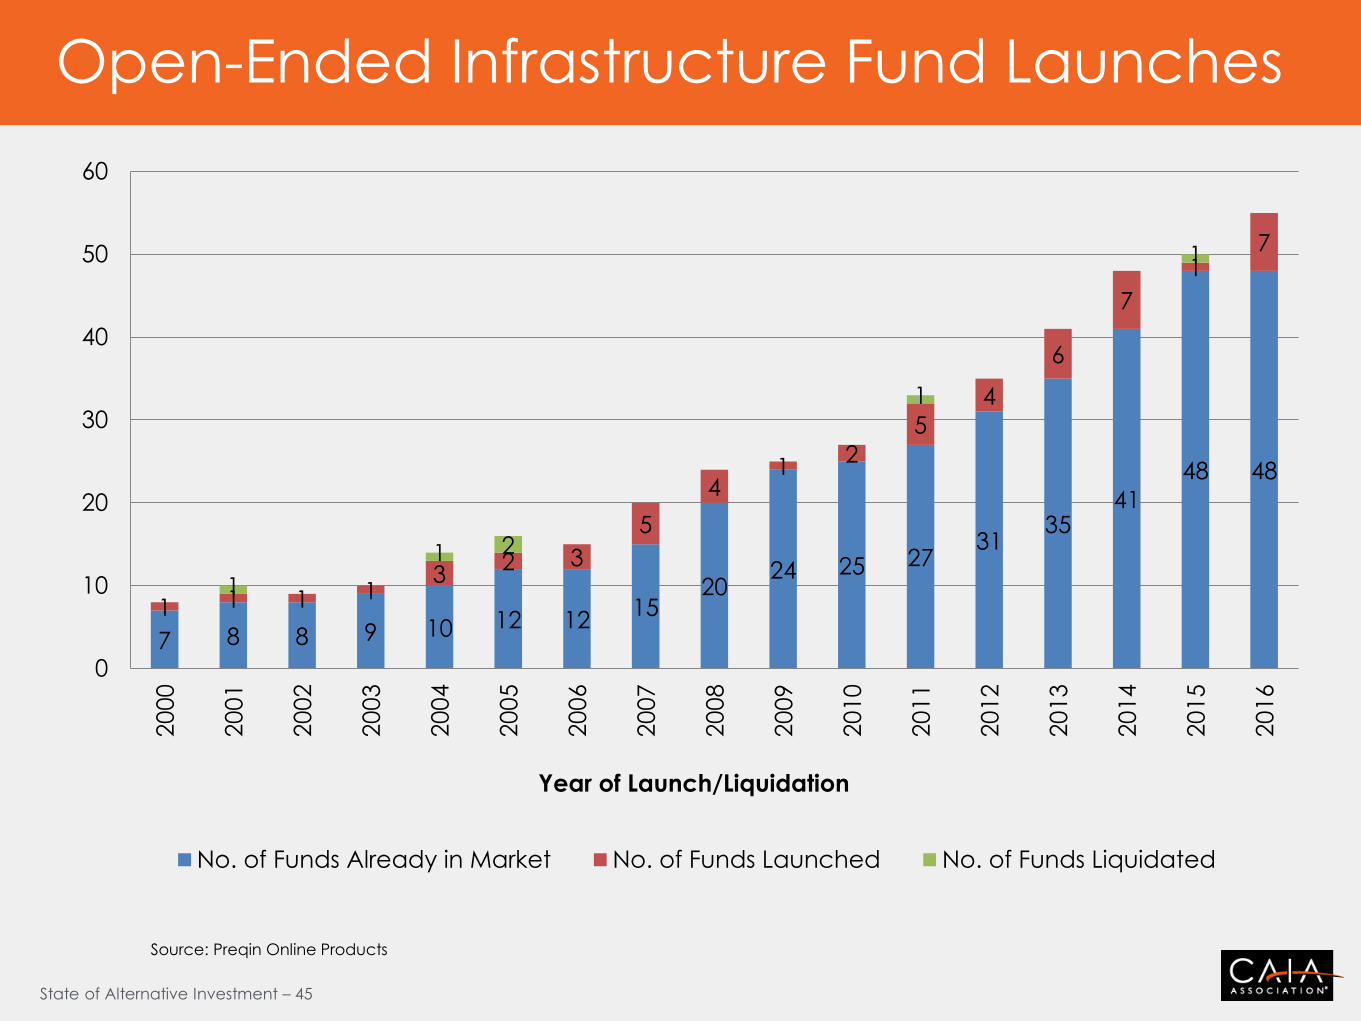
State of Alternative Investment – 45
Open-Ended Infrastructure Fund Launches
7 8 8 9 10 12 12 15
20 24 25 27
31 35
41
48 48
1 1 1 1 3
2 3
5
4 1
2
5
4
6
7
1 7
1
1 2
1
1
0
10
20
30
40
50
602000
2001
2002
2003
2004
2005
2006
2007
2008
2009
2010
2011
2012
2013
2014
2015
2016
Year of Launch/Liquidation
No. of Funds Already in Market No. of Funds Launched No. of Funds Liquidated
Source: Preqin Online Products
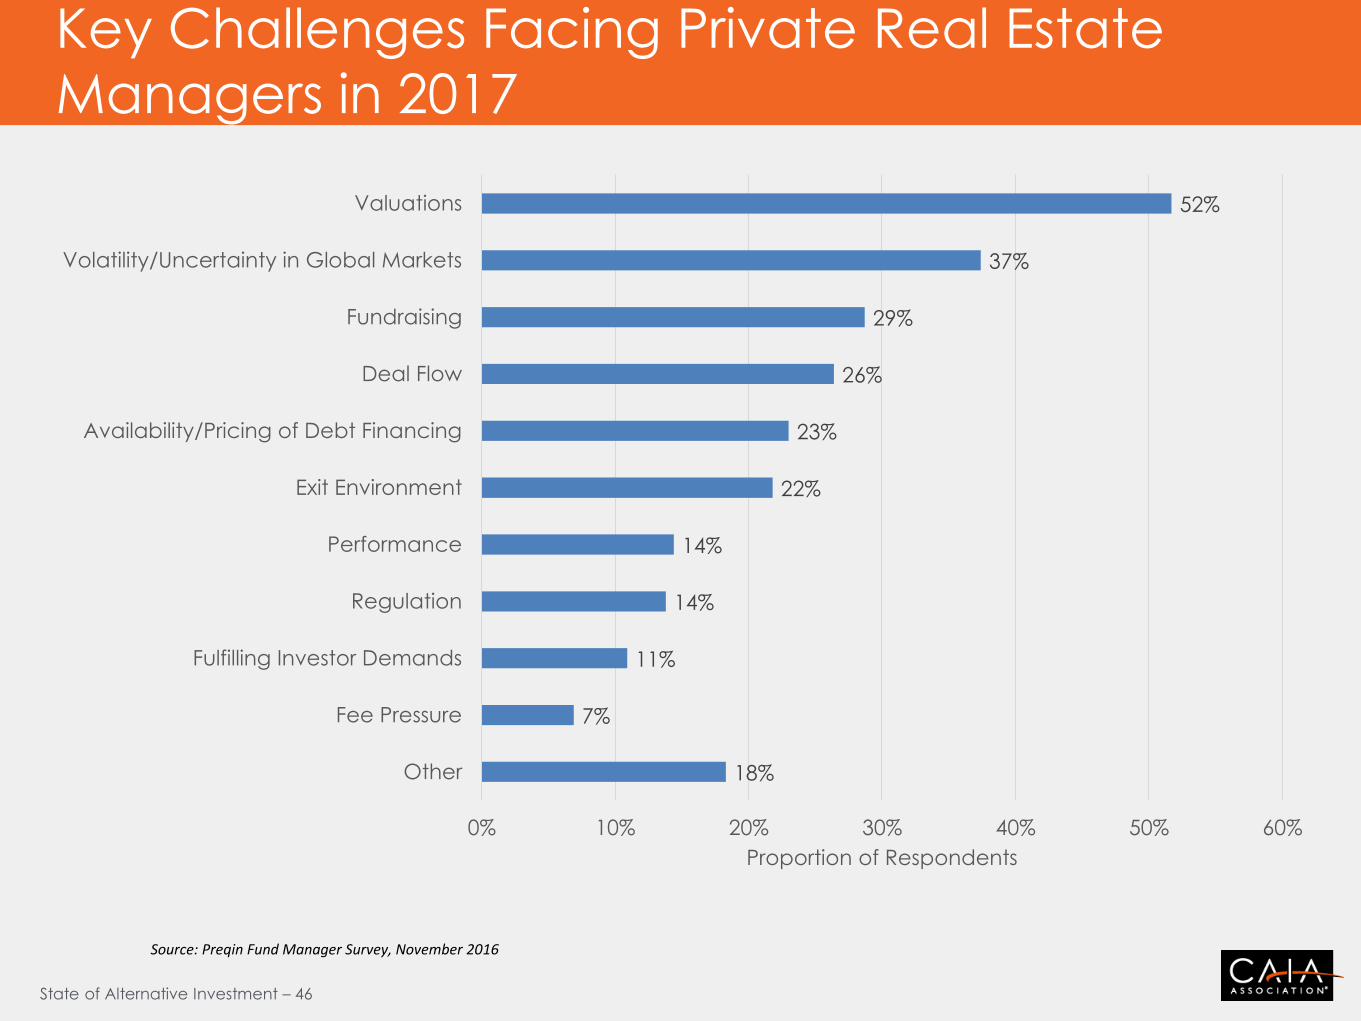
State of Alternative Investment – 46
Key Challenges Facing Private Real Estate
Managers in 2017
Source: Preqin Fund Manager Survey, November 2016
18%
7%
11%
14%
14%
22%
23%
26%
29%
37%
52%
0% 10% 20% 30% 40% 50% 60%
Other
Fee Pressure
Fulfilling Investor Demands
Regulation
Performance
Exit Environment
Availability/Pricing of Debt Financing
Deal Flow
Fundraising
Volatility/Uncertainty in Global Markets
Valuations
Proportion of Respondents
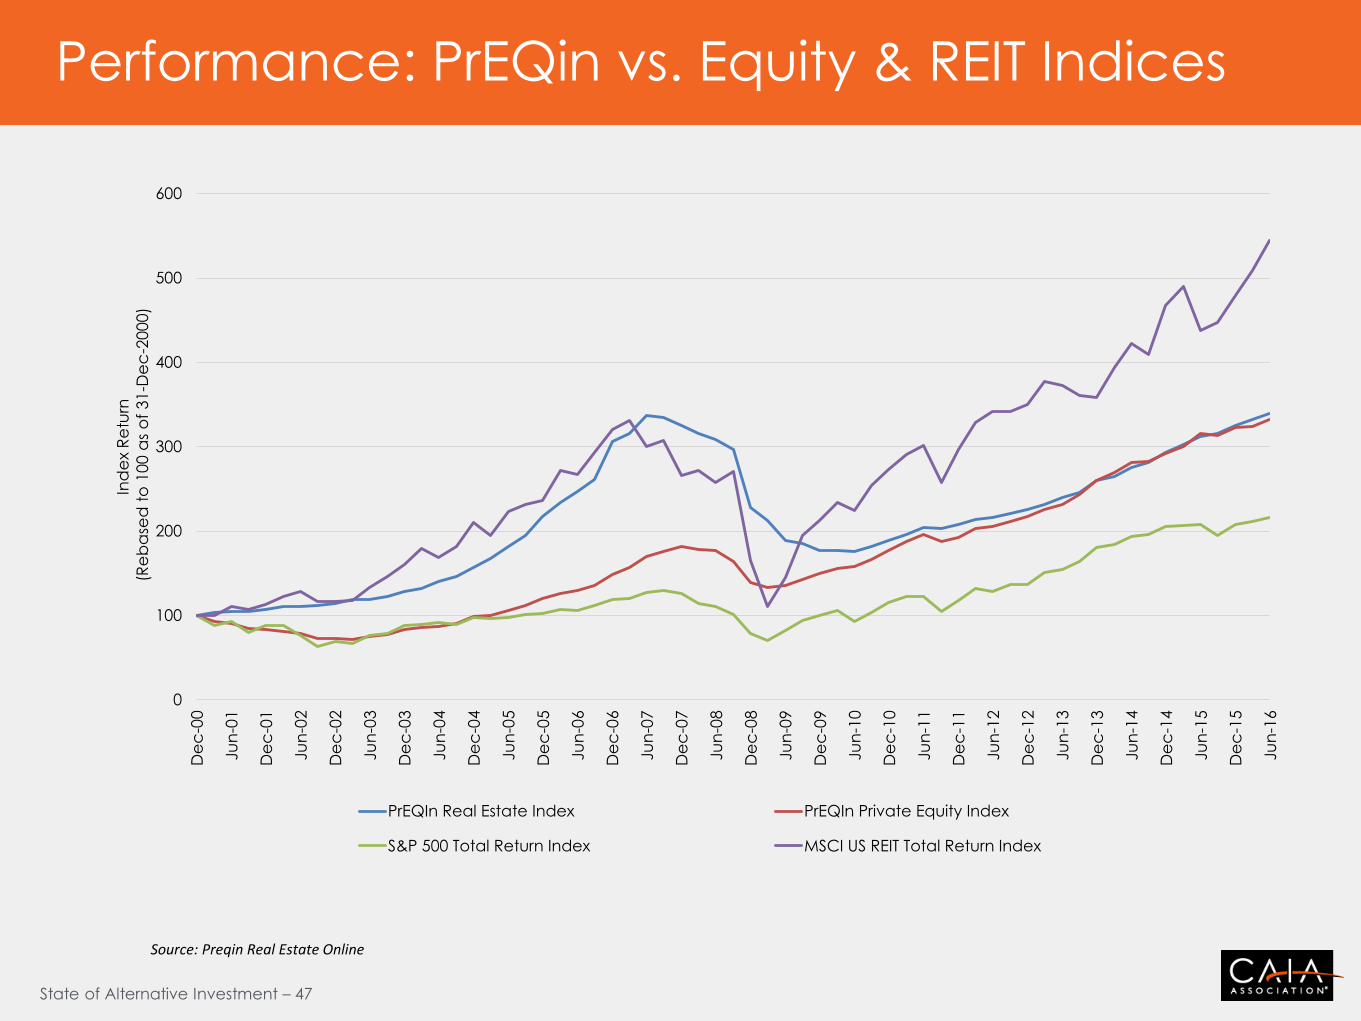
State of Alternative Investment – 47
Performance: PrEQin vs. Equity & REIT Indices
Source: Preqin Real Estate Online
0
100
200
300
400
500
600D
ec
-00
Ju
n-0
1
De
c-0
1
Ju
n-0
2
De
c-0
2
Ju
n-0
3
De
c-0
3
Ju
n-0
4
De
c-0
4
Ju
n-0
5
De
c-0
5
Ju
n-0
6
De
c-0
6
Ju
n-0
7
De
c-0
7
Ju
n-0
8
De
c-0
8
Ju
n-0
9
De
c-0
9
Ju
n-1
0
De
c-1
0
Ju
n-1
1
De
c-1
1
Ju
n-1
2
De
c-1
2
Ju
n-1
3
De
c-1
3
Ju
n-1
4
De
c-1
4
Ju
n-1
5
De
c-1
5
Ju
n-1
6
Ind
ex R
etu
rn
(R
eb
ase
d t
o 1
00 a
s o
f 31
-De
c-2
000)
PrEQIn Real Estate Index PrEQIn Private Equity Index
S&P 500 Total Return Index MSCI US REIT Total Return Index

State of Alternative Investment – 48
Real Estate: Public Market Equivalent (PME)
Source: Preqin Real Estate Online
0.5
0.6
0.7
0.8
0.9
1.0
1.1
1.2
20
04
20
05
20
06
20
07
20
08
20
09
20
10
20
11
20
12
20
13
20
14
20
15
20
16
PM
E V
alu
e (
X)
Vintage Year
KS PME Using MSCI US REIT
KS PME Using S&P 500 TR
If PME value (X) is >1, private real
estate has outperformed the
public market

State of Alternative Investment – 49
US Average Cap Rate vs. US 10 Year Yield
Source: CAIA and Bloomberg
0
2
4
6
8
10
12
1/1
/20
01
5/1
/20
01
9/1
/20
01
1/1
/20
02
5/1
/20
02
9/1
/20
02
1/1
/20
03
5/1
/20
03
9/1
/20
03
1/1
/20
04
5/1
/20
04
9/1
/20
04
1/1
/20
05
5/1
/20
05
9/1
/20
05
1/1
/20
06
5/1
/20
06
9/1
/20
06
1/1
/20
07
5/1
/20
07
9/1
/20
07
1/1
/20
08
5/1
/20
08
9/1
/20
08
1/1
/20
09
5/1
/20
09
9/1
/20
09
1/1
/20
10
5/1
/20
10
9/1
/20
10
1/1
/20
11
5/1
/20
11
9/1
/20
11
1/1
/20
12
5/1
/20
12
9/1
/20
12
1/1
/20
13
5/1
/20
13
9/1
/20
13
1/1
/20
14
5/1
/20
14
9/1
/20
14
1/1
/20
15
5/1
/20
15
9/1
/20
15
1/1
/20
16
5/1
/20
16
9/1
/20
16
1/1
/20
17
Yie
ld
Spread US Avg. Cap Rate US 10 Year Yield
State of Alternative Investment – 50
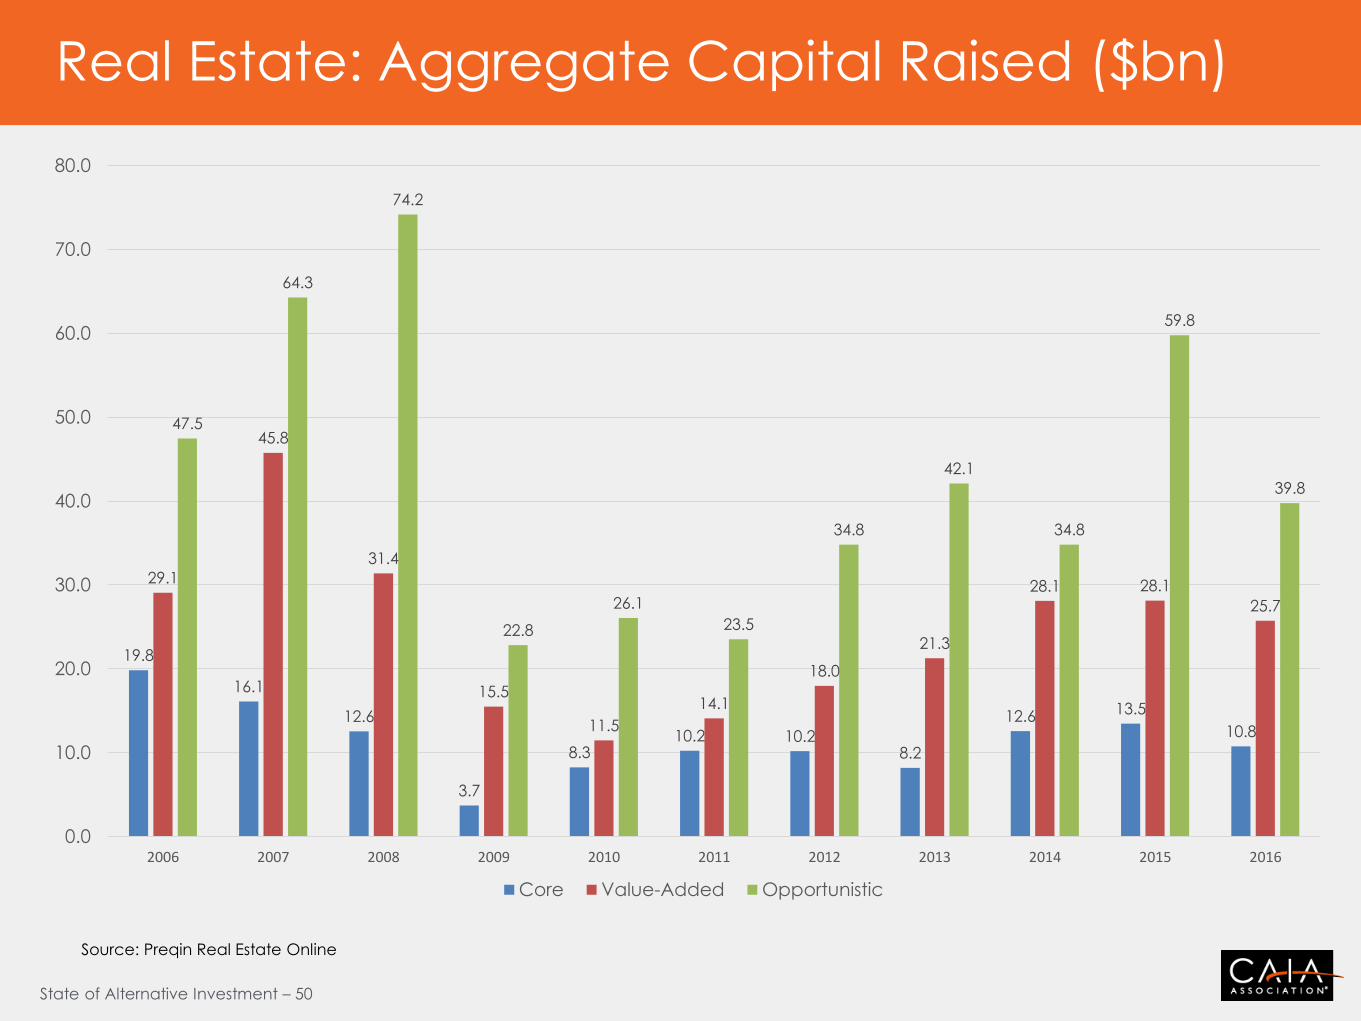
Real Estate: Aggregate Capital Raised ($bn)
19.8
16.1
12.6
3.7
8.3 10.2 10.2
8.2
12.6 13.5
10.8
29.1
45.8
31.4
15.5
11.5
14.1
18.0
21.3
28.1 28.1
25.7
47.5
64.3
74.2
22.8
26.1
23.5
34.8
42.1
34.8
59.8
39.8
0.0
10.0
20.0
30.0
40.0
50.0
60.0
70.0
80.0
2006 2007 2008 2009 2010 2011 2012 2013 2014 2015 2016
Core Value-Added Opportunistic
Source: Preqin Real Estate Online
State of Alternative Investment – 51
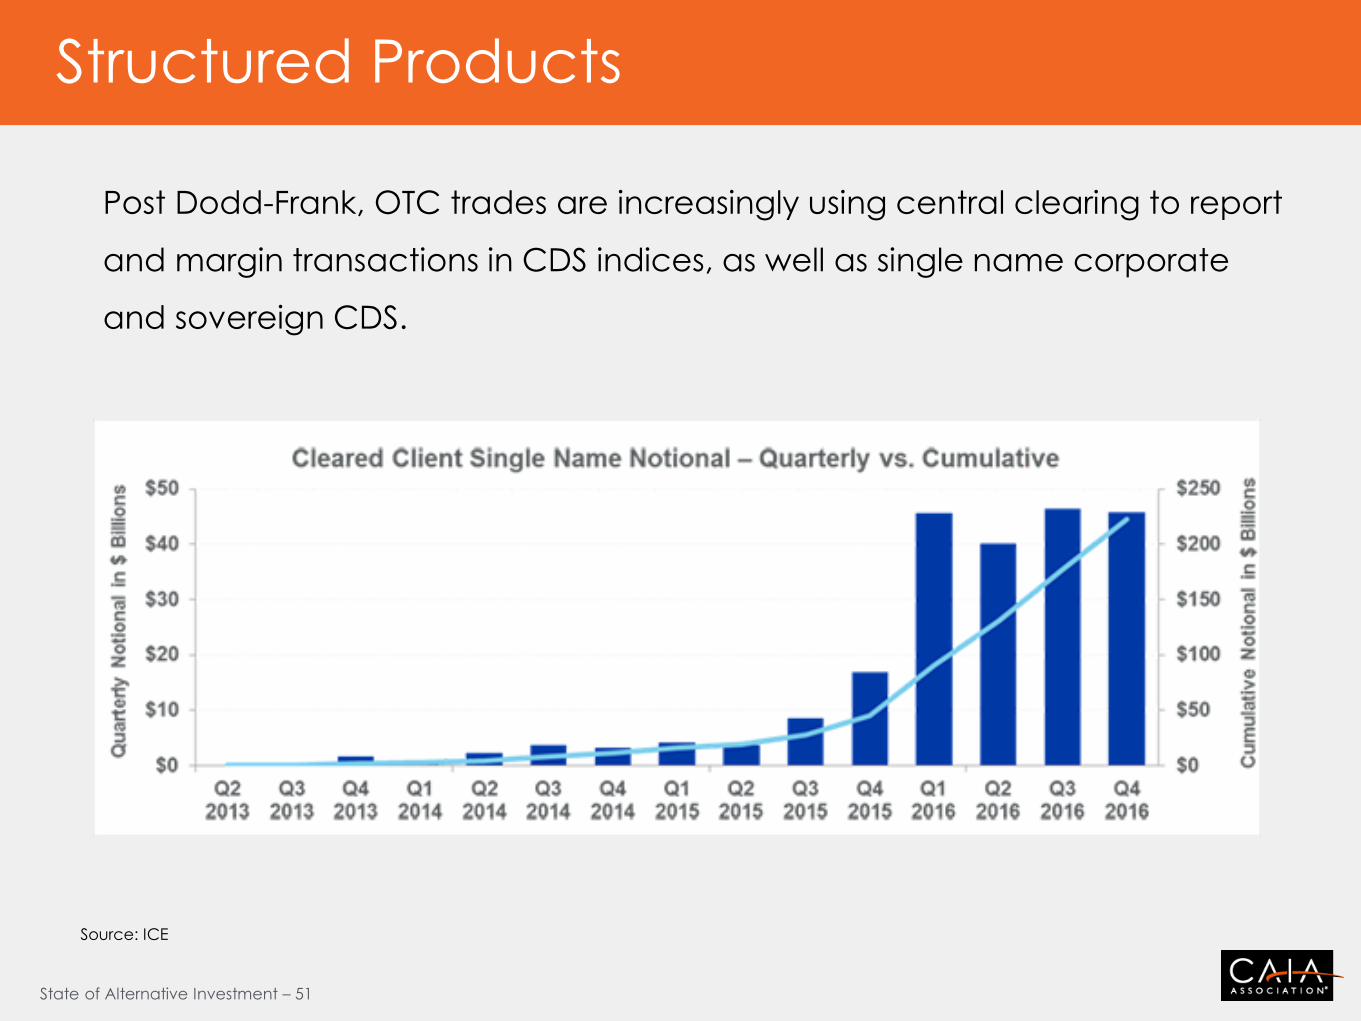
Structured Products
Post Dodd-Frank, OTC trades are increasingly using central clearing to report
and margin transactions in CDS indices, as well as single name corporate
and sovereign CDS.
Source: ICE
State of Alternative Investment – 52
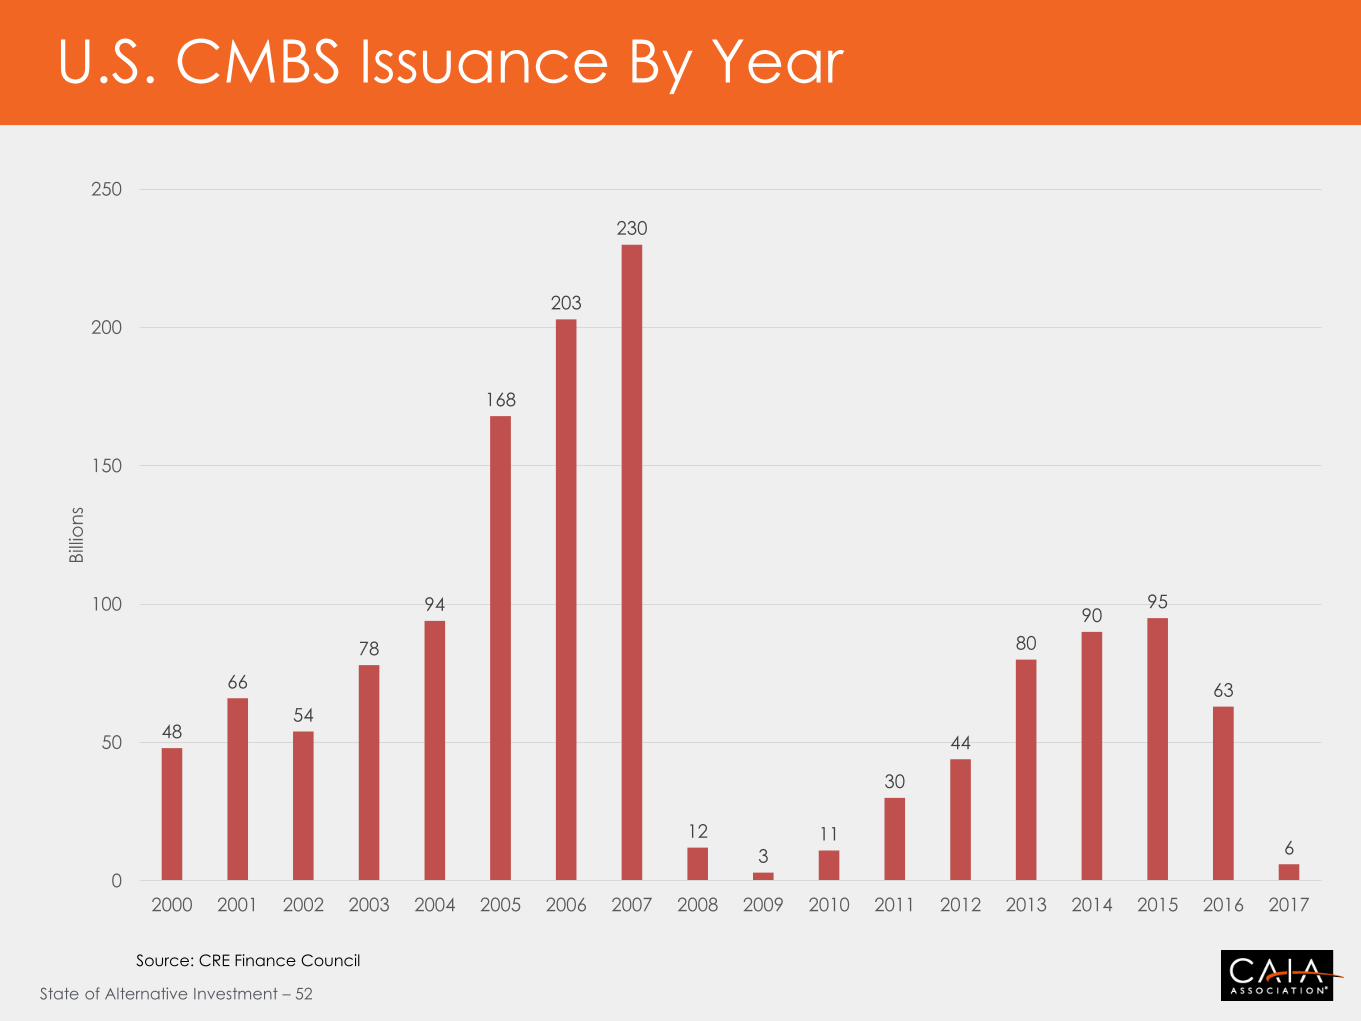
U.S. CMBS Issuance By Year
Source: CRE Finance Council
48
66
54
78
94
168
203
230
12
3 11
30
44
80
90 95
63
6
0
50
100
150
200
250
2000 2001 2002 2003 2004 2005 2006 2007 2008 2009 2010 2011 2012 2013 2014 2015 2016 2017
Bill
ion
s
State of Alternative Investment – 53
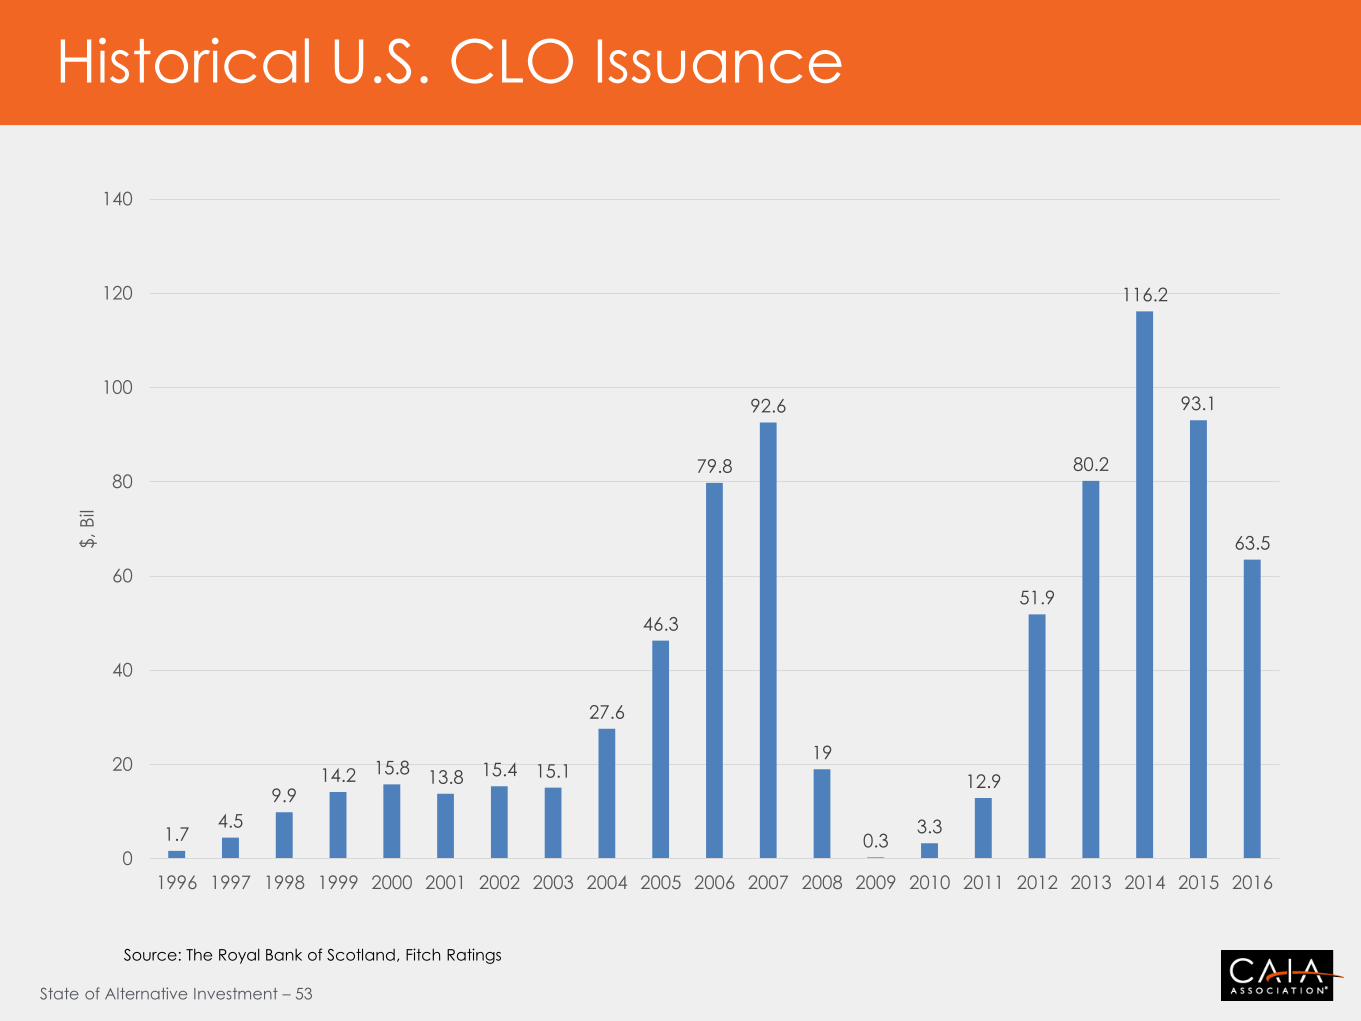
Historical U.S. CLO Issuance
Source: The Royal Bank of Scotland, Fitch Ratings
1.7 4.5
9.9 14.2 15.8
13.8 15.4 15.1
27.6
46.3
79.8
92.6
19
0.3 3.3
12.9
51.9
80.2
116.2
93.1
63.5
0
20
40
60
80
100
120
140
1996 1997 1998 1999 2000 2001 2002 2003 2004 2005 2006 2007 2008 2009 2010 2011 2012 2013 2014 2015 2016
$, B
il

September 2017 Exam
The Global Benchmark In Alternative
Investment Education
The CAIA Charter

State of Alternative Investment – 55
Global Presence
State of Alternative Investment – 56
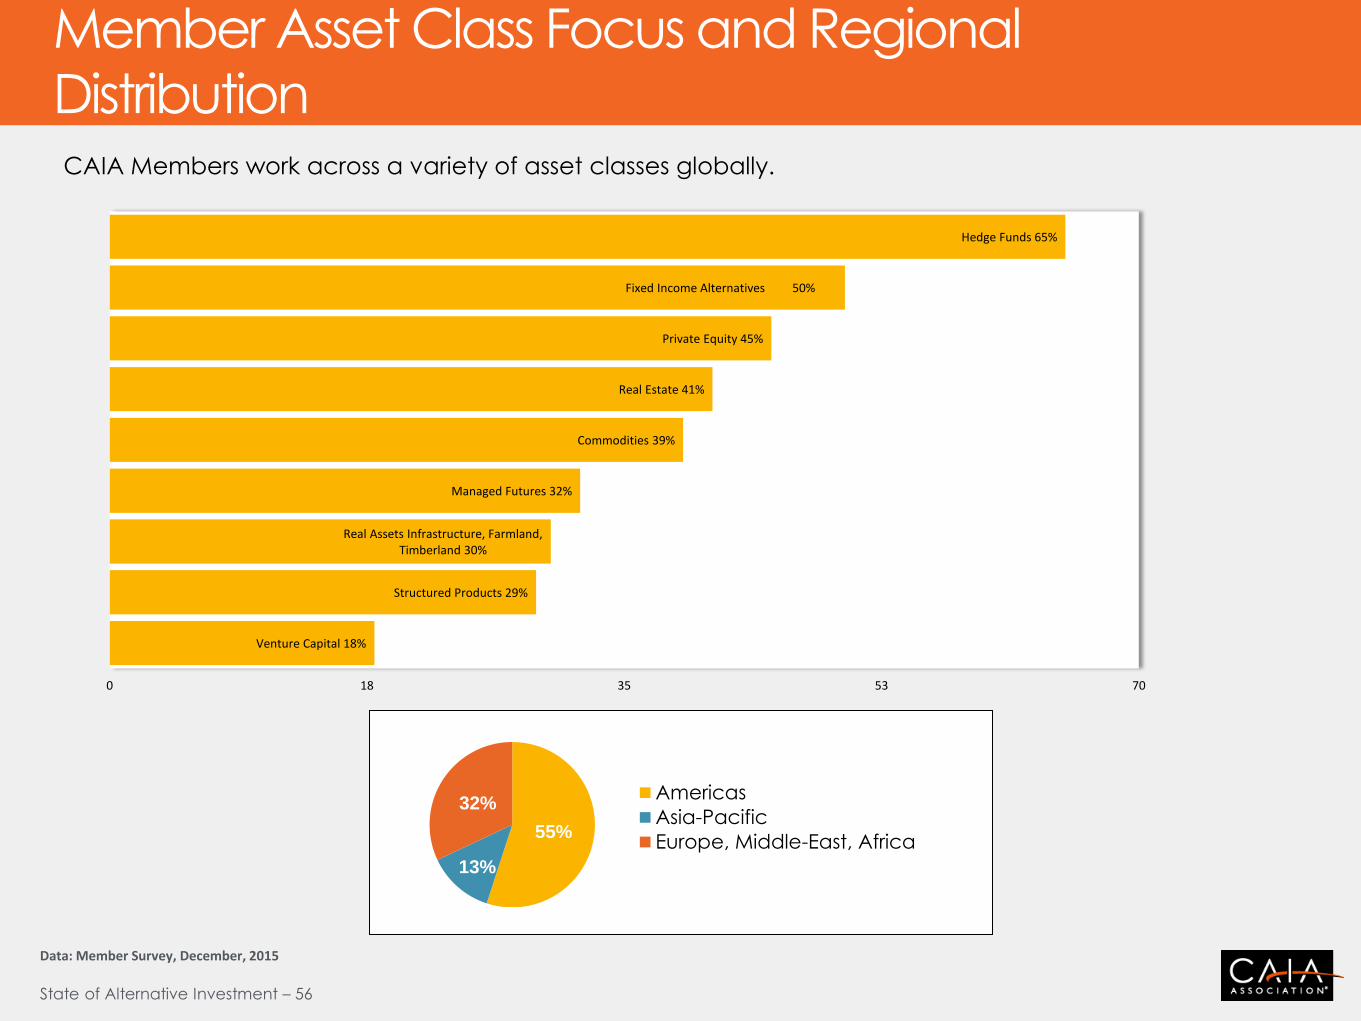
Member Asset Class Focus and Regional
Distribution
Data: Member Survey, December, 2015
Hedge Funds 65%
Fixed Income Alternatives 50%
Private Equity 45%
Real Estate 41%
Commodities 39%
Managed Futures 32%
Real Assets Infrastructure, Farmland, Timberland 30%
Structured Products 29%
Venture Capital 18%
0 18 35 53 70
55%
13%
32% Americas
Asia-Pacific
Europe, Middle-East, Africa
CAIA Members work across a variety of asset classes globally.
State of Alternative Investment – 57
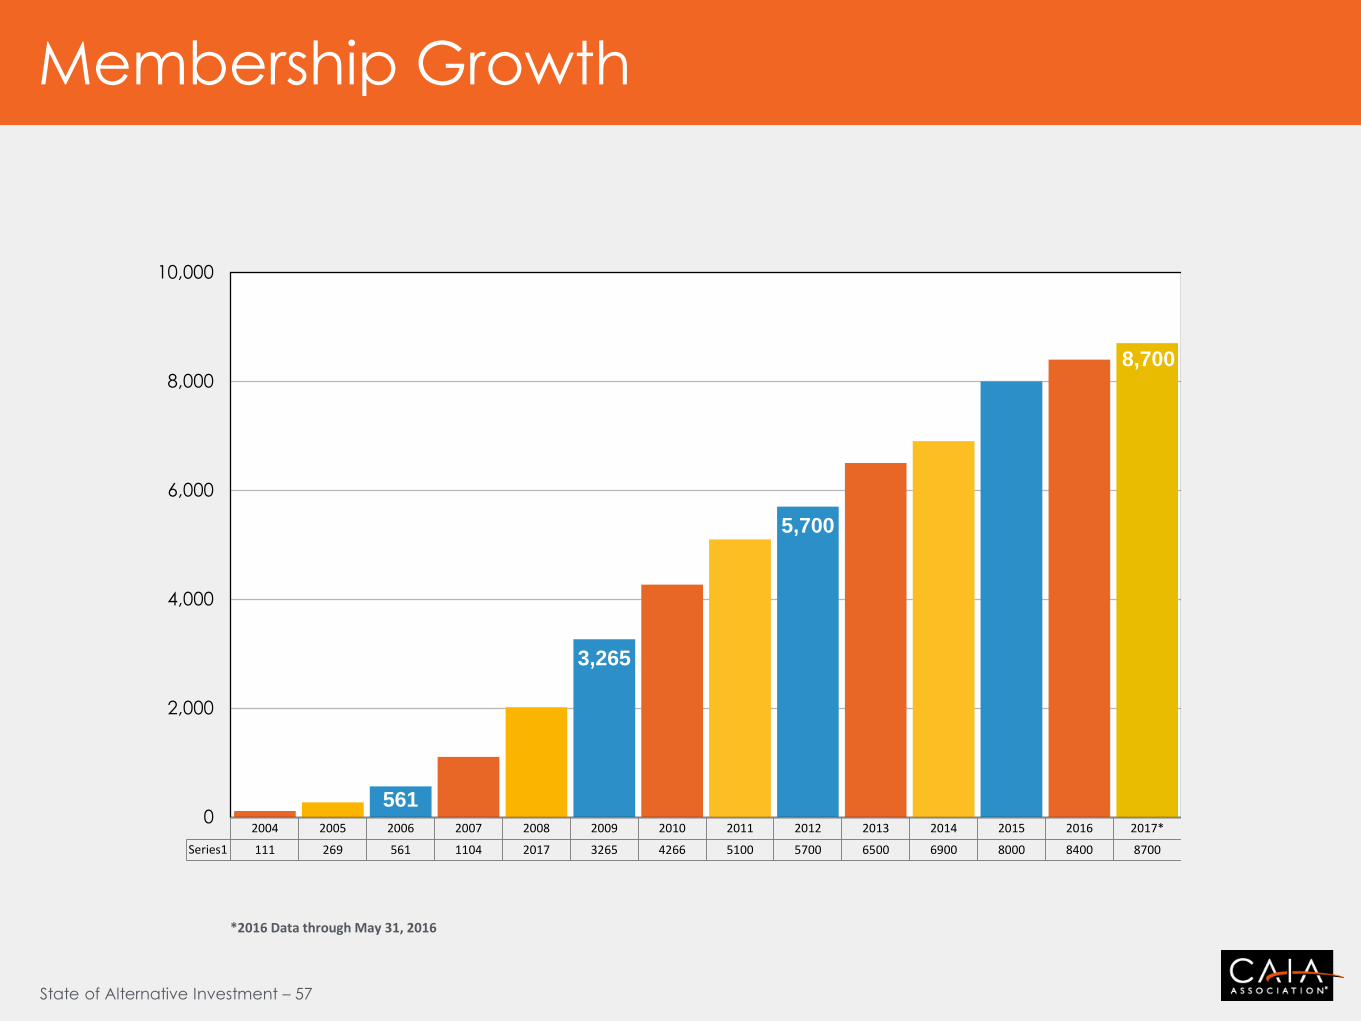
Membership Growth
2004 2005 2006 2007 2008 2009 2010 2011 2012 2013 2014 2015 2016 2017*
Series1 111 269 561 1104 2017 3265 4266 5100 5700 6500 6900 8000 8400 8700
561
3,265
5,700
8,700
0
2,000
4,000
6,000
8,000
10,000
*2016 Data through May 31, 2016
State of Alternative Investment – 58
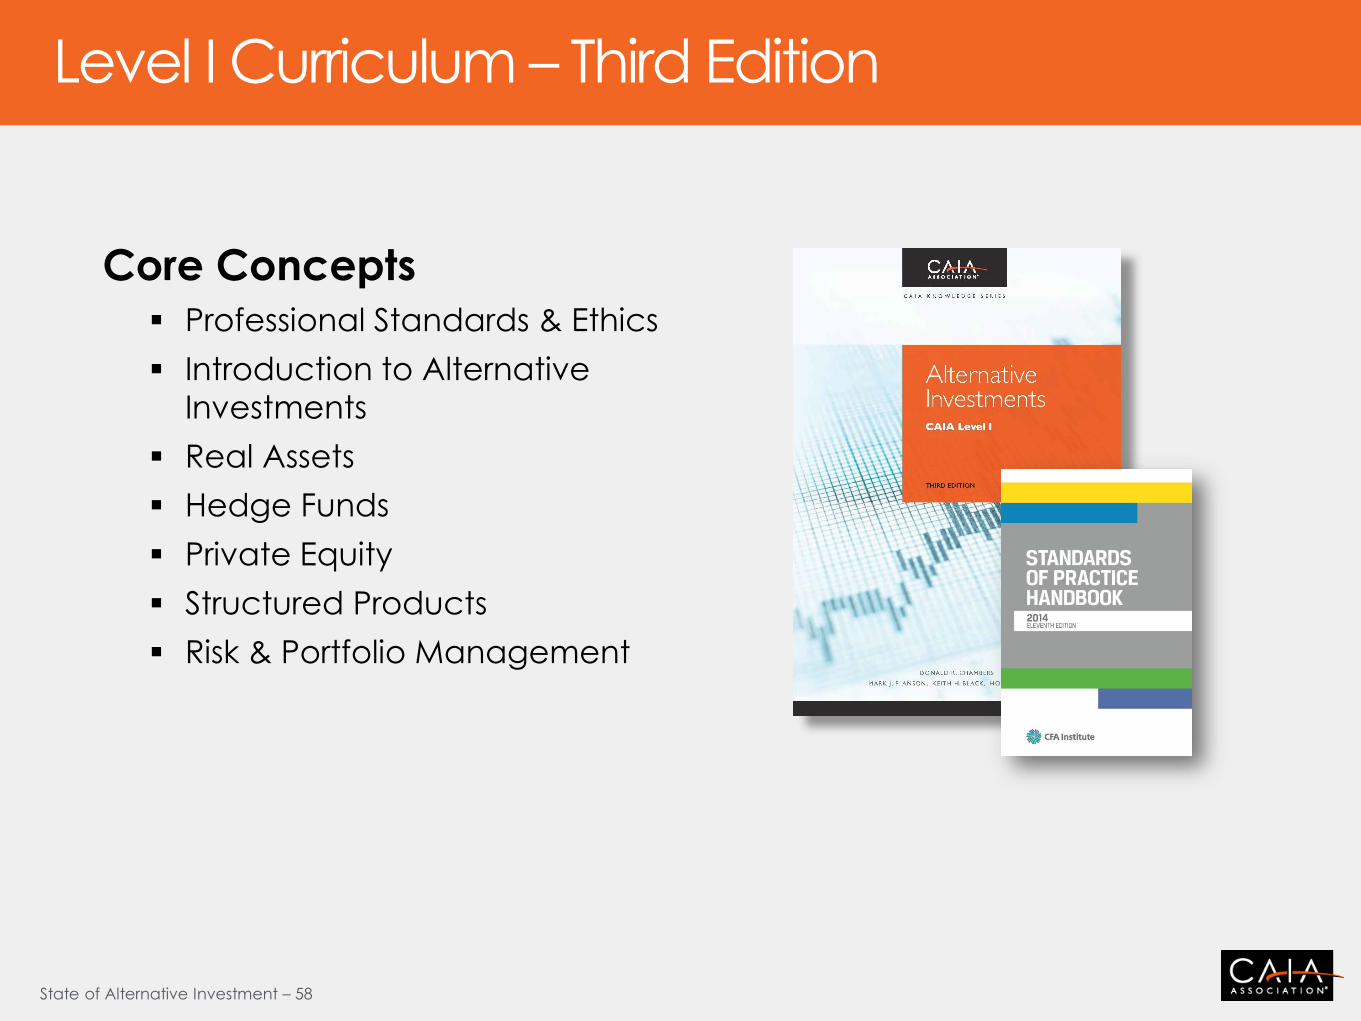
Level I Curriculum – Third Edition
Core Concepts
Professional Standards & Ethics
Introduction to Alternative
Investments
Real Assets
Hedge Funds
Private Equity
Structured Products
Risk & Portfolio Management
State of Alternative Investment – 59
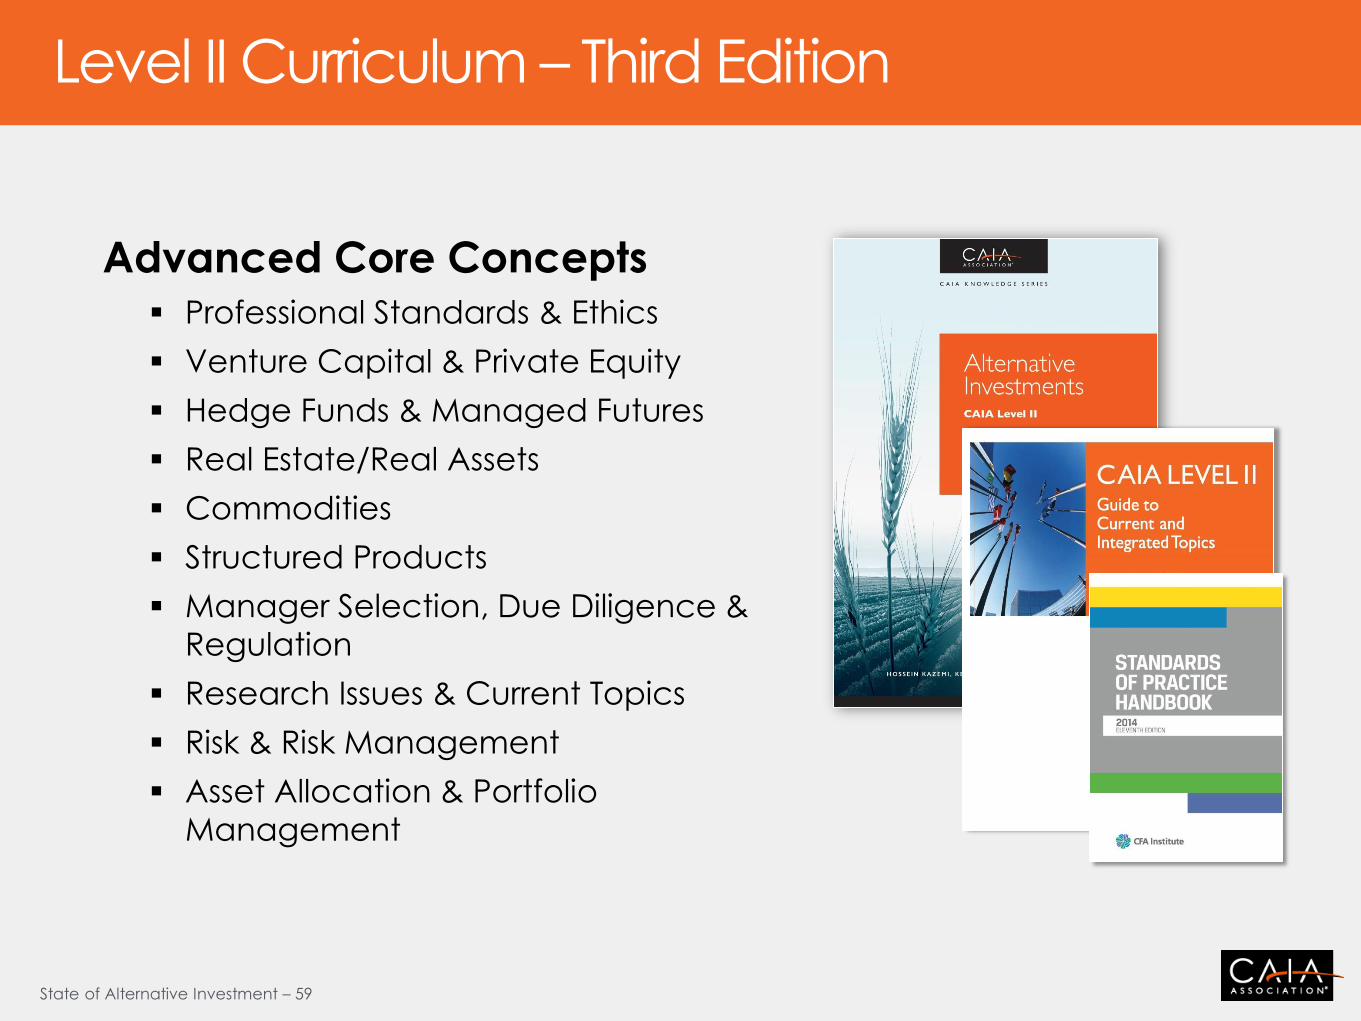
Level II Curriculum – Third Edition
Advanced Core Concepts
Professional Standards & Ethics
Venture Capital & Private Equity
Hedge Funds & Managed Futures
Real Estate/Real Assets
Commodities
Structured Products
Manager Selection, Due Diligence &
Regulation
Research Issues & Current Topics
Risk & Risk Management
Asset Allocation & Portfolio
Management
State of Alternative Investment – 60
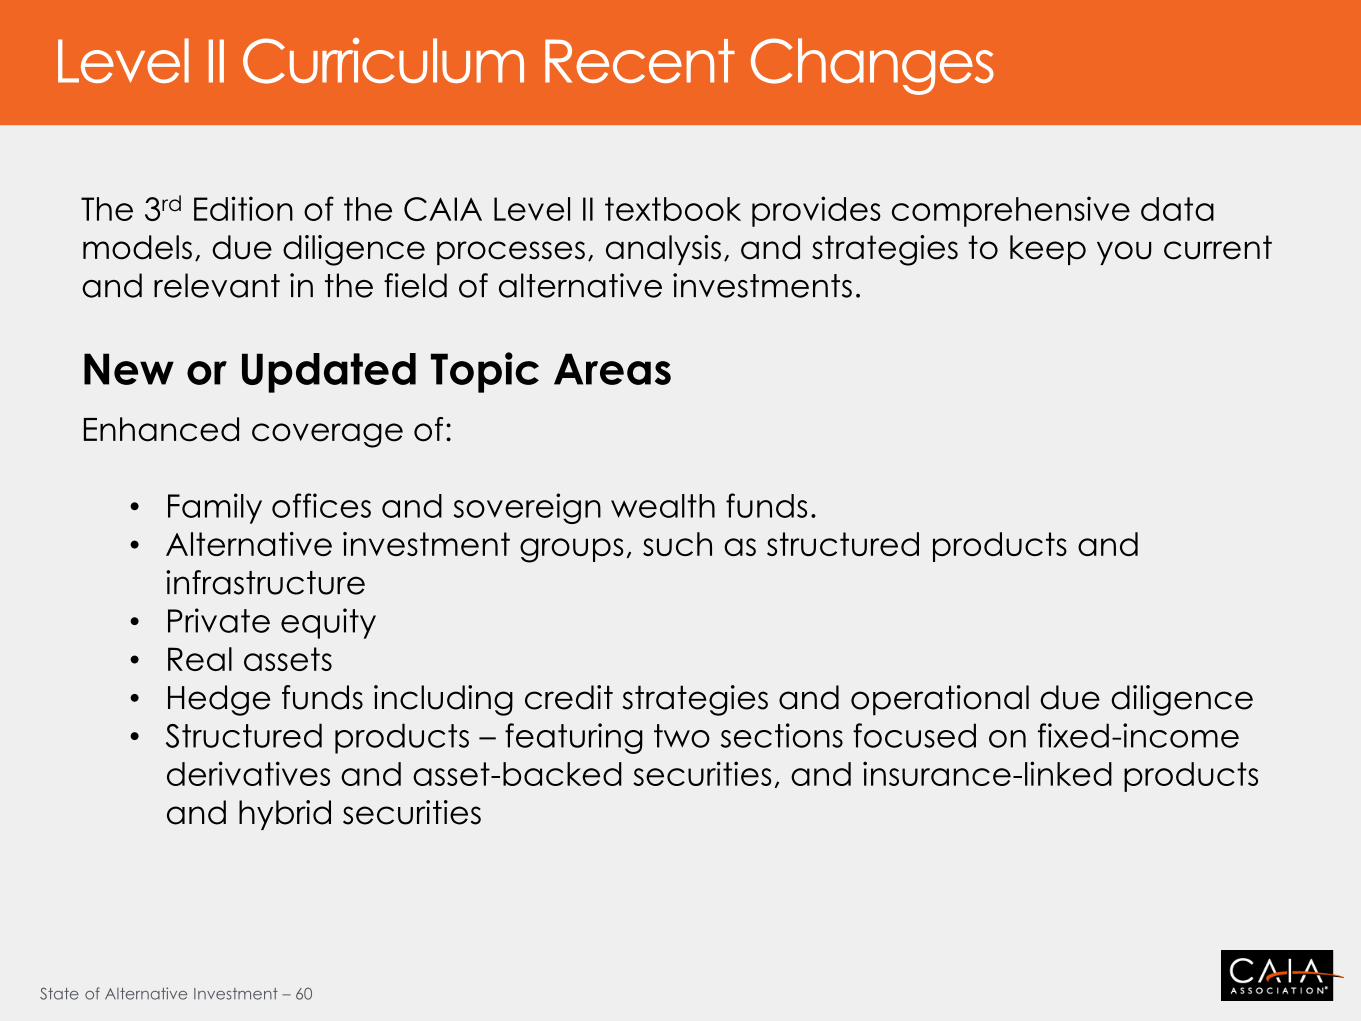
Level II Curriculum Recent Changes
The 3rd Edition of the CAIA Level II textbook provides comprehensive data
models, due diligence processes, analysis, and strategies to keep you current
and relevant in the field of alternative investments.
New or Updated Topic Areas
Enhanced coverage of:
• Family offices and sovereign wealth funds.
• Alternative investment groups, such as structured products and
infrastructure
• Private equity
• Real assets
• Hedge funds including credit strategies and operational due diligence
• Structured products – featuring two sections focused on fixed-income
derivatives and asset-backed securities, and insurance-linked products
and hybrid securities
State of Alternative Investment – 61
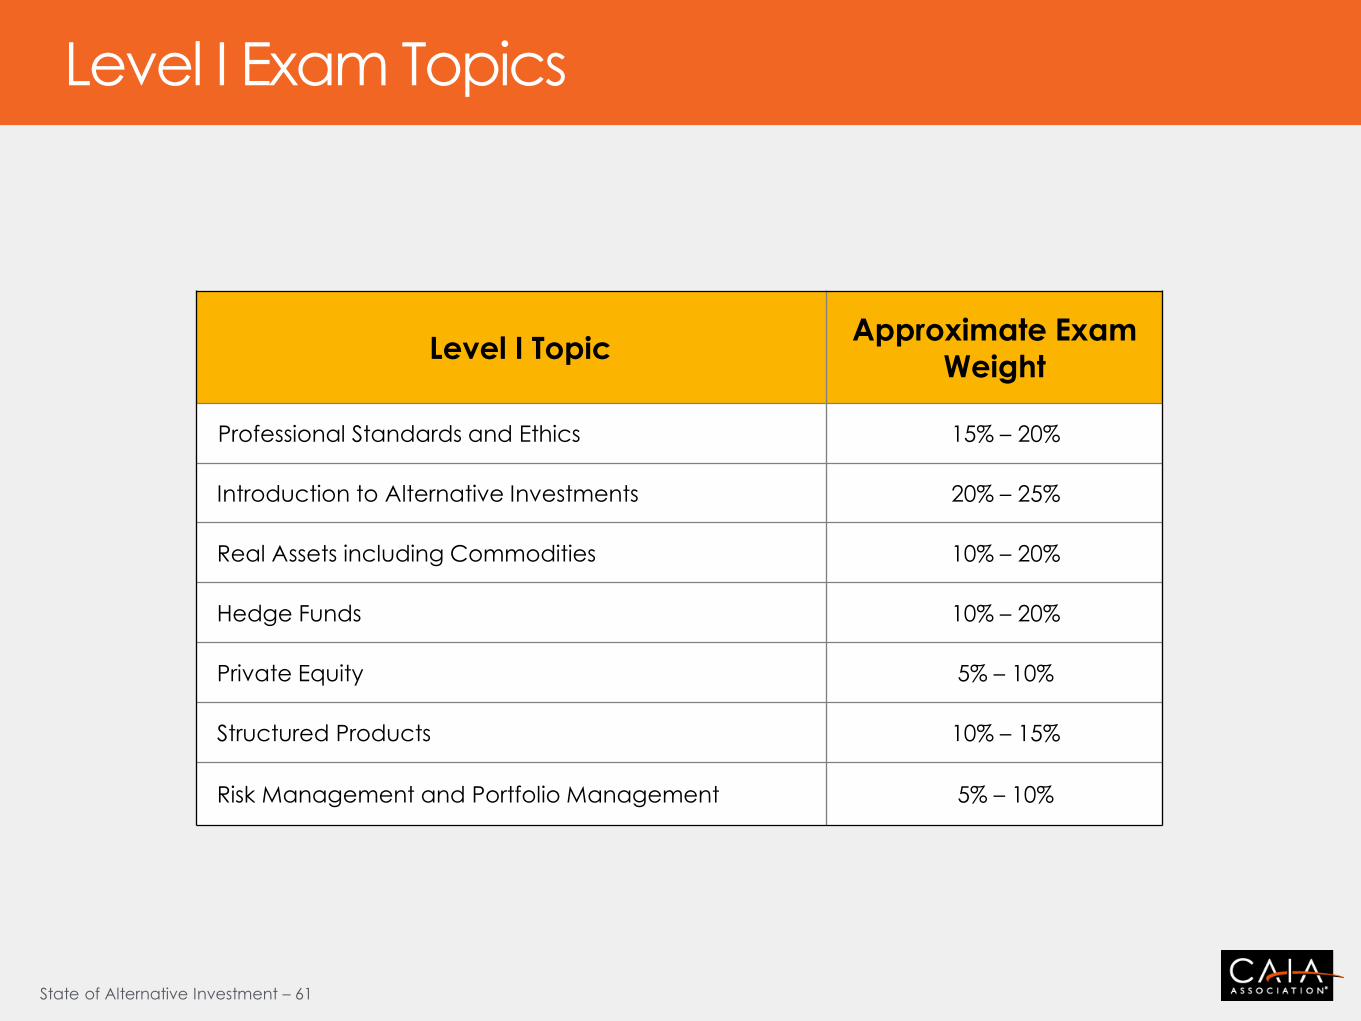
Level I Topic Approximate Exam
Weight
Professional Standards and Ethics 15% – 20%
Introduction to Alternative Investments 20% – 25%
Real Assets including Commodities 10% – 20%
Hedge Funds 10% – 20%
Private Equity 5% – 10%
Structured Products 10% – 15%
Risk Management and Portfolio Management 5% – 10%
Level I Exam Topics
State of Alternative Investment – 62
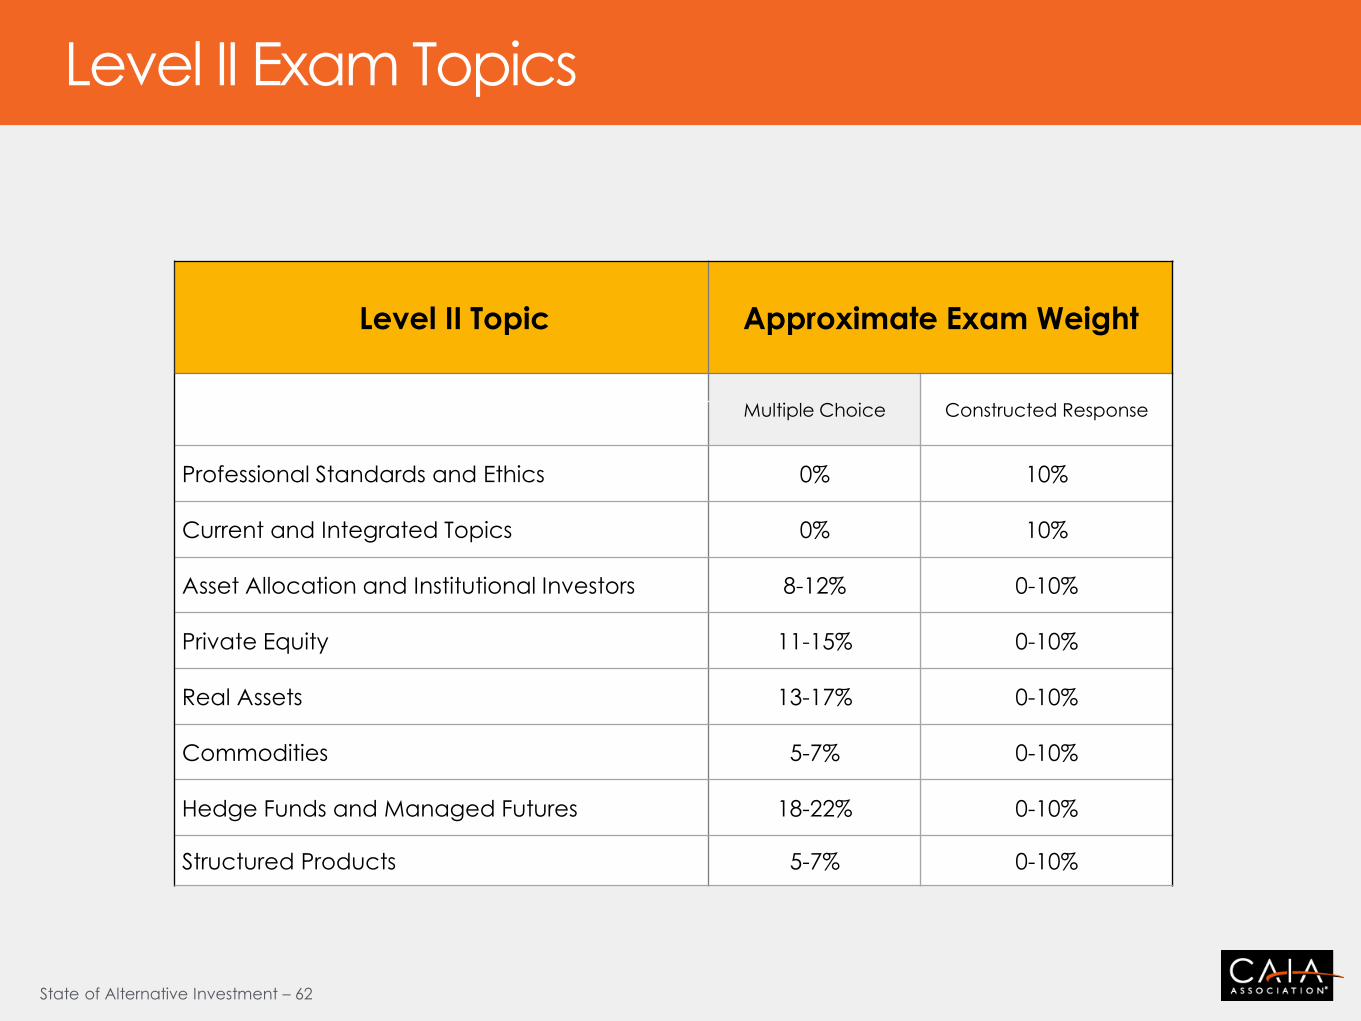
Level II Topic Approximate Exam Weight
Multiple Choice Constructed Response
Professional Standards and Ethics 0% 10%
Current and Integrated Topics 0% 10%
Asset Allocation and Institutional Investors 8-12% 0-10%
Private Equity 11-15% 0-10%
Real Assets 13-17% 0-10%
Commodities 5-7% 0-10%
Hedge Funds and Managed Futures 18-22% 0-10%
Structured Products 5-7% 0-10%
Level II Exam Topics
State of Alternative Investment – 63
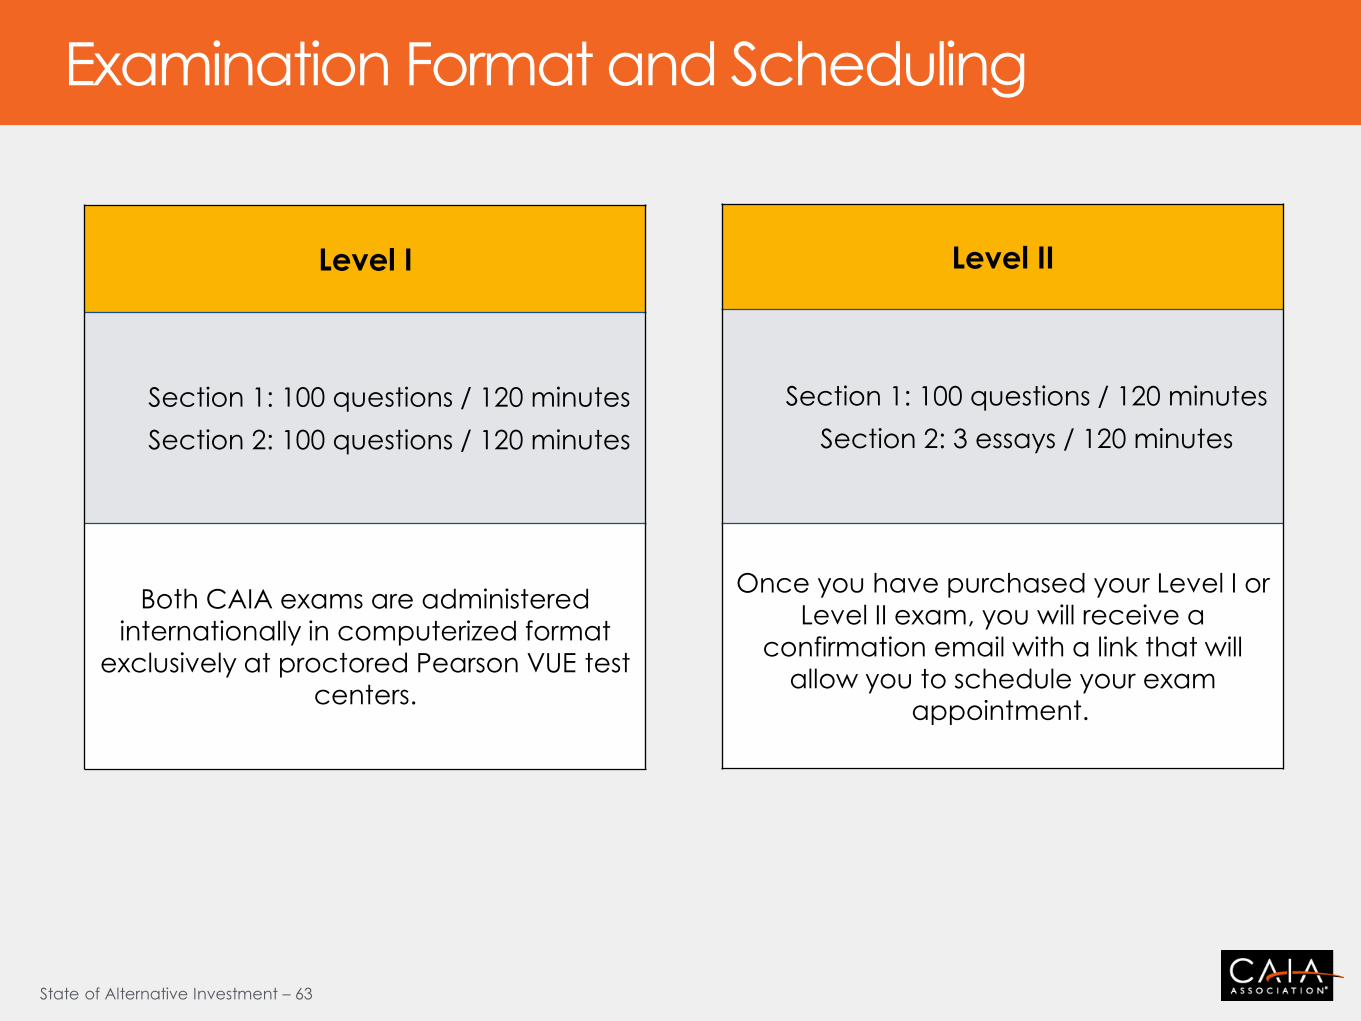
Examination Format and Scheduling
Level I
Section 1: 100 questions / 120 minutes
Section 2: 100 questions / 120 minutes
Both CAIA exams are administered
internationally in computerized format
exclusively at proctored Pearson VUE test centers.
Level II
Section 1: 100 questions / 120 minutes
Section 2: 3 essays / 120 minutes
Once you have purchased your Level I or
Level II exam, you will receive a
confirmation email with a link that will
allow you to schedule your exam appointment.

State of Alternative Investment – 64
Study guides outlining keywords and learning objectives
Workbooks with sample exercises
Candidate orientation sessions
Study calculator to plan your course of study
Third-party preparatory course and programs
Level I & Level II sample exams
Candidate Support/Tools
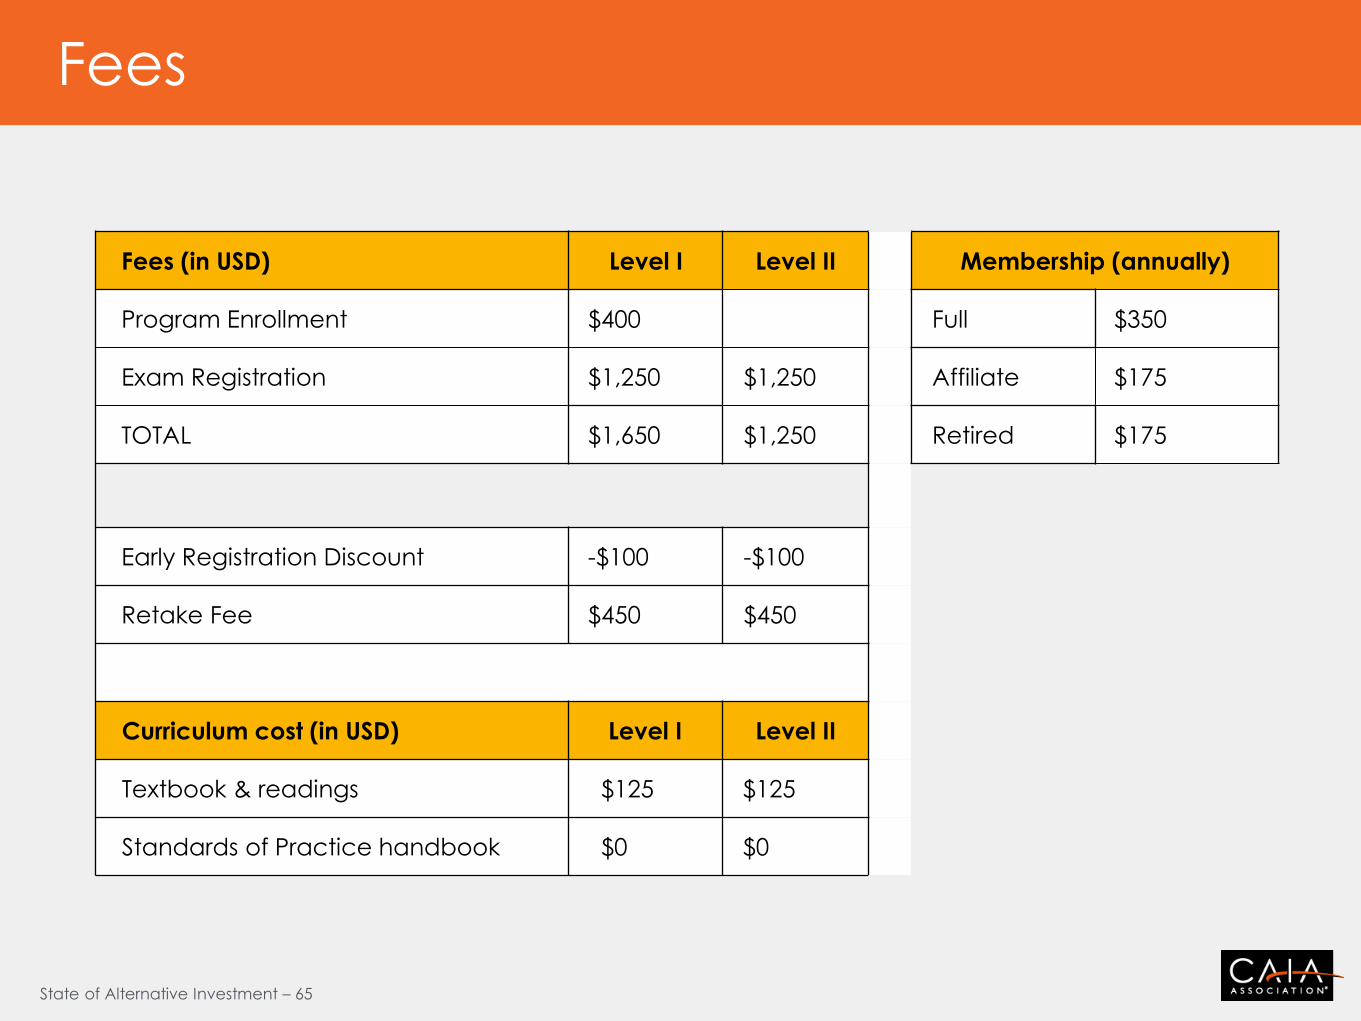
State of Alternative Investment – 65
Fees (in USD) Level I Level II Membership (annually)
Program Enrollment $400 Full $350
Exam Registration $1,250 $1,250 Affiliate $175
TOTAL $1,650 $1,250 Retired $175
Early Registration Discount -$100 -$100
Retake Fee $450 $450
Curriculum cost (in USD) Level I Level II
Textbook & readings $125 $125
Standards of Practice handbook $0 $0
Fees
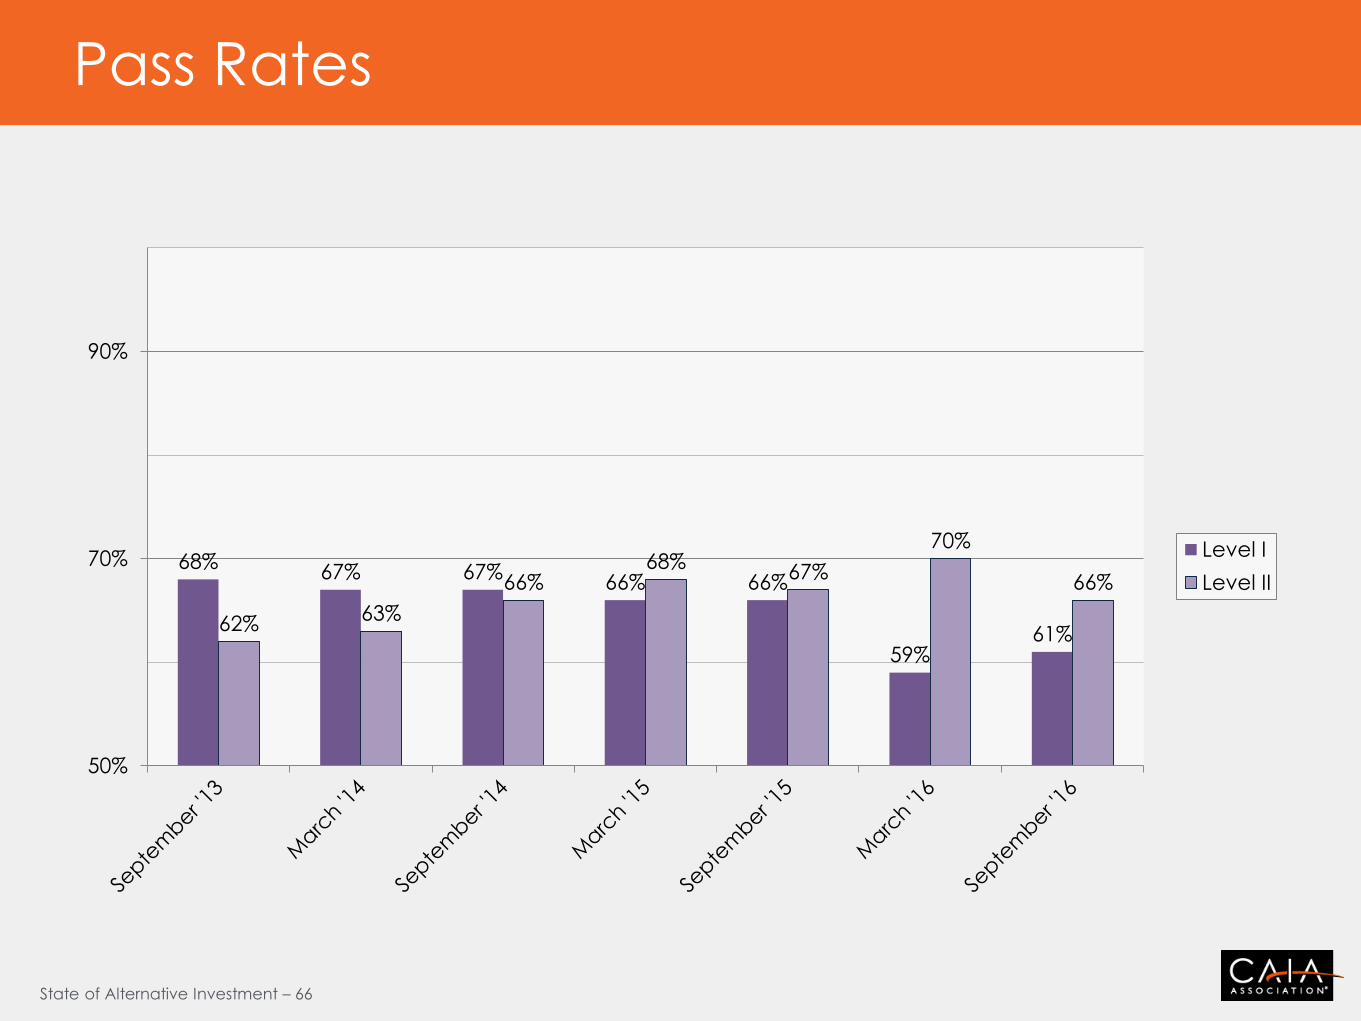
State of Alternative Investment – 66
68% 67% 67%
66% 66%
59% 61%
62% 63%
66% 68%
67%
70%
66%
50%
70%
90%
Level I
Level II
Pass Rates
State of Alternative Investment – 67
CAIA Charter
State of Alternative Investment – 68
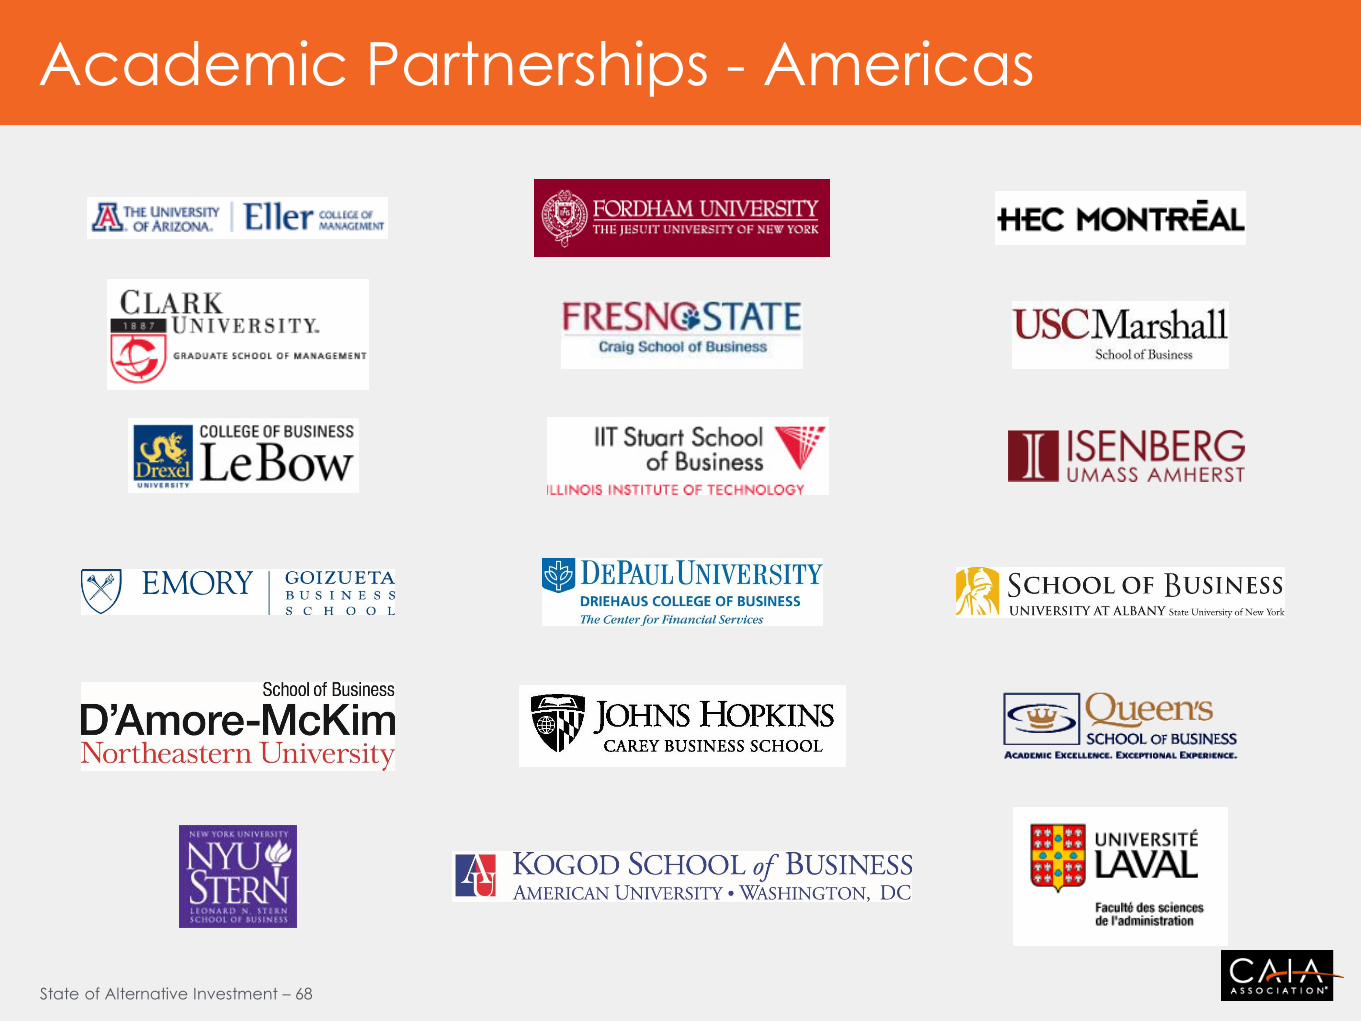
Academic Partnerships - Americas
State of Alternative Investment – 69
A complete list of CAIA’s academic
partners globally can be found at caia.org.
Academic Partnerships - EMEA
State of Alternative Investment – 70
Academic Partnerships - APAC
A complete list of CAIA’s academic partners globally can be found at caia.org.
State of Alternative Investment – 71
Association Partnerships
State of Alternative Investment – 72
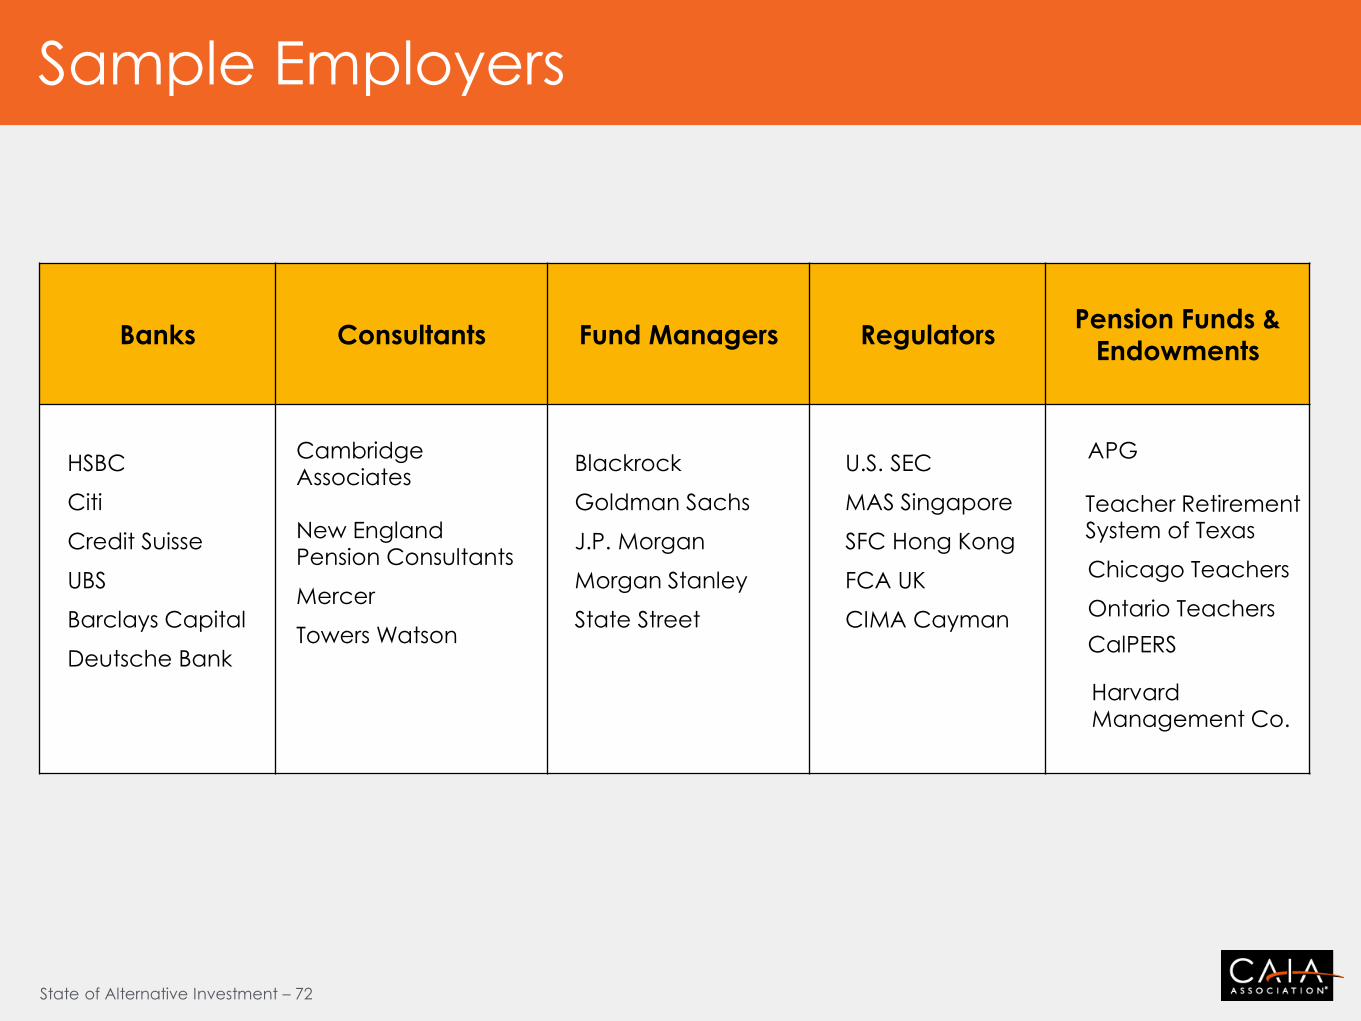
Banks Consultants Fund Managers Regulators Pension Funds &
Endowments
HSBC
Citi
Credit Suisse
UBS
Barclays Capital
Deutsche Bank
Cambridge Associates New England Pension Consultants
Mercer
Towers Watson
Blackrock
Goldman Sachs
J.P. Morgan
Morgan Stanley
State Street
U.S. SEC
MAS Singapore
SFC Hong Kong
FCA UK
CIMA Cayman
APG
Teacher Retirement System of Texas
Chicago Teachers
Ontario Teachers
CalPERS Harvard Management Co.
Sample Employers
State of Alternative Investment – 73
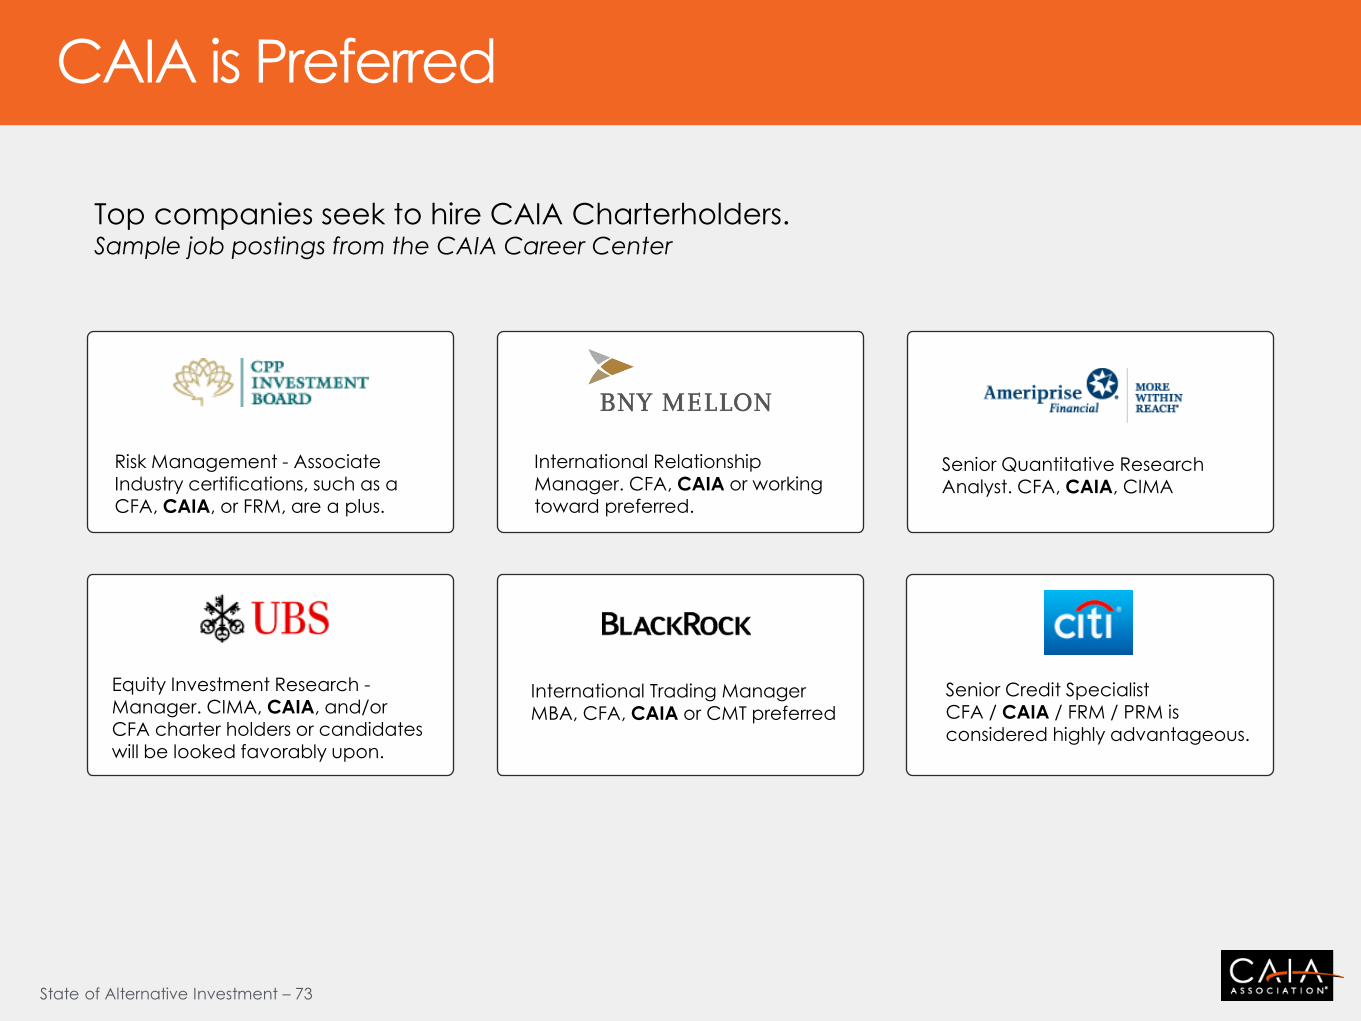
Top companies seek to hire CAIA Charterholders. Sample job postings from the CAIA Career Center
International Relationship Manager. CFA, CAIA or working toward preferred.
Equity Investment Research -
Manager. CIMA, CAIA, and/or CFA charter holders or candidates will be looked favorably upon.
International Trading Manager MBA, CFA, CAIA or CMT preferred
CAIA is Preferred
Senior Quantitative Research Analyst. CFA, CAIA, CIMA
Senior Credit Specialist CFA / CAIA / FRM / PRM is considered highly advantageous.
Risk Management - Associate Industry certifications, such as a CFA, CAIA, or FRM, are a plus.
State of Alternative Investment – 74
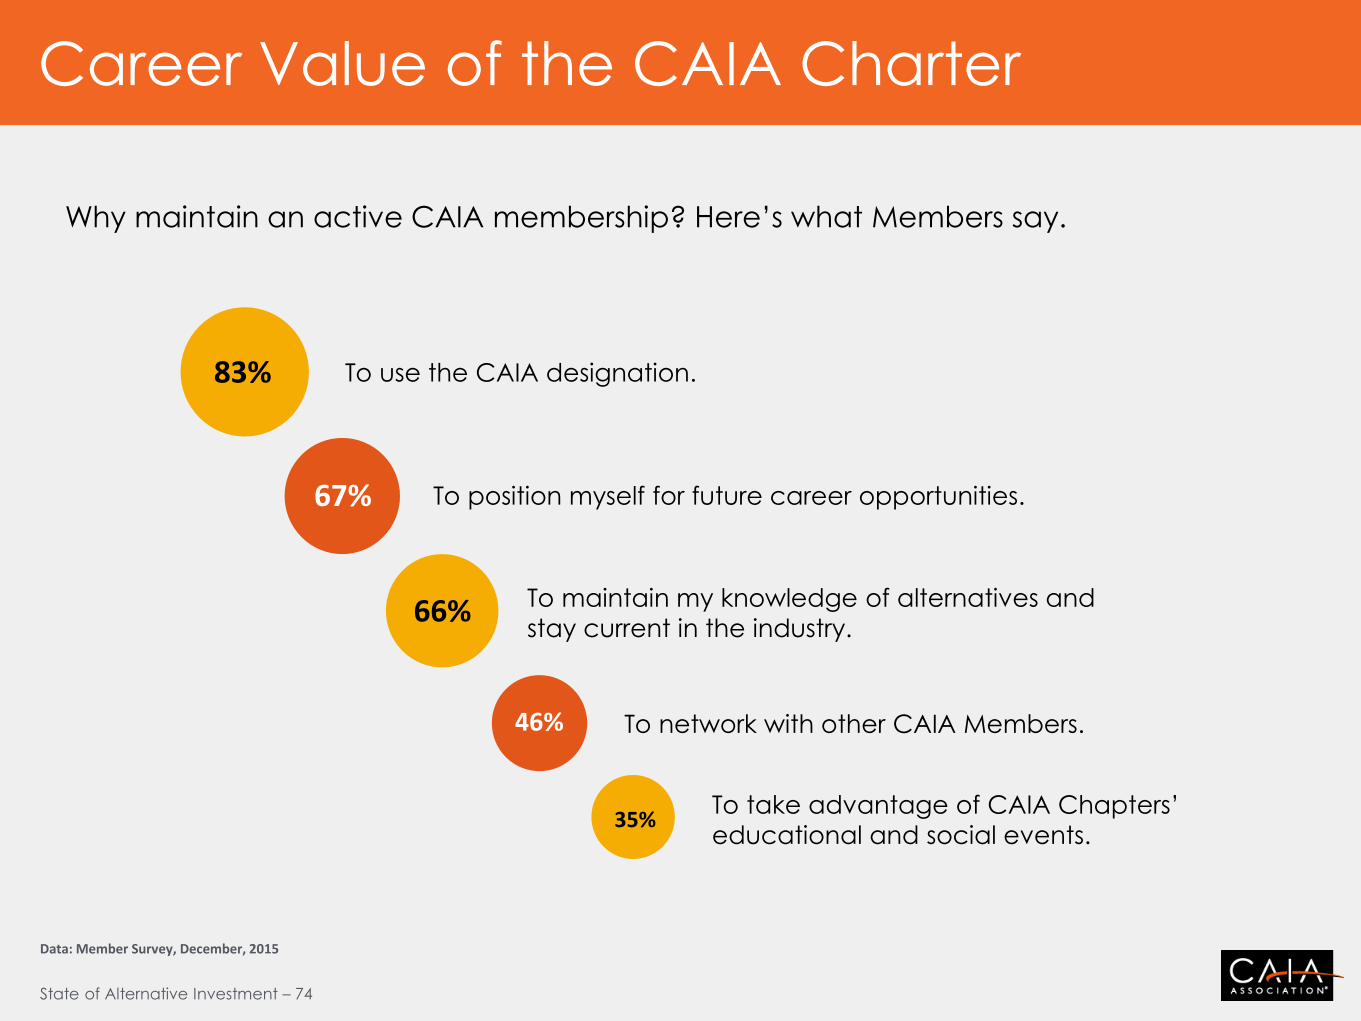
Why maintain an active CAIA membership? Here’s what Members say.
67%
83%
66%
46%
35%
Data: Member Survey, December, 2015
To use the CAIA designation.
To position myself for future career opportunities.
To maintain my knowledge of alternatives and
stay current in the industry.
To network with other CAIA Members.
To take advantage of CAIA Chapters’
educational and social events.
Career Value of the CAIA Charter

State of Alternative Investment – 75
Use of CAIA marks in professional documents
Chapter educational and networking events
Global network of more than 8,700 Members
Globally-recognized designation
Education and Research at CAIA.org
Self-evaluation Tool
Ongoing education
CAIA Career Center
Member Benefits
State of Alternative Investment – 76
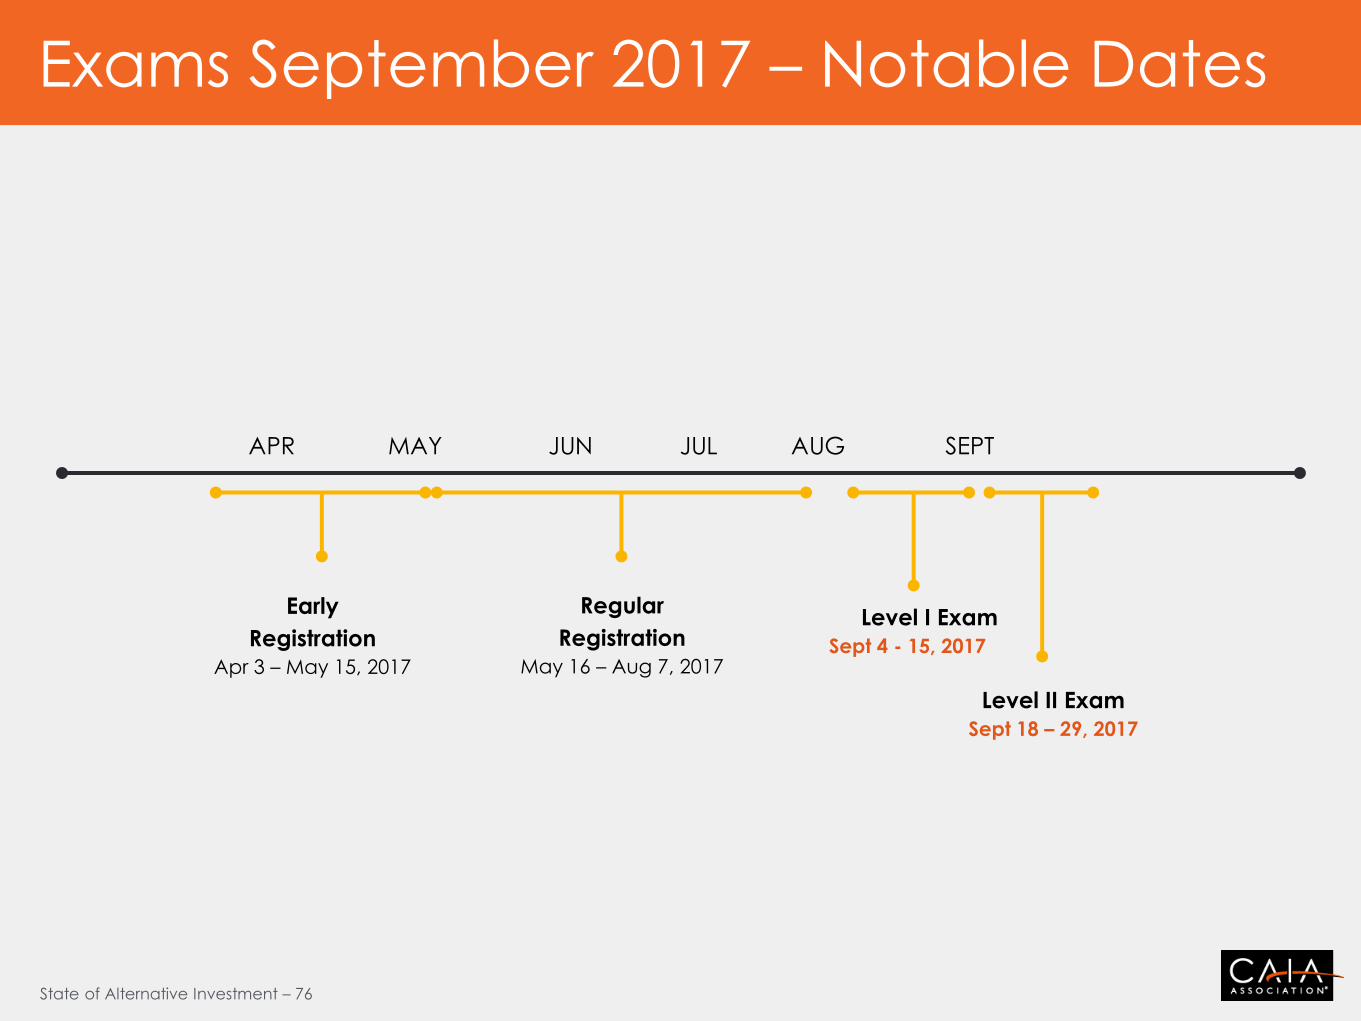
Early
Registration
Apr 3 – May 15, 2017
Regular
Registration
May 16 – Aug 7, 2017
Level I Exam
Sept 4 - 15, 2017
Level II Exam
Sept 18 – 29, 2017
APR MAY JUN JUL AUG SEPT
Exams September 2017 – Notable Dates
State of Alternative Investment – 77
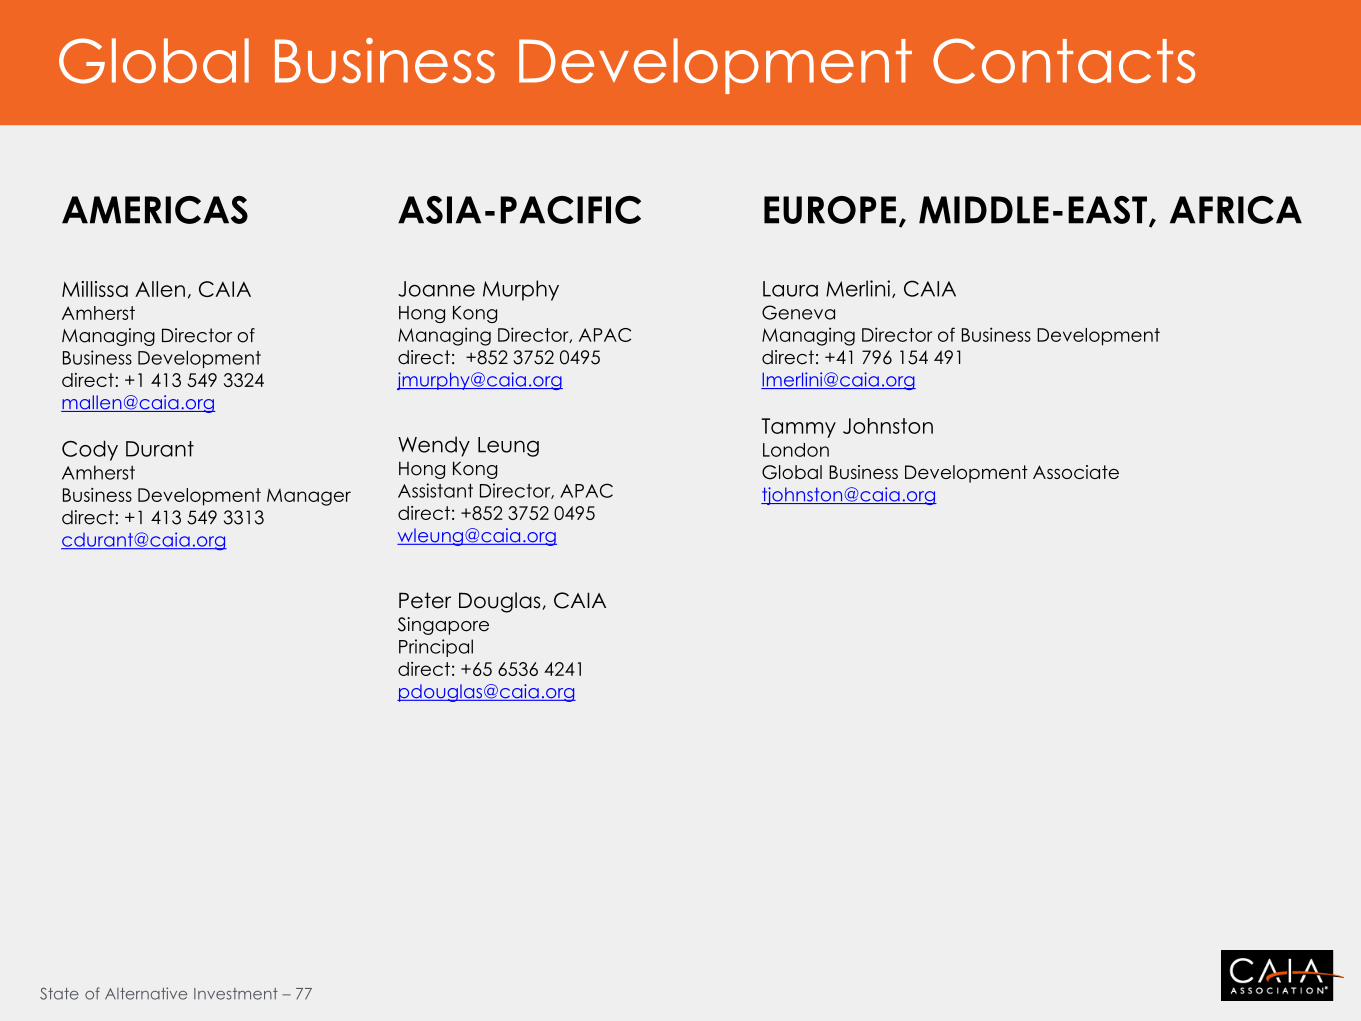
AMERICAS
Millissa Allen, CAIA Amherst Managing Director of Business Development direct: +1 413 549 3324 [email protected]
Cody Durant Amherst Business Development Manager direct: +1 413 549 3313 [email protected]
EUROPE, MIDDLE-EAST, AFRICA
Laura Merlini, CAIA Geneva Managing Director of Business Development direct: +41 796 154 491 [email protected]
Tammy Johnston London Global Business Development Associate [email protected]
ASIA-PACIFIC
Joanne Murphy Hong Kong Managing Director, APAC direct: +852 3752 0495 [email protected]
Wendy Leung Hong Kong Assistant Director, APAC direct: +852 3752 0495 [email protected]
Peter Douglas, CAIA Singapore
Principal direct: +65 6536 4241 [email protected]
Global Business Development Contacts
www.caia.org
The Global Benchmark In Alternative
Investment Education
The CAIA Charter