the startup europe ecosystempublications.jrc.ec.europa.eu/repository/bitstream/jrc...successful...
TRANSCRIPT

The Startup Europe Ecosystem
Analysis of the Startup
Europe projects and of
their beneficiaries
Fiammetta Rossetti, Daniel Nepelski
and Melisande Cardona
2018
EUR 29134 EN

This publication is a Technical report by the Joint Research Centre (JRC), the European Commission’s science
and knowledge service. It aims to provide evidence-based scientific support to the European policymaking
process. The scientific output expressed does not imply a policy position of the European Commission. Neither
the European Commission nor any person acting on behalf of the Commission is responsible for the use that
might be made of this publication.
JRC Science Hub
https://ec.europa.eu/jrc
JRC110945
EUR 29134 EN
PDF ISBN 978-92-79-80358-1 ISSN 1831-9424 doi:10.2760/78946
Luxembourg: Publications Office of the European Union, 2018
© European Union, 2018
Reuse is authorised provided the source is acknowledged. The reuse policy of European Commission documents is regulated by Decision 2011/833/EU (OJ L 330, 14.12.2011, p. 39).
For any use or reproduction of photos or other material that is not under the EU copyright, permission must be
sought directly from the copyright holders.
How to cite this report:
Rossetti, F., Nepelski, D. and Cardona, M, The Startup Europe Ecosystem. Analysis of the Startup
Europe projects and of their beneficiaries, EUR 29134 EN, Publications Office of the European Union,
Luxembourg, 2018, ISBN 978-92-79-80358-1, doi:10.2760/78946, JRC110945.
All images © European Union 2018
Title:
The Startup Europe Ecosystem. Analysis of the Startup Europe projects and of their beneficiaries
Abstract:
In 2015 the European Commission (EC) DG CNECT launched the 2nd edition of the Startup Europe (SE) initiative
under the Horizon 2020 EU Research and Innovation programme. This initiative coordinated the efforts of six
distinct projects (Digistart, Welcome, ePlus, Startup Scaleup, Twist and Startup Europe Partnership) that
connected just as many European entrepreneurial ecosystems. This report provides the theoretical framework
to analyse the policy support to entrepreneurship and evidence on the nearly 700 startups participating in the
SE projects. This exercise also helps to collect relevant insights about the effectiveness of the matching
between the SE offerings and the needs of startups.
i
Contents
Foreword .............................................................................................................. 2
Executive summary ............................................................................................... 3
1 Introduction ...................................................................................................... 7
2 3B framework of policy support to startups ........................................................... 8
3 The design of Startup Europe ............................................................................ 10
3.1 Startup Europe in the 3B framework of policy support to startups .................... 10
3.2 Framework conditions for firms' growth in the SE ecosystems ......................... 15
4 The reach of Startup Europe ............................................................................. 18
5 Traits of the Startup Europe beneficiaries ........................................................... 20
5.1 Sector of activity ....................................................................................... 20
5.2 Age .......................................................................................................... 21
5.3 Size ......................................................................................................... 23
5.4 Financial performance ................................................................................ 25
5.5 Track of Venture Capital funding .................................................................. 27
5.6 Internationalisation of the websites and internet traffic................................... 30
5.7 Gender of SE startups' funders .................................................................... 32
6 Two cases of Startup Europe beneficiaries .......................................................... 34
7 A synthesis of the SE ecosystems ...................................................................... 36
8 Conclusions and recommendations .................................................................... 38
List of figures ...................................................................................................... 40
List of tables ....................................................................................................... 41
References ......................................................................................................... 42

2
Foreword
This report is prepared in the context of the three-year research project on Research on
Innovation, Start-up Europe and Standardisation (RISES), jointly launched in 2017 by
JRC and DG CONNECT of the European Commission. The JRC provides evidence-based
support to policies in the domain of digital innovation and start-ups. In particular:
Innovation with the focus on maximising the innovation output of EC funded
research projects, notably building on the Innovation Radar;
Start-ups and scale-ups – providing support to Start-up Europe; and
Standardisation and IPR policy aims under the Digital Single Market priorities.
This research builds on the work and expertise gathered within the EURIPIDIS project. It
is part of the long-standing collaboration between the JRC and DG CONNECT in the
domain of digital innovation and start-ups.
3
Executive summary
Successful startups generate large economic benefits and facilitating their growth is
ascending the policy agenda. Policies that support startups aim to improve both the
framework and the systemic conditions of the entrepreneurial ecosystems. The
framework conditions improve directly with the institutional and infrastructural progress,
while the systemic conditions cannot be so directly governed as they relate to networks,
talent and leadership. A way to influence the latter conditions entails increasing the
density of connections within and between entrepreneurial ecosystems. In light of this, in
2014 under the Horizon 2020 EU Research and Innovation programme the European
Commission (EC) DG CNECT launched the Startup Europe (SE) initiative. The objective of
SE was to exert a coordinated action in connecting the ecosystems of several projects
and to enhance in this way the coherence of the entire European entrepreneurial
ecosystem. This report investigates the approximately 700 startups that enrolled in the
SE projects to benefit from the initiative. The analysis provides evidence about the
effectiveness of the matching between the SE offerings and startups' needs. The study is
carried out by focusing on startups' characteristics in terms of demographics, financial
performance, use of VC funding, founders' gender and the internationalization of their
activity.
The Startup Europe projects
The review of the six SE projects, i.e. Digistart, Welcome, ePlus, Startup Scaleup, Twist
and Startup Europe Partnership, reveals considerable differences as for:
The target groups encompassing academic and research communities, university
students, web entrepreneurs as much as European startup champions,
The geographical reach linking precise European cities in most of the projects
with the exception of Startup Europe Partnership operating at the Pan-European
level,
The value propositions including the promotion of entrepreneurial role models
among university students as much as the provision of training and consulting to
network with investors, mentors, media, corporates and peer entrepreneurs.
According to their objectives, the SE projects feed into the 3B framework of policy
support corresponding to three entrepreneurial phases (see Figure 1):
Buffering, the policy support to early stage entrepreneurial activities,
Bridging, the policy support to link startups with external actors in the
ecosystem,
Boosting, the policy support to accelerate the growth of promising businesses.
Connecting the European entrepreneurial ecosystems
Each project of SE targeted a specific combination –called ecosystem- of European cities
(e.g., the ecosystem of Digistart was Lisbon and Malmö). On the one hand it is
reasonable to assume that these cities reflect their national framework conditions of
entrepreneurship, particularly for scale up ventures. Indeed the SE projects assemble
balanced ecosystems made of cities from both better and poorer national entrepreneurial
conditions (Figure 5, Figure 6). On the other hand, once the information about SE
beneficiaries is added to the adequacy of the national entrepreneurial conditions then
both the similarities and the complementarities within the SE ecosystems become more
apparent (Figure 28). For example, the SE findings about Digistart show that the
companies from Lisbon and Malmö are alike concerning the average turnover, attitude
towards VC funding and internationalisation, even though the national entrepreneurial
context is more favourable in Sweden than in Portugal. On the front of diversities, on
average, the companies from Malmö are older, bigger and with more female
entrepreneurs while those from Lisbon have better profit margins.

4
Figure 1: The SE projects in the 3B framework of policy support to startups
Source: Startup Europe DG Connect; Autio and Ranniko (2016); Amezcua et al. (2013)
Beneficiaries of the Startup Europe projects
The picture of about 700 beneficiaries from the 6 SE projects reveals the following facts:
There was a strong geographical bias related to startups' origin. The majority
(some 40%) of beneficiaries are from the Iberian Peninsula, and startups from
Italy and Germany represent altogether 20% (10% each) of the beneficiaries. At
city level, Berlin, Lisbon, Madrid and Rome provide the majority of startups.
The digital startups made more than 2/3 of the beneficiaries. These firms
develop app-based solutions and online platform business model.
The SE initiative attracted early stage, small ventures. More than 40% of the
firms matched with Orbis were 1 and 2 years old and about 50% of the SE
beneficiaries had 4 employees maximum.
The SE beneficiaries suffer from financial constraints. Half of the firms matched
with Orbis attained a turnover of 90K € and a profit margin of -5.8% at the most.
Startups' financial performance does not improve over time. On the
contrary, older startups have worse profit margins than younger ones.
1 out of 10 startups received Venture Capital (VC) funding.
The early stage VC funding accounts for 85% of the rounds and 50% of the VC-
backed startups received 1M € or less.
The number of VC rounds indicates a low continuity of the VC funding. On
average the startups could access the VC funds only went through 1 round.
At country level, there is a negative relation between the VC funding and the
extent of SE. Whereas Spanish startups accounted for over 25% of the total
beneficiaries only 3% of them received VC funding. The opposite is true about
Northern European and Scandinavian countries.
Many local startups but few international scaleups. Fewer companies
engaged with boosting projects and more than 90% of the startups matched with
data on internet traffic receive at least 75% of their web visits from their home
country. Portuguese, Italian and Spanish startups have the lowest share of
international internet traffic while Swedish, British and Finish startups have the
highest.

5
It's a Man's Man's Man's World1. About the companies matched with available
gender information, nearly 90% of the founders are men and this figure increases
with the age and the development stage of the firms.
The accuracy of the matchmaking
According to the 3B framework of policy support to startups, the buffering projects aim to
safeguard early-stage startups while the bridging and the boosting ones aim to enhance
more advanced participants (see Figure 2). The typical SE beneficiary is an early
stage and financially constrained venture of the digital domain from a country with
limited VC investments. This fact per se highlights that the SE beneficiaries were
particularly seeking for buffering and some bridging. However, the presence of
participants within the projects of advanced bridging and boosting also witnesses the
heterogeneity of the beneficiaries. This altogether suggests that the matchmaking was
efficient vis-à-vis the widespread buffering needs of the beneficiaries, plus more
customised support and fair offer of bridging and boosting was required and offered
depending on startups' characteristics and development stage.
1 "It's a Man's Man's Man's World" (1966) by James Brown and Betty Jean Newsome.
https://en.wikipedia.org/wiki/It%27s_a_Man%27s_Man%27s_Man%27s_World

6
Figure 2: Three facts about the SE beneficiaries and projects in the 3B framework
Note: The graph shows the median values of beneficiaries as for number of employees (Figure 13), turnover (Figure 15) and age (Figure 12) across the SE projects.
Source: Startup Europe DG Connect; Autio and Ranniko (2016); Amezcua et al. (2013)
7
1 Introduction
In contrast to traditional entrepreneurial activities, like opening a restaurant or a grocery
shop, a startup is a newly emerged and fast-growing business seeking to meet the
marketplace by developing a business model around an innovative idea (Blank, 2010).
The projects pursued by startups are very risky, so their survival rates are quite low.
However, the startups that survive and succeed may have large economic impacts
(Guzman & Stern, 2016). Due to this potential, startups are at the centre of policy
interest. The key questions concern how public policy can improve the framework and
systemic conditions of entrepreneurial ecosystems and facilitate startup creation and
growth (Van Roy & Nepelski, 2016, 2017). The framework conditions include, among
others, the institutions and the physical infrastructures, while the systemic conditions
mostly relate to the presence of networks, leadership, finance, talent or new knowledge
(Stam & Spigel, 2016). Thus, the framework conditions can be improved by
straightforward measures like changes to the regulatory environment. Instead, the role
of the public sector is more subtle concerning the improvement of the systemic
conditions (Fuerlinger, Fandl, & Funke, 2015). Ways to improve the systemic conditions
may be, for example, by increasing the density of connections or by facilitating the
network of different actors in the entrepreneurial ecosystem. In light of this, in 2014 the
European Commission DG CNECT launched the Startup Europe (SE) initiative (EC, 2014,
2016) with the objective to have coordinated endeavours to connect the European
entrepreneurial clusters and to make the resulting ecosystem more coherent.
In order to cast some light on the outcomes of SE, this report looks at six projects
launched under the SE initiative: Digistart, Welcome, ePlus, Startup Scaleup, Twist and
Startup Europe Partnership. This document begins with linking the SE projects to
corresponding measures from the 3B (buffering, bridging and boosting) framework of
policy support at different entrepreneurial phases (standup, startup and scaleup). It
continues with a description of the approximately 700 startups enrolled in the activities of
the SE projects. The exploration of startups' demographics, financial performance, use of
VC fuding, funder gender and the internationalization of their activity provides evidence
on the effectiveness of the matching between the SE projects and startups' potential
needs.
The remaining of the document is organised as follows: Section 2 introduces the 3B
framework of policy support to startups. Section 3 places SE projects in the 3B
framework of policy support to startups. Section 4 presents the geographic reach of SE
projects. Section 5 analyses traits and characteristics of SE beneficiaries. Section 6
presents two particular cases among the SE beneficiaries. Section 7 elaborates on the
main findings and section 7 draws the main conclusions.

8
2 3B framework of policy support to startups
Entrepreneurial activities are extensively affected by the context in which they take
place. Hence, understanding the institutional, informational and socioeconomic factors –
commonly denoted as framework conditions – is essential to collect relevant insights
about the entrepreneurial processes of creation, survival and growth. The evolution and
life of startups are marked by a series of outcomes and milestones. Each milestone
requires different resources and capabilities, framework conditions are heterogeneously
affecting the entrepreneurial milestones. Policy actions designed to improve the
outcomes of the entrepreneurial process should be tailored to the distinct needs of
entrepreneurs along the different milestones (Autio & Rannikko, 2016; Stam et al.,
2012).
Figure 3 introduces the 3B (buffering, bridging and boosting) framework of policy support
to startups along their development phases (stand-up, start-up and scale-up). The
underlying assumption behind the 3B framework of policy support to startups is that
every entrepreneurial journey originates from opportunity recognition. To pursue this
opportunity, prospective entrepreneurs must take action to actually become
entrepreneurs. Hence the first milestone is the creation of the start-up. At this stage,
public support should aim to buffering startups from adverse external conditions. The
rationale behind buffering lies in a resource-based perspective in which firms are
resource-constrained entities. Buffering policies aim to create adequate conditions for the
provision of vital resources in order to lower the firm dependency on external providers.
The resource endowment is particularly salient at the creation of startups to ensure that
they "do not run out fuel". Public support through buffering can include seed-stage
access to financial capital, low-cost office space, tax deductions, and initiatives to lower
the regulatory burden of establishing new firms, among others.
The second milestone that entrepreneurs need to achieve during their journey is the
retention of the business venture leading to survival. Once achieved the retention
milestone, buffering and sheltering barriers against the hostile external environment are
no longer appropriate. At this stage, the bridging public support comes into play. In
sharp contrast with buffering activities, these policy instruments promote and facilitate
networking relationships with external partners. Bridging activities relate to the
facilitation of inter-organizational networks, collaborations and the flow of knowledge and
resources across organisations.
The third milestone is the growth. At this stage, the policy support relates to the
boosting of firms' organizational capacities to scale-up the business. It could take the
form of public support emphasizing growth motivation and encouraging firms to achieve
milestones towards growth. The public support of this kind fits particularly the growth
process of scale-up firms since it boosts them in the pursuit of both market expansion
and economic growth.
This report employs the aforementioned 3B framework to analyse both the Startup
Europe projects and the companies that joined these projects. This conceptual framework
should enable to detect how well the projects were designed in order to effectively match
the right target group of startups.

9
Figure 3: The 3B framework of policy support to startups
Source: Van Roy and Nepelski (2016) based on Autio and Ranniko (2016) and Amezcua et al.
(2013)

10
3 The design of Startup Europe
3.1 Startup Europe in the 3B framework of policy support to
startups
In 2014, under the Horizon 2020, the European Commission DG CNECT launched the
Startup Europe initiative (EC, 2014, 2016). The objective of Startup Europe was to
coordinate the EU work to connect clusters and ecosystems across Europe and to bring a
higher coherence among the different EU initiatives. Until now, 14 projects were funded
to build bridges between the startup players within European ecosystems. These projects
worked directly with more than 700 startups, bringing them together with investors,
accelerators, entrepreneurs, corporate networks, universities and the media. The current
analysis looks six projects launched between 2015 and 2016: Digistart, Welcome, ePlus,
Startup Scaleup, Twist and Startup Europe Partnership.
Table 1 presents an overview of the projects, their target groups, ecosystems in which
they operated, and the activities they offered. One can observe a large variation along all
these dimensions. With respect to the target group, while, for example, Digistart
targeted academic and research community and university students, the focus of Startup
Europe Partnership was on European startup champions. Also the geographical coverage
is unique for each project. In general, they targeted at least two different local European
ecosystems. For example, Digistart connected Lisbon and Malmö. Similar observation can
be made with respect to the value propositions of the projects. They offered connecting
startups with corporates for business advice or investments. In this way, startups could
network with potential clients and successful entrepreneurs and establish mentorships
and seminars and trainings. The projects did not provide any direct financial support to
startups. Their main objective was to improve their knowledge and increase their
connectivity in the European entrepreneurship ecosystem. Potential startups just signed
up to the projects and were selected to participate.

11
Table 1: Overview of Startup Europe Projects
Project Target Group Ecosystem Value proposition
Academic and
research
community
University students
Web entrepreneurs
Lisbon (PT)
Malmö (SE)
Imbibe business skills
to university students
Optimize the
business models and
pricing decisions of
digital startups
Tech startups
Berlin (DE)
Dublin (IE)
Milan (IT)
Madrid (ES)
Salamanca (ES)
Team up with local
partners
Engage with tech
investors, mentors,
media, corporates,
entrepreneurs, etc.
Link tech startups with
policy makers
Web entrepreneurs
(both European
businesses and
potential
entrepreneurs)
Lisbon (PT)
Nice/Côte D’Azur
(FR)
Baden-
Württemberg
(DE)
Liaise entrepreneurs
with European leading
early stage venture
and crowdfunding
networks
Link firms with active
mentors in
national/regional
programmes
Match companies with
European science and
technology experts
Ambitious
companies aiming
to grow in the
internet of things
and services (IoTS)
Cartagena (ES)
Zoetermeer (NL)
Vilnius (LT)
Dublin (IE)
Tailored services for
IoTSs
Supporting the
marketplace of
investors to encourage
investment for growth
Innovative medium
and large
companies
Web entrepreneurs
Rome (IT)
Lille (FR)
Warsaw (PL)
Stockholm (SE)
Connect with right
type of finance
Valorise the network to
access new markets
European startup
champions
Elite club of
scaleups
Pan-European
Access to top notch
investors and
accelerators from all
over Europe
Provide internal
conversation with the
European Investment
Fund and the European
Commission
Source: Startup Europe DG Connect
12
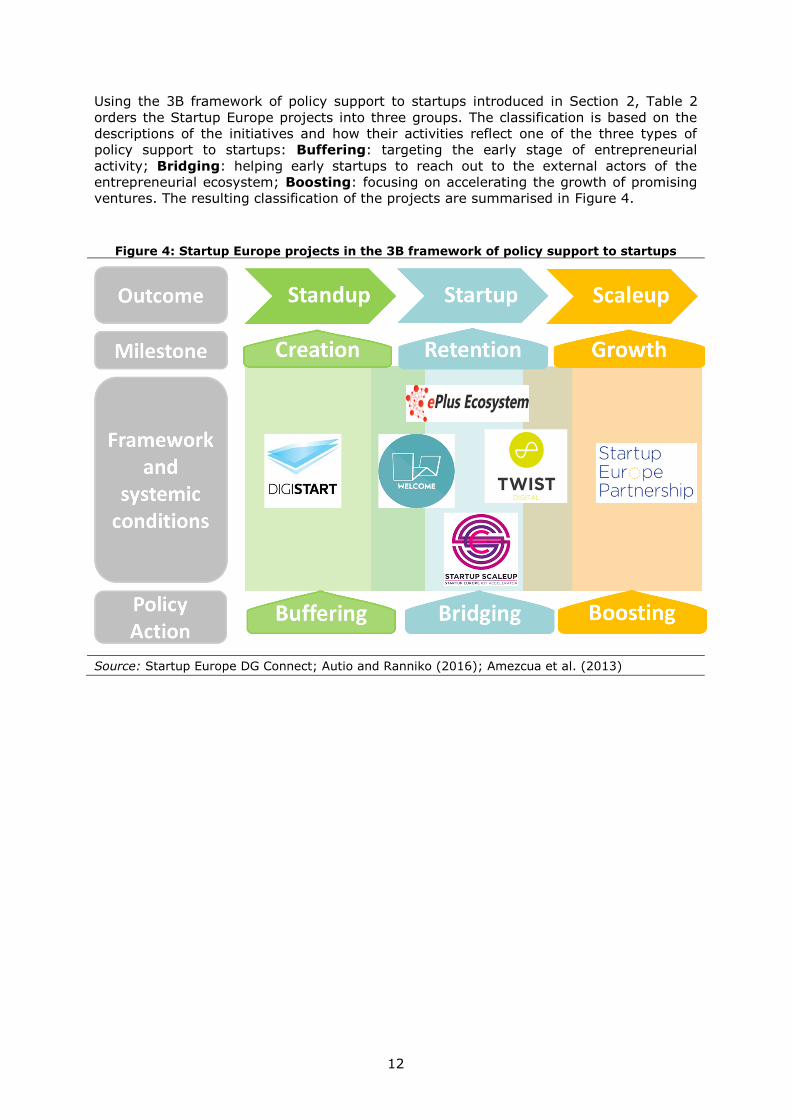
Using the 3B framework of policy support to startups introduced in Section 2, Table 2
orders the Startup Europe projects into three groups. The classification is based on the
descriptions of the initiatives and how their activities reflect one of the three types of
policy support to startups: Buffering: targeting the early stage of entrepreneurial
activity; Bridging: helping early startups to reach out to the external actors of the
entrepreneurial ecosystem; Boosting: focusing on accelerating the growth of promising
ventures. The resulting classification of the projects are summarised in Figure 4.
Figure 4: Startup Europe projects in the 3B framework of policy support to startups
Source: Startup Europe DG Connect; Autio and Ranniko (2016); Amezcua et al. (2013)
13
Table 2 classifies the SE projects according to the widespread conceptualisations of the
possible policy actions (Autio and Ranniko, 2016) to support different entrepreneurial
stages (Autio et al., 2017).
At the base of the classification there is the policy endeavours to stimulate the
entrepreneurial potential to stand up and become manifest. At this stage, governments
can provide resources aimed to buffer and protect new firms from the scarcity of internal
resources and the dependency from external resources. At this entrepreneurial phase,
the suitable support comes via training and consulting services, to stimulate the
knowledge building of standing up companies, with infrastructural support related to low-
cost office space, and with more financial help in the form of tax breaks and subsidies.
According to the value proposition, Digistart is definitely the project mostly active in
training budding champions.
The middle layer of Table 2 presents the intermediate policy support which addresses
companies already survived, therefore retained, from the first round of natural selection.
The policy support at this phase aims to create connections by bridging both among
startups and between startups and relevant stakeholders. Key support at this stage
relate first to the branding, which is about framing the business promise to the potential
customers, as the brand is tightly connected with what companies are and how they are
perceived by the market. Secondly, referral is about helping companies to increase their
sales with a market strategy driving to positive experiences of customers and the
consequent good reputation. Third, networking services aims to provide companies with
events and ties to exchange ideas and team up together. Field building closely address
connecting fragmented players within a given field of work to have a resulting industry
which is better organised to deal effectively and efficiently with common issues and
challenges. Finally, facilitating ties with business angels and venture capitalists helps
companies towards concrete possibilities to expand their business and jump to the
following entrepreneurial phase. According to their value propositions Welcome, Eplus,
Startup Scaleup, and Twist provide a policy support that – in different ways – classifies
as bridging.
The top entrepreneurial achievement is scaling up and it couples with a policy support
that boosts firms' organisational capacities to help their growth. At this stage there is a
strong and clear focus on checking that companies attain selective milestones
consistently with a strong motivation to grow.

14
Table 2: The Startup Europe projects and their support to different entrepreneurial phases
Startup Europe project
Start-up
development
phase
Type of
policy
support
Theoretical policy support
Dig
ista
rt
Welc
om
e
Ep
lus
Sta
rtu
p S
cale
up
Tw
ist
Sta
rtu
p E
uro
pe
Partn
ersh
ip
Scale-up Boosting
Highly selective initiatives based on strong growth motivation
√
Progressive control on milestone achievement
Hands-on support on achieving milestones
Encouraging equity funding
√
Promote the exchange of experiential insights for rapid growth
√
Start-up Bridging
Branding
Referral
√
√ √
Networking services
√ √
√ √
Field building
√ √ √ √
Tie facilitation with business angels and venture capitalists
√ √
√ √
Stand-up Buffering
Training √
Consulting services √
Low-cost office space
Tax breaks
Financial subsidies
Source: Startup Europe DG Connect; Autio and Ranniko (2016); Amezcua et al. (2013)

15
3.2 Framework conditions for firms' growth in the SE ecosystems
Figure 5 displays the quality of the contextual framework conditions for scaleups that the
SE cities enjoy in their respective countries. This information is from the "Assessment of
Framework Conditions for the Creation and Growth of Firms in Europe" (2016) and it
groups together countries with excellent, very good, good or fair conditions. By each SE
project the figure plots the cities identified as the relevant ecosystem of the project. It is
interesting to note that cities with worst and best framework conditions for scaleups are
in contact via the SE projects. Finally each SE ecosystem results in an overall balanced
match with both weaker and stronger spots bridged together. Scandinavian and Dutch
national contexts offer to companies the top framework conditions to scale up and are
joined with European countries (and cities) with more difficulties. This is the case of
Digistart, Startup Scaleup and Twist. The very good conditions of Ireland, France and
Germany are brought about instead by Welcome, Eplus, and Startup Scaleup.
Figure 5: National framework conditions for scaleups in the SE ecosystems
Note: The graph shows the national overall framework conditions for scaleups concerning the European cities of the SE projects' ecosystems.
Source: Startup Europe DG Connect; Van Roy and Daniel Nepelski (2016)
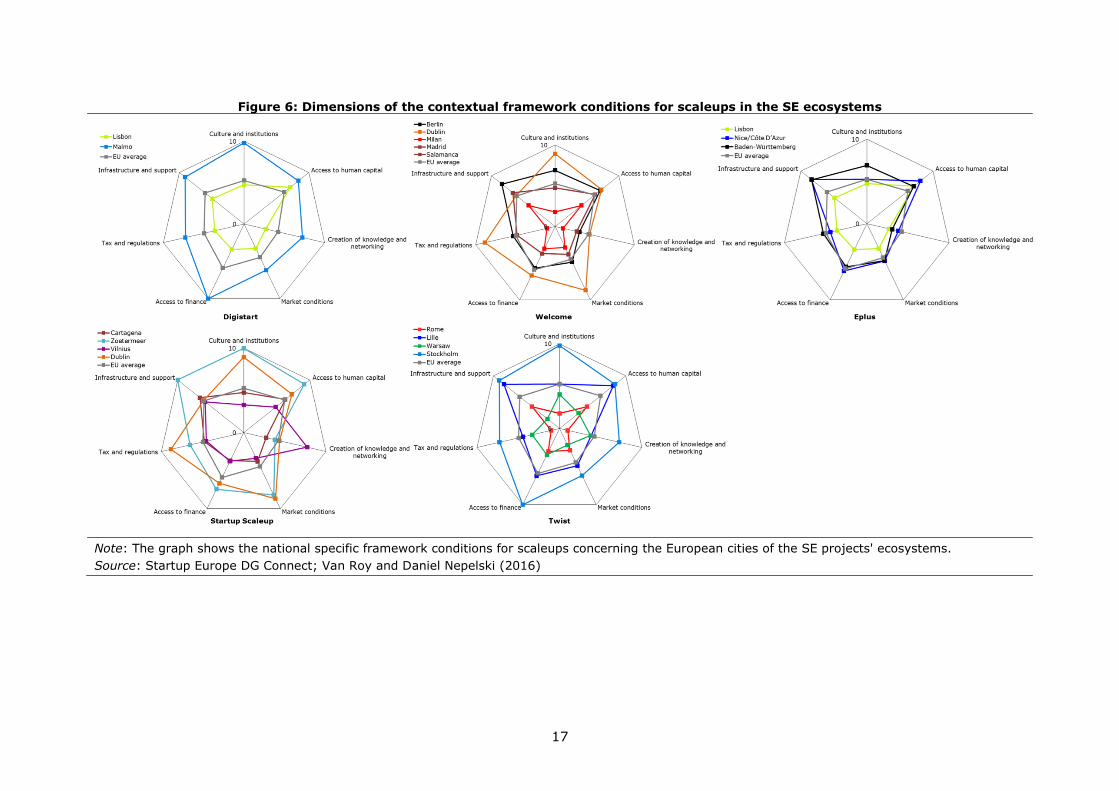
Figure 6 shows how the national contexts of the selected SE ecosystems rank on the key
seven framework conditions of: 1. Culture and institutions; 2. Access to human capital;
3. Creation of knowledge and networking; 4. Market conditions; 5. Access to finance; 6.
Tax and regulations; 7. Infrastructure and support. This figure digs into the complexity
concealed by the general level of framework conditions at national levels and may display
which are the factors acting as common or complementary grounds for the ecosystems.
Within Digistart, for example, even if Malmö is clearly ahead of Lisbon in all the dimensions
still Lisbon enjoys the good pre-requisites offered by Portugal especially in terms of a good
access to human capital. This may certainly be an enabler of the successfulness of the
exchanges between these two ecosystems. Welcome looks quite balanced with national

16
contexts offering the cities similar framework conditions for scaleups, with Dublin in Ireland
and Milan in Italy being the two upper and lower poles. Instead, the project Eplus puts
together cities form countries that may have possible complementarities, with Lisbon possibly
enjoining very good access to human capital while Nice/Côte D’Azur and Baden-Württemberg
may enjoy better infrastructure and support at national levels. A similar case could be as well
the one of Startup Scaleup that ties Vilnius from a national context with high creation of
knowledge and networking with the outstanding Irish condition as for tax and regulations and
the Dutch infrastructure and access to human capital. In the ecosystem of Startup Scaleup
the national background of Cartagena is relatively stronger in terms of infrastructure and
human capital than in the other dimensions. Finally, Twist merges the Swedish excellence
with Italian, French and Polish contexts where the heterogeneity across the framework
conditions may turn into valuable complementarities.
17
Figure 6: Dimensions of the contextual framework conditions for scaleups in the SE ecosystems
Note: The graph shows the national specific framework conditions for scaleups concerning the European cities of the SE projects' ecosystems.
Source: Startup Europe DG Connect; Van Roy and Daniel Nepelski (2016)
18
4 The reach of Startup Europe
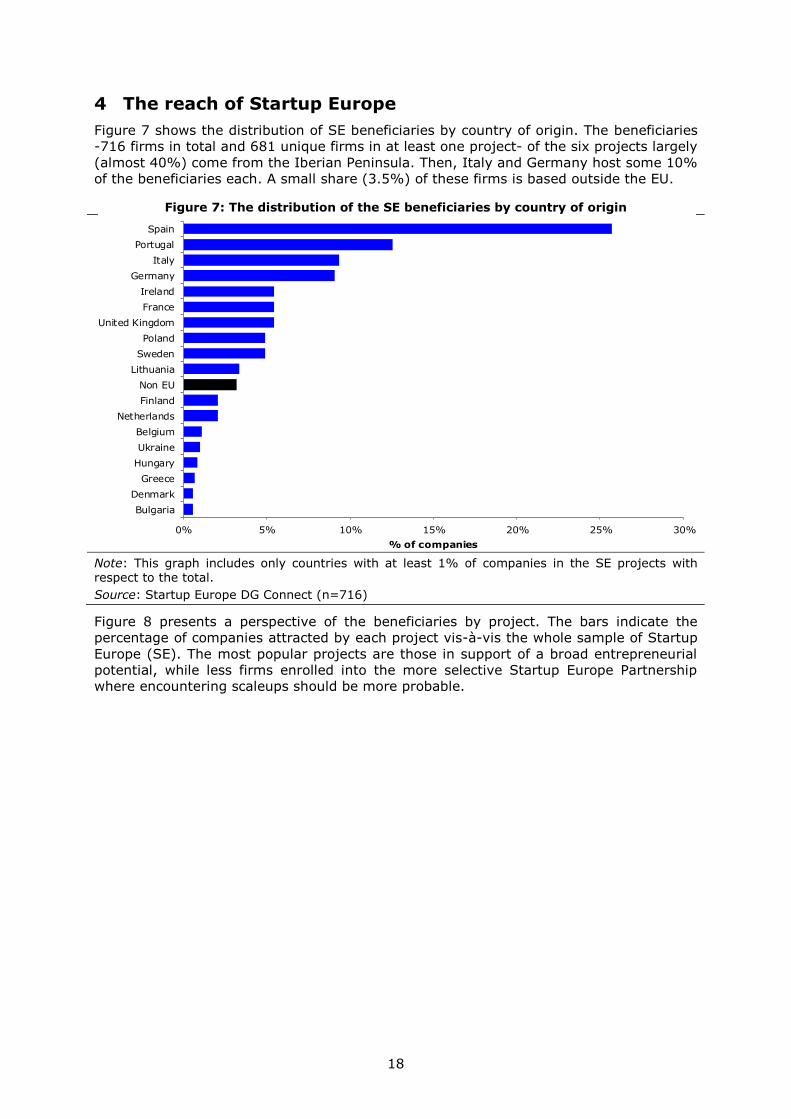
Figure 7 shows the distribution of SE beneficiaries by country of origin. The beneficiaries
-716 firms in total and 681 unique firms in at least one project- of the six projects largely
(almost 40%) come from the Iberian Peninsula. Then, Italy and Germany host some 10%
of the beneficiaries each. A small share (3.5%) of these firms is based outside the EU.
Figure 7: The distribution of the SE beneficiaries by country of origin
Note: This graph includes only countries with at least 1% of companies in the SE projects with respect to the total.
Source: Startup Europe DG Connect (n=716)
Figure 8 presents a perspective of the beneficiaries by project. The bars indicate the
percentage of companies attracted by each project vis-à-vis the whole sample of Startup
Europe (SE). The most popular projects are those in support of a broad entrepreneurial
potential, while less firms enrolled into the more selective Startup Europe Partnership
where encountering scaleups should be more probable.
0% 5% 10% 15% 20% 25% 30%
Bulgaria
Denmark
Greece
Hungary
Ukraine
Belgium
Netherlands
Finland
Non EU
Lithuania
Sweden
Poland
United Kingdom
France
Ireland
Germany
Italy
Portugal
Spain
% of companies

19
Figure 8: The distribution of the SE beneficiaries by projects
Source: Startup Europe DG Connect (n=716)
Figure 9 shows the geography of the different projects and the participation they attain
at city level. In the majority of cases the cities that gather the most of startups are the
ones directly identified by the SE ecosystems (Table 1). However companies from several
other cities responded to the SE calling and enrolled in the projects.
Figure 9: The distribution of SE beneficiaries by city of origin and project
Note: For each project the map shows the cities where the startups are based. Each city gets a
point by project and location, the size of points indicates the number of firms. Different projects
are in different colors. Size has four categories (i.e. 1 firm, 2-5 firms, 6-10 firms and 10-25 firms). The information about cities of origin is available about 72% of the startups.
Source: Startup Europe DG Connect, Orbis (n=495)
0%
5%
10%
15%
20%
25%
30%
Digistart Welcome Eplus Startup
Scaleup
Twist Startup
EuropePartnership
% o
f com
panie
s

20
5 Traits of the Startup Europe beneficiaries
This chapter outlines the traits of the Startup Europe beneficiaries in order to provide
similar policy initiatives with informative insights. The characteristics of the beneficiaries
are found out by means of additional data on the following features:
1. Sector of activity,
2. Age,
3. Size,
4. Financial performance,
5. Track of Venture Capital (VC) funding,
6. Internationalisation of activity,
7. Gender of startups' funders.
The data about the sector of activity, age, size, and financial performance of companies
are from Orbis - Bureau van Dijk. Data about size and financial performance relate to the
last available year.
Data of VC funding, internationalisation and gender are instead from Venture Source -
Dow Jones, Alexa, and Namsor respectively.
Finally, the number of observations (n) underneath the following figures indicates the
startups that were actually matched from the 681 of the SE sample.
5.1 Sector of activity
The information on the sectors (as per the NACE Rev. 2 classification) gives an indication
of the businesses that are more in search of support from policy (Figure 10). On the
other hand, the SE projects are particularly tailored to technology-based entrepreneurs.
All things considered it is not a surprise that the SE startups are predominately (almost
60% of them) from the broad sector of "Information and communication" (IC). Also
companies from the broad manufacturing sector (8%) are mostly active in the
"Manufacturing of computer, electronic and optical products". The second big class (18%)
of entrepreneurial endeavours is the "Professional, scientific and technical activities".

21
Figure 10: The distribution of the SE beneficiaries across the sectors of the economy
Note: The graph shows the percentage of startups by the sectors of the economy (NACE Rev. 2).
Source: Orbis, Bureau van Dijk (n=358)
71% of the IC beneficiaries operate in the sector of "Computer programming,
consultancy and related activities". In many cases these firms develop app-based
solutions (e.g., booking and sharing platforms, devices of internet-of-things) and to
digital health. By means of example, 149 firms from the SE sample mention the word
"app" in the description they provided of themselves while 19 firms indicate the word
"IoT".
5.2 Age
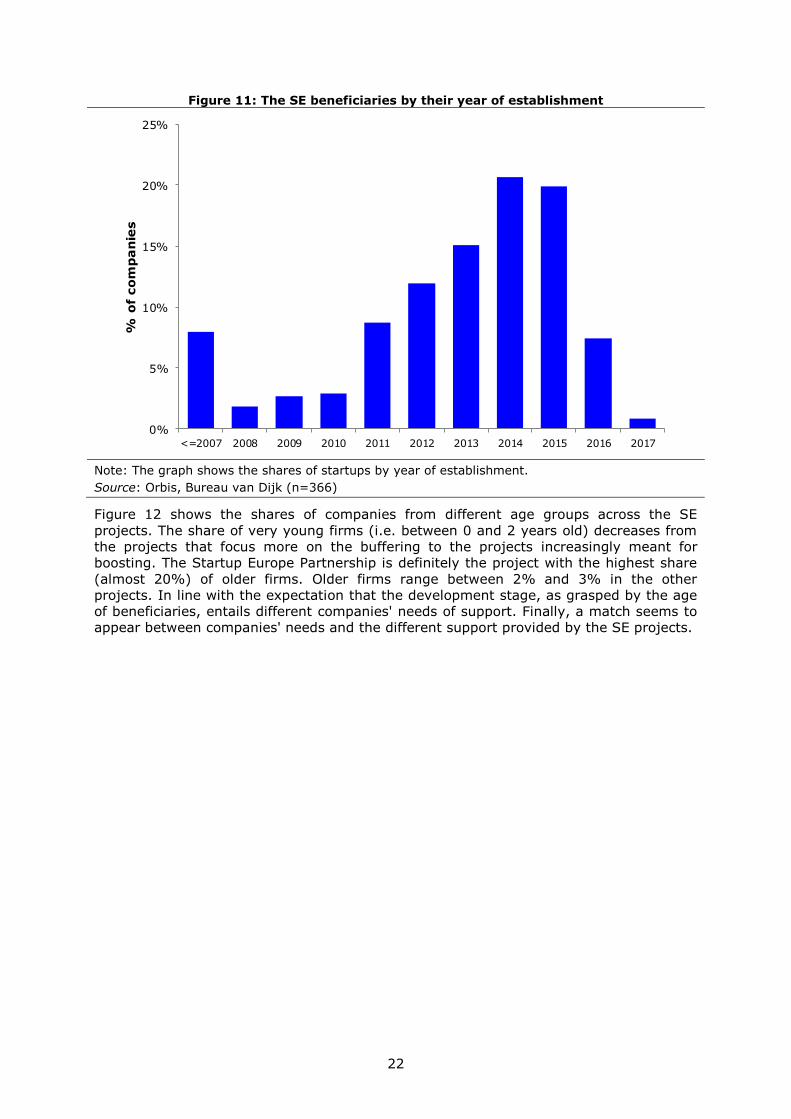
Figure 11 offers an insight into the age – and possibly the development stage – of the SE
beneficiaries. The majority (41%) of firms were founded between 2014 and 2015 and
were respectively 2 and 1 years old during the SE edition in 2016. The age is computed
with respect to 2016 as "2016 – year of establishment".
22
Figure 11: The SE beneficiaries by their year of establishment
Note: The graph shows the shares of startups by year of establishment.
Source: Orbis, Bureau van Dijk (n=366)
Figure 12 shows the shares of companies from different age groups across the SE
projects. The share of very young firms (i.e. between 0 and 2 years old) decreases from
the projects that focus more on the buffering to the projects increasingly meant for
boosting. The Startup Europe Partnership is definitely the project with the highest share
(almost 20%) of older firms. Older firms range between 2% and 3% in the other
projects. In line with the expectation that the development stage, as grasped by the age
of beneficiaries, entails different companies' needs of support. Finally, a match seems to
appear between companies' needs and the different support provided by the SE projects.
0%
5%
10%
15%
20%
25%
0%
5%
10%
15%
20%
25%
<=2007 2008 2009 2010 2011 2012 2013 2014 2015 2016 2017
% o
f co
mp
an
ies

23
Figure 12: The age of SE beneficiaries by project
Note: The graph shows the percentage of startups from different age groups (0-2 years old; 3-5 years old; 6-8 years old) by project. The age is computed as "2016 – year of establishment".
Source: Orbis, Bureau van Dijk (n=366)
5.3 Size
Following on the characteristics of SE beneficiaries, Figure 13 shows the entire
distribution of the startups along the number of employees. Almost 20% of companies
are 1-employee firms while overall half of the companies have between 1 and 4
employees.
0%
10%
20%
30%
40%
50%
60%
70%
80%
90%
100%
Digistart Welcome Eplus Startup
Scaleup
Twist Startup
EuropePartnership
% o
f com
panie
s
6 - 8
3 - 5
0 - 2

24
Figure 13: The share of SE beneficiaries by the number of employees
Note: The graph shows the numbers and shares of startups by given numbers of employees.
Source: Orbis, Bureau van Dijk (n=195)
Figure 14 shows the share of small (i.e. between 1 and 20 employees) and bigger
companies by the SE project. Similarly to age, smaller firms gather more into the
projects with a focus on buffering and bridging while bigger ones enter the projects for
boosting.
Figure 14: The employees of SE beneficiaries by project
Note: The graph shows the percentage of startups with different numbers of employees (1-20 employees; 21-40 employees; 41-60 employees; 61-80 employees; 81-100 employees) by project.
Source: Orbis, Bureau van Dijk (n=195)
0%
10%
20%
30%
40%
50%
60%
1 2 3 4 ≥5
% o
f co
mp
an
ies
Nr of employees
median value = 4
0%
10%
20%
30%
40%
50%
60%
70%
80%
90%
100%
Digistart Welcome Eplus StartupScaleup
Twist StartupEurope
Partnership
% o
f com
panie
s
81 - 100
61 - 80
41 - 60
21 - 40
1 - 20
25
5.4 Financial performance
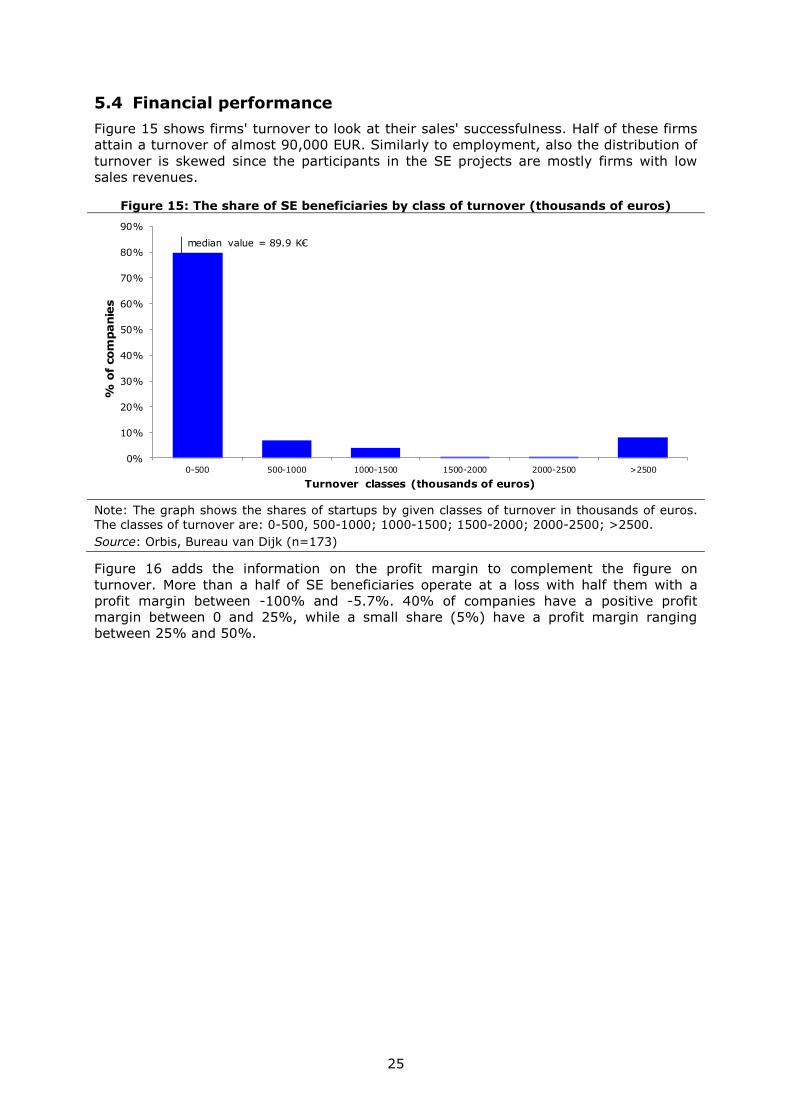
Figure 15 shows firms' turnover to look at their sales' successfulness. Half of these firms
attain a turnover of almost 90,000 EUR. Similarly to employment, also the distribution of
turnover is skewed since the participants in the SE projects are mostly firms with low
sales revenues.
Figure 15: The share of SE beneficiaries by class of turnover (thousands of euros)
Note: The graph shows the shares of startups by given classes of turnover in thousands of euros.
The classes of turnover are: 0-500, 500-1000; 1000-1500; 1500-2000; 2000-2500; >2500.
Source: Orbis, Bureau van Dijk (n=173)
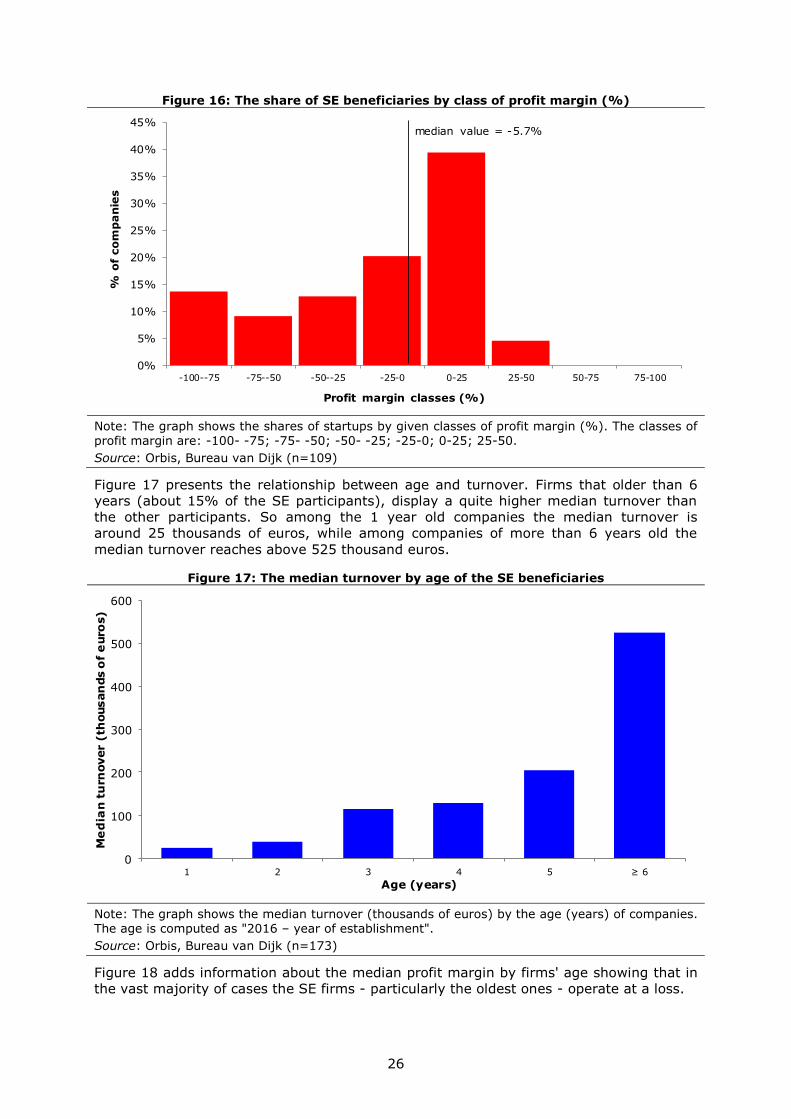
Figure 16 adds the information on the profit margin to complement the figure on
turnover. More than a half of SE beneficiaries operate at a loss with half them with a
profit margin between -100% and -5.7%. 40% of companies have a positive profit
margin between 0 and 25%, while a small share (5%) have a profit margin ranging
between 25% and 50%.
0%
10%
20%
30%
40%
50%
60%
70%
80%
90%
0-500 500-1000 1000-1500 1500-2000 2000-2500 >2500
% o
f com
panie
s
Turnover classes (thousands of euros)
median value = 89.9 K€
26
Figure 16: The share of SE beneficiaries by class of profit margin (%)
Note: The graph shows the shares of startups by given classes of profit margin (%). The classes of profit margin are: -100- -75; -75- -50; -50- -25; -25-0; 0-25; 25-50.
Source: Orbis, Bureau van Dijk (n=109)
Figure 17 presents the relationship between age and turnover. Firms that older than 6
years (about 15% of the SE participants), display a quite higher median turnover than
the other participants. So among the 1 year old companies the median turnover is
around 25 thousands of euros, while among companies of more than 6 years old the
median turnover reaches above 525 thousand euros.
Figure 17: The median turnover by age of the SE beneficiaries
Note: The graph shows the median turnover (thousands of euros) by the age (years) of companies. The age is computed as "2016 – year of establishment".
Source: Orbis, Bureau van Dijk (n=173)
Figure 18 adds information about the median profit margin by firms' age showing that in
the vast majority of cases the SE firms - particularly the oldest ones - operate at a loss.
0%
5%
10%
15%
20%
25%
30%
35%
40%
45%
-100--75 -75--50 -50--25 -25-0 0-25 25-50 50-75 75-100
% o
f co
mp
an
ies
Profit margin classes (%)
median value = -5.7%
0
100
200
300
400
500
600
1 2 3 4 5 ≥ 6
Me
dia
n t
urn
over (
thousan
ds o
f e
uro
s)
Age (years)

27
Figure 18: The median profit margin by age of the SE beneficiaries
Note: The graph shows the median profit margin (%) by the age (years) of companies. The age is computed as "2016 – year of establishment".
Source: Orbis, Bureau van Dijk (n=109)
5.5 Track of Venture Capital funding
Scaling up a business necessitates the support of riskier equity therefore this section
explores how the SE beneficiaries performed about attracting VC investments. In total 73
companies from the SE initiative benefitted from VC deals, as documented by the
Venture Source of Dow Jones and the deals obtained by these firms add up to 123.
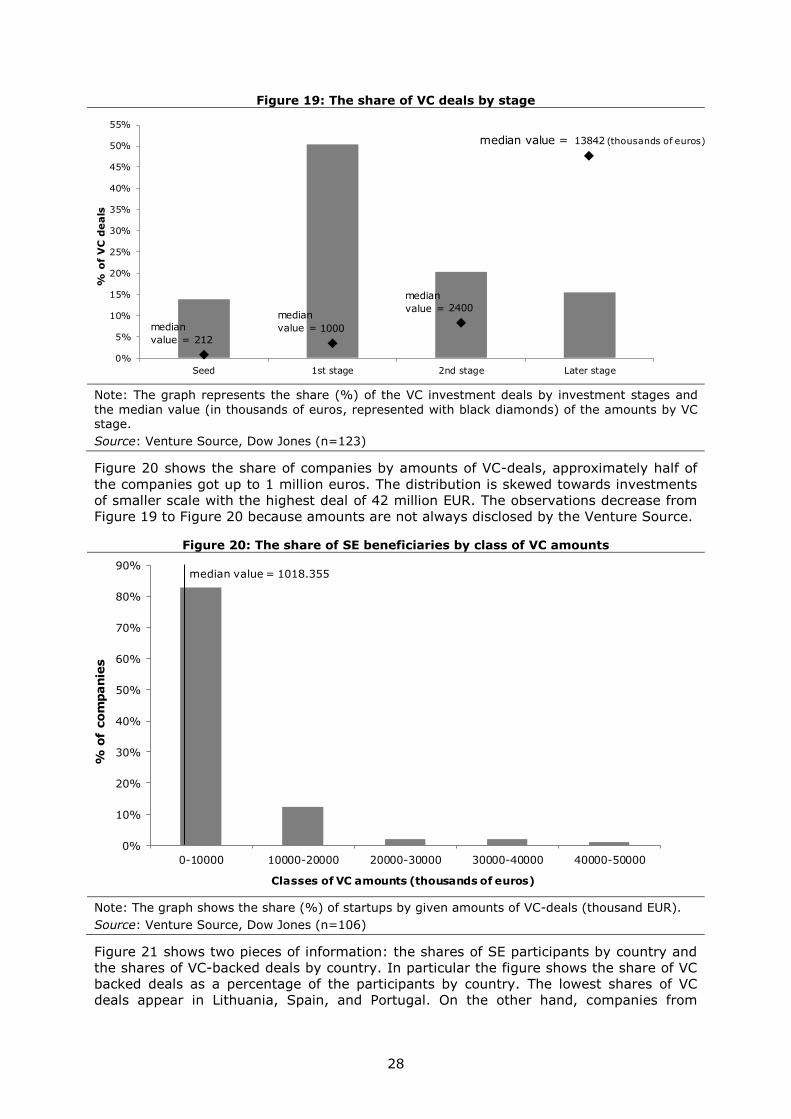
Figure 19 shows the shares of deals by VC stage revealing that that the majority of the
VC investments are early-stage, either seed or first round investments (64%). At the
same time the median values of the amounts increases with the number of rounds, so
the median amount of the seeds investment is around 212 thousand of euros, while the
median amount of the later stage investments is almost 14000 thousands of euros.
-16%
-14%
-12%
-10%
-8%
-6%
-4%
-2%
0%
2%
1 2 3 4 5 ≥ 6
Me
dia
n p
rofi
t m
arg
in (
%)
Age (years)
28
Figure 19: The share of VC deals by stage
Note: The graph represents the share (%) of the VC investment deals by investment stages and
the median value (in thousands of euros, represented with black diamonds) of the amounts by VC stage.
Source: Venture Source, Dow Jones (n=123)
Figure 20 shows the share of companies by amounts of VC-deals, approximately half of
the companies got up to 1 million euros. The distribution is skewed towards investments
of smaller scale with the highest deal of 42 million EUR. The observations decrease from
Figure 19 to Figure 20 because amounts are not always disclosed by the Venture Source.
Figure 20: The share of SE beneficiaries by class of VC amounts
Note: The graph shows the share (%) of startups by given amounts of VC-deals (thousand EUR).
Source: Venture Source, Dow Jones (n=106)
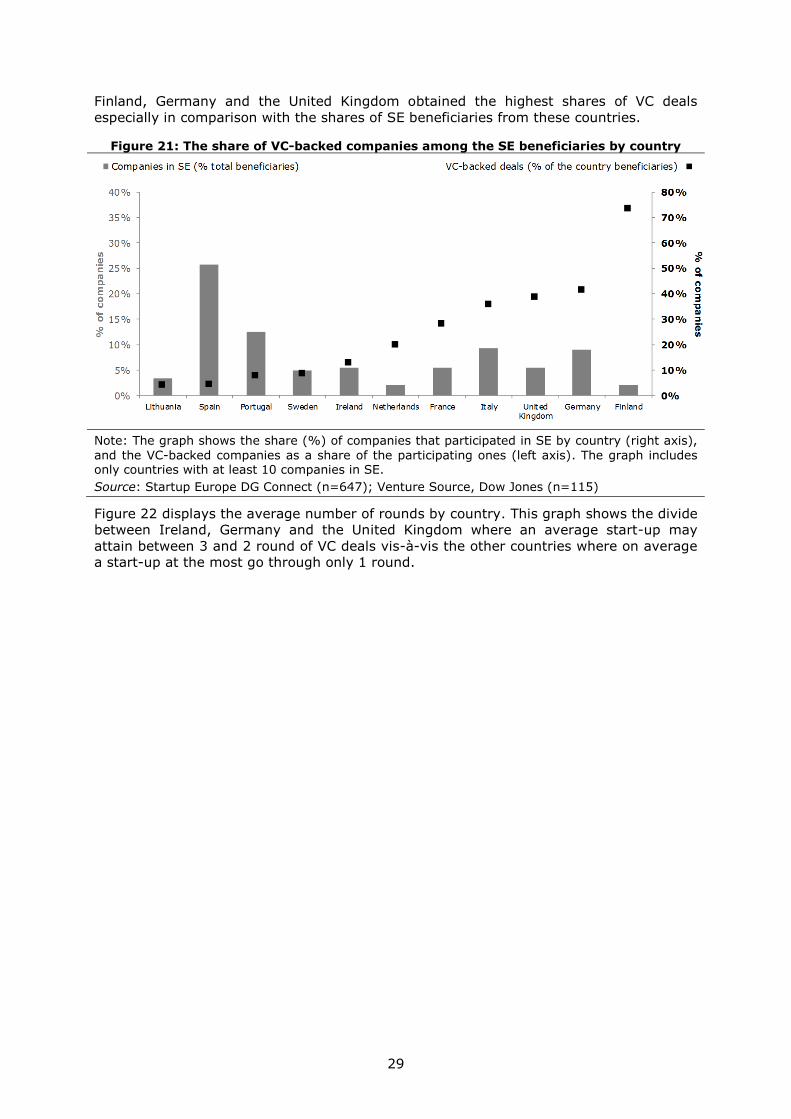
Figure 21 shows two pieces of information: the shares of SE participants by country and
the shares of VC-backed deals by country. In particular the figure shows the share of VC
backed deals as a percentage of the participants by country. The lowest shares of VC
deals appear in Lithuania, Spain, and Portugal. On the other hand, companies from
2121000
2400
13842
0
2000
4000
6000
8000
10000
12000
14000
16000
0%
5%
10%
15%
20%
25%
30%
35%
40%
45%
50%
55%
Seed 1st stage 2nd stage Later stage
% o
f V
C d
ea
ls
median value = (thousands of euros)
median
value =
median
value =
median
value =
0%
10%
20%
30%
40%
50%
60%
70%
80%
90%
0-10000 10000-20000 20000-30000 30000-40000 40000-50000
% o
f com
panie
s
Classes of VC amounts (thousands of euros)
median value = 1018.355
29
Finland, Germany and the United Kingdom obtained the highest shares of VC deals
especially in comparison with the shares of SE beneficiaries from these countries.
Figure 21: The share of VC-backed companies among the SE beneficiaries by country
Note: The graph shows the share (%) of companies that participated in SE by country (right axis),
and the VC-backed companies as a share of the participating ones (left axis). The graph includes only countries with at least 10 companies in SE.
Source: Startup Europe DG Connect (n=647); Venture Source, Dow Jones (n=115)
Figure 22 displays the average number of rounds by country. This graph shows the divide
between Ireland, Germany and the United Kingdom where an average start-up may
attain between 3 and 2 round of VC deals vis-à-vis the other countries where on average
a start-up at the most go through only 1 round.
30
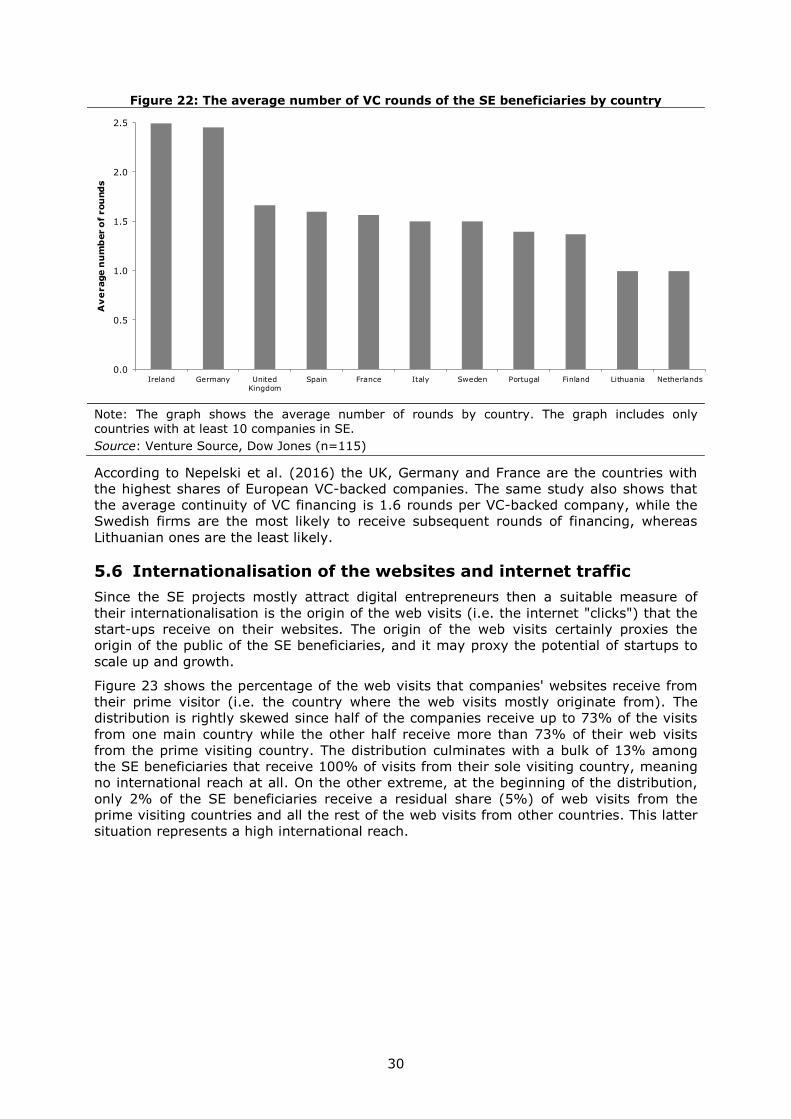
Figure 22: The average number of VC rounds of the SE beneficiaries by country
Note: The graph shows the average number of rounds by country. The graph includes only countries with at least 10 companies in SE.
Source: Venture Source, Dow Jones (n=115)
According to Nepelski et al. (2016) the UK, Germany and France are the countries with
the highest shares of European VC-backed companies. The same study also shows that
the average continuity of VC financing is 1.6 rounds per VC-backed company, while the
Swedish firms are the most likely to receive subsequent rounds of financing, whereas
Lithuanian ones are the least likely.
5.6 Internationalisation of the websites and internet traffic
Since the SE projects mostly attract digital entrepreneurs then a suitable measure of
their internationalisation is the origin of the web visits (i.e. the internet "clicks") that the
start-ups receive on their websites. The origin of the web visits certainly proxies the
origin of the public of the SE beneficiaries, and it may proxy the potential of startups to
scale up and growth.
Figure 23 shows the percentage of the web visits that companies' websites receive from
their prime visitor (i.e. the country where the web visits mostly originate from). The
distribution is rightly skewed since half of the companies receive up to 73% of the visits
from one main country while the other half receive more than 73% of their web visits
from the prime visiting country. The distribution culminates with a bulk of 13% among
the SE beneficiaries that receive 100% of visits from their sole visiting country, meaning
no international reach at all. On the other extreme, at the beginning of the distribution,
only 2% of the SE beneficiaries receive a residual share (5%) of web visits from the
prime visiting countries and all the rest of the web visits from other countries. This latter
situation represents a high international reach.
0.0
0.5
1.0
1.5
2.0
2.5
Ireland Germany United
Kingdom
Spain France Italy Sweden Portugal Finland Lithuania Netherlands
Av
erage n
um
ber
of
rou
nd
s

31
Figure 23: The share of internet visits from the prime country to the SE beneficiaries'
websites
Note: The graph represents the distribution of the "clicks" from the prime country (% of total "clicks").
Source: Alexa (n=143)
Figure 24 looks closely at the companies that receive more than 75% of web visits from
one country. For 93% of theSE beneficiaries their prime visiting country is actually their
home country. Therefore, these startups are more focused on their domestic markets
confirming the suspicion of little internationalisation.
Figure 24: The share of visits from the home country to the SE beneficiaries' websites
that receive more than 75% of web visits from one country
Note: The pie chart shows the share of domestic visitors in the companies with more than 75% of clicks from one country.
Source: Alexa (n=107)
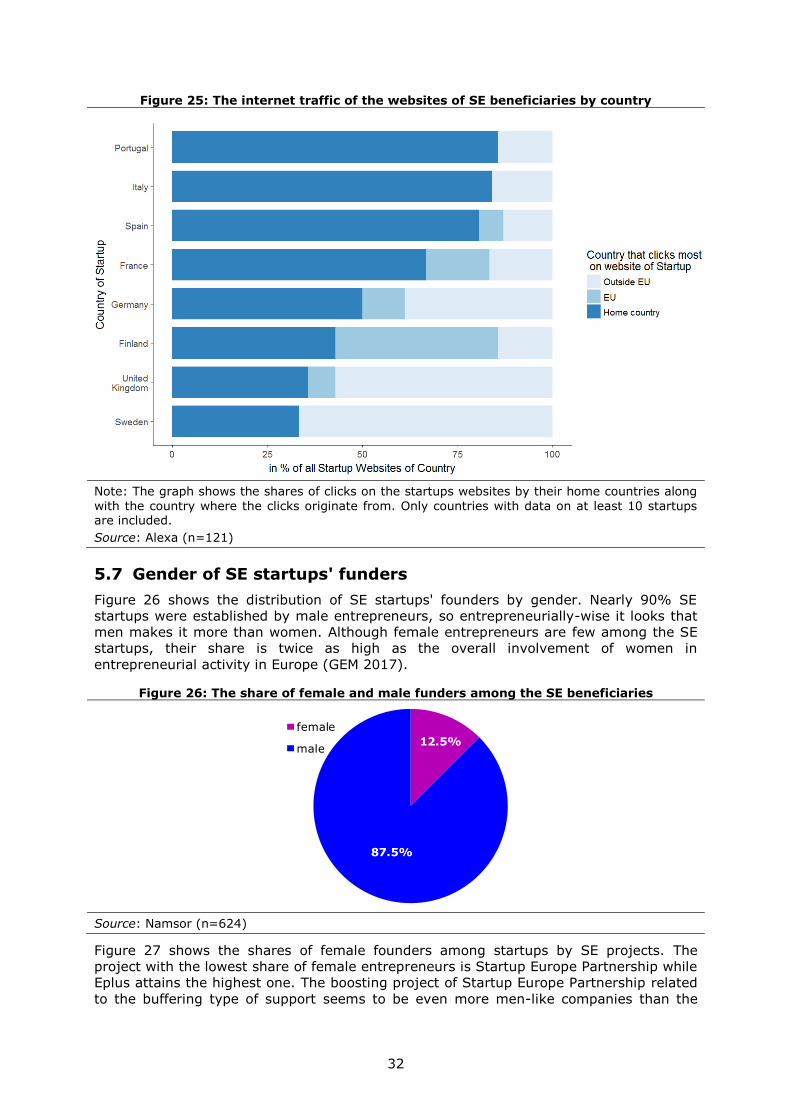
Figure 25 shows the internet traffic of startups websites by country. Particularly
companies from Portugal, Italy and Spain receive the most of their digital visits from
their home country. Digital visits from abroad, when they take place, are predominantly
from outside the European Union.
32
Figure 25: The internet traffic of the websites of SE beneficiaries by country
Note: The graph shows the shares of clicks on the startups websites by their home countries along
with the country where the clicks originate from. Only countries with data on at least 10 startups are included.
Source: Alexa (n=121)
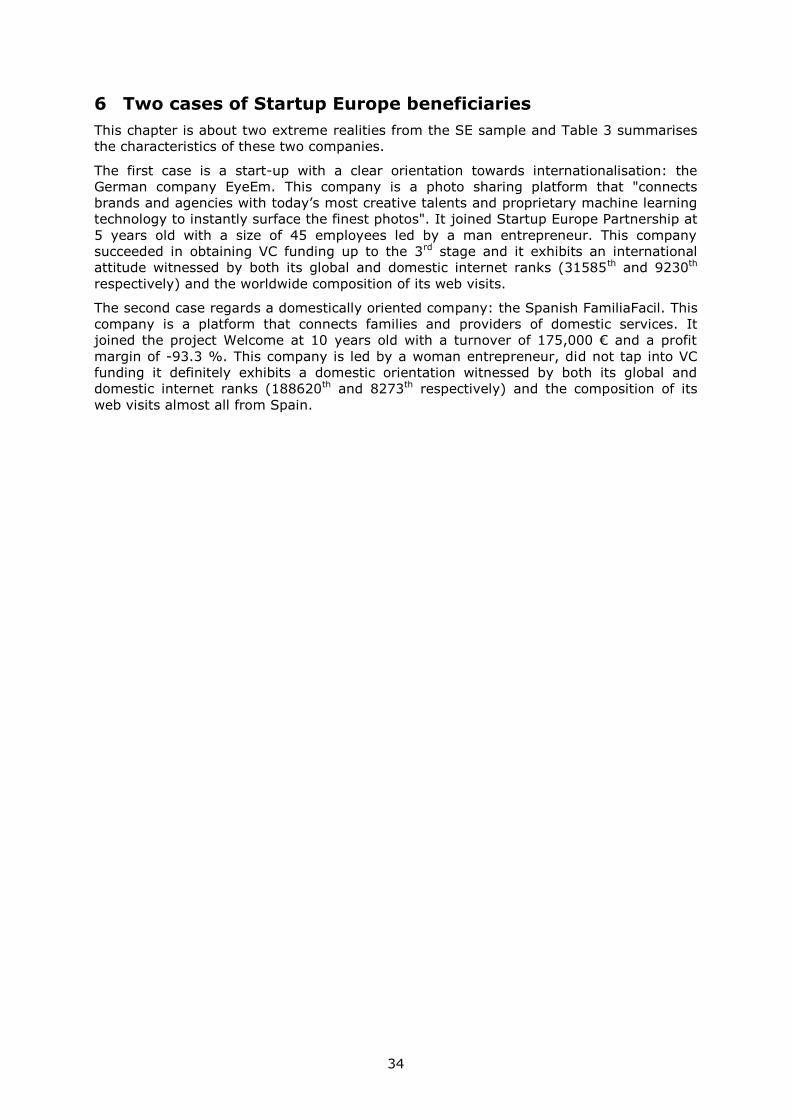
5.7 Gender of SE startups' funders
Figure 26 shows the distribution of SE startups' founders by gender. Nearly 90% SE
startups were established by male entrepreneurs, so entrepreneurially-wise it looks that
men makes it more than women. Although female entrepreneurs are few among the SE
startups, their share is twice as high as the overall involvement of women in
entrepreneurial activity in Europe (GEM 2017).
Figure 26: The share of female and male funders among the SE beneficiaries
Source: Namsor (n=624)
Figure 27 shows the shares of female founders among startups by SE projects. The
project with the lowest share of female entrepreneurs is Startup Europe Partnership while
Eplus attains the highest one. The boosting project of Startup Europe Partnership related
to the buffering type of support seems to be even more men-like companies than the
12.5%
87.5%
female
male

33
buffering and bridging projects. However, the share of women entrepreneurs slightly
varies across the SE projects.
Figure 27: The share of female founders by project
Note: The graph shows the shares of female founders by project.
Source: Namsor (n=624)
0%
2%
4%
6%
8%
10%
12%
14%
16%
18%
Digistart Welcome Eplus Startup
Scaleup
Twist Startup
EuropePartnership
% o
f co
mp
an
ies
34
6 Two cases of Startup Europe beneficiaries
This chapter is about two extreme realities from the SE sample and Table 3 summarises
the characteristics of these two companies.
The first case is a start-up with a clear orientation towards internationalisation: the
German company EyeEm. This company is a photo sharing platform that "connects
brands and agencies with today’s most creative talents and proprietary machine learning
technology to instantly surface the finest photos". It joined Startup Europe Partnership at
5 years old with a size of 45 employees led by a man entrepreneur. This company
succeeded in obtaining VC funding up to the 3rd stage and it exhibits an international
attitude witnessed by both its global and domestic internet ranks (31585th and 9230th
respectively) and the worldwide composition of its web visits.
The second case regards a domestically oriented company: the Spanish FamiliaFacil. This
company is a platform that connects families and providers of domestic services. It
joined the project Welcome at 10 years old with a turnover of 175,000 € and a profit
margin of -93.3 %. This company is led by a woman entrepreneur, did not tap into VC
funding it definitely exhibits a domestic orientation witnessed by both its global and
domestic internet ranks (188620th and 8273th respectively) and the composition of its
web visits almost all from Spain.

35
Table 3: Two cases among the SE beneficiaries
Name EyeEm FamiliaFacil
SE project Startup Europe Partnership Welcome
Establishment year and place
2011 in Berlin 2006 in Madrid
Number of employees 45 N/A
Turnover N/A 175,000 €
Profit margin N/A -93.3 %
Gender of the CEO Man Woman
VC funding rounds (amounts)
3 rounds (the 2nd of 4,600,000 € and the 3rd of 17,000,000 €)
0 rounds
Global internet traffic (rank)
31585th 188620th
Domestic internet traffic (rank)
9230th 8273th
Web visits
Website https://www.eyeem.com/ https://familiafacil.es/en
Source: Startup Europe DG Connect
13%
13%
11%
8%
5%
50%
website visits from:
Germany
Japan
United States
China
France
Others94%
6% website visits from:
Spain
Others
36
7 A synthesis of the SE ecosystems
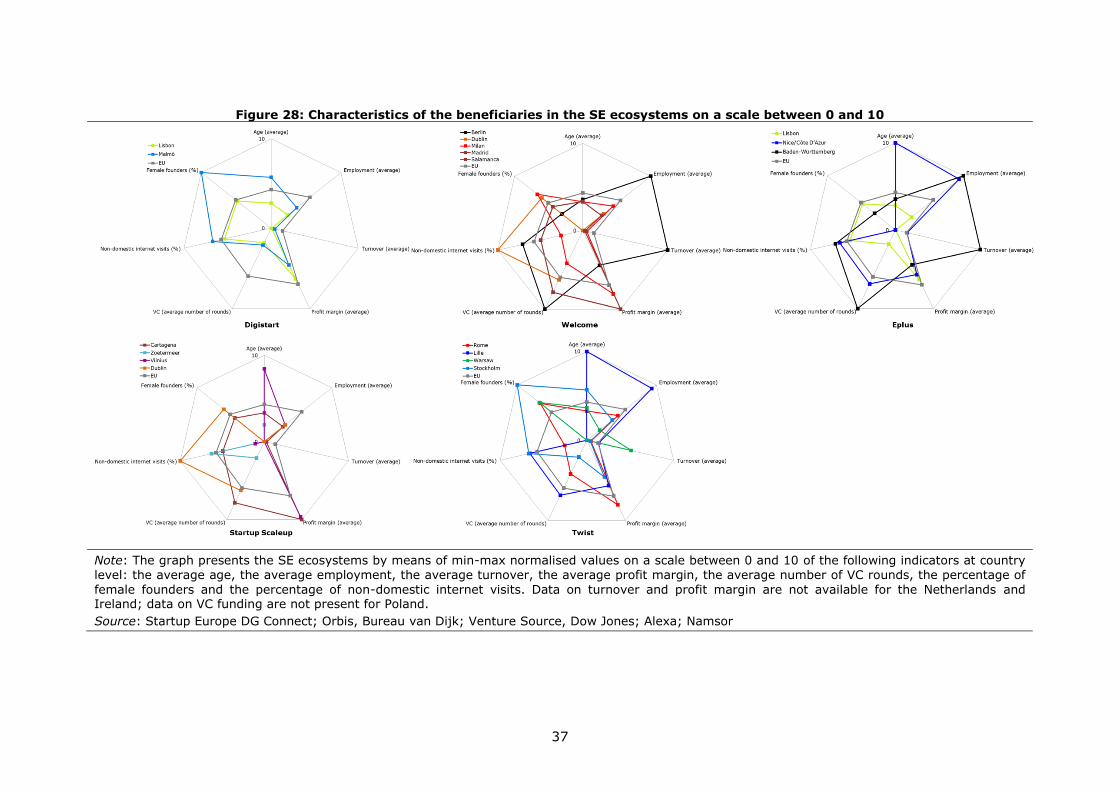
Figure 28 presents the SE beneficiaries' characteristics at country level of the SE
ecosystems that are identified expressly by the SE projects. Specifically, the graph shows
data that are normalised between 0 and 10 of the companies average age, the average
employment, the average turnover, the average profit margin, the average number of VC
rounds, the percentage of female founders and the percentage of non-domestic internet
visits in the countries identified by the SE projects. This graph particularly complements
the information from Figure 6 with information of the companies' traits that are discussed
throughout this report. In the project Digistart similarities in the shape of the national
ecosystems appear in the radar chart, Portugal with the representative ecosystem of
Lisbon scores lower than Sweden represented by Malmö in the SE projects. At the same
times both affinities –as for the average turnover and the average number of VC rounds-
and complementarities on the other indicators appear.
Certainly, Figure 28 displays more mixed evidence than Figure 5 and Figure 6 and it
shows the existence of heterogeneous realities in ecosystems that gathered together
within the SE projects. By means of example, France (represented by Lille and Nice/Côte
D’Azur) is over the EU average concerning the framework conditions to scale up business
and has on average the oldest (5 years old) companies from the SE ecosystems. Ireland
(represented by Dublin) is also a country with very good framework conditions but has
instead on average the youngest (less than 2 years old) ones. At the same time French
companies are also among the most sizeable (with an average of 13 employees) together
with the German ones while the slimmer firms are from the Netherlands (with 3
employees on average). German companies are at the top of turnover with on average
5,700,000€, while the profit margin is commonly negative everywhere and Spanish firms
have an average profit margin of -8.5%. As for the average numbers of VC rounds the
companies from Germany (almost 3 rounds), Spain, France and Ireland are at the top (in
the case of Spain, a bias may be due to the very high presence of companies from this
country). About the internationalisation, the Irish companies are at the top with 65% of
web visits from other countries while companies from Sweden have the highest female
founders (20%) vis-à-vis the other SE ecosystems.
Finally, the diversity of the SE beneficiaries is not always aligned to the assessment of
the framework conditions for scaleups. In this respect the SE brought together rich
variability at company level from which companies themselves. For example, Sweden
provides excellent framework condition as for access to finance but concerning the VC
funding of the SE sample it appears that on average German companies benefit more
than Swedish ones from advanced funding mechanisms. The Swedish high standing
entrepreneurial culture matches well with the highest percentage of women that start up
a business in this country.
37
Figure 28: Characteristics of the beneficiaries in the SE ecosystems on a scale between 0 and 10
Note: The graph presents the SE ecosystems by means of min-max normalised values on a scale between 0 and 10 of the following indicators at country
level: the average age, the average employment, the average turnover, the average profit margin, the average number of VC rounds, the percentage of
female founders and the percentage of non-domestic internet visits. Data on turnover and profit margin are not available for the Netherlands and Ireland; data on VC funding are not present for Poland.
Source: Startup Europe DG Connect; Orbis, Bureau van Dijk; Venture Source, Dow Jones; Alexa; Namsor

38
8 Conclusions and recommendations
The review of six Startup Europe projects, i.e. Welcome, Digistart, ePlus, Startup
Scaleup, Twist and Startup Europe Partnership, reveals considerable differences in
terms of their target groups, geographical reach and value proposition. In order to
assess how effectively the support offered by the projects matched the needs of the
startups, this analysis employed the 3B (i.e. buffering, bridging, boosting) framework of
policy support at different entrepreneurial phases (i.e. stand-up, start-up, scale-up).
Therefore, the SE programmes are associated to a specific type of support to
entrepreneurship based on their offerings. For example, the project Digistart offers
training and consulting services, therefore it qualifies as a buffering support to the early
stage of entrepreneurial activity. In contrast, Startup Europe Partnership focuses on of
promising ventures in order to link them with equity investments and to accelerate their
growth, therefore it appears as a boosting support.
Even if there is a recognised need to improve the coherence and linkages in the EU
entrepreneurial ecosystem, a reflection about the relevance of the value proposition of
projects goes hand in hand with the difficulty that policy has to directly enhance the
systemic conditions. For future releases of SE it is absolutely relevant to design the
value proposition of projects clearly, together with well-defined milestone
achievements, to make sure of attracting the "right" startups and to offer them suitable
support of buffering/bridging/boosting.
A typical SE beneficiary is an early stage, financially constrained venture that operates in
the digital domain and comes from a country with limited private investments in young
firms. However, the SE beneficiaries exhibit some differences. The characteristics of the
SE beneficiaries also confirm that Digistart, for example, focuses on the early phases of
the startup lifecycle while Startup Europe Partnership attracts more advanced firms. This
may suggest that overall the matchmaking between the SE offerings and the
startups has been efficient. In addition to that, it also highlights the necessity of
customised support on startups' characteristics and development phase.
Nonetheless, the fact that the majority of startups face financial difficulties and come
from countries with little VC funds to novel and risky ventures stirs some reflection. A
reasonable assumption may be that some companies only joined the SE projects to find
the support that they struggle to find elsewhere. In this case it is probable that a number
of unsuccessful small and medium enterprises hid among the worthy startups operating
at loss but concealing a true potential. To rule out this possibility, the recommendation is
that project coordinators may perhaps perform a better screening to disentangle
unsuccessful SMEs from the actual startups operating at loss but with a real potential.
A worrying finding is that the business of the majority of startups is confined in the home
country. At first sight, this seems a confirmation of the fragmentation of the European
market. However, considering the heterogeneous internationalisation of startups from
different countries, an alternative explanation could be that founders from specific
ecosystems are either reluctant or not equipped with necessary know-how to pursue
international business strategies. In order to address this possibility, initiatives like SE
should directly target the lack of internationalisation to better support worthy
startups that are not equipped for international business strategies yet.
Finally to effectively monitor similar initiatives and to strengthen the conclusions of this
type of study, it would be ideal to have a systematic collection of data during and
after the SE initiative to track companies' records. Due to its limitations, the current
study cannot be seen as a validation exercise. A valid control group is necessary to
answer questions on whether participating to SE enhanced the internationalisation, the
likelihood of receiving VC funding, or other relevant dimensions. However, even if
feasible from the methodological perspective, it could not yield a definite answer. The SE
initiative aims to reinforce the systemic conditions of the European entrepreneurial
ecosystem by, among others, increasing the connections of the ecosystem and
propagating the entrepreneurial culture. These interventions are more subtle than

39
traditional policy mechanisms based, for example, on direct subsidies to individual actors
aimed at enhancing their effort in desired activities, e.g. R&D. Therefore, a number of
measureable objectives that are meant to achieve by means of SE should be clearly
identified in order to assess these soft policy interventions. This should be done together
with collection of relevant and systematic data to track the progress of the initiative
towards its objectives.

40
List of figures
Figure 1: The SE projects in the 3B framework of policy support to startups ................. 4
Figure 2: Three facts about the SE beneficiaries and projects in the 3B framework ........ 6
Figure 3: The 3B framework of policy support to startups ........................................... 9
Figure 4: Startup Europe projects in the 3B framework of policy support to startups .....12
Figure 5: National framework conditions for scaleups in the SE ecosystems .................15
Figure 6: Dimensions of the contextual framework conditions for scaleups in the SE
ecosystems ..........................................................................................................17
Figure 7: The distribution of the SE beneficiaries by country of origin ..........................18
Figure 8: The distribution of the SE beneficiaries by projects ......................................19
Figure 9: The distribution of SE beneficiaries by city of origin and project ....................19
Figure 10: The distribution of the SE beneficiaries across the sectors of the economy ...21
Figure 11: The SE beneficiaries by their year of establishment ...................................22
Figure 12: The age of SE beneficiaries by project .....................................................23
Figure 13: The share of SE beneficiaries by the number of employees .........................24
Figure 14: The employees of SE beneficiaries by project ............................................24
Figure 15: The share of SE beneficiaries by class of turnover (thousands of euros) .......25
Figure 16: The share of SE beneficiaries by class of profit margin (%) ........................26
Figure 17: The median turnover by age of the SE beneficiaries ..................................26
Figure 18: The median profit margin by age of the SE beneficiaries ............................27
Figure 19: The share of VC deals by stage ...............................................................28
Figure 20: The share of SE beneficiaries by class of VC amounts ................................28
Figure 21: The share of VC-backed companies among the SE beneficiaries by country ..29
Figure 22: The average number of VC rounds of the SE beneficiaries by country ..........30
Figure 23: The share of internet visits from the prime country to the SE beneficiaries'
websites ..............................................................................................................31
Figure 24: The share of visits from the home country to the SE beneficiaries' websites
that receive more than 75% of web visits from one country .......................................31
Figure 25: The internet traffic of the websites of SE beneficiaries by country................32
Figure 26: The share of female and male funders among the SE beneficiaries ..............32
Figure 27: The share of female founders by project ..................................................33
Figure 28: Characteristics of the beneficiaries in the SE ecosystems on a scale between 0
and 10 ................................................................................................................37

41
List of tables
Table 1: Overview of Startup Europe Projects ..........................................................11
Table 2: The Startup Europe projects and their support to different entrepreneurial
phases ................................................................................................................14
Table 3: Two cases among the SE beneficiaries ........................................................35

42
References
Autio, E., Nambisan, S., Thomas, L. D., & Wright, M. (2017). Digital affordances, spatial
affordances, and the genesis of entrepreneurial ecosystems. Strategic Entrepreneurship
Journal.
Autio, E. and H. Rannikko (2016). Retaining winners: Can policy boost high-growth
entrepreneurship? Research Policy 45(1): 42-55.
Amezcua, A. S., M. G. Grimes, et al. (2013). Organizational sponsorship and founding
environments: a contingency view on the survival of business-incubated firms, 1994–
2007. Academy of Management Journal 56(6): 1628-1654.
Blank, S. (2010). What’s A Startup? First Principles. from
https://steveblank.com/2010/01/25/whats-a-startup-first-principles/
European Commission (2014). Startup Europe: building the ecosystem, 2017, from
https://ec.europa.eu/digital-single-market/en/startup-europe-building-ecosystem
European Commission (2015). A Digital Single Market Strategy for Europe - Analysis and
Evidence. from http://ec.europa.eu/priorities/digital-single-market/docs/dsm-swd_en.pdf
European Commission (2016). Europe's next leaders: the Start-up and Scale-up
Initiative. (COM(2016) 733). From http://ec.europa.eu/information_society/digital-
agenda/documents/digital-agenda-communication-en.pdf
Fuerlinger, G., Fandl, U., & Funke, T. (2015). The role of the state in the
entrepreneurship ecosystem: insights from Germany. Triple Helix, 2-3(1), 1-26.
GEM (2017). Global Entrepreneurship Monitor Global Report 2016/17.
Guzman, J., & Stern, S. (2016). Nowcasting and Placecasting Entrepreneurial Quality and
Performance (pp. 63-109): National Bureau of Economic Research, Inc.
Nepelski, D., Piroli, G. and De Prato, G. (2016). European start-up hotspots: Analysis of
Venture Capital financing in Europe. Joint Research Centre, JRC Scientific and Policy
Reports – EUR 28021 EN. doi:10.2791/39207
OECD (2017). Entrepreneurship at a Glance 2017, OECD Publishing.
Stam, E., & Spigel, B. (2016). Entrepreneurial ecosystems. Utrecht School of Economics.
Discussion Paper Series nr: 16-13.
Van Roy, V. and Nepelski, D. (2016). Assessment of Framework Conditions for the
Creation and Growth of Firms in Europe. Joint Research Centre, JRC Scientific and Policy
Reports – EUR 28167 EN; doi:10.2791/2811
Van Roy, V. and Nepelski, D. (2017). Determinants of high-tech entrepreneurship in
Europe. Joint Research Centre, JRC Scientific and Policy Reports – EUR 28299 EN;
doi:10.2791/96153

GETTING IN TOUCH WITH THE EU
In person
All over the European Union there are hundreds of Europe Direct information centres. You can find the address of the centre nearest you at: http://europea.eu/contact
On the phone or by email
Europe Direct is a service that answers your questions about the European Union. You can contact this service:
- by freephone: 00 800 6 7 8 9 10 11 (certain operators may charge for these calls),
- at the following standard number: +32 22999696, or
- by electronic mail via: http://europa.eu/contact
FINDING INFORMATION ABOUT THE EU
Online
Information about the European Union in all the official languages of the EU is available on the Europa website at: http://europa.eu
EU publications You can download or order free and priced EU publications from EU Bookshop at:
http://bookshop.europa.eu. Multiple copies of free publications may be obtained by contacting Europe
Direct or your local information centre (see http://europa.eu/contact).

44
KJ-N
A-2
9134-E
N-N
doi:10.2760/78946
ISBN 978-92-79-80358-1