the spirit level findings and why they matter redistribution of wealth - a question of social power...
TRANSCRIPT

The Spirit Level findings and why they matter
Redistribution of wealth -a question of social power
21st May 2012
Sue Christoforouwww.equalitytrust.org.uk
1
What we’re going to look at
• The Spirit Level
• Link between income inequality and health and social outcomes
• How do countries compare?
• Is it a causal explanation?
• What can be done?
• Myths about greater equality
2
The Spirit Level
• Synthesis of about 30 years of accumulated research into poor health and social outcomes associated with inequality
• Consistent set of 23 developed world countries were used throughout the study
• Richest 50 countries ranked by wealth according the World Bank
• Excluded those with populations of less than three million to exclude tax havens
• Used all the remaining countries for which a comparable income distribution measure was available in the UN Human Development Reports
3
The Spirit Level • Sources of data: WHO, UN, OECD, World Bank
• Internationally comparable data do not exist for most of developing world
4
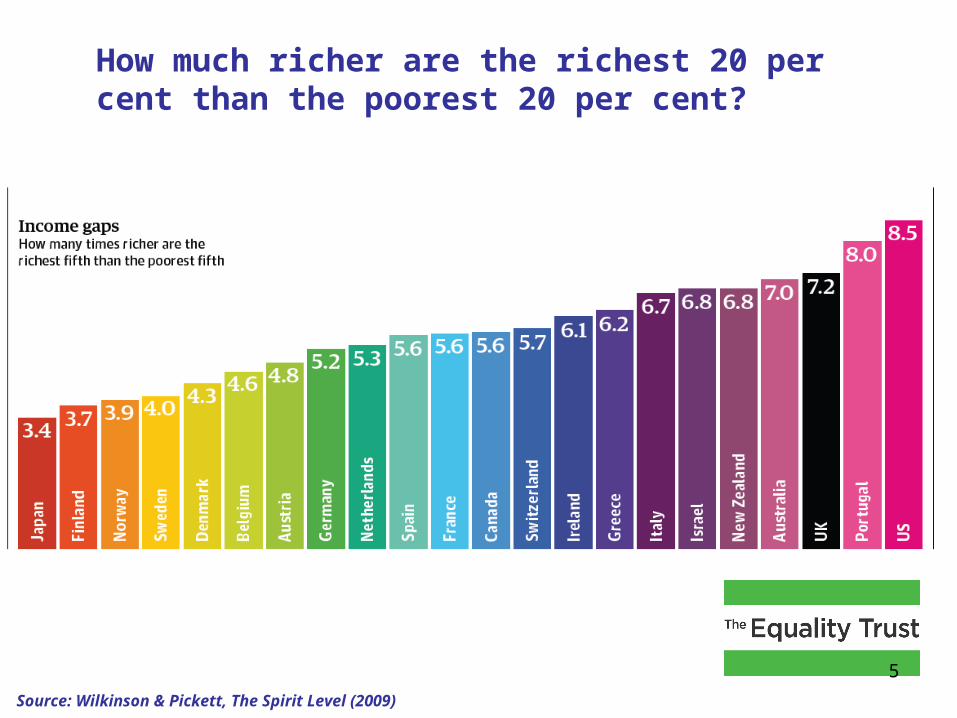
How much richer are the richest 20 per cent than the poorest 20 per cent?
Source: Wilkinson & Pickett, The Spirit Level (2009)
5
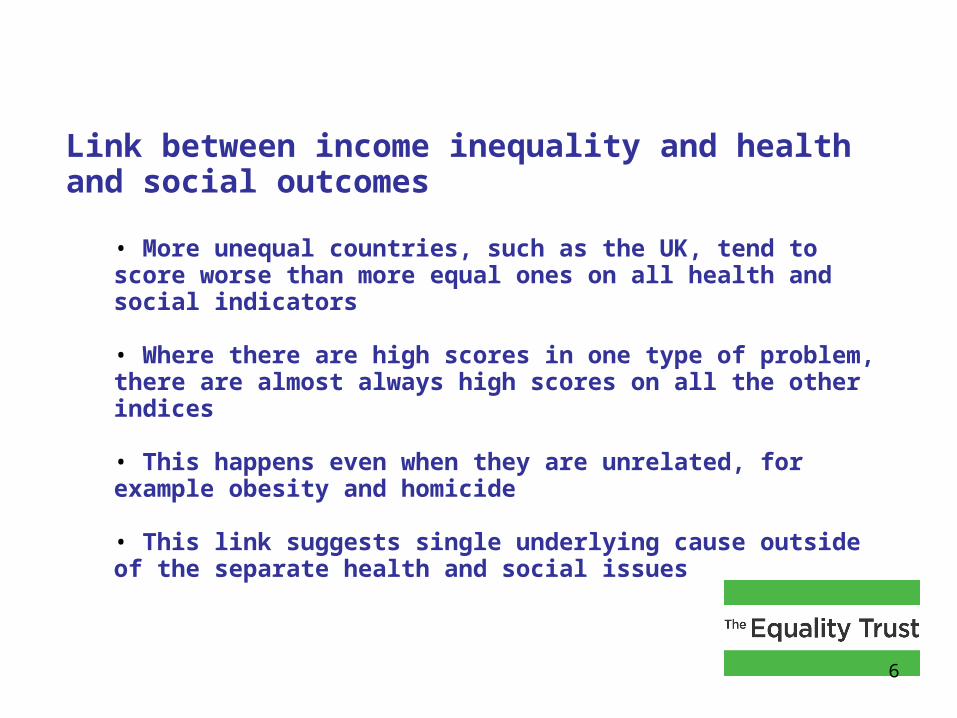
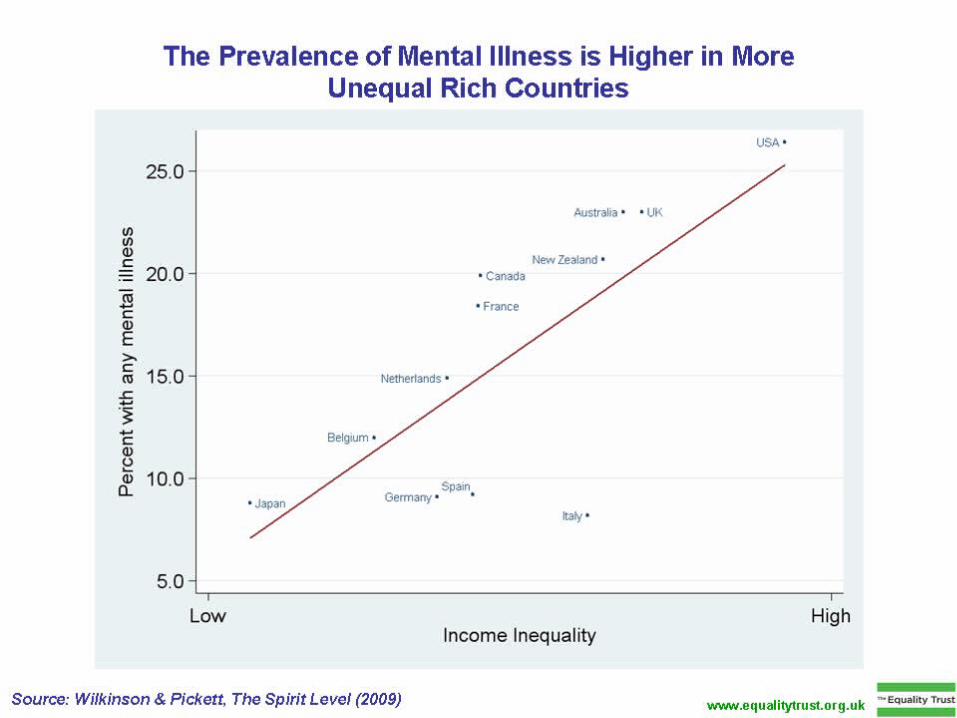
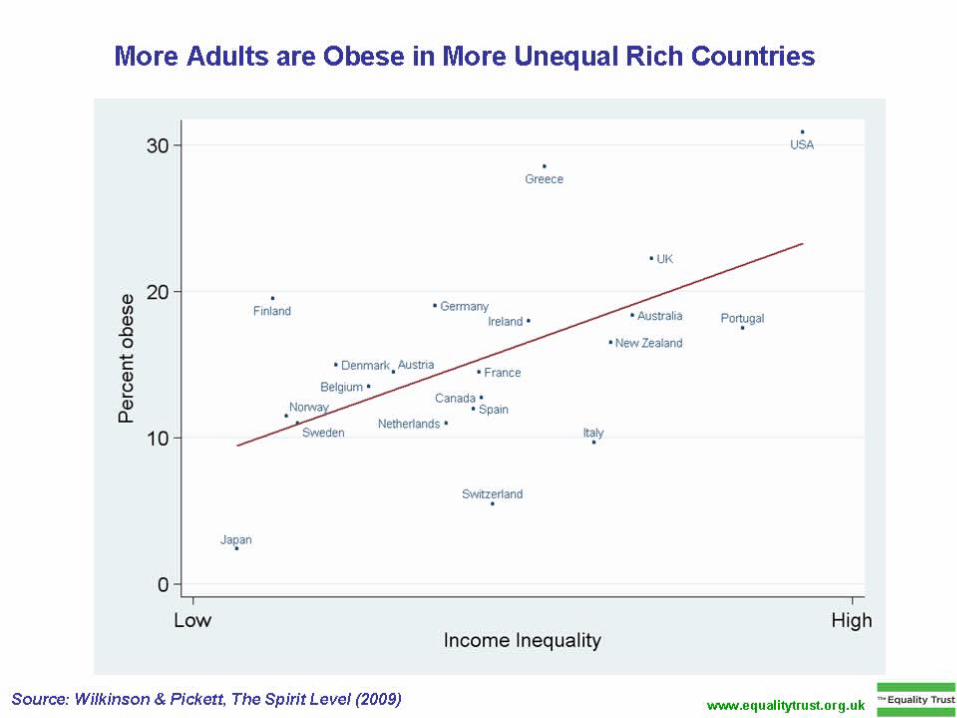
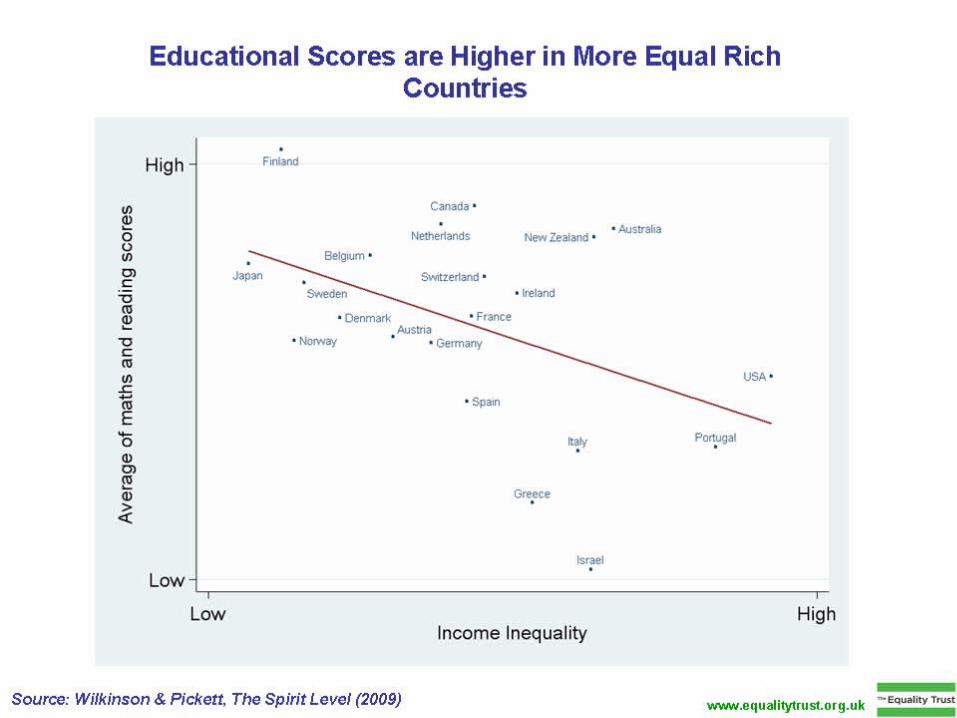
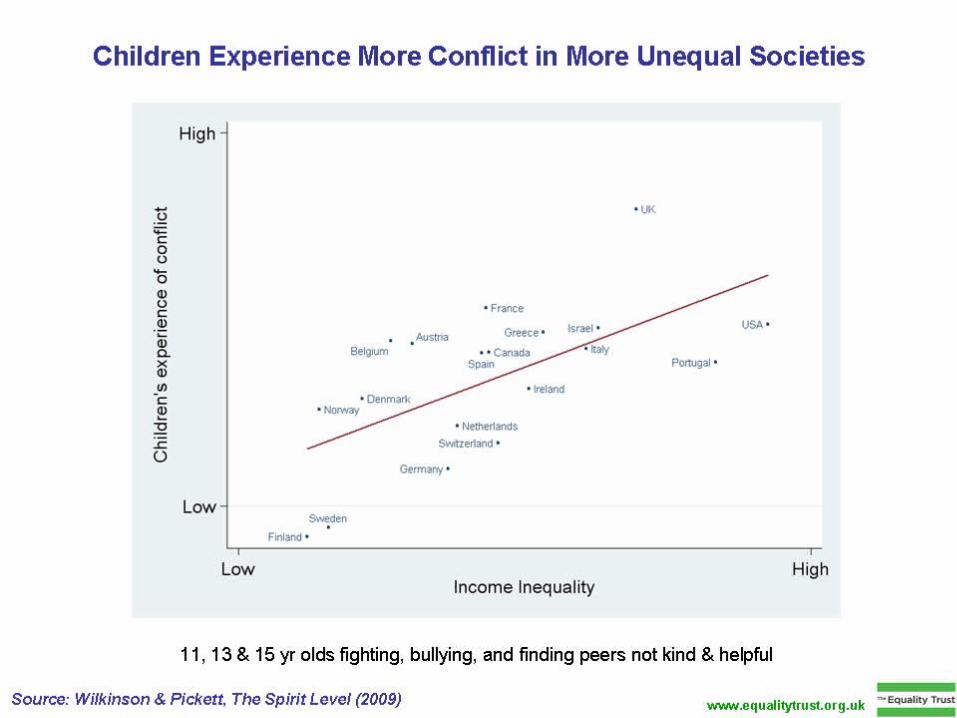
Link between income inequality and health and social outcomes
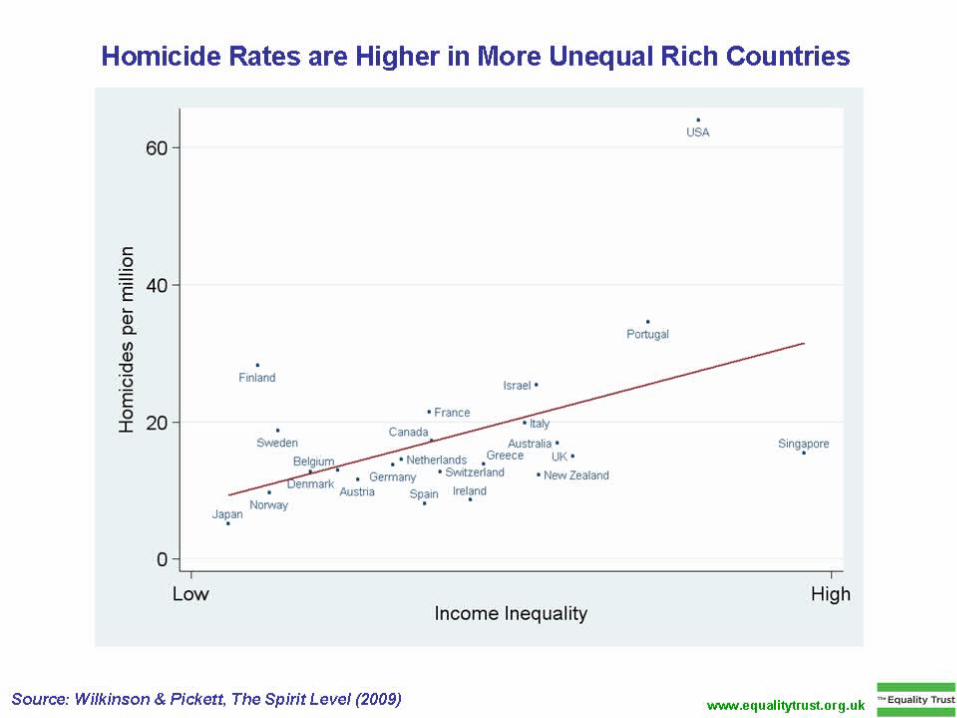
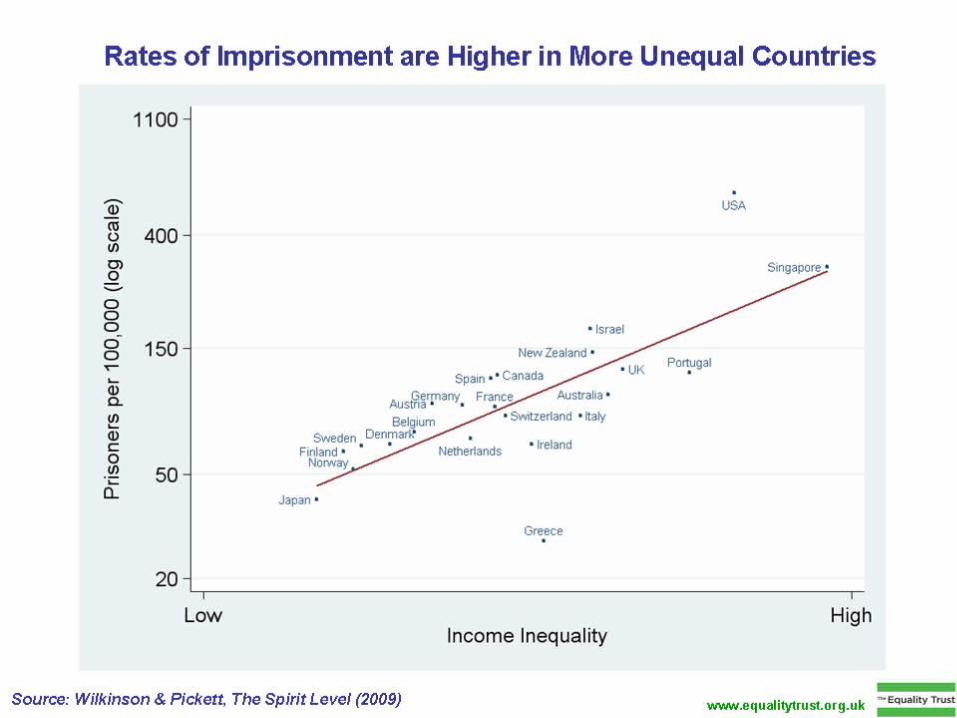
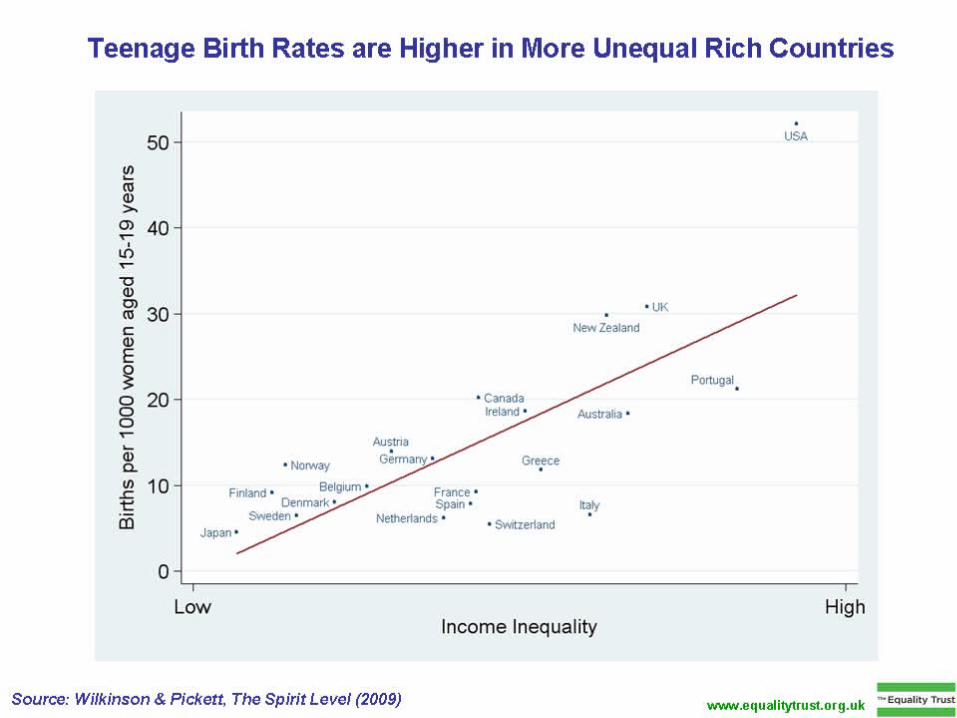
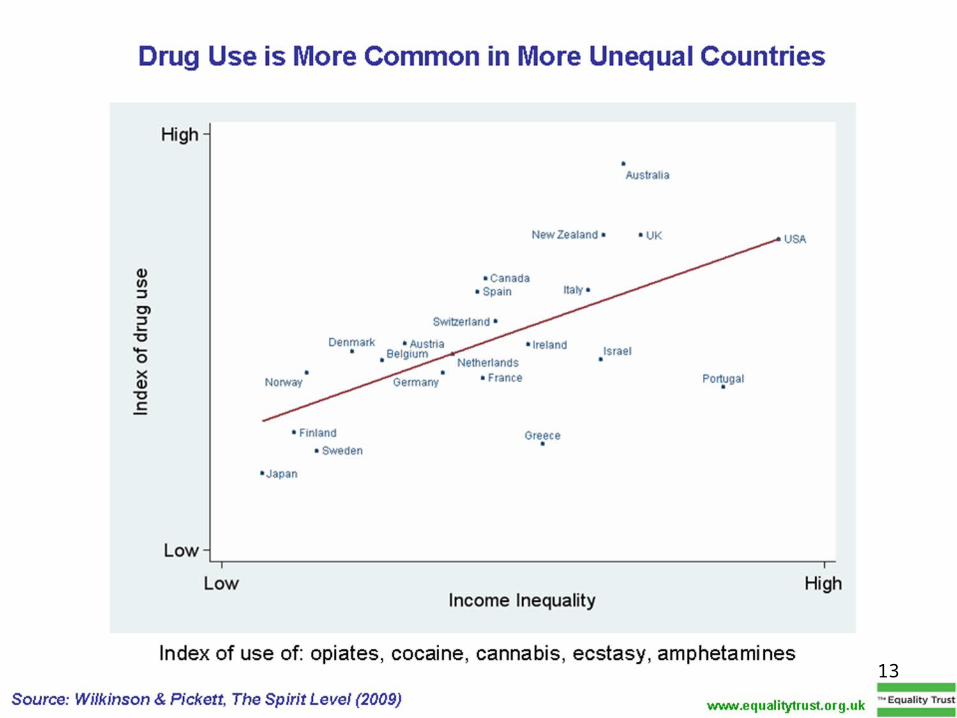
• More unequal countries, such as the UK, tend to score worse than more equal ones on all health and social indicators
• Where there are high scores in one type of problem, there are almost always high scores on all the other indices
• This happens even when they are unrelated, for example obesity and homicide
• This link suggests single underlying cause outside of the separate health and social issues
6
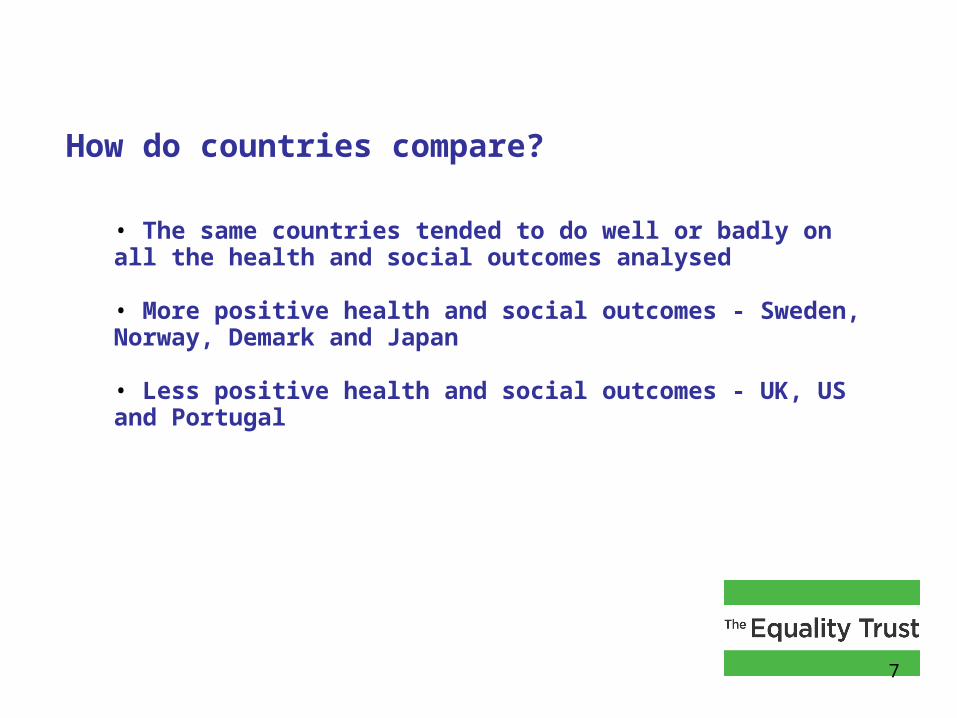
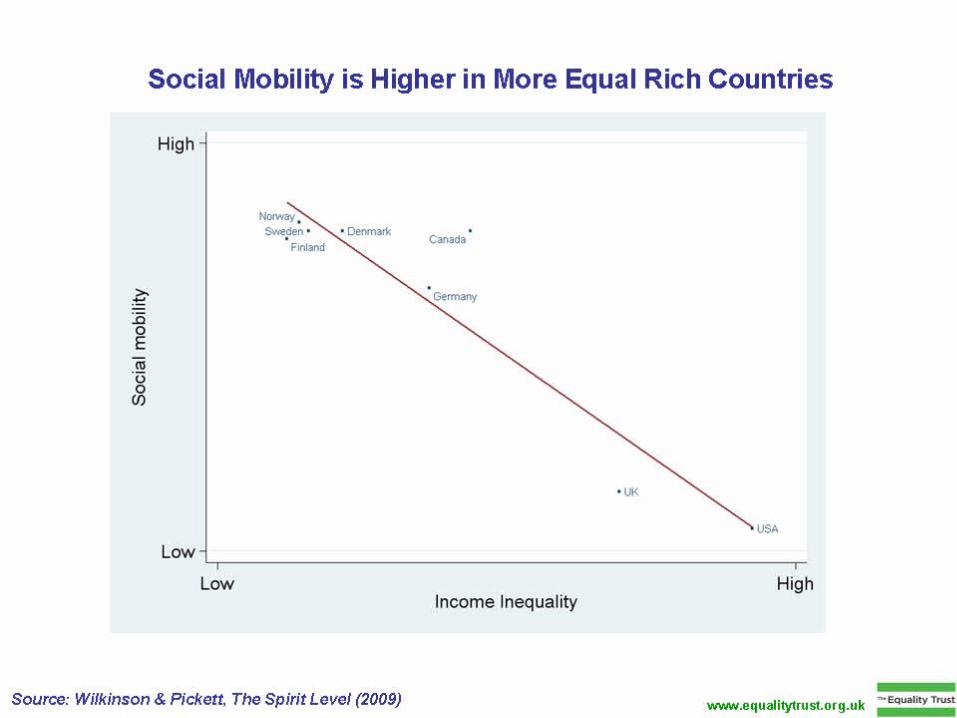
How do countries compare?
• The same countries tended to do well or badly on all the health and social outcomes analysed
• More positive health and social outcomes - Sweden, Norway, Demark and Japan
• Less positive health and social outcomes - UK, US and Portugal
7
13
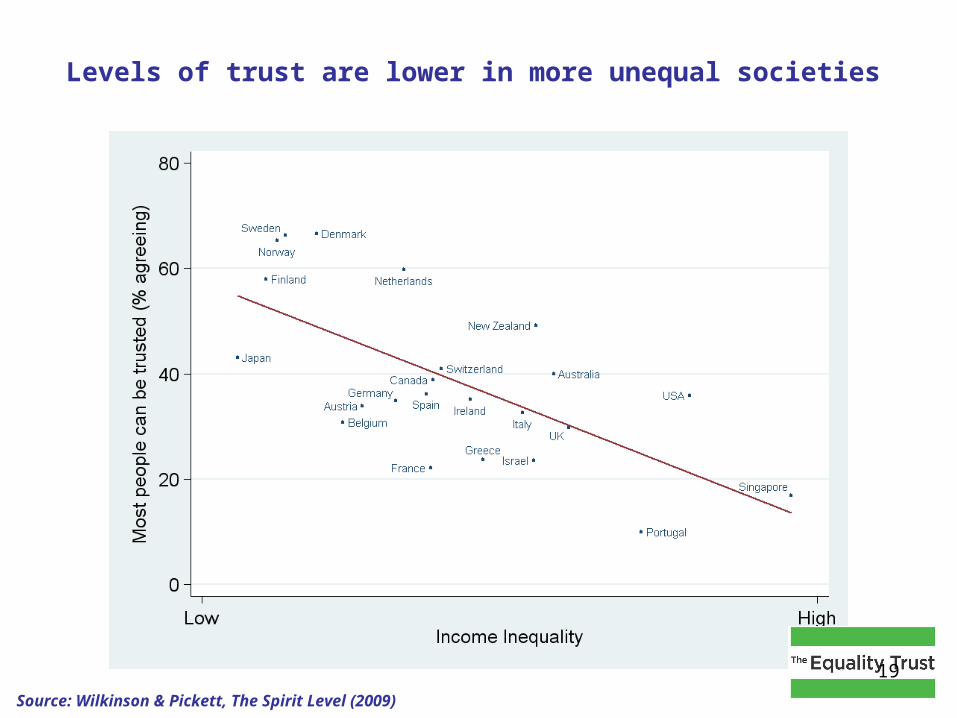
Levels of trust are lower in more unequal societies
Source: Wilkinson & Pickett, The Spirit Level (2009)
19
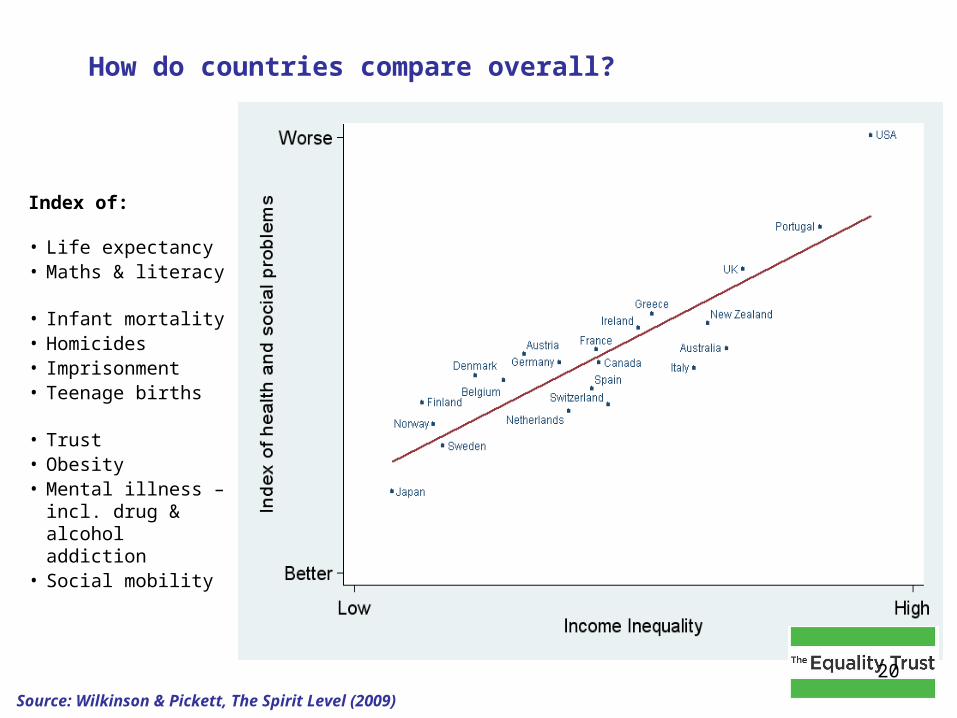
Index of: • Life expectancy• Maths & literacy • Infant mortality• Homicides• Imprisonment• Teenage births • Trust• Obesity• Mental illness – incl.
drug & alcohol addiction
• Social mobility
How do countries compare overall?
Source: Wilkinson & Pickett, The Spirit Level (2009)
20
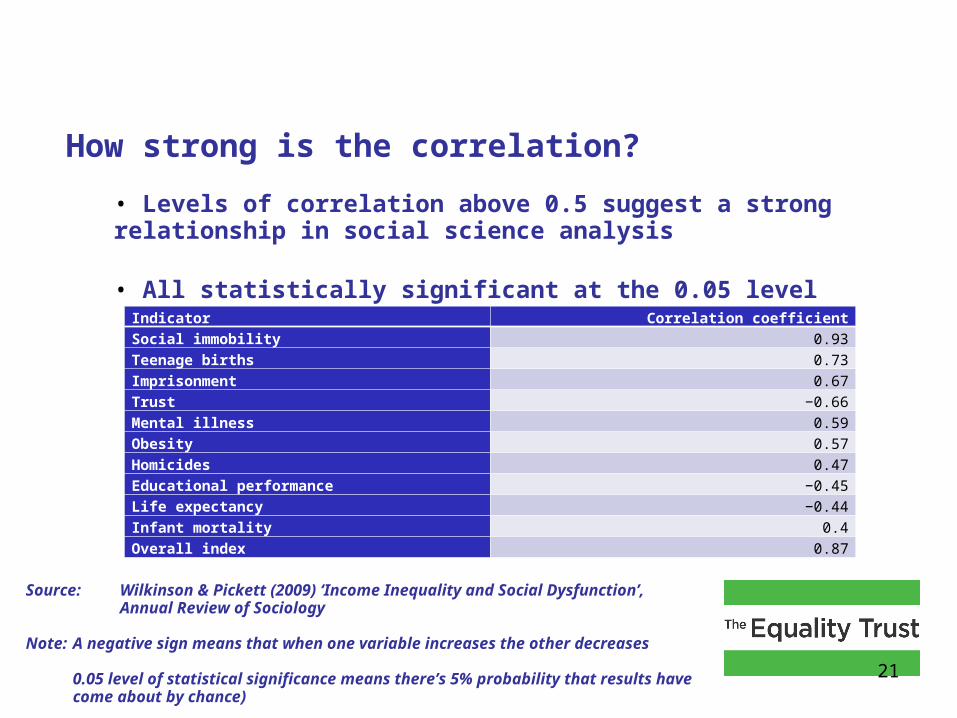
How strong is the correlation?
• Levels of correlation above 0.5 suggest a strong relationship in social science analysis
• All statistically significant at the 0.05 levelIndicator Correlation coefficient
Social immobility 0.93
Teenage births 0.73
Imprisonment 0.67
Trust −0.66
Mental illness 0.59
Obesity 0.57
Homicides 0.47
Educational performance −0.45
Life expectancy −0.44
Infant mortality 0.4
Overall index 0.87
Source: Wilkinson & Pickett (2009) ‘Income Inequality and Social Dysfunction’, Annual Review of Sociology
Note: A negative sign means that when one variable increases the other decreases
0.05 level of statistical significance means there’s 5% probability that results have come about by chance)
21
Is this a causal explanation?
• Are there other explanations?
Average income
Country size
Ethnic homogeneity
22
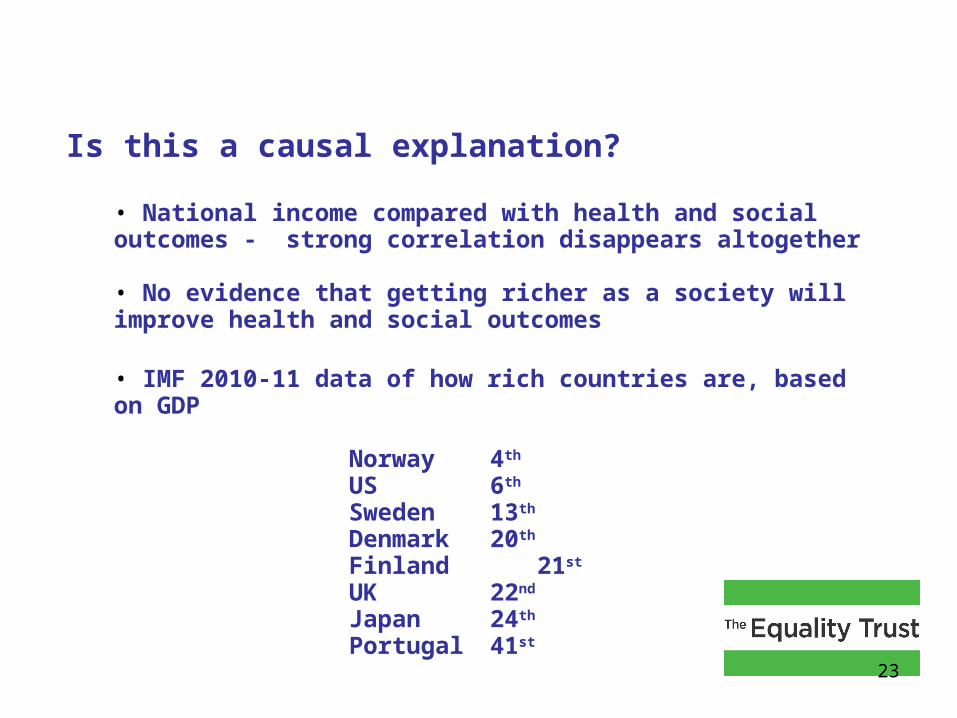
Is this a causal explanation?
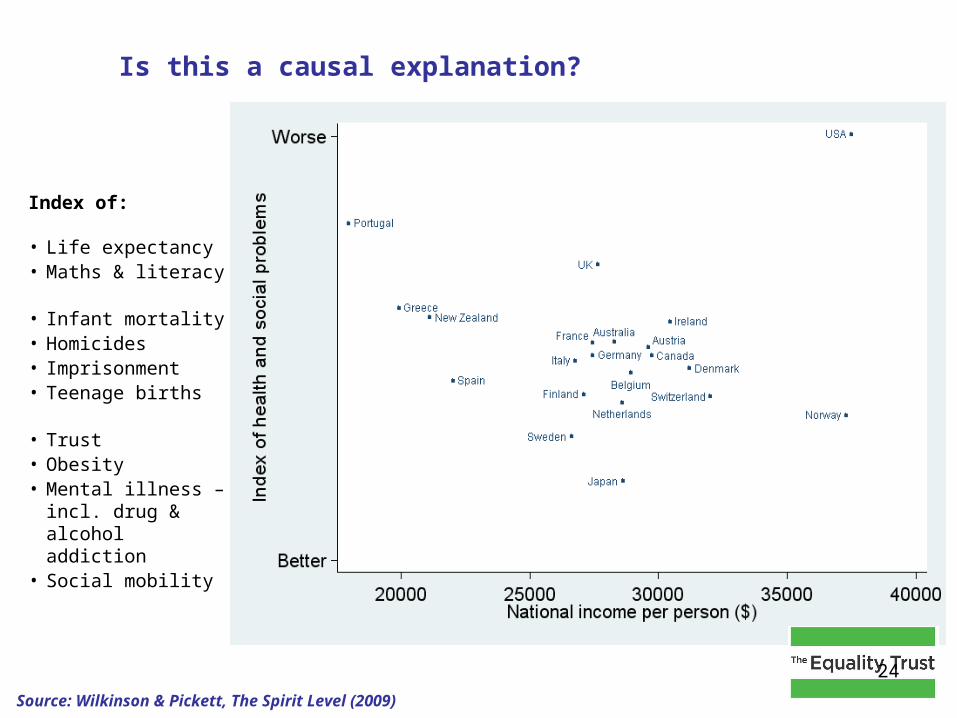
• National income compared with health and social outcomes - strong correlation disappears altogether
• No evidence that getting richer as a society will improve health and social outcomes
• IMF 2010-11 data of how rich countries are, based on GDP
Norway 4th US 6th
Sweden 13th Denmark 20th Finland 21st
UK 22nd Japan 24th Portugal 41st
23
Is this a causal explanation?
Index of: • Life expectancy• Maths & literacy • Infant mortality• Homicides• Imprisonment• Teenage births • Trust• Obesity• Mental illness – incl.
drug & alcohol addiction
• Social mobility
Source: Wilkinson & Pickett, The Spirit Level (2009)
24
Is this a causal explanation?
• Norway, Sweden and Finland – small countries with good health and social outcomes
• Singapore and Portugal – small countries with poor health and social outcomes
• Countries with the largest populations are the US and Japan - at opposite ends of the inequality spectrum
25
Is this a causal explanation?
• Very similar proportion of the population of Sweden and the US are foreign born
• Spain has larger migrant population than Portugal
• Spain is more equal and has better health and social outcomes than Portugal
• Ethnic divisions become important when they serve as markers of social status attracting stigmatisation, prejudice and discrimination
26
Is this a causal explanation?
• No other equally compelling explanation than income inequality
27
What can we do?
Income differences before tax
• Increase company democracy - employee ownership
• Promote more directors from within companies
• Put employees on remuneration committees
• Legislate for reporting of pay ratios and policies
• Legislate for phased reduction in pay ratios
• Legislate for quotas to redress inequality
28
What can we do?
Taxes & benefits
• Stop tax evasion and invest in welfare provision
• End tax havens and invest in welfare provision
• Make taxation progressive
• Provide welfare benefits on universal basis
29
Myths about greater equality
Reduction in inequality will affect growth
• World Intellectual Patent Organization
patents per capita for Portugal = 0.6 and for the US = 1.0patents per capita for Japan = 7.8 and for Sweden = 30.1
• Benefits of economic growth limited for developed countries - diminishing returns from growth
30
Myths about greater equality
High pay produces better returns
• High director & CEO pay positively correlates with poor governance, resulting in poorer company performance (High Pay Commission)
• Narrower pay dispersion positively correlates with improved organisation performance (Hutton Review of Fair Pay in the Public Sector)
• Fair pay equates to engaged staff, equates to greater revenue generation (A Third of a Percent: The gulf between employees’ pay and chief executives’ pay and the adverse impacts on UK plc)
31
What’s the future looking like?
• Shifts towards a knowledge- and service-based economy, and increases in high-paid and low-paid jobs at the expense of those in the middle, will continue to 2020
• Changes in employment structure will contribute to an increase in poverty rates by 2020
• Both the relative poverty rate and the absolute poverty rate will increase
• Projected changes in employment structure will also lead to increased inequality in net household incomes between 2010 and 2020, with income growth projected to be higher at the top than at the bottom
Brewer M et al (May 2012) Poverty and Inequality in 2020: impact of changes in the structure of employment Joseph Rowntree Foundation
32
Why, when the evidence is so strong, is there little change?
• 2009 Professor Richard Wilkinson presents The Spirit Level findings to senior policy-makers - HO, CO, DH, PM’s Private Office
• Acknowledged presentation was “compelling and convincing”
• Recognition that economic inequality causes many of the social problems government tackles
• Acceptance that economic inequality socially damaging, not translated into significant policy-making
• Career incentives to silencing some evidence to avoid challenging dominant narratives
• “ … there is some systematic distortion of the useof evidence in ways that suit the interests of the powerful social groups that constitute the Britishstate.”
Stevens A (2010) Telling policy stories: an ethnographic study of the use of evidence in policy–making in the UK Journal of Social Policy
33
Useful web links
•Rebuttal of critics:www.equalitytrust.org.uk/resources/other/response-to-
questions
•Audio file of discussion with the authors: www.guardian.co.uk/books/audio/2009/mar/05/the-spirit-level?popup=true
•Richard Wilkinson TED talk: www.ted.com/talks/lang/en/richard_wilkinson.html
•Does Income Inequality Cause Health and Social Problems? www.jrf.org.uk/publications/income-inequality-health-social-problems
•The shackled runner: time to rethink positive discrimination? http://wes.sagepub.com/content/24/4/728.full.pdf+html
•Understanding attitudes to tackling economicinequality: www.jrf.org.uk/publications/attitudes-economic-inequality
34
Useful web links
•Islington Fairness Commission report: www.islington.gov.uk/DownloadableDocuments/CouncilandDemocracy/Pdf/fairness_commission/IFC_final_report_closing_the_gap.pdf
•Society for the Study of Economic Inequality: www.ecineq.org
•Commission on Living Standards: www.livingstandards.org
•High Pay Commission: www.highpaycommission.co.uk
•Inequalities: inequalitiesblog.wordpress.com
•Hutton Review of Fair Pay in the Public Sector:www.hm-treasury.gov.uk/indreview_willhutton_fairpay.htm
•Poverty and Inequality in 2020: impact of changes in the structure of employment: www.jrf.org.uk/sites/files/jrf/employment-inequality-income-full.pdf
•A Third of a Percent: www.onesociety.org.uk
35
What we looked at
• The Spirit Level
• Link between income inequality and health and social outcomes
• How do countries compare?
• Is it a causal explanation?
• What can be done?
• Myths about greater equality
36
The Spirit Level findings and why they matter
Redistribution of wealth -a question of social power
21st May 2012
Sue Christoforouwww.equalitytrust.org.uk
37