the spectroscopy and h-band imaging of virgo cluster ... department of physics and astronomy, new...
TRANSCRIPT
The Spectroscopy and H-band Imaging of Virgo Cluster Galaxies (SHIVir) Survey:Scaling Relations and the Stellar-to-total Mass Relation
Nathalie N.-Q. Ouellette1, Stéphane Courteau1, Jon A. Holtzman2, Aaron A. Dutton3, Michele Cappellari4, Julianne J. Dalcanton5,Michael McDonald6, Joel C. Roediger7, James E. Taylor8, R. Brent Tully9, Patrick Côté7, Laura Ferrarese7, and Eric W. Peng10,11
1 Department of Physics, Engineering Physics and Astronomy, Queen’s University, Kingston, ON K7L 3N6, Canada2 Department of Physics and Astronomy, New Mexico State University, Las Cruces, NM, 88003-8001, USA
3 Department of Physics, New York University Abu Dhabi, Abu Dhabi, United Arab Emirates4 Sub-department of Astrophysics, Department of Physics, University of Oxford, Denys Wilkinson Building, Keble Road, Oxford, OX1 3RH, UK
5 Department of Astronomy, University of Washington, Seattle, WA, 98195, USA6MIT Kavli Institute for Astrophysics and Space Research, MIT, Cambridge, MA, 02139, USA7 Herzberg Institute of Astrophysics, National Research Council, Victoria, BC, V9E 2E7, Canada
8 Department of Physics and Astronomy, University of Waterloo, Waterloo, ON, N2L 3G1, Canada9 Institute for Astronomy, University of Hawaii, 2680 Woodlawn Drive, Honolulu, HI 96822-1839, USA
10 Department of Astronomy, Peking University, Beijing 100871, China11 Kavli Institute for Astronomy and Astrophysics, Peking University, Beijing 100871, China
Received 2016 August 16; revised 2017 April 24; accepted 2017 May 20; published 2017 July 5
Abstract
We present parameter distributions and fundamental scaling relations for 190 Virgo cluster galaxies in the SHIVirsurvey. The distribution of galaxy velocities is bimodal about Vcirc∼125 km s−1, hinting at the existence ofdynamically unstable modes in the inner regions of galaxies. An analysis of the Tully-Fisher relation (TFR) of late-type galaxies (LTGs) and the fundamental plane (FP) of early-type galaxies (ETGs) is presented, yielding acompendium of galaxy scaling relations. The slope and zero-point of the Virgo TFR match those of field galaxies,while scatter differences likely reflect distinct evolutionary histories. The velocities minimizing scatter for the TFRand FP are measured at large apertures where the baryonic fraction becomes subdominant. While TFR residualsremain independent of any galaxy parameters, FP residuals (i.e., the FP “tilt”) correlate strongly with thedynamical-to-stellar mass ratio, yielding stringent galaxy formation constraints. We construct a stellar-to-total massrelation (STMR) for ETGs and LTGs and find linear but distinct trends over the rangeM*=108–11Me. Stellar-to-halo mass relations (SHMRs), which probe the extended dark matter halo, can be scaled down to masses estimatedwithin the optical radius, showing a tight match with the Virgo STMR at low masses; possibly inadequate haloabundance matching prescriptions and broad radial scalings complicate this comparison at all masses. While ETGsappear to be more compact than LTGs of the same stellar mass in projected space, their mass-size relations inphysical space are identical. The trends reported here may soon be validated through well-resolved numericalsimulations.
Key words: galaxies: clusters: individual (Virgo) – galaxies: elliptical and lenticular, cD – galaxies: fundamentalparameters – galaxies: kinematics and dynamics – galaxies: spiral – surveys
1. Introduction
A major quest of modern astrophysics is to understand theorigin of the broad ensemble of observed galaxy properties.The last decade has heralded a new era of large galaxy surveysdesigned for this (SDSS, Abazajian et al. 2003; SAURON,Bacon et al. 2001; ATLAS3D, Cappellari et al. 2011a;CALIFA, Sánchez et al. 2012; SAMI, Croom et al. 2012;MaNGA, Bundy et al. 2015; and others) and will provide forhundreds and thousands of galaxies at a time the high-qualityspectrophotometric data required to understand the physicaldrivers of galaxy formation and evolution in a statisticalmanner. Scaling relations from parameters extracted for thesegalaxies, such as the velocity–luminosity or Tully-Fisherrelation (hereafter TFR, Tully & Fisher 1977, Courteauet al. 2007a), the Faber-Jackson relation (Faber & Jack-son 1976), the fundamental plane of galaxies (hereafter FP,Djorgovski & Davis 1987; Dressler et al. 1987; Benderet al. 1992; Bernardi et al. 2003; Cappellari et al. 2006; LaBarbera et al. 2008; Cappellari et al. 2013b), and others haveprovided empirical evidence of the physical laws governingstructure formation in our universe (see Cappellari 2016 for areview).
The scaling relation parameters and their scatter depend on anumber of factors: structural parameter definitions (Courteau1996, 1997), environment (Vogt 1995; Mocz et al. 2012),fitting algorithms (Courteau et al. 2007a; Avila-Reeseet al. 2008; Hall et al. 2012), redshift and peculiar motions(Willick et al. 1997; Willick & Strauss 1998; FernándezLorenzo et al. 2011; Miller et al. 2011), projection effects andbandpass (Aaronson et al. 1986; Hall et al. 2012), morphology(Courteau et al. 2007a; Tollerud et al. 2011), stellar populations(Cappellari et al. 2006; Falcón-Barroso et al. 2011b; Cappellariet al. 2013a), and metallicity (Woo et al. 2008), to name a few.Furthermore, despite recent progress, galaxy formation modelsstill struggle with basic relations of galaxies, including colordependencies and structural bimodalities (Dekel & Birn-boim 2006; McDonald et al. 2009b), angular momentumcontent (Fall & Romanowsky 2013; Obreschkow & Glazeb-rook 2014), variations in the stellar initial mass function (IMF)(Dutton et al. 2011; Cappellari et al. 2012; Smith 2014), centralversus satellite distributions (Rodríguez-Puebla et al. 2015),and more.Fundamental as they may be, dynamical tracers of structure,
such as the circular velocity function and stellar-to-halo mass
The Astrophysical Journal, 843:74 (27pp), 2017 July 1 https://doi.org/10.3847/1538-4357/aa74b1© 2017. The American Astronomical Society. All rights reserved.
1

relations (SHMR), still show acute data-model discrepancies.For instance, the SHMR, which probes the efficiency of starformation processes within certain dark matter halos(Leauthaud et al. 2012; Grossauer et al. 2015; Rodríguez-Puebla et al. 2015), is shown to peak for L* galaxies and todecline for both larger and smaller halos as a resultofmechanisms such as feedback from supernovae and super-massive black holes, halo strangulation, andram pressurestripping from the cluster and group environments. However,simulation-based SHMRs are notoriously inaccurate, especiallyat the low- and high-mass ends, because oferroneous modelassumptions such as those involving feedback models andother radiative mechanisms (Sawala et al. 2015) as well asproblematic data-model comparisons (Trujillo-Gomez et al.2011; Klypin et al. 2015). Tremendous gains in the calibrationand study of the SHMR and other galaxy scaling relationscould be made if homogeneous, deep, dynamical compilationsof complete (i.e., volume-limited) galaxy samples wereavailable, in particular in the low-mass regime of galaxybuilding blocks. For instance, the combination of photome-trically and spectroscopically determined galaxy metrics hasyielded stringent tests of ΛCDM-motivated galaxy formationmodels through comparisons with observed velocity-size-luminosity relations of galaxies (Dutton et al. 2011; Trujillo-Gomez et al. 2011; Cappellari et al. 2013a; Dutton et al. 2013;Norris et al. 2014; Obreschkow & Glazebrook 2014; Bekeraitéet al. 2016), but these still fail to capture the full range ofgalaxy properties in a complete, homogeneous manner. Weattempt to overcome this predicament with a multi-facetedphotometric and spectroscopic survey of the Virgo cluster, andpresent here the first results of the spectroscopic component ofour ongoing “Spectroscopy and H-band Imaging of the Virgocluster” (SHIVir) survey.
The Virgo cluster is an ideal laboratory for measuring andcharacterizing galaxy scaling relations because ofits proximity,richness, diverse galaxy population, reliable completeness, andextensive ancillary data. While dynamical tracers, such as H Ior Hα, may be truncated in galaxy disks, inner dark matterhalos are mostly unaffected by cluster interactions (as verifiedby comparable field and cluster TFRs). Thus, globally relevantconclusions can be reached by studying Virgo cluster galaxies(hereafter VCGs) and contrasted against similar investigationsof field galaxies. Other extensive surveys of the Virgo clusterexist, most notably the Canada–France–Hawaii Telescope’s“Next Generation Virgo cluster Survey” (NGVS, Ferrareseet al. 2012). SHIVir is however unique for its exploitation ofwide-field optical and infrared imaging as well as optical long-slit spectroscopy over a wide areal coverage of the Virgocluster. Thanks to its complement of deep optical imaging,from the Sloan Digital Sky Survey (SDSS)and near-infraredphotometry, collected mostly by ourselves (see Section 2), for arepresentative sampling of the Virgo cluster, SHIVir’s imagingprovides a broad census of galaxy stellar masses, ages, andmetallicities.12 The photometric component of SHIVir hasenabled the confirmation and/or discovery of structuralbimodalities within the Virgo population and other environ-ments (McDonald et al. 2009b), the ubiquity of stellar disks inearly-type galaxies (McDonald et al. 2011), stellar populationgradients and their connection with formation models of galaxybulges and disks (Roediger et al. 2011a, 2011b), stellar radial
migrations in Virgo disks (Roediger et al. 2012), and a detailedstudy of stellar mass-to-light versus color transformations(Roediger & Courteau 2015).The spectroscopic component of the SHIVir survey provides
critical data, which naturally complement a photometric survey,for the detailed investigation of galaxy structure and evolution.For instance, as one of the main drivers of galaxy evolution(Courteau et al. 2014; Cappellari 2016), a galaxy’s dynamicalmass requires that it be measured with well-resolved spectro-scopic mapping over its projected surface (or at least majoraxis). The latter then provides the rotational and dispersionprofiles required to link mass and light profiles and assess theirdependence on stellar populations and environment. Scalingrelations based on a dynamical tracer can then be constructed.Spectra are also most valuable for the determination of clustermembership and peculiar motions; for the Virgo cluster, theformer was previously assessed by others (Binggeliet al. 1985),13 and we are not concerned with cosmic flowstudies in this paper (cf. Tully & Shaya 1984; Lee et al. 2014).Because our program targets a broad range of morphologicaltypes for VCGs, we are able to combine dynamical tracers forlate- and early-type galaxies (hereafter LTG and ETG,respectively) to enable a direct, unique calibration of stellar-to-total mass relations (hereafter STMR; not to be confusedwith the SHMR) in a single environment for the first time.14
This paper, which presents the dynamical component of theSHIVir survey, is organized as follows. In Section 2weintroduce the spectroscopic catalog and data set for the SHIVirsurvey. The construction of surface brightness (SB) anddynamical distributions/bimodalities and scaling relations(TFR, FP, STMR, stellar mass TFR, mass-size relation, anddark-matter-size relation) is presented in Section 3. Conclu-sions and thoughts about future investigations are presented inSection 4.
2. Data
The SHIVir survey draws its sample from the magnitude-limited Virgo Cluster Catalog (Binggeli et al. 1985, hereafterVCC) containing 2096 galaxies in a 140 deg2 area (∼11.7Mpc2) around central galaxies M49 and M87. The full SHIVirsample contains 742 VCGs for which g-, r-, and i-band imagesare available in the SDSS 6th Data Release (Adelman-McCarthy et al. 2008). A representative subsample of 286galaxies from the SDSS subsample of VCGs were imaged at H-band (McDonald et al. 2009b). The full SHIVir catalog and theH-band subsample were bothconstructed to span the entirerange of galaxy morphologies. Each morphological type wasalso sampled to maintain its proportion within the entire Virgocluster, see Figure2 of McDonald et al. (2009b). The SHIVirsample is thus meant to be representative of the Virgo cluster.The SHIVir photometric catalog is presented in McDonaldet al. (2009b) (H-band imaging) and Roediger et al.(2011a, 2011b) (multi-band imaging and stellar populationanalysis); werefer to these papers for a detailed description ofthe catalog selection. The SHIVir photometric data areavailable at http://www.astro.queensu.ca/virgo.The construction of unbiased scaling relations relies in part
on non-parametric assessments of galaxy structure. Parametric
12 Short of blue spectra for all VCGs, the NIR photometry alleviates the age-metallicity degeneracy endemic to optical imaging.
13 See also the extensive membership revision by Ferrarese et al. (2016).14 Other SHMRs based on heterogenous databases for varied environmentshave been presented before (e.g., Dutton et al. 2011; Trujillo-Gomezet al. 2011). We return to themin Section 3.5.
2
The Astrophysical Journal, 843:74 (27pp), 2017 July 1 Ouellette et al.

modeling often rests on arbitrary (and internally covariant)multiparameter fitting functions. Our nominal set of non-parametric metrics for galaxies includes local or integratedluminosity L, colors, stellar masses M*, effective or isophotal
15
SB, radii R, and maximum circular velocity Vcirc fromabsorption or emission spectra (Courteau 1997; Courteauet al. 2007a, 2014). Photometrically determined values, suchas effective or disk scale radius (measured along the semimajoraxis) and effective SB, were computed by McDonald et al.(2009b) using isophotal fitting to produce SB profiles fromwhich the quantities were measured. All relevant photometricvalues are corrected for line-of-sight dust extinction usingvalues from Schlafly & Finkbeiner (2011). Throughout thiswork, i-band photometry is favored. This redder band is lessaffected by dust attenuation, and it allows us to include a largersample of galaxies in our study, since all 742 SHIVir galaxieshave i-band photometry available, whereas only 286 VCGshave H-band photometry. Radial, luminosity, and inclinationparameters are computed via isophotal fitting of galaxy images(Courteau 1996). Radii and SB measurements for LTGs arecorrected for inclination-dependent extinction using the methodof Tully et al. (1998) and Hall et al. (2012). All photometricparameters used for the scaling relations presented in this workare from the photometric catalog described here.
In order to directly calibrate the STMR, galaxy stellar massesand other photometrically derived parameters must becontrasted against dynamical masses. While certain directmeasurements, such as weak gravitational lensing and satellitekinematics, allow for halo mass measurements out to largeradii, they involve complex and approximate methods requiringspecial circumstances (e.g., the presence of a lensed galaxy or asatellite). On smaller scales, e.g., within the optical radius of agalaxy, the dynamical mass of most galaxies can be estimatedquite accurately with circular velocity measurements (rotationalor dispersion; see Courteau et al. 2014 for a review). Providingaccurate, well-defined dynamical masses for as many VCGs aspossible is one of SHIVir’s main goals.
The literature abounds with various, somewhat heteroge-neous, mass estimates for VCGs given widely differentmeasurement techniques. Consequently, we embarked in2008 on a long-term program to acquire our own homogeneouslong-slit spectra of VCGs on 4–8 m class telescopes. Deeplong-slit spectroscopy was acquired for 138 SHIVir galaxies,including some (40 VCGs) by the ACSVCS (Côté et al. 2004)team using both the 2.1 m and the Mayall 4 m telescopes at theKitt Peak National Observatory (KPNO) using the Ritchey-Chrétien Focus Spectrograph. The rest (98 VCGs) wereobserved by us over the period of 2008–2015 using thefollowing instruments: the Ritchey-Chrétien FocusSpectrograph (KPC-007 grating) on the Mayall 4.0 m telescopeat the KPNO, the Dual Imaging Spectrograph (B1200/R1200grating) on the ARC 3.5 m telescope at the Apache PointObservatory (APO), and the Gemini Multi-ObjectSpectrograph (long-slit mode, B1200 grating) on the Gemini-South 8.2 m telescope. The KPNO spectra covered thewavelength range 3900–5430 Å, with a spectral resolution ofR∼2500. The APO spectra took advantage of the dual blueand red channels with wavelength coverages of 4160–5420 Åand 6015–7200 Å, with spectral resolutions of R∼2000 andR∼4000, respectively. The Gemini spectra have a wavelength
coverage of 4050–5500 Å with a spectral resolution ofR∼3750. The long-slit spectra from KPNO and APO werereduced using a suite of XVISTA routines.16 The Geminispectra were reduced using the Gemini IRAF package. RCextraction typically required S/N/Å>5. The detailed proce-dures for the extraction of dynamical parameters from ourspectra are presented in N.N.Q. Ouellette et al. (2017b, inpreparation). A brief overview is provided below.Dynamics for VCG galaxies are measured from red emission
features (Hα, [NII]) for gas-rich systems and blue absorptionfeatures for gas-poor systems. The SHIVir emission andabsorption spectra are relatively deep, reaching typicallybeyond 2–4 Re (see Figure 1). The red spectra used∼20–30 minuteintegrations per galaxy on 4 m telescopes,while the blue spectra required 1–3 hr per galaxy on 4–8 mtelescopes. Because at least half of the Virgo cluster LTGs arestripped by the cluster environment (Koopmann & Kenney2004), their Hα and H I velocity fields are not as extensive asthose of field galaxies (see Figure 1 for a comparison withCourteau 1997 and Courteau et al. 2000), but they obey thesame velocity-luminosity scaling relations (see Section 3.3).With the added kinematic values taken from reliable literaturesources described in Section 2.3, the presented SHIVir catalogpertains to a total of 190 VCGs. While the original SHIVircatalog was meant to be representative of the entire VCCcatalog, the extensive integration times of our long-slit spectraprevented the steady observations of dwarf galaxies inabsorption (i.e., especially the dwarf ellipticals). Highlyinclined LTGs and ETGs with significant emission weregenerally avoided for cleaner kinematic signatures. Thespectroscopic SHIVir sample is fully described in ourcompanion data paper N.N.Q. Ouellette et al. (2017b, inpreparation).When available, distances (and their uncertainties) to
individual VCGs are taken from Jerjen et al. (2004) andBlakeslee et al. (2009); otherwise, a distance of 16.5 Mpc (Mei
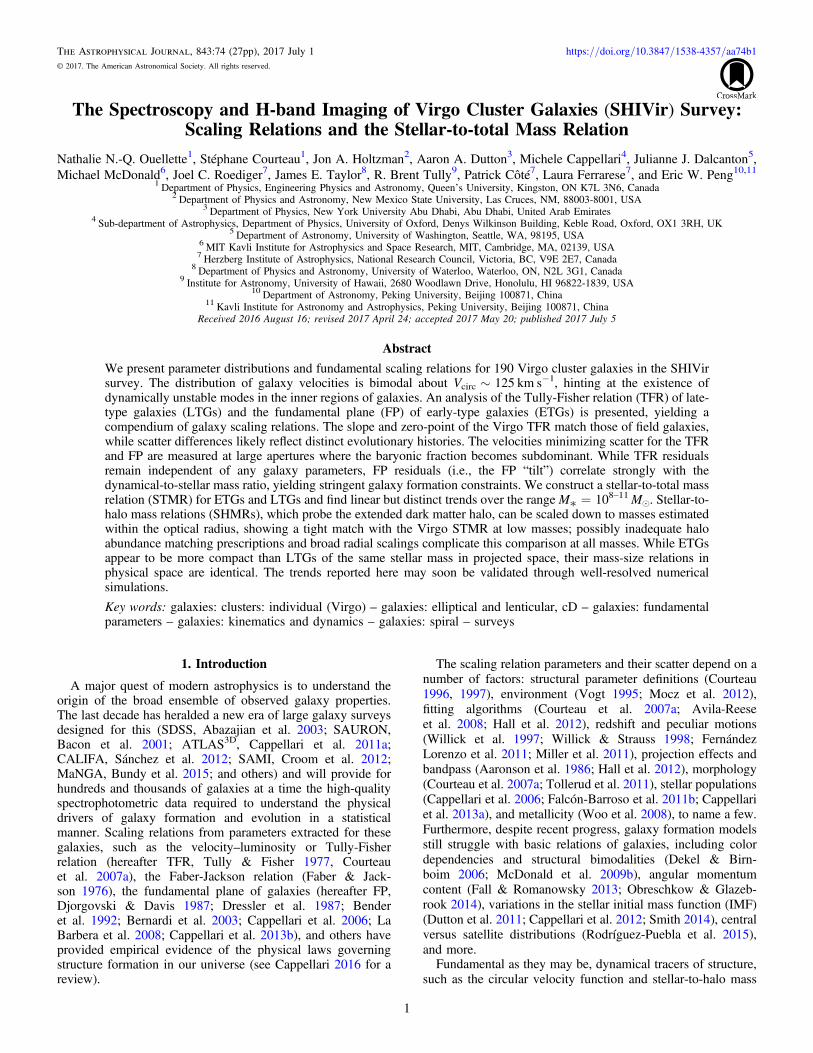
Figure 1. (Left) Histogram of the maximumradial extent of the SHIVir Hαrotation curves used in our TFR analysis normalized by the i-band disk scalelength Rd. Similar data are shown for the field spiral samples of Courteau(1997) and Courteau et al. (2000). (Right) Histogram of the maximumrange ofthe SHIVir velocity dispersion profiles normalized by the i-band effectiveradius Re.
15 Ltot and Re may rely on model-dependent extrapolation of the light profile(growth curve) of a galaxy to infinity or the definition of a galaxy’s edge.
16 XVISTA is maintained by J. Holtzman, see http://astronomy.nmsu.edu/holtz/xvista/index.html for documentation.
3
The Astrophysical Journal, 843:74 (27pp), 2017 July 1 Ouellette et al.
et al. 2007) (with an uncertainty of 15%) is assumed for allother VCGs.
2.1. Rotational Velocity
To construct scaling relations and study the dynamical massof LTGs, their rotational velocities must be extracted. Thewavelength range and resolution of our spectroscopic dataallow the creation of Hα emission rotation curves (RCs) fromwhich rotational velocities can be measured.
The SHIVir rotational velocities are extracted by fitting threeGaussian distributions over the [NII]-Hα-[NII] emissioncomplex. Emission line peaks and uncertainties are computedusing an intensity-weighted centroid method (Courteau 1997).The rotational velocities are all corrected for inclination (notedby a superscript “c”) using the SHIVir photometric estimatesfrom the reddest, and thus least dust-extincted, images. Thetypical velocity scatter from duplicate measurements (whenliterature values were available) is 5–10 km s−1. The con-structed RCs are used to select the velocity measurethatreduces TFR scatter (Courteau 1997) in Section 3.3. Thesemeasurements typically include velocities extracted at isophotalradii, fiducial (e.g., half-light) radii, and metric radii (e.g., inkpc), along the RC. V2.2
i is measured at 2.15 disk scale lengths,which corresponds to the peak rotational velocity of a pureexponential disk (Freeman 1970; Courteau 1997). V23.5
i ismeasured at the isophotal radius, R23.5, corresponding to the i-band 23.5 mag arcsec−2 isophotal level. The RC can also becollapsed spatially for the measurement of intensity-weightedline widths. W20
i is 80% of the total line width area, as definedby Courteau (1997). The V23.5
i velocity metric yields thesmallest TFR scatter (Section 3.3). Vmax
i is measured along amodel fit at the last radial point where the Hα tracer is stilldetected. For that fit, we use the following multiparameter fitfunction (Courteau 1997; see also Bertola et al. 1991):
V R Vx
1
1, 1crit 1
=+ g g
( )( )
( )
where x=Rt/R, γ controls the degree of sharpness of theRCturnover, Vcrit is the asymptotic maximum velocity, and Rt
is the radius at which the transition between the rising and flatparts of the RC occurs. When the RC reaches a flat regime, anaverage of the observed velocities measured at the appropriateradius is taken. In other cases, nominal velocities are takenfrom a model fit at the radii described above.
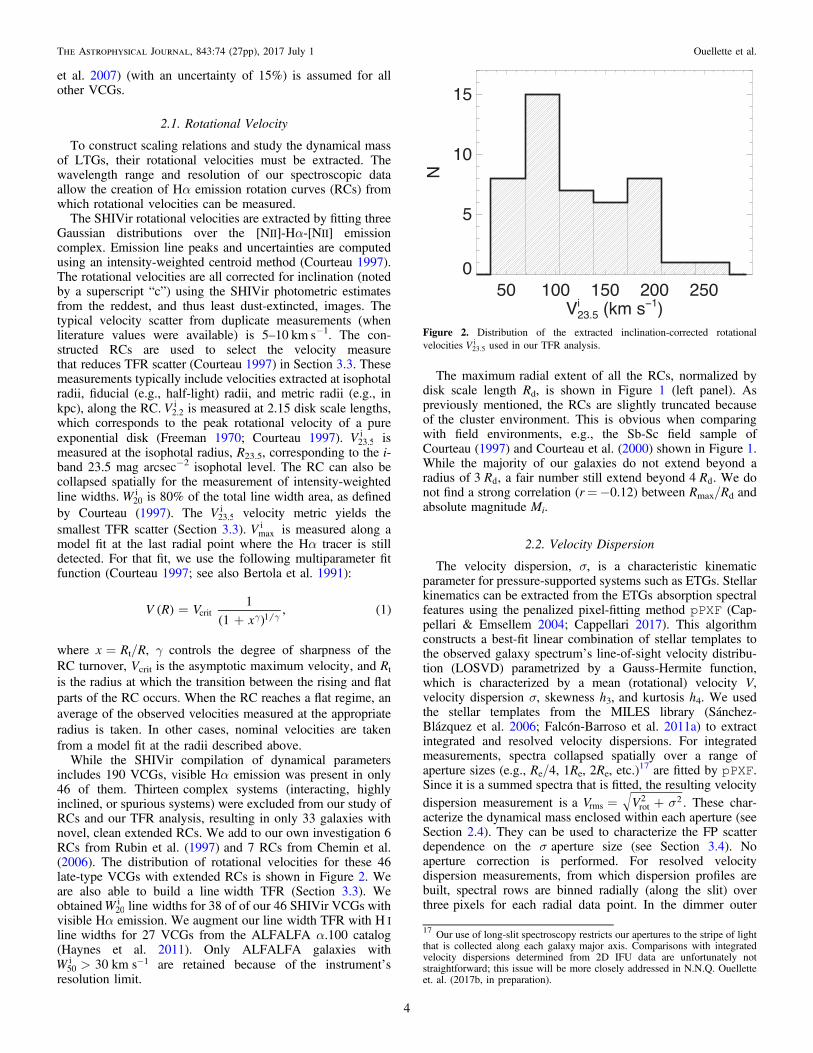
While the SHIVir compilation of dynamical parametersincludes 190 VCGs, visible Hα emission was present in only46 of them. Thirteencomplex systems (interacting, highlyinclined, or spurious systems) were excluded from our study ofRCs and our TFR analysis, resulting in only 33 galaxies withnovel, clean extended RCs. We add to our own investigation 6RCs from Rubin et al. (1997)and 7 RCs from Chemin et al.(2006). The distribution of rotational velocities for these 46late-type VCGs with extended RCs is shown in Figure 2. Weare also able to build a linewidth TFR (Section 3.3). WeobtainedW20
i linewidths for 38 of of our 46 SHIVir VCGs withvisible Hα emission. We augment our linewidth TFR with H Ilinewidths for 27 VCGs from the ALFALFA α.100 catalog(Haynes et al. 2011). Only ALFALFA galaxies withW 30 km s50
i 1> - are retained because ofthe instrument’sresolution limit.
The maximumradial extent of all the RCs, normalized bydisk scale length Rd, is shown in Figure 1 (left panel). Aspreviously mentioned, the RCs are slightly truncated becauseofthe cluster environment. This is obvious when comparingwith field environments, e.g., the Sb-Sc field sample ofCourteau (1997) and Courteau et al. (2000) shown in Figure 1.While the majority of our galaxies do not extend beyond aradius of R3 d, a fair number still extend beyond R4 d. We donot find a strong correlation (r=−0.12) between Rmax/Rd andabsolute magnitude Mi.
2.2. Velocity Dispersion
The velocity dispersion, σ, is a characteristic kinematicparameter for pressure-supported systems such as ETGs. Stellarkinematics can be extracted from theETGsabsorption spectralfeatures using thepenalized pixel-fitting method pPXF (Cap-pellari & Emsellem 2004; Cappellari 2017). This algorithmconstructs a best-fit linear combination of stellar templates tothe observed galaxy spectrumʼs line-of-sight velocity distribu-tion (LOSVD) parametrized by a Gauss-Hermite function,which is characterized by a mean (rotational) velocity V,velocity dispersion σ, skewness h3,and kurtosis h4. We usedthe stellar templates from the MILES library (Sánchez-Blázquez et al. 2006; Falcón-Barroso et al. 2011a) to extractintegrated and resolved velocity dispersions. For integratedmeasurements, spectra collapsed spatially over a range ofaperture sizes (e.g., Re/4, 1Re, 2Re, etc.)
17 are fitted by pPXF.Since it is a summed spectra that is fitted, the resulting velocitydispersion measurement isa V Vrms rot
2 2s= + . These char-acterize the dynamical mass enclosed within each aperture (seeSection 2.4). They can be used to characterize the FP scatterdependence on the σaperture size (see Section 3.4). Noaperture correction is performed. For resolved velocitydispersion measurements, from which dispersion profiles arebuilt, spectral rows are binned radially (along the slit) overthreepixels for each radial data point. In the dimmer outer
Figure 2. Distribution of the extracted inclination-corrected rotationalvelocities V23.5
i used in our TFR analysis.
17 Our use of long-slit spectroscopy restricts our apertures to the stripe of lightthat is collected along each galaxymajor axis. Comparisons with integratedvelocity dispersions determined from 2D IFU data are unfortunately notstraightforward; this issue will be more closely addressed in N.N.Q. Ouelletteet.al. (2017b, in preparation).
4
The Astrophysical Journal, 843:74 (27pp), 2017 July 1 Ouellette et al.

regions of the galaxy, rows are binned until the necessary S/Nlevel of 50/Å is reached. These dispersion measurementscharacterize the galaxy kinematics locally; velocity dispersionprofiles are constructed from them. The maximumradial extentof these dispersion profiles, normalized by Re, is shown inFigure 1 (right panel). We find only amoderate correlation(r=−0.33) between Rmax/Re and absolute magnitude Mi.
Various emission lines are masked to enable reliable pPXFfits. While we wish to fit galaxy spectra from as broad a stellartemplate library as possible, the size of the MILES library (985templates) and the large number of radial LOSVD measure-ments required to build a resolved profile would make thiseffort computationally prohibitive. Instead, we use a spatiallycollapsed (“mashed”) spectrum over an aperture of R2 e for eachgalaxy for which pPXF selects an optimal stellar templatesubcatalog from the entire MILES library. Barring any notablevariations in the stellar populations of our galaxies along theirradii (of which we found none), this yields a subcatalog ofapproximately 15–20 stellar templates chosen from the MILESlibrary for each galaxy that produces stable fits in a time-efficient manner. The choice of feature masking and templateselection can significantly impact dynamical measurements;this is further explored in N.N.Q. Ouellette et al. (2017b, inpreparation).
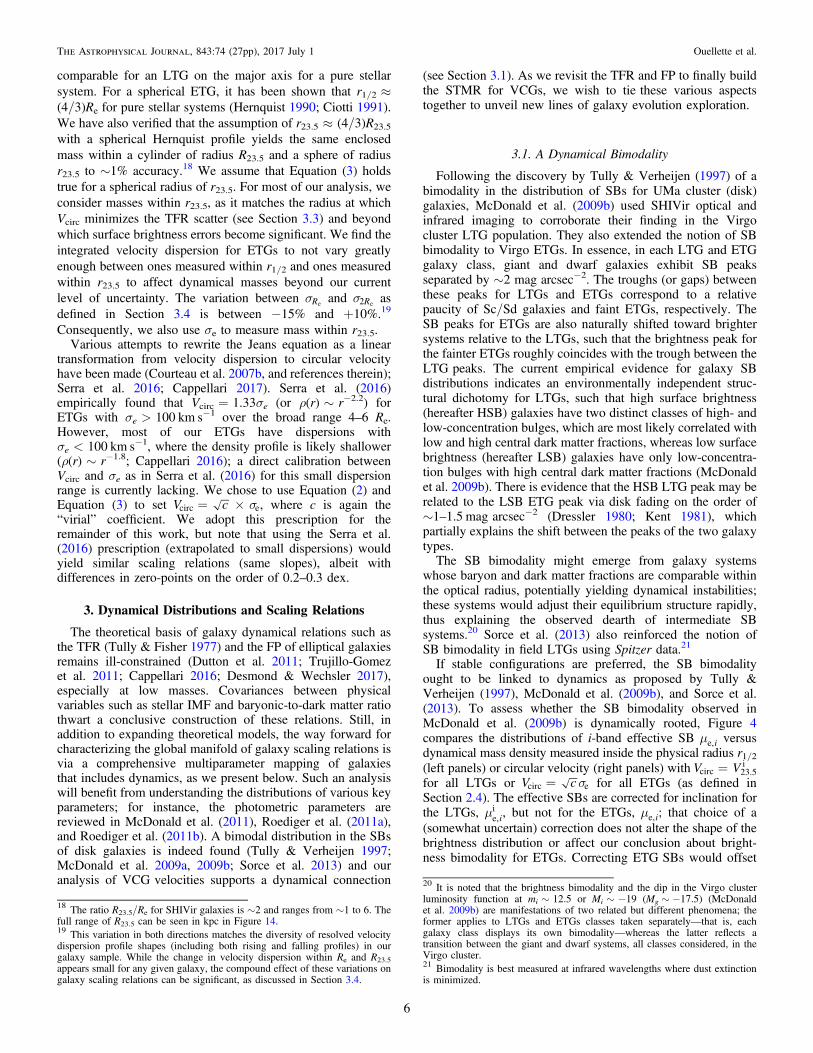
An integrated central velocity dispersion, σ0 (taken within anaperture of Re/8), was measured for 131 VCGs, whereas anintegrated effective velocity dispersion σe could be measuredfor 128 VCGs (see Figure 3), 88 of which are ETGs. Theintegrated velocity dispersions for these ETGs are used toextract the tightest FP (Section 3.4).
2.3. Additional Data
We supplemented our dynamical catalog with a number ofliterature sources; all data presented in this paper concernmembers of the SHIVir catalog (742 galaxies in total; seeSection 2). The morphological classification is taken from theGOLDMine database (Gavazzi et al. 2003), corresponding tonumerical Hubble types ranging from −3 to 20. For reference,SHIVir ETGs have a Hubble type between −3 and 2 inclusive,while LTGs range from 3 to 20 inclusive.
Our TFR sample is described in Section 2.1. Our FP analysis(Section 3.4) only contains SHIVir kinematics in order to studythe FP scatter based on different velocity dispersion metrics.For our bimodality (Section 3.1) and mass relation studies(Sections 3.5–3.7), multiple dynamical values are used fromthe following supplementary sources: 72 values from ACSVCS(P. Côté 2011, private communication), 43 values from Fouquéet al. (1990), 30 values from Rubin et al. (1997) and Rubinet al. (1999), 14 values from Geha et al. (2003), 12 values fromvan Zee et al. (2004), 47 values from ATLAS3D (Cappellariet al. 2011a), 29 values from SMAKCED (Toloba et al. 2011),57 values from ALFALFA (Haynes et al. 2011), and 7 valuesfrom Ryś et al. (2014). Note that many VCGs in our cataloghave values available from multiple sources, which is why thetotal sum of kinematic values is larger than 190, which is thesize of our object catalog. The typical dispersion betweenmultiple estimates of the circular speed is only 10%–15%.When multiple entries are available for a galaxy target, we usetheir statistical average. This procedure ensures that galaxystructural parameters are not counted twice.
2.4. Stellar and Dynamical Masses
Our computation of stellar mass exploits color transforma-tions such as those presented in Roediger & Courteau (2015).The SDSS colors g−r, g−i, g−z, and g−H are used toconstrain mass-to-light ratios versus color relations (MLCRs),which allows for optimal modeling and fitting of SEDs using aChabrier IMF (Chabrier 2003), and then produces stellar mass-to-light ratios from which a stellar mass can be inferred. Thecolors are computed from the SHIVir photometric catalogdescribed in Section 2. Our g-band and H-band SB profilestypically reach a depth of 26 mag arcsec−2 and 24 magarcsec−2, respectively (McDonald et al. 2011). The stellar masserrors in this paper account for random uncertainties only.Systematic errors due to the IMF choice may exceed 0.3 dex;an additional 0.2 dex may contribute to the error budgetbecause ofother modeling choices.Dynamical masses within a fiducial projected radius, R, are
inferred for rotating disks via the following:
M R V R G, 2dyn circ2=( ) ( )
where G is the gravitational constant. We take circular velocityto be V V V V isincirc rot
i23.5i
23.5= = = for LTGs, where i is theinclination of the galaxy disk and the superscript “c” indicatesthat the velocity is corrected for inclination. For ETGs,analogous values of Mdyn measured inside an effectivespherical radius can be computed using
M r cr
G, 3dyn 1 2
1 2 e2s
=( ) ( )
where the structural constant c is computed from the function
c n0.300 4.153,= - +
built from the values in Table2 of Courteau et al. (2014) andthe Sérsic index n computed from our i-band bulge-diskdecompositions of the total light profiles described inMcDonald et al. (2011). The constant c is computed forapertures based on a physical spherical radius, namely r1/2. It iswarranted here to reflect upon the transformation fromprojected to physical radius, i.e., r(R). The two quantities are
Figure 3. Distribution of the SHIVir integrated effective velocity disper-sions σe.
5
The Astrophysical Journal, 843:74 (27pp), 2017 July 1 Ouellette et al.
comparable for an LTG on the major axis for a pure stellarsystem. For a spherical ETG, it has been shown that r1/2≈(4/3)Re for pure stellar systems (Hernquist 1990; Ciotti 1991).We have also verified that the assumption of r23.5≈(4/3)R23.5
with a spherical Hernquist profile yields the same enclosedmass within a cylinder of radius R23.5 and a sphere of radiusr23.5 to ∼1% accuracy.18 We assume that Equation (3) holdstrue for a spherical radius of r23.5. For most of our analysis, weconsider masses within r23.5, as it matches the radius at whichVcirc minimizes the TFR scatter (see Section 3.3) and beyondwhich surface brightness errors become significant. We find theintegrated velocity dispersion for ETGs to not vary greatlyenough between ones measured within r1/2 and ones measuredwithin r23.5 to affect dynamical masses beyond our currentlevel of uncertainty. The variation between Res and R2 es asdefined in Section 3.4 is between −15% and +10%.19
Consequently, we also use σe to measure mass within r23.5.Various attempts to rewrite the Jeans equation as a linear
transformation from velocity dispersion to circular velocityhave been made (Courteau et al. 2007b, and references therein);Serra et al. 2016; Cappellari 2017). Serra et al. (2016)empirically found that Vcirc=1.33σe (or ρ(r)∼r−2.2) forETGs with σe>100 km s−1 over the broad range 4–6 Re.However, most of our ETGs have dispersions withσe<100 km s−1, where the density profile is likely shallower(ρ(r)∼r−1.8; Cappellari 2016); a direct calibration betweenVcirc and σe as in Serra et al. (2016) for this small dispersionrange is currently lacking. We chose to use Equation (2) andEquation (3) to set V ccirc es= ´ , where c is again the“virial” coefficient. We adopt this prescription for theremainder of this work, but note that using the Serra et al.(2016) prescription (extrapolated to small dispersions) wouldyield similar scaling relations (same slopes), albeit withdifferences in zero-points on the order of 0.2–0.3 dex.
3. Dynamical Distributions and Scaling Relations
The theoretical basis of galaxy dynamical relations such asthe TFR (Tully & Fisher 1977) and the FP of elliptical galaxiesremains ill-constrained (Dutton et al. 2011; Trujillo-Gomezet al. 2011; Cappellari 2016; Desmond & Wechsler 2017),especially at low masses. Covariances between physicalvariables such as stellar IMF and baryonic-to-dark matter ratiothwart a conclusive construction of these relations. Still, inaddition toexpanding theoretical models, the way forward forcharacterizing the global manifold of galaxy scaling relations isvia a comprehensive multiparameter mapping of galaxiesthatincludes dynamics, as we present below. Such an analysiswill benefit from understanding the distributions of various keyparameters; for instance, the photometric parameters arereviewed in McDonald et al. (2011), Roediger et al. (2011a),and Roediger et al. (2011b). A bimodal distribution in the SBsof disk galaxies is indeed found (Tully & Verheijen 1997;McDonald et al. 2009a, 2009b; Sorce et al. 2013) and ouranalysis of VCGvelocities supports a dynamical connection
(see Section 3.1). As we revisit the TFR and FP to finally buildthe STMR for VCGs, we wish to tiethese various aspectstogether to unveil new lines of galaxy evolution exploration.
3.1. A Dynamical Bimodality
Following the discovery by Tully & Verheijen (1997) of abimodality in the distribution of SBs for UMa cluster (disk)galaxies, McDonald et al. (2009b) used SHIVir optical andinfrared imaging to corroborate their finding in the Virgocluster LTG population. They also extended the notion of SBbimodality to Virgo ETGs. In essence, in each LTG and ETGgalaxy class, giant and dwarf galaxies exhibit SB peaksseparated by ∼2 mag arcsec−2. The troughs (or gaps) betweenthese peaks for LTGs and ETGs correspond to a relativepaucity of Sc/Sd galaxies and faint ETGs, respectively. TheSB peaks for ETGs are also naturally shifted toward brightersystems relative to the LTGs, such that the brightness peak forthe fainter ETGs roughly coincides with the trough between theLTGpeaks. The current empirical evidence for galaxy SBdistributions indicates an environmentally independent struc-tural dichotomy for LTGs, such that high surface brightness(hereafter HSB) galaxies have two distinct classes of high- andlow-concentration bulges, which are most likely correlated withlow and high central dark matter fractions, whereas low surfacebrightness (hereafter LSB) galaxies have only low-concentra-tion bulges with high central dark matter fractions (McDonaldet al. 2009b). There is evidence that the HSB LTG peak may berelated to the LSB ETG peak via disk fading on the order of∼1–1.5 magarcsec−2 (Dressler 1980; Kent 1981), whichpartially explainsthe shift between the peaks of thetwo galaxytypes.The SB bimodality might emerge from galaxy systems
whose baryon and dark matter fractions are comparable withinthe optical radius, potentially yielding dynamical instabilities;these systems would adjust their equilibrium structure rapidly,thus explaining the observed dearth of intermediate SBsystems.20 Sorce et al. (2013) also reinforced the notion ofSB bimodality in field LTGs using Spitzer data.21
If stable configurations are preferred, the SB bimodalityought to be linked to dynamics as proposed by Tully &Verheijen (1997), McDonald et al. (2009b), and Sorce et al.(2013). To assess whether the SB bimodality observed inMcDonald et al. (2009b) is dynamically rooted, Figure 4compares the distributions of i-band effective SB ie,m versusdynamical mass density measured inside the physical radius r1/2(left panels) or circular velocity (right panels) with V Vcirc 23.5
i=for all LTGs or V ccirc es= for all ETGs (as defined inSection 2.4). The effective SBs are corrected for inclination forthe LTGs, ie,
im , but not for the ETGs, ;ie,m that choice of a(somewhat uncertain) correction does not alter the shape of thebrightness distribution or affect our conclusion about bright-ness bimodality for ETGs. Correcting ETGSBs would offset
18 The ratio R23.5/Re for SHIVir galaxies is ∼2 and ranges from ∼1 to 6. Thefull range of R23.5 can be seen in kpc in Figure 14.19 This variation in both directions matches the diversity of resolved velocitydispersion profile shapes (including both rising and falling profiles) in ourgalaxy sample. While the change in velocity dispersion within Re and R23.5appears small for any given galaxy, the compound effect of these variations ongalaxy scaling relations can be significant, as discussed in Section 3.4.
20 It is noted that the brightness bimodality and the dip in the Virgo clusterluminosity function at mi∼12.5 or Mi∼−19 (Mg ∼ −17.5) (McDonaldet al. 2009b) are manifestations of two related but different phenomena; theformer applies to LTGs and ETGs classes taken separately—that is, eachgalaxy class displays its own bimodality—whereas the latter reflects atransition between the giant and dwarf systems, all classes considered, in theVirgo cluster.21 Bimodality is best measured at infrared wavelengths where dust extinctionis minimized.
6
The Astrophysical Journal, 843:74 (27pp), 2017 July 1 Ouellette et al.
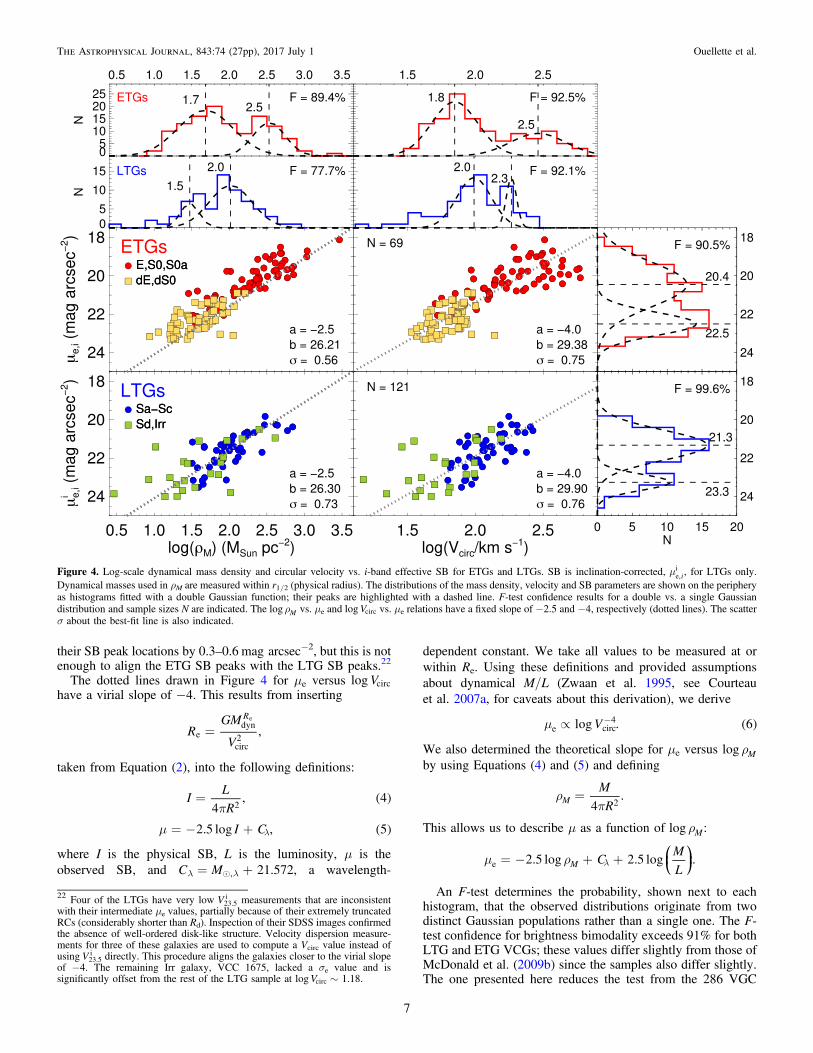
their SB peak locations by 0.3–0.6 magarcsec−2, but this is notenough to align the ETG SB peaks with the LTG SB peaks.22
The dotted lines drawn in Figure 4 for μe versus Vlog circhave a virial slope of −4. This results from inserting
RGM
V,
R
edyn
circ2
e
=
taken from Equation (2), into the following definitions:
IL
R4, 4
2p= ( )
I C2.5 log , 5m = - + l ( )
where I is the physical SB, L is the luminosity, μ is theobserved SB, and Cλ=Me,λ+21.572, a wavelength-
dependent constant. We take all values to be measured at orwithin Re. Using these definitions and provided assumptionsabout dynamical M/L (Zwaan et al. 1995, see Courteauet al. 2007a, for caveats about this derivation), we derive
Vlog . 6e circ4m µ - ( )
We also determined the theoretical slope for μe versus log Mrby using Equations (4) and (5) and defining
M
R4.M 2
rp
=
This allows us to describe μ as a function of log Mr :
CM
L2.5 log 2.5 log .Mem r= - + +l ⎜ ⎟⎛
⎝⎞⎠
An F-test determines the probability, shown next to eachhistogram, that the observed distributions originate from twodistinct Gaussian populations rather than a single one. The F-test confidence for brightness bimodality exceeds 91% for bothLTG and ETG VCGs; these values differ slightly from those ofMcDonald et al. (2009b) since the samples also differ slightly.The one presented here reduces the test from the 286 VGC
Figure 4. Log-scale dynamical mass density and circular velocity vs. i-band effective SB for ETGs and LTGs. SB is inclination-corrected, ie,im , for LTGs only.
Dynamical masses used in ρM are measured within r1/2 (physical radius). The distributions of the mass density, velocity and SB parameters are shown on the peripheryas histograms fitted with a double Gaussian function; their peaks are highlighted with a dashed line. F-test confidence results for a double vs. a single Gaussiandistribution and sample sizes N are indicated. The log Mr vs. μe and Vlog circ vs. μe relations have a fixed slope of −2.5 and −4, respectively (dotted lines). The scatterσ about the best-fit line is also indicated.
22 Four of the LTGs have very low V23.5i measurements that areinconsistent
with their intermediate μe values, partially because oftheir extremely truncatedRCs (considerably shorter than Rd). Inspection of their SDSS images confirmedthe absence of well-ordered disk-like structure. Velocity dispersion measure-ments for three of these galaxies are used to compute a Vcirc value instead ofusing V23.5
i directly. This procedure aligns the galaxies closer to the virial slopeof −4. The remaining Irr galaxy, VCC 1675, lacked a σe value and issignificantly offset from the rest of the LTG sample at Vlog 1.18circ ~ .
7
The Astrophysical Journal, 843:74 (27pp), 2017 July 1 Ouellette et al.

galaxies in McDonald et al. (2009b) to 190 VCGs that musthave simultaneous SB and reliable velocity information(sources for kinematics are listed in Section 2.3). The versionofMcDonald et al. (2009b)of this figure relied on the moreuncertain and heterogeneous HyperLEDA database for kine-matic values (Paturel et al. 2003). The matching bimodalityseen in Figure 4 for log Mr and Vlog circ also yields F-valueshigher than78%, or with a significance of ∼1.3σ. While this islower than the ideal 3σ confidence threshold, the SBbimodality has been observed in a number of environmentsby a number of other works (Tully & Verheijen 1997; M09;Sorce et al. 2013), while there have been no studies refutingthis bimodality. These statistics again differ slightly from thoseof M09 since the samples also differ slightly. Henceforth, ourdiscussion of bimodality focuses on μe versus Vlog circ, as Vcirc
is a direct observable, whereas Mr must be computed fromvelocity and radius jointly.
A separation of the (μe, Vlog circ) relation by Hubble typesshows very distinct groupings.23 For the ETGs, the brightnessbimodality is clearly delineated by giant (E-S0) versus dwarf(dE-dS0) galaxies. While the morphological dichotomy istrivial, by definition of the types themselves, it is remarkablethat the two galaxy groups are equally well delineated invelocity space; the SB gap at ∼21 mag arcsec−2 lines up withthe gap in velocity at Vlog 2.1circ ~ (Vcirc= 125 km s−1 at Re)for the ETGs. The analog for LTGs is slightly muddled by thefact that SHIVir currently suffers from a dearth of Virgo spiralgalaxies. While the SHIVir survey was built to be morpholo-gically representative of its parent catalog, the VCC, morerecent surveys such as the NGVS (complete down toM* = 106Me and 50% complete down to Mg=−9.13 mag)
have shown Virgo to contain a larger number of fainter spiralsand dwarfs than was previously thought (Ferrarese et al. 2016).A tentative SB gap occurs at ∼22.5 mag arcsec−2 and again at
Vlog 2.1circ = for the LTGs, despite a significant Hubble typeoverlap between the two peaks.In order to understand the dynamical dichotomy, it is
speculated that a galaxy undergoes rapid structural readjust-ments in unstable regimes where baryonic and dark matter areco-dominant. McDonald et al. (2009b) and Sorce et al. (2013)discussed a scenario whereby a rotating system that retains(does not shed) large amounts of angular momentum inhibitsthe flow of baryons to its center thus delaying the onset ofrotational equilibrium at a given radius in the galaxy (see alsoDalcanton et al. 1997). The gap between the peaks, whethertraced by SB or circular velocity, would then reflect aconfiguration where baryons and dark matter are equallydominant by mass within the optical radius. We discuss thepossible implications of this scenario for the ETG population inSection 3.2. While this qualitative picture has physical appeal,the values found in Figure 4 for the gap velocities(V 125 km s23.5
i 1~ - ) seem low compared to those inferredfrom scaling relation arguments: see Figure1 of Courteau &Dutton (2015). According to the latter, a 50% dark matterfraction measured at ∼1.3 Re (2.2 Rd) would be found for LTGsrotating at ∼200 km s−1 at that radius. These two disparateestimates indicate that the problem of dynamical stability ingalaxy disks and spheroids requires additional insight, aspossibly provided by numerical explorations of galaxystructure with a range of baryons and dark matter at all radii.
3.2. Size-Luminosity Relation
The dependence of luminosity/mass on size and velocity hasbeen investigated by the ATLAS3D collaboration (Cappellariet al. 2013a; Cappellari 2016). They presented a distribution
Figure 5. Luminosity-size diagram of 190 SHIVir VCGs (thesample is the same as in Figure 4). L is the total i-band luminosity, and Re is the projected effectiveradius. ETGs are plotted as circles in shades of red, LTGs are plotted as triangles in shades of blue. The saturation of blue and red indicates Vcirc. Dashed lines showlines of constant Vcirc (approximate best-fit lines for fourcircular velocity bins from our observational data), and the (nearly parallel) arrows indicate the directions ofincreasing Vcirc and μe.
23 If morphological types are deemed somewhat subjective, a group separationby concentration (see Equation (7)) or g−i color yields the same results andconclusions.
8
The Astrophysical Journal, 843:74 (27pp), 2017 July 1 Ouellette et al.

with a critical mass of M*∼2×10¹¹Me above which theirmassive slow-rotator ETGs lie and below which low-massspirals and fast-rotator ETGs are found. The authors suggestedthat galaxies evolve across lines of constant σe at low mass andalong lines of constant σe at high mass. This notion of a two-stage evolution consistent with our results was introduced inFaber et al. (2007) as a mixed scenario in which blue spiralsaccrete gas and are eventually quenched into red ellipticals,which then combine via dry mergers to form the most massiveellipticals. Figure 5 revisits this scenario with a distribution of
Llog i versus Rlog e as a function of circular velocity (for themass-size relation, see Figure 14, top panels). For a givenluminosity, circular velocity, or fixed dynamical mass, LTGshave noticeably larger effective radii than ETGs. This isexpected, since ETGs typically have a more centrally concen-trated mass distribution (and higher concentration values) at fixedVcirc. The difference in mass distribution between the two galaxyclasses may indicate an evolutionary sequence between them. Tocharacterize the evolution of different galaxy populations into oneanother, the luminosity/mass-size distribution of the Virgocluster can be compared to that of field galaxies and a moreevolved cluster such as Coma, as was done in Cappellari (2013).The field was found to have a larger fraction of spiral galaxies,whereas Coma has a notable dearth of spirals. LTGs and ETGshave closer proportions within the SHIVir sample, implying thatthe cluster environment plays a key role in processing spirals intoellipticals. Indeed, the study ofFaber et al. (2007)of theevolution of the blue/red galaxy fraction over time showed thatthe progenitors of the present-dayred ETGs must exist in theblue LTG population at z�1.
A scenario whereby red ellipticals formed as blue spirals thatare eventually quenched—via AGN feedback (Granatoet al. 2004; Springel et al. 2005; Dubois et al. 2013), winds(Murray et al. 2005), and other heating mechanisms—mayexplain the SB and dynamical bimodality in the ETGs seen inSection 3.1. Accreted gas turned into stellar mass and bulgegrowth would increase a galaxy’s Vcirc, while star formationshutdown would redden its color. Any bimodality existing inthe spiral population as a result ofthe aforementioneddynamical instability during disk formation could be retainedin this blue-to-red evolutionary track. Disk fading (Kent 1981)as a possible evolutionary mechanism between spirals andlenticulars would affect the fraction of spirals in the Virgoenvironment and partially cause the SB peaks’ shift betweenLTGs and ETGs as seen in Figure 4. However, staggeredquenching—wherein we find a correlation between halo massand quenching epochs—as an evolutionary mechanism in L*
galaxies has been shown to increase scatter in growth and starformation histories (Terrazas et al. 2016), potentially muddyingany bimodality left over from disk formation instabilities.Minor mergers required to form spheroidal geometries mayalso add a secondary dynamical instability by which the ETGbimodality is created. Instances where only quenching hasoccurred may explain the creation of S0s/dS0s for which a diskis still present. The evolution from blue spirals to small redellipticals would keep much of the disk, and thus the rotationalcomponent of the kinematics, intact. Indeed, this is whereATLAS3D places their fast-rotator ETGs. Via dry mergers,these fast-rotator ETGs gain stellar mass but also increase insize as they grow larger and more spheroidal (Toomre 1977;Kaviraj et al. 2014), therefore moving along lines of constantσe or Vcirc, and along the red sequence. Major mergers almost
certainly play an important role in the creation of massivespheroidals (M* > 1010.7Me), but auxiliary mechanisms suchas morphological transformations (Bundy et al. 2007) are likelyrequired to drive the observed evolution from intermediate-redshift progenitors to the massive spheroidal population seenin the local universe. Unfortunately, the bimodality observed inthe ETG population cannot be attributed to the separationbetween fast- and slow-rotator ETGs (Emsellem et al. 2011), asthe critical mass of this classification is much too high atM*∼2×10¹¹Me.
3.3. Velocity-Luminosity (Tully-Fisher) Relations
We now wish to explore the fundamental correlationbetween galaxian luminosity and velocity, also known as theTFR. While the TFR has been studied extensively (e.g.,Courteau 1997; Giovanelli et al. 1997; McGaugh et al. 2000;Courteau et al. 2007a; Pizagno et al. 2007; Hall et al. 2012;Bekeraité et al. 2016; Bradford et al. 2016, to list a few),differences between field and cluster environments remain ill-constrained especially in the context of the Virgo cluster, wherestripping effects have been well documented (e.g., Koopmann& Kenney 2004). We have compiled a subsample of 46 VirgoLTGs with resolved Hα RCs that could successfully be fittedusing themultiparameter function in Equation (1).24 Our TFRanalysis takes advantage of i-band photometry to mitigate dustextinction effects. Table 1 presents the i-band TFRs for LTGsbased on a bisector regression and one of the following velocitymetrics: V2.2
i , V23.5i , Vmax
i , and W 220i or W 250
i linewidths.Figure 6 (top panel) shows TFRs for the SHIVir sample and
two other VCG data sets (Rubin et al. 1997; Cheminet al. 2006), using V23.5
i . This velocity metric produced thesmallest scatter in this TFR analysis, in agreement with Hallet al. (2012). Integrated linewidths, e.g., from 21 cm emissionprofiles, can also be compared to our TFR data. The correctedALFALFA linewidths for VCGs from Haynes et al. (2011)and SHIVir linewidths are displayed in the figure as W 250
i
and W 220i , respectively. However, given an uncertain
transformation from linewidth to rotational velocity (Papas-tergis et al. 2011), the first three fits in Table 1 do not includeALFALFA and SHIVir linewidths. The TFR slopes usingVmax
i , V2.2i , and V23.5
i are all consistent with each other; W 220i is
the exception with a steeper slope, although it is still consistentwithin the uncertainties. Its zero-point, however, is noticeablylower than the other three, but this is solely due to the inclusionof the ALFALFA data points; the SHIVir W 220
i TFR has aslope of −7.54± 0.68 and a zero-point of −21.85± 0.27. Weconfirm that the TFR with the lowest scatter usesV23.5
i ,which ismeasured far in the outer disk (Courteau 1997). The TFRscatter with V23.5
i is 9% smaller than for V2.2i , 11% smaller than
for Vmaxi , and 60% smaller than for W 220
i (the reported scatterestimates are those of forward fits). In other words, the tightestTFR is achieved for the most extended aperture where the RCis likely at its flattest and where the dark matter is likelydominant. The TFR scatter for our VCGs is somewhat largerthan reported for large samples of field and cluster galaxies(Courteau et al. 2007a; Hall et al. 2012). This is largely due toour smaller sample size and greater distance errors (as the 3D
24 The other LTGs have RCs that are either too noisy, still rising at theirtruncation radius, or have highly irregular shapes. These galaxies all have lowVrot. Their exclusion from the TFR only results in a dearth of data at the low-velocity end.
9
The Astrophysical Journal, 843:74 (27pp), 2017 July 1 Ouellette et al.

structure of the Virgo cluster is poorly determined). Typically,the TFR scatter found for samples containing a few hundredgalaxies is on the order of 0.2 to 0.5 mag (Courteau 1997;Giovanelli et al. 1997). Since our LTG sample is relatively
small, the fit uncertainty should be proportionally larger. Thescatter for TFRs based on resolved RCs ranges from 0.49 to0.56 mag, or 0.2 to 0.22 dex. It is even larger if ALFALFAvalues are included. Regardless of the velocity metric, the TFRscatter always increases at lower velocities (Vcirc� 90 km s−1,or log(Vcirc)� 1.95),where baryonic effects (neglect of thegaseous mass, increasing stellar velocity dispersion) steepenand broaden the TFR slope (McGaugh et al. 2000; Simonset al. 2015; Bekeraité et al. 2016).Superimposed on the data in Figure 6 are additional TFRs
based on i-band photometry for cluster (Giovanelli et al. 1997;Neistein et al. 1999; Hall et al. 2012) and field environments(Courteau et al. 2007a; Pizagno et al. 2007). Despite rampressure stripping and tidal interactions in cluster environ-ments, which affect star formation rates, and thus galaxyluminosities, more effectively than in the field (Koopmann &Kenney 2004), and while Virgo RCs are truncated relative tofield analogs, the VCG data nicely match other cluster and fieldTF distributions. The environmental independence of the TFR
Table 1Bisector Least-squares Tully-Fisher Relations (TFRs)
Vrot a (mag) b (mag) σ (dex) N
V2.2i −7.16±0.35 −21.85±0.12 0.216 46
V23.5i −7.12±0.28 −21.63±0.10 0.197 46
Vmaxi −7.15±0.34 −21.76±0.12 0.222 46
W 220i −7.68±0.58 −22.38±0.33 0.487 65
Note.TFRs computed as M a V blog 2.3i roti= - +· ( ) using different
velocity metrics (1st column). σ is the forward scatter and N is the numberof fitted data points. The catalogs used for the first three velocity metrics areSHIVir, Rubin et al. (1997), and Chemin et al. (2006). The catalogs used forthe fourth velocity metric are SHIVir and ALFALFA (Haynes et al. 2011).
Figure 6. (Top) Bisector TFRs for various Virgo databases: SHIVir (both V23.5, fitted, and W20/2, unfitted), Rubin et al. (1997), and Chemin et al. (2006); theALFALFA (Haynes et al. 2011) data are shown but not fitted. The velocity metric Vrot
i is V23.5i for the first three samples, and the linewidth W 220
i for SHIVir andW 2050
i for ALFALFA. Also shown are cluster and field TF fits for other non-Virgo source catalogs (Giovanelli et al. 1997; Neistein et al. 1999; Courteauet al. 2007a; Pizagno et al. 2007; Hall et al. 2012). Our best TFR for VCGs (see Table 1) is shown as a solid black line. The typical uncertainty per SHIVir point isshown on the left. (Bottom) TFRs for various statistical fits of multiple surveys (Giovanelli et al. 1997; Courteau et al. 2007a; Pizagno et al. 2007), including thepresent study. The predicted magnitude differences resulting from the choice of fitting method can be comparable to those accounted for by observational scatter.
10
The Astrophysical Journal, 843:74 (27pp), 2017 July 1 Ouellette et al.

has also been noted by Vogt (1995) and Mocz et al. (2012),among others. The slope and zero-point of the cluster and fieldTFRs are statistically the same for the best-fit lines of theincluded catalogs in Figure 6. However, the TFR scatters forfield and cluster samples may differ, with the field samplesshowing lower values. This is likely the result of a quieter massaccretion history and a less perturbed evolution of the darkmatter halos for field systems, as well as the presence ofkinematically disturbed systems such as tidal dwarf galaxies(Lelli et al. 2015), interacting and stripped galaxies (Mendes deOliveira et al. 2003), and enhanced (Milvang-Jensenet al. 2003) or quenched (Nakamura et al. 2006) star formationin galaxy clusters.
Figure 6 (bottom panel) shows the same data as above, but nowcomparing various fits (forward, inverse, bisector, orthogonal) ofthe TFR data by Giovanelli et al. (1997), Courteau et al. (2007a),Pizagno et al. (2007) and this work. We have tested that theBayesian formalism of Kelly (2007) yields nearly identical resultsas the bisector fits (using IDL routines sixlin, mpfit andbces). The range of cluster and field TFR parameters due to thechosen statistical method is as large as the data’s own dispersion.Indeed, the study ofBradford et al. (2016)of systematicuncertainties on the baryonic TFR showed a variation of up to12% on the slope depending on the fitting algorithm used, whichis at the level of both our velocity and magnitude uncertainties.Unfortunately, there is no universal standard for the choice ofregression in scaling relation analyses, and the exact statisticalmethod is not always specified. Indeed this ambiguity prevents usfrom firmly assessing that cluster and field TFRs differ onstatistical grounds. Furthermore, the Courteau et al. (2007a) cluster(light blue) and field (gray) points plotted in the background ofFigure 6, top panel, appear to be slightly offset from each other byMi= 0.5 at Vlog 2.2rot
i =( ) . While an environmental dependenceis a tempting explanation, one cannot guarantee at this stage thatthe magnitudes are exactly zero-pointed to the same system(Courteau et al. 2007a). The uniform photometric calibration to theNGVS system should alleviate this concern. Additionally, theCourteau et al. (2007a) data are an amalgamation of differentsurveys, hence its heterogeneous nature.
Producing a TFR for the Virgo cluster has its own uniquechallenges, chief of which is using accurate distances toconvert apparent into absolute magnitudes. The size and exactshape of the Virgo cluster remain poorly defined. Fukugitaet al. (1993) posited that spiral galaxies in the Virgo clustermay be distributed in an elongated region extending from adistance of 13 to 30 Mpc; Blakeslee et al. (2009) have alsomeasured VCG distances ranging from 10.9 to 30.9 Mpc. Thesignificant distance uncertainty at Virgo makes it challenging toavoid galaxies from contaminating backgrounds, and indeedmay be an important source for our larger scatter. This suggeststhat distance errors contribute to our large scatter. We quantifythis contribution here. Based on the SHIVir sample, distanceuncertainties average out to 2.27 Mpc, or roughly± 13.8% indistance, if VCGs lie at a mean distance of 16.5 Mpc. Theresulting scatter derived from distance errors alone is 0.3 mag,or over half of the total observed TFR scatter. While it is acommon approximation to place all VCGs at 16.5 Mpc,multiple overlapping clouds likely make up the Virgo cluster(Tully et al. 2016). Approximating a VCGdistance to be 16.5Mpc when its true distance is unknown would thus markedlyincrease the scatter of our scaling relations. Our initial TFR studyincluded only distances with uncertainties on the order of 1 Mpc
or less (setting all other distances to 16.5 Mpc). This resulted in alarger scatter than for the TFR presented here, and thus we choseto include all available distances enumerated in Section 2.3.
3.3.1. TFR Residuals
The scatter of the TFR is known to be sharply independent ofnumerous galaxy observables, making this relation a genuine“fundamental plane” for LTGs (Zwaan et al. 1995; Courteau &Rix 1999; Courteau et al. 2007a). For completeness, we hereexplore the scatter of this cluster’s TFR in Figure 7 as a function ofa number of parameters: i-band effective SB, g− r color, Hubbletype, effective radius Re, stellar mass, gas mass, semimajor-to-minor-axis ratio a/b, and C28 concentration measured in the i-band, defined as
Cr
r5 log , 728
80
20=
⎛⎝⎜
⎞⎠⎟ ( )
where r80 and r20 are the radii enclosing 80% and 20% of the totallight. This parameter should be mostly independent of projectioneffects (McDonald et al. 2009b) and is somewhat analogousto morphological class. ETGs with large bulges have highconcentrations, while LTGs with smaller bulges have lowconcentrations. Hubble types have been ordered from 3 (Sa) to12 (Im), in accordance with theGOLDMineclassification(Gavazzi et al. 2003). No included galaxies were found to haveHubble types ranging from 13 (Pec) to 19 (dIm), thus galaxiesclassified as 20 (?) were placed immediately after 12. BothSpearman and Pearson correlation coefficients for these distribu-tions are quite low, ranging from−0.30 to 0.29 and−0.15 to 0.18,respectively. For a null hypothesis where a given parameter doesnot correlate with residuals, we find no p-value more significantthan 0.22; we verify and conclude that the TFR residuals do notstrongly depend on any tested galaxy parameters (Courteauet al. 2007a; Dutton et al. 2007; Hall et al. 2012, and referencestherein).
3.3.2. Higher Forms of the TFR: Stellar and Baryonic
The best-fit STFR for all SHIVir data plotted in Figure 8,including ALFALFA data, is
M Vlog 4.02 0.30 log 1.74 0.53 ;23.5i
* = ´ + ( ) ( )
and without ALFALFA data,
M Vlog 3.99 0.18 log 1.49 0.37 ,23.5i
* = ´ + ( ) ( )as seen in Figure 8 (top right panel). Hall et al. (2012) alsofound M Vrot
4* µ using a large SDSS sample (N= 3041) and
radio line widths.25
Our smaller sample size yields a fairly large TFR slopeuncertainty, but the slope itself is consistent with a nominalvalue of 4. TheBradford et al. (2016)STFR for a set ofisolated galaxies yielded a slightly larger slope of 4.14±0.06,but still matched our relation within the uncertainties. Our best-fit STFR has a scatter of 0.32 dex in M*, or 0.08 in V23.5
i ,whichexactly matches the values of Desmond & Wechs-ler (2017).
25 In principle, using line widths for nearly flat rotation curves measured atoptical or radio wavelengths ought to yield the same “maximum” circularvelocities, and the respective TFRs should have comparable slopes(Courteau 1997), as they do here.
11
The Astrophysical Journal, 843:74 (27pp), 2017 July 1 Ouellette et al.

Construction of the BTFR took advantage of H I gas massesfrom the ALFALFA α.100 catalog (Haynes et al. 2011). Theseare only available for 40 of the 46 VCGs used in our TFRs; thesix galaxies with missing values are still used in the BTFR;their gas mass is set to zero. An atomic gas TFR is also plottedin Figure 8 (bottom left panel). The Virgo cluster BTFR,Figure 8 (bottom right panel) yields a flatter relation than theregular TFR, as expected (Gurovich et al. 2010). Our best-fitBTFR for all SHIVir data plotted in Figure 8 (bottom rightpanel), including ALFALFA, is
M Vlog 3.57 0.16 log 2.44 0.35 .bar 23.5i= ´ + ( ) ( )
Our BTFR slope is steeper than that of Gurovich et al. (2010),3.2±0.1, and Bradford et al. (2016), 3.24±0.05, butmatches the slope ofHall et al. (2012)of 3.45±0.12.
Numerical and semi-analytic galaxy formation simulationsbased on the ΛCDM model, which assume Mbar∝M200 andVcirc∝V200, predict a BTFR slope of 3 (Mo & Mao 2000;Navarro & Steinmetz 2000; van den Bosch 2000), but a morerealistic picture of disk galaxies that includes the impact ofbaryons, adiabatic contraction, and angular momentum con-servation will likely increase the BTFR slope to lie somewherebetween 3 and 4 (Dutton & van den Bosch 2009; Gurovichet al. 2010). As we increase our sample of gas-rich dwarfgalaxies in the future, we may begin to see a shallowing of ourBTFR slope at the low-mass end, which has been reflected indwarf BTFR studies resulting in slopes as low as 2 (McCallet al. 2012; Bradford et al. 2016; Karachentsev et al. 2017).Complete fit solutions for all TFRs, including scatter andsample size, are found in Figure 8.
Figure 7. Forward TFR residuals Δ Mi, vs. Re, g−r, Hubble type, C28, gas mass log(Mgas), stellar mass log(M*), a/b, and μe. The multiple windows are arranged inorder of increasing Pearson correlation coefficient r, shown in the bottom left corner of each window along with the Spearman correlation coefficient ρ and p-value.The data are all color-coded by Hubble type.
12
The Astrophysical Journal, 843:74 (27pp), 2017 July 1 Ouellette et al.

3.4. Fundamental Plane
We now turn our attention to the FP of the 88 ETGs forwhich stellar kinematics could be successfully extracted. TheFP for E, S0, dE, dS0, and Sa galaxies follows the description:
R a b clog log log ,e es= + + S( ) ( ) ( )
where the effective radius Re and effective SB Σe within Re aredetermined from i-band photometry, and the velocity disper-sion σ uses multiple definitions described below. Sa galaxiesare included in the ETG sample for the FP, despite beingclassified as LTGs in the rest of this paper, since their velocitydispersions are reliable and dominant (over Vrot).
Historically, σ has been measured for spectra integrated oversmall radii (typically a fraction of Re) or taken over a fewcentral pixels (σ0). For the SHIVir survey, we wish to probevelocity dispersions well into the transition regime frombaryon-to-dark-matter domination, typically in the 2–4 Re
regime. The scatter for FPs based on different velocity metricsisshown to decrease as a function of aperture in this section.
Figure 9 shows FP fits, computed with the lts_planefitroutine of Cappellari et al. (2013b) for (Re, σ, Σe), for fourdifferent dispersion measures, with apertures from 0 to 2Re. Itis encouraging, e.g., for cosmic flow studies or galaxyformation modeling, that the FP scatter is significantly reducedfor velocity dispersions measured at large galactocentricradii.26 Distances can thus be inferred more accurately. Thisresult matches the theoretical predictions of Dutton et al.(2013), whichstatethat variations in the velocity dispersionprofiles that aredue to non-homology in anisotropy andstructure are decreased when the aperture size is increasedand a mass closer to M200 is sampled. Integral field spectra ofellipticalapertures of up to Re have already revealed hints ofthis effect (Cappellari et al. 2011b; Scott et al. 2015), and wenow extend this conclusion to larger radii.27
Figure 8. Classic (top left), stellar mass (top right), atomic gas (bottom left), and baryonic TFR (bottom right). The velocity metric used is V23.5i for all four relations.
H I masses are taken from the ALFALFA α.100 catalog (Haynes et al. 2011); only 40 of our 46 VCGs have available gas masses. The baryonic mass is the sum of thestellar and gas masses; thegas mass is set to zero if it was not measured by ALFALFA. The six galaxies with unavailable gas masses are highlighted in yellow in theBTFR plot; their Mbar values should be taken as lower limits. TFR slopes, zero-points, scatter σ, Pearson correlation coefficients r, and sample sizes N are shown ineach panel.
26 Ultimately, one wishes to find the location where the FP scatter isminimized, likely within the region of dark matter domination.27 Signal-to-noise limitations for velocity dispersions measured at larger radiiyield smaller samples. However, we have verified that the FP fits remain thesame if we restrict the entire analysis to the 83 galaxies with dispersion profilesthat extend out to 2Re.
13
The Astrophysical Journal, 843:74 (27pp), 2017 July 1 Ouellette et al.

As mentioned above, we designed the SHIVir survey inorder to probe velocity dispersions at large radii. Thecharacteristics of the stellar kinematics are expected to varywith radius. For instance, the classification of ETGs into fast/slow rotator (Cappellari et al. 2011b; Emsellem et al. 2011) wasdefined for kinematics measured within Re. The shape of therotation curve canvary at radii larger than Re, however,de-pending on whether a galaxy is an S0 or a disky elliptical(Arnold et al. 2014). This is because the outer kinematics infast-rotator ETGs depend on the spatial scale of the stellar disk(see Figure3 of Cappellari 2016). Indeed, the FP scatter isreduced when using σe instead of σ0 (Cappellari et al. 2013b;Scott et al. 2015). For the SHIVir sample, the FP scatter dropsby 24% from 0.176 dex at center to 0.133 dex at 2Re. Thisagrees with Scott et al. (2015), whose FP scatter for an IFUstudy of 106 galaxies in three nearby clusters dropped from0.08 dex at center to 0.07 dex at Re, a 9% improvement. Sinceour integrated velocity dispersions are not aperture corrected,the outer parts of the spectra are possibly overwhelmed by theinner signal. However, the FP scatter dependence on aperture
size is clear, indicating that the outer parts still affect thedispersion measurement significantly (and this also despite therapid loss in slit area coverage at larger galactocentric radii).We have stated in Section 2.4 that the variations in velocitydispersions integrated within different slit lengths are quiteminimal, but the combined effects of these small variations for80–90 galaxies can contribute a sizeable decrease in FP scatter.A comparison with literature results is warranted. Bernardi
et al. (2003) compiled 11sets of FP best-fit parameters basedlargely on central velocity dispersion σ0 and r-band photometryfrom the literature, the median of which is b=1.33±0.12and c=−0.82±0.03. Our own best-fit parameters for the σ0case differ slightly: b=1.15±0.04 and c=−0.80±0.03.Larger apertures may probe a more complex structural pattern;Cappellari et al. (2013b) used velocity dispersions measuredwithin Re and obtained best-fit FP parameters at i-band ofb=1.06±0.04 and c=−0.76±0.02. These match our FPsolution at Re: b=1.16±0.04 and c=−0.77±0.03. Ingeneral, we match ATLAS3Dʼs results best. While we mayposit that some of those differences are environment-related,
Figure 9. FP relations (using a bisector regression) for SHIVir gas-poor galaxies with velocity dispersions measured within a radius of R 8e , Re/4, Re, and 2Re. Thebest-fit line and 1σ uncertainty are shown as solid and dashed black lines, respectively. The best-fit parameters a, b, c, sample size N, scatter σ, and typical uncertaintyper point are shown in each panel. The data are color-coded by stellar-to-total-mass ratio (the most dominant second parameter). Galaxies classified as dwarfs (dS0/dE) by the GOLDMine (Gavazzi et al. 2003) database are plotted as squares. The remaining galaxies are plotted as circles.
14
The Astrophysical Journal, 843:74 (27pp), 2017 July 1 Ouellette et al.

Falcón-Barroso et al. (2011b) showed that kinematic sub-structure or the environment do not yield a preferred location inthe FP for SAURON galaxies. Furthermore, a direct FPcomparison might be ill-suited if the FP is a warped surface(Cappellari et al. 2013a). The plane can also change drasticallydepending on the galaxy sample. The b parameter ofCappellariet al. (2013a)changed by 29% whenonlygalaxies withσ>130 km s−1 were included. Their c parameter alsochanged by 14% depending on the choice of dispersion,whether using σe or integrated over a radius of 1 kpc, σkpc. Careis thus called for when comparing different FP planar fits basedon different definitions of σ and other galaxy structuralparameters, especially at large galactocentric radii where therelative fraction of dark matter is non-negligible (Courteau &Dutton 2015). Nonetheless, while the FP scatter is noticeablyreduced for a larger aperture of the σ measurement, the best FPfit parameters are rather stable across all definitions.
It is worth noting that the individual FPs for giant and dwarfellipticals are statistically comparable, thus suggesting that bothpopulations are governed by similar evolutionary processes.This is even more apparent in the FP with R2 es as the velocitydispersion metric. We find,however,that the FP scatter is notonly larger for dwarf galaxies (M* < 109Me), but their FPresiduals are systematically larger. This may imply acontinuous but curved FP between dwarfs and giants, as seenfor photometric parameters in Ferrarese et al. (2012). Indeed,galaxies with a higher stellar mass fraction deviate below theFP; we return to this point in our FP residualanalysis (seeSection 3.4.1). Whether the FP is continuous (Graham &Guzmán 2003; Graham & Guzman 2004; Tollerud et al. 2011)or has a discontinuity (Kormendy 1985; Burstein et al. 1997)remains a matter of debate (Graham 2005), and the large scatterin our dwarf FP prevents us from resolving this issue.
3.4.1. FP Residuals
As with our TFR analysis, the FP residuals are plotted inFigure 10 as a function ofdynamical mass within r1/2, Mr
dyn1 2,
stellar-mass-to-light ratio M*/L, semimajor-to-minor-axis ratioa/b, g−r color, distance from M87 as an analog toenvironmental density, stellar mass M*, Hubble type, C28
concentration, total-mass-to-light ratio M Lrdyn
1 2 and stellar-to-total-mass ratio M Mr
dyn1 2
* . We set the distance to M87 at 16.7Mpc (Mei et al. 2007) and subsequently define dM87 for each ofour VCCs to be dM87=dVCC−16.7 Mpc. We define FPresiduals to be the y-axis minus the x-axis in Figure 9.Luminosity L is half the total galaxy light measured in thei-band, to compare mass (measured inside r1/2) and light withincomparable radii. The distance of M87 is taken to be 16.7 Mpc(Blakeslee et al. 2009). Total (dynamical) masses are alwayscalculated using σe. This residual analysis benefits from thelargest number of VCGs (88) when the FP uses a centralvelocity dispersion σ0. Spearman and Pearson correlationcoefficients are quite weak (−0.32 to 0.16, and −0.31 to 0.21)for all parameters (whether on a logarithmic or linear scale),save two specific cases: the total-mass-to-light ratio (r= 0.52and ρ= 0.34) and the stellar-to-total-mass ratio (r=−0.59 andρ=−0.40). The nearly null p-values for these two parametersshow strong statistical significance. These two quantities areclosely linked, since our stellar mass measurements exploitluminosity and color values, so we discuss only the strongest ofthe two correlations with the stellar-to-total-mass ratio,M Mr
dyn1 2
* . No correlation between the FP residuals and the
stellar mass (r=−0.21)or the dynamical mass (r= 0.00) isfound. We also find C28 and Hubble type, both markers ofmorphology, to have correlations with p-values with asignificance level of 2σ or higher, but we believe that both ofthese correlationstracethe M Mr
dyn1 2
* correlation, since thestellar-to-total-mass ratio likely correlates with the morphologyitself. We do note that a large scatter or uncertainty on σ woulddrive the linear correlation we see in M Mr
dyn1 2
* , since anoverestimated σ would produce a lower M Mr
dyn1 2
* value andlarger FP residual (and vice versa for underestimated σ values).We must trust that our VD measurements are reasonablyaccurate.It is likely the ratio between stellar and total masses that
controls the FP tilt (Ciotti et al. 1996; Borriello et al. 2003); ahigher ratio yields larger negative residuals and is associatedwithgalaxies thatmove away from the FP best-fit line (alsoseen in Figure 9). The dark matter fraction within Re increaseswith total mass, or σ used as a proxy, for ETGs in the relevantmass range (Tortora et al. 2012) for a Chabrier IMF (Duttonet al. 2013), implying that it is the low-mass population with ahigher stellar mass fraction that deviates fromthe FP. TheHubble type assignments taken from the GOLDMine database(Gavazzi et al. 2003) may not accurately reflect the dwarfpopulation in SHIVir, and a strong residualcorrelation iscurrently lacking in our analysis for morphology. We stillconfirm that the galaxies with the largest negative FP residuals(shown to deviate downwards fromthe FP in Figure 9) areindeed low-total-mass systems. Other important contributors tothe tilt of the FP may include variations in the mass-to-lightratio of stellar populations (Faber et al. 1987; Prugniel &Simien 1996; Trujillo et al. 2004; Cappellari et al. 2013b;Cappellari 2016), galaxy age (Forbes et al. 1998), dynamicaland structural non-homology (Busarello et al. 1997; Graham &Colless 1997; Trujillo et al. 2004), and gas dissipationfollowing mergers (Robertson et al. 2006). Dutton et al.(2013) found that the rate at which thevelocity dispersionchanges with galaxy size (at any given stellar mass) is ameasure of the FP tilt produced by all these combined effects,which ultimately causethe FP to divergefrom an idealizedvirial theorem (Busarello et al. 1997).For the remainder of our analysis, we now merge the
SHIVir spectroscopic and photometric measurements for theLTGs (Section 3.3) and ETGs into one fundamental STMRof VCGs.
3.5. Stellar-to-total Mass Relation
While our separate investigations of the TFR and FP haveyielded compelling insights about their individual structure andevolution, we now wish to merge our entire catalog,irrespective of morphology, to obtain a most representativepicture of a galaxy’s evolutionary drivers. A number of strikingrelations between ETGs and LTGs emerge as a result. Webegin by addressing the relation between stellar and total massfor VCGs. This relates to the “stellar-to-halo mass relation”(SHMR) inferred from halo abundance matching (HAM)analyses, whereas webenefit from dynamically determinedtotal masses rather than dark matter masses alone. For SHIVir,rotational velocities and velocity dispersions are converted intodynamical masses as described in Section 2.4. Figure 11 showsthe STMRs with Mdyn for r<r1/2 (top panel) or r<r23.5(middle panel) and stellar masses M* inferred from meancolors within r23.5. Only galaxies with Vlog 1.5circ > are
15
The Astrophysical Journal, 843:74 (27pp), 2017 July 1 Ouellette et al.

included in the relations showcased in Sections 3.5–3.7; anumber of Irr galaxies below this range have uncertain circularvelocity values (see Section 3.1).
The scatter of the STMR may indicate different contributorsto evolutionary processes depending on mass regime (Guet al. 2016). Much like the TFR for LTGs with
Figure 10. FP residuals vs. dynamical mass within r1/2 log Mrdyn
1 2( ), stellar-mass-to-light ratio log(M*/L), semimajor-to-minor-axis ratio a/b, g−r, distance fromM87, stellar mass log(M*), C28, Hubble type, total-mass-to-light ratio log M Lr
dyn1 2( ),and stellar-to-total-mass ratio log M Mr
dyn1 2
*( ) (in order of increasing Pearsoncorrelation coefficient r, shown in the left corner of each panel along with the Spearman correlation coefficient ρ and p-value). M* and L are both measured within r1/2. The data are color-coded by Hubble type. A significant correlation exists for the log M Mr
dyn1 2
*( ) parameter; theblue dashed line traces the bestfit between that massratio and the FP residuals.
16
The Astrophysical Journal, 843:74 (27pp), 2017 July 1 Ouellette et al.

Vrot<95 km s−1, the increased scatter in the STMR is likelydue to the lack of rotational support in low-mass spirals. TheSTMR is tightest in the regime of massive ellipticals and early-
type spirals with M*�109.5Me. The latter corresponds to thetransition mass where rotational support for the overalldynamical equilibrium becomes significant (Simons
Figure 11. (Top) Virgo cluster STMR using a dynamical mass, Mdyn, measured inside r1/2, and a stellar mass M* measured inside r23.5 computed from SED fitting.All galaxies are part of the larger SHIVir catalog of 742 VCC galaxies; point colors indicate the source of the dynamical information for Mdyn. The dashed line is the1:1 relation and the solid black line is our fit up to Mdyn∼1011 Me. A curved dashed line accounts for the likely inflection at that transition. The lower limit STMRfrom Penny et al. (2015) is also shown (purple dash-dotted line). (Middle) STMR, now using the total (dynamical) mass measured inside r23.5 for the SHIVir datapoints, differentiated by morphology. Also shown are SHMRs for central and satellite galaxies that probe dynamical masses at very large radii (Leauthaud et al. 2012;Rodríguez-Puebla et al. 2013, 2015; Grossauer et al. 2015; Hudson et al. 2015), where Mtot is M200. Predictions for thedark matter content of some of these SHMRsare presented in Section 3.7. The SHMR ofHudson et al. (2015)is interpolated to M Mr
tot dyn23.5= (see text) for a direct comparison (double-dashed brown line) with
our data. The match is especially good. (Bottom) Velocity-stellar-mass relation of VCGs by morphological types, with the Pearson correlation coefficient, r, andscatter on log(Vcirc), σV. Vcirc is V23.5 for LTGs and c es´ for ETGs, as defined in Section 2.4.
17
The Astrophysical Journal, 843:74 (27pp), 2017 July 1 Ouellette et al.

et al. 2015). In Figure 11, middle panel, the scatter for galaxiesabove and below the transition mass is 0.18Mlog *
s = dex and0.33 dex respectively, in agreement with simulations (Rodrí-guez-Puebla et al. 2015; Gu et al. 2016), although theconcerned halo masses are measured within much larger radiithan our own total masses. This also matches typicalobservational estimates of SHMR scatter ranging from 0.15to 0.35 dex (Yang et al. 2009; More et al. 2011; Leauthaudet al. 2012; Behroozi et al. 2013b; Reddick et al. 2013; Tinkeret al. 2013; Kravtsov et al. 2014; Lehmann et al. 2017). Most ofthese studies used Mvir or M200 for their SHMRs. Somegalaxies haveM*�Mdyn, consistent with uncertainties and thefact that dark matter is subdominant in ETGs within r1/2 andr23.5 (Courteau & Dutton 2015). All but three data points inFigure 11, middle panel, fall below the 1:1 line, as would beexpected for dark-matter-dominated systems.
Various SHMRs are also shown in Figure 11 (middle panel).These are typically computed via HAM or the halo occupationdistribution (HOD) to estimate the halo mass at cosmologicalradii (e.g., R200). They are reported in Figure 11 as originallypublished, with no adjustment for the differences in size range.Leauthaud et al. (2012) found an SHMR turnover atM*=4.5×10¹⁰Me, decreasing slightly with redshift, whileBehroozi et al. (2013b) found the same trend for redshiftsbelow z=2, but with a reversal at higher redshifts. Thus, if theratio Mhalo/M* only changes weakly with redshift, it likelyplays a role in regulating quenching and other star formationprocesses, more so than halo mass alone. The SHIVir STMR(Figure 11, middle panel) shows a possible inflection (dottedline) above M*≈1011Me, consistent with Leauthaud et al.(2012), Rodríguez-Puebla et al. (2013, 2015) and to a lesserdegree, the low-amplitude curved SHMR for NGVS galaxieswith stellar masses in the range 105–10.4Me (Grossaueret al. 2015). These comparisons are only qualitative as themetrics for total mass are all slightly different (e.g., adynamical mass at small radius versus a halo mass at largeradius). An F-test shows a 45% chance that our STMR is bestfitted with a second-degree polynomial with an inflection ratherthan a straight line, and a 62% chance that a third-degreepolynomial fits the plotted inflection best. This is at odds withthe linear STMR of Penny et al. (2015), but their galaxies didnot exceed Mdyn=1011.7Me, the point at which a possibleinflection is observed. While this F-test cannot validate theexistence of this turning point in our data set, numerous studiesof galaxy groups and clusters have clearly cemented the notionof a maximum efficiency of stellar mass formation at halomasses near 1012Me (Mandelbaum et al. 2006; Behrooziet al. 2010; Leauthaud et al. 2012; Behroozi et al. 2013a).
Overall, the broad shapes of SHMRs and our own STMRagree for M*�1010Me, but the SHMR slopes are muchsteeper than those of our STMRat lower masses. Likewise,Rodríguez-Puebla et al. (2015) performed a segregated STMRanalysis of blue and red central galaxies, concluding that thescatter, shape, and amplitude of their SHMR for the twosamples are different. Within their probed stellar mass range of109–12Me, M*/Mh was found be larger for blue galaxies. Thedifference in STMR shape between SHIVir and Leauthaudet al. (2012) may well be linked to their investigation of fieldversus cluster galaxies. It can indeed be argued that most VCGsare satellite rather than central galaxies, and our STMR shouldbe compared to that of Rodríguez-Puebla et al. (2013) forsatellite galaxies (gray line); the closest match in shape is
indeed found above M*=1010.2Me. We also recallthat ourdynamical masses were measured directly using kinematics,rather than inferred through, say, abundance matching. A directcomparison of STMRs measured at r23.5 or R200 requireslinking inner and outer halo profiles. The clear discrepancybetween our STMR and the SHMRs of other studies reportedabove at low masses suggests that feedback effects, adiabaticcontraction (Chan et al. 2015), and other baryonic processes arelikely responsible for the nonlinear scaling between massescomputed within r23.5 and R200 (Dutton et al. 2011). Similarconclusions from a study of the STFR were reached by Milleret al. (2014).In order to compare the SHMRs plotted in Figure 11, middle
panel, with our STMR for masses computed within r23.5 (thephysical radius), we must interpolate the former to smallerradii. Figure 14 provides us with an estimate of r23.5 for a givenM*, Vcirc and morphological type (see Section 3.6 for a fullanalysis of these relations). If we assume an NFW dark matterdensity profile (Navarro et al. 1996) with a standardconcentration, we can calculate the dark matter mass Mhalo
(r< r23.5) expected within this radius (see Section 3.7 for moredetails). Summing with M* (r< r23.5) finally yields Mtot
(r< r23.5), which can be compared with our direct SHIVirmeasurements in Figure 11. Using the SHMR of Hudson et al.(2015)—which describes a mixture of blue (dominant at low-mass) and red (dominant at high-mass) galaxies—and theconcentration-mass relation given by Muñoz-Cuartas et al.(2011)—and converted from (Mvir, cvir) to (M200, c200) usingthe method of Hu & Kravtsov (2003)—we can infer one suchinterpolated STMR (thick brown double-dashed line inFigure 11, middle panel). Hudson’s interpolated STMR is aconsiderably better match in shape to our STMR, especially atlow masses, than any other original SHMRs reported inFigure 11.For clarity, we reproduce the middle panel of Figure 11in
Figure 12, where we identify the STMR for ETGs and LTGsseparately. The Hudson interpolation is shown prominently(double-dashed brown line) as well as a similar inwardinterpolated STMR by B. Mancillas & V. Avila-Reese (2017,in preparation) (single pink line). Mancillas & V. Avila-Reeseextracted their STMR from mock simulations of LTGs incentrifugal equilibrium within adiabatically contracted ΛCDMhalos; their stellar and dynamical masses are all inferred within2Re,which is quite appropriate for our comparison—werecallthat we find R23.5∼1–4 Re for our sample, r23.5=R23.5 forLTGs, and r23.5=(4/3)R23.5 for ETGs. Hudson’s STMRprovides a generally fair match at low masses. Additionally,Mancillas & Avila-Reese’s STMR is a great match for theSHIVir LTG sample below Mtot<1010Me, both slopes beingnearly identical. Their mean STMRslope is also in broadagreement with that of Rodríguez-Puebla et al. (2015) for bluegalaxies (blue solid line in Figure 11, middle panel). We expectMancillas & Avila-Reese’s STMR to match our LTG STMR,as it was constructed for LTGs.The flattening of the STMR (Mancillas & Avila-Reese)
starting at Mlog 10.8* ~ appears to be largely the imprint ofthe Mbar–Mvir relation, which turns over at Mvir∼1012Me.This well-studied turnover has great significance in galaxyformation models: on the one hand, at lower virial masses, thegravitational potential is weaker and significant gas outflowsdue to SN-driven feedback are allowed; on the other, at highermasses, two processes become systematically more relevant:
18
The Astrophysical Journal, 843:74 (27pp), 2017 July 1 Ouellette et al.

(1) the gas is (virial) shock-heated to very high temperaturesin such a way that the cooling timescale becomes verylong (in groups and clusters most baryons remain lockedin the virial shock-heated gas, inhibiting further galaxymass growth), and
(2) the formation of luminous AGNs is efficient in such away that the AGN feedback inhibits further stellar massgrowth or even promotes strong gas ejection.
The above mentioned processes become mostly irrelevant atvirial masses near 1012Me. For lower and higher masses, theprocesses mentioned above systematically reduce the stellar massgrowth efficiency (Avila-Reese et al. 2003; Behroozi et al. 2010).
Figure 12 also shows the STMR relation for our ETG andLTG samples separately. The LTG relation,
M Mlog 1.27 0.07 log 3.44 0.72 ,rdyn
23.5
* = - ( ) ( )
is considerably steeper than for ETGs,
M Mlog 0.93 0.02 log 0.09 0.20 .rdyn
23.5
* = + ( ) ( )
This may indicate that ETGs live in more massive and/orconcentrated halos than LTGs of the same stellar masses, at leastabove M*∼1010Me (further discussed in Section 3.7 andFigure 16), as seen in More et al. (2011) for satellite galaxies.Note that using the prescription ofSerra et al. (2016)for Vcirc forETGs would change their STMRzero-point by ∼0.2–0.3 dex.The distinct slope between the LTG and ETG STMRs would notchange. The STMR for the full catalog is
M Mlog 0.97 0.02 log 0.36 0.25 .rdyn
23.5
* = - ( ) ( )
Overall, it can be concluded from comparing abundance-matched SHMRs with our measured STMR that the former are
only valid at the highest masses where the stellar-to-haloassociations are least affected by stochasticity. Sawala et al.(2015) found HAM to fail at lowmasses because oferroneousmodel assumptions, including the assumptions that every halocan host a visible galaxy and that structure formation can beaccurately represented by dark-matter-only simulations. Usageof HAM has been constrained to galaxies with circularvelocities above a threshold value, sometimes as high as80 km s−1 (Trujillo-Gomez et al. 2011). Beyond this, thereliability of this technique hinges on including baryons(Trujillo-Gomez et al. 2011) and carefully choosing optimalresolution values for the required simulations (Klypinet al. 2015). When available, high-quality observational datasuch as those presented here are preferable to STMRsextrapolated from SHMRs or predicted by simulations.In Section 3.3we discussed the possible effect of distance
uncertainties on the TFR. Owingto morphological segregation,assuming a distance of 16.5 Mpc when none other isavailablecan be more precarious for spiral galaxies who tendto populate cluster outskirts than for ellipticals that are morelikely to be concentrated around the cluster center. Toaggravate the situation, all 69 SHIVir galaxies morphologicallyclassified as LTGs did not have catalog distances and wereconsequently assigned a value of 16.5 Mpc. In Figure 13wehighlight the effects of using a distance uncertainty of 15% forthe 69 LTGs and the 49 ETGs with no formal distanceavailable. When a published distance is available, the quoteduncertainty is readily used. Distance uncertainties affect boththe total dynamical mass and total luminosity since physicalradius is required. We find that distance errors can contribute∼35% of the STMR scatter for both ETGs and LTGs.
Figure 12. As in Figure 11, middle panel (same data). The STMR from B. Mancillas etal. (2017, in preparation) for simulated LTGs, with the stellar mass M* andtotal mass Mtot both measured within 2Re, is in pink. The SHIVir STMR is shown in blue for LTGs (Irr galaxies are excluded given their highly truncated and/oruncertain RCs), and in red for ETGs. The dashed line is again the 1:1 line.
19
The Astrophysical Journal, 843:74 (27pp), 2017 July 1 Ouellette et al.

Nevertheless, despite substantial distance errors, the distinctSTMR slopes between ETGs and LTGs remain.
3.6. The Stellar Mass TFR, Mass-size and Velocity-sizeRelations
Figures 11–12 show two distinct STMRs for ETGs andLTGs, the latter being steeper than the former.28 InSection 3.3we computed the STFR for SHIVir spirals forwhich extended RCs were measured. Including literaturesources and all morphologies now yields the followingrelations:
M Vlog 3.28 0.26 log 2.91 0.57circ* = ´ + ( ) ( )
for a sample of 69 LTGs and
M Vlog 2.56 0.07 log 4.23 0.15circ* = ´ + ( ) ( )
for a sample of 121 ETGs. For all galaxies, this relationbecomes
M Vlog 2.73 0.08 log 3.93 0.18circ* = ´ + ( ) ( )
with a scatter of 0.13 dexVlog circs = . The mean slope and scatterof the STFR (Figure 11, bottom panel) matches ΛCDMexpectations (Dutton et al. 2011). In the mass rangeM*>109.5Me, we find thatLTGscontain more stellar mass
than ETGs at a given Vcirc measurement, in agreement with theobservational data used by Trujillo-Gomez et al. (2011). Wealso tested the use of different velocity metrics in the STFR,
including S0.3, S0.5 (Kassin et al. 2007), andV Vrms e2
rot2s= + ,
and found that Vcirc produces the smallest STFR scatter.Figure 14, top left panel, shows the mass-size relation for
SHIVir VCGs in projected space. At any given projected radius,ETGs contain more stellar mass than LTGs, possibly due to thepresence of a relatively larger and more concentrated core; wesee a similar result for the trends with circular velocity as a proxyfor dynamical mass in Figure 5. Cappellari et al. (2013a) alsofound a strong link between bulge mass and global galaxyproperties for the ATLAS3D sample. As a result, galaxies withhigher mean SBs lie above the mean stellar mass-size relation(Hall et al. 2012). We find the relations for the ETGs,
M Rlog 2.89 0.09 log 7.85 0.06 ,23.5* = ´ + ( ) ( )
and LTGs,
M Rlog 2.98 0.19 log 7.41 0.15 ,23.5* = ´ + ( ) ( )
to be closely parallel with a significant offset ofMlog 0.45 dex* ~ between the samples’ zero-points.29 The
projected mass-size relation for the entire SHIVir catalog is
M Rlog 2.81 0.09 log 7.76 0.06 .23.5* = ´ + ( ) ( )
We visualize the bimodal nature of this relation in Figure 15.Separate histograms of the forward residuals in the mass-sizerelation for ETGs and LTGs are fitted with Gaussians with apeak offset of 0.32 dex, which roughly matches the interceptoffset between the two best-fit lines plotted on Figure 14, topleft panel. The bimodal nature of the residual distribution isconfirmed at the 82% level.We considered in Section 3.2 the possible evolutionary
tracks connecting different galaxy populations in luminosity/mass-size relations, to have a more direct probe for comparisonwith Faber et al. (2007), Cappellari et al. (2013b), Cappellari(2013), and Cappellari (2016). We can, as in Figure 5, identifythe blue spirals that are theorized to evolve into fast-rotatorETGs thatmay eventually merge to form the massive slow-rotator ETGs. Our projected mass-size relation (Figure 14, topleft panel) showcases the change in size as the evolutionoccurs: quenched spirals become more centrally concentratedand turn into ETGs as their bulges grow, and these ETGsbecome increasingly large and massive via dry mergers.Corresponding lines of evolution can be drawn in the STFR
plot (Figure 11, bottom panel) as they are in Figure 5 for theluminosity-size relation: quenched LTGs (Sa-Sb) evolve intoETGs (E/S0) with an increase in Vcirc, and these ETGs moveupwardin stellar mass and grow into the most massive ETGsalong lines of constant Vcirc via dry mergers. Cappellari et al.(2013b) identified a break at M*=3×10¹⁰Me between thetwo different power laws that delineate the zone of exclusion inthis mass-size distribution (see Cappellari 2016, Figure 23 for adepiction of this distribution). This break could correspond tothe slight downward turn in slope we observe in the upperenvelope of the E/S0 sample at Rlog 0.623.5 ~ andM*∼1010Me in Figure 14, top left panel. Cappellari et al.(2013b) identified this break at M*∼1010.5Me; the differencewith our own break location is likely due to different apertures
Figure 13. As in Figure 12 (same data), but data points and STMRs for ETGs/LTGs shown with distance uncertainties only. LTGs and their STMR areshown in navy blue, and ETGs and their STMR are shown in light red. Theblack dotted line is the 1:1 line. 1s level total STMR scatters and STMRscatters due to 15% distance uncertainties (shown about the best-fit STMRs asshaded blue and red regions) are indicated.
28 The low-mass ends of the two SHMRs for blue and red centrals ofRodríguez-Puebla et al. (2015) and Mandelbaum et al. (2016) show similar“bimodal” distributions and distinct slopes, but these concern central ratherthan satellite galaxies and are thus ill-suited for comparisons with VCGs. Thisis discussed further in Section 3.7.
29 For future plans, we aim to add more dwarf galaxies to the SHIVir survey todetermine if this offset is maintained across all mass regimes.
20
The Astrophysical Journal, 843:74 (27pp), 2017 July 1 Ouellette et al.

within which stellar mass was measured and systematicuncertainties in stellar masses. Whether this break is a truefeature or merely a sample bias will deserve deeperinvestigation and additional data. A secondary break atM*∼2×10⁹ was suggested by Cappellari et al. (2013a),below which spirals, fast-rotator ETGs, and dwarf spheroidalsare assumed to follow the same continuous relation. Thissecondary break coincidentally matches the threshold forquenching of field galaxies found by Geha et al. (2012): at
lower masses, only environmental effects such as gas stripping(Cappellari et al. 2013b) and strangulation (Peng et al. 2015)may quench these galaxies. Supernovae and stellar windsshould not terminate star formation in these low-mass systems(Emerick et al. 2016). Our sample could in principle allow us toobserve this second break down to Mlog 8.3* = , but theincreased scatter at low masses (for all the reasons statedabove) thwarts any conclusive insight in this regime. Tinkeret al. (2016) has shown that different quenching scenarios
Figure 14. (Top Left) Stellar-mass-size relation, with the Pearson correlation coefficient, r, and scatter on log(R23.5), R23.5s . Stellar mass is measured within acylindrical volume with projected radius R23.5. (Top Right) Same as in the top left panel, but the physical radius r23.5 is used, and stellar mass for ETGs is measuredinside a spherical volume of radius r23.5. (Bottom Left) Projected velocity-size relation, with the Pearson correlation coefficient, r, and scatter on log(Vcirc), Vcircs .Typical uncertainties are shown for all relations. (Bottom Right) Same as in the bottom left panel, but the physical radius r23.5 is used. Typical uncertainties are shownfor all relations.
21
The Astrophysical Journal, 843:74 (27pp), 2017 July 1 Ouellette et al.

(involving hitting critical values for parameters such asredshift, halo mass, stellar mass, or stellar-to-halo mass ratio)will yield varying STMR scatter.
We also inspect the SHIVir mass-size relation in physicalspace in Figure 14, top right panel. Here, we plot the physicalradius r23.5 versus stellar mass measured within a sphericalvolume of radius r23.5 for ETGs and a cylindrical volume ofradius r23.5=R23.5 for LTGs. The bimodality seen in projectedspace is now completely eliminated. We find the relations forthe ETGs,
M rlog 2.87 0.10 log 7.53 0.07 ,23.5* = ´ + ( ) ( )
and LTGs,
M rlog 2.93 0.18 log 7.47 0.14 ,23.5* = ´ + ( ) ( )
to be exactly the same within the uncertainties. The physicalmass-size relation for the entire SHIVir catalog is
M rlog 2.89 0.09 log 7.51 0.07 .23.5* = ´ + ( ) ( )
In this picture, the “mixed scenario” hypothesis is stillcompatible with our results, but the first step—wherein late-type spirals accrete gas to increase in stellar mass andeventually turn into fast-rotator ETGs via quenching (alsoreducing their size slightly)—is considerably shorter in themass-size space. The relative importance of this first stepversus that of the dry merger step in galaxies’ total massaccretion appears to depend on whether a projected space orphysical space mass-size relation is analyzed.
As a check, we also plot the velocity-size relation using bothprojected (Figure 14, bottom left panel) and physical (Figure 14,bottom right panel) radii. In both cases, we find distinct slopesbetween the ETG and LTG populations, similar to what wasfound for the STMR (Figure 12) and the STFR (Figure 11,bottom panel). Since both the STFR and mass-size relationhave the same slope in log–log space, we expect a slope of ∼1for the velocity-size relation: this is indeed observed within theuncertainties.
A joint analysis of all the relations presented in Figures 11and 14 should eventually provide the best insight into thephysics of galaxy formation.
3.7. Dark Matter Content and Halo Masses
We can estimate the dark matter mass within r23.5 bysubtracting the total stellar and gas mass from the dynamicalmass estimated at that radius. It is interesting to compare darkmatter mass estimates directly to model predictions fromcosmological simulations at the same radius.Simulations of cosmological structure formation find that
halos form with a universal density profile, originally describedby Navarro et al. (1996):
rr
r r r. 80 s
s3
rr
=+
( )( )
( )
This form has two free parameters, a characteristic density ρ0and a scale radius rs. The scale radius rs is usually specified interms of the virial radius rvir and the concentration parameterc=rvir/rs. There are several common choices for rvir; here weadopt the spherical collapse definition,
rM3
4,vir
vir
vir c
1 3
pd r=
⎛⎝⎜
⎞⎠⎟
where δvir is an overdensity predicted by the spherical collapsemodel to be δc∼100 at z=0 in ΛCDM. More recentevidence has shown that the universal profile deviates slightlybut systematically from this form, and is better described as athree-parameter Einasto profile (Gao et al. 2008; Dutton &Macciò 2014; Klypin et al. 2016). However, the differencesbetween the two forms in enclosed mass at R∼10 kpc arefairly minimal for halos in the mass range considered here; forsimplicity,we assume the NFW form of the density profile.The corresponding enclosed mass is
M r Mf x
f c, 9vir< =( ) ( )
( )( )
where x ≡ r/rs and f x x x xln 1 1º + - +( ) ( ) ( ).For the spherical collapse definition,
r M M250 kpc 10vir12 1 3= ( ) at z=0. The concentration
parameter c has been the subject of many detailed studies;see e.g., Dutton & Macciò (2014) or Klypin et al. (2016) forfull references. Correcting for the different profiles anddefinitions assumed, there is reasonable agreement betweenrecent studies in the predicted mean concentration as a functionof mass and redshift, at least in our mass range and at lowredshift. For a Planck cosmology, the expected meanconcentration is c=7–12 over the halo mass rangeM M M5 10 5 10h
10 12~ ´ - ´ (Dutton & Macciò 2014).On the other hand, these simulations also predict appreciablehalo-to-halo scatter in concentration, with log 0.13cs ~ , or afactor of 1.35. Thus we will consider a range of representativeconcentrations, from c=5 to c=15.Figure 16 shows enclosed dark matter mass versus r23.5 for
the SHIVir sample (points, colored by morphological type),compared with predictions for NFW profiles of various valuesof Mvir and c (curves, colored by mass and surrounded by ashaded region representing a range of concentrations). Startingfrom the top left-most panel, the halo masses expected fromprevious estimates of the SHMR (e.g., Grossauer et al. 2015,
Figure 15. Histogram of residuals on log(M*) in the projected mass-sizerelation (Figure 14, top left panel) for ETGs (light red) and LTGs (navy blue).The standard deviation σ of Gaussians fitted over each individual histogram isposted in the upper right corner. The F-test confidence result for a double vs. asingle Gaussian distribution is indicated.
22
The Astrophysical Journal, 843:74 (27pp), 2017 July 1 Ouellette et al.

plotted in the middle panel of Figure 11) are Mlog 11h ~ , 11.2,11.4, 11.6, 11.8, and 12.2, while the other SHMRs shown inFigure 11, middle panel, predict values ∼0.2–0.3 dex lower.For the lower mass bins, these predictions seem in goodagreement with the data; given observational uncertainties,most individual galaxies are consistent with halos in thepredicted mass range and with a reasonable concentration, withonly a few points lying ∼1–2σ above the expected relation. Athigher stellar masses ( Mlog 9.9* > ), we see some evidence formore enclosed mass than expected from the z=0 prediction,particularly for the ETGs. The same trend is seen in Figure 12,where the predictions from Hudson et al. (2015) orB. Mancillas et al. (2017, in preparation) lie 0.2–0.3 dex tothe left of the mean Mtot measured for the ETGs, but areroughly consistent with the mean Mtot measured for the LTGs.
There are at least four possible explanations for this excess.The first is the effect of formation redshift. Our sample consistsof cluster galaxies, some of which formed in the field at higherredshift and fell into the cluster well before z=0. Theproperties of these systems should correspond to those of fieldhalos at higher redshift. Our own calculations indicate that thepredictions for z=1 would lie about 0.1–0.2 dex above thoseshown, and could explain some of the offset seen in Figure 16(as well as the possible difference between ETGs and LTGs—see Thomas et al. 2009). Another possibility is that these
massive systems have experienced more adiabatic contraction.Furthermore, since MDM=Mtot−M*, inferred dark mattermasses can depend strongly on the IMF assumed for the stellarcomponent, especially at higher masses (Dutton et al. 2013;Dutton & Treu 2014). We note, however, that a different IMFwould not affect the total mass estimates discussed earlier, andthat these alsoshowed excess mass relative to the predictions athigh stellar mass. Finally, we note that Grossauer et al. (2015)found a similar upturn in their Virgo SHMR at highstellarmasses as part of the NGVS, relative to field results such asBehroozi et al. (2013b). If cluster galaxies, which findthemselves in relatively dense environments from the outset,formed less efficiently than their field equivalents even beforethey merged into the cluster, this might explain such an offset.More detailed modeling of Virgo and other clusters will berequired to fully test this hypothesis.We note an offset of 0.3–0.5 dex in dark matter content
between LTGs and ETGs in the two highest stellar mass bins.Note that the use of Serra et al. (2016)ʼs Vcirc prescription—which would subsequently affect both Mdyn and MDM
measurements—would likely decrease the size of this off-set,although it wouldnot completely erase it. This differencein halo mass between LTGs and ETGs has been observed byThomas et al. (2009) (in a sample of Coma cluster members),Dutton et al. (2011), and more recently by Mandelbaum et al.
Figure 16. Dark halo mass within r23.5 as a function of r23.5. The SHIVir data set is divided into sixstellar mass bins (chosen so that each bin would have roughly thesame sample size), and all data points are color-coded by morphological type. NFW predictions based on varying virial halo masses Mvir and concentrations c areshown. Typical uncertainties are shown in the bottom right corner.
23
The Astrophysical Journal, 843:74 (27pp), 2017 July 1 Ouellette et al.

(2016) (for a sample of central locally brightest galaxies),whereby ETGs live in more massive halos than LTGs for agiven stellar mass at M*>109.9Me; note that Hudson et al.(2015) found the opposite trend. Mandelbaum et al.(2016)further amplified this differencefor galaxies with stellarmasses higher than 1011Me. It seems likely that this∼2–3× difference in halo masses is independent of environ-ment and could indicate systematic differences in halocontraction or formation epoch, as a function of galaxy type.The lack of major mergers in the formation history of LTGsmay be chief in driving this difference (Dutton et al. 2011).
4. Summary and Conclusions
We have presented the first results from the spectroscopiccomponent of the SHIVir survey. Using carefully assembledscaling relations, we can paint a global picture of galaxystructural properties within a cluster environment. We find astrong bimodality in both SB and circular velocity for bothETGs and LTGs, possibly indicating dynamically unstablemodes of galaxy formation. The TFR for Virgo cluster galaxiesshows the same slope and normalization as that of fieldgalaxies, but the TFR scatter for this galaxy cluster is largerthan that of the field. Environmentally dependent processessuch as tidal stripping and tidal interactions apparently do notinfluence the dark matter halo, which strongly regulates a spiralgalaxy’s maximumrotational velocity, but may increase thescatter in cluster TFRs. TFR scatter is minimized when V23.5
i ,the deprojected circular velocity measured at the isophotal levelof 23.5 mag arcsec−2, is used since the likelihood of samplingthe flat part of the RC is increased. With slopes of ∼4 and∼3.5, respectively, our stellar mass and baryonic TFRs arefound to match those of others (Hall et al. 2012; Bradfordet al. 2016). Following Hall et al. (2012), we stress that scalingrelation parameters are subject to the vagaries of fittingmethods. The long-slit spectroscopy used in this study hasalso enabled the sampling of velocity dispersions beyondcurrent integral field unit maps; as a result, we find that the FPscatter is minimized at (or beyond) 2Re where the transitionmid-point between baryon-to-dark-matter domination typicallyoccurs. The FPs for giant and dwarf ellipticals follow apossibly continuous but curved plane, suggesting analogousformation processes. FP residuals, or “tilt” of the FP, are foundto correlate with galaxies’ dark matter fraction (total-to-stellar-mass ratio). This, as well as the independence of the TFRscatter on SB or any other parameter, yields stringent galaxyformation constraints such as the characterization of the stellarIMF, impact of adiabatic contraction, and likely evolutionarypaths of galaxies. In the Virgo cluster, we find the contributionof distance errors to the scaling relationscatters to besubstantial: 50% for the TFR, 25% for the FP, and 20%–35%for the STMR. For the TFR and STMR, that scatter increases atthe low-mass end where the slope of the baryonic TFR istypically steeper. The total typical uncertainties for our stellarand dynamical masses are 0.11 dex and 0.08 dex, respectively.
Our presentation of the Virgo cluster STMR and otherscaling relations highlights a number of fundamental linksbetween galaxy structural and dynamical parameters involvingill-constrained evolutionary scenarios and self-regulatingprocesses: a possible turnover in the STMR at M*≈1011Me concordant with other independent results, an increasein the scatter of the STMR and STFR below the transitionstellar mass of ∼109.5Me, a discrepancy in the slopes of
STMRs/SHMRs based on dynamical masses measured withinoptical radii (Mr
dyn23.5) or the entire galaxy (M200) between ETGs
and LTGs, and a gradient in morphology (or SB) in the mass-size relation.Most SHMR studies hint at a maximumSF efficiency where
M*/Mhalo is largest. Our data are too sparse in the relevantmass range to confirm this putative turnover, but they are notinconsistent with it either. If this feature is real, it suggests thatSF mechanisms are sensitive to the baryon-to-dark-matter ratioat the optical radius even if the dark matter content may berelatively low within that radius. Quenching should thusstrongly depend on halo mass rather than stellar mass (Wooet al. 2013) for the Virgo cluster, which is mostly dominated bysatellite galaxies. In addition to quenching mechanismsaffecting central galaxies (gas depletion, heating, feedback),these satellites are subjected to their own unique mechanisms(ram pressure stripping, strangulation). This may explain theconsistency of the highest mass range of our data with thisturnover, and why the satellite SHMR from Rodríguez-Pueblaet al. (2013) flattens at lower masses than other SHMRs.We provide in Table 2 a summary of the salient two-
parameter scaling relations presented in this paper. Our best-fitthree-parameter FPis given by
Rlog kpc 0.17 1.15 log km s
0.76 log mag arcsec .e e
1
e2
s= +- S
-
-
( ) ( )( )
The distinct nature of the relations shown in Figures 11, 12, and14 (top left, bottom left, and right panels) and Figure 16between ETGs and LTGs solidifies the notion that these twogroups are driven by different evolutionary scenarios. Thedifferent formation histories of ETGs and LTGs seem to resultin a notable offset between their respective galaxy sizes.However, the scatter in our estimates of σ, and thus Vcirc andMdyn for ETGs along with the assumptions made in Section 2.4,complicate the confirmation of genuine, intrinsic physicalmechanisms regarding any offset with LTGs. Still, the presenceof this offset in the projected mass-size relation, which does notsuffer from any velocity transformations, suggests thatparameters such asbulge mass and concentration may bedriving the evolution of galaxies with color, morphological,size, star formation, and mass. We do note, however, that thisoffset disappears in the physical mass-size relation. A numberof steps can be taken to reduce the interpretation biases orfurther uncertainty in the quest toward understanding galaxyformation and evolution based on scaling relations. Theseinclude unbiased mass estimates based on robust velocity andmass metrics (free of deprojection uncertainty), bridging thegap in the dynamical mapping of the inner and outer regions ofgalaxies, augmenting dynamical databases for fainter galaxiesinto the low-mass regime, and expanding scaling relationmanifolds with stellar population parameters such as age andmetallicity.
N.N.Q.O. acknowledges support from the Natural Scienceand Engineering Research Council (NSERC) of Canada througha PGS D3 scholarship. S.C. acknowledges support from theNSERC of Canada through a generous Research DiscoveryGrant. M.C. acknowledges support from a Royal SocietyUniversity Research Fellowship. Mike Hudson is thankedwarmly for interpolating his SHMR based on our data in order
24
The Astrophysical Journal, 843:74 (27pp), 2017 July 1 Ouellette et al.

to match the STMR presented in Figure 12, along with VladimirAvila-Reese and Brisa Mancillas for providing the STMR fortheir simulated LTGs. We are also grateful to Jakob Walcher,Alexie Leauthaud, and Kristine Spekkens for insightful com-ments. Finally, our revised manuscript benefited greatly from thereferee’s thoughtful and constructive suggestions.
References
Aaronson, M., Bothun, G., Mould, J., et al. 1986, ApJ, 302, 536Abazajian, K., Adelman-McCarthy, J. K., Agüeros, M. A., et al. 2003, AJ,
126, 2081Adelman-McCarthy, J. K., Agüeros, M. A., Allam, S. S., et al. 2008, ApJS,
175, 297Arnold, J. A., Romanowsky, A. J., Brodie, J. P., et al. 2014, ApJ, 791, 80Avila-Reese, V., Firmani, C., & Vázquez-Semadeni, E. 2003, RMxAC, 17, 66Avila-Reese, V., Zavala, J., Firmani, C., & Hernández-Toledo, H. M. 2008, AJ,
136, 1340Bacon, R., Copin, Y., Monnet, G., et al. 2001, MNRAS, 326, 23Behroozi, P. S., Conroy, C., & Wechsler, R. H. 2010, ApJ, 717, 379Behroozi, P. S., Wechsler, R. H., & Conroy, C. 2013a, ApJL, 762, L31Behroozi, P. S., Wechsler, R. H., & Conroy, C. 2013b, ApJ, 770, 57Bekeraité, S., Walcher, C. J., Falcón-Barroso, J., et al. 2016, A&A, 593, A114Bender, R., Burstein, D., & Faber, S. M. 1992, ApJ, 399, 462Bernardi, M., Sheth, R. K., Annis, J., et al. 2003, AJ, 125, 1866Bertola, F., Bettoni, D., Danziger, J., et al. 1991, ApJ, 373, 369Binggeli, B., Sandage, A., & Tammann, G. A. 1985, AJ, 90, 1681Blakeslee, J. P., Jordán, A., Mei, S., et al. 2009, ApJ, 694, 556Borriello, A., Salucci, P., & Danese, L. 2003, MNRAS, 341, 1109Bradford, J. D., Geha, M. C., & van den Bosch, F. C. 2016, ApJ, 832, 11Bundy, K., Bershady, M. A., Law, D. R., et al. 2015, ApJ, 798, 7Bundy, K., Treu, T., & Ellis, R. S. 2007, ApJL, 665, L5Burstein, D., Bender, R., Faber, S., & Nolthenius, R. 1997, AJ, 114, 1365Busarello, G., Capaccioli, M., Capozziello, S., Longo, G., & Puddu, E. 1997,
A&A, 320, 415Cappellari, M. 2013, ApJL, 778, L2
Cappellari, M. 2016, ARA&A, 54, 597Cappellari, M. 2017, MNRAS, 466, 798Cappellari, M., Bacon, R., Bureau, M., et al. 2006, MNRAS, 366, 1126Cappellari, M., & Emsellem, E. 2004, PASP, 116, 138Cappellari, M., Emsellem, E., Krajnović, D., et al. 2011a, MNRAS, 413, 813Cappellari, M., Emsellem, E., Krajnović, D., et al. 2011b, MNRAS, 416, 1680Cappellari, M., McDermid, R. M., Alatalo, K., et al. 2012, Natur, 484, 485Cappellari, M., McDermid, R. M., Alatalo, K., et al. 2013a, MNRAS,
432, 1862Cappellari, M., Scott, N., Alatalo, K., et al. 2013b, MNRAS, 432, 1709Chabrier, G. 2003, PASP, 115, 763Chan, T. K., Kereš, D., Oñorbe, J., et al. 2015, MNRAS, 454, 2981Chemin, L., Balkowski, C., Cayatte, V., et al. 2006, MNRAS, 366, 812Ciotti, L. 1991, A&A, 249, 99Ciotti, L., Lanzoni, B., & Renzini, A. 1996, MNRAS, 282, 1Côté, P., Blakeslee, J. P., Ferrarese, L., et al. 2004, ApJS, 153, 223Courteau, S. 1996, ApJS, 103, 363Courteau, S. 1997, AJ, 114, 2402Courteau, S., Cappellari, M., de Jong, R. S., et al. 2014, RvMP, 86, 47Courteau, S., & Dutton, A. A. 2015, ApJL, 801, L20Courteau, S., Dutton, A. A., van den Bosch, F. C., et al. 2007a, ApJ, 671, 203Courteau, S., McDonald, M., Widrow, L. M., & Holtzman, J. 2007b, ApJL,
655, L21Courteau, S., & Rix, H.-W. 1999, ApJ, 513, 561Courteau, S., Willick, J. A., Strauss, M. A., Schlegel, D., & Postman, M. 2000,
ApJ, 544, 636Croom, S. M., Lawrence, J. S., Bland-Hawthorn, J., et al. 2012, MNRAS,
421, 872Dalcanton, J. J., Spergel, D. N., Gunn, J. E., Schmidt, M., & Schneider, D. P.
1997, AJ, 114, 635Dekel, A., & Birnboim, Y. 2006, MNRAS, 368, 2Desmond, H., & Wechsler, R. H. 2017, MNRAS, 465, 820Djorgovski, S., & Davis, M. 1987, ApJ, 313, 59Dressler, A. 1980, ApJ, 236, 351Dressler, A., Lynden-Bell, D., Burstein, D., et al. 1987, ApJ, 313, 42Dubois, Y., Gavazzi, R., Peirani, S., & Silk, J. 2013, MNRAS, 433, 3297Dutton, A. A., Conroy, C., van den Bosch, F. C., et al. 2011, MNRAS,
416, 322
Table 2Galaxy Scaling Relations for Virgo Cluster
Relation Sample y x Slope Zero-point Scatter (dex) N
TFR LTGs Mi log(V23.5i ) −7.12±0.28 −5.25±0.10 0.216 46
BTFR LTGs log(Mbar) log(V23.5i ) 3.57±0.16 2.44±0.35 0.280 46
STMR LTGs log(M*) log(Mrdyn
23.5) 1.27±0.07 −3.44±0.72 0.342 69
ETGs 0.93±0.02 0.09±0.20 0.231 121All 0.97±0.02 −0.36±0.25 0.294 190
STFR LTGs log(M*) log(Vcirc) 3.28±0.26 2.91±0.57 0.448 69ETGs 2.56±0.07 4.23±0.15 0.301 121All 2.73±0.08 3.93±0.18 0.367 190
Projected Mass-Size LTGs log(M*) log(R23.5) 2.98±0.19 7.41±0.15 0.448 69ETGs 2.89±0.09 7.85±0.06 0.358 121All 2.81±0.09 7.76±0.06 0.394 190
Physical Mass-Size LTGs log(M*) log(r23.5) 2.93±0.18 7.47±0.14 0.438 69ETGs 2.87±0.10 7.53±0.07 0.350 121All 2.89±0.09 7.51±0.07 0.356 190
Projected Velocity-Size LTGs log(Vcirc) log(R23.5) 0.89±0.08 1.39±0.06 0.137 69ETGs 1.12±0.05 1.43±0.03 0.182 121All 1.02±0.04 1.42±0.03 0.194 190
Physical Velocity-Size LTGs log(Vcirc) log(r23.5) 0.89±0.08 1.39±0.06 0.137 69ETGs 1.12±0.05 1.29±0.03 0.182 121All 1.06±0.04 1.31±0.03 0.172 190
Note.The LTG sample, ETG sample, and All Morphologies sample are presented separately. R23.5 and r23.5 are in kpc. V23.5i is in km s−1. All masses are in Me. The
slope, zero-point, scatter σ, and sample size N are given for each relation.
25
The Astrophysical Journal, 843:74 (27pp), 2017 July 1 Ouellette et al.

Dutton, A. A., & Macciò, A. V. 2014, MNRAS, 441, 3359Dutton, A. A., Macciò, A. V., Mendel, J. T., & Simard, L. 2013, MNRAS,
432, 2496Dutton, A. A., & Treu, T. 2014, MNRAS, 438, 3594Dutton, A. A., & van den Bosch, F. C. 2009, MNRAS, 396, 141Dutton, A. A., van den Bosch, F. C., Dekel, A., & Courteau, S. 2007, ApJ,
654, 27Emerick, A., Mac Low, M.-M., Grcevich, J., & Gatto, A. 2016, ApJ, 826, 148Emsellem, E., Cappellari, M., Krajnović, D., et al. 2011, MNRAS, 414, 888Faber, S. M., Dressler, A., Davies, R. L., Burstein, D., & Lynden-Bell, D.
1987, in Nearly Normal Galaxies. From the Planck Time to the Present, ed.S. M. Faber (New York: Springer), 175
Faber, S. M., & Jackson, R. E. 1976, ApJ, 204, 668Faber, S. M., Willmer, C. N. A., Wolf, C., et al. 2007, ApJ, 665, 265Falcón-Barroso, J., Sánchez-Blázquez, P., Vazdekis, A., et al. 2011a, A&A,
532, A95Falcón-Barroso, J., van de Ven, G., Peletier, R. F., et al. 2011b, MNRAS,
417, 1787Fall, S. M., & Romanowsky, A. J. 2013, ApJL, 769, L26Fernández Lorenzo, M., Cepa, J., Bongiovanni, A., et al. 2011, A&A, 526, A72Ferrarese, L., Côté, P., Cuillandre, J.-C., et al. 2012, ApJS, 200, 4Ferrarese, L., Côté, P., Sánchez-Janssen, R., et al. 2016, ApJ, 824, 10Forbes, D. A., Ponman, T. J., & Brown, R. J. N. 1998, ApJL, 508, L43Fouqué, P., Bottinelli, L., Gouguenheim, L., & Paturel, G. 1990, ApJ, 349, 1Freeman, K. C. 1970, ApJ, 160, 811Fukugita, M., Okamura, S., & Yasuda, N. 1993, ApJL, 412, L13Gao, L., Navarro, J. F., Cole, S., et al. 2008, MNRAS, 387, 536Gavazzi, G., Boselli, A., Donati, A., Franzetti, P., & Scodeggio, M. 2003,
A&A, 400, 451Geha, M., Blanton, M. R., Yan, R., & Tinker, J. L. 2012, ApJ, 757, 85Geha, M., Guhathakurta, P., & van der Marel, R. P. 2003, AJ, 126, 1794Giovanelli, R., Haynes, M. P., Herter, T., et al. 1997, AJ, 113, 53Graham, A., & Colless, M. 1997, MNRAS, 287, 221Graham, A. W. 2005, in IAU Coll. 198: Near-fields Cosmology with Dwarf
Elliptical Galaxies, ed. H. Jerjen & B. Binggeli (Cambridge: CambridgeUniv. Press), 303
Graham, A. W., & Guzmán, R. 2003, AJ, 125, 2936Graham, A. W., & Guzman, R. 2004, in Penetrating Bars Through Masks of
Cosmic Dust, ed. D. L. Block et al. (Dordrecht: Kluwer AcademicPublishers), 723
Granato, G. L., De Zotti, G., Silva, L., Bressan, A., & Danese, L. 2004, ApJ,600, 580
Grossauer, J., Taylor, J. E., Ferrarese, L., et al. 2015, ApJ, 807, 88Gu, M., Conroy, C., & Behroozi, P. 2016, ApJ, 833, 2Gurovich, S., Freeman, K., Jerjen, H., Staveley-Smith, L., & Puerari, I. 2010,
AJ, 140, 663Hall, M., Courteau, S., Dutton, A. A., McDonald, M., & Zhu, Y. 2012,
MNRAS, 425, 2741Haynes, M. P., Giovanelli, R., Martin, A. M., et al. 2011, AJ, 142, 170Hernquist, L. 1990, ApJ, 356, 359Hu, W., & Kravtsov, A. V. 2003, ApJ, 584, 702Hudson, M. J., Gillis, B. R., Coupon, J., et al. 2015, MNRAS, 447, 298Jerjen, H., Binggeli, B., & Barazza, F. D. 2004, AJ, 127, 771Karachentsev, I. D., Kaisina, E. I., & Kashibadze, O. G. 2017, AJ, 153, 6Kassin, S. A., Weiner, B. J., Faber, S. M., et al. 2007, ApJL, 660, L35Kaviraj, S., Huertas-Company, M., Cohen, S., et al. 2014, MNRAS, 443, 1861Kelly, B. C. 2007, ApJ, 665, 1489Kent, S. M. 1981, ApJ, 245, 805Klypin, A., Prada, F., Yepes, G., Heß, S., & Gottlöber, S. 2015, MNRAS,
447, 3693Klypin, A., Yepes, G., Gottlöber, S., Prada, F., & Heß, S. 2016, MNRAS,
457, 4340Koopmann, R. A., & Kenney, J. D. P. 2004, ApJ, 613, 866Kormendy, J. 1985, ApJ, 295, 73Kravtsov, A., Vikhlinin, A., & Meshscheryakov, A. 2014, arXiv:1401.7329La Barbera, F., Busarello, G., Merluzzi, P., et al. 2008, ApJ, 689, 913Leauthaud, A., Tinker, J., Bundy, K., et al. 2012, ApJ, 744, 159Lee, J., Rey, S. C., & Kim, S. 2014, ApJ, 791, 15Lehmann, B. V., Mao, Y.-Y., Becker, M. R., Skillman, S. W., &
Wechsler, R. H. 2017, ApJ, 834, 37Lelli, F., Duc, P.-A., Brinks, E., et al. 2015, A&A, 584, A113Mandelbaum, R., Seljak, U., Kauffmann, G., Hirata, C. M., & Brinkmann, J.
2006, MNRAS, 368, 715Mandelbaum, R., Wang, W., Zu, Y., et al. 2016, MNRAS, 457, 3200McCall, M. L., Vaduvescu, O., Pozo Nunez, F., et al. 2012, A&A, 540, A49McDonald, M., Courteau, S., & Tully, R. B. 2009a, MNRAS, 393, 628
McDonald, M., Courteau, S., & Tully, R. B. 2009b, MNRAS, 394, 2022McDonald, M., Courteau, S., Tully, R. B., & Roediger, J. 2011, MNRAS,
414, 2055McGaugh, S. S., Schombert, J. M., Bothun, G. D., & de Blok, W. J. G. 2000,
ApJL, 533, L99Mei, S., Blakeslee, J. P., Côté, P., et al. 2007, ApJ, 655, 144Mendes de Oliveira, C., Amram, P., Plana, H., & Balkowski, C. 2003, AJ,
126, 2635Miller, S. H., Bundy, K., Sullivan, M., Ellis, R. S., & Treu, T. 2011, ApJ,
741, 115Miller, S. H., Ellis, R. S., Newman, A. B., & Benson, A. 2014, ApJ, 782, 115Milvang-Jensen, B., Aragón-Salamanca, A., Hau, G. K. T., Jørgensen, I., &
Hjorth, J. 2003, MNRAS, 339, L1Mo, H. J., & Mao, S. 2000, MNRAS, 318, 163Mocz, P., Green, A., Malacari, M., & Glazebrook, K. 2012, MNRAS, 425, 296More, S., van den Bosch, F. C., Cacciato, M., et al. 2011, MNRAS, 410, 210Muñoz-Cuartas, J. C., Macciò, A. V., Gottlöber, S., & Dutton, A. A. 2011,
MNRAS, 411, 584Murray, N., Quataert, E., & Thompson, T. A. 2005, ApJ, 618, 569Nakamura, O., Aragón-Salamanca, A., Milvang-Jensen, B., et al. 2006,
MNRAS, 366, 144Navarro, J. F., Frenk, C. S., & White, S. D. M. 1996, ApJ, 462, 563Navarro, J. F., & Steinmetz, M. 2000, ApJ, 538, 477Neistein, E., Maoz, D., Rix, H.-W., & Tonry, J. L. 1999, AJ, 117, 2666Norris, M. A., Kannappan, S. J., Forbes, D. A., et al. 2014, MNRAS, 443,
1151Obreschkow, D., & Glazebrook, K. 2014, ApJ, 784, 26Papastergis, E., Martin, A. M., Giovanelli, R., & Haynes, M. P. 2011, ApJ,
739, 38Paturel, G., Petit, C., Prugniel, P., et al. 2003, A&A, 412, 45Peng, Y., Maiolino, R., & Cochrane, R. 2015, Natur, 521, 192Penny, S. J., Janz, J., Forbes, D. A., Benson, A. J., & Mould, J. 2015, MNRAS,
453, 3635Pizagno, J., Prada, F., Weinberg, D. H., et al. 2007, AJ, 134, 945Prugniel, P., & Simien, F. 1996, A&A, 309, 749Reddick, R. M., Wechsler, R. H., Tinker, J. L., & Behroozi, P. S. 2013, ApJ,
771, 30Robertson, B., Cox, T. J., Hernquist, L., et al. 2006, ApJ, 641, 21Rodríguez-Puebla, A., Avila-Reese, V., & Drory, N. 2013, ApJ, 767, 92Rodríguez-Puebla, A., Avila-Reese, V., Yang, X., et al. 2015, ApJ, 799, 130Roediger, J. C., & Courteau, S. 2015, MNRAS, 452, 3209Roediger, J. C., Courteau, S., MacArthur, L. A., & McDonald, M. 2011a,
MNRAS, 416, 1996Roediger, J. C., Courteau, S., McDonald, M., & MacArthur, L. A. 2011b,
MNRAS, 416, 1983Roediger, J. C., Courteau, S., Sánchez-Blázquez, P., & McDonald, M. 2012,
ApJ, 758, 41Rubin, V. C., Waterman, A. H., & Kenney, J. D. P. 1997, BAAS, 29,
105.15Rubin, V. C., Waterman, A. H., & Kenney, J. D. P. 1999, AJ, 118, 236Ryś, A., van de Ven, G., & Falcón-Barroso, J. 2014, MNRAS, 439, 284Sánchez, S. F., Kennicutt, R. C., Gil de Paz, A., et al. 2012, A&A, 538, A8Sánchez-Blázquez, P., Peletier, R. F., Jiménez-Vicente, J., et al. 2006,
MNRAS, 371, 703Sawala, T., Frenk, C. S., Fattahi, A., et al. 2015, MNRAS, 448, 2941Schlafly, E. F., & Finkbeiner, D. P. 2011, ApJ, 737, 103Scott, N., Fogarty, L. M. R., Owers, M. S., et al. 2015, MNRAS, 451, 2723Serra, P., Oosterloo, T., Cappellari, M., den Heijer, M., & Józsa, G. I. G. 2016,
MNRAS, 460, 1382Simons, R. C., Kassin, S. A., Weiner, B. J., et al. 2015, MNRAS, 452, 986Smith, R. J. 2014, MNRAS, 443, L69Sorce, J. G., Courtois, H. M., Sheth, K., & Tully, R. B. 2013, MNRAS, 433, 751Springel, V., Di Matteo, T., & Hernquist, L. 2005, MNRAS, 361, 776Terrazas, B. A., Bell, E. F., Henriques, B. M. B., & White, S. D. M. 2016,
MNRAS, 459, 1929Thomas, J., Saglia, R. P., Bender, R., et al. 2009, ApJ, 691, 770Tinker, J. L., Leauthaud, A., Bundy, K., et al. 2013, ApJ, 778, 93Tollerud, E. J., Bullock, J. S., Graves, G. J., & Wolf, J. 2011, ApJ, 726,
108Tinker, J., Wetzel, A., Conroy, C., & Mao, Y.Y. 2016, arXiv:1609.03388Toloba, E., Boselli, A., Cenarro, A. J., et al. 2011, A&A, 526, A114Toomre, A. 1977, in Evolution of Galaxies and Stellar Populations, ed.
B. M. Tinsley & R. B. Larson (New Haven, CT: Yale UniversityObservatory), 401
Tortora, C., La Barbera, F., Napolitano, N. R., de Carvalho, R. R., &Romanowsky, A. J. 2012, MNRAS, 425, 577
26
The Astrophysical Journal, 843:74 (27pp), 2017 July 1 Ouellette et al.

Trujillo, I., Burkert, A., & Bell, E. F. 2004, ApJL, 600, L39Trujillo-Gomez, S., Klypin, A., Primack, J., & Romanowsky, A. J. 2011, ApJ,
742, 16Tully, R. B., Courtois, H. M., & Sorce, J. G. 2016, AJ, 152, 50Tully, R. B., & Fisher, J. R. 1977, A&A, 54, 661Tully, R. B., Pierce, M. J., Huang, J.-S., et al. 1998, AJ, 115, 2264Tully, R. B., & Shaya, E. J. 1984, ApJ, 281, 31Tully, R. B., & Verheijen, M. A. W. 1997, ApJ, 484, 145van den Bosch, F. C. 2000, ApJ, 530, 177
van Zee, L., Skillman, E. D., & Haynes, M. P. 2004, AJ, 128, 121Vogt, N. P. 1995, PhD thesis, Cornell Univ.Willick, J. A., Courteau, S., Faber, S. M., et al. 1997, ApJS, 109, 333Willick, J. A., & Strauss, M. A. 1998, ApJ, 507, 64Woo, J., Courteau, S., & Dekel, A. 2008, MNRAS, 390, 1453Woo, J., Dekel, A., Faber, S. M., et al. 2013, MNRAS, 428, 3306Yang, X., Mo, H. J., & van den Bosch, F. C. 2009, ApJ, 695, 900Zwaan, M. A., van der Hulst, J. M., de Blok, W. J. G., & McGaugh, S. S. 1995,
MNRAS, 273, L35
27
The Astrophysical Journal, 843:74 (27pp), 2017 July 1 Ouellette et al.