the spectroscopic (ft-ir, ft-raman, nmr & uv-vis) … · analysis of maleic anhydride has been...
TRANSCRIPT

IOSR Journal of Applied Physics (IOSR-JAP) e-ISSN: 2278-4861.Volume 8, Issue 3 Ver. II (May. - Jun. 2016), PP 01-14 www.iosrjournals.org
DOI: 10.9790/4861-0803020114 www.iosrjournals.org 1 | Page
The Spectroscopic (FT-IR, FT-Raman, NMR & UV-Vis) and first order hyperpolarizability, Homo and Lumo analysis of Maleic
anhydride By HF and DFT Methods
R. Durga1, S. Anand1, K. Rajkumar1, S. Ramalingam1, R.S. Sundararajan2 1 Department of Physics, A.V.C. College, Mayiladuthurai, Tamilnadu, India.
2 Department of Physics, Government Arts College, Kumbakonam, Tamilnadu, India. Abstract: In this work, experimental and theoretical study on the molecular structure and the vibrational spectra of Maleic anhydride is presented. The vibrational frequencies of the title compound were obtained theoretically by HF and DFT calculations employing the standard 6-311++G(d,p) basis sets for optimized geometry and were compared with Fourier transform infrared spectrum (FTIR) in the range of 100–4000 cm−1 and with Fourier Transform Raman spectrum in the range of 100–4000 cm−1. Complete vibrational assignments, analysis and correlation of the fundamental modes for the title compound were carried out. The vibrational harmonic frequencies were scaled using scale factor, yielding a good agreement between the experimentally recorded and the theoretically calculated values. Moreover, 13C NMR and 1H NMR were calculated by using the gauge independent atomic orbital (GIAO) method with B3LYP methods and the 6-311++G(d,p) basis set and their spectra were simulated and the chemical shifts linked to TMS were compared. A study on the electronic and optical properties; absorption wavelengths, excitation energy, dipole moment and frontier molecular orbital energies were carried out. The kubo gap of the present compound was calculated related to HOMO and LUMO energies which confirm the occurring of charge transformation between the base and ligand. Besides frontier molecular orbitals (FMO), molecular electrostatic potential (MEP) was performed. The NLO properties related to Polarizability and hyperpolarizability based on the finite-field approach were also discussed. Key words: Maleic anhydride; HF & DFT; HOMO-LUMO; FMO; hyperpolarizability; MEP
I. Introduction Vibrational spectroscopy is a valuable tool for the elucidation of molecular structure and gives a
dynamical picture of the molecule. Vibrational spectroscopy has contributed significantly to the growth of polymer chemistry, catalysis, fast reaction dynamics, etc. [1]. In the present study, vibrational spectroscopic analysis of Maleic anhydride has been carried out and discussed in detail. The Maleic anhydride is a potential chemical which finds lists of application in pharmaceutics, cosmetics, polymers, insulate paint and polyester resins, pigments and industrial solvents, etc. [2]. Consideration of these factors leads to undertake the detailed spectral investigation of Maleic anhydride. Modern vibrational spectroscopy has proved to be an exceptionally powerful technique for solving many chemistry problems. HF and DFT [3, 4] have been accepted by the quantum chemistry community as a cost effective general procedure for studying physical properties of the molecules. In the framework of HF and DFT approach, different exchange and correlation functions are routinely used. Among those, the HF and DFT (B3LYP, B3PW91 & LSDA) combination is most used since it proved its ability in reproducing various molecular properties, including vibrational spectra. The combined use of HF and DFT (B3LYP, B3PW91 & LSDA) functional and standard basis sets 6-311++G(d,p) provides an excellent balance between accuracy and computational efficiency of vibrational spectra for large and medium size molecules. The vibrational frequencies obtained by quantum chemical calculations are typically larger and they have to be scaled by empirical scaling factors. These scaling factors depend on both the methods and basis sets and they are determined from the mean deviation between the calculated and experimental frequencies [5–8]. The aim of this work is to check the performance of HF and DFT force field for simulation of the IR and Raman spectra of the title compound with the use of standard and 6-311++G(d,p) basis sets. The literature survey reveals that, to the best of our knowledge, no intensive observation of spectroscopic [FT-IR and FT-Raman] and theoretical [HF/DFT] investigation has been reported so far. Therefore, the present investigation was undertaken to study the vibrational spectra, geometrical frame work review, inter and intra molecular interaction between HOMO and LUMO energy levels and first order hyperpolarizability of non linear optical (NLO) activity of the Maleic anhydride. The simulated and observed spectra were analyzed in detail.

The Spectroscopic (FT-IR, FT-Raman, NMR & UV-Vis) And First Order Hyperpolarizability..
DOI: 10.9790/4861-0803020114 www.iosrjournals.org 2 | Page
II. Experimental Details The compound Maleic anhydride is purchased from Sigma–Aldrich Chemicals, USA, which is of
spectroscopic grade and hence used for recording the spectra as such without any further purification. The FT-IR spectrum of the compound is recorded in Bruker IFS 66V spectrometer in the range of 4000–100 cm−1. The spectral resolution is ±2 cm−1. The FT-Raman spectrum of AMS is also recorded in the same instrument with FRA 106 Raman module equipped with Nd:YAG laser source operating at 1.064 µm line widths with 200 mW power. The spectra are recorded in the range of 4000–100 cm−1 with scanning speed of 30 cm−1 min−1 of spectral width 2 cm−1. The frequencies of all sharp bands are accurate to ±1 cm−1.
III. Computational Methods
Generally, the methodological investigation of vibrational spectroscopy along with quantum computational calculations is a potent tool for the thoughtful of fundamental vibrational behavior of a molecule. In the present work, HF and some of the hybrid methods; B3LYP, LSDA and B3PW91 were carried out using the basis sets 6-311++G(d,p). All these calculations were performed using GAUSSIAN 09W [9] program package on Pentium i3 processor in personal computer. In DFT methods; Becke’s three parameter hybrids function combined with the Lee-Yang-Parr correlation function (B3LYP) [10-11], Becke’s three parameter exact exchange-function (B3) [12] combined with gradient-corrected correlational functional of Lee, Yang and Parr (LYP) [13-14] and Perdew and Wang (PW91) [14-15] predict the best results for molecular geometry and vibrational frequencies for moderately larger molecules. The calculated frequencies are scaled down to yield the coherent with the observed frequencies. The scaling factors are 0.90, 0.95, 0.98 and 0.99 for HF/6-311++G(d,p) method. For B3LYP/6-311++G(d,p) basis set, the scaling factors are 0.95, 0.99, 1.05, 1.08 and 1.14. For LSDA/ 6-311+G(d,p) basis set, the scaling factors are 0.95, 0.99, 1.05, 1.08 and 1.14. For B3PW91/6-311+G(d,p) basis set, the scaling factors are 0.95, 0.99, 1.05, 1.08 and 1.14.
The 1H and 13C NMR isotropic shielding are calculated with the GIAO method [16] using the optimized parameters obtained from B3LYP/6-311++G(d,p) method. 13C isotropic magnetic shielding (IMS) of any X carbon atoms is made according to value 13C IMS of TMS, CSX=IMSTMS. The 1H and 13C isotropic chemical shifts of TMS at B3LYP methods with 6-311++G(d,p) level using the IEFPCM method in DMSO, chloroform and CCl4. The absolute chemical shift is found between isotropic peaks and the peaks of TMS [17].
The electronic properties; HOMO-LUMO energies, absorption wavelengths and oscillator strengths are calculated using B3LYP method of the time-dependent DFT (TD-DFT) [18-20], basing on the optimized structure in gas phase and solvent [DMSO, chloroform and CCl4] mixed phase. Thermodynamic properties have been calculated from 100-1000ºC in gas phase using B3LYP/6-311++G(d,p) method. Moreover, the dipole moment, nonlinear optical (NLO) properties, linear polarizabilities and first hyperpolarizabilities and chemical hardness have also been studied.
IV. Results And Discussion
4.1. Molecular geometry The present molecular system; Maleic anhydride belongs to C2V group of symmetry. The molecular
structure is optimized by Berny’s optimization algorithm using Gaussian 09 and Gauss view program and is shown in Figure 1.

The Spectroscopic (FT-IR, FT-Raman, NMR & UV-Vis) And First Order Hyperpolarizability..
DOI: 10.9790/4861-0803020114 www.iosrjournals.org 3 | Page
Experimental and simulated spectra of IR and Raman are presented in the Figures 2 and 3, respectively. The comparative optimized structural parameters such as bond length, bond angle and dihedral angle are presented in Table 1. The observed (FT-IR and FT-Raman) and calculated vibrational frequencies and vibrational assignments are submitted in Table 2. The present compound contains four carbon atoms, two hydrogen atoms and three oxygen atoms.
Table 1: Optimized geometrical parameters for Maleic Anhydride computed at HF, DFT
(B3LYP & B3PW91) and LSDA with 6-31++G(d, p) & 6-311++G(d, p) basis sets
The structure optimization and zero point vibrational energy of the compound in HF and DFT (B3LYP,
B3PW91 & LSDA) with 6-311++G(d,p) are 38.00, 34.77, 34.99 and 34.20 Kcal/Mol, respectively. The calculated energy of HF is greater than DFT method because the assumption of ground state energy in HF is greater than the true energy. Though, the molecular structure belongs to plane, with respect to attractions of carbon atoms. Since the present compound is made up of organic molecules, the entire atoms are connected by covalent and co-ordination covalent bonds.
In comparison with the experimental values, it is observed that most of the calculated bond length values are slightly larger than the experimental values. This may be due to the fact that the calculations are performed for the isolated molecules (gaseous phase) while the experimental spectra are recorded in solid phase. This is in accordance with the earlier work [21]. Comparing bond angles and lengths of B3LYP, B3PW91 and LSDA with those of HF, as a whole the formers are bigger than later and the B3LYP, B3PW91 and LSDA calculated values correlates well compared with the experimental data. Although the differences, calculated
Geometrical Parameters
Methods B3LYP B3PW91 LSDA HF 6-311++G (d-p)
6-311++G (d-p)
6-311++G (d-p)
6-311++G (d-p)
Bond length(Å) (O1 - C2) 1.3927 1.3856 1.3815 1.3575 (O1 - C4) 1.3927 1.3856 1.3815 1.3575 (C2 - O3) 1.1909 1.1897 1.1924 1.1667 (C2 - C6) 1.4902 1.4864 1.474 1.4914 (C4 - O5) 1.1909 1.1897 1.1924 1.1667 (C4 - C8) 1.4902 1.4864 1.474 1.4914 (C6 - H7) 1.08 1.0809 1.0899 1.071 (C6 - C8) 1.3321 1.3309 1.3311 1.3161 (C8 - H9) 1.08 1.0809 1.0899 1.071 Bond angle(˚) (C2 - O1 - C4) 108.6465 108.6474 108.3995 109.9919 (O1 - C2 - O3) 122.6876 122.6581 122.5165 123.3332 (O1 - C2 - C6) 107.4838 107.6461 107.8236 107.2839 (O3 - C2 - C6) 129.8287 129.6958 129.6598 129.3829 (O1 - C4 - O5) 122.6876 122.6581 122.5165 123.3332 (O1 - C4 - C8) 107.4838 107.6461 107.8236 107.2839 (O5 - C4 - C8) 129.8287 129.6958 129.6598 129.3829 (C2 - C6 - H7) 122.0026 122.0969 122.0317 122.1788 (C2 - C6 - C8) 108.193 108.0302 107.9766 107.7201 (H7 - C6 - C8) 129.8044 129.8729 129.9917 130.1011 (C4 - C8 - C6) 108.193 108.0302 107.9766 107.7201 (C4 - C8 - H9) 122.0026 122.0969 122.0317 122.1788 (C6 - C8 - H9) 129.8044 129.8729 129.9917 130.1011 Dihedral angles(˚) (C4 - O1 - C2 - O3) 180.0067 180.0098 -179.9984 -179.9875 (C4 - O1 - C2 - C6) 0.0024 0.0037 -0.0034 -0.0062 (C2 - O1 - C4 - O5) -180.0067 -180.0098 179.9984 179.9875 (C2 - O1 - C4 - C8) -0.0024 -0.0037 0.0034 0.0062 (O1 - C2 - C6 - H7) 179.9983 -180.0021 -179.9976 -179.9939 (O1 - C2 - C6 - C8) -0.0015 -0.0023 0.0021 0.0037 (O3 - C2 - C6 - H7) -0.0064 -0.0089 -0.003 -0.0141 (O3 - C2 - C6 - C8) -180.0062 -180.009 179.9966 179.9836 (O1 - C4 - C8 - C6) 0.0015 0.0023 -0.0021 -0.0037 (O1 - C4 - C8 - H9) -179.9983 180.0021 179.9976 179.9939 (O5 - C4 - C8 - C6) 180.0062 180.009 -179.9966 -179.9836 (O5 - C4 - C8 - H9) 0.0064 0.0089 0.003 0.0141 (C2 - C6 - C8 - C4) 0.0 0.0 0.0 0.0 (C2 - C6 - C8 - H9) 179.9998 180.0001 -179.9996 -179.9974 (H7 - C6 - C8 - C4) -179.9998 -180.0001 179.9996 179.9974 (H7 - C6 - C8 - H9) 0.0 0.0 0.0 0.0

The Spectroscopic (FT-IR, FT-Raman, NMR & UV-Vis) And First Order Hyperpolarizability..
DOI: 10.9790/4861-0803020114 www.iosrjournals.org 4 | Page
geometrical parameters represent a good approximation and they are the basis for calculating other parameters, such as vibrational frequencies. Optimized geometrical parameters, namely, bond lengths and bond angles at HF/6-31++G (d, p), DFT (B3LYP, B3PW91 and LSDA) 6-311++G (d, p) levels are given in the Table 1. The carbon atoms in substituted oxygen atoms exert a larger attraction on the valence electron cloud of the hydrogen atom resulting in an increase in the C–H force constants and a decrease in the corresponding bond length. It is evident from the C–C bond lengths ranging from 1.4740 to 1.4914 Å by HF and DFT methods, the C–O bond lengths in Maleic anhydride vary from 1.3575 to 1.1.3927 Å by HF and DFT (B3LYP) methods and the C–H bond lengths in Maleic anhydride vary from 1.0710 to 1.0899 Å by HF and DFT (B3LYP) methods, respectively. The carbon atom appears to be a little distorted because of the O and H group substitution as seen from the bond angles C4–C8–H9, which are calculated as 122.00◦ and 122.17◦, respectively, by HF and B3LYP methods and are larger than typical hexagonal angle of 120◦.
Table 2: Observed and calculated vibrational frequencies of Maleic Anhydride computed at HF, DFT (B3LYP& B3PW91) and LSDA with 6-31++G(d, p) & 6-311++G(d, p) basis sets
S. No
Symmetry Species C2v
Observed Frequency (cm-1)
Methods Vibrational Assignments
HF B3LYP B3PW91 LSDA FTIR FT-Raman 6-311++G
(d, p) 6-31++G (d, p)
6-311++G (d, p)
6-31++G (d, p)
1 A1 3409 s 3260 w 3382 3415 3427 3404 (C – H) υ 2 A1 3059 m 3235 w 3055 3071 3080 3067 (C – H) υ 3 A1 2038 w - 2019 2056 2019 2024 (C = O) υ 4 A1 1859 m - 1839 1840 1860 1833 (C = O) υ 5 A1 1775 s 1620 m 1764 1780 1744 1761 (C = O) υ 6 B2 1584 s 1540 vs 1569 1581 1567 1524 (C = C) υ 7 B2 1433 s 1455 s 1419 1431 1455 1434 (C = C) υ 8 A2 1264 s 1235 m 1257 1277 1267 1234 (C – O – C) υ 9 A2 1219 s - 1224 1197 1208 1220 (C – O – C) υ 10 A2 1120 m - 1125 1116 1112 1120 (C – O – C) υ 11 B1 1061 s - 1054 1066 1047 1067 (C – O – C) υ 12 B1 990 m 980 w 999 992 972 991 (C – H) δ 13 B2 903 s - 903 898 857 894 (C – H) δ 14 B2 862 s - 842 874 847 860 (C – H) δ 15 B2 783 m 730 s 773 795 773 790 (C – H) δ 16 A2 695 m 700 s 713 692 695 694 (C – H) γ 17 A2 633 m - 627 636 639 628 (C – H) γ 18 B1 606 m - 609 603 591 605 (C – H) γ 19 B1 407 w 470 w 403 403 406 397 (C – H) γ 20 B1 - 280 w 274 257 253 277 (C – H) γ 21 B1 - 200 vw 183 162 161 161 (C – H) γ
s – Strong; m–Medium; w – Weak; vs – Very Strong; vw – Very Weak; υ – stretching; δ – In plane bending; γ – out plane bending
The Spectroscopic (FT-IR, FT-Raman, NMR & UV-Vis) And First Order Hyperpolarizability..
DOI: 10.9790/4861-0803020114 www.iosrjournals.org 5 | Page
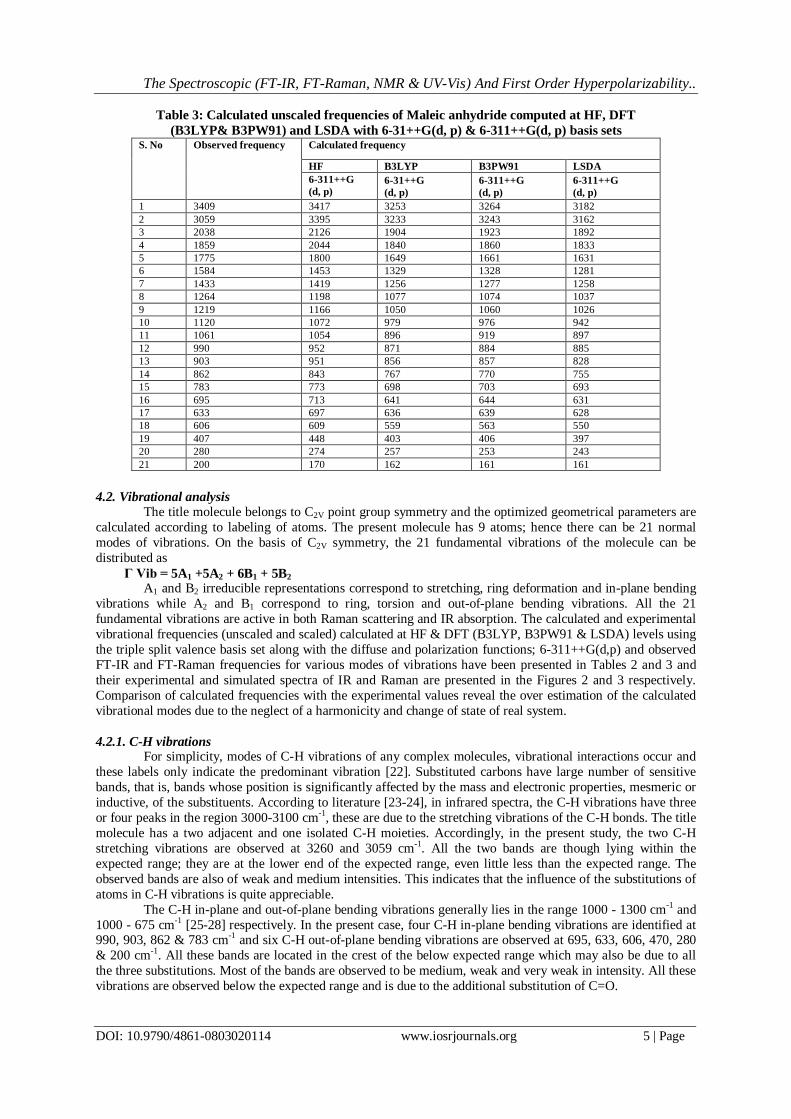
Table 3: Calculated unscaled frequencies of Maleic anhydride computed at HF, DFT (B3LYP& B3PW91) and LSDA with 6-31++G(d, p) & 6-311++G(d, p) basis sets
S. No
Observed frequency
Calculated frequency
HF B3LYP B3PW91 LSDA 6-311++G (d, p)
6-31++G (d, p)
6-311++G (d, p)
6-311++G (d, p)
1 3409 3417 3253 3264 3182 2 3059 3395 3233 3243 3162 3 2038 2126 1904 1923 1892 4 1859 2044 1840 1860 1833 5 1775 1800 1649 1661 1631 6 1584 1453 1329 1328 1281 7 1433 1419 1256 1277 1258 8 1264 1198 1077 1074 1037 9 1219 1166 1050 1060 1026 10 1120 1072 979 976 942 11 1061 1054 896 919 897 12 990 952 871 884 885 13 903 951 856 857 828 14 862 843 767 770 755 15 783 773 698 703 693 16 695 713 641 644 631 17 633 697 636 639 628 18 606 609 559 563 550 19 407 448 403 406 397 20 280 274 257 253 243 21 200 170 162 161 161
4.2. Vibrational analysis
The title molecule belongs to C2V point group symmetry and the optimized geometrical parameters are calculated according to labeling of atoms. The present molecule has 9 atoms; hence there can be 21 normal modes of vibrations. On the basis of C2V symmetry, the 21 fundamental vibrations of the molecule can be distributed as
Γ Vib = 5A1 +5A2 + 6B1 + 5B2 A1 and B2 irreducible representations correspond to stretching, ring deformation and in-plane bending
vibrations while A2 and B1 correspond to ring, torsion and out-of-plane bending vibrations. All the 21 fundamental vibrations are active in both Raman scattering and IR absorption. The calculated and experimental vibrational frequencies (unscaled and scaled) calculated at HF & DFT (B3LYP, B3PW91 & LSDA) levels using the triple split valence basis set along with the diffuse and polarization functions; 6-311++G(d,p) and observed FT-IR and FT-Raman frequencies for various modes of vibrations have been presented in Tables 2 and 3 and their experimental and simulated spectra of IR and Raman are presented in the Figures 2 and 3 respectively. Comparison of calculated frequencies with the experimental values reveal the over estimation of the calculated vibrational modes due to the neglect of a harmonicity and change of state of real system.
4.2.1. C-H vibrations
For simplicity, modes of C-H vibrations of any complex molecules, vibrational interactions occur and these labels only indicate the predominant vibration [22]. Substituted carbons have large number of sensitive bands, that is, bands whose position is significantly affected by the mass and electronic properties, mesmeric or inductive, of the substituents. According to literature [23-24], in infrared spectra, the C-H vibrations have three or four peaks in the region 3000-3100 cm-1, these are due to the stretching vibrations of the C-H bonds. The title molecule has a two adjacent and one isolated C-H moieties. Accordingly, in the present study, the two C-H stretching vibrations are observed at 3260 and 3059 cm-1. All the two bands are though lying within the expected range; they are at the lower end of the expected range, even little less than the expected range. The observed bands are also of weak and medium intensities. This indicates that the influence of the substitutions of atoms in C-H vibrations is quite appreciable.
The C-H in-plane and out-of-plane bending vibrations generally lies in the range 1000 - 1300 cm-1 and 1000 - 675 cm-1 [25-28] respectively. In the present case, four C-H in-plane bending vibrations are identified at 990, 903, 862 & 783 cm-1 and six C-H out-of-plane bending vibrations are observed at 695, 633, 606, 470, 280 & 200 cm-1. All these bands are located in the crest of the below expected range which may also be due to all the three substitutions. Most of the bands are observed to be medium, weak and very weak in intensity. All these vibrations are observed below the expected range and is due to the additional substitution of C=O.

The Spectroscopic (FT-IR, FT-Raman, NMR & UV-Vis) And First Order Hyperpolarizability..
DOI: 10.9790/4861-0803020114 www.iosrjournals.org 6 | Page
4.2.2. C=C Vibrations The C=C stretching vibrations usually occur in the region 1400- 1625 cm-1 [29-31]. The C=C
stretching vibrations of the present compound are observed with strong intensity at 1584 and 1433 cm-1. This assignment is in line with the literature and the most of the bands are observed both in IR and Raman spectra. 4.2.3. C = O and C – O – C Vibrations
The Carbonyl group vibrational frequencies are considered to be significant in the vibrational spectra of ketones, and for this reason, such bands have been the subject of extensive studies [32-34]. The intensity of these bands can increase because of conjugation, therefore, leads to the intensification of the Raman lines as well as the increased infrared band intensities. The carbonyl stretching vibrations in ketones are expected in the region 1680-1715 cm-1. In this work, a strong band at 1775 cm-1 and weak & medium bands in the region 2038 & 1859 cm-1 in IR has been assigned to C=O stretching vibration. The carbonyl vibrations proposed in this study, though lie within the literature values, it is worth to note that its frequency is relatively low which may be due to the coupling of CH group vibrations. The C – O – C stretching vibrations usually occur in the region 1310 - 1210 cm-1. In this work, strong and medium bands are observed at 1264, 1219, 1061 and 1120 cm-1 in IR region and these are assigned to C – O – C stretching vibration.
4.3. NMR analysis
In order to get the chemical information of the molecular components of the compound, the NMR spectral data was calculated at B3LYP method with 6-311++G(d,p) level on the basis of GIAO method and the chemical shifts of the compound are reported in ppm relative to TMS for 1H and 13C NMR spectra which were presented in Table 4 and the corresponding spectra were shown in Figure 4. The carbons and hydrogen’s were situated in different environment with different elements which makes the molecule complicated. The isotropic chemical shift of the elements (C and H) usually explicated the unknown chemical properties of the complicated compound. In general, the chemical shifts of carbon depend upon the bonded atoms and their chemical environment in the compound. The isotropic chemical shifts in aromatic compounds are usually observed in the region of 100 – 160 ppm [35]. The chemical shift corresponding to the base and ligand group direct the reliable interpretation of chemical properties. Usually, the chemical shift of aliphatic chain is constantly behind the aromatic compound [36]. Symmetry also makes atoms equivalent in molecules. If group of atoms are in some identical locations relative to a plane of symmetry in a molecule, they are equivalent [37, 38]. The NMR signals are divided into domain of peaks with respect to the diamagnetic equivalence of carbon and hydrogen atoms. The observed chemical shift of carbons C6 & C8 were limited in the region 110 – 116 ppm. The chemical shift of carbons was observed above 110 ppm and was quite normal. The carbons C2 and C4 in the chain showed high degree of chemical shift (182 ppm) which was greater than other carbons. This is mainly due to the random breaking of proton shield by oxygen groups. Thus, the chemical properties of the ligand groups were inserted into the compound via such carbons. The hydrogen atoms were existed in the molecule in three different environments upon which the chemical shift of the atoms was classified. The chemical shift of H7 and H9 are equal and its value is 17 ppm. This is purely due to the extended influence on hydrogen atom by nearby carbon atoms. From the entire chemical shift of the molecules it can be inferred that, the chemical property of the organic molecules and this is the main cause for the present complex molecule having new chemical property.

The Spectroscopic (FT-IR, FT-Raman, NMR & UV-Vis) And First Order Hyperpolarizability..
DOI: 10.9790/4861-0803020114 www.iosrjournals.org 7 | Page
Table 4: Calculated 1H and 13C NMR chemical shifts (ppm) of Maleic Anhydride Atom Posi.
B3LYP /6-311+ G (d,p) (ppm)
TMS B3LYP/6-311 +G (2d,p) GIAO (ppm)
Shift (ppm)
B3LYP/6-311+ G(d,p) (ppm)
TMS B3LYP/6-311 +G (2d,p) GIAO (ppm)
Shift (ppm)
B3LYP/6-311+ G(d,p) (ppm)
TMS B3LYP/6-311 +G (2d,p) GIAO (ppm)
Shift (ppm)
B3LYP /6-311+ G (d,p) (ppm)
TMS B3LYP/6-311 +G (2d,p) GIAO (ppm)
Shift (ppm)
Gas DMSO Chloroform CCl4 C2 12.76 195.23 182.47 16.07 198.54 182.47 15.16 197.62 182.46 14.26 196.72 182.46 C4 12.76 195.23 182.47 16.07 198.54 182.47 15.16 197.62 182.46 14.26 196.72 182.46 C6 35.76 146.70 110.94 32.87 149.59 116.72 33.68 148.77 115.09 34.47 147.98 113.51 C8 35.76 146.70 110.94 32.87 149.59 116.72 33.68 148.77 115.09 34.47 147.98 113.51 H7 24.83 7.04 17.17 24.44 7.43 17.01 24.54 7.33 17.21 24.65 7.22 17.43 H9 24.83 7.04 17.79 24.44 7.73 17.01 24.54 7.33 17.21 24.65 7.22 17.43 4.4. Mulliken charge distribution analysis
The Mulliken charge is used to understand the charge distribution on the chemical bonding because it facilitates positive and negative regions in the molecular space, at which the protons and electrons concentrate. Thus chemically significant regions; bonds can be identified; also gives the narration of the mechanism of electrophilic and nucleophilic substitutions. Normally, the charges are distributed evenly over the molecule which leads to be neutral. Whenever the substitutions are added to the molecule, the charge distribution is completely altered with respect to the substitution. Usually, the negative Mulliken populated over the highly electronegative atoms which splits the positive charges among hydrogen atoms. The C and H of the molecule have positive space. The Mulliken charges of each atom are presented in Table 5. Thus the entire charge levels of the molecule are altered on par with due to the substitution. Simultaneously, the chemical property has also changed for the same. The Mulliken charge analysis diagram is displayed in the Figure 5. The shape of molecule and the charge level arrangement in the crystal lattice leads to the high degree of optical phonon momentum. This is the main cause for the compound being optically active.
Table 5: Mulliken charges for Maleic Anhydride at HF/6-311G ++ (d,p) basis sets Atom Mullikan Charges
C2 0.132 C4 0.132 C6 0.074 C8 0.074 H7 0.270 H9 0.270 O1 – 0.240 O3 – 0.355 O5 – 0.355

The Spectroscopic (FT-IR, FT-Raman, NMR & UV-Vis) And First Order Hyperpolarizability..
DOI: 10.9790/4861-0803020114 www.iosrjournals.org 8 | Page
4.5 Frontier molecular analysis (Electronic properties) In molecular interaction, there are two important orbital’s that interact with each other. One is
the highest energy occupied molecular orbital called HOMO represents the ability to donate an electron. The other one is the lowest energy unoccupied molecular orbital called LUMO which acts as an electron acceptor. These orbitals are also called the frontier orbital’s. The interaction between them is much stable and is called filled empty interaction. When the two same sign orbital’s overlap to form a molecular orbital, the electron density will occupy at the region between two nuclei. The molecular orbital resulting from in-phase interaction is defined as the bonding orbital which has lower energy than the original atomic orbital. The out-of-phase interaction forms the anti bonding molecular orbital with the higher energy than the initial atomic orbital.
The electronic reconfiguration and electronic excitations in frontier molecular orbitals are very much useful for studying the electric and optical properties of the organic molecules. The stabilization of the bonding and destabilization of the antibonding of molecular orbital can be made by the overlapping of molecular orbitals. The stabilization of the bonding molecular orbital and destabilization of the antibonding can increase when the overlap of two orbitals increases [39].
Table 6: Frontier molecular orbitals with energy levels of Maleic Anhydride Energy levels Energy in eV H+8 13.675 H+7 13.287 H+6 12.699 H+5 12.125 H+4 11.860 H+3 9.914 H+2 9.488 H+1 9.336 H 8.569 L 3.589 L-1 0.251 L-2 0.118 L-3 0.459 L-4 0.687 L-5 0.758 L-6 1.388 L-7 1.773 L-8 1.817 L-9 2.080 L-10 2.405
Usually, the chemical reactions and resonance can be explained by interactions (overlap) between
frontier molecular orbital’s and also used to explain the structure and reactivity of molecules. The 3D plots of the frontier orbitals, HOMO and LUMO for title molecule are in gas, shown in Figure 6. The symmetrical link was intersected by C of the chain. In LUMO, there were so many empty orbitals. The electron transitions were happened between those HOMO and LUMO and thus the compound has been stabilized. Here, irrespective of

The Spectroscopic (FT-IR, FT-Raman, NMR & UV-Vis) And First Order Hyperpolarizability..
DOI: 10.9790/4861-0803020114 www.iosrjournals.org 9 | Page
HOMO and LUMO, the s and p orbital lobs were interlinked and the electron clouds were shared their spatial orbital’s and also spent their time in the place of link. During that time, the analogous physical and chemical properties mutually shared between the atoms. The charge levels were fluctuated due to the electron cloud sharing and were evidenced in the Mulliken charge analysis. The band gap of the present compound was found to be 4.98 eV which was moderate for electronic properties. From this observation, it is clear that, the in and out-of-phase interactions are present in HOMO and LUMO respectively. The HOMO→LUMO transition implies an electron density transferred among atoms separately. The HOMO and LUMO energy are 8.569 eV and 3.589 eV in gas phase (Table 6). Energy difference between HOMO and LUMO orbital’s is called as energy gap (kubo gap) that is an important feature for the stability of structures. The DFT level calculated energy gap is 4.98 eV, which shows the medium energy gap and reflects the high electrical activity of the molecule. 4.6. HOMO-LUMO analysis (Optical properties)
The data observation of the electronic structure of the present compound has explained the optoelectronic character from which it can be identified that whether the compound is optically active or not. The electronic energy excitation of the present molecule were calculated at the B3LYP/6-311++G(d,p) level using the TD-DFT approach in gas phase and with the solvent of DMSO, Chloroform and CCl4. The simulated UV-Visible spectra in gas and solvent phase are shown in Figure 7. The calculated excitation energies, oscillator strength (f) and wavelength (l) and spectral assignments are given in Table 7. The range of UV-Visible from 200 to 380 nm is the portion of the spectrum normally covered by the term ultraviolet. The excitation of electrons from p & d orbital’s, π orbitals and particularly π conjugated systems occurs above 200 nm and gives rise to readily accessible and informative spectra. The compound under study is a semiconductor which was designed for the purpose of optoelectronic devices. In this case, the collective vibrational called opto-electronic transition was observed in the region 300-360 nm with minimum energy gap of 3.53 eV. These transitions have been assigned to n→σ* and n→π* for gas phase. In the solvent phases, there was no considerable disparity found. But, the energy gap of the present compound was expanded up by the solvent effect. Though, the entire transitions have been belonging to ultraviolet region and the entire assignment restricted with R-band category in between UV and visible region, the NLO component was found to be active in the molecule. The molecular orbital lobe interaction in UV-Visible is appeared in Figure 8.

The Spectroscopic (FT-IR, FT-Raman, NMR & UV-Vis) And First Order Hyperpolarizability..
DOI: 10.9790/4861-0803020114 www.iosrjournals.org 10 | Page
Table 7: Theoretical electronic absorption spectra of Maleic Anhydride (absorption wavelength λ (nm), excitation energies E (eV) and oscillator strengths (f)) using TD-DFT/B3LYP/6-311++G(d,p) method
H: HOMO; L: LUMO
The chemical hardness and potential, electronegativity and Electrophilicity index are calculated and
their values are shown in Table 8. The chemical hardness is a good indicator of the chemical stability. The chemical hardness of present compound is 2.49 and therefore, the present compound has much chemical stability. Similarly, the electronegativity of the compound is 6.079 and if the value is very high due to substitution of atoms; the property of chemical bonds in the molecule will be changed from covalent to ionic. Electrophilicity index is a factor which is used to measure the energy lowering due to maximal electron flow between donor [HOMO] and acceptor [LUMO].
Table 8: Calculated energies values, chemical hardness, electro negativity,
Chemical potential, Electrophilicity index of Maleic Anhydride Parameters TD-DFT/B3LYP/ 3-21G++(d, p) Etotal (Hartree) 379.24 EHOMO (eV) 8.569 ELUMO (eV) 3.589 EHOMO-LUMO gap (eV) 4.98 EHOMO-1 (eV) 0.767 ELUMO+1 (eV) 3.4476 EHOMO-1-LUMO+1 gap (eV) 2.6806 Chemical hardness () 2.49 Electronegativity (χ) 6.079 Chemical potential (µ) 2.49 Chemical softness(S) 0.2008 Electrophilicity index (ω) 3.785 Dipole moment 4.3418
From the Table 8, it is found that the Electrophilicity index is 3.785 which is high and this value
ensures that the strong energy transformation is taking place between HOMO+1 and LUMO-1 instead of HOMO-LUMO since the transition is forbidden between HOMO and LUMO. The dipole moment in a molecule is another important electronic property. Whenever the molecule would have possessing large dipole moment, the intermolecular interactions is very strong. The calculated dipole moment value for the title compound is 4.3418 Debye. It is apparent and moderate due to the presence of coordinate covalent bond which is inferred that, the present molecule has strong intermolecular interactions.
λ (nm) E (eV) ( f ) Major contribution Assignment Region Bands
Gas 350.41 3.5383 0.0001 HL (92%) n→σ* visible R-band
(German, radikalartig)
232.49 5.3328 0.0163 HL-1 (86%) n→σ* visible 220.90 5.6126 0.2866 H+1L (86%) n→σ* visible 200.25 6.1915 0.0004 HL-1 (92%) n→π* visible 186.22 6.6581 0.0002 H+1L (89%) n→π* visible DMSO 328.31 3.7764 0.0002 HL (90%) n→σ* visible R-band
(German, radikalartig)
242.68 5.1089 0.1067 HL-1 (87%) n→σ* visible 216.31 5.7317 0.2981 H+1L-1 (83%) n→σ* visible 194.47 6.3756 0.0015 HL-1 (92%) n→π* visible 181.18 6.8431 0.0004 H+1L (89%) n→π* visible Chloroform 334.37 3.7080 0.0002 HL (86%) n→σ* visible R-band
(German, radikalartig)
239.90 5.1681 0.1010 H+1L (78%) n→σ* visible 218.83 5.6657 0.3022 H+1L-1(77%) n→σ* visible 196.12 6.3219 0.0011 HL-1 (92%) n→π* visible 182.59 6.7903 0.0003 H+1L (89%) n→π* visible CCl4 340.39 3.6424 0.0002 HL (86%) n→σ* visible R-band
(German, radikalartig)
237.33 5.2242 0.0902 H+1L (78%) n→σ* visible 221.27 5.6034 0.3087 H+1L-1(74%) n→σ* visible 197.71 6.2711 0.0008 HL-1 (92%) n→π* visible 183.97 6.7393 0.0003 H+1L (89%) n→π* visible

The Spectroscopic (FT-IR, FT-Raman, NMR & UV-Vis) And First Order Hyperpolarizability..
DOI: 10.9790/4861-0803020114 www.iosrjournals.org 11 | Page
4.7. Polarizability and First order hyperpolarizability analysis In order to investigate the relationships among the molecular structures, non-linear optic properties
(NLO) and molecular binding properties, the polarizabilities and first order hyperpolarizabilities of the present compound are calculated using DFT-B3LYP method and 6-311+G(d,p) basis set, based on the finite-field approach.
The Polarizability and hyperpolarizability tensors (αxx, αxy, αyy, αxz, αyz, αzz and βxxx, βxxy, βxyy, βyyy, βxxz, βxyz, βyyz, βxzz, βyzz, βzzz) are obtained from the output file of Polarizability and hyperpolarizability calculations. However, α and β values of Gaussian output in atomic units (a.u.) have been converted into electronic units (esu) (α; 1 a.u. = 0.1482×10⁻²⁴ esu, β; 1 a.u. = 8.6393×10⁻³³ esu). The mean polarizability (α), anisotropy of polarizability (Δα) and the average value of the first hyperpolarizability can be calculated using the equations.
zzyyxxtot 3
1
21222222 666
21
yzxyxzxxzzzzyyyyxx
21222
zyyzxxzzzyxxyzzyyyxzzxyyxxx
It is well known that, molecule with high values of dipole moment, molecular Polarizability and first hyperpolarizability having more active NLO properties. The first hyperpolarizability () and the component of hyperpolarizability x, y and z of Maleic anhydride along with related properties (0, total, and Δ) are reported in Table 9. The calculated value of dipole moment is found to be 4.3418 Debye. The highest value of dipole moment is observed in the component of µy which is 4.3418 Debye. The lowest value of the dipole moment of the molecule is µz component (0.0000 Debye). The calculated average Polarizability and anisotropy of the Polarizability is 28.757 x 10⁻²⁴ esu and 40.758 x 10⁻²⁴ esu, respectively. The low value of Polarizability reflects the rich NLO property of the present compound. The magnitude of the molecular hyperpolarizability , is one of important key factors in a NLO system. The B3LYP/6-311+G(d,p) calculated first hyperpolarizability value () is 0.0000009 x 10⁻³⁰ esu. The hyperpolarizability result explore that, the title compound is able to generate the second order harmonic generation with more amplitude. So, the present compound can be used to prepare the NLO crystals for electronic applications. In addition to that, due to its elevated values of Polarizability and hyperpolarizability, the present compound is able to bind with other molecules with less amount of binding energy.
Table 9: The dipole moments µ (D), the polarizability α (a.u.), the average polarizability αo (esu), the anisotropy of the polarizability Δα (esu), and the first hyperpolarizability β (esu) of Maleic Anhydride
Parameter a.u. Parameter a.u. αxx -37.4849 βxxx -0.0036 αxy 0.0005 βxxy -4.1910 αyy -36.2387 βxyy 0.0050 αxz 0.0000 βyyy 6.9700 αyz 0.0000 βxxz 0.0000 αzz -48.4090 βxyz 0.0000 αtot 28.757 βyyz 0.0000 Δα 40.758 βxzz 0.0017 µx 0.0010 βyzz 12.5420 µy 4.3418 βzzz 0.0000 µz 0.0000 βtot 0.0000009 µ 4.3418
4.8. Molecular electrostatic potential (MEP) maps analysis
The molecular electrostatic potential is nothing but the existence of interaction energy between the negative and positive charge distribution of a molecule. The molecular interaction energy was calculated by using the equation
11 1
V(r ) iM
j j
Qr r
If the charge distribution continues over the compound, the MEP is then given by equation at any instant

The Spectroscopic (FT-IR, FT-Raman, NMR & UV-Vis) And First Order Hyperpolarizability..
DOI: 10.9790/4861-0803020114 www.iosrjournals.org 12 | Page
11
( )V(r ) r drr r
The MEP is highly informative concerning the protonic and electronic charge distribution of a given molecule. It is mainly used for optical polarization interaction analysis analogous to the crystalline state. It is also used for topographical analysis of the electronic structure and molecular reactivity pattern of the composite materials. Molecular electrostatic potential view was framed at B3LYP/6-311++G(d,p) level in which the entire molecular interactive zones can be viewed. The potential energy interaction between proton and electron fields is classified from higher frequency region to higher wavelength region which designated that, the charge dislocation between electrophilic and nucleophilic boundaries. In a molecule, charges are polarized rigorously in negative and positive terminals, and there are significant differences in electron and proton density due to the doping of substitution in base compound. The rich electronegativity region was indicated by affluent proton region almost entire region. The negative (red) regions of MEP were related to electrophilic reactivity and the positive (blue) regions to nucleophilic reactivity as shown in Figure 9. The negative regions are mainly localized on the electronegative atoms. A maximum positive region is localized on the hydrogen group of the molecule indicating a possible site for nucleophilic attack. The addition of electron withdrawing groups produces a large increase in positive potential at the center of the ring. The variance in ESP surfaces shows an increase in the intensity of this localized positive potential in the molecule becomes more electron-deficient. Thus, the ESP surface measurements identify two complementary regions within the compound. Electrophiles (electron-deficient, positively charged species) tend to be attracted to the regions of a molecule in which the ESP attains its most negative values since these are the effects of molecule’s electrons are most dominant, whereas nucleophiles (an electron rich, negatively charged species) are especially attracted to the areas where the ESP is the most positive. The contour of electrostatic potential and molecular electrostatic potential are shown in Figure 9. 4.9 Thermodynamic properties analysis
The thermodynamic functions of the present compound with different temperatures were calculated at B3LYP/6-311++G(d,p) level the standard statistical thermodynamic functions: standard heat capacities (C0
p,m) standard entropies (S0
m), and standard enthalpy changes (ΔH0m) for the title compounds were obtained from the theoretical harmonic frequencies and listed in Table 10. The entropy, specific heat capacity and enthalpy were varied with respect to temperature in positive coefficient basis. The temperature from 100 K to 1000 K, the variation of the parameters was linear and sustained up to the maximum temperature. This view showed the consistent chemical stability of the present compound. Normally, the thermo dynamical analysis on aromatic compound is important since they provide the necessary information regarding the chemical reactivity. In addition to that, it is also very important to discuss the existence and alternation of thermodynamic parameters of the present compound. From Table 10, it can be observed that, the thermodynamic functions were increased with temperature ranging from 100 to 1000K due to the fact that the molecular vibrational intensities increased with temperature. The correlation graph between heat capacities, entropies, enthalpy changes and temperatures

The Spectroscopic (FT-IR, FT-Raman, NMR & UV-Vis) And First Order Hyperpolarizability..
DOI: 10.9790/4861-0803020114 www.iosrjournals.org 13 | Page
were shown in Figure 10. At low temperature, it is found that, the specific heat capacity of the present compound is fall down rapidly and obeyed the Debye T3 law whereas, at high temperature, the specific heat capacity is saturated at 1000ºK. The entropy and enthalpy of the present compound gets elevated and saturated at 1000ºK as the specific heat capacity.
Table 10: Thermodynamic parameters at different temperatures at the B3LYP/6-311++G (d, p) level for
Maleic Anhydride T(K)
)K mol(calC -1-10m,p )K mol(calS -1-10
m )mol(kcalH -10m
100.00 42.87 245.76 3.63 200.00 62.39 281.01 8.83 298.15 85.86 310.29 16.10 300.00 86.29 310.82 16.26 400.00 107.64 338.67 26.00 500.00 124.72 364.60 37.65 600.00 138.09 388.57 50.82 700.00 148.61 410.68 65.17 800.00 157.02 431.09 80.47 900.00 163.84 449.99 96.52 1000.00 169.46 467.56 113.20
V. Conclusion
FT-IR, FT-Raman, UV-Vis, NMR and quantum chemical calculation studies have been performed on Maleic anhydride, in order to identify its structural and spectroscopic properties. A complete vibrational analysis of Maleic anhydride was performed with HF and DFT (B3LYP, B3PW91 & LSDA) method and 6-311++G(d,p) basis set. The influences of different vibrational frequencies of the title compound were discussed. From the Mulliken charge analysis, the entire charge levels of the molecule are altered on par with due to the substitution. The change of geometrical parameters along with the substitutions is deeply analyzed. The simulated 13C NMR and 1H NMR spectra in gas and solvent phase are displayed and the chemical shifts related to TMS are studied. The electrical, optical and bio molecular properties are profoundly investigated using frontier molecular orbital. From the UV-Visible spectra, it is monitored that, the entire electronic transitions shifted bathochromically due to the substitutional effect. It is also found that the present compound is optically and electrically active and also posses NLO properties. The molecular electrostatic potential (MEP) map is performed and from which the change of the chemical properties of the compound is also discussed. The correlations between the statistical thermodynamics and temperature are also obtained. It is seen that the heat capacities, entropies and enthalpies increase with the increasing temperature owing to the intensities of the molecular vibrations increase with increasing temperature. Furthermore, the polarizability, the first order hyperpolarizability and total dipole moment of title molecule have been calculated and the results are discussed. These results indicate that the Maleic anhydride compound is a good candidate of nonlinear optical materials.

The Spectroscopic (FT-IR, FT-Raman, NMR & UV-Vis) And First Order Hyperpolarizability..
DOI: 10.9790/4861-0803020114 www.iosrjournals.org 14 | Page
References [1]. D.N. Sathyanarayana, Vibrational Spectroscopy—Theory and Applications, second ed., New Age International (P) Limited
Publishers, New Delhi, 2004. [2]. P.R. Singh, S.K. Dikshit, Molecular Spectroscopy Principles and Chemical Applications, first ed., S. Chand & Company Limited,
New Delhi, 1985. [3]. For excellent reviews of DFT and its applications, see :R.G. Parr,W.Yang, Density Functional Theory of Atoms and Molecules,
Oxford, New York, 1989; R.O. Jones, O. Gunnarson, Rev. Mol. Phys. 61 (1989) 689; T. Ziegler, Chem. Rev. 91 (1991) 651. [4]. W. Kohn, L.J. Sham, Phys. Rev. A140 (1965) 1133. [5]. W.J. Hehre, L. Radom, P.V.R. Schleyer, J.A. Pople, Ab initio Molecular Orbital Theory, Wiley, New York, 1986. [6]. E.F. Healy, A. Holder, J. Mol. Struct. 281 (1993) 141. [7]. N.J. Harris, J. Phys. Chem. 99 (1995) 14689. [8]. J.W. Finley, P.J. Stephens, J. Mol. Struct. (Theo. Chem.) 357 (1995) 225. [9]. R.J. Lewis, Sr (Ed.). Hawley's Condensed Chemical Dictionary, 12th ed. New York, NY: Van Nostrand Rheinhold Co., (1993)
860. [10]. D. Hartley and H. Kidd (eds.). The Agrochemicals Handbook. Old Woking, Surrey, United Kingdom: Royal Society of
Chemistry/Unwin Brothers Ltd., (1983). [11]. W. Gerhartz, Ullmann's Encyclopedia of Industrial Chemistry. 5th ed: Deerfield Beach, FL: VCH Publishers, 1985 21. [12]. M.K. Marchewka, A. Pietraszko, Spectrochimica Acta Part A 69 (2008) 312–318. [13]. Ivan S. Lim, Gustavo E. Scuseria, Chemical Physics Letters, 460, 2008, 137-140. [14]. Ljupco Pejov, Mirjana Ristova, Bojan Soptrajanov, Spectrochimica Acta Part A 79 (2011) 27–34. [15]. M.J. Frisch et al., Gaussian 09, Revision A.1, Gaussian, Inc., Wallingford CT, 2009. [16]. Z. Zhengyu, D. Dongmei, Journal of Molecular Structure (Theochem) 505 (2000) 247-252. [17]. Z. Zhengyu, F. Aiping, D. Dongmei, Journal of Quantum Chemistry, 78 (2000) 186-189. [18]. A.D. Becke, Physics Review, A 38 (1988) 3098-3101. [19]. C. Lee, W. Yang, R.G. Parr, Physics Review, B. 37 (1988) 785-790. [20]. A.D. Becke, Journal of Chemical Physics, 98 (1993) 5648-5652. [21]. N. Sundaraganesan, S. Kalaichelvan, C. Meganathan, B. Dominic Joshua, J. Cornard, Spectrochimica Acta Part A 71 (2008) 898-
906. [22]. George Socrates, Infrared and Raman Characteristic group frequencies, 3rd ed. Wiley, New York (2001). [23]. G. Eazhilarasi, R. Nagalakshmi, V. Krishnakumar, Spectrochimica Acta part A 71 (2008) 502 – 507. [24]. N.Sundaraganesan, G.Elango, S.Sebastian and P.Subramani ,Indian Journal of Pure and Applied Physics 47 (2009) 481. [25]. Krishnakumar, N. Prabavathi Spectrochimica Acta part A 71 (2008) 449 – 457. [26]. Altun, K. Golcuk, M. Kumru, Journal of Molecular structure (Theochem), 637-639 (2003) 155. [27]. V. Krishnakumar, R. John Xavier, Spectrochimica Acta part 61 A (2005) 253-258. [28]. Yu-Xi Sun, Qing-Li Hao, Zong-Xue Yu,Wen-Jun Jiang, Lu-De Lu, XinWang, Spectrochimica Acta Part A 73 (2009) 892-901. [29]. V. Krishna kumar R. John Xavier, Indian Journal of Pure and applied physics, 41 (2003) 95-98. [30]. D.N. Sathyanarayana, vibrational spectroscopy theory and applications, 2nd ed, New Age International (P) limited publisher, New
Delhi (2004). [31]. N.P. Singh, R.A. Yadav, Indian Journal of Physics, B 75 (4) (2001) 347. [32]. D.A. Kleinman, Physics Review, 126 (1962) 1977-1981. [33]. Smith, Infrared Spectral Interpretation, A Systematic Approach, CRC Press, Washington, DC, 1999. [34]. Lee, W. Yang, R.G. Parr, Physics reiew, B 37 (1988) 785. [35]. S. Ahmad, S. Mathew, P.K. Verma, Indian J. Pure Appl. Phys. 30 (1992) 764e770. [36]. N. Karthikeyan, J. Joseph Prince, S. Ramalingam, S. Periandy, Spectrochim. Acta Part A Mol. Biomol. Spectrosc. 124 (2014)
165e177. [37]. M. Balc, Basic p1 sH and p13 s CNMR Spectroscopy, first ed., Elsevier, Amsterdam; Boston, 2005, 12, 427. [38]. Breitmaier, 3rd rev. ed., in: Structure Elucidation by NMR in Organic Chemistry: a Practical Guide, Wiley, Chichester, West
Sussex, England, 2002. xii, 258. [39]. Jean, Yvesand and Volatron, François. An Introduction to Molecular Orbitals. Oxford University Press. 11.03. 2005