the spectral sensitivit of they goldfish and...
TRANSCRIPT

J. Exp. Biol. (1965), 4a, 481-493 481
With 4 text-figures
Printed in Great Britain
THE SPECTRAL SENSITIVITY OF THE GOLDFISH ANDTHE CLAWED TOAD TADPOLE UNDER PHOTOPIC
CONDITIONS*
BY J. R. CRONLY-DILLON AND W. R. A. MUNTZ
Institute of Experimental Psychology, Oxford University
{Received 23 September 1964)
The visual pigments of the vertebrate retina fall into two major classes, dependingon whether they are based on vitamin Ax or vitamin Aj. The rod pigment in theformer case is rhodopsin, and in the latter case porphyropsin, and the scotopicsensitivities of the animals agree well with the absorption spectra of the relevantpigment. Later work led to the view that the photopic sensitivities of animals alsofall into the same two classes: those animals with visual pigments based on vitamin Ax
are maximally sensitive at about 560 mfi, and those with pigments based on vitamin Ajat about 620 m/t (Granit, 1941, 1947). The first type of photopic sensitivity can beroughly fitted by the absorption spectrum of the pigment iodopsin, the second bythe absorption spectrum of the pigment cyanopsin (Wald, Brown & Smith, 1953,1955). The difference between the rods and cones within each group is due to theopsin part of the molecule.
As far as the photopic sensitivity is concerned, the position outlined above, whichwill be referred to as the classical position, has mainly arisen from electrophysiologicalwork on comparatively few species. Cone pigments are difficult to isolate, so thatalthough a large amount of data is available for rod pigments, the data on cone pigmentsare equivocal (Dartnall, i960); the only cone pigment that has been extracted isiodopsin, and the fit between, photopic sensitivity data and its absorption spectrumis not perfect. Similarly, Granit's photopic data were obtained from only a few species,and some physiological data do not agree with the classical view (Tansley, Copen-haver & Gunkel, 1961, for squirrel).
Behavioural studies of photopic sensitivity are found to give widely varying results.Sometimes a more or less classical curve is obtained (Brown, 1937, on rabbits;Blough, 1957, on pigeons; Wald, 1945, on humans; Jacobs, 1963, on monkeys), butthe curve may be unexpectedly narrow (Grundfest, 1932ft, on sunfish), or may showsecondary rises and inflexions (Stiles & Crawford, 1933, on humans; Weale, 1953, onhumans). On other occasions the photopic curve bears no apparent relation to theclassical curve (Gunter, 1954, on cats; Muntz, 1962, on Rana).
From the above brief review it is clear that further data are needed on the photopicsensitivity of different animals, especially as data obtained by electrophysiological andbiochemical means do not necessarily correlate with the animal's behaviour. In
• This work forms part of a project on stimulus-analysing mechanisms jointly financed by theAmerican Office of Naval Research (Contract Number N 62558-0453) and the NufBeld Foundation.Support was also received from the U.S. National Institutes of Health (Contract No. NB 0442301).

482 J. R. CRONLY-DILLON AND W. R. A. MUNTZ
humans, for example, the electroretinogram resulting from a single light flash undefphotopic conditions yields a curve agreeing approximately with the absorption spectrumof rhodopsin, but the subjects' report of the relative brightness of the different coloursagrees with the classical photopic sensitivity curve (Riggs, Berry & Wagner, 1943).In the present paper photopic curves obtained by means of the optomotor response,are presented for two cold-blooded vertebrates: the goldfish (Carassius auratus) andthe clawed toad (Xenopus laevis).
Spectral sensitivity curves under photopic or scotopic conditions may be obtainedby determining the energy of various spectral lights necessary to produce a constantresponse. Where a behavioural response is used as the index of sensitivity, it is desirableto employ a method that does not depend on previous learning. A suitable responseis the optomotor response, where the experimenter exploits the natural tendency ofanimals to follow a movement in the visual field. Xenopus was selected becausebehavioural data using the phototactic response are available for this animal (Denton &Pirenne, 1954). These data do not agree with the classical curve for either rod or conesensitivity, and almost certainly results from interaction between receptors of morethan one type (Dartnall, 1956). It is therefore important to determine the spectralsensitivity using another type of behaviour, especially as in Rana the spectral curveusing the optomotor response agrees with the classical position (Birukow, 1949),whereas the curve obtained using the phototactic response is entirely different andsimilar to that obtained with Xenopus (Muntz, 1962). A further reason for usingXenopus was that the photopic sensitivity revealed by means of the electroretinogramin this animal is unusual in form, and unlike both the phototactic curve and theclassical curve (Muntz, 1965). It is therefore of interest to see whether the curveobtained using the optomotor response agrees with the curve obtained in the photo-tactic situation, or with the curve obtained using the electroretinogram, or with theclassical curve, or with none of these. Xenopus tadpoles were used, as opposed toadults, since they proved to give much more reliable optomotor responses.
Goldfish were selected as a second animal because a considerable amount of workhas been done on colour vision in goldfish, both behaviourally (McCleary & Bern-stein, 1959), and physiologically (MacNichol, Wolbarsht & Wagner, 1961). Thephotopic sensitivity is a necessary datum to be considered if colour vision is to beexplained.
METHODS
(a) Apparatus
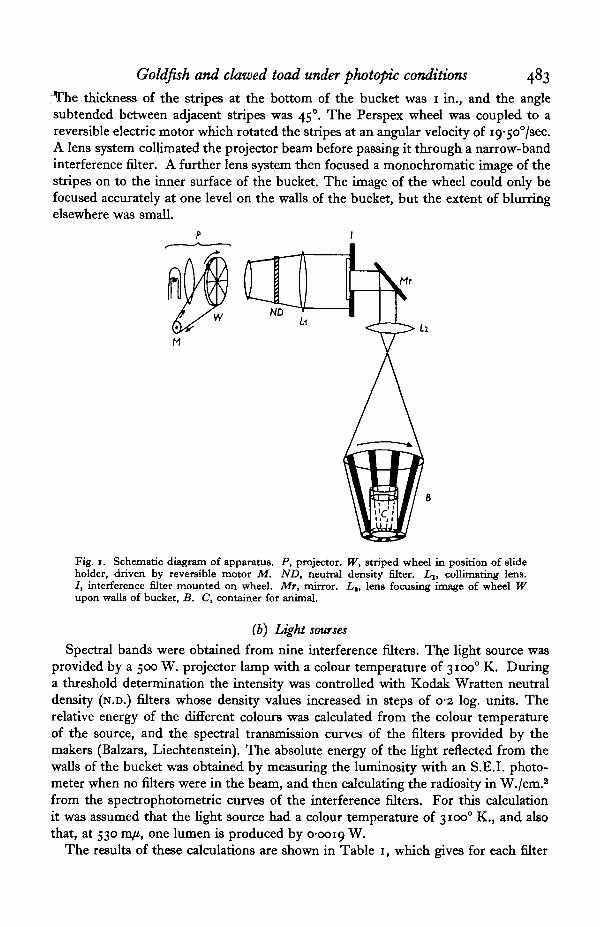
The apparatus is shown schematically in Fig. 1. The fish or tadpole was placed ina cylindrical glass container 5 in. in diameter. This was filled with water to a depth of3 in., and kept at room temperature (approximately 200 C) . The container itself restedat the bottom of a bucket lined with white paper; the distance between the walls ofthe bucket and the walls of the glass container was about 1 in. at the bottom of thebucket, and approximately z\ in. at water level.
The image of a small transparent Perspex wheel with black stripes radiating fromthe centre was projected into the bucket. The image of the centre of the wheel wasmade to coincide with the axis of the container, and the image of the wheel itself castan alternating pattern of light and dark stripes on the inner walls of the bucket.
Goldfish and clawed toad under photopic conditions 483
thickness of the stripes at the bottom of the bucket was 1 in., and the anglesubtended between adjacent stripes was 450. The Perspex wheel was coupled to areversible electric motor which rotated the stripes at an angular velocity of ig-$o°lsec.A lens system coUimated the projector beam before passing it through a narrow-bandinterference filter. A further lens system then focused a monochromatic image of thestripes on to the inner surface of the bucket. The image of the wheel could only befocused accurately at one level on the walls of the bucket, but the ertent of blurringelsewhere was small.
Mr
M
Fig. 1. Schematic diagram of apparatus. P, projector. W, striped wheel in position of slideholder, driven by reversible motor M. ND, neutral density filter. l^, collimating lens./ , interference filter mounted on wheel. Mr, mirror. Lt, lens focusing image of wheel Wupon walls of bucket, B. C, container for animal.
(b) Light sourses
Spectral bands were obtained from nine interference filters. The light source wasprovided by a 500 W. projector lamp with a colour temperature of 31000 K. Duringa threshold determination the intensity was controlled with Kodak Wratten neutraldensity (N.D.) filters whose density values increased in steps of 0*2 log. units. Therelative energy of the different colours was calculated from the colour temperatureof the source, and the spectral transmission curves of the filters provided by themakers (Balzars, Liechtenstein). The absolute energy of the light reflected from thewalls of the bucket was obtained by measuring the luminosity with an S.E.I, photo-meter when no filters were in the beam, and then calculating the radiosity in W./cm.2
from the spectrophotometric curves of the interference filters. For this calculationit was assumed that the light source had a colour temperature of 31000 K., and alsothat, at 530 m/i, one lumen is produced by 0-0019 W.
The results of these calculations are shown in Table 1, which gives for each filter

484 J. R. CRONLY-DILLON AND W. R. A. MUNTZ
the wavelength at which transmission was maximal, the half-maximum bandwidth,the energy obtained through each filter when no N.D. filters were placed in the beam,and the amount, in log. units, by which each colour of light must be adjusted in orderto obtain an equal quantum spectrum (the correction factor).
Background illumination was obtained by indirect lighting from a 60 W. tungstenbulb, and by stray light from the projector. The level of background illuminationwas measured by an S.E.I, photometer. In one experiment on goldfish a colouredbackground light was used; this was obtained from a second projector illuminatingthe walls of the bucket by means of a second mirror.
Table 1. Characteristics of the interference filters used in the experiments
ABU. in ny* 436 46a 494 528 585 615 635 670 700
Half max. bandwidth 12 8 11 0-8 9 9 10 10 10(nyt)
Max. available 9-5 13-5 25-7 30-1 44-6 51-1 63-0 84-6 89-8energy (/tW./cm.1)
Correction factor +°'34 +0-29 —0-09 —0-16 —0-33 —0-39 —0-48 —o-6i —0-64
(c) Threshold criteria
(*) Goldfish. Not all fish responded in exactly the same way to the moving stripes.Some fish would attempt to follow a particular stripe and swim around the bowl atapproximately the same speed as the stripes, others would start to follow a stripe,overtake it, then double back, then attempt to follow another stripe, and so on,repeating the cycle indefinitely. Initially this behaviour caused some difficulty,especially at those intensities where the experimenter could not see the stripes himselfand did not know beforehand which way they were moving. However, it soon becameapparent that the movements which a fish makes when it starts to follow a stripe aredifferent from those which it makes when it starts to double back. In addition wenoted whether the swimming pattern was altered when the motor was reversed.
Sometimes a fish would lie in contact either with the side or bottom of the con-tainer, and would show no response to the moving stripes, while other fish wouldsometimes dart about wildly every time the stripes started to move. In both casesthe fish were either discarded or tested at some other time when they were moredisposed to give a recognizable optomotor response.
During a threshold determination at a particular wavelength the intensity wasreduced with the aid of N.D. filters whose intensity values increased in steps of 0-2.At each intensity the fish was given ten trials, and the direction of rotation of the stripeswas varied randomly during the test sequence. A time limit of 2 min. was set for eachtrial. A particular intensity was considered above threshold if the fish gave a clearoptomotor response in 80 % of the trials.
The different colours of light were tested in a random order. In general, weattempted to select a presentation sequence where the spectral separation betweensucceeding test wavelengths was as great as possible. This procedure was adoptedas a precaution against the possibility that the thresholds might be affected as a resultof selective adaptation introduced by tests for the colour previously used.
(it) Clawed toad. When undisturbed, tadpoles of the clawed toad normally remainmore or less motionless with their heads pointing downwards at an angle of approxi-
Goldfish and clawed toad under photopic conditions 485
mately 450. This posture is maintained by rapid vibrations of the end of the tail.Under these conditions the optomotor response is easy to observe; the only changein behaviour is that the tail bends slightly with the result that the animal rotates aboutits own axis in the same direction as the movement of the stripes. When the stripesare well above threshold the rotation of the animal may be equal to the rotation ofthe stripes, but as the intensity of the light is reduced the animal lags progressivelyfarther behind. The threshold was taken as that intensity of light at which no rotationof the animal or bending of the tail could be seen within 2 min of the motor beingswitched on. Sometimes an animal would dash violently around the tank; under theseconditions the optomotor response could not be observed and the trial wasdiscontinued.
During a threshold determination at a particular wavelength the intensity of thelight was reduced by steps of 0-2 log. units until the response could no longer be seen.The different colours of light were presented in a random order, and two thresholddeterminations were made at each wavelength.
RESULTS
(a) Goldfish
Five z\ in. goldfish were used in these experiments. In order to get the fish fullylight-adapted before starting an experiment they were all subjected for 2 hr. to abright light provided by a 100 W. tungsten bulb.
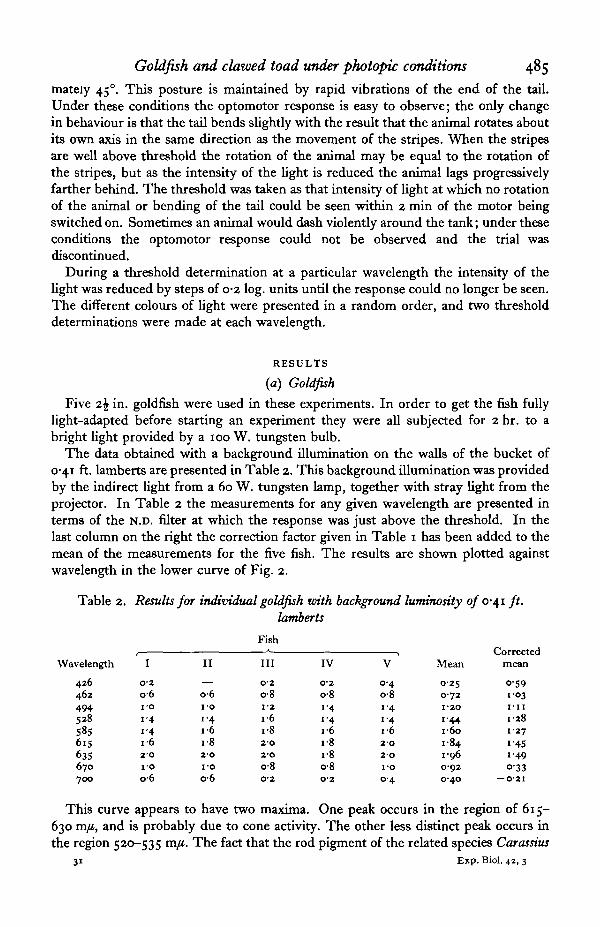
The data obtained with a background illumination on the walls of the bucket of0-41 ft. lamberts are presented in Table 2. This background illumination was providedby the indirect light from a 60 W. tungsten lamp, together with stray light from theprojector. In Table 2 the measurements for any given wavelength are presented interms of the N.D. filter at which the response was just above the threshold. In thelast column on the right the correction factor given in Table 1 has been added to themean of the measurements for the five fish. The results are shown plotted againstwavelength in the lower curve of Fig. 2.
Table 2. Results for individual goldfish with background luminosity 0/0-41 ft.lamberts
Fish
Wavelength
426462
494528S85615635670700
I
O-2
o-6i -oi -4i '4i-62 0
I'O
o-6
II
—o-6I - O
1'4i-6i-8a-oi -o
o-6
III [V
O-2 O-2o-8 o-81 - 2
1 6i-82-O
2 - O
o-8 (
•4• 4
•6•8
[•8
3-8O-2 O-2
V
0-4
o-8I - 41 4i-62 0
2-O
I - O
0-4
Mean niear
0-25 0-590-72I-2O
1 44i-6o1 841-960-92 <0-40 — (
[•03[•II
[•28[•27
['45i-495-333-21
This curve appears to have two maxima. One peak occurs in the region of 615-630 m/i, and is probably due to cone activity. The other less distinct peak occurs inthe region 520-535 m/i. The fact that the rod pigment of the related species Carassius
31 Exp. Biol. 42, 3

486 J. R. CRONLY-DILLON AND W. R. A. MUNTZ
carasshis has its absorption maximum at 523 m/i (Dartnall, 1961) suggests that thissecondary peak in the photopic sensitivity curve of the goldfish might be due toactivity of rods that are still functioning under photopic conditions. In order to testthis hypothesis a second experiment was run using a lower adapting light.
0 -
400 600
Wavelength (m/i)
700
Fig. 2. Spectral sensitivity of goldfish under two conditions of background illumination.Open circles, background illumination of 041 ft. lamberts; closed circles, backgroundillumination of 0-052 ft. lamberts.
400 700600
Wavelength (m/i)
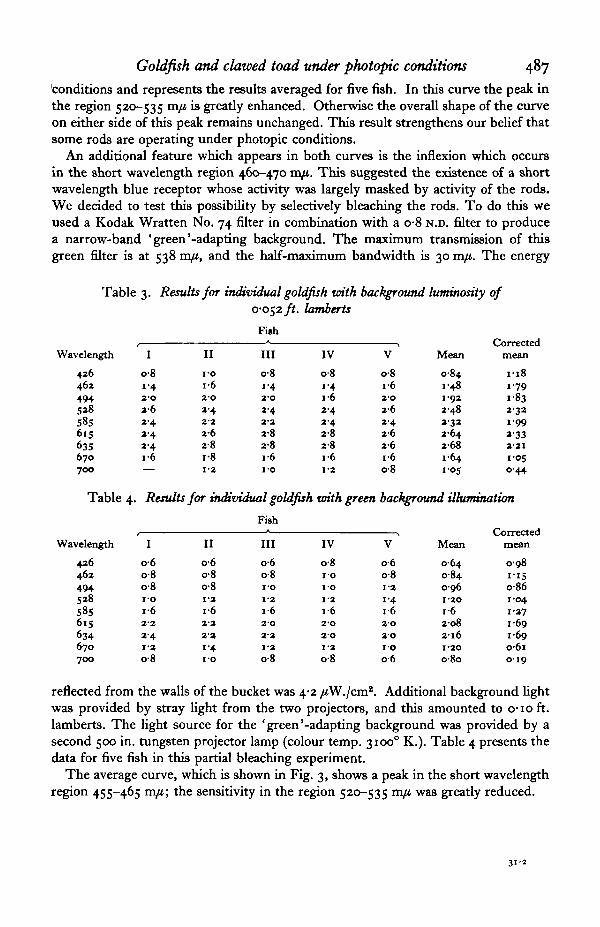
Fig. 3. Spectral sensitivity of goldfish with green background illumination.
Table 2 presents the data when the adapting light was only 0-052 ft. lamberts. Thebackground illumination in this case was provided by stray light from the projectoronly. The uppermost curve in Fig. 2 shows the photopic sensitivity under these
Goldfish and clawed toad under photopic conditions 487
conditions and represents the results averaged for five fish. In this curve the peak inthe region 520-535 m/i is greatly enhanced. Otherwise the overall shape of the curveon either side of this peak remains unchanged. This result strengthens our belief thatsome rods are operating under photopic conditions.
An additional feature which appears in both curves is the inflexion which occursin the short wavelength region 460-470 m/t. This suggested the existence of a shortwavelength blue receptor whose activity was largely masked by activity of the rods.We decided to test this possibility by selectively bleaching the rods. To do this weused a Kodak Wratten No. 74 filter in combination with a o-8 N.D. filter to producea narrow-band 'green'-adapting background. The maximum transmission of thisgreen filter is at 538 nyj, and the half-maximum bandwidth is 30 m/£. The energy
Table 3. Results for individual goldfish with background luminosity of0-052 ft. lamberts
Fish
Wavelength
426462
4945285856156356707 0 0
I
o-81 42-O
2-62-42-42-4
—
II
i -oi-62-O
2 42 - 2
2-62-8i-81-2
III
o-81-42'O
2 42 - 2
2-82-81-6i-o
IV
o-81-4i-62-42-42'82 8i-61-2
V
o-8i -62-O
2-62 42-62-6i-6o-8
Mean
0 8 41-481 922 4 82 3 22 6 42 6 81-641 05
mear
1 1 81 7 91 8 32-321 9 92-332-211-05o-44
Table 4. Results for individual goldfish vrith green background illumination
Fish
Wavelength
426462494538
585615634670700
I
o-6o-8o-8i -o1 62 - 2
2 41-2
o-8
II
o-6o-8o-81-2
i-62-22'21-4I-O
III
o-6o-8i -o1-2
i-62 - 0
2-2
1-2
o-8
IV
o-8i -oI-O
1-2
i-62-O
2 - 0
1-2
O'8
V
o-6o-81-2
1-4i-62-O
2 0
i -oo-6
Mean
0-640-840-961-20i-62 0 82 1 6I-2Oo-8o
mear
0 9 8I-ISo-861 041-271-691 6 9o-6i0-19
reflected from the walls of the bucket was 4-2 /iW./cm*. Additional background lightwas provided by stray light from the two projectors, and this amounted to o-io ft.lamberts. The light source for the 'green'-adapting background was provided by asecond 500 in. tungsten projector lamp (colour temp. 31000 K.). Table 4 presents thedata for five fish in this partial bleaching experiment.
The average curve, which is shown in Fig. 3, shows a peak in the short wavelengthregion 455-465 m/i; the sensitivity in the region 520-535 mji was greatly reduced.
31-2
J. R. CRONLY-DILLON AND W. R. A. MUNTZ
(b) Clawed toad
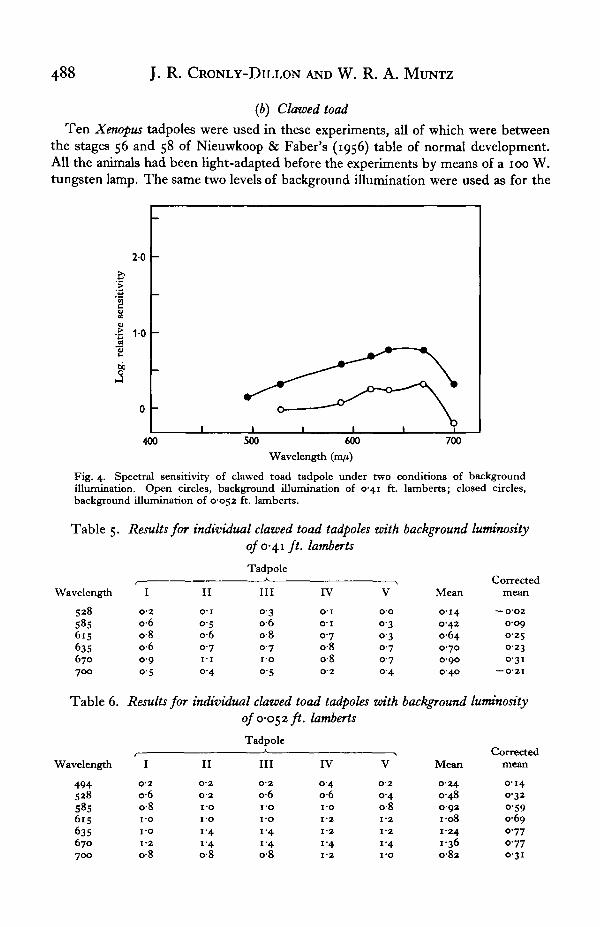
Ten Xenopus tadpoles were used in these experiments, all of which were betweenthe stages 56 and 58 of Nieuwkoop & Faber's (1956) table of normal development.All the animals had been light-adapted before the experiments by means of a 100 W.tungsten lamp. The same two levels of background illumination were used as for the
400 600
Wavelength (m/t)
700
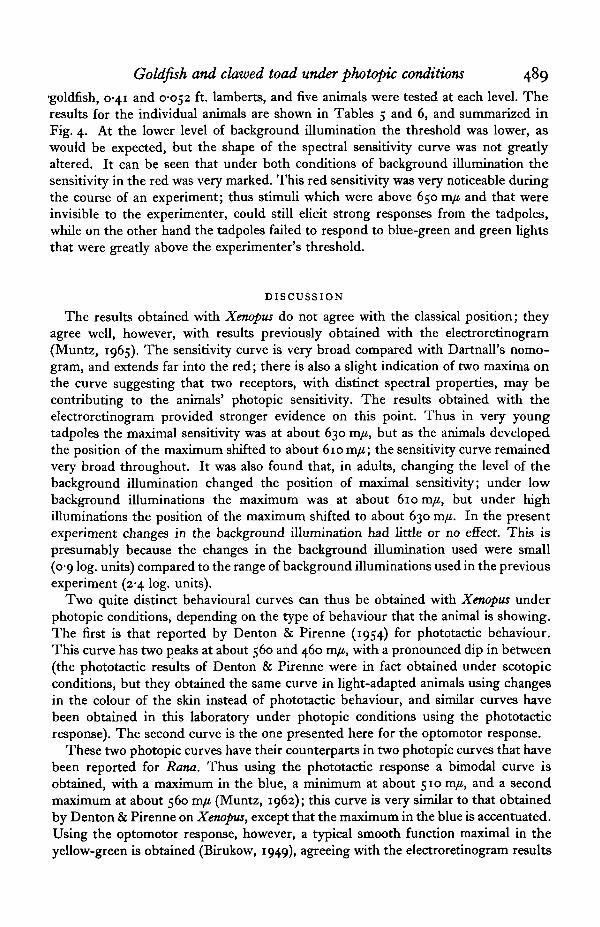
Fig. 4. Spectral sensitivity of clawed toad tadpole under two conditions of backgroundillumination. Open circles, background illumination of 0-41 ft. lamberts; closed circles,background illumination of 0052 ft. lamberts.
Table 5. Results for individual clawed toad tadpoles with background luminosityof 0-4.1 ft. lamberts
Tadpole
Wavelength
528
S856156356707 0 0
I
O-2
o-6o-8o-60 90-5
II
o - i
o-so-60 71 1
0-4
I I I
o-3o-6o-80 7i - o
o-5
rvo - i
o - i
0-7o-8o-8O-2
V
OO
O-30-30-70 70 4
Mean
0 1 4
0-420-640-70o-oo0 4 0
Correctedmean
— 0 0 2
0-09
0 2 5
0 2 3
0 3 1
— 0-21
Table 6. Results for individual clawed toad tadpoles with background luminosityof o-o^z ft. lamberts
Tadpole
Wavelength
4 9 4528
S85
6 i S
6356 7 07 0 0
I
O-2
o-6o-8i -oi -o1-2
o-8
II
O-2
O'2
I-O
I-O
1 "41-4o-8
II I rv0'2 0 4o-6 o-6i -oi -o1-4
1-40-8
[ • 0
[ - 2
[ - 2
[ • 4
[ - 2
V
O-2
0 4o-81-2
1-2
1-4I-O
Mean
0-240 4 80-921 081 2 4
1 3 60 8 2
mear
0-140 3 2
o-S90-690-770-770 3 1
Goldfish and clawed toad under photopic conditions 489
'goldfish, 0-41 and 0-052 ft. lamberts, and five animals were tested at each level. Theresults for the individual animals are shown in Tables 5 and 6, and summarized inFig. 4. At the lower level of background illumination the threshold was lower, aswould be expected, but the shape of the spectral sensitivity curve was not greatlyaltered. It can be seen that under both conditions of background illumination thesensitivity in the red was very marked. This red sensitivity was very noticeable duringthe course of an experiment; thus stimuli which were above 650 m/i and that wereinvisible to the experimenter, could still elicit strong responses from the tadpoles,while on the other hand the tadpoles failed to respond to blue-green and green lightsthat were greatly above the experimenter's threshold.
DISCUSSION
The results obtained with Xenopus do not agree with the classical position; theyagree well, however, with results previously obtained with the electroretinogram(Muntz, 1965). The sensitivity curve is very broad compared with Dartnall's nomo-gram, and extends far into the red; there is also a slight indication of two maxima onthe curve suggesting that two receptors, with distinct spectral properties, may becontributing to the animals' photopic sensitivity. The results obtained with theelectroretinogram provided stronger evidence on this point. Thus in very youngtadpoles the maximal sensitivity was at about 630 m/i, but as the animals developedthe position of the maximum shifted to about 610 m/i; the sensitivity curve remainedvery broad throughout. It was also found that, in adults, changing the level of thebackground illumination changed the position of maximal sensitivity; under lowbackground illuminations the maximum was at about 610 m/i, but under highilluminations the position of the maximum shifted to about 630 m/i. In the presentexperiment changes in the background illumination had little or no effect. This ispresumably because the changes in the background illumination used were small(09 log. units) compared to the range of background illuminations used in the previousexperiment (2-4 log. units).
Two quite distinct behavioural curves can thus be obtained with Xenopus underphotopic conditions, depending on the type of behaviour that the animal is showing.The first is that reported by Denton & Pirenne (1954) for phototactic behaviour.This curve has two peaks at about 560 and 460 m/i, with a pronounced dip in between(the phototactic results of Denton & Pirenne were in fact obtained under scotopicconditions, but they obtained the same curve in light-adapted animals using changesin the colour of the skin instead of phototactic behaviour, and similar curves havebeen obtained in this laboratory under photopic conditions using the phototacticresponse). The second curve is the one presented here for the optomotor response.
These two photopic curves have their counterparts in two photopic curves that havebeen reported for Rana. Thus using the phototactic response a bimodal curve isobtained, with a maximum in the blue, a minimum at about 510 m/i, and a secondmaximum at about 560 m/i (Muntz, 1962); this curve is very similar to that obtainedby Denton & Pirenne on Xenopus, except that the maximum in the blue is accentuated.Using the optomotor response, however, a typical smooth function maximal in theyellow-green is obtained (Birukow, 1949), agreeing with the electroretinogram results

49° J- R- CRONLY-DILLON AND W. R. A. MUNTZ
of Granit (1947). The two spectral curves of Rana are adapted to the two types ofbehaviour. The optomotor response yields a sensitivity curve of the classical form,so that the animal will respond maximally to the brightness of the stimulus, irrespec-tive of colour. On the other hand, in the phototactic situation the response is specificto wavelength, and relatively independent of brightness; it has been suggested thatthis is a specialization helping the animal to escape towards the water when frightened(Muntz, 1962). Inhibitory effects have been shown to be involved in the phototacticcurve, so that some sensitivity is sacrificed in obtaining the wavelength specificity.
In the case of Rana there is evidence as to the neural basis of these differences aswell. Thus it is probable that the sensitivity in the phototactic situation is mediatedby a system of on fibres projecting to the diencephalon from the retina (Muntz, 1962)and the optomotor response is presumably mediated by fibres passing to the optictectum, probably on-off fibres.
The optomotor response shows that Xenopus possess a marked sensitivity in thered part of the spectrum, and the question therefore arises as to whether the animalcan respond to red as a colour, irrespective of brightness and saturation. An experi-ment reported by Burgers (1952), using the optomotor response, suggests that it can.Burgers showed that stripes of blue or of green could be matched by stripes of asuitable shade of grey so that no response was obtained; no shade of grey was found,however, which the animals were unable to distinguish from red. A second questionconcerns the usefulness of this marked red sensitivity to the animal in its naturalenvironment, but at present it is not possible to suggest any hypothesis on this point.
The results obtained from Xenopus suggest that more than one receptor contributesto the photopic sensitivity of this animal. The same is true of the photopic sensitivityof the goldfish, where at least three receptors appear to be involved. These threereceptors can be separated out to some extent by varying the background illumination.Thus decreasing the background illumination causes a marked increase in sensitivityin the region of 530 m/i. It is probable therefore that the sensitivity in this region isdue to the rods, since these would be expected to have their maximal sensitivity atabout this point, and it would also be expected that their sensitivity would be enhanced,relative to that of the cones, by decreasing the background illumination. A difficultywith this view is that the hump at this point cannot be fitted by Dartnall's nomogram,being too narrow, particularly on the blue side of the maximum. Grundfest (1932 a),using the optomotor response and working on the scotopic sensitivity of the sunfish,also found his spectral sensitivity curve to be too narrow: the narrowness in hisexperiment was much more extreme than it was in the case of the 530 m/i hump in thegoldfish. He suggested that the effect was due to photo-insensitive pigments whichwere acting as filters and absorbing light on either side of the maximum and thereforesharpening the curve, and he discusses what the pigments might be. If this explana-tion applies to the goldfish only one pigment need be postulated, absorbing towardsthe blue end of the spectrum. Although no definite evidence is available, such asituation is very probable. Granit (1947), for example, has presented several illustra-tions of the fact that spectral curves obtained on intact eyes suggest little sensitivityin the blue, but that if the lens and optic media are removed, so that the light fallsdirectly on to the retina itself, the spectral sensitivity approaches much more nearlyto that expected from the absorption spectrum of the appropriate visual pigment.

Goldfish and clawed toad under photopic conditions 491
It thus appears that, in the goldfish, the rods contribute to the spectral sensitivitycurve under photopic conditions as well as under scotopic conditions. This situationwas also found by Granit (1941) on a related species, Cyprinus, using the electroretino-gram; irrespective of the state of light-adaptation two humps were always apparentone at the characteristic position for rods and one at the characteristic position forcones. The effect of dark-adaptation or light-adaptation was to alter the relativeheights of the two humps, but Granit never succeeded in abolishing either humpentirely. The result is interesting since it shows that in certain circumstances the rodsare functioning under photopic conditions. Other work also •suggests that this maysometimes occur. In humans, for example, the photopic sensitivity curve does notappear to contain any contribution from the rods, but the electroretinogram indicatesthat the rods may still befunctioning (Riggs et al. 1943), and calculations show thatonly a small amount of the rhodopsin need have been bleached away (Rushton, i960).Although therefore the rods do not appear to contribute to brightness perceptionunder photopic conditions in most vertebrates, they may well still be functioning, andcould be involved as one of the receptors of colour vision, as has been suggested, forexample, by Willmer (1946). An hypothesis to explain one particular type of colourvision, in which the rods are involved as a receptor having inhibitory properties, haspreviously been put forward for Rana (Muntz, 1963).
The present experiments demonstrate two other receptors contributing to thephotopic sensitivity of the goldfish, apart from the rods. The first of these is maximallysensitive at about 610 m/i, in the classical position for cone sensitivity. The curve isagain rather narrow, and does not, for example, give a good fit with cyanopsin, aswould be required by the classical position. Such narrowness is, however, common forphotopic sensitivity curves, and was again found by Grundfest (1932a) for the sun-fish. The third receptor appears to be maximal at about 450 mfi, in the blue. Bluereceptors are common in other animals. Thus blue-sensitive pigments have beenextracted from the retina of the tench (Dartnall, 1952) and the frog (Dartnall, 1957)and blue receptors are strongly suggested by experiments on several other animals(for example, Granit, 1947, guinea-pig, Ingvaar, 1959, cat; Blackwell & Blackwell,1961, man).
The results suggest that the goldfish has three receptors, in the blue, the green,and the orange, and that all three are capable of functioning under photopic conditions.These three receptors could clearly form the basis for a system of colour vision ac-cording to the trichromatic scheme. The work of MacNichol et al. (1961), however,shows that colour is coded in goldfish according to an opponents scheme of the typeput forward by Hering, and not according to a trichromatic scheme. The recordingswere made at the level of the ganglion cells, however, so that it is possible that thereceptors function according to a trichromatic scheme, but that, after analysis by theretina, the information is coded in the optic nerve according to opponent principlesof the type put forward by Hering. Several 'zone theories' of this sort have beenworked out in some detail, and have been reviewed by Judd (1951). The data fromthe present experiments are not detailed enough to warrant working out such a schemein detail for the goldfish, but it is easy to see in a general way how the analysis couldbe performed. For example, consider a retinal ganglion cell receiving inputs from anequal number of rods and cones, and connected in such a way that the input from

492 J. R. CRONLY-DILLON AND W. R. A. MUNTZ
the rods is excitatory and causes the ganglion cell to fire at the onset of illumination,whereas the input from the cones is inhibitory and causes the ganglion cell to fire by' rebound' at the end of illumination. Such a ganglion cell will have precisely thecharacteristics described for one class of optic nerve fibre by MacNichol et al. (1961):it will give an off response to red, and an on response to blue. Different retinal inter-connexions of this sort between receptors and ganglion cells could similarly give riseto the other characteristic types of spectral response described for the optic nervefibres.
SUMMARY
1. Photopic spectral sensitivity curves have been obtained by means of the opto-motor response for the tadpole of the clawed toad (Xenopus laevis), and for the gold-fish (Carassius auratus). Both these animals have visual pigments based on vitamin A2,and would be expected therefore to have photopic sensitivity curves maximal atabout 615 m/i and fitting, at any rate approximately, the absorption spectrum ofcyanopsin.
2. The results with Xenopus show a broad curve extending far into the red, andhaving its maximal sensitivity at about 630 m/i. It is probable that this curve reflectsthe summated activity of two receptors, maximally sensitive at 610 and 630 m/i.
3. The results are discussed in relation to other behavioural work with Xenopus,using the phototactic response, in which an entirely different form of spectral curvewas obtained, and in relation to behavioural and physiological data which are availablefor Rana.
4. The photopic curve of the goldfish shows three humps, which can be separatedout to a large extent by using different background illuminations. One hump ismaximal at about 610 m/i, the classical position for cone sensitivity in freshwater fish.A second hump is maximal at about 530 m/i, and is probably due to the rods, and thethird hump is maximal at about 450 m/j in the blue. The relation of these three re-ceptors to colour vision in this animal are discussed.
REFERENCES
BIRUKOW, G. (1949). Die Entwicklung des Tages—und dea DSmmerungsehen im Ange des Gras-frosches (Rana temporaria L.). Z. vergl. Physiol. 31, 322—47.
BLACKWELL, H. R. & BLACKWELL, O. M. (1961). Rod and cone mechanisms in typical and atypicalcongenital achromatopsia. Vision Res. 1, 62-107.
BLOUGH, D. S. (1957). Spectral sensitivity of the pigeon. J. Opt. Soc. Amer. 47, 827-33.BROWN, R. H. (1937). The bright sensitivity curve of the rabbit. J. Gen. Psychol. 17, 323-8.BURGEBS, A. C. J. (1952). Optomotor reactions of Xenopus laevis. I. Physiol. comp. 3, 272-81.DARTNALL, H. J. A. (1952). Visual pigment 467, a photosensitive pigment present in tench retinae.
J. Physiol. 116, 257-89.DARTNALL, H. J. A. (1956). Further observations on the visual pigments of the clawed toad, Xenopus
laevis. J. Physiol. 134, 327-38.DARTNALL, H. J. A. (1957). The Visual Pigments. London: Methuen and Co. Ltd.DARTNALL, H. J. A. (i960). Visual pigments of colour vision. In: Mechanisms of Colour Discrimination,
ed. Y. Galifret. Oxford: Pergamon Press.DARTNALL, H. J. A, (1961). The identity and distribution of visual pigments in the animal kingdom.
In: The Eye, vol. 11, ed. H. Davson. New York and London: Academic Press.DENTON, E. J. & PIRENNE, M. H. (1954). The visual sensitivity of the toad, Xenopus laevis. J. Physiol.
135, 181-207.GRANIT, R. A. (1941). A relation between rod and cone substances based on scotopic and photopic
spectra of Cyprinus, Tinea, Anguilla and Testudo. Acta physiol. scand. 3, 334-46.
Goldfish and clawed toad under photopic conditions 493GRANIT, R. (1947). Sensory Mechanisms ofthe Retina. Oxford University Press.GRUNDFEST, H. (1932a). The sensibility of the sunfish, Lepomtis, to monochromatic radiation of low
intensities. J. Gen. Physiol. 15, 307-28.GRUNDFEST, H. (19326). The spectral sensitivity of the sunfish as evidence for a double visual system.
J. Gen. Physiol. 15, 507-24.GUNTER, R. (1954). The spectral sensitivity of light-adapted cats. J. Physiol. 123, 400-15.INGVAAR, D. H. (1959). Spectral sensitivity as measured in cerebral visual centres. Acta Physiol. scand.
46, suppl. 159.JACOBS, G. H. (1063). Spectral sensitivity and colour vision of the squirrel monkey. J. Comp. Physiol.
Psychol. 56, 616-21.JUDD, D. B. (1961). Basic correlates of the visual stimulus. In: Handbook of Experimental Psychology,
ed. S. S. Stevens. New York: John Wiley and Sons, Inc.MACNICHOL, E. F., JR., WOLBARSHT, M. L. & WAGNER, H. G. (1961). Electrophysiological evidence
for mechanism of colour vision in the goldfish. In Light and Life, W. D. McElroy and H. B. Glass(eds.). Baltimore, Maryland: Johns Hopkins Press.
MCCLEARY, R. A. & BERNSTEIN, J. J. (1959). A unique method for control of brightness cues in studyof colour vision in fish. Pkysiol. Zool. 33, 384-92.
MUNTZ, W. R. A. (1962). Effectiveness of different colours of light in releasing the positive phototacticbehaviour of frogs, and a possible function of the retinal projection to the diencephalon. J. Neuro-physiol. 25, 712-20.
MUNTZ, W. R, A. (1963). The development of phototaxis in the frog {Rana temporaria). J. Exp. Biol.40, 371-9-
MUNTZ, W. R. A. (1965). The spectral sensitivity of Xenopus laevis as determined by the electroretino-gram threshold (in preparation).
NIEUWKOOP, P. D. & FABER, J. (1956). Normal table of Xenopus laevis Daudin. Amsterdam: North-Holland Publishing Company.
RIGGS, L. A., BERRY, R. N. & WAYNER, M. (1943). A comparison of electrical and psychophysicaldeterminations of the spectral sensitivity of the human eye. J. Opt. Soc. Amer. 39, 427-36.
RUSHTON, W. A. H. (i960). At the retinal level. In: Mechanisms of Colour Vision, ed. Y. Galifret.Oxford: Pergamon Press.
STILES, W. S. & CRAWFORD, B. H. (1933). The luminal brightness increment as a function of wave-length for different conditions of the foreal and paraforeal retina. Proc. Roy. Soc. B, 113, 496-530.
TANSLEY, K., COPENHAVER, R. M. & GUNKEL, R. D. (1961). Spectral sensitivity curves of diurnalsquirrels. Vition Res. I, 154-65.
WALD, G. (1945). Human vision and the spectrum. Science, 101, 653-8.WALD, G., BROWN, P. K. & SMITH, P. H. (1953). Cyanopsin, a new pigment of cone vision. Science,
118, 505-8.WALD, G., BROWN, P. K. & SMITH, P. H. (1955). Iodopsin. J. Gen. Physiol. 38, 623-81.WEALE, R. A. (1953). Colour vision in the peripheral retina. Brit. Med. Bull. 9, 55-60.WILLMER, E. N. (1946). Retinal Structure and Colour Vision: a Restatement and an Hypothesis. Cam-
bridge University Press.