the south african social mediawebsite.ornico.co.za/report/sa_social_media_landscape_2020.pdf ·...
TRANSCRIPT

THE SOUTH AFRICAN
SOCIAL MEDIAL A N D S C A P E
Brought to you by:
world wide worx
SOCIAL MEDIA MYTHSHIGH WALLS AND
CONTROLLED DATA

CO
NT
EN
TS INTRODUCTION
Oresti Patricios, CEO, Ornico
INDUSTRY SURVEYIntroduction by Arthur Goldstuck, MD, World Wide Worx
YOU NEED THE BIG PICTURE TO GET THE BIG INSIGHTSFrancois Van Dyk, Head of Operations, Ornico
INSTAGRAM: ALL ABOUT CELEBRITY Arthur Goldstuck, MD, World Wide Worx
LINKEDIN - SATURATION AND BEYONDArthur Goldstuck, MD, World Wide Worx
TWITTER, A VITAL VOICEArthur Goldstuck, MD, World Wide Worx
THE BATTLE IN UNDERSTANDING CONSUMER AUDIENCESKelvin Jonck, MD, YOUKNOW
INSIDE TWITTER
TIKTOK GROWTH IN AFRICAArthur Goldstuck, MD, World Wide Worx
THE EVOLUTION OF NATURAL LANGUAGE INTERPRETATIONRobin Meisel, Co-Founder, Psychographica
SOCIAL MEDIA PSYCHOGRAPHICS
UNDER THE SKIN OF SOCIAL MEDIA IN SOUTH AFRICAArthur Goldstuck, MD, World Wide Worx
TGI/ASK AFRIKA SURVEY
GLOBALWEBINDEX SURVEY
DATA PARTNERS
ACKNOWLEDGEMENTS
03062124273334373943445254606263

#SocialSA2020
3
SOCIAL MEDIA MYTHS, SOCIAL MEDIA MYTHS, HIGH WALLS AND HIGH WALLS AND
CONTROLLED DATACONTROLLED DATAOresti Patricios - CEO, Ornico
S ocial media is filled with unproven myths, guesses and
assumptions from both brands and individuals, where measurement shows that most data is behind the high walls of platforms that we trust with our data.
The much talked about Facebook–Cambridge Analytica data scandal of 2018 was the tipping point to API closures from Facebook,
Instragram, Twitter and others.
What does this mean for brands, measurement, brand data democratisation and publicly available information for communicators, marketing and brands?
It means that in some ways we have regressed in our ability to monitor, measure and make sense of how people utilise social media.
On the other hand, it means we are now finding better ways to collaborate and add other localised data sets that increase context in Africa.
Additional to the data that is controlled by social media platforms (where they are the only ones who report statistics) we now also integrate usage from people on the ground as well as platform numbers.

#SocialSA2020
4
The 2020 edition of The South African Social Media Landscape includes more data sets from on-the-ground research through collaboration with TGI / Ask Afrika and also YOUKNOW, who bring insightful survey data by GlobalWebIndex. These, among other significant social media platform numbers, form one of the most in-depth analyses into the usage of social media and internet usage in South Africa. Ornico has found that analysing social media spend, growth and usage needs a detailed look from across various data points, which include looking outside the platforms by asking some of the most active social media users about their habits.
Another finding is that Facebook spend has plateaued, based on a survey that informs social media spend which is a large part of
the Social Media Landscape. This signals how brands are looking at prioritising their budgets across platforms, which can also talk to where brands look to increase their communication. Does this mirror your view of social media usage? Are brands seemingly spending less on advertising across platforms, especially Facebook?
Launched in China in 2016, TikTok is seen as the new kid on the block in South Africa which marketers and communicators are scrambling to understand. Talking about the growth of this platform on the 2020 edition of The South African Social Media Landscape, researcher and analyst, Arthur Goldstuck, says he has never seen such traction on Twitter, Facebook, LinkedIn or Instagram. No matter how famous, infamous or unknown the subjects of the content. We look
forward to seeing how brands find their way around this relatively new platform which celebrated its 1-billion user mark in February 2019.
One of the underlying areas that brands and platforms miss out on when analysing social media interactions with their communities is the psychographics aspects. Brands and individuals express themselves from a human perspective which determines who the brands appeal to. This years’ report also sees us collaborating with Psychographica, a company that utilises social signals and natural language interpretation to report on the psychology and emotion expressed by social media users. This includes brands, individual community managers behind brands and the individual users who engage with these accounts.

#SocialSA2020
5
Both 2019 and now 2020 have been years of questioning the relevance of the influencer and balancing the scales of what goes viral because it’s paid for versus what makes the news because it resonates. One of the myths that was debunked was that hopping onto the bandwagon of trending content, like the #KFCProposal, adds to brand relevance. In fact, it didn’t work for most of the brands that jumped on later. So much so that when the wedding happened towards the end of 2019, no brands were mentioned except KFC. The Woolies Water Challenge also trended in a similar way without the brand in sight, but Woolworths played along without attempting to overshadow the people who started the trend. In fact, it may even be the age of brands
enabling social media virality by being great at customer experience.
In the age of social media myths, high walls and controlled data, Africa’s growth will be reliant on making as much findings as possible. From brands, marketers to platforms themselves there is a great opportunity to collaborate and contribute towards improved standards.
After all, customers are evolving and the smartest brands with the most intelligent analysis and insightful understanding of people will continue to win. Let’s tear down the high walls and democratise data. [SocialSA2020]
One of the myths that was
debunked was that hopping
onto the bandwagon of trending
content, like the #KFCProposal,
adds to brand relevance.
#SocialSA2020
6
SA SOCIAL MEDIA LANDSCAPE 2020
INDUSTRY SURVEYArthur Goldstuck, MD, World Wide Worx

#SocialSA2020
7
O ur survey of more than 100 of South Africa’s biggest brands
revealed that Facebook remains the social platform of choice for marketing. Nine out of 10 respondents – just more than 89% - indicated they were active on Facebook, versus 77% on Twitter, 75% on LinkedIn and 68% on Instagram.
There was a common factor across all these platforms, however: a substantial drop in engagement from the previous year. The one exception was LinkedIn, which saw a small increase in activity by major brands. LinkedIn also led the way in the proportion of older platforms who were intending to use it for the first time in the coming year: a large 21%. It also sees a rise in platform where most budget was planned to be allocated, from 11% of respondents to 15% of respondents, while most other platforms fell in this regard.
One could argue that LinkedIn is a social platform whose time has come. The
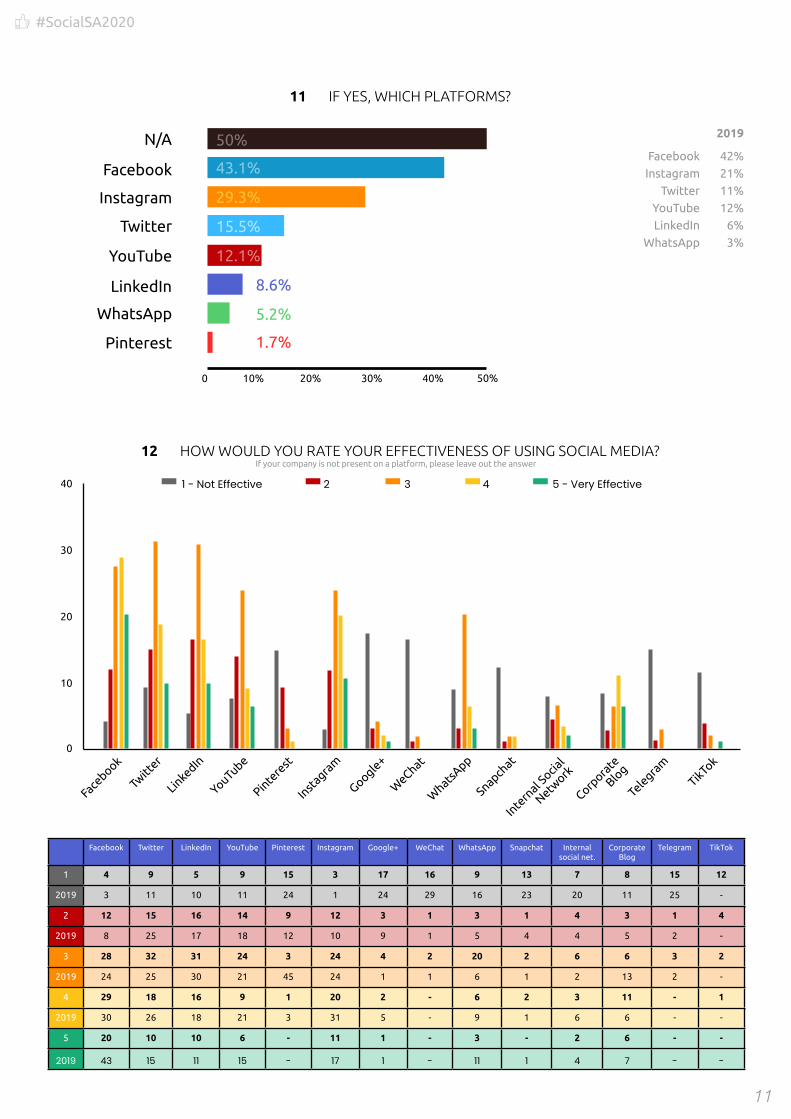
popularity of social media environments for brands has in the past been shown to be directly related to the level of usage of those platforms by marketers. Hence, TikTok is almost non-existent among big brands, as the marketers behind those brands are not active on TikTok. Of the fewer than 20% of brands using it, none believe they are doing so very effectively. These numbers are likely to change significantly during 2020.
On the flip side, as marketing professionals have embraced LinkedIn and discovered how powerful a tool it is for connecting with other professionals, they have thrown their weight behind it.
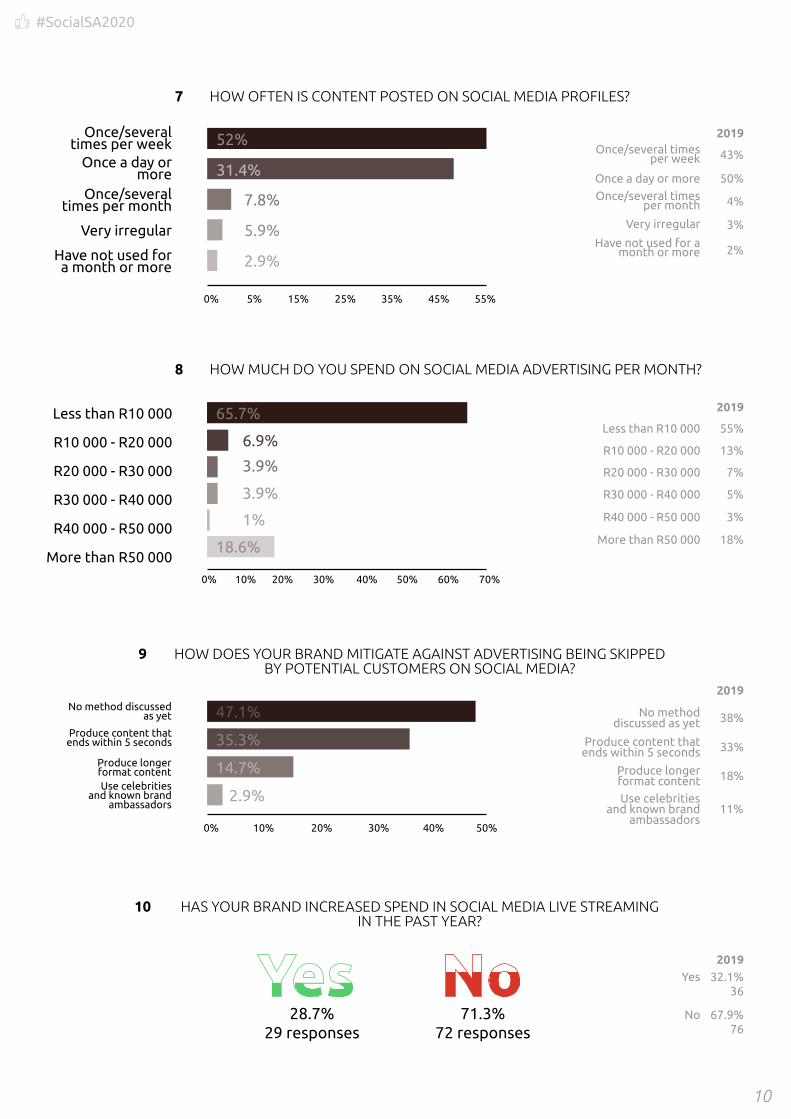
One of the factors behind the declining use of most social platforms appears to be the cost associated and the budgets available. The proportion of brands spending less than R10,000 a month on social media increased sharply from 55% to 65%, suggesting a tightening of budgets in this area. As a result, the proportion posting
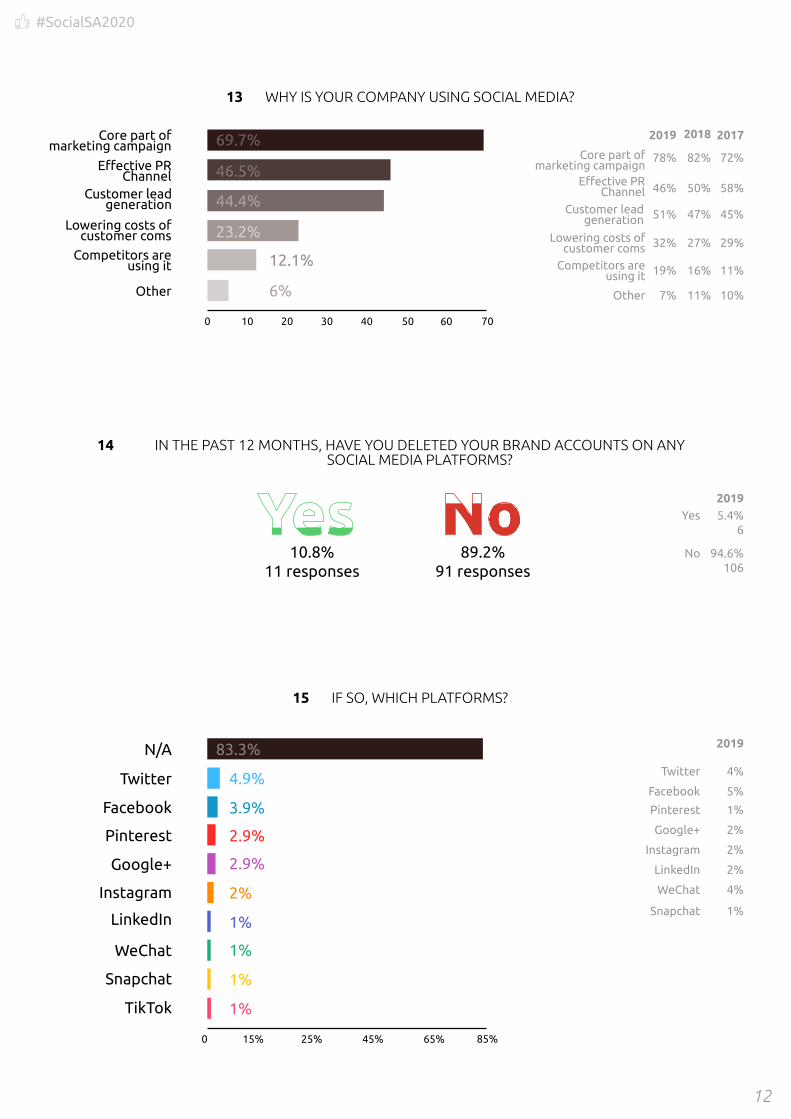
on social media profiles once a day or more, has dropped dramatically, from 50% to 31%. Just over 10% of brands have gone as far as deleting accounts from social media platforms – most typically from Twitter, but Facebook also being taken out of play.
Training of staff has also been ditched wholesale, with only 53% planning to do so this year, compared to 78% last year. No wonder only 10% of brands say they have optimal skills in this area, compared to 15% last year.
Not surprisingly, then, lack of budget emerges as the single most significant barrier to implementing social media strategies. A massive 18% are not allocating budget to social media, compared to only 1% last year.
In short, these are hard times in social media. [SocialSA2020]

#SocialSA2020
8
2019 201996.4% 87.5%
20182017 2018201796%97% 88%90%
People may select more than one checkbox, so percentages may add up to more than 100%.
89.2% 77.5%2019
67.9%2018201768%68%
50%2019
77.7%2018201778%72%
68.6%2019
73.2%20182017
73%72%
75.5%
SURVEY PARTICIPANTS
PLATFORM USAGE
Marketing
Consumers (B2C)
Businesses (B2B)
Digital/Social Media
PR Advertising Media
25.5%25.5% 17.6%17.6% 17.6%17.6% 10.8%10.8% 8.8%8.8%
Research 4.9% Sales 3.9% Media Buying 2% Crowdfunding 2% Other 7%
WhatsApp 34.3% Corporate Blog 23.5% Mobile App 11.8% Google+ 8.8% Internal Social Network 6.9%
2019 Digital / Social Media 25% Marketing 25% PR 19% Advertising 11% Media 7%
26 Responses 18 Responses 18 Responses 11 Responses 9 Responses
0 804020 60
76.5%
57.8%
WHAT INDUSTRY/PROFESSION/ROLE ARE YOU IN?
DO YOU HAVE FORMAL SOCIAL MEDIA MARKETING STRATEGIES FOR B2C AND B2B?2
1
WHAT PLATFORMS ARE YOUR COMPANY CURRENTLY ACTIVE ON?3

#SocialSA2020
9
Facebook 61%
2019
8%
11%
3%
13%
2%
2%
YouTube
Google+
0 30%20%10% 40% 50% 60%
YouTube
Google+
25.5%2019 2019 2019 2019
36% 22% 26% 26%2018 2018 2018 20182017 2017 2017 2017
13% 8% 16% 14%14% 14% 16% 26%
People may select more than one checkbox, so percentages may add up to more than 100%.
People may select more than one checkbox, so percentages may add up to more than 100%.
31.4% 25.5% 23.5% 21.6%
LinkedIn 21.6% Facebook 15.7% Twitter 11.8% Mobile App 11.8% Snapchat 9.8%
WHICH OF THOSE YOU ARE NOT ACTIVE ON, DO YOU PLAN TO BE IN THE NEXT 12 MONTHS?4
WHICH PLATFORM ARE YOU SPENDING MOST OF YOUR SOCIAL MEDIA BUDGET ON?5
WHO IS MANAGING THE SOCIAL MEDIA ACCOUNTS?6
59.4%
15.6%
11.5%
5.2%
3.1%
2.1%
2.1%
Marketing Team
201942%
11%
16%
4%
7%
14%
6%
201844%
16%
13%
12%
5%
N/A
11%
201739%12%
N/A
12%
4%
16%
N/A
PR Team
Individuals
Third Party
Strategy Team
Agency
Other
0 10 20 30 40
Individuals
Agency
PR Team
Other
Strategy Team
Third Party
Myself
Marketing Team 38.2%
20.6%
15.7%
8.8%
9%
2.9%
2.9%
2.2%
#SocialSA2020
10
HOW OFTEN IS CONTENT POSTED ON SOCIAL MEDIA PROFILES?7
HOW MUCH DO YOU SPEND ON SOCIAL MEDIA ADVERTISING PER MONTH?8
HOW DOES YOUR BRAND MITIGATE AGAINST ADVERTISING BEING SKIPPED BY POTENTIAL CUSTOMERS ON SOCIAL MEDIA?
9
HAS YOUR BRAND INCREASED SPEND IN SOCIAL MEDIA LIVE STREAMING IN THE PAST YEAR?
10
50%
2019
43%
4%
3%
2%
Once/several times per month
Once/several times per month
Very irregular Very irregular
Have not used for a month or more
Have not used for a month or more
Once/several times per week Once/several times
per weekOnce a day or more Once a day or more
15%5% 25% 35% 45% 55%0%
2019
2019
2019
52%
31.4%
7.8%
5.9%
2.9%
R10 000 - R20 000R10 000 - R20 000
R20 000 - R30 000 R20 000 - R30 000
R30 000 - R40 000 R30 000 - R40 000
R40 000 - R50 000R40 000 - R50 000
More than R50 000More than R50 000
Less than R10 000Less than R10 000 55%
13%
7%
5%
3%
18%
10% 20% 30% 40% 50% 60% 70%0%
65.7%
6.9%
3.9%
3.9%
1%
18.6%
33%
18%
11%
38%
Produce longer format content
Use celebrities and known brand
ambassadors
Use celebrities and known brand
ambassadors
No method discussed as yet
Produce content that ends within 5 seconds
Produce longer format content
No method discussed as yet
Produce content that ends within 5 seconds
10% 20% 30% 40% 50%0%
47.1%
35.3%
14.7%
2.9%
32.1%36
67.9%76
No
Yes
28.7%29 responses
71.3%72 responses
#SocialSA2020
11
Facebook 42%
2019
11%
6%
12%
21%
3%
YouTube
0 20%10% 30% 40% 50%
YouTube
N/A
IF YES, WHICH PLATFORMS?11
50%
43.1%
29.3%
15.5%
12.1%
8.6%
5.2%
1.7%
1 - Not Effective 2 3 4 5 - Very Effective
Twitt
er
Corpora
te
Blog
Telegra
m
YouTube
Pinte
rest
Inst
agram
Google+
Whats
App
Snapchat
Inte
rnal S
ocial
Network
Face
book
TikTok0
10
20
30
40
Facebook Twitter LinkedIn YouTube Pinterest Instagram Google+ WeChat WhatsApp Snapchat Internalsocial net.
Corporate Blog
Telegram TikTok
1 4 9 5 9 15 3 17 16 9 13 7 8 15 12
2019 3 11 10 11 24 1 24 29 16 23 20 11 25 -
2 12 15 16 14 9 12 3 1 3 1 4 3 1 4
2019 8 25 17 18 12 10 9 1 5 4 4 5 2 -
3 28 32 31 24 3 24 4 2 20 2 6 6 3 2
2019 24 25 30 21 45 24 1 1 6 1 2 13 2 -
4 29 18 16 9 1 20 2 - 6 2 3 11 - 1
2019 30 26 18 21 3 31 5 - 9 1 6 6 - -
5 20 10 10 6 - 11 1 - 3 - 2 6 - -
2019 43 15 11 15 - 17 1 - 11 1 4 7 - -
If your company is not present on a platform, please leave out the answerHOW WOULD YOU RATE YOUR EFFECTIVENESS OF USING SOCIAL MEDIA?12
#SocialSA2020
12
2019
78%
46%
51%
32%
19%
7%
2018
82%
50%
47%
27%
16%
11%
2017
72%
58%
45%
29%
11%
10%
10 20 30 40 50 60 700
Core part of marketing campaign
Core part of marketing campaign
Effective PR Channel
Effective PR Channel
Customer lead generation
Customer lead generation
Lowering costs of customer coms
Lowering costs of customer coms
Competitors are using it
Competitors are using it
OtherOther
WHY IS YOUR COMPANY USING SOCIAL MEDIA?13
69.7%
44.4%
46.5%
23.2%
12.1%
6%
IN THE PAST 12 MONTHS, HAVE YOU DELETED YOUR BRAND ACCOUNTS ON ANY SOCIAL MEDIA PLATFORMS?
14
IF SO, WHICH PLATFORMS?15
20195.4%
6
94.6%106
No
Yes
10.8%11 responses
89.2%91 responses
Facebook 5%
2019
4%
2%
1%
2%
2%
4%
1%
Google+
Snapchat
0 25%15% 45% 65% 85%
N/A
Google+
Snapchat
TikTok
83.3%
4.9%
3.9%
2.9%
2.9%
2%
1%
1%
1%
1%

#SocialSA2020
13
HOW DO YOU PLAN TO IMPROVE SOCIAL MEDIA SKILLS AND COMPETENCIES IN 2020?16
DO YOU HAVE THE RIGHT SKILLS IN PLACE TO LEVERAGE AND MANAGE SOCIAL MEDIA EFFECTIVELY IN 2020?
17
HOW ARE YOU MEASURING YOUR SOCIAL MEDIA EFFECTIVENESS ON TWITTER?18
2019
78%
7%
15%
11%
4%
14%
2018
60%
10%
16%
13%
4%
27%
2017
67%
12%
17%
7%
5%
17%
Use specialist social media agencies
Hire a social media consultant
Hire in experts(within our sector)
Use specialist social media agencies
Hire a social media consultant
Hire in experts(within our sector)
Hire in experts(outside our sector)
Hire in experts(outside our sector)
We have no plans at present We have no plans at
present
Invest in training our current people Invest in training
our current people
10% 20% 30% 40% 50% 60%0%
53.5%
3.9%
8.8%
40.2%
37.3%
9.8%
17.2%
23.2%
5.1%
16.2%
7.1%
20192%8%
37%
38%
15%
20183%6%
25%
50%
16%
20173%
11%36%
30%
20%
0% 10% 20% 30% 40% 50%
2 2
33
4
4
Our skills are optimal
Our skills are optimal
We are ill equippedWe are ill equipped
2019
53%
19%
54%
67%
35%
51%
17%
5%5%
23%
2018
59%
22%
62%
73%
45%
45%
24%
13%N/A
N/A
2017
69%
23%
69%
74%
43%
51%
26%
6%N/A
N/A
Retweets
Number of customer followers
Number of followersRetweets
Click through rates
Mentions & Comments
Sentiment analysis
Sentiment analysis
Enquiries via Twitter
Click through rates
Longevity of activity around posts/campaigns
Enquiries via Twitter
Number of customer followers Revenue via Twitter
Other
Revenue via Twitter
Other
Longevity of activity around posts/campaigns
Mentions & Comments
Number of followers
10% 20% 30% 40% 50% 60%0%
56.7%
48.9%
44.4%
43.3%
35.6%
20%
14.4%
12.2%
8.9%
8%

#SocialSA2020
14
2019
48%
27%
66%
75%
17%
63%
38%
15%
25%
2018
64%
36%
74%
72%
33%
70%
39%
24%
N/A
2017
57%
28%
67%
78%
33%
51%
40%
35%
N/A
Likes & Shares
Posts
Click through rates
Mentions & Comments
Number of fans
Likes & Shares
Enquiries via Facebook
Sentiment analysisPosts
Click through rates
Sentiment analysis
Enquiries via Facebook
Revenue via Facebook
Revenue via Facebook
Longevity of activity around posts/comments
Longevity of activity around posts/comments
Mentions & Comments
Number of fans
10% 20% 30% 40% 50% 60% 70%0%
2019
7%
24%
43%
36%
41%
17%
31%
6%
12%
2018
11%
22%
36%
46%
37%
N/A
33%
13%
N/A
2017
20%
24%
56%
54%
39%
N/A
49%
11%
N/A
Click through ratesPosts
Longevity of activity around posts/campaigns
Mentions & Comments
Mentions & Comments
Likes & SharesEnquiries via
Click through rates
Other
Posts
We don’t have LinkedIn
We don’t have LinkedIn
Enquiries via LinkedIn
Revenue via LinkedIn
Revenue via LinkedIn
Number of groupmembers
Longevity of activity around posts/campaigns
Likes & SharesNumber of group
members
15% 25% 35% 45% 55%0%
HOW ARE YOU MEASURING YOUR SOCIAL MEDIA EFFECTIVENESS ON FACEBOOK?19
HOW ARE YOU MEASURING YOUR SOCIAL MEDIA EFFECTIVENESS ON LINKEDIN?20
HOW ARE YOU MEASURING YOUR SOCIAL MEDIA EFFECTIVENESS ON YOUTUBE?21
62.8%
52.9%
43.1%
38.2%
34.3%
18.6%
13.7%
11.8%
9.8%
2%
10%
58.5%
55.3%
48.9%
34%
22.3%
20.2%
19.1%
13.8%
2019
73%
43%
30%
18%
14%
14%
2018
54%
29%
29%
19%
20%
43%
2017
96%
53%
36%
26%
33%
N/A
N/A
Other
Average length per viewAverage length
per viewNumber of subscribersNumber of
subscribers Comments
Likes
LikesCommentsOther
Number viewsNumber views
15% 25% 35% 45% 55% 65%0%
61.8%
36.3%
25.5%
12.7%
10.8%
9.9%
10%
#SocialSA2020
15
2019
27%
23%
60%
64%
32%
12%
20%
6%
15%
21%
Click through rates
Posts
Longevity of activity around posts/campaigns
Mentions & Comments
Mentions & Comments
Likes
Enquiries via Instagram
Click through rates
OtherPosts
Other
Enquiries via Instagram
Revenue via Instagram
Not applicable
Your posts featured by other accounts
Revenue via Instagram
Number of followers
Longevity of activity around posts/campaigns
Your posts featured by other accounts
Likes
Number of followers
10% 20% 30% 40% 50% 60%0%
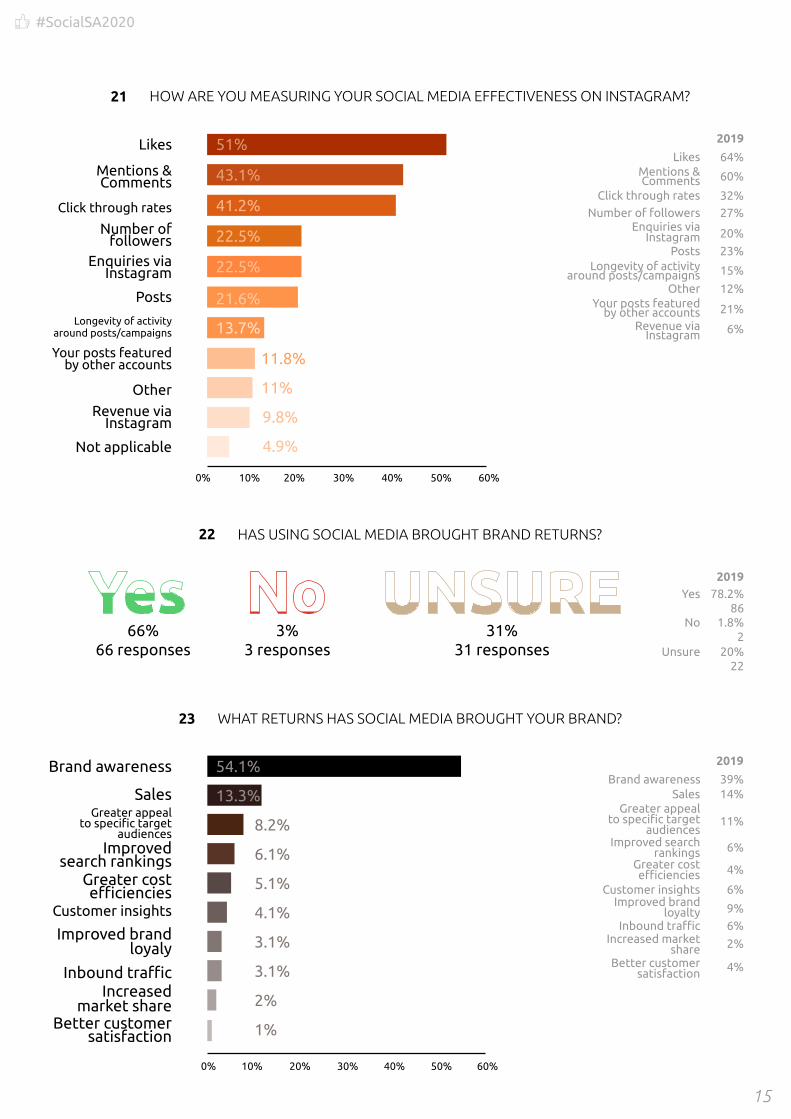
HOW ARE YOU MEASURING YOUR SOCIAL MEDIA EFFECTIVENESS ON INSTAGRAM?21
51%
43.1%
41.2%
22.5%
22.5%
21.6%
13.7%
11.8%
9.8%
4.9%
11%
HAS USING SOCIAL MEDIA BROUGHT BRAND RETURNS?22
WHAT RETURNS HAS SOCIAL MEDIA BROUGHT YOUR BRAND?23
201978.2%
861.8%
220%
22
No
Unsure
Yes
66%66 responses
3%3 responses
31%31 responses
Customer insights
Brand awarenessSales
Improved brand loyalty
Improved brandloyaly
Better customer satisfaction
Improved search rankings
Improved search rankings
Better customersatisfaction
Inbound traffic
Inbound traffic
Greater cost efficienciesGreater cost
efficiencies
Increased market share
Customer insights
Greater appeal to specific target
audiences
Increased market share
Greater appeal to specific target
audiences
Brand awareness
Sales 14%
2019
39%
9%
4%
6%
6%
4%
6%
2%
11%
10% 20% 30% 40% 50% 60%0%
54.1%
13.3%
8.2%
6.1%
5.1%
4.1%
3.1%
3.1%
2%
1%

#SocialSA2020
16
DOES YOUR BRAND MAKE USE OF PAID SOCIAL MEDIA INFLUENCERS?24
DO YOU KNOW WHO THE MOST INFLUENTIAL PEOPLE IN YOURSOCIAL MEDIA COMMUNITIES ARE?
25
DO YOU KNOW THE OVERALL INFLUENCE OF YOUR SOCIAL MEDIA COMMUNITIES?26
DO YOU USE PROGRAMMATIC ADVERTISING TOOLS?27
2019
2019
2019
2019
35.7%40
63.4%71
51.8%58
40%44
64.3%72
36.6%41
48.2%54
60%66
No
No
No
No
Yes
Yes
Yes
Yes
29.4%30 responses
58.8%60 responses
58.8%60 responses
36.4%36 responses
70.6%72 responses
41.2%42 responses
41.2%42 responses
63.6%63 responses
HAVE PROGRAMMATIC ADVERTISING TOOLS IMPROVED YOUR ROI?28
201934.6%
379.3%
1056.1%
60
No
Unsure
Yes
25.8%25 responses
12.4%12 responses
61.9%60 responses

#SocialSA2020
17
0 105 15 20 25 30 35 40
1 - No problem 2 3 - Some complications 4 5 - Significant barrier
Lack of Budget
Time to properly manage these
channels
Inability to measure
Lack of technology
Lack of management
understanding
Level of change in digital
Skills of marketing/brand
teams
Quality of agency partners
Lack of budget Time to properly manage these
channels
Inability to measure
Lack of technology
Lack of management
understanding
Level of change in digital
Skills of marketing/brand
teams
Quality of agency partners
1
2020 4 6 17 31 15 14 11 17
2019 11 13 15 33 15 13 13 22
2018 15 19 27 42 23 26 26 40
2017 13 7 19 36 18 14 10 32
2
2020 14 20 28 26 26 34 29 34
2019 12 8 14 28 17 16 18 22
2018 12 11 19 30 19 26 27 26
2017 17 11 24 32 12 22 22 28
3
2020 40 26 33 26 25 32 30 33
2019 37 20 43 25 26 36 42 34
2018 34 34 41 26 25 36 29 28
2017 35 33 34 34 36 57 43 28
4
2020 19 22 18 15 23 17 21 14
2019 15 39 21 15 27 34 26 21
2018 19 30 16 12 22 21 15 12
2017 25 37 28 8 28 16 27 19
5
2020 25 18 6 4 13 5 11 4
2019 37 32 19 11 27 13 13 13
2018 36 22 13 6 27 7 19 10
2017 26 28 11 5 22 7 14 9
WHAT ARE THE BARRIERS PREVENTING MARKETERS FROM GETTING MORE VALUE OUT OF SOCIAL MEDIA?
29

#SocialSA2020
18
2019
26%
40%
13%
6%
4%
4%
15%
38%
4%
4%
Cloud applications for marketing/social media
Chatbots
Artificial Intelligence
Machine Learning
Virtual Reality / Augmented Reality
Blockchain - Smart Contracts
Machine Learning
Blockchain - Cryptocurrency
Blockchain - Smart Contracts
Blockchain - Other
Blockchain - Cryptocurrency
CRM and listening tools
Clarabridge
Virtual Reality / Augmented Reality
NoneNone
Other
Blockchain - Other
Cloud applications for marketing/social media
ChatbotsArtificial Intelligence
10% 20% 30% 40% 50%0%
HAVE YOU ALLOCATED BUDGET TOWARDS NEW TECHNOLOGY FOR MARKETING PURPOSES?30
201942%
47
58%65
No
Yes
35%35 responses
65%65 responses
IF YES, WHICH OF THE FOLLOWING TECHNOLOGIES DO YOU UTILIZE?31
“OUR SENIOR MANAGEMENT FULLY UNDERSTAND WHY WE ARE USING SOCIAL MEDIA”32
45.3%
45.3%
41.5%
30.2%
13.2%
4.8%
3.8%
1.9%
No strong view26.5%
Strongly disagree11.8%
Strongly agree61.8%
2019
47%
36%
15%
2018
56%
23%
21%
2017
49%
35%
16%
No strong view
Strongly disagree
Strongly agree
1.9%
1.9%
1.9%
#SocialSA2020
19
Strongly agree24.5%
Strongly disagree22.5%
No strong view52.9%
No strong view19.6%
Strongly Disagree1%
Strongly agree79.4%
Strongly agree29.4%
Strongly disagree22.5% No strong view
48%
2019
2019
2019
28%
91%
30%
46%
9%
49%
27%
0%
21%
2018
2018
2018
45%
94%
32%
28%
4%
45%
27%
2%
23%
2017
2017
2017
34%
89%
25%
23%
10%
47%
33%
1%
28%
No strong view
No strong view
No strong view
Strongly disagree
Strongly disagree
Strongly disagree
Strongly agree
Strongly agree
Strongly agree
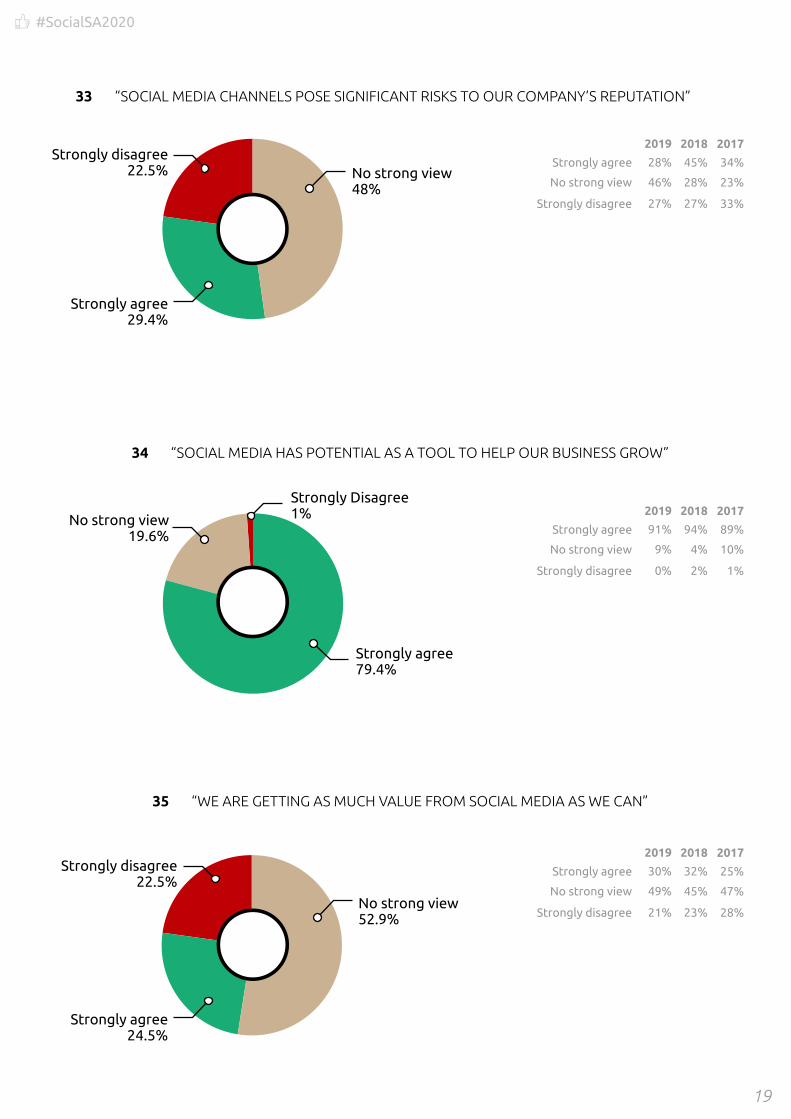
“SOCIAL MEDIA CHANNELS POSE SIGNIFICANT RISKS TO OUR COMPANY’S REPUTATION”33
“SOCIAL MEDIA HAS POTENTIAL AS A TOOL TO HELP OUR BUSINESS GROW”34
“WE ARE GETTING AS MUCH VALUE FROM SOCIAL MEDIA AS WE CAN”35

#SocialSA2020
20
2019
53%
9%
64%
50%
29%
30%
29%
32%
42%
2018
57%
8%
66%
44%
26%
36%
47%
7%
5%
2017
60%
53%
67%
52%
33%
46%
44%
N/A
N/A
Social media analytics
Hiring a social media agency
Social influencer marketing
Multimedia content (video/podcasts etc)
Cross-platform campaigns
Social influencer marketing
Competitor analysis
Social media banner ads
Social media based activations
Social media banner ads
Social media based activations
Data analytics tools (other than social
media analytics)Data analytics tools
(other than social media analytics)
Competitor analysis
Hiring a social media agency
Cross-platform campaigns
Multimedia content (video/podcasts etc)
Social media analytics
0% 10% 20% 30% 40% 50% 60%
0 10 20 30 40 50
Increased
Increased
Decreased
Decreased
Not using social media
Not using social media
Stayed the same
Stayed the same
0 10 20 30 40 50 60
END OF SURVEY RESULTS
2019
2019
44%
62%
44%
25%
4%
3%
1%
0%
2018
2018
42%
57%
36%
31%
9%
7%
5%
2%
2017
2017
44%
66%
38%
26%
7%
4%
3%
2%
Increased
Increased
Decreased
Decreased
Not using social media
Not using social media
Stayed the same
Stayed the same
42.1%
32.3%
30.3%
50.9%
18.6%
6.8%
5.8%
8.8%
HAS SOCIAL MEDIA BUDGET ALLOCATION CHANGED SINCE THE PREVIOUS YEAR? - IN 201936
HAS SOCIAL MEDIA BUDGET ALLOCATION CHANGED SINCE THE PREVIOUS YEAR? - PLANNING TO IN 2020
36
WHICH SOCIAL MEDIA STRATEGIES ARE YOU PLANNING TO IMPLEMENT IN THE NEXT 12 MONTHS?
37
55%
52%
46%
31%
31%
30%
24%
22%
18%
#SocialSA2020
21
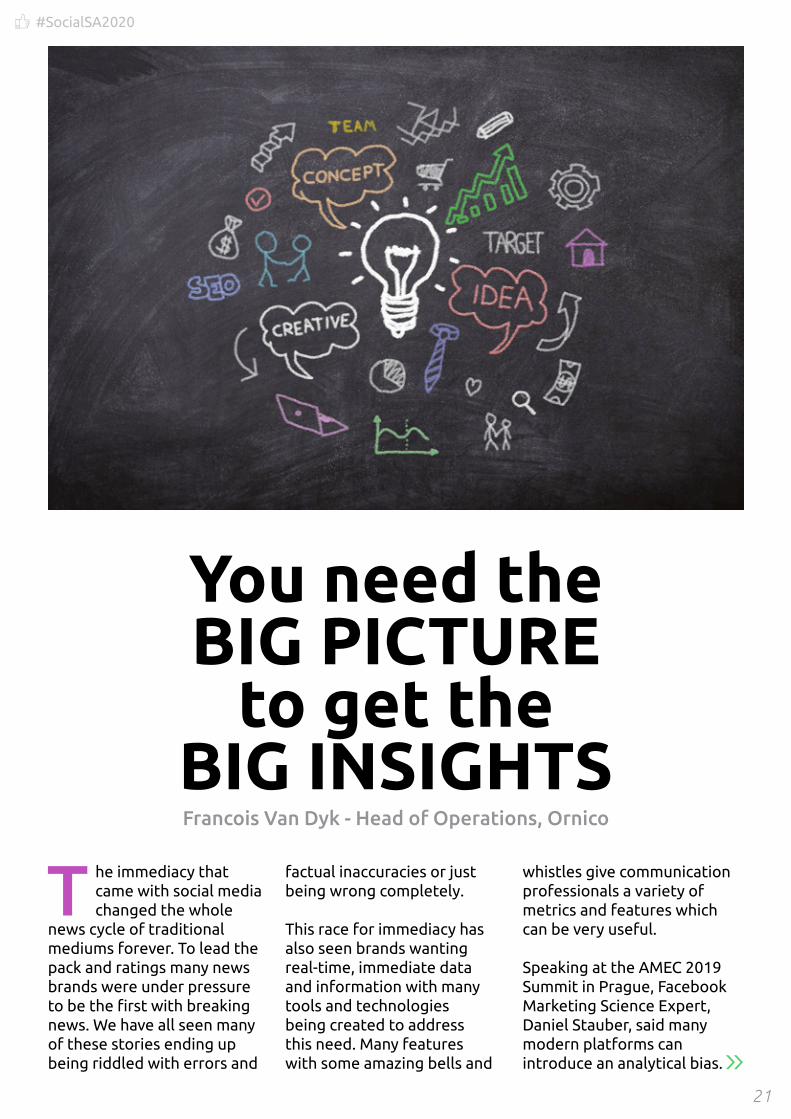
T he immediacy that came with social media changed the whole
news cycle of traditional mediums forever. To lead the pack and ratings many news brands were under pressure to be the first with breaking news. We have all seen many of these stories ending up being riddled with errors and
factual inaccuracies or just being wrong completely.
This race for immediacy has also seen brands wanting real-time, immediate data and information with many tools and technologies being created to address this need. Many features with some amazing bells and
whistles give communication professionals a variety of metrics and features which can be very useful.
Speaking at the AMEC 2019 Summit in Prague, Facebook Marketing Science Expert, Daniel Stauber, said many modern platforms can introduce an analytical bias.
You need theBIG PICTURE
to get theBIG INSIGHTSFrancois Van Dyk - Head of Operations, Ornico
#SocialSA2020
22
For instance, because it measures “likes” this then becomes the metric of choice for the observer. Because of this inherent bias Stauber believes it becomes even more critical for communicators to be very aware of the specific objectives of their campaigns.As William Bruce Cameron said: “Not everything that can be counted counts, and not everything that counts can be counted.”
When launching the Barcelona Principles of communication measurement in 2010, AMEC (The International Association for the Measurement and Evaluation of Communication) already recognised the importance of measuring social media by stating in their 6th Principle that “Social Media can and should be measured.”
In 2015, Barcelona Principles 2.0 made some subtle but, in some cases, fundamental changes to the original principles. Principle 6 was now updated to “Social media can and should be measured
consistently with other media channels.” So instead of just measuring social in its own space it now needed to be considered in the broader messaging context.
I recently did some research on a South African brand’s media coverage for a month. I noticed two particular spikes in the volume of coverage – one in the middle of the month and a second one towards the end. These spikes involved traditional media such as radio and newspapers with the majority of volumes coming from online news sites.
The first spike showed a very successful Corporate Social Responsibility programme by the brand - donating millions of rand to a not-for-profit organisation. The media responded well to this and provided lots of positive messaging around this good deed. The second spike was mainly incidental and passing mentions of the brand and focused on an unusual event which occurred at one of their
outlets – a feel-good story which actually went viral with over 100 000 views on social media, which the news channels then subsequently reported on.
We usually just analyse social media for this particular brand so I decided to compare my traditional media research to the usual social media report we do for them. As expected, Twitter conversations spiked at the exact same periods as the traditional – a perfect correlation. Until you dig a little deeper.
Though the month-end spike correlated – the brand only being mentioned incidentally – the first spike was very interesting.
Despite the very positive traditional reporting on the generous CSR donation, the Twitter spike during this exact period had very little discussions around this topic. The majority of conversations were about a competition they just launched – naturally with the obligatory hashtag!
Not everything that can be counted counts, and not everything that
counts can be counted.
#SocialSA2020
23
Now I am not privy to the brand’s marketing and communications planning but I do think that launching a totally unrelated competition on social media at the same time as doing a big CSR initiative was maybe not the wisest move.
The competition drowned out almost all Twitter conversations around the CSR project that the company was doing. Timing and context would have made all the difference where launching the competition a week before or after the CSR initiative would have given the brand more positive visibility over a longer period of time. The second spike also showed no participation by the brand. They may have only been mentioned in passing but a great opportunity was missed to build engagement on the feel-good viral story. But this
is a good example of how a siloed approach to a brand’s marketing and communication activities can dilute messages. The PR and communication team, advertising and digital agencies are all operating in their own little siloes without clear alignment to achieve a brand’s communication objectives.
Writing for WARC, Paul Smith says in an article on integrated marketing communications (IMC) that “IMC makes the range of messages more consistent and, in turn, more credible. This reduces risk in the mind of the buyer which then shortens the search process and helps to dictate the outcome of brand comparisons. Unintegrated, on the other hand, send disjointed messages which dilute message impact.” The same goes for measuring and evaluating your campaigns.
Had I only looked at the normal media coverage or social media in isolation, both would have looked great. By combining these I could find the anomaly and easily identify how to improve future campaigns. Many communicators chase big numbers – more “likes”, more impressions, more reach – the bigger the number the more they believe they show the success and the value of their activities. But the wonderful thing about measurement and evaluation best practices is not to necessarily show how great your campaign was. But rather to learn from the successes and failures. To do it much better next time. [SocialSA2020]
Francois van DykHead: Operations | OrnicoAMEC International Board Director

#SocialSA2020
24
T he depth of Instagram’s penetration in South Africa is best reflected
in the massive followings built up by media personalities. While AB de Villers remains the most-followed South African on the platform, that is largely a factor of his huge popularity in India, where he was one of the most successful batsmen in the Indian Premier League (IPL). His 9.7-million followers is larger than the total Instagram user base in South Africa, which is estimated at around 9-million.
A more realistic reflection of South African enthusiasm for Instagram personalities is the following of the next most popular individuals, actresses and TV presenters Boitumelo Thulo, with 3.6-million followers, and Minnie Dlamini with 3.5-million. Model, entrepreneur and presenter Bonang Matheba and hip-hop
artist Cassper Nyovest each have 3.4-million followers. Assuming that no one individual can capture as much as half of the country’s Instagram followers, this suggests a user base of at least 7.2-million, which supports the estimate of 9-million.
Ask Afrika’s TGI data for Instagram, provided later in this report, shows that 19% of those aged 15 and above, living in cities and towns, using Instagram actively (i.e. in the last 4 weeks). With a sample frame of 24.6-million, this suggests 4.7-million active users, given that active users tend to make up half of the user base of most social media platforms. This would confirm an estimate of around 9-million Instagram users in South Africa.
Further insights into Instagram’s usage in South
Africa are provided by the Industry Survey on page 6, which reveals that enthusiasm among marketers has declined a little, from 78% using it last year to 68% this year. Given budget constraints also revealed in the survey, it suggests that the cost of either using or competing with major personalities on the platform has become daunting for some. The key to such competing lies in skilfully executed strategies, but major brands have also reduced their commitment to building social media skills internally.
Does this mean Instagram has become a luxury for major brands? Not necessarily. A mere 2% have deleted Instagram accounts this year, the same level as the year before. So while they don’t keep the budget, they still keep the faith. [SocialSA2020]
Arthur Goldstuck, MD, World Wide Worx
ALLABOUTCELEBRITY

#SocialSA2020
25
minniedlamini
1,828 posts
MinnieSouth Africa’s Diamond Sport & Lifestyle TV Host/Actress/Executive [email protected]
3.5m followers 990 following
Follow bonang_m
1,727 posts
Bonang MathebaMedia Personality. Founder of The @houseofbng. Member of the Cap Classique Producer’s Association. Proudly South African ZA Forbes Africa’s 50 Most Powerful Women 2020www.BonangMatheba.com
3.4m followers 1.567 following
Follow
pearlthusi
3,070 posts
Pearl ThusiThespian. Philanthropist. African Khaleesi. Mama Pantha. African Tomb Raider. Ndlovukazi. Thusi elihle. Honourary Nigerian ooooo youtu.be/1zgxDFEifyI
3m followers 2.295 following
Follow
djzinhle
9,967 posts
ZINHLE JIYANENo1 FEMALE DJ IN AFRICA! SOUTH AFRICAN CLUB DJ ZA ERA BY DJ [email protected] FUSE ACADEMY KAIRO’s MAMA www.youtube.com/watch?v=aEWNNjiZBRk
3m followers 760 following
Follow amandadupont
1,046 posts
Amanda du-PontChild of GodCollaborations [email protected]/Pd7nCIIxL30
2.9m followers 291 following
Follow
TOP 20 SOUTH AFRICANS ON INSTAGRAM
abdevilliers17
474 posts
AB de VilliersSouth African Cricket player
9.7m followers 178 following
Follow
somizi
11,849 posts
Somizi
2.8m followers 1.204 following
Follow
boity
1,588 posts
Boitumelo Thulo#ForbesUnder30. Actress. TV. Entrepreneur. Musician. Legend in the making. ZA| @boitytoningsupport | Moët&Chandon | @impulse_southafrica | Emirates
3.6m followers 4.085 following
Follow
casspernyovest
5,982 posts
Refiloe Phoolo ZACLICK LINK BELOW FamilyTreeRec.lnk.to/GoodForThat
3.4m followers 1.487 following
Follow
nomzamo_m
1,430 posts
Nomzamo Mbatha ZAACTRESS UNHCR GOODWILL AMBASSADOR Face of NEUTROGENA PUMA Ambassador AUDI Ambassador [email protected] www.nomzamolighthouse.org
2.9m followers 2.433 following
Follow
1
3
5
7
9
2
4
6
8
10

#SocialSA2020
26
dalesteyn
1,073 posts
Athlete / Fishing fanatic / Dog dad /Ocean dweller / Restless wanderer /Powered by salami / @newbalanceza @nbcricket @gopro @goproza @oakley youtu.be/OF62RFyBqqU
1.4m followers 783 following
Follow
leratokganyago
630 posts
LeratokganyagoFounder of #FlutterByLKG, Award Winning TV Presenter! RADIO & CLUB DJ! For Bookings - [email protected] youtu.be/AYX2dnPQOK8
2m followers 2.127 following
Follow
thembiseete_
2,854 posts
Thembi Seete ZAFace of Ponds actor,performer,speaker Co-founder @azuribeautybar @thembiseete_fitnesspage Herbalife coach bookings: [email protected]
1.9m followers 2.007 following
Followjessicankosi
1,020 posts
jessicankosiAward winning South African ActressTV Presenter • Volvo Ambassador • A difference Maker
2.1m followers 1.098 following
Follow
ilovekhanya
819 posts
Khanya Mkangisa Actress TV Host club dj [email protected]
1.5m followers 773 following
Follow
emteethehustla
57 posts
eMTeeNEW MUSIC https://music.apple.com/za/al-bum/wave-single/1497077404.https://youtu.be/xRgs-DqFmzY
1.5m followers 616 following
Follow
akaworldwide
6,925 posts
AKA
2.6m followers 1.587 following
Follow
terrypheto
2,582 posts
Terry PhetoLeading Lady. Emotional Mannequin. Wanderlust.www.imdb.com/name/nm1965907
894k followers 1.733 following
Follow
realblackcoffee
1,934 posts
Black CoffeeAngel Investor @flightmodesawww.blackcoffeesbcncsly.com
2.5m followers 7.506 following
Follow
fafdup
778 posts
Faf du PlessisJesus follower , Husband , Father , Pro cricketer
1.1m followers 1.254 following
Follow
11
13
15
17
19
12
14
16
18
20
TOP 20 SOUTH AFRICANS ON INSTAGRAM
#SocialSA2020
27
S ometimes, a graph doesn’t provide a clear picture of a trend.
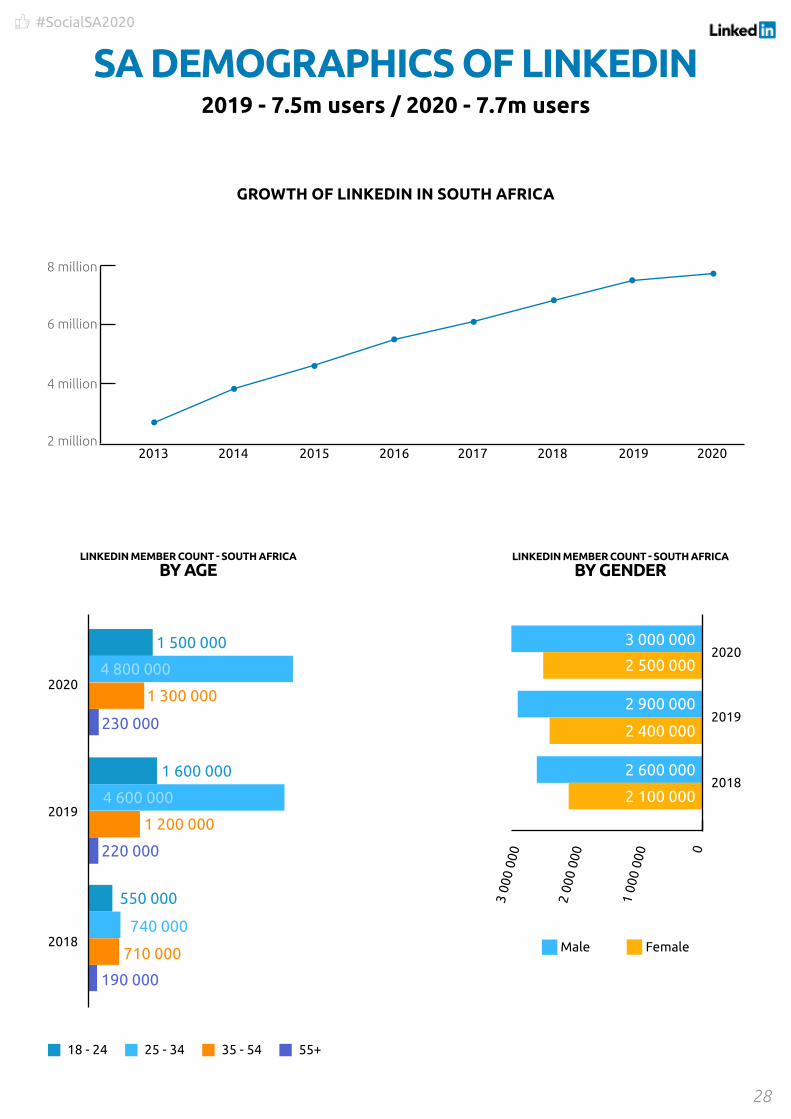
LinkedIn growth was relatively flat this year, rising only marginally from 7.5-million to 7.7-million users in South Africa. However, considering that it is a professional network, this can be seen as representing saturation rather than stagnation.
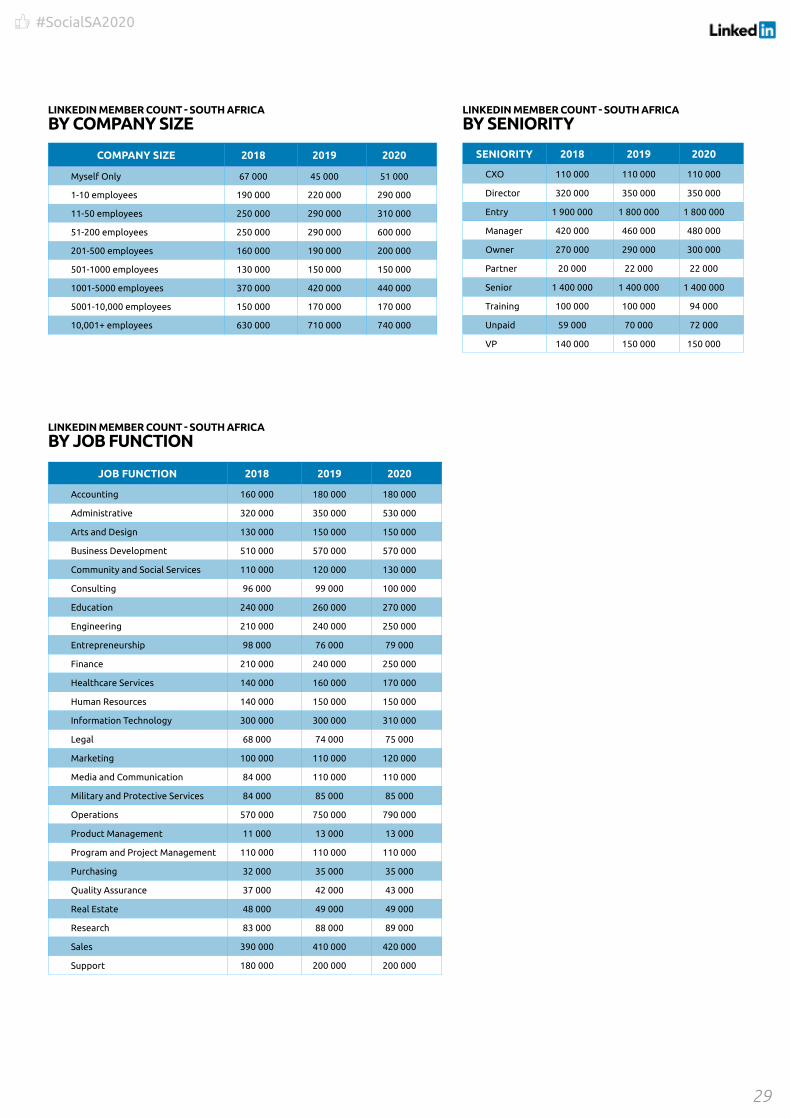
In particular, the data reveals strong growth among small and medium enterprises. While the number of large corporations, with more than 10,000 employees, grew strongly by 30,000 members, the biggest growth came from those with 1-10 employees (by 70,000), and those with 51-200 (by 310,000).
This indicates the extent to which those in small business are beginning to discover the secret behind LinkedIn’s success: it is a superb networking tool and corporate workers have always had the networking advantage through being exposed to a far larger complement of colleagues. LinkedIn helps to level this very unequal playing field, if it is leveraged effectively.
This also seems to be the secret that marketers have discovered. Because they themselves are increasingly using LinkedIn, and discovering its effectiveness, they are also integrating it into their companies’ branding strategies. The proportion
of brands responding to our Industry Survey (see page 6) that said they were allocating most of their social media budget to LinkedIn increased from 11% to 15% this year, while most other platforms saw a drop in their proportion of being the primary outlet.
The only industry sector that saw a significant jump, around a dozen and a half classified by LinkedIn, was Government, which increased from 190,000 to 220,000 members. This is a clear indication that LinkedIn is making its presence felt in all spheres of society. [SocialSA2020]
SATURATIONAND
BEYONDArthur Goldstuck, MD, World Wide Worx
#SocialSA2020
28
SA DEMOGRAPHICS OF LINKEDIN2019 - 7.5m users / 2020 - 7.7m users
GROWTH OF LINKEDIN IN SOUTH AFRICA
2 million2013 2014 2015 2016 2017 2018 2019 2020
4 million
6 million
8 million
LINKEDIN MEMBER COUNT - SOUTH AFRICA
BY GENDER
Male Female
0
20182 100 000
2 600 000
2 400 000
2 900 000
2 500 000
3 000 000
2019
2020
1 00
0 00
0
2 00
0 00
0
3 00
0 00
0
LINKEDIN MEMBER COUNT - SOUTH AFRICA
BY AGE
18 - 24 25 - 34 35 - 54 55+
2018740 000
710 000
550 000
190 000
20194 600 000
220 000
1 200 000
1 600 000
2020
230 000
1 500 000
4 800 000
1 300 000
#SocialSA2020
29
JOB FUNCTION 2018 2019 2020
Accounting 160 000 180 000 180 000
Administrative 320 000 350 000 530 000
Arts and Design 130 000 150 000 150 000
Business Development 510 000 570 000 570 000
Community and Social Services 110 000 120 000 130 000
Consulting 96 000 99 000 100 000
Education 240 000 260 000 270 000
Engineering 210 000 240 000 250 000
Entrepreneurship 98 000 76 000 79 000
Finance 210 000 240 000 250 000
Healthcare Services 140 000 160 000 170 000
Human Resources 140 000 150 000 150 000
Information Technology 300 000 300 000 310 000
Legal 68 000 74 000 75 000
Marketing 100 000 110 000 120 000
Media and Communication 84 000 110 000 110 000
Military and Protective Services 84 000 85 000 85 000
Operations 570 000 750 000 790 000
Product Management 11 000 13 000 13 000
Program and Project Management 110 000 110 000 110 000
Purchasing 32 000 35 000 35 000
Quality Assurance 37 000 42 000 43 000
Real Estate 48 000 49 000 49 000
Research 83 000 88 000 89 000
Sales 390 000 410 000 420 000
Support 180 000 200 000 200 000
COMPANY SIZE 2018 2019 2020
Myself Only 67 000 45 000 51 000
1-10 employees 190 000 220 000 290 000
11-50 employees 250 000 290 000 310 000
51-200 employees 250 000 290 000 600 000
201-500 employees 160 000 190 000 200 000
501-1000 employees 130 000 150 000 150 000
1001-5000 employees 370 000 420 000 440 000
5001-10,000 employees 150 000 170 000 170 000
10,001+ employees 630 000 710 000 740 000
LINKEDIN MEMBER COUNT - SOUTH AFRICA
BY COMPANY SIZE
SENIORITY 2018 2019 2020
CXO 110 000 110 000 110 000
Director 320 000 350 000 350 000
Entry 1 900 000 1 800 000 1 800 000
Manager 420 000 460 000 480 000
Owner 270 000 290 000 300 000
Partner 20 000 22 000 22 000
Senior 1 400 000 1 400 000 1 400 000
Training 100 000 100 000 94 000
Unpaid 59 000 70 000 72 000
VP 140 000 150 000 150 000
LINKEDIN MEMBER COUNT - SOUTH AFRICA
BY SENIORITY
LINKEDIN MEMBER COUNT - SOUTH AFRICA
BY JOB FUNCTION

#SocialSA2020
30
LINKEDIN MEMBER COUNT - SOUTH AFRICA
BY INDUSTRY
INDUSTRY 2018 2019 2020
Security and Investigations 52 000 58 000 61 000
Outsourcing/Offshoring 13 000 16 000 18 000
Facilities Services 23 000 26 000 27 000
Business Supplies and Equipment 36 000 38 000 40 000
Human Resources 59 000 62 000 63 000
Marketing and Advertising 110 000 NA NA
Public Relations and Communications 19 000 NA NA
Market Research 8 000 NA NA
Management Consulting 77 000 82 000 87 000
Accounting NA 150 000 150 000
Environmental Servces NA 41 000 43 000
Event Services NA 33 000 34 000
Executive Office NA 11 000 11 000
Information Services NA 11 000 12 000
Educational 320 000 360 000 370 000
E-Learning 14 000 14 000 14 000
Research 38 000 39 000 39 000
Education Management 150 000 170 000 170 000
Primary/Secondary Education 20 000 26 000 27 000
Higher Education 110 000 130 000 130 000
Finance 690 000 NA 530 000
Venture Capital & Private Equity 3 000 4 100 4 300
Capital Markets 5 000 6 000 6 200
Commercial Real Estate 7 000 NA NA
Banking 110 000 130 000 130 000
Insurance 90 000 100 000 100 000
Investment Management 16 000 18 000 19 000
Investment Banking 13 000 14 000 15 000
Real Estate 74 000 NA NA
Financial Services 310 000 320 000 330 000
Accounting 140 000 NA NA
Government 580 000 190 000 220 000
Political Organization 4 000 4 500 4 600
Government Relations 21 000 23 000 24 000
Executive Office 11 000 NA NA
Law Enforcement 37 000 NA NA
Public Safety 7 000 NA NA
Public Policy 3 000 4 000 4 000
Government Administration 140 000 150 000 160 000
International Affairs 1 000 1 300 1 300
INDUSTRY 2018 2019 2020
Agriculture 47 000 52 000 54 000
Farming 38 000 42 000 45 000
Ranching < 1 000 870 950
Dairy 4 000 4 700 4 900
Fishery 3 000 3 700 3 800
Arts 180 000 63 000 65 000
Music 23 000 NA NA
Arts and Crafts 33 000 36 000 36 000
Photography 14 000 15 000 15 000
Graphic Design 13 000 NA NA
Museums and Institutions 2 000 NA NA
Performing Arts 4 000 13 000 5 800
Fine Art 7 000 7 200 7 400
Motion Pictures and Film 7 000 NA NA
Design 46 000 NA NA
Construction 460 000 290 000 300 000
Architecture & Planning 30 000 NA NA
Civil Engineering 65 000 72 000 73 000
Building Materials 34 000 34 000 35 000
Construction 170 000 190 000 200 000
Consumer Goods 560 000 280 000 290 000
Import and Export 22 000 NA NA
Wholesale 25 000 NA NA
Wine and Spirits 12 000 13 000 13 000
Luxury Goods & Jewelry 5 000 6 300 6 600
Retail 170 000 NA NA
Furniture 14 000 16 000 16 000
Consumer Goods 52 000 53 000 54 000
Consumer Electronics 13 000 11 000 11 000
Food Production 41 000 NA NA
Supermarkets 4 000 NA NA
Tobacco 3 000 3 600 3 700
Cosmetics 21 000 24 000 25 000
Apparel & Fashion 24 000 28 000 29 000
Sporting Goods 4 000 4 500 4 700
Consumer Services - 49 000 48 000
Food & Beverage - 84 000 87 000
Corporate 700 000 550 000 570 000
Staffing and Recruiting 27 000 29 000 31 000
Professional Training & Coaching 33 000 29 000 30 000

#SocialSA2020
31
LINKEDIN MEMBER COUNT - SOUTH AFRICA
BY INDUSTRY CONTINUED...
INDUSTRY 2018 2019 2020
Judiciary 1 000 1 300 1 300
Legislative Office 2 000 3 400 3 500
Military 7 000 NA NA
High Tech 560 000 360 000 370 000
Computer & Network Security 21 000 22 000 23 000
Nanotechnology 800 NA NA
Wireless 3 000 NA NA
Defense & Space 11 000 NA NA
Computer Hardware 14 000 NA NA
Computer Software 68 000 69 000 71 000
Computer Networking 14 000 NA NA
Internet 30 000 33 000 35 000
Semiconductors 1 000 NA NA
Telecommunications 110 000 NA NA
Information Technology and Services 260 000 270 000 280 000
Legal 140 000 100 000 100 000
Alternative Dispute Resolution 2 000 2 900 3 000
Law Practice 52 000 54 000 55 000
Legal Services 42 000 46 000 48 000
Manufacturing 1 000 000 520 000 540 000
Plastics 9 000 9 700 10 000
Electrical/Electronic Manufacturing 73 000 81 000 82 000
Mechanical or Industrial Engineering 75 000 85 000 87 000
Industrial Automation 17 000 18 000 19 000
Packaging and Containers 15 000 17 000 17 000
Glass, Ceramics & Concrete 4 000 5 000 5 200
Renewables & Environment 17 000 16 000 17 000
Textiles 12 000 13 000 13 000
Paper & Forest Products 12 000 13 000 13 000
Railroad Manufacture 2 000 1 800 1 800
Machinery 28 000 30 000 32 000
Chemicals 55 000 61 000 64 000
Oil & Energy 72 000 NA NA
Mining & Metals 150 000 NA NA
Utilities 51 000 NA NA
Shipbuilding 1 000 1 500 1 700
Aviation & Aerospace 14 000 16 000 16 000
Automotive 110 000 130 000 130 000
Defence & Space - 13 000 14 000
Food Production - 46 000 49 000
INDUSTRY 2018 2019 2020
Media & Communications 430 000 230 000 230 000
Writing and Editing 20 000 19 000 19 000
Online Media 8 000 8 600 8 700
Animation 6 000 NA NA
Media Production 29 000 NA NA
Broadcast Media 29 000 NA NA
Printing 25 000 26 000 26 000
Publishing 17 000 18 000 18 000
Newspapers 4 000 4 900 5 100
Market Research - 9 000 9 100
Marketing and Advertising - 120 000 130 000
Public Relations & Communications - 20 000 20 000
Translation and Localization - 4 000 4 200
Health Care (formerly Medical) 300 000 240 000 250 000
Alternative Medicine 7 000 NA NA
Health, Wellness and Fitness 82 000 NA NA
Mental Health Care 9 000 11 000 11 000
Veterinary 4 000 5 000 5 100
Medical Devices 16 000 16 000 17 000
Hospital & Health Care 99 000 110 000 120 000
Pharmaceuticals 38 000 37 000 38 000
Biotechnology 13 000 14 000 14 000
Medical Practice 49 000 55 000 57 000
Non-profit 280 000 120 000 130 000
Program Development 4 000 4 700 5 000
Nonprofit Organization Management 44 000 50 000 52 000
Fund-Raising 7 000 3 400 3 400
Think Tanks 3 000 3 100 3 200
Philanthropy 2 000 3 100 3 200
International Trade and Development 11 000 12 000 12 000
Consumer Services 46 000 NA NA
Civic & Social Organization - 11 000 12 000
Individual & Family Services - 13 000 15 000
Libraries - 2 800 2 900
Museums & Institutions - 2 300 2 400
Religious Institutions - 21 000 22 000
Recreational & Travel 640 000 240 000 250 000
Computer Games 3 000 NA NA
Events Services 40 000 41 000 42 000
Recreational Facilities and Services 3 000 4 700 5 000
#SocialSA2020
32
LINKEDIN MEMBER COUNT - SOUTH AFRICA
BY INDUSTRY CONTINUED...
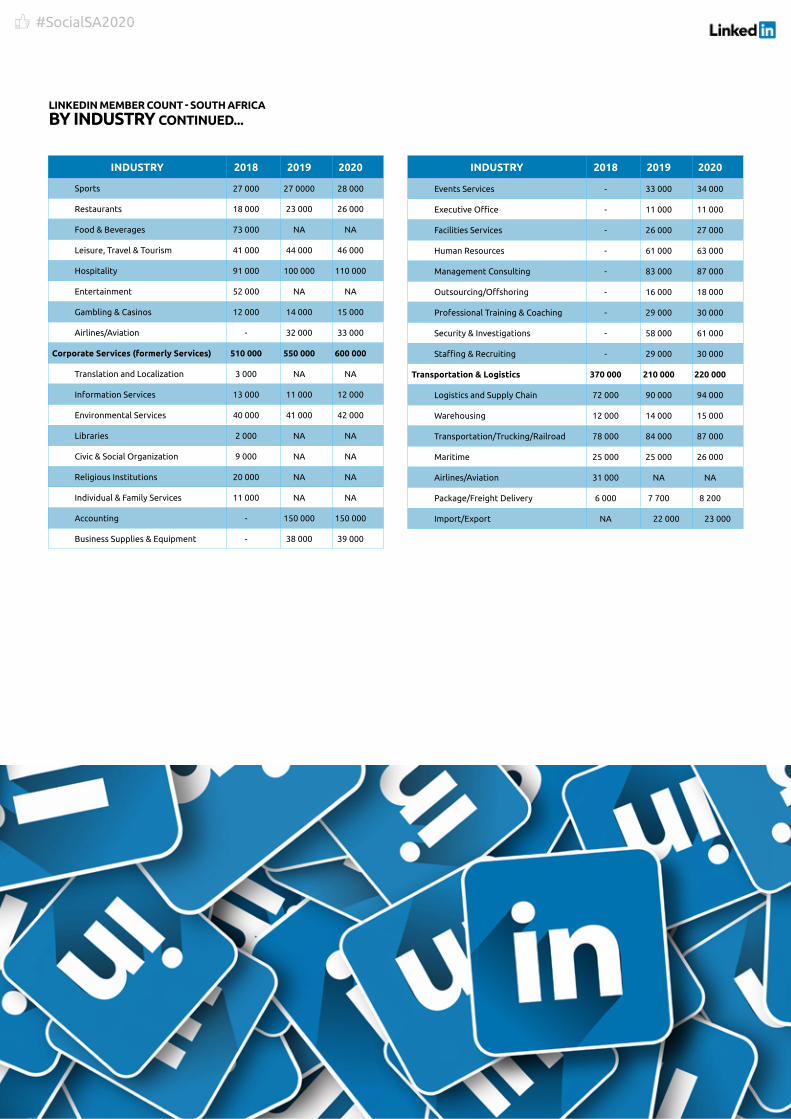
INDUSTRY 2018 2019 2020
Sports 27 000 27 0000 28 000
Restaurants 18 000 23 000 26 000
Food & Beverages 73 000 NA NA
Leisure, Travel & Tourism 41 000 44 000 46 000
Hospitality 91 000 100 000 110 000
Entertainment 52 000 NA NA
Gambling & Casinos 12 000 14 000 15 000
Airlines/Aviation - 32 000 33 000
Corporate Services (formerly Services) 510 000 550 000 600 000
Translation and Localization 3 000 NA NA
Information Services 13 000 11 000 12 000
Environmental Services 40 000 41 000 42 000
Libraries 2 000 NA NA
Civic & Social Organization 9 000 NA NA
Religious Institutions 20 000 NA NA
Individual & Family Services 11 000 NA NA
Accounting - 150 000 150 000
Business Supplies & Equipment - 38 000 39 000
INDUSTRY 2018 2019 2020
Events Services - 33 000 34 000
Executive Office - 11 000 11 000
Facilities Services - 26 000 27 000
Human Resources - 61 000 63 000
Management Consulting - 83 000 87 000
Outsourcing/Offshoring - 16 000 18 000
Professional Training & Coaching - 29 000 30 000
Security & Investigations - 58 000 61 000
Staffing & Recruiting - 29 000 30 000
Transportation & Logistics 370 000 210 000 220 000
Logistics and Supply Chain 72 000 90 000 94 000
Warehousing 12 000 14 000 15 000
Transportation/Trucking/Railroad 78 000 84 000 87 000
Maritime 25 000 25 000 26 000
Airlines/Aviation 31 000 NA NA
Package/Freight Delivery 6 000 7 700 8 200
Import/Export NA 22 000 23 000

#SocialSA2020
33
Twitter remains a vital platform for news dissemination, public
discourse and personal expression in South Africa.
Ask Afrika’s TGI data for social media, provided later in this report shows that 19% of those aged 15 and above, living in cities and towns, were using Twitter actively (i.e. in the last 4 weeks). This is the same proportion as for Instagram. This suggests 4.7-million active users, and close to 9-million total users.
For this year’s report we were able to draw on the data gathered by Brandwatch, through the Crimson Hexagon social data tool, to understand the trends underlying Twitter use and sentiment in South Africa. One of the most surprising
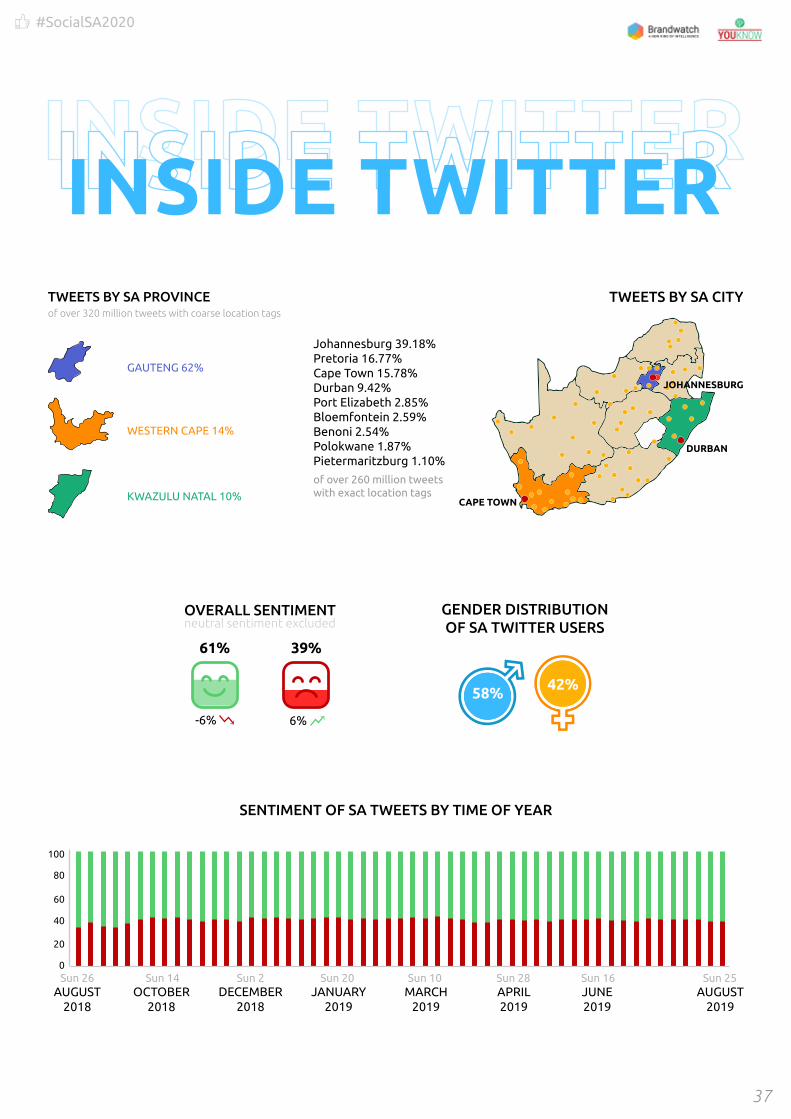
insights from the data was that, while Johannesburg is predictably the source of most Twitter activity (39% of activity), Cape Town does not come in second, as one would expect. Instead, Pretoria is the country’s second Twitter city, with 16.7% of tweets emanating from the capital city, against 15.7% coming from the Mother City. Durban is a distant fourth at just over 9%.
Contrary to the view that Twitter is primarily a vehicle for negative sentiment, the data shows that, of the tweets reflecting sentiment, 61% comprise positive sentiments, against 39% negative. However, it is clear that even 39% remains a high proportion and generates significant shade over the Twitter landscape in general.
Some blame the toxicity of Twitter for this negative sentiment, and some would even point to toxic masculinity: males generate an overwhelming proportion of tweets, at 58% compared to 42% for women.
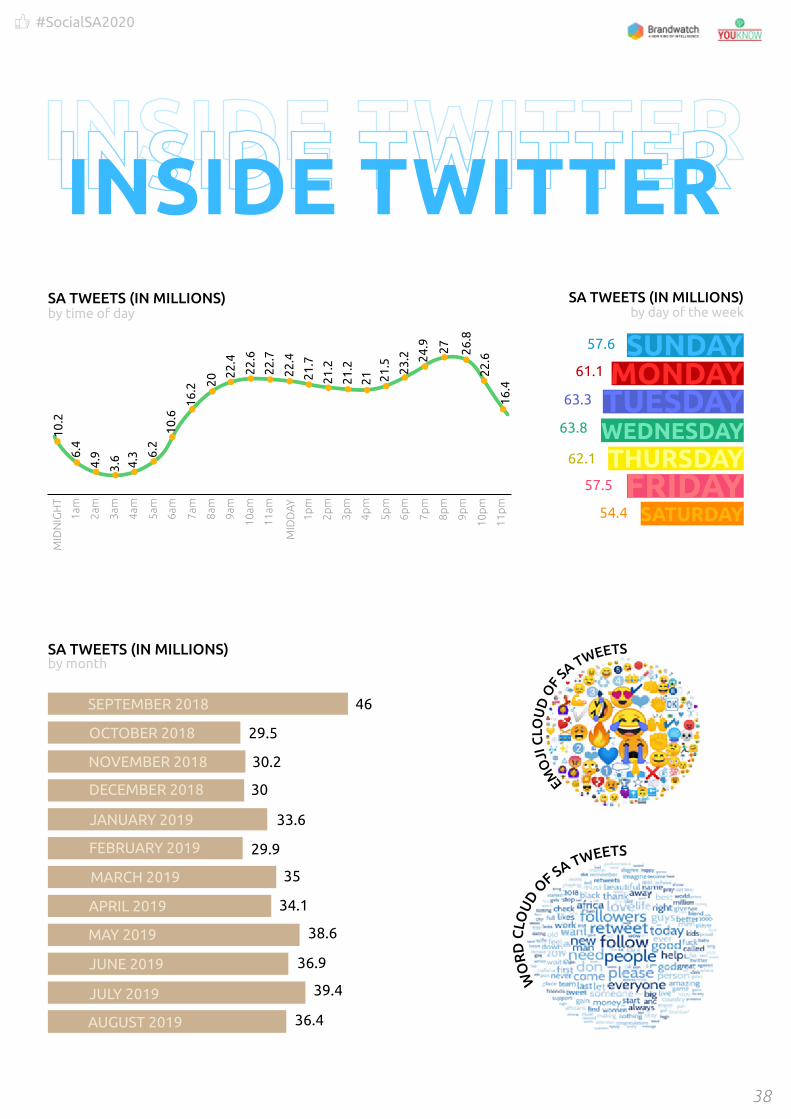
The most fascinating insight into the data produced by Crimson Hexagon must surely be the Emoji Cloud. It shows an almost equal preponderance of laughter as tears: the two emojis that leap out from the rest. The larger emojis surrounding these, however, tend to reflect love and happiness. This is the true bottom line of Twitter sentiment in South Africa: many tears, but overcome by love and laughter. [SocialSA2020]
A Vital VoiceArthur Goldstuck, MD, World Wide Worx
#SocialSA2020
34
T here are two opposing, yet ironically complementary, forces
at play in the social data space at the moment.On the one side, you have the social analytics and social intelligence companies such as Brandwatch, Buzzsumo, Netbase and others wanting to provide their clients with richer and more valuable insights based on analysing social data from social networks, such as Facebook, Instagram and Twitter. On the other side, you have the data departments of these
exact same social networks. Leading up to, and after, the Cambridge Analytica scandal, social networks have been under a lot of pressure to reduce the amount of individual user data which they make public, or which they make accessible to 3rd parties (such as app developers and the social intelligence companies.) However, to allow their partners to enrich the user and marketer’s experiences there does need to be the ability to share some of that data.
Kelvin Jonck - MD, YOUKNOW
BATTLETHE
IN UNDERSTANDING CONSUMER AUDIENCES

#SocialSA2020
35
In the world of social media intelligence providers, it becomes increasingly valuable to allow their customers (marketers and researchers, for example) to be able to understand what consumers want through what they say publicly on social platforms: their needs, desires, preferences and grievances. It helps to be able to segment those audiences into tangible groups which can more easily be addressed. It helps to know that the Gen Z entrepreneur, from Soweto, needs better network signal to build their business. Or that new mothers, under the age of 28, in certain urban regions,
prefer same-day delivery over discounts when doing their online shopping.
With this in mind, not all social networks are created equal, or have the same views on how their user’s data should be leveraged. Facebook (and hence Instagram and WhatsApp) cares more about leveraging that data to sell advertising on their platforms. They don’t make much money off of the sale of data to 3rd parties, such as the social listening companies. Twitter, on the other hand, does have a robust data strategy. Being, for the most part, a public network, Twitter still provides
access to public conversations on its network for the purposes of market research, brand reputation analysis and other forms of insights. They do, however, restrict where that data can be used - such as their restrictions on working with governments from countries deemed to be “not free”.
These changing attitudes to how social data can and should be used has led to many organisations looking elsewhere for complementary, collective data; the merger of concepts such as solicited and unsolicited data.
These changing attitudes to how social data can
and should be used has led to many organisations
looking elsewhere for complementary, collective
data; the merger of concepts such as solicited and
unsolicited data.

#SocialSA2020
36
There is an increasing awareness that to have a better view of the consumer, the need to combine social data, behavioural analytics, market research data and other sources in your evaluations and planning is essential. Brandwatch, the social listening giant, for example, realised this and acquired a market research, polling technology, called Qriously. Qriously works by purchasing programmatic display ads and presents users with short, interactive polls - the results of which are instantaneously analysed and presented back to the researcher. This market analysis can then be overlayed with social data to understand what people think when you ask them a question (solicited), as well as when you don’t (unsolicited).
There is a distinct difference between what people will advertise about themselves on public social networks, as opposed to what they’ll admit to via anonymous survey responses. For example, via surveys, respondents may disclose their household incomes, their credit ratings and even marital status (single, married, divorced).On social, some may be less willing to share those insights, but will gladly tell you their view on the latest Marvel movie before you need to ask.
At YOUKNOW, we’ve seen an increased requirement from our clients to look at solicited market research at speed. We recently partnered with GlobalWebIndex to provide their unique approach to understanding digital audiences to South Africa.
At the end of the day, insightful human analysis is still required to find the nuggets of gold in the data. But it’s become increasingly clear that one source of truth is not going to cut it. The winners look at multiple views of their consumers and are able to combine that with the knowledge of their industry to take their organization to the next level.
Kelvin’s final thought to the industry: The data will get you 50% there. Invest in smart people to take you the rest of the way. [SocialSA2020]
The data will get you 50% there. Invest in
smart people to take you the rest of the way.
#SocialSA2020
37
42%58%
GENDER DISTRIBUTIONOF SA TWITTER USERS
OVERALL SENTIMENTneutral sentiment excluded
61%
-6%
39%
6%
SENTIMENT OF SA TWEETS BY TIME OF YEAR
100
0
20
AUGUST2018
OCTOBER2018
DECEMBER2018
JANUARY2019
MARCH2019
APRIL2019
JUNE2019
AUGUST2019
40
60
80
Sun 26 Sun 14 Sun 2 Sun 20 Sun 10 Sun 28 Sun 16 Sun 25
TWEETS BY SA PROVINCEof over 320 million tweets with coarse location tags
KWAZULU NATAL 10%
GAUTENG 62%
WESTERN CAPE 14%
TWEETS BY SA CITY
of over 260 million tweets with exact location tags
Johannesburg 39.18%Pretoria 16.77%Cape Town 15.78%Durban 9.42%Port Elizabeth 2.85%Bloemfontein 2.59%Benoni 2.54%Polokwane 1.87%Pietermaritzburg 1.10%
DURBAN
JOHANNESBURG
CAPE TOWN
#SocialSA2020
38
SA TWEETS (IN MILLIONS)by day of the week
57.6
61.1
63.3
63.8
62.1
57.5
54.4
SA TWEETS (IN MILLIONS)by time of day
MID
NIG
HT
1am
2am
3am
4am
5am
6am
7am
8am
9am
10am
11am
1pm
2pm
3pm
4pm
5pm
6pm
7pm
8pm
9pm
10p
m
11p
m
MID
DAY
10.2
6.4
4.9
3.6 4.3 6.
2
10.6
16.2 20
22.4
22.6
22.7
22.4
21.7
21.2
21.2
21.5 23
.2 24.9 27 26
.8
22.6
16.421
SA TWEETS (IN MILLIONS)by month
SEPTEMBER 2018
OCTOBER 2018
NOVEMBER 2018
DECEMBER 2018
JANUARY 2019
FEBRUARY 2019
MARCH 2019
APRIL 2019
MAY 2019
JUNE 2019
JULY 2019
AUGUST 2019
46
29.5
30.2
30
33.6
29.9
35
34.1
38.6
36.9
39.4
36.4
WO
RD
CLO
UD O
F SA TWEETS
EMO
JI C
LOU
D O
F SA TWEETS

#SocialSA2020
39
eenagers lip-syncing to well-worn radio hits. Students pretending to reveal their darkest secrets. Romances blossoming and failing. Parent-shaming flourishing. Pranksters pranking random innocents.
That seems, at first glance, to be the world of TikTok. It’s
a video creation and sharing social network for Android and iOS smartphones that provides music tracks and special effects to spice up the material users put up. Videos can last anything from 3 to 60 seconds, which means they can be quick to create, quick to consume, and quick to forget.
TikTokTakes SA By Storm
It was the big social media sensation of 2019, and is continuing its momentum in the youth market in 2020. ARTHUR GOLDSTUCK unpacks the TikTok phenomenon.
#SocialSA2020
40
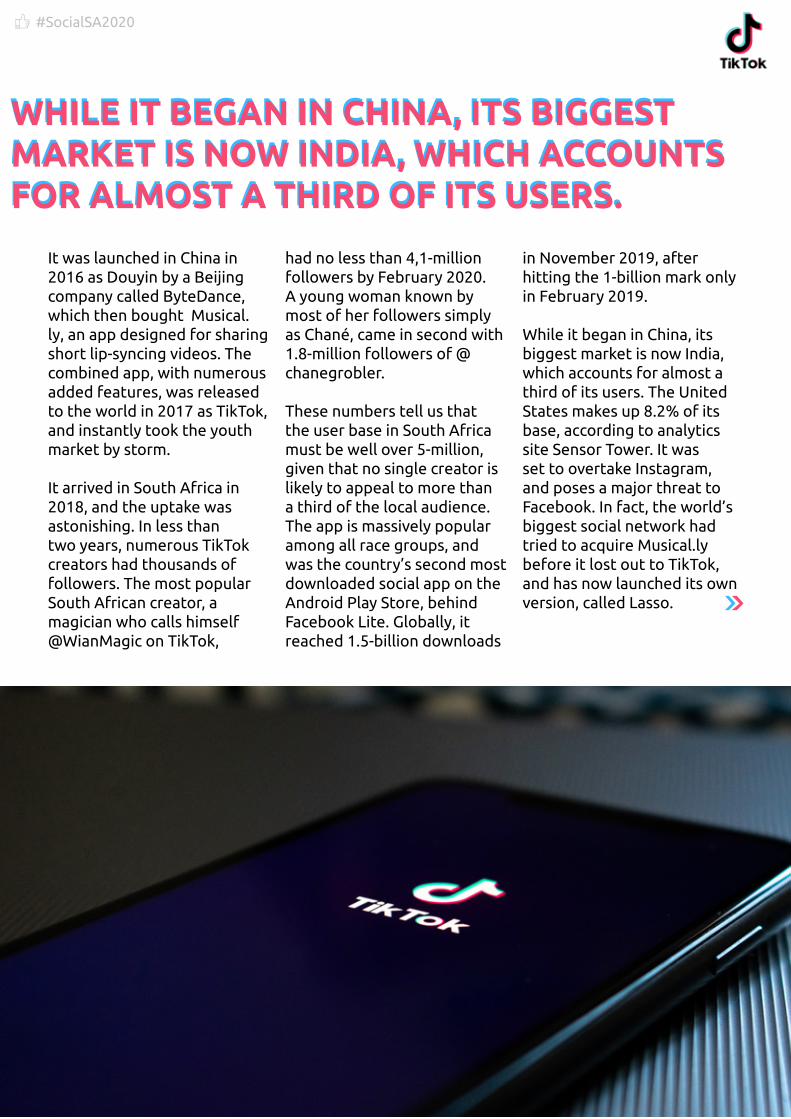
It was launched in China in 2016 as Douyin by a Beijing company called ByteDance, which then bought Musical.ly, an app designed for sharing short lip-syncing videos. The combined app, with numerous added features, was released to the world in 2017 as TikTok, and instantly took the youth market by storm.
It arrived in South Africa in 2018, and the uptake was astonishing. In less than two years, numerous TikTok creators had thousands of followers. The most popular South African creator, a magician who calls himself @WianMagic on TikTok,
had no less than 4,1-million followers by February 2020. A young woman known by most of her followers simply as Chané, came in second with 1.8-million followers of @chanegrobler.
These numbers tell us that the user base in South Africa must be well over 5-million, given that no single creator is likely to appeal to more than a third of the local audience. The app is massively popular among all race groups, and was the country’s second most downloaded social app on the Android Play Store, behind Facebook Lite. Globally, it reached 1.5-billion downloads
in November 2019, after hitting the 1-billion mark only in February 2019.
While it began in China, its biggest market is now India, which accounts for almost a third of its users. The United States makes up 8.2% of its base, according to analytics site Sensor Tower. It was set to overtake Instagram, and poses a major threat to Facebook. In fact, the world’s biggest social network had tried to acquire Musical.ly before it lost out to TikTok, and has now launched its own version, called Lasso.
WHILE IT BEGAN IN CHINA, ITS BIGGEST MARKET IS NOW INDIA, WHICH ACCOUNTS FOR ALMOST A THIRD OF ITS USERS.
WHILE IT BEGAN IN CHINA, ITS BIGGEST MARKET IS NOW INDIA, WHICH ACCOUNTS FOR ALMOST A THIRD OF ITS USERS.
#SocialSA2020
41
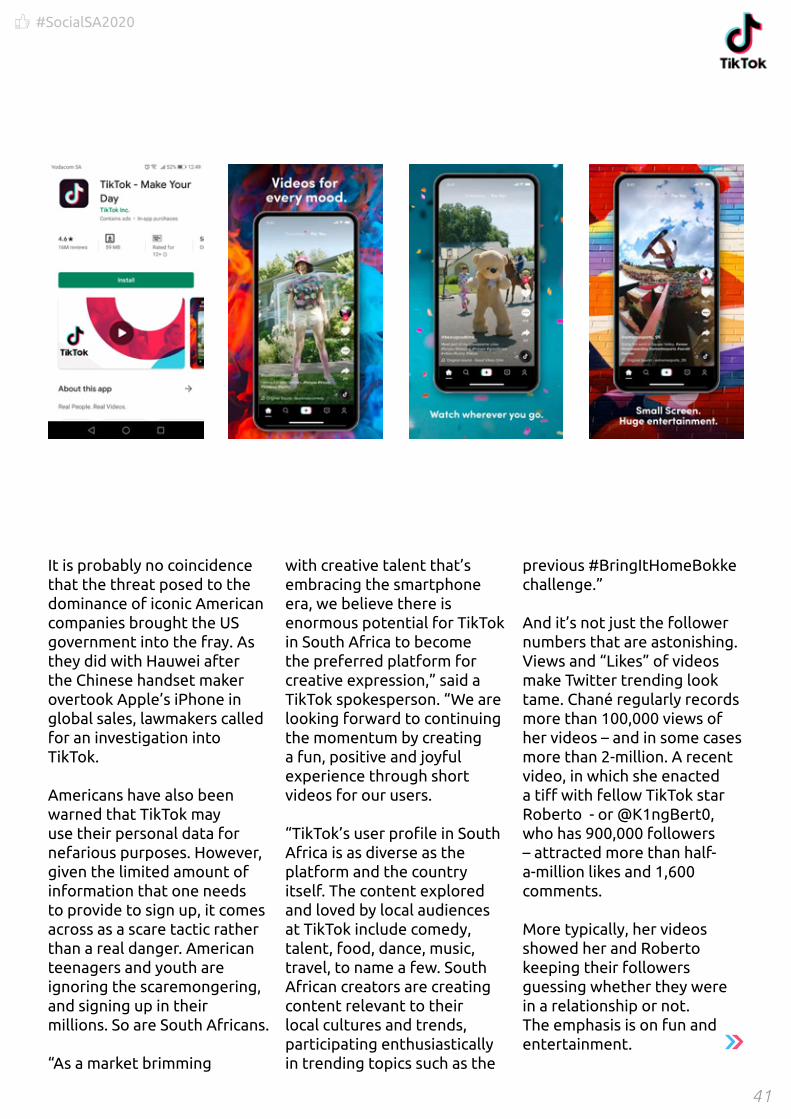
It is probably no coincidence that the threat posed to the dominance of iconic American companies brought the US government into the fray. As they did with Hauwei after the Chinese handset maker overtook Apple’s iPhone in global sales, lawmakers called for an investigation into TikTok.
Americans have also been warned that TikTok may use their personal data for nefarious purposes. However, given the limited amount of information that one needs to provide to sign up, it comes across as a scare tactic rather than a real danger. American teenagers and youth are ignoring the scaremongering, and signing up in their millions. So are South Africans.
“As a market brimming
with creative talent that’s embracing the smartphone era, we believe there is enormous potential for TikTok in South Africa to become the preferred platform for creative expression,” said a TikTok spokesperson. “We are looking forward to continuing the momentum by creating a fun, positive and joyful experience through short videos for our users.
“TikTok’s user profile in South Africa is as diverse as the platform and the country itself. The content explored and loved by local audiences at TikTok include comedy, talent, food, dance, music, travel, to name a few. South African creators are creating content relevant to their local cultures and trends, participating enthusiastically in trending topics such as the
previous #BringItHomeBokke challenge.”
And it’s not just the follower numbers that are astonishing. Views and “Likes” of videos make Twitter trending look tame. Chané regularly records more than 100,000 views of her videos – and in some cases more than 2-million. A recent video, in which she enacted a tiff with fellow TikTok star Roberto - or @K1ngBert0, who has 900,000 followers – attracted more than half-a-million likes and 1,600comments.
More typically, her videos showed her and Roberto keeping their followers guessing whether they were in a relationship or not. The emphasis is on fun and entertainment.
#SocialSA2020
42
“I make videos to make other people inspired,” Chané told us in a (short) interview. “I try and inspire them every day, try to make them feel better about themselves. People give me feedback about how I make them feel better about themselves, so that’s what I try to achieve.”
In February 2020, Chané created a video to spread awareness of the dangers of a TikTok challenge dubbed “#SkullBreakerChallenge, which has caused injury and death. Her public service video drew more than 1,1-million views and more than 6,000 comments.
Of course, TikTok can be used for any kind of content. Psychological tricks and business advice are common. Comedy sketches are hugely popular. Actors like Will Smith have chosen it as their
preferred social sharing channel.
“TikTok enables everyone to be a creator through easy-to-use tools, including special effects, filters, music, and more, which allows users to view and capture a wide variety of interesting authentic moments,” said the spokesperson. “This results in a diverse array of creative content. Along with TikTok’s interest-based recommendation system, this helps creators to be discovered more easily among a new audience.
“Short video content consumption has gained increasing popularity and we believe TikTok offers opportunities for brands to reach creators to develop engaging, interactive content together, tailored for a new audience.”
For my own TikTok feed (@arr2gee), I chose to focus on short interviews with interesting people, ranging from entrepreneurs and executives to journalists and activitsts to TikTok stars themselves. This last category told me just how crazy TikTok can get. My first interview, with @Witny8, who has over 600,000 followers, had more than 78,000 views and 3500 likes. The interview with Chané has passed 64,000 views and 5,700 likes.
I’ve never seen such traction on Twitter, Facebook, LinkedIn or Instagram, no matter how famous, infamous or unknown the subjects of the content. TikTok has its own rules, and the first one is that all the rules of social media have changed. [SocialSA2020]
TIKTOK’S USER PROFILE IN SOUTH AFRICA IS AS DIVERSE AS THE PLATFORM AND THE COUNTRY ITSELF. THE CONTENT EXPLORED AND LOVED BY LOCAL AUDIENCES AT TIKTOK INCLUDE COMEDY, TALENT, FOOD, DANCE, MUSIC, TRAVEL, TO NAME A FEW.
TIKTOK’S USER PROFILE IN SOUTH AFRICA IS AS DIVERSE AS THE PLATFORM AND THE COUNTRY ITSELF. THE CONTENT EXPLORED AND LOVED BY LOCAL AUDIENCES AT TIKTOK INCLUDE COMEDY, TALENT, FOOD, DANCE, MUSIC, TRAVEL, TO NAME A FEW.

#SocialSA2020
43
C onventional approaches to interpreting free text through the use of standard interpretation methods and
computational language interpretation have utilised the fields of cognitive computing, computer vision, neural networks as well as deep learning to extract information.
The result of this work has been topic extraction and sentiment analysis which provide the face-value meaning of what is contained inside of the text and is very two dimensional in the context provided. This approach is heavily steeped on looking at the content language words such as the nouns, verbs and adjectives, words that we consciously select, in our communication and make up about 40% of the words employed, resulting in the poor results seen to date.
The analysis that has been used in this report
is based on machine learning, linguistics, psychology as well as artificial intelligence and attempts to understand functional word usage. This approach looks at the utilisation of pronouns, prepositions and auxiliary verbs and extracts meaning from the placement and usage of these words that are typically unconsciously selected. This new form of free text analytics gives a different perspective on what is being said as well as psychological insight into the person communicating, including their personality profile, mindset and interpersonal dynamics.
Understanding human relationships and communication is not rocket science, it is far, far more complicated and this new approach simplifies the messy problem of trying to interpret the true context of what is being said by humans. [SocialSA2020]
THE EVOLUTION THE EVOLUTION OF NATURAL OF NATURAL LANGUAGE LANGUAGE
INTERPRETATIONINTERPRETATIONRobin Meisel, Co-Founder, Psychographica

#SocialSA2020
44
MTN@MTNza
Nedbank Ltd@Nedbank
Pick n Pay@PicknPay
Mr Price@MRPfashion
First National Bank@FNBSA
Mediclinic @mediclinic
DStv@DStv
Mondi@mondigroup
Discovery@Discovery_SA
ABSA Bank Ltd@Absa
Castle Lager@castlelagersa
Black Label@blacklabelsa
Capitec Bank@CapitecBankSA
Woolworths@WOOLWORTHS_SA
Wesbank@wesbank
Vodacom@Vodacom
Sasol@sasolsa
Standard Bank@StandardBankZA
Telkom@TelkomZA
Sanlam@sanlam
Sappi@sappisoutherna
METHODOLOGY
The Big 5 Model for personality traits first emerged in the 1960s for understanding peoples personality and today, it is a robust, empirical, data-driven model. Many modern psychologists utilise the Big 5 Model as it can apply universally and it provides a measurable means to understanding personality. The point of its use, in this case, is to measure the degree to which particular personality trait is expressed by a brand in social media. In other words, brands exhibit each of the five traits (conscientiousness, agreeableness, openness, neuroticism, and extraversion), but at varying levels and this model helps you, and others,
understand what makes the brand tick.
TOP BRAND PSYCHOGRAPHIC DATA
Psychographica
#SocialSA2020
45
99.00
98.84
91.42
86.50
99.00 75.45 93.19
96.56
97.45
99.00 99.00
77.8195.31
93.39
91.87
85.86
96.19
97.02
94.16
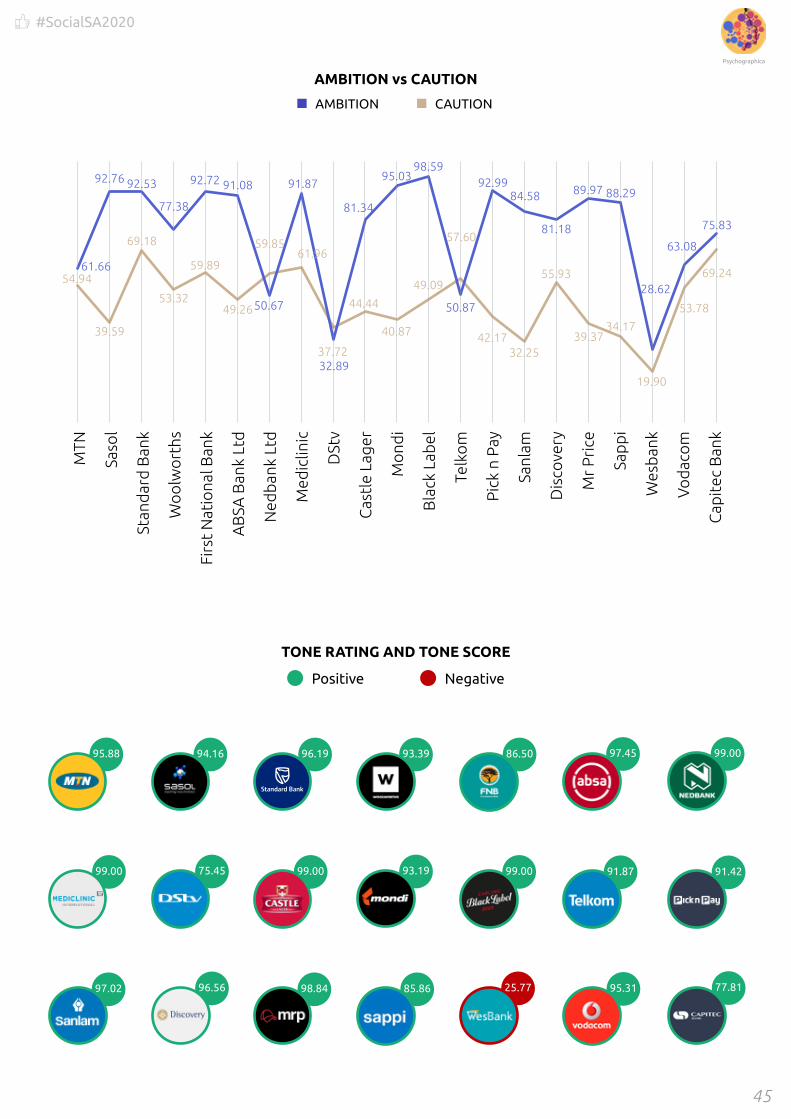
TONE RATING AND TONE SCORE
NegativePositive
95.88
25.77
AMBITION vs CAUTIONM
TN
Saso
l
Stan
dar
d B
ank
Wo
olw
ort
hs
Firs
t N
atio
nal B
ank
AB
SA B
ank
Ltd
Ned
ban
k Lt
d
Med
iclin
ic
DSt
v
Cas
tle
Lage
r
Mo
ndi
Bla
ck L
abel
Telk
om
Pic
k n
Pay
Sanl
am
Dis
cove
ry
Mr
Pri
ce
Sap
pi
Wes
ban
k
Vo
dac
om
Cap
itec
Ban
k
61.6654.94
92.76
39.59
92.53
69.18
77.38
53.32
92.72
59.89
91.08
49.2650.67
59.8561.96
91.87
37.7232.89
81.34
44.44
95.03
40.87
98.59
49.09
50.87
57.60
92.99
42.17
84.58
32.25
81.18
55.93
89.97
39.37
88.29
34.17
28.62
19.90
63.08
53.78
75.83
69.24
AMBITION CAUTION
Psychographica

#SocialSA2020
46
AUTHORITY and FRIENDLINESSAUTHORITY FRIENDLINESS
EMPATHY and EMOTIONAL AWARENESS
EMPATHY EMOTIONAL AWARENESS
0
100
50
0
30
15
27.5
8
18.6
3
14.8
7
13.0
1
12.9
6
12.3
9
12.3
0
10.9
3
10.8
7
9.66 9.58
9.50
7.64
7.19
7.17
6.69
6.49
5.40
4.94
3.97 2.
36
MTN
Saso
l
Stan
dar
d B
ank
Wo
olw
ort
hs
Firs
t N
atio
nal B
ank
AB
SA B
ank
Ltd
Ned
ban
k Lt
d
Med
iclin
ic
DSt
v
Cas
tle
Lage
r
Mo
ndi
Bla
ck L
abel
Telk
om
Pic
k n
Pay
Sanl
am
Dis
cove
ry
Mr
Pri
ce
Sap
pi
Wes
ban
k
Vo
dac
om
Cap
itec
Ban
k
49.7
0
47.4
2
54.9
6
54.1
6
37.2
9
38.5
5
61.6
1
45.4
9
50.5
1
66.0
8
46.0
3
8.46
64.5
0
20.8
2
55.8
0
59.9
1
60.8
5
60.0
1
1.00
58.8
1
46.5
1
MTN
Saso
l
Stan
dar
d B
ank
Wo
olw
ort
hs
Firs
t N
atio
nal B
ank
AB
SA B
ank
Ltd
Ned
ban
k Lt
d
Med
iclin
ic
DSt
v
Cas
tle
Lage
r
Mo
ndi
Bla
ck L
abel
Telk
om
Pic
k n
Pay
Sanl
am
Dis
cove
ry
Mr
Pri
ce
Sap
pi
Wes
ban
k
Vo
dac
om
Cap
itec
Ban
k
98.9
2
84.2
5
99.0
0
99.0
0
87.2
5
99.0
0
99.0
0
99.0
0
93.6
9
97.7
6
88.5
6
96.2
5
99.0
0
99.0
0
99.0
0
99.0
0
99.0
0
74.1
9
72.1
7
99.0
0
99.0
0
43.5
5 69.8
4 80.0
7
56.9
7
53.2
7
50.2
6
49.5
1
46.4
3
45.4
5
44.9
2
42.1
5
41.0
6
39.6
4
36.3
8
36.0
1
35.0
4
33.2
8
33.2
0
28.6
6
26.5
6
7.59
Psychographica

#SocialSA2020
47
BIG 5 PERSONALITY TRAITSM
TN
Saso
l
Stan
dar
d B
ank
Wo
olw
ort
hs
Firs
t N
atio
nal B
ank
AB
SA B
ank
Ltd
Ned
ban
k Lt
d
Med
iclin
ic
DSt
v
Cas
tle
Lage
r
Mo
ndi
Bla
ck L
abel
Telk
om
Pic
k n
Pay
Sanl
am
Dis
cove
ry
Mr
Pri
ce
Sap
pi
Wes
ban
k
Vo
dac
om
Cap
itec
Ban
k
AGREEABLENESS NEUROTICISMEXTRAVERSIONCONSCIENTIOUSNESSOPENNESS
10
10
5
5
0
0
EMOTIONAL STYLE
MTN
Saso
l
Stan
dar
d B
ank
Wo
olw
ort
hs
Firs
t N
atio
nal B
ank
AB
SA B
ank
Ltd
Ned
ban
k Lt
d
Med
iclin
ic
DSt
v
Cas
tle
Lage
r
Mo
ndi
Bla
ck L
abel
Telk
om
Pic
k n
Pay
Sanl
am
Dis
cove
ry
Mr
Pri
ce
Sap
pi
Wes
ban
k
Vo
dac
om
Cap
itec
Ban
k
HOW WELL ADJUSTED HAPPINESS DEPRESSION
Psychographica

#SocialSA2020
48
SOCIAL STYLE
ABILITY TO NETSPEAK
10
10
5
5
0
0
MTN
Saso
l
Stan
dar
d B
ank
Wo
olw
ort
hs
Firs
t N
atio
nal B
ank
AB
SA B
ank
Ltd
Ned
ban
k Lt
d
Med
iclin
ic
DSt
v
Cas
tle
Lage
r
Mo
ndi
Bla
ck L
abel
Telk
om
Pic
k n
Pay
Sanl
am
Dis
cove
ry
Mr
Pri
ce
Sap
pi
Wes
ban
k
Vo
dac
om
Cap
itec
Ban
k
MTN
Saso
l
Stan
dar
d B
ank
Wo
olw
ort
hs
Firs
t N
atio
nal B
ank
AB
SA B
ank
Ltd
Ned
ban
k Lt
d
Med
iclin
ic
DSt
v
Cas
tle
Lage
r
Mo
ndi
Bla
ck L
abel
Telk
om
Pic
k n
Pay
Sanl
am
Dis
cove
ry
Mr
Pri
ce
Sap
pi
Wes
ban
k
Vo
dac
om
Cap
itec
Ban
k
SOCIAL SKILLS SECURE WARMTH
NETSPEAK FOCUS
Psychographica

#SocialSA2020
49
63.7
4
91.5
1
94.6
9
21.0
3
78.1
9
74.1
7
69.0
2
26.6
9
77.3
7
44.4
5
61.0
3
35.3
4
41.2
3
38.0
9
42.2
4
66.1
6
54.3
2
33.2
3
40.8
9
53.2
0
77.2
8
MTN
Saso
l
Stan
dar
d B
ank
Wo
olw
ort
hs
Firs
t N
atio
nal B
ank
AB
SA B
ank
Ltd
Ned
ban
k Lt
d
Med
iclin
ic
DSt
v
Cas
tle
Lage
r
Mo
ndi
Bla
ck L
abel
Telk
om
Pic
k n
Pay
Sanl
am
Dis
cove
ry
Mr
Pri
ce
Sap
pi
Wes
ban
k
Vo
dac
om
Cap
itec
Ban
k
MOST ACTIVE
MTN
Saso
l
Stan
dar
d B
ank
Wo
olw
ort
hs
Firs
t N
atio
nal B
ank
AB
SA B
ank
Ltd
Ned
ban
k Lt
d
Med
iclin
ic
DSt
v
Cas
tle
Lage
r
Mo
ndi
Bla
ck L
abel
Telk
om
Pic
k n
Pay
Sanl
am
Dis
cove
ry
Mr
Pri
ce
Sap
pi
Wes
ban
k
Vo
dac
om
Cap
itec
Ban
k
MOST ADVENTUROUS
64.5
4
64.6
8
54.3
7
56.0
1
63.9
1
78.7
5
73.0
1
55.8
6
76.0
8
54.4
9
90.7
3
54.7
7
77.5
7
81.5
9
82.7
8
51.9
8
76.7
1
11.8
6
58.9
3
88.6
5
63.2
3
Psychographica
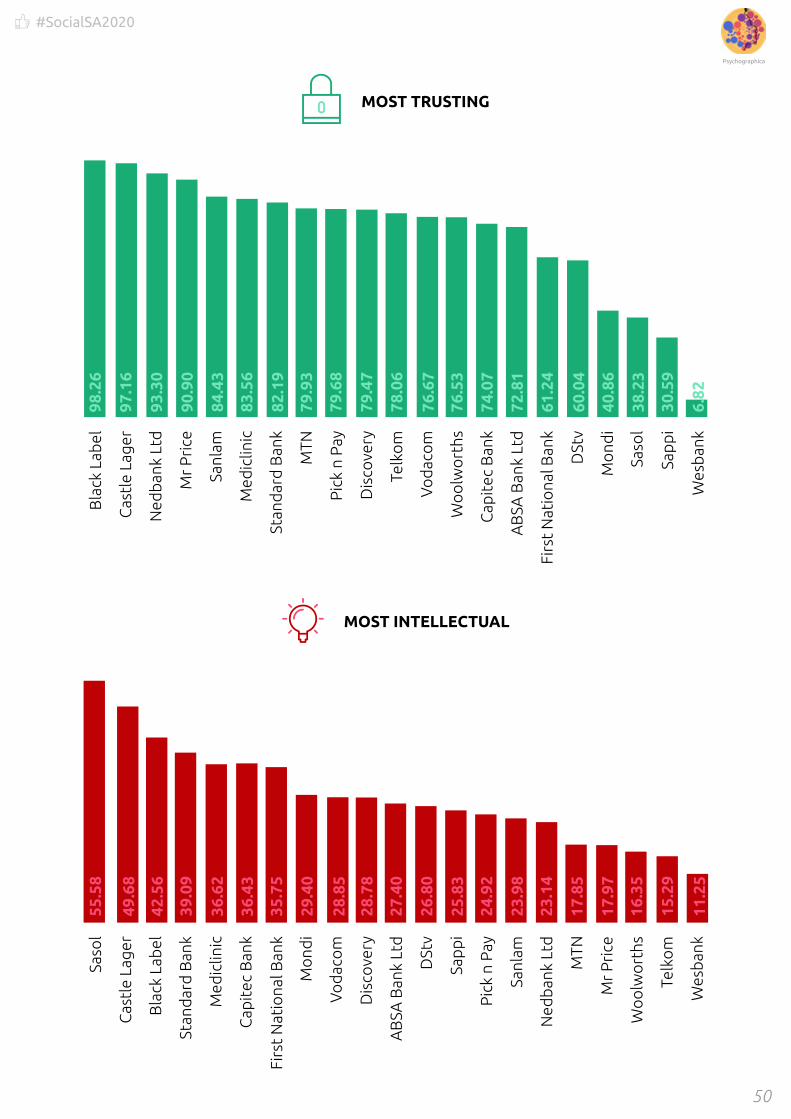
#SocialSA2020
50
MOST TRUSTING
MTN
MTN
Saso
l
Saso
l
Stan
dar
d B
ank
Stan
dar
d B
ank
Wo
olw
ort
hs
Wo
olw
ort
hs
Firs
t N
atio
nal B
ank
Firs
t N
atio
nal B
ank
AB
SA B
ank
Ltd
AB
SA B
ank
Ltd
Ned
ban
k Lt
d
Ned
ban
k Lt
d
Med
iclin
ic
Med
iclin
ic
DSt
v
DSt
v
Cas
tle
Lage
rC
astl
e La
ger
Mo
ndi
Mo
ndi
Bla
ck L
abel
Bla
ck L
abel
Telk
om
Telk
om
Pic
k n
Pay
Pic
k n
Pay
Sanl
am
Sanl
am
Dis
cove
ryD
isco
very
Mr
Pri
ce
Mr
Pri
ce
Sap
pi
Sap
pi
Wes
ban
kW
esb
ank
Vo
dac
om
Vo
dac
om
Cap
itec
Ban
k
Cap
itec
Ban
k
40.8
6
97.1
6
6.82
84.4
3
98.2
6
61.2
4
60.0
4
79.4
7
83.5
6
30.5
9
79.9
3
90.9
0
72.8
1
76.5
3
82.1
9
76.6
7
93.3
0
74.0
7
79.6
8
38.2
3
78.0
6
MOST INTELLECTUAL
25.8
3
55.5
8
36.4
3
35.7
5
17.8
5
28.7
8
17.9
7
42.5
6
27.4
0
28.8
5
36.6
2
16.3
5
23.9
8
15.2
9
23.1
4
49.6
8
39.0
9
24.9
2
26.8
0
11.2
5
29.4
0
Psychographica
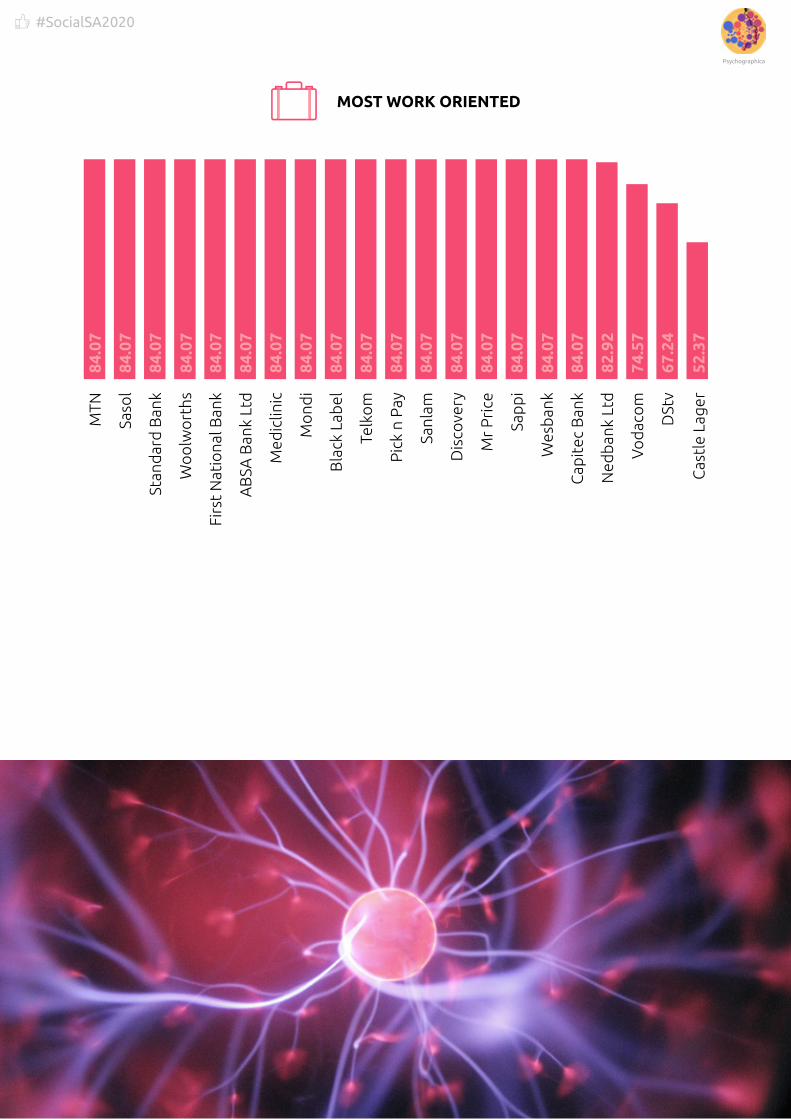
#SocialSA2020
51
MOST WORK ORIENTEDM
TN
Saso
l
Stan
dar
d B
ank
Wo
olw
ort
hs
Firs
t N
atio
nal B
ank
AB
SA B
ank
Ltd
Ned
ban
k Lt
d
Med
iclin
ic
DSt
v
Cas
tle
Lage
r
Mo
ndi
Bla
ck L
abel
Telk
om
Pic
k n
Pay
Sanl
am
Dis
cove
ry
Mr
Pri
ce
Sap
pi
Wes
ban
k
Vo
dac
om
Cap
itec
Ban
k
84.0
7
84.0
7
84.0
7
84.0
7
84.0
7
84.0
7
82.9
2
52.3
7
84.0
7
84.0
7
84.0
7
84.0
7
84.0
7
84.0
7
84.0
7
84.0
7
84.0
7
67.2
4
74.5
7
84.0
7
84.0
7
Psychographica

#SocialSA2020
52
T hanks to the privacy and election scandals presided over by
Facebook and other social networks in recent years, most social platforms have shut down their APIs – Application Programming Interfaces – that allow their user data to be interrogated.
As a result, we must turn to indirect means to gauge platform size and penetration. Thanks to our partnership with Ask Afrika, we have access to the most extensive consumer behaviour data set on the continent, namely the TGI Survey. World Wide Worx collaborates with Ask Afrika in structuring questions around technology, the Internet and
social media, and in return are able to share the most significant insights in our reports.
While the data does not provide an absolute size of each social media or instant messaging platform, it gives an insight into the proportion of South Africans who are highly active users of these platforms. The TGI data represents 26,922,000 South Africans, or 46% of the population. The sample framework is adults, defined as 15+, living in cities and towns.
From the point of view of this report, the most important data in the report
is the proportion of active users of social media and instant messaging platforms. Correlating the penetration proportions with the sample frame, we are able to provide the highly active user base of each platform, as follows:
Whatsapp 10.1-millionFacebook 9.1-millionYouTube 9.1-million
Instagram 4.7-millionTwitter 4.7-million
Linkedin 3.7-millionPinterest 3.4-million
Tinder 3.2-millionWechat 1.2-million
Snapchat 1.2-million
The most remarkable statistics in this data are the rise of Pinterest and Tinder.
UNDERTHESKINof social media in South AfricaArthur Goldstuck, MD, World Wide Worx

#SocialSA2020
53
The former had previously been seen to be in decline in South Africa, falling to below a million users, while the latter was non-existent. At the same time, the WeChat user base has all but vanished, having at one time been estimated at more than 5-million users in South Africa. These shifts show the extent to which social media is an ever-shifting landscape, and social dominance or lag is never set in stone.
Along with these shifts, the most significant numbers are those showing Instagram catching up with Twitter. Twitter remains a powerful medium of personal expression as well as news dissemination, but Instagram has proven itself as more of a tool of social connection than of sharing views or broadcasting news. In particular, the rise of Instagram Video has meant
that it has become a far more versatile tool than Twitter.
An indication of just how powerful the role of Instagram is in this regard can be found in the statistics of social network usage in the last 7 days, an indicator of intensive engagement with the platform. Instagram stands at 8.2% of the sample frame, not far behind the most commonly used social network, Facebook, which comes in at just under 10%. Twitter is in third place among social networks, at 7.6%.
The analysis according to Socio Economic Levels (SEL) reveals that all social networks drop close to zero in penetration of the lowest socio-economic level. Only apps rise above this penetration, but still only at 3%. Age, too, is a significant indicator of penetration, with penetration of all platforms
inversely proportional to age.
We worked with Ask Afrika to develop a framework for understanding who embraces what platforms on the basis of tech readiness, which emerged as the clearest indicator of use versus non-use. The biggest contrast was between those defined as Tech Adopters, and the Tech laggards. So, for example, 56% of adopters used Twitter, versus only 36% of laggards. Instagram had almost the exact same contrast, of 55% versus 35%. For LinkedIn, the comparison was 41% versus 27%.
The primary conclusion from this data is that, after age and socio-economic level has been taken into account, level of tech-readiness is the key factor in uptake of social media and related services. [SocialSA2020]
Twitter remains a powerful medium of personal expression as well as news dissemination, but Instagram has proven itself as more of a tool of social connection than of sharing views or broadcasting news.

#SocialSA2020
54
TGI works with Ask Afrika to structure questions in the TGI survey around technology, social media and electronics, to ensure it keeps up with rapid change. Last year Ask Afrika conducted 30 000 interviews, representing 24.6-million South Africans, aged 15+, living in cities and towns. The following demographics represent this sample frame. The Past-7-days metric represents highly
active users, and is a powerful measure of impact.
CURRENTLY USED INSTANT MESSAGING
FacebookMessenger
Google Talk
iMessage
Skype Chat
Other
Snapchat
GoogleHangouts
Google Allo
Viber
MSNMessenger
Signal
2Go
Telegram
Kik
YahooMessenger
2%
33%
18%6%
3%3%
3%
1%
THE HIGHLY ACTIVE NUMBERS
10.1 millionWHATSAPP
9.1 millionFACEBOOK
4.7 millionINSTAGRAM
4.7 millionTWITTER
3.7 millionLINKEDIN
3.4 millionPINTEREST
3.2 millionTINDER
1.2 millionWECHAT
1.2 millionSNAPCHAT
9.1 millionGOOGLE/YOUTUBE
65+45 - 6435 - 4425 - 3415 - 24
WhatsApp FacebookMessenger
Twitter YahooMessenger
GoogleTalk
iMessage Skype WeChat
7%
24%
35%
39%
41%
3%
12%17%
24%
24%
AGE DEMOGRAPHIC OF USERS

#SocialSA2020
55
SOCIAL NETWORKING IN THE PAST 7 DAYS
SOCIAL NETWORK USAGE
9.97%
9.90%
8.20%
7.62%
7.56%
7.40%
6.99%
6.62%
6.25%
5.82%
8.39%
APPS
2GO
TELEGRAM
GOOGLE NETWORKS
TINDER
OTHER
PLATFORM USE BY GENDER
Twitter LinkedIn Telegram Tinder Pinterest
Apps Facebook 2Go Other InstagramGoogle ChatNetworks
4.2%4.9%5.4%6.4%
6.5%
4.1%
7%
7.5%
10.8%
15.3%
27.8%
FEMALE
4.2%4.4%4.4%6%
6.5%
4.2%
7.6%
8.4%
9.4%
18%
26.9%
MALE
POPULATION GROUP
Apps
2Go
OtherInstagram
Telegram
Tinder
Google ChatNetworks
Indian/AsianColouredWhiteBlack
8% 14% 15% 16%
9% 17% 9% 17%
7% 15% 10% 13%
7% 17% 9% 11%
6% 14% 8% 10%
6% 14% 10% 8%
6% 13% 11% 9%
6% 13% 8% 11%
6% 11% 8% 7%
5% 13% 9% 8%
5% 10% 8% 8%
TECHNOLOGICAL LITERACY
LAGGARD
TECH A
DAPTER
17%
16%
22%
21%13%
22%
17%17%
13%17
%15
%
13%13%
22%
11%
14%12%
12%
12%
16%
11%
11%
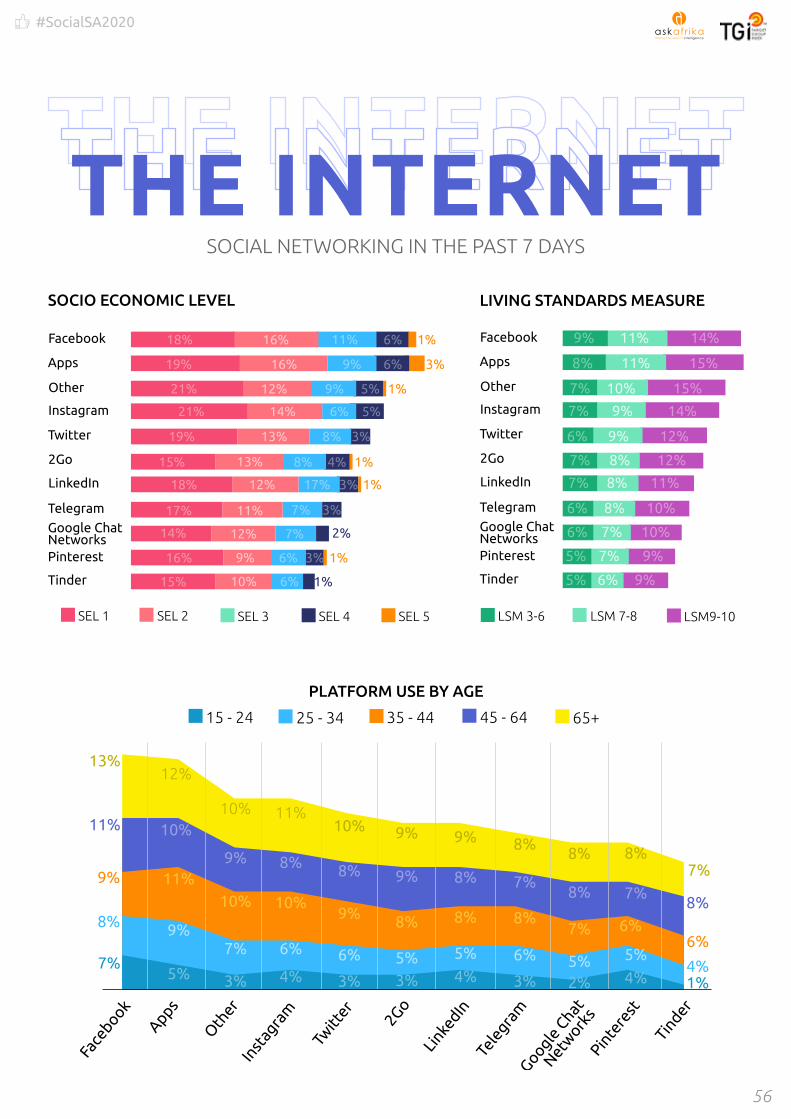
#SocialSA2020
56
SOCIO ECONOMIC LEVEL
Apps
2Go
Other
Telegram
Tinder
Google ChatNetworks
SEL 3 SEL 4 SEL 5SEL 2SEL 1
18% 16% 11% 6% 1%
19% 16% 9% 6% 3%
21% 12% 9% 5% 1%
21% 14% 6% 5%
19% 13% 8% 3%
15% 13% 8% 4% 1%
3%
3%
2%
1%
3% 1%
1%
18% 12% 17%
17% 11% 7%
14% 12% 7%
16% 9% 6%
15% 10% 6%
SOCIAL NETWORKING IN THE PAST 7 DAYS
Face
book
Apps
Oth
erIn
stag
ram
Twitt
er
2Go
Linke
dInTe
legra
mGoogle
Chat
Network
sPin
tere
st
Tinder
13%
11%
9%
8%
7%
10%
8%
9%
6%
3%
11%
8%
10%
6%
4%
10%
9%
10%
7%
3%
12%
10%
11%
9%
5%
8%
7%
8%
6%
3%
9%
8%
8%
5%
4%
9%
9%
8%
5%3%
8%
8%
7%
5%2%
8%
7%
6%
5%
4%
7%
8%
6%
4%1%
65+45 - 6435 - 4425 - 3415 - 24
PLATFORM USE BY AGE
LIVING STANDARDS MEASURE
Apps
2Go
Other
Telegram
Tinder
Google ChatNetworks
LSM9-10LSM 7-8LSM 3-6
9% 11% 14%
8% 11% 15%
7% 10% 15%
7% 9% 14%
6% 9% 12%
7% 8% 12%
7% 8% 11%
6% 8% 10%
6% 7% 10%
5% 7% 9%
5% 6% 9%
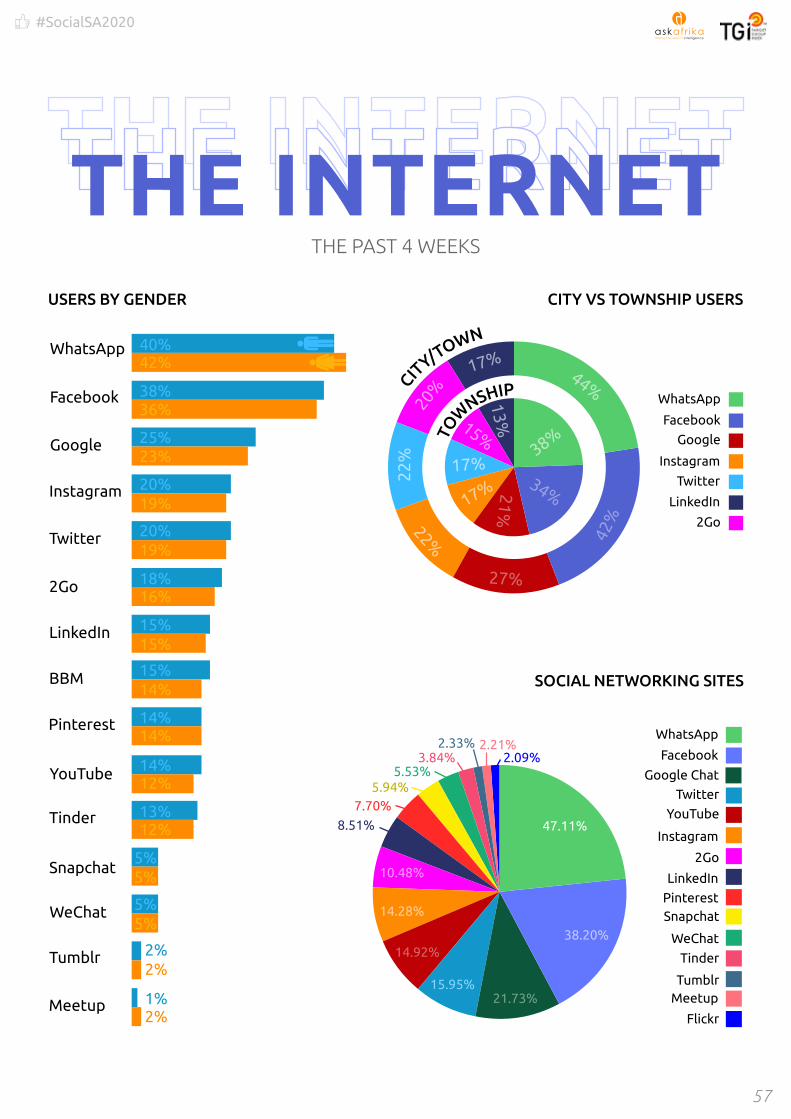
#SocialSA2020
57
THE PAST 4 WEEKS
USERS BY GENDER
2Go
BBM
YouTube
Tinder
Tumblr
Meetup
Snapchat
40%42%
38%36%
25%23%
20%19%
20%19%
18%16%
15%15%
15%14%
14%14%
14%12%
13%12%
5%5%
5%5%
2%2%
1%2%
2Go
CITY/TOWN
TO
WNSHIP
44%
38%
42%
34%
27%
21%
22%
22%
17%
17%
20%15%
17%
13%CITY VS TOWNSHIP USERS
47.11%
38.20%
21.73%15.95%
14.92%
14.28%
10.48%
8.51%
7.70%5.94%
5.53%3.84%
2.33% 2.21%2.09%
SOCIAL NETWORKING SITES
Meetup
2Go
Tinder
Flickr
Google Chat
Tumblr
Snapchat
YouTube
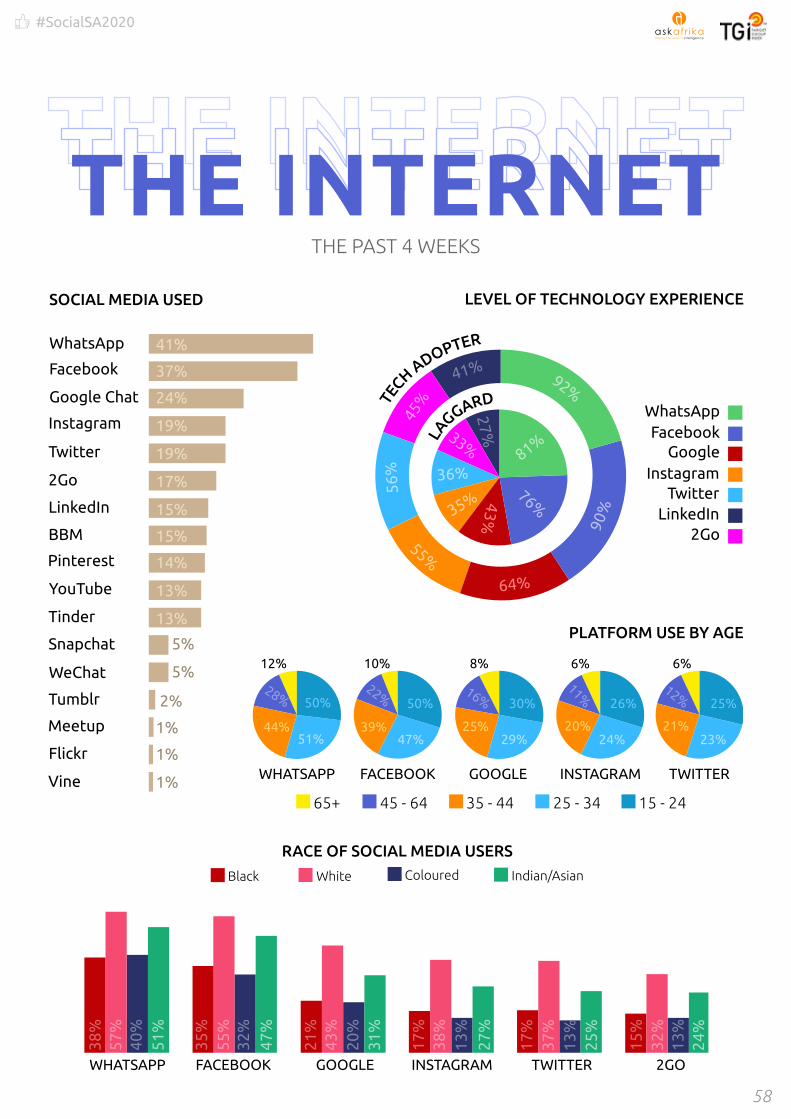
#SocialSA2020
58
THE PAST 4 WEEKS
41%
37%
24%
19%
19%
17%
15%
15%
14%
13%
13%
5%
5%
2%
1%
1%
1%
Google Chat
2Go
BBM
YouTube
Tinder
Tumblr
Meetup
Flickr
Vine
Snapchat
SOCIAL MEDIA USED
FacebookWhatsApp
2Go
GoogleInstagram
TwitterLinkedIn
TECH ADOPTER
LAGGARD
92%
81%
90%
76%
64%
43%
55%
56%
35%
36%
45%
33%
41%
27%LEVEL OF TECHNOLOGY EXPERIENCE
Indian/AsianColouredWhiteBlack
RACE OF SOCIAL MEDIA USERS
WHATSAPP FACEBOOK GOOGLE INSTAGRAM TWITTER 2GO
38%
57%
40%
51%
35%
55%
32%
47%
21%
43%
20%
31%
17%
38%
27%
17%
37%
13%
13%
25%
15%
32%
13%
24%
65+ 45 - 64 35 - 44 25 - 34 15 - 24
WHATSAPP FACEBOOK GOOGLE INSTAGRAM TWITTER
50%
12%
51%44%
28% 50%
10%
47%39%
22%30%
8%
29%25%
16% 26%
6% 6%
24%20%
11%
25%
23%21%
12%
PLATFORM USE BY AGE
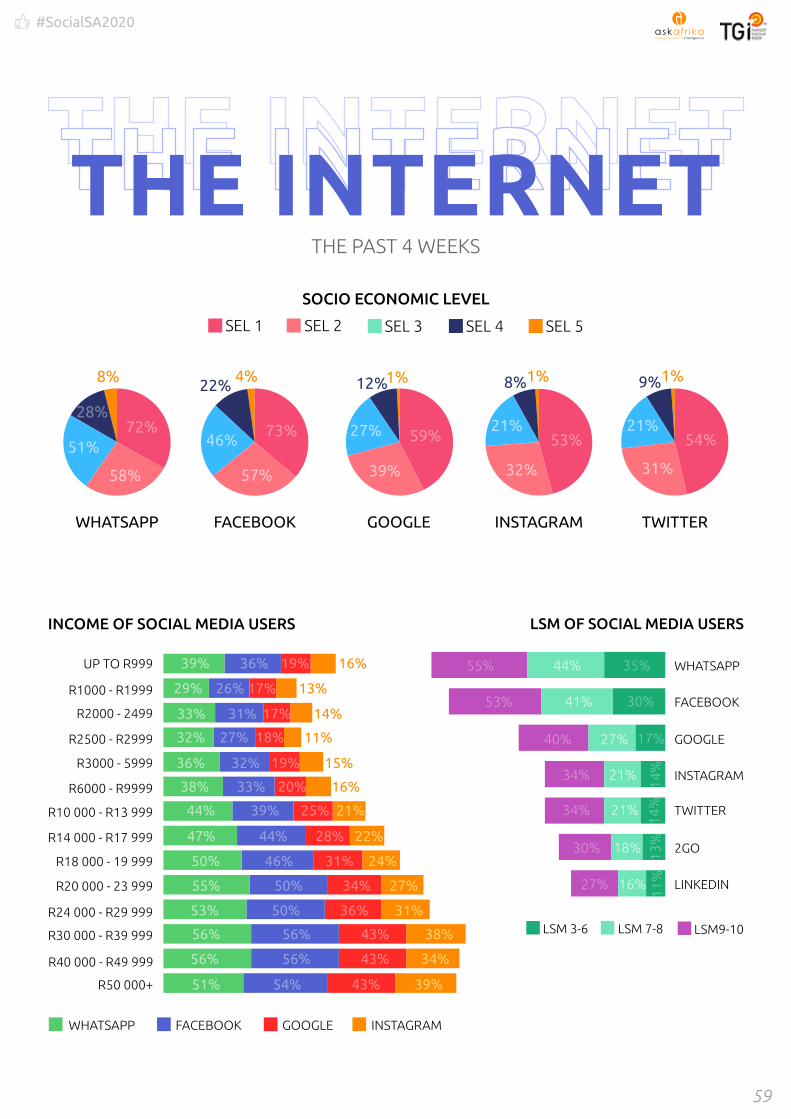
#SocialSA2020
59
THE PAST 4 WEEKS
SOCIO ECONOMIC LEVEL
SEL 3 SEL 4 SEL 5SEL 2SEL 1
WHATSAPP FACEBOOK GOOGLE INSTAGRAM TWITTER
72%28%
8%
58%
51%73%
22%4%
57%
46% 59%
12%1%
39%
27%53%
8%1%
32%
21%54%
9%1%
31%
21%
LSM OF SOCIAL MEDIA USERS
2GO
LSM9-10LSM 7-8LSM 3-6
35%
30%
17%
14%
14%
13%
11%
44%
41%
27%
21%
21%
18%
16%
55%
53%
40%
34%
34%
30%
27%
INCOME OF SOCIAL MEDIA USERS
WHATSAPP FACEBOOK GOOGLE INSTAGRAM
R50 000+ 51% 54% 43% 39%
R40 000 - R49 999 56% 56% 43% 34%
R30 000 - R39 999 56% 56% 43% 38%
R24 000 - R29 999 53% 50% 36% 31%
R20 000 - 23 999 55% 50% 34% 27%
R18 000 - 19 999 50% 46% 31% 24%
R14 000 - R17 999 47% 44% 28% 22%
R10 000 - R13 999 44% 39% 25% 21%
R6000 - R9999 38% 33% 20% 16%
R3000 - 5999 36% 32% 19% 15%
R2500 - R2999 32% 27% 18% 11%
R2000 - 2499 33% 31% 17% 14%
R1000 - R1999 29% 26% 17% 13%
UP TO R999 39% 36% 19% 16%
#SocialSA2020
60
G lobalWebIndex is home of the world’s largest ongoing study on the
digital consumer. Our survey into the world’s internet population spans 46 countries worldwide and represents over 2 billion internet users, which we leverage to create 40,000 data points for marketers to better understand their audiences. We are the only study to provide quarterly global data. Currently, we are interviewing more than
700,000 unique individuals annually.
GlobalWebIndex began its ongoing research back in 2009, in response to what was a clear need in the market for a harmonized, global survey on how internet behaviors were evolving. Starting with an annual study in the first year, it became bi-annual throughout 2010, 2011 and 2012 before being run each quarter from the start of 2013
onwards. At the end of 2020, we will have run 40 separate waves of research. Over time, our country coverage has increased. Beginning with 16 markets in 2009, we were running our harmonized study in 36 countries by the end of 2016. We incorporated 6 new markets in 2017, added 3 more in 2018, and added 1 more in 2019, to bring our total to 46. [SocialSA2020]

#SocialSA2020
61
OVER 60%
OVER 10%
OVER 40%
~30%
~20%
~20%
PLATFORMS USED MORE THAN ONCE A DAY
ACCOUNTS FOLLOWED% who say they “follow” these accounts on social media
BRANDS YOU LIKE
48% | 38%
BRANDS YOU ARECONSIDERING BUYING FROM
38% | 27%
South Africa Global Average
MEMBERS
USERS
92%
67%
87%
84%
83%
80%
76%
73%
66%
64%
60%
56%
51%
40%
46%
35%
37%
35%
33%
33%
91%
60%
83%
78%
86%
85%
61%
54%
58%
59%
45%
43%
40%
28%
38%
28%
25%
24%
27%
27%
TOP MOTIVATIONS FOR USING SOCIAL MEDIA% who say the following are main reasons for using social media
To find funny orentertaining content
38 %
50%
To share photos orvideos with others
33 %
48
%
To stay in touch withwhat my friends are doing
40 %
56%
To stay up to datewith news/current events
40 %
56
%
General networkingwith other people
33 %
48
%
South Africa Global Average

#SocialSA2020
62
DATA PARTNERS
(Psychographica)
Contact:
ORNICO
P O Box 783691, Sandton,
2146, South Africa
Phone: +27-11-884-5041
www.ornico.co.za
WORLD WIDE WORX
PO Box 752, Pinegowrie,
2123, South Africa
Phone: +27-11-782-7003
www.worldwideworx.com
Copyright © 2020 Ornico
and World Wide Worx.
All rights reserved
ACKNOWLEDGEMENTS
PUBLISHER
Oresti PatriciosCEO, Ornico
Arthur GoldstuckMD, World Wide Worx
EDITOR
Mongezi Mtati Marketing Manager, Ornico
RESEARCH
Arthur GoldstuckMD, World Wide Worx
Mbuluma SilumbweSenior Social Media Analyst, Ornico
GRAPHIC DESIGN
Jessica PretoriusGraphic Designer, Ornico