the south african food cost review
TRANSCRIPT

2012
���������������������������������� ������������������
The South African Food Cost Review
© Copyright – National Agricultural Marketing Council (NAMC). In terms of the Copyright Act, Act No. 98 of 1978, no part of this report may be reproduced or transmitted in or by any means, electronic or mechanical, including photocopying, recording or by any information storage and retrieval system, without the written permission of the publisher. The information contained in this report may not be used without acknowledging the publisher.
Published by NAMC, Private Bag X935, Pretoria, 0001. Tel: 012 341 1115
ISBN: 978-0-621-42211-5

The South African
Food Cost Review2012
���������������������������������� ������������������
Published By
The National AgriculturalMarketing Council
The Department of Agriculture, Forestry and Fisheries
and

The South African Food Cost Review 2012 The South African Food Cost Review 2012The South African Food Cost Review 2012
The purpose of this publication is to reflect on food price trends during 2012. It attempts to provide more insight into the complex factors driving commodity and food prices. This is the seventh publication of the South African Food Cost Review, emanating from the recommendations by the Food Pricing Monitoring Committee in 2003 to monitor food prices in South Africa on a regular basis.
The South African Food Cost Review 2012

I
The South African Food Cost Review 2012 The South African Food Cost Review 2012The South African Food Cost Review 2012
EXECUTIVE SUMMARY
TRENDS IN AGRICULTURE, FORESTRY AND FISHERIES TRADE
In 2012, South Africa remained a net exporter of agriculture, forestry and fisheries (AFF) products and the total value generated from exporting these products was equivalent to R62.25 billion in 2012 – registering a slight decline of 4% year on year growth. The aggregated imports of all agricultural, forestry and fishery products amounted to R56.95 billion which is an increase of 5.8% year on year growth. The Euro zone remains the largest destination market for South Africa’s fruit exports, while South East Asia is increasingly becoming an important trading partner on agricultural products. Zimbabwe was the leading destination for South African Agricultural, Forestry and Fisheries (AFF) products, which constituted 8.6% of total AFF exports. Zimbabwe was followed by the Netherlands (8.5%), UK (8.4%), China (6%) and Mozambique (4.9%) respectively in 2012. The main suppliers of AFF imports into South Africa were China, followed by Argentina, the United Kingdom, Thailand and Brazil in 2012, which accounted for 39% of the total AFF imports into South Africa.
TRENDS IN INPUT COSTS
The farming requisite price index increased by 14.5% from 2011 to 2012, with the biggest increase of 15.1% being in the price of intermediate goods and services. The prices of fertilizer, fuel and animal feed all increased by 14.2%, 16.1% and 15.2% respectively from 2011 to 2012. The terms of trade for primary agriculture continued to decline in 2012.
The cost of food manufacturing is not just influenced by the price of raw commodities, but also by non-food inputs. The Producer Price Index (PPI) for selected materials used in the food manufacturing process showed the following trends between 2011 and 2012:
■ Paper, pulp and paperboard products increased by 4.7%, and
■ Plastic products increased by 4.3%.
Non-food inputs that are used at almost all stages of the food value chain are inputs such as fuel, electricity, labour and water. All of these items fall within the category of administered and regulated prices, and showed the following price trends between 2011 and 2012:
■ The regulated minimum wages for primary agriculture increased by 9.5% between 2011 and 2012.
■ 0.05% sulphur diesel increased by 16.1% in Gauteng and by 15.9% at the coast.
■ Electricity prices increased by 23.1%.
INFLATIONARY TRENDS FOR SELECTED FOOD ITEMS
The average Consumer Price Index (CPI) rate for 2012 was 5.7%, that is, 0.7 percentage points higher than that of 2011. On average the price increases were 0.7% higher in 2012 than in 2011. The food and non-alcoholic beverage index continued to increase when compared to 2011. The food and non-alcoholic beverages inflation contributed more to the headline inflation in 2012 compared to its contribution in 2011. The comparison of the CPI for food and non-alcoholic beverages in the different provinces shows that the Northern Cape, Western Cape and Eastern Cape experienced the highest food price increases during 2012.
The price indices of the different food groups show that sugar, sweets and desserts, other food, fruit and fish showed the largest increases in 2012, in comparison to 2011, i.e., the prices increased by 28.23%, 17.48%, and 15.65% respectively. The bread and cereals, vegetables and meat price indices showed an increase of 4.04%, 3.58% and 3.48% respectively. Fruits, oils and fats, milk, eggs and cheese decreased by 2.58%, 2.53% and 1.63% on average between 2011 and 2012. The comparison between urban and rural food prices showed that, for a certain basket of goods, rural consumers paid R1.28 less than urban consumers.
The South African Food Cost Review 2012

II
The South African Food Cost Review 2012 The South African Food Cost Review 2012
TRENDS IN FARM VALUES AND THE FARM-TO-RETAIL PRICE SPREADS FOR SELECTED COMMODITIES
The margin between farm gate prices and the price the consumer pays for selected food items is a topic that is frequently debated. In order to better understand the difference between farm gate and retail prices, farm values of selected products and the farm-to-retail price spreads (FTRPS) were calculated. The farm value share is the value of the farm product’s equivalent in the final food product purchased by the consumers. The FTRPS is the difference between what the consumer pays for the food product at retail level and the value of the farm product used in that product. Price spreads measure the aggregate contributions of food manufacturing, distribution, wholesaling and retailing firms that transform farm commodities into final products.
■ Poultry: The real FTRPS of fresh whole chicken increased by 18.7% on average from 2011 to 2012. During the same period the real farm value share of fresh whole chicken decreased by 9.3% to 56.34%.
■ Beef: The real FTRPS of beef increased by 9.3% between 2011 and 2012, while the real farm value share decreased by 5.9% and was at 44.6% in December 2012.
■ Lamb: The real FTRPS of lamb increased by 4.9% between 2011 and 2012 and the farm value share decreased by 7.9% on average during the same period.
■ Pork: The real FTRPS of pork chops decreased by 2.38% between 2010 and 2011 while the farm value share increased by 6.31% on average between 2011 and 2012.
■ Milk: The real FTRPS of milk decreased from 5% to 4.8% between 2010 and 2011. On the other hand, the farm value share of milk was on average 34.09% in 2011 compared to 34.54% in 2010. Between 2010 and 2011, the farm value share of milk decreased by 1.32%.
■ Maize: Between 2011 and 2012, the average real farm value share of super and special maize meal increased from 50.1% to 68.7% and from 49.0% to 56.2% respectively. The real FTRPS for super maize meal decreased to R1 309 per ton. The real FTRPS of special maize meal decreased from R1 814 per ton to R1 755 per ton (or 18.42%).
■ Wheat: The real farm value share for brown and white bread was 14% and 20% respectively for 2012. The real FTRPS for brown and white bread was R13 002 per ton and R13 731 per ton respectively.
■ Vegetables: From 2011 to 2012 the average real FTRPS and real farm value share of different vegetables showed the following trends:
� The real farm value share of cabbage decreased by 1.1% on average between 2010 and 2011, while the real FTRPS of cabbage increased by 11.12%.
� The real FTRPS of onions increased by 10.37%, while the real farm value share of onions decreased by 12.65%.
� The real FTRPS of tomatoes decreased by 0.17%, while the real farm value share of tomatoes decreased by 0.12%.
� The real FTRPS of potatoes decreased by 7.88%, while the real farm value share of potatoes increased by 5.48%.

III
The South African Food Cost Review 2012 The South African Food Cost Review 2012
SELECTED TOPICS
With the publication of the Food Cost Review, a number of selected topics are discussed. These are (i) South African Social Assistance Programme: can beneficiaries afford food? (ii) Trade facilitation; (iii) Financial position of the agricultural sector; and (iv) The right to water and the allocation of water rights in South Africa.
■ South African Social Assistance Programme: Can Beneficiaries Afford Food?
South Africa is food secure at national level but the same sentiment cannot be said about household food security whether it be for urban or rural communities. Achieving food security is still a serious challenge in South Africa. In attempting to address vulnerability to food insecurity and poverty, the South African government has introduced a social assistance programme which mainly forms part of the measures that aims to combat poverty and food insecurity. However, the question which remains is, whether the social grants are enough to cover all social needs?
Although there are different types of social grants which are adjusted for inflation every year, such grants are not enough to pay for the avarage food basket. The total cost of the food basket has increased from R386.43 to R451.08 between 2010 and 2012 (StatsSA, 2013). Efforts are required to ensure that beneficiaries and households receiving a social grant can afford food. These can partly be achieved if certain budget of the social assistance program is used to empower communities through establishment of household food security and income-generating projects.
■ Trade facilitation
Challenges with trade facilitation in Africa negatively affect intra-continental trade. Africa remains a net importer of food with its dependency on imports increasing. Most African countries face considerable challenges to achieving more open trade due to cost of trading. This challenge can be overcome by trade facilitation. Trade facilitation can provide opportunities for African exporters if hard infrastructure and technical advice are backed by appropriate policy reforms.
■ Financial position of the agricultural sector
Agricultural debt in South Africa increased from R57 billion in 2008 to about R88 billion in 2012, a growth of more than 54% in nominal terms over the five years, which translates into about 10% per annum. The gross value of agriculture is currently about R162 billion, an increase of 43% from R113 billion in 2007/8 and 153% from R64 billion in 2001/2 (or about 14% per annum). The growth has been attributed to the increase in livestock production, which surpassed field crops. The livestock industry has grown steadily, while field crops developed sideways and horticulture grew slowly. This reflects a shift to more animal protein-driven agriculture production. This is a reversal of the 1980s phenomenon of using grazing and marginal lands for crop production.
The gross farm income and the expenditure on intermediate goods and services increased steadily and the net farm income has moved sideways. Following a phase of decline, the net farm income has increased in 2012 to R53 billion. The ratio between the gross farm income and the expenditure may reflect the conversion rate of intermediate goods and services to produce value of agricultural output. The agricultural sector is generating more value from the debt it is exposed to. On the other hand, the last time the gap between total debt and net farm income (repayment potential gap) was closed, was in 2007. The repayment potential gap had widened the most by 2011. In 2012 the gap started closing.
■ The right to water and the allocation of water rights in South Africa
Article 27(1)(b) of the South African Constitution guarantees the right of every South African to have “access to sufficient food and water.” Water in South Africa is a scarce commodity, however, and reliable access thereto is a prerequisite for sustained agricultural production. An estimated eight percent of the country’s potential arable land is under irrigation, accounting for nearly two thirds of the national water requirement. For these reasons, it is important to distinguish between “water rights” as conferred by the allocation of a licence in accordance with the National Water Act (NWA), and the fundamental “right to water” as defined inter alia in South Africa’s Bill of Rights. This article draws that distinction in accordance with legal precedent and provides a brief overview of the nexus between water, food security and the international trade in agricultural production.

IV
The South African Food Cost Review 2012 The South African Food Cost Review 2012
This report was compiled by a team of researchers inside and outside of the National Agricultural Marketing Council (NAMC). The efforts and dedication of the team listed below in alphabetical order are greatly appreciated.
◊ Mr Bonani Nyhodo (NAMC)
◊ Mr Christo Joubert (NAMC)
◊ Ms Corné Dempers (NAMC)
◊ Ms Heidi Phahlane (NAMC)
◊ Mr Lindikaya Myeki (NAMC)
◊ Ms Londiwe Thabethe (NAMC)
◊ Ms Masego Moobi (NAMC)
◊ Dr Moraka Makhura (Land Bank)
◊ Ms Rika Verwey (NAMC)
◊ Mr Sifiso Ntombela (NAMC)
◊ Dr Simphiwe Ngqangweni (NAMC)
◊ Ms Stephanie van der Walt (NAMC)
◊ Mr Sydwell Lekgau (NAMC)
◊ Ms Yolanda Potelwa (NAMC)
Acknowledgements

V
The South African Food Cost Review 2012 The South African Food Cost Review 2012
TABLE OF CONTENTS
EXECUTIVE SUMMARY ............................................................................................................................ I
ACKNOWLEDGEMENTS .......................................................................................................................... IV
TABLE OF CONTENTS .............................................................................................................................. V
LIST OF FIGURES ..................................................................................................................................VIII
LIST OF TABLES ....................................................................................................................................... XI
ACRONYMS ..........................................................................................................................................XIII
1 WHAT HAPPENED TO FOOD PRICES? .........................................................................................1
1.1 Global food price trends .................................................................................................................1
2 SOUTH AFRICA’S AGRICULTURE, FORESTRY AND FISHERIES TRADE REVIEW ..........................2
2.1 South African Agricultural Trade Performance in 2012 .................................................................. 22.2 World agricultural trade .................................................................................................................22.3 South Africa’s fisheries trade ..........................................................................................................42.4 South Africa’s forestry trade ...........................................................................................................6
3 TRENDS IN INPUT COSTS ............................................................................................................9
3.1 Terms of trade for primary agriculture ........................................................................................... 93.2 Farming requisite price index trends ............................................................................................ 103.3 Producer price index trends ..........................................................................................................123.4 Trends in the cost of selected inputs ............................................................................................. 13
3.4.1 Fertilizer prices .............................................................................................................. 133.4.2 Administered and regulated prices ................................................................................ 16
4 INFLATIONARY TRENDS FOR SELECTED FOODSTUFFS.............................................................22
4.1 Food and non-alcoholic beverages ............................................................................................... 224.2 Urban food price trends ...............................................................................................................254.3 Rural food price trends .................................................................................................................324.4 Comparison between rural and urban food prices ....................................................................... 35
5 TRENDS IN PRICES, FARM VALUES AND PRICE SPREADS ........................................................37
5.1 Introduction .................................................................................................................................. 375.2 Price trends in the meat sector ..................................................................................................... 37
5.2.1 Poultry industry ............................................................................................................. 375.2.2 Beef ................................................................................................................................ 395.2.3 Lamb .............................................................................................................................. 415.2.4 Pork ................................................................................................................................ 43
5.3 Dairy sector .................................................................................................................................. 455.3.1 Price trends .................................................................................................................... 45

VI
The South African Food Cost Review 2012 The South African Food Cost Review 2012
5.4 Price trends in the maize sector.................................................................................................... 515.4.1 Production, consumption and stock levels of white maize ............................................ 515.4.2 Production, stock levels and consumption of yellow maize .......................................... 525.4.3 The South African maize balance sheet ......................................................................... 545.4.4 White maize price trends ............................................................................................... 555.4.5 Yellow maize price trends .............................................................................................. 555.4.6 Real farm gate price and the real retail value of special and super maize meal ............565.4.7 Maize-to-maize meal value chain .................................................................................. 58
5.5 Wheat sector ................................................................................................................................ 615.5.1 Production and imports ................................................................................................. 615.5.2 Consumption ................................................................................................................. 615.5.3 Price trends for wheat ................................................................................................... 625.5.4 Real farm gate and retail prices of brown and white bread .......................................... 625.5.5 Real farm value share of brown and white bread .......................................................... 645.5.6 Farm-to-retail price spread (FTRPS) ............................................................................... 655.5.7 Wheat-to-white bread chain.......................................................................................... 645.5.8 Wheat-to-brown bread chain ........................................................................................ 68
5.6 Sunflower seed ............................................................................................................................. 715.6.1 Production and consumption of sunflower seed ........................................................... 715.6.2 Price trends for sunflower seeds ................................................................................... 72
5.7 Soybeans ...................................................................................................................................... 735.7.1 Soybean production ....................................................................................................... 735.7.2 Soybean consumption ................................................................................................... 735.7.3 Soybean trade ................................................................................................................ 745.7.4 Price trends for soybeans .............................................................................................. 75
5.8 Vegetable sector ........................................................................................................................... 75
6 SELECTED TOPICS .....................................................................................................................79
6.1 South African Social Assistance Programme: Can Beneficiaries Afford Food? .............................79
6.2 Trade facilitation .......................................................................................................................... 806.2.1 Is trade facilitation important for Africa? ...................................................................... 816.2.2 The challenges identified by businesses ........................................................................ 826.2.3 Initiatives by South Africa to improve intra-Africa trade ............................................... 826.2.4 South Africa’s Agricultural Market and Product diversification ..................................... 826.2.5 Market and Consumer Preference in Emerging Markets ............................................... 856.2.6 The level of protection of the domestic cereal grain industry ....................................... 876.2.7 Non tariff measures in South Africa’s grain industry. ..................................................... 90
6.3 Financial position of the agricultural sector ................................................................................. 906.3.1 Changes in agricultural debt levels ................................................................................ 916.3.2 Debt distribution by financial institution ....................................................................... 926.3.3 Interest cover ratio and weighted average interest rate ................................................ 936.3.4 Gross and net farm income ........................................................................................... 946.3.5 Debt repayment capacity and debt repayment capacity used ...................................... 95
6.4 The right to water and the allocation of water rights in South Africa ..........................................956.4.1 Socio-economic rights: progressive realisation and the reasonable allocation of
resources ....................................................................................................................... 956.4.2 Distinguishing water rights from the right to water: The Makhanya-case .....................966.4.3 Agriculture and food security ...................................................................................... 1006.4.4 The water-food-trade nexus ........................................................................................ 101
7 REFERENCES ...........................................................................................................................104

VII
The South African Food Cost Review 2012 The South African Food Cost Review 2012
8 ANNEXURES ............................................................................................................................107
Annexure 1: Methodology to calculate the costs and margins in maize-to-maize meal value chain.............107
Annexure 2: Methodology on the calculation of wheat to bread value chain .............................................. 109

VIII
The South African Food Cost Review 2012 The South African Food Cost Review 2012
LIST OF FIGURES
Figure 1: International food price index ............................................................................................................................. 1
Figure 2: International price indices for different food categories ..................................................................................... 1
Figure 3: Terms of trade (1995–2012) ................................................................................................................................ 9
Figure 4: Real gross income, expenditure on intermediate goods and services and net farming income (1990–2012) .. 10
Figure 5: FRPI (1994–2012) .............................................................................................................................................. 10
Figure 6: FRPI of intermediate goods and services (1995–2012) ..................................................................................... 11
Figure 7: PPI for selected industry groups (2000–2012) ................................................................................................... 12
Figure 8: Producer price index for selected input items (2000–2012) ............................................................................. 13
Figure 9: International fertilizer prices (2000–2012) ........................................................................................................ 14
Figure 10: Local fertilizer price trends (2000–2012) ......................................................................................................... 15
Figure 11: Crude oil price (1997–2012) ............................................................................................................................ 17
Figure 12: Diesel prices in Gauteng and at the coast (2006–2012) .................................................................................. 17
Figure 13: Vehicle costs over time for different sized vehicle (2004–2012) ..................................................................... 19
Figure 14: Annual changes in electricity unit cost (2010, 2011 and 2012) ....................................................................... 20
Figure 15: Minimum wages (2003–2012) ......................................................................................................................... 21
Figure 16: Contribution of different categories of consumer goods and services to the CPI ........................................... 22
Figure 17: CPI and CPI rate of change for food and non-alcoholic beverages .................................................................. 23
Figure 18: Headline CPI rate and CPI rate of change for food and non-alcoholic beverages ............................................ 23
Figure 19: CPI for food and non-alcoholic beverages in the different provinces in South Africa ..................................... 24
Figure 20: CPI for different food groups ........................................................................................................................... 24
Figure 21: CPI for processed and unprocessed products ................................................................................................. 25
Figure 22: International poultry price trends ................................................................................................................... 37
Figure 23: Poultry retail price trends ................................................................................................................................ 38
Figure 24: Poultry producer price trends ......................................................................................................................... 38
Figure 25: Real farm-to-retail price spread and farm value share of poultry ................................................................... 39
Figure 26: International beef price trends ........................................................................................................................ 39
Figure 27: Retail price trends for different beef cuts ........................................................................................................ 40
Figure 28: Beef producer price trends .............................................................................................................................. 40
Figure 29: Real farm-to-retail price spread and farm value share for beef ...................................................................... 41

IX
The South African Food Cost Review 2012 The South African Food Cost Review 2012
Figure 30: International Lamb prices ................................................................................................................................ 41
Figure 31: Lamb retail price trends ................................................................................................................................... 42
Figure 32: Lamb producer price trends ............................................................................................................................ 42
Figure 33: Real farm-to-retail price spreads and farm value share of lamb ..................................................................... 43
Figure 34: International pork price trends ....................................................................................................................... 43
Figure 35: Pork retail price trends .................................................................................................................................... 44
Figure 36: Pork producer price trends .............................................................................................................................. 44
Figure 37: Real farm-to-retail price spread and farm value share of pork........................................................................ 45
Figure 38: Raw milk price and retail values for full cream and low fat milk, sachets (R/litre) .......................................... 45
Figure 39: Real farm value shares for full cream milk, sachets (R/litre) ........................................................................... 46
Figure 40: Real farm-to-retail price spread for full cream milk, sachets (R/litre) ............................................................. 47
Figure 41: Retail price of powdered milk, (R/kg) .............................................................................................................. 51
Figure 42: Domestic white maize production and consumption ...................................................................................... 51
Figure 43: Total white exports, pipeline requirements, carry-over and carry-over as a percentage of total domestic demand......................................... .................................................................................................................. 52
Figure 44: Per capita consumption and population.......................................................................................................... 52
Figure 45: Domestic yellow maize production and consumption..................................................................................... 53
Figure 46: Total yellow exports, pipeline requirements, carry-out and carry-out as a percentage of total domestic demand ............................................................................................................................... 53
Figure 47: Import parity, export parity and SAFEX white maize price .............................................................................. 55
Figure 48: Import parity, export parity and SAFEX yellow price ....................................................................................... 56
Figure 49: Real retail value and farm value of special maize meal ................................................................................... 56
Figure 50: Real retail value and farm value of super maize meal ..................................................................................... 57
Figure 51: Real farm value share of special and super maize meal .................................................................................. 57
Figure 52: Real farm to retail price spread of special and super maize meal ................................................................... 58
Figure 53: Area planted, commercial production and imports (tons) .............................................................................. 61
Figure 54: Wheat consumption and production .............................................................................................................. 62
Figure 55: Import parity, export parity and SAFEX wheat price ....................................................................................... 62
Figure 56: Farm gate price of wheat and real retail price of brown and white bread ...................................................... 63
Figure 57: Price difference between white and brown bread .......................................................................................... 63
Figure 58: Real farm value share of brown and white bread............................................................................................ 64
Figure 59: Real farm to retail price spread of brown and white bread ............................................................................. 64

X
The South African Food Cost Review 2012 The South African Food Cost Review 2012
Figure 60: Area planted; production and consumption of sunflowers seed in South Africa ............................................ 72
Figure 61: Domestic sunflower seed price and retail price of sunflower (750 mℓ) .......................................................... 72
Figure 62: Area planted, production and demand of soybean seed in South Africa ........................................................ 73
Figure 63: Area planted, production and demand for soybeans in South Africa .............................................................. 74
Figure 64: Price trends for soybeans ................................................................................................................................ 75
Figure 65: Volume of selected vegetables sold at fresh produce markets ....................................................................... 75
Figure 66: Market price trends for selected fresh vegetables .......................................................................................... 76
Figure 67: Retail price trends for selected fresh vegetables ............................................................................................. 76
Figure 68: Real farm-to-retail price spread and farm value share of cabbages ................................................................ 77
Figure 69: Real farm-to-retail price spread and farm value share of onions .................................................................... 77
Figure 70: Real FRPS and farm value share of tomatoes .................................................................................................. 78
Figure 71: Real farm-to-retail price spread and farm value share of potatoes ................................................................. 78
Figure 72: South African agricultural growth to leading destinations (1996-2012) ......................................................... 83
Figure 73: Market share changes of leading destination markets in South African exports................. ........................... 84
Figure 74: South African Cereal production (1996-2012)............. .................................................................................... 87
Figure 75: South African import duty on cereals and production....... ............................................................................. 88
Figure 76: Changes is agricultural debt levels.......... ........................................................................................................ 91
Figure 77: Total farm debt........ ........................................................................................................................................ 92
Figure 78: Interest cover ratio for the agricultural sector........ ......................................................................................... 93
Figure 79: Gross value of agricultural production ............................................................................................................ 94
Figure 80: The nominal gross and net farm income, as well as expenditure on intermediate goods and services ..........94
Figure 81: Valuation of agricultural debt......... ................................................................................................................. 95
Figure 82: Surface water withdrawal in (2000)....... ......................................................................................................... 97
Figure 83: Food Security Risk Index.......... ...................................................................................................................... 100
Figure 84: Mean annual rainfall in South Africa (1970—2006).......... ............................................................................ 102

XI
The South African Food Cost Review 2012 The South African Food Cost Review 2012
LIST OF TABLES
Table 1: South Africa’s agricultural exports to the world.................................................................................................... 3
Table 2: South Africa’s agricultural imports to the world ................................................................................................... 4
Table 3: South Africa’s leading imported fishery products (2007–2012) ............................................................................ 5
Table 4: South Africa’s leading exported fishery products (2007–2012) ............................................................................ 6
Table 5: South African exports of forestry products ........................................................................................................... 7
Table 6: South Africa imports of forestry products ............................................................................................................ 8
Table 7: The South African fertilizer demand, domestic production and imports ............................................................ 15
Table 8: Vehicle cost changes from 2004 to 2011 ............................................................................................................ 20
Table 9: Average annual retail prices for certain food items in the bread and cereal group ............................................ 26
Table 10: Average annual retail prices for certain food items in the meat group ............................................................ 27
Table 11: Average annual retail prices for certain food items in the fish group ............................................................... 27
Table 12: Average annual retail prices for certain food items in the milk group .............................................................. 28
Table 13: Average annual retail prices for eggs and cheese ............................................................................................. 28
Table 14: Average annual retail prices for certain food items in the oils and fats group .................................................. 29
Table 15: Average annual retail prices for fruit ................................................................................................................ 29
Table 16: Average annual retail prices for certain food items in the vegetable group ..................................................... 30
Table 17: Average annual retail prices for sugar ............................................................................................................... 31
Table 18: Average annual retail prices for tea and coffee................................................................................................. 31
Table 19: Average annual retail prices for bread and cereals in rural areas ..................................................................... 32
Table 20 : Average annual retail prices for oils and fats in rural areas ............................................................................. 33
Table 21: Average annual retail prices for beans in rural areas ........................................................................................ 34
Table 22: Average annual retail prices for milk in rural areas ........................................................................................... 34
Table 23: Average annual retail prices for tea and coffee in rural areas ........................................................................... 34
Table 24: Average annual retail prices of sugar in rural areas .......................................................................................... 35
Table 25: Comparison of rural and urban food prices ...................................................................................................... 36
Table 26: Typical cost composition of pasteurised full cream milk in 2-litre containers offered for sale in a retail store.. 48
Table 27: South African maize balance sheet for the 2011/12 season ............................................................................. 54
Table 28: Average costs in the maize to maize meal (super maize meal) value chain (Component A) ............................ 59
Table 29: The maize-to-maize meal (super maize meal) value chain (Component B) ...................................................... 60

XII
The South African Food Cost Review 2012 The South African Food Cost Review 2012
Table 30: Average costs in the wheat-to-white bread supply chain (Component A) ........................................................ 64
Table 31: Average costs in the wheat-to-white bread supply chain (Component B) ........................................................ 66
Table 32: Average cost in the wheat-to-white bread supply chain (Component C) ......................................................... 67
Table 33: Aggregated selected cost items for the wheat-to-white bread chain ............................................................... 68
Table 34: age costs in the wheat-to-brown bread supply chain (Component A) .............................................................. 68
Table 35: Average costs in the wheat-to-brown bread supply chain (Component B) ....................................................... 69
Table 36: Average cost in the wheat-to-white bread value chain (Component C) ........................................................... 70
Table 37: Aggregated version of cost items ...................................................................................................................... 71
Table 38: Import of soybean products for 2011 ............................................................................................................... 74
Table 39: Total number of social grants types and the provincial shares as at 28/02/13 ................................................. 79
Table 40: South African agricultural product diversification (1996-2012) ........................................................................ 85
Table 41: Global retail sales growth by volume (percent change per annum) ................................................................. 86
Table 42: Top 10 leading cereal imports, Applicable Tariff (rates) in 2011 and trade agreements in place..................... 89
Table 43: Growth of the agricultural sector...................................................................................................................... 91
Table 44: Source of agricultural finance ........................................................................................................................... 93

XIII
The South African Food Cost Review 2012 The South African Food Cost Review 2012
ACRONYMSAFF Agricultural, Forestry and Fisheries
AMPS All Media and Products Study
AMT Agrimark Trends
BDI Baltic Dry Index
CPI Consumer Price Index
DAFF Department of Agriculture, Forestry and Fisheries
DAP Di-ammonium phosphate
DPME Department of Performance Monitoring and Evaluation
EU European Union
FAO Food and Agricultural Organisation
FCR Food Cost Review
FRPI Farming Requisite Price Index
FTRPS Farm-to-retail price spread
FSSA Fertilizer Society of South Africa
Grain SA Grain South Africa
GTA Global Trade Atlas
ICESCR International Covenant on Economic, Social and Cultural Rights
IEA International Energy Association
IFA International Fertilizer Industry Association
IFSS Integrated Food Security Strategy
ITC International Trade Centre
LSM Living Standards Measure
MDG Millenium Development Goals
MOP Murate of potash
MPO Milk Producers’ Organization
MTSF Medium Term Strategic Framework
NESOI Not elsewhere specified or included
NFD National Freight Database
PPI Producer Price Index
PRI Protein Research Institute

The South African Food Cost Review 2012 The South African Food Cost Review 2012
XIV
The South African Food Cost Review 2012 The South African Food Cost Review 2012
ACRONYMS
CDG Care Dependency Grant
CSG Child Support Grant
DG Disability Grant
FCG Foster Care Grant
ICROP Improved Community Registration Outreach Programme
NAMC National Agricultural Marketing Council
OAG Old Age Grant
SAARF South African Advertising Research Foundation
SAFEX South African Futures Exchange
SAGIS South African Grain Information Service
SAMPRO South African Milk Processors’ Organisation
SAPIA South African Petroleum Industry Association
SARB South African Reserve Bank
SASSA South African Social Security Agency
SME Small And Medium Enterprises
SSA Sub-Saharan Africa
Stats SA Statistics South Africa
UAE United Arab Emirates
UK United Kingdom
UN United Nations
USA United States Of America
VAT Value Added Tax
WTA World Trade Atlas
WVG War Veteran Grant

1
The South African Food Cost Review 2012 The South African Food Cost Review 2012The South African Food Cost Review 2012 The South African Food Cost Review 2012
1. WHAT HAPPENED TO FOOD PRICES?
1.1 Global food price trendsThe Food and Agricultural Organization (FAO) of the United Nations (UN) publishes the food price index on a monthly basis. The food price index consists of five commodity group price indices, namely the meat, dairy, cereals, oils and sugar price indices. These indices are weighted with the average export shares of each of the groups for 2002–2004. In total, 55 commodity quotations, considered by FAO commodity specialists as representing the international prices of the food commodities noted, are included in the overall index. Figure 1 shows the overall food price index from 2008 to 2012. The average FAO food price index for 2012 was 141.5 points; 12.5 points (8.14%) lower than the 2011 index.
Figure 1: International food price indexSource: FAO, 2013
Figure 2 shows the international price indices for different food categories. Sugar and oils have the highest price indices when compared to cereals and dairy price indices. There was a decrease in all the indices of the different food categories. The sugar price index decreased by 18.16% between 2011 and 2012. The dairy, oils and cereals price indices decreased by 15.52%, 11.79% and 3.62% respectively. The meat price index had the lowest decrease between 2011 and 2012.
Figure 2: International price indices for different food categories Source: FAO, 2013
0
50
100
150
200
250
2008 2009 2010 2011 2012
Inde
x (2
002-
2004
= 1
00)
100
150
200
250
300
350
Jan-
08
Apr-
08
Jul-0
8
Oct
-08
Jan-
09
Apr-
09
Jul-0
9
Oct
-09
Jan-
10
Apr-
10
Jul-1
0
Oct
-10
Jan-
11
Apr-
11
Jul-1
1
Oct
-11
Jan-
12
Apr-
12
Jul-1
2
Oct
-12 In
dex
(200
2-20
04 =
100
)
Meat Price Index Dairy Price Index Cereals Price Index
Oils Price Index Sugar Price Index

2
The South African Food Cost Review 2012 The South African Food Cost Review 2012
2 SOUTH AFRICA’S AGRICULTURE, FORESTRY AND FISHERIES TRADE REVIEW
2.1 South African Agricultural , Forestry and Fisheries Trade Performance in 2012South Africa is an important and globally known exporter and importer of agricultural, fishery and forestry (AFF) products. The country is a strong exporter of wine, wool, sugar, maize, fruits and wood products, while importing large quantities of rice, wheat, soybean oil, whisky, fish, tobacco and palm oil. Overall, the country is a net exporter of agriculture, forestry and fisheries products and the total value generated from exporting these products was equivalent to R62.25 billion in 2012, registering a slight decline of 4% year on year growth. The aggregated imports of all agricultural, forestry and fishery products amounted to R56.95 billion which is an increase of 5.8% year on year growth. The Euro zone remains the largest destination market for South Africa’s fruit exports, while South East Asia is increasingly becoming an important trading partner on agricultural products. Zimbabwe was the leading destination for South African AFF products, which constituted 8.6% of total AFF exports. Zimbabwe was followed by the Netherlands (8.5%), UK (8.4%), China (6%) and Mozambique (4.9%) respectively in 2012. The main suppliers of AFF imports into South Africa were China, followed by Argentina, the United Kingdom, Thailand and Brazil in 2012, which accounted for 39% of the total AFF imports into South Africa.
2.2 South Africa’s agricultural tradeSouth Africa’s agricultural trade trends between 1996 and 2012 represent a good picture of a country that has always been a net exporter. In 2007, the gap between exports and imports was at its minimum. In 2012, total agricultural exports were valued at R50.87 billion registering a minimal decline of 1.83%. The decrease in agricultural exports can be attributed to a 47% decrease of maize exports. On the other side of trade, South African agricultural imports grew to R48.02 billion gaining a growth rate of 5.8% year on year. The increase in agricultural imports may have resulted due to rises in rice and sardines imports growing at the rate of 37% and 167% respectively between 2011 and 2012. The exports and imports of the agricultural sector constituted 82% and 84% of the country’s total AFF exports and imports respectively. On the export front, Table 1 represents leading destinations for South African exports of agricultural products, as well the most exported agricultural products. Agricultural exports have grown by 70% between 2007 and 2012. South Africa is a strong net exporter of fruits (oranges, grapes and apples), followed by wine, maize and wool. The leading market destinations for South African agricultural exports are Netherlands, Zimbabwe, the UK, Mozambique and Mexico. These markets collectively accounted for around 39% of total agricultural exports in 2012. However, their market share has decreased due to diversion of South African exports to African countries.
SOUTH AFRICA’S AGRICULTURE, FORESTRY AND
FISHERIES TRADE REVIEW

3
The South African Food Cost Review 2012 The South African Food Cost Review 2012
Table 1: South Africa’s agricultural exports to the world
HS code Product Description
Export value (billion rand )
Export value
Export quantity (tons)
Main destinations of South African agricultural exports (Share in total South African agricultural exports)
2007 2012 2012 2007-2012 2012
Agricultural Products 29.8 50.8 - 70
080510 Oranges 2.8 4.8 1 097 299 71 Netherlands (18%), Russia (11%), Saudi Arabia (8%), UAE (8%), UK (6%)
220421 Wine in container <2l 3.7 3.6 128 885 653 -3 UK (16%), Germany (11%), Netherlands
(11%), Canada (8%), US (8%)
080610 Grapes 2.2 3.5 264 079 59 Netherlands (43%), UK (19%), China (9%), UAE (4%), Russia (4%)
100590 Maize 0.1 3.0 991 563 2850 Mexico (88%), Mozambique (5%), North Korea (2%), Zimbabwe (2%)
080810 Apples 1.5 2.6 388 835 73 UK (27%), Malaysia (12%), Benin (7%), Angola (6%), UAE (5%)
510111 Wool 1 2.3 40 805 130 China (63%), Republic of Czech (16%), India (12%), Italy (4%), Egypt (2%)
220429 Wine in container >2l 0.9 2.1 275 706 445 130 UK (25%), Germany (17%), Sweden
(14%), Denmark (8%), Russia (6%)
210690 Food Preparations 0.5 1.1 40 157 123 Zimbabwe (20%), Nigeria (12%), Zambia (11%), Mozambique (11%), Tanzania (6%)
150790 Soybean Oil 0.004 1.0 71 769 23778 Zimbabwe (95%), Zambia (3%), Republic of Congo (2%)
170199 Cane 0.5 0.9 172 573 90Mozambique (26%), Zimbabwe (23%), Angola (15%), Madagascar (11%), Uganda (6%)
Source: Global Trade Atlas, 2013
Table 2 shows major suppliers of agricultural imports into South Africa, as well as the most imported products into South Africa. The top 10 imported products accounted for 49% of total agricultural imports in 2012. The top five suppliers of import products include Argentina, China, Brazil, the UK and Netherlands; collectively they are supplying about 39% of agricultural imports to South Africa.

4
The South African Food Cost Review 2012 The South African Food Cost Review 2012
Table 2: South Africa’s agricultural imports to the world
HS code
Product Description
2007
Import value (billion rand )
Import value (billion rand )
Import quantity (tons)
Growth in value
(%)
Main suppliers of South African agricultural imports (Share in total South African agricultural imports)
2012 2007-2012 2012 2007-
2012 2012
Agricultural Products 29.8 48 61
100630 Rice 2.1 5.7 1 281 552 171 Thailand (35%), China (33%), India (23%), Brazil (5%), Vietnam (3%)
151190 Palm oil 1.4 3.3 400 742 136 Indonesia (50%), Malaysia (46%), Mauritius (2%), Brazil (1%)
230400 Soybean 1.5 2.8 767 412 87 Argentina (100%)
020714 Chicken cuts & offal 1.2 2.5 214 004 108Brazil (29%), Netherlands (26%), UK (11%), Germany (10%), Thailand (4%)
220830 Whiskies 1.5 2.3 34 015 869 53 UK (82%), Ireland (8%), US (7%), Canada (2%), France (1%)
150790 Soybean oil 0.7 1.9 167 259 171Netherlands (39%), Spain (35%), Germany (16%), Brazil (6%), Malaysia (2%)
151211 Sunflower oil 0.8 1.8 187 848 125Argentina (59%), Ukraine (17%), Switzerland (9%), Spain (4%), France (3%)
210690 Food preparation 0.9 1.3 22 467 44US (18%), Netherlands (12%), Germany (10%), Ireland (7%), France (6%)
240120 Tobacco 0.5 0.9 20 140 80 Brazil (30%), Zimbabwe (27%), India (7%), Malawi (4%), Germany (4%)
170199 Cane 0.03 0.8 149 355 2567 Brazil (86%), Thailand (7%), India (3%), Finland (2%)
Source: Global Trade Atlas, 2013
2.3 South Africa’s fisheries tradeSouth Africa has exported and imported fishery products valued at R33.6 billion and R13 billion respectively between 1996 and 2012. Noteworthy is the fact that fishery exports have been on a declining trend between 2003 and 2011, registering a decline rate of 12.3% during this period. Imports have increased by 122% between 2007 and 2012. In 2012 South Africa had a negative trade balance of R600 million. In 2012, South Africa imported 70% of its fishery products from Thailand while Spain and Italy were leading export markets, with South Africa having a market of 17% in both countries. In 2012 South Africa had an average global fishery import and export share of 1.8% and 1.5% respectively. Table 3 shows ten of the most imported fishery products for the years 2007 and 2012. Sardines were the most exported product with Thailand supplying 84% of this product in 2012. The second most imported fishery product is tuna, of which 95% was supplied by Thailand in 2012. Of the leading imported fishery products, dried cod declined by 7.2% between 2007 and 2012.

5
The South African Food Cost Review 2012 The South African Food Cost Review 2012
Table 3: South Africa’s leading imported fishery products (2007–2012)
HS code
Product Description
Import value (billion rand)
Import value (billion rand)
Import quantity
Growth value
Main suppliers of South Africa Fishery Imports (Share in total South African fishery imports)
2007 2012 (tons) (2007-2012) 2012
Fisheries Products 0.907 2.1 99623 122.1
160413 Sardines Brisling Prep/Pres, Not Minced
0.153 1 .2 71164 680.2
Thailand (84%), China (8%), Philippines (3%), Indonesia (2%), Portugal (1%)
160414 Tunas Prep/Pres, Not Minced 0.201 0.409 11735 104
Thailand (95%), Philippines (3%), China (1%)
030749 Cuttle Fish & Squid, Frozen, Dried, Salted Or In Brine
0.104 0.167 7796 60.4
China (37%), Spain (27%), Falkland Island (15%), US (6%), Peru (4%)
030313 Atlantic Salmon & Banube Salmon, Frozen
0.020 0.039 900 334.4Norway (85%), UK (7%), Mauritius (4%), Chile (4%)
160419 Fish, Prepared Or Preserved, Whole Or Pieces NESOI
0.039 0.037 2290 -5.6Peru (70%), Thailand (16%), US (7%), Malaysia (4%), UK (2%)
160420 Fish, Prepared Or Preserved, NESOI 0,007 0.027 1100 269
Uruguay (57%), Thailand (13%), China (10%), UK (6%), Poland (4%)
160415 Mackerel, Prepared Or Preserved, Not Minced
0.010 0.025 1326 147.7 China (79%), Peru (15%), Germany (7%)
030314 Trout, Frozen 0.005 0.021 555 129.74Norway (43%), United Kingdom (41%), Chile (16%)
030551 Cod, Dried, Whether Or Not Salted But Not Smoked
0.020 0.019 267 -7.2 Norway (85%), Portugal (15%)
160540 Crustaceans, NESOI , Prepared Or Preserved
0.0007 0.015 493 1962.2India (44%), China (42%), Singapore (7%), Chile (2%)
Source: Global Trade Atlas, 2013*NESOI not elsewhere specified or indicated
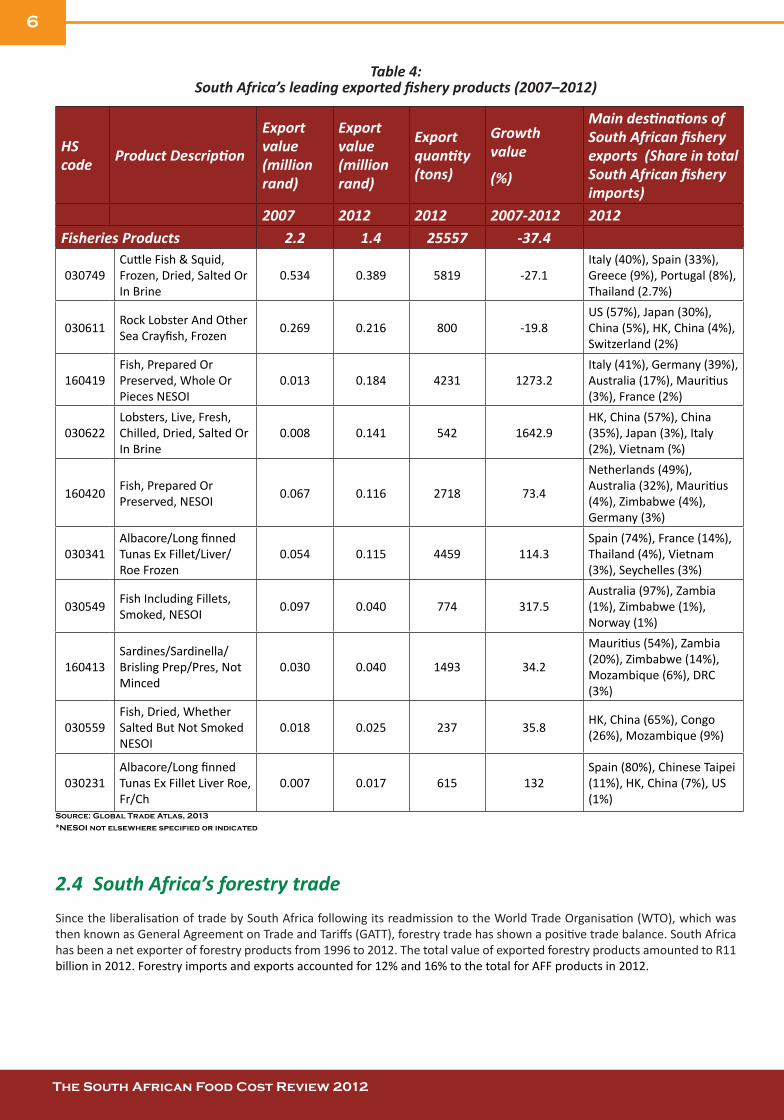
Table 4 shows fishery products exported from South Africa. Cuttle fish and squid, rock lobster and prepared fish were the most exported fishery products in 2012. However, cuttle fish and squid, as well as rock lobster have decreased in value by 37.4% and 27.1% respectively (see table 4). Italy (40%) and Spain (33%) were leading markets for South Africa cuttle fish and squid. Of the most exported products, lobsters had the highest growth rate.
6
The South African Food Cost Review 2012 The South African Food Cost Review 2012
Table 4: South Africa’s leading exported fishery products (2007–2012)
HS code Product Description
Export value (million rand)
Export value (million rand)
Export quantity (tons)
Growth value
(%)
Main destinations of South African fishery exports (Share in total South African fishery imports)
2007 2012 2012 2007-2012 2012Fisheries Products 2.2 1.4 25557 -37.4
030749 Cuttle Fish & Squid, Frozen, Dried, Salted Or In Brine
0.534 0.389 5819 -27.1Italy (40%), Spain (33%), Greece (9%), Portugal (8%), Thailand (2.7%)
030611 Rock Lobster And Other Sea Crayfish, Frozen 0.269 0.216 800 -19.8
US (57%), Japan (30%), China (5%), HK, China (4%), Switzerland (2%)
160419 Fish, Prepared Or Preserved, Whole Or Pieces NESOI
0.013 0.184 4231 1273.2Italy (41%), Germany (39%), Australia (17%), Mauritius (3%), France (2%)
030622 Lobsters, Live, Fresh, Chilled, Dried, Salted Or In Brine
0.008 0.141 542 1642.9HK, China (57%), China (35%), Japan (3%), Italy (2%), Vietnam (%)
160420 Fish, Prepared Or Preserved, NESOI 0.067 0.116 2718 73.4
Netherlands (49%), Australia (32%), Mauritius (4%), Zimbabwe (4%), Germany (3%)
030341 Albacore/Long finned Tunas Ex Fillet/Liver/Roe Frozen
0.054 0.115 4459 114.3Spain (74%), France (14%), Thailand (4%), Vietnam (3%), Seychelles (3%)
030549 Fish Including Fillets, Smoked, NESOI 0.097 0.040 774 317.5
Australia (97%), Zambia (1%), Zimbabwe (1%), Norway (1%)
160413 Sardines/Sardinella/Brisling Prep/Pres, Not Minced
0.030 0.040 1493 34.2
Mauritius (54%), Zambia (20%), Zimbabwe (14%), Mozambique (6%), DRC (3%)
030559 Fish, Dried, Whether Salted But Not Smoked NESOI
0.018 0.025 237 35.8 HK, China (65%), Congo (26%), Mozambique (9%)
030231 Albacore/Long finned Tunas Ex Fillet Liver Roe, Fr/Ch
0.007 0.017 615 132Spain (80%), Chinese Taipei (11%), HK, China (7%), US (1%)
Source: Global Trade Atlas, 2013
*NESOI not elsewhere specified or indicated
2.4 South Africa’s forestry tradeSince the liberalisation of trade by South Africa following its readmission to the World Trade Organisation (WTO), which was then known as General Agreement on Trade and Tariffs (GATT), forestry trade has shown a positive trade balance. South Africa has been a net exporter of forestry products from 1996 to 2012. The total value of exported forestry products amounted to R11 billion in 2012. Forestry imports and exports accounted for 12% and 16% to the total for AFF products in 2012.

7
The South African Food Cost Review 2012 The South African Food Cost Review 2012
Table 5 shows the most exported forestry products, as well as five top markets for South African forestry products in 2012.
• Forestry exports grew by 50% between 2007 and 2012, and the value of forestry exports amounted to R10 billion in 2012.
• The main markets for South African forestry exports in 2012 were Indonesia (20%), China (14%), Zimbabwe (5.9%), Thailand (5.8%) and UK (5.6%).
• Chemical woodpulp, Kraftliner and Chemical woodpulp soda were leading export products that constituted 72% of the total forestry products.
Table 5: South African exports of forestry products
HS Product Description
2007
Export value (million rand )
Exports value (million rand )
Export quantity
Main destinations for South African forestry exports (Share in total South African forestry exports)
2012 2007–2012 2012 2012
Forestry Products 6.7 10.0 50
470200 Chemical Woodpulp, Dissolving Grades 2.9 4.9 2 467 479 71
Indonesia (39%), China (19%). Thailand (10%), Belgium (9%), India (9%)
480419 Kraftliner, Uncoated, Bleached, In Rolls Or Sheets 0.9 1.5 243 078 67 UK (16%), Germany (14%), Italy
(13%), Spain (12%), France (8%)
470329 Chemical Woodpulp 0.5 0.8 159 126 53 China (59%), Indonesia (15%), Thailand (11%), Korea (7%),
480100 Newsprint, In Rolls Or Sheets 0.1 0.3 44 608 141Zimbabwe (27%), Zambia (19%), Mauritius (8%), Malawi (8%), Nigeria (7%)
481910 Cartons, Boxes & Cases Corrugated Paper 0.2 0.3 22 972 50
Zimbabwe (29%), Mozambique (24%), Angola (9%, India (8%), Zambia (6%)
490199 Printed Books, Brochures, Etc., Nesoi 0.3 0.2 5 072 -12 UK (17%), Zimbabwe (12%),
Mozambique (9%), Malawi (8%)
480411 Kraftliner, Uncoated Unbleached In Rolls Or Sheets
0.3 0.1 28 615 -51 Zimbabwe (18%), Zambia (12%), Cote d’Ivorie (9%), Mauritius (7%)
441820 Doors And Their Frames And Thresholds Of Wood 0.2 0.1 6 677 -37
UK (54%), Mozambique (9%), Zimbabwe (8%), Zambia (6%), DRC (4%)
470730 Recycled (Waste & Scrap) Paper 0.004 0.1 91 462 2514
Indonesia (37%), India (27%), Thailand (18%), Philippines (4%), Cote d’Ivorie (3%)
482110 Paper And Paperboard Labels Of All Kinds, Printed 0.04 0.1 1 815 173
Mozambique (28%), Zambia (27%), Zimbabwe (23%) Ghana (7%), Malawi (5%)
Source: Global Trade Atlas, 2013 *NESOI not elsewhere specified or indicated

8
The South African Food Cost Review 2012 The South African Food Cost Review 2012
Table 6 represents total values of imports for forestry products as well as major suppliers of forestry imports into South Africa.
• Forestry imports grew by 10% between 2007 and 2012, and the value of forestry exports amounted R6.9 billion in 2012.
• The main markets for South African forestry exports in 2012 were China (16%), the UK (14%), the United States (13%), Germany (9%) and Sweden (5%).
• Printed articles (books, brochures etc.), were leading export products that constituted 21% of the total forestry products.
Table 6: South Africa imports of forestry products
HS code Product Description
Import value (million rand )
Import value (million rand )
Import quantity
Growth in value
(%)
Main suppliers of South African forestry Imports (Share in total South African forestry
2007 2012 2012 2007–2012
2012
Forestry Products 6.3 6.9 10
490199 Printed Books, Brochures, Etc., Nesoi 1.4 1.5 18 961 1 UK (49%), USA (21%), China
(9%), Germany (4%)
481190 Paper 0.2 0.4 15 107 92Germany (27%), Austria (20%), Italy (16%), Japan (9%), China (8%)
481029 Paper Ex Lite-Wght Writing 0.4 0.4 47 074 -10Finland (37%), China (31%), Korea (11%), Germany (6%), Italy (5%)
470321 Chemical Woodpulp, Soda 0.1 0.3 57 480 230USA (51%), Argentina (20%), New Zealand (13%), Finland (5%), Austria (3%)
441299 Plywood, Veneer Panels & Similar Lam Wood, Nesoi 0.2 0.2 31 939 -4
China (48%), Malaysia (12%), Brazil (11%), Malawi (7%), Austria (3%)
480421 Sack Kraft Paper Uncoated Unbleached, Rolls/Sheets 0.1 0.2 21 896 42
Sweden (33%), Republic Czech (31%), Austria (12%), Spain (8%), USA (5%)
441600 Casks, Barrels, Vats, Etc. And Parts Of Wood 0.2 0.2 1 665 -5
France (86%), USA (5%), Chile (5%), Austria (3%), Hungary (1%)
490290 Newspapers, Appearing Less Than 4 Times Per Week 0.1 0.2 1 896 169
UK (61%), Spain (19%), USA (12%), Australia (2%), Germany (2%)
480300 Toilet Etc. Hshld/Sanitary Stock Paper Roll Or Sheets 0.04 0.1 13 801 245
Indonesia (19%), UAE (19%), Malaysia (18%), Sweden (10%), Saudi Arabia (6%)
480920 Self-Copy Paper, In Rolls Or Sheets Over 36cm Wide 0.1 0.1 10 901 1
Germany (39%), US (30%), Thailand (19%), Indonesia (7%), Belgium (6%)
Source: Global Trade Atlas, 2013 *NESOI not elsewhere specified or indicated

9
The South African Food Cost Review 2012 The South African Food Cost Review 2012
3 TRENDS IN INPUT COSTS
3.1 Terms of trade for primary agricultureThe rise in input costs at farm level creates what is known as the cost-price squeeze effect. This is best illustrated by calculating the terms of trade at the primary agricultural level by dividing the primary Producer Price Index (PPI) with the Farming Requisite Price Index (FRPI); that is, the prices received by farmers for their output divided by the prices paid for farm inputs. From Figure 3, it is evident that the terms of trade at the primary agricultural level has deteriorated significantly over time. There was, however, some relief during the commodity price boom in 2007 and 2008.
Figure 3: Terms of trade (1995–2012)Source: Own calculations based on data from DAFF, 2013
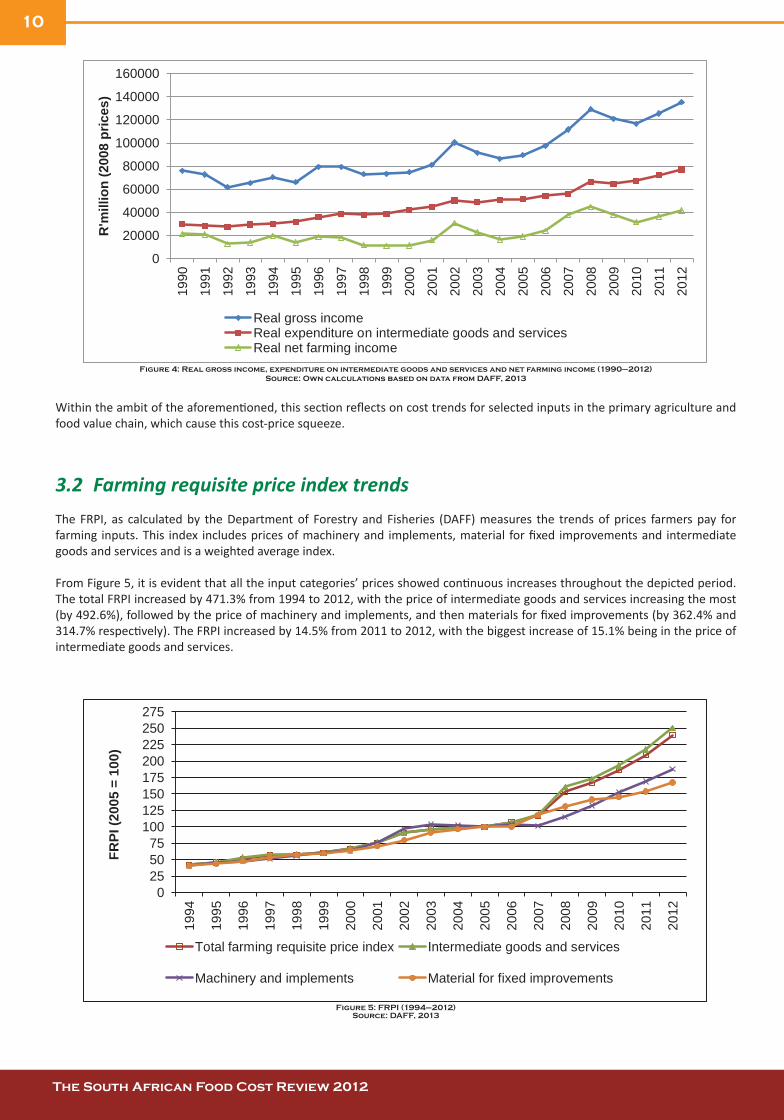
The overall financial position of primary producers is constantly under pressure. Figure 4 shows the real gross income, real expenditure on intermediate goods and services, and the real net farming income from 1990 to 2012. Over the depicted period, the gross income increased by 77.9%, while the expenditure on intermediate goods and services increased by 158.3%. This led to an increase of only 94.8% in the real net farming income. Between 2011 and 2012, the changes were 7.8%, 6.9% and 14.1% respectively. During 2010 the real net farming income decreased by 16.7% and during 2011, the real net farming income increased by 15.1%.
0.80
0.85
0.90
0.95
1.00
1.05
1.10
1.15
1.20
1.25
2000
2001
2002
2003
2004
2005
2006
2007
2008
2009
2010
2011
2012
Term
s of
trad
e (2
005
= 10
0)
Terms of trade
10
The South African Food Cost Review 2012 The South African Food Cost Review 2012
Figure 4: Real gross income, expenditure on intermediate goods and services and net farming income (1990–2012) Source: Own calculations based on data from DAFF, 2013
Within the ambit of the aforementioned, this section reflects on cost trends for selected inputs in the primary agriculture and food value chain, which cause this cost-price squeeze.
3.2 Farming requisite price index trendsThe FRPI, as calculated by the Department of Forestry and Fisheries (DAFF) measures the trends of prices farmers pay for farming inputs. This index includes prices of machinery and implements, material for fixed improvements and intermediate goods and services and is a weighted average index.
From Figure 5, it is evident that all the input categories’ prices showed continuous increases throughout the depicted period. The total FRPI increased by 471.3% from 1994 to 2012, with the price of intermediate goods and services increasing the most (by 492.6%), followed by the price of machinery and implements, and then materials for fixed improvements (by 362.4% and 314.7% respectively). The FRPI increased by 14.5% from 2011 to 2012, with the biggest increase of 15.1% being in the price of intermediate goods and services.
Figure 5: FRPI (1994–2012)Source: DAFF, 2013
0
20000
40000
60000
80000
100000
120000
140000
160000
1990
1991
1992
1993
1994
1995
1996
1997
1998
19
99
2000
2001
2002
2003
2004
2005
2006
2007
2008
2009
2010
2011
2012
R'm
illio
n (2
008
pric
es)
Real gross income Real expenditure on intermediate goods and services Real net farming income
0 25 50 75
100 125 150 175 200 225 250 275
1994
1995
1996
1997
1998
1999
2000
2001
2002
2003
2004
2005
2006
2007
2008
2009
2010
2011
2012
FRPI
(200
5 =
100)
Total farming requisite price index Intermediate goods and services
Machinery and implements Material for fixed improvements

11
The South African Food Cost Review 2012 The South African Food Cost Review 2012
When considering the price trends of intermediate goods and services, it is clear from Figure 6 that the price of fertilizer and fuel is much more volatile than other prices and peaked at higher levels during 2008. The price of fertilizer decreased, but not to the levels prior to 2008. From 1994 to 2012, the price of fertilizer increased by 711.7%, the price of fuel by 580.2% and the price of animal feed by 555%. The price trends of these inputs from 2011 to 2012 were as follows: an increase of 14.2% in the price of fertilizer, an increase of 16.1% in the price of fuel, and an increase of 15.2% in the price of animal feed.
Figure 6: FRPI of intermediate goods and services (1995–2012) Source: DAFF, 2013
0 25 50 75
100 125 150 175 200 225 250 275
1994
1995
1996
1997
1998
1999
2000
2001
2002
2003
2004
2005
2006
2007
2008
2009
2010
2011
2012
FRPI
(200
5 =
100)
Total farming requisite price index Intermediate goods and services
Machinery and implements Material for fixed improvements

12
The South African Food Cost Review 2012 The South African Food Cost Review 2012
3.3 Producer price index trendsAs mentioned above, the cost of food manufacturing is not just influenced by the price of raw commodities as inputs, but also by non-food inputs. Among these are the cost of diesel, packaging material, electricity and labour. The PPI – as calculated by Statistics South Africa (Stats SA) – measures trends in the manufacturing price of goods at first point of sale (factory level). This index includes manufacturing prices of products destined for local use, for export, as well as imported components for further value adding. This index implies – but does not directly measure – the cost of services involved in the production process.
The PPI is measured at industry level and is a weighted average index to indicate the production inflation of the economy. Figure 7 shows the PPI for all industry groups, as well as some selected industries. From 2000 to 2012, the PPI of all industry groups increased by 120.5%. Contributing to this increase was an increase of 245.3% in electricity prices, a 210.7% increase in the price of petroleum and coal products, a 203.1% increase in gas and water prices, a 82.9% increase in the price of plastic products, a 79.8% increase in agricultural food industry prices and a 76.1% increase in the manufacturing price of pulp, paper and paperboard products.
Price trends between 2011 and 2012 for the items depicted were as follows: all groups increased by 6.2%, electricity increased by 17.6%, petroleum and coal products increased by 12.5%, gas and water increased by 9.6%, agriculture food increased by 6.5%, paper, pulp and paperboard products increased by 4.7%, and plastic products increased by 4.3%.
Figure 7: PPI for selected industry groups (2000–2012)
Source: Stats SA, 2013
Figure 8 shows the PPI for selected materials. These items are not industry-specific, but indicate price trends to industry on the input side. From 2000 to 2012, the PPI of diesel at refinery level increased by 315% and diesel at retail outlets by 265%, plastic bottles increased by 173.4%, tin plate increased by 142.3%, kraft paper increased by 77.3% and boxes and corrugated cardboard by 75.2%.
Price trends between 2011 and 2012 for the items depicted were as follows: diesel at retail outlets increased by 63.2% and diesel at refinery level increased by 58.2%, boxes and corrugated cardboard increased by 2%, kraft paper remains unchanged, while plastic bottles and tin plate decreased by 28.3% and 28% respectively.
0 25 50 75
100 125 150 175 200 225 250 275
1994
1995
1996
1997
1998
1999
2000
2001
2002
2003
2004
2005
2006
2007
2008
2009
2010
2011
2012
FRPI
(200
5 =
100)
Total farming requisite price index Intermediate goods and services
Machinery and implements Material for fixed improvements

13
The South African Food Cost Review 2012 The South African Food Cost Review 2012
Figure 8: Producer price index for selected input items (2000–2012) Source: Stats SA, 2013
3.4 Trends in the cost of selected inputs
3.4.1 Fertilizer prices
International fertilizer pricesAccording to the International Fertilizer Industry Association (IFA) (2012), global fertilizer demand is estimated to have increased by 2.4% in 2012 to 176.8 million tons nutrients, thus reflecting attractive prices for most agricultural commodities since middle of 2011. Fertilizer sales were estimated at 178 million tons which is 0.3% higher than in 2011. Key developments in the international trade of the main nutrients and raw materials in 2012 comprised lower trade volumes for nearly all fertilizer products, intermediates and raw materials, and a recovery of fertilizer demand and imports in North America and East Asia. China re-emerged as a prominent importer of potash and sulphur and was the world’s largest exporter of di-ammonium phosphate (DAP) and urea, despite facing seasonal export tariffs in 2012.
Figure 9 shows the international fertilizer price movements. Price changes for the items between 2011 and 2012 were as follows: the price of urea increased by 9.3%, the price of muriate of potash (MOP) increased by 18.4% and the DAP price decreased by 7%.
0
100
200
300
400
500
600
2000 2001 2002 2003 2004 2005 2006 2007 2008 2009 2010 2011 2012
Inde
x (2
000
= 10
0)
Boxes, corrugated cardboard Kraft paper Diesel oil - refinery level Diesel oil - Retail outlets Plastic bottles Tinplate

14
The South African Food Cost Review 2012 The South African Food Cost Review 2012
Figure 9: International fertilizer prices (2000–2012) Source: Grain South Africa (Grain SA), 2013
Domestic fertilizer pricesThe South African fertilizer industry is fully exposed to world market forces in a totally deregulated environment, with no import tariffs or government-sponsored measures. The local demand for fertilizer is in the region of 2 million physical tons. This amounts to approximately 750 000 tons of plant nutrient (N + P 2O5 + K2O).
Table 7 shows the South African fertilizer demand, domestic production and import situation.
0
100
200
300
400
500
600
700
800
900
2000
2001
2002
2003
2004
2005
2006
2007
2008
2009
2010
2011
2012
Inde
x (2
005
= 10
0)
Urea Di-Ammonium Phosphate (DAP) Muriate of Potash (MOP)
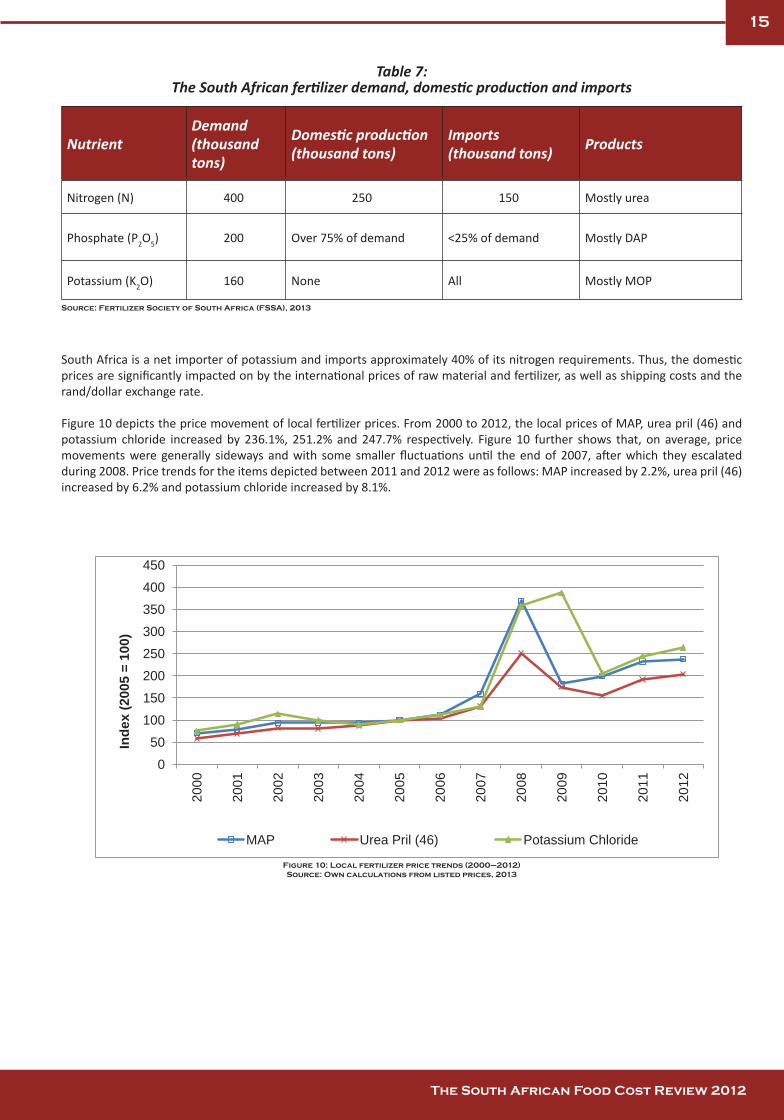
15
The South African Food Cost Review 2012 The South African Food Cost Review 2012
Table 7: The South African fertilizer demand, domestic production and imports
NutrientDemand (thousand tons)
Domestic production (thousand tons)
Imports (thousand tons) Products
Nitrogen (N) 400 250 150 Mostly urea
Phosphate (P2O5) 200 Over 75% of demand <25% of demand Mostly DAP
Potassium (K2O) 160 None All Mostly MOP
Source: Fertilizer Society of South Africa (FSSA), 2013
South Africa is a net importer of potassium and imports approximately 40% of its nitrogen requirements. Thus, the domestic prices are significantly impacted on by the international prices of raw material and fertilizer, as well as shipping costs and the rand/dollar exchange rate.
Figure 10 depicts the price movement of local fertilizer prices. From 2000 to 2012, the local prices of MAP, urea pril (46) and potassium chloride increased by 236.1%, 251.2% and 247.7% respectively. Figure 10 further shows that, on average, price movements were generally sideways and with some smaller fluctuations until the end of 2007, after which they escalated during 2008. Price trends for the items depicted between 2011 and 2012 were as follows: MAP increased by 2.2%, urea pril (46) increased by 6.2% and potassium chloride increased by 8.1%.
Figure 10: Local fertilizer price trends (2000–2012) Source: Own calculations from listed prices, 2013
0 50
100 150 200 250 300 350 400 450
2000
2001
2002
2003
2004
2005
2006
2007
2008
2009
2010
2011
2012
Inde
x (2
005
= 10
0)
MAP Urea Pril (46) Potassium Chloride

16
The South African Food Cost Review 2012 The South African Food Cost Review 2012
3.4.2 Administered and regulated prices
An administered price is defined as the price of a product that is set consciously by an individual producer or group of producers and/or any price that can be determined or influenced by government, either directly or through a government agency/institution without reference to market forces.
Examples of administered prices are the following:
■ Housing (assessment rates, sanitary fees, refuse removal, water, electricity and paraffin)
■ Transport (petrol, public transport – trains, motor licenses and motor vehicle registration)
■ Communication (telephone fees, postage, cell phone calls)
■ Recreation and culture (television licence)
■ Education (school fees and university, technikon and college fees)
■ Restaurants and hotels.
Regulated prices are those administered prices that are monitored and controlled by government policy. To this end, price regulation does not necessarily imply the presence of an economic regulator, but a restriction on the extent to which prices may vary, depending on government’s policy objective.
Examples of administered prices that are regulated are the following:
■ Housing (water, electricity and paraffin)
■ Transport (petrol)
■ Communication (telephone fees, postage, cell phone calls).
TransportInternational crude oil prices
Crude oil prices affect food value chains in several complex ways, from influencing the prices of primary agricultural inputs, to inputs used in value addition processes (e.g. packaging) to the distribution of food. Trends in the crude oil price are therefore an important indicator of trends in prices throughout the food value chain.
Figure 11 shows the trends in the crude oil price. Crude oil prices rocketed in the early part of 2007 to reach a peak of US$145 per barrel in July 2008. The average price per barrel in 2008 was US$97.55 per barrel. The oil price has decreased significantly since the peak in 2008. According to the International Energy Agency (IEA) (2009), the price of oil depends on a multitude of global economic factors, such as economic growth, future demand and supply of oil, and speculation in the oil market.
Tighter credit availability, the slowdown in economic activity as a result of the global financial and economic crises, and fewer speculations in the oil market are reasons provided by the IEA for the significant drop in oil prices since mid-2008. On an average annual basis, the price decreased by 36.65% from US$97.55 per barrel in 2008 to US$61.80 per barrel in 2009. This downward trend did not continue during 2010 and the crude oil price increased by 28.8% on an average annual basis. During 2011 the average crude oil price surpassed the 2008 peak and increased further by 39% to an average of $110.64 per barrel. According to the IEA (2013), supply shortfalls during 2012 caused by Libyan civil war, international sanctions against Iran and unplanned non-OPEC output stoppages, forced the price past the 2008 peak. Record levels of supply from USA and Iraq and some recovery in Libyan supply during 2012 improved the situation. On the demand side, the global economic recovery lost momentum and there are signs that China demand is reducing. During 2012 the crude oil price increased by only 0.7%.

17
The South African Food Cost Review 2012 The South African Food Cost Review 2012
Figure 11: Crude oil price (1997–2012) Source: Grain SA, 2013
Domestic fuel and transport costsFuel makes a significant contribution to the variable costs of primary agricultural production, as well as food distribution costs. Figure 12 illustrates trends in the crude oil price and 0.05% sulphur diesel price in Gauteng and at the coast. Variation in the diesel price is affected by the international oil price, the rand/dollar exchange rate and changes in taxes and levies. The crude oil price (dollar per barrel) increased by 483.5% from 1997 to 2012 and the price of 0.05% sulphur diesel in Gauteng and at the coast, increased by 461.3% and 481.2 3%, respectively. The diesel price peaked in 2008, achieving an average rate of R9.27ℓ, with R9.34/ℓ in Gauteng and R9.20/ℓ at the coast. The average diesel price, however, decreased significantly during 2009 (by 29.7%). Over the same period, the crude oil price decreased by 36.7%.
Price trends for the items depicted between 2011 and 2012 were as follows: 0.05% sulphur diesel in Gauteng increased by 16.1%, 0.05% sulphur diesel at the coast increased by 15.9%, and the crude oil price increased by 0.7%.
Figure 12: Diesel prices in Gauteng and at the coast (1997–2012)Source: South African Petroleum Industry Association (SAPIA) and Grain SA, 2013
0
20
40
60
80
100
120
1997
1998
1999
2000
2001
2002
2003
2004
2005
2006
2007
2008
2009
2010
2011
2012
Pric
e (U
S$/b
arre
l)
Crude oil
0 13 26 39 52 65 78 91 104 117 130
1.5 2.5 3.5 4.5 5.5 6.5 7.5 8.5 9.5
10.5 11.5
1997
1998
1999
2000
2001
2002
2003
2004
2005
2006
2007
2008
2009
2010
2011
2012
Cru
de o
il pr
ice
(US$
per
bar
rel)
Die
sel p
rice
(R/li
tre)
Diesel 0.05% S Gauteng Diesel 0.05% S Coast Crude oil

18
The South African Food Cost Review 2012 The South African Food Cost Review 2012
Transport and logistical costs account for a substantial portion of the overall cost of food. The diverse nature, location and size of the various agricultural value chains from farm gate to consumer present a highly complex transport matrix. Furthermore, there is a perception that food prices are driven up by high fuel prices, but never come down when fuel prices drop. Cognisance should be taken of the fact that there are also other cost drivers that affect transport and logistical costs.
Based on the National Freight Database (NFD), three vehicle categories were chosen to represent vehicles typically used to transport agricultural products and livestock. The NFD categorises vehicles by their number of axles. This method is similar to that applied in the calculation of toll road fees.
Figure 13 illustrates the vehicle cost composition over time for different sized vehicles1. Fixed costs include depreciation, cost of capital, licence, insurance and wages. Running costs include fuel, oil, maintenance, tyres and incidental costs. The sum of the fixed and running costs is the total operational cost.
1 Assumptions: 1 – 85 000 km per annum, 260 work days, 8-ton payload and estimated economical life of 8 years. 2 – 180 000 km per annum, 286 work days, 28-ton payload and estimated economical life of 5 years. 3 – 200 000 km per annum, 286 work days, 36-ton payload and estimated economical life of 4 years.
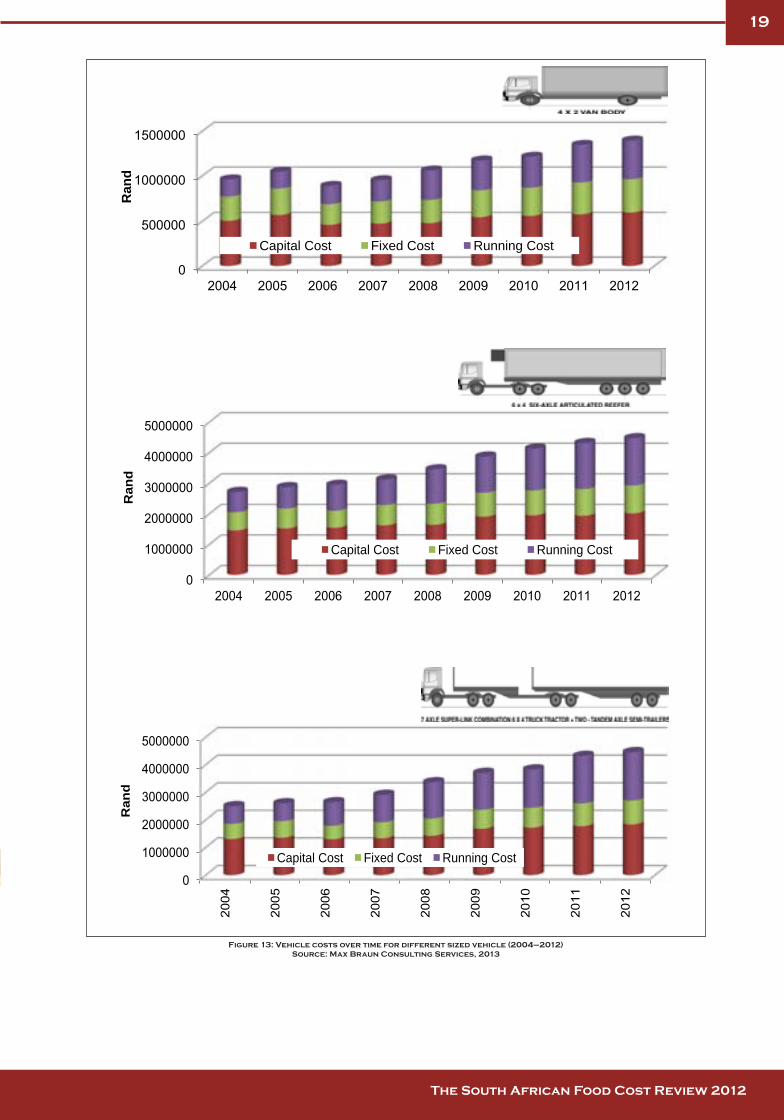
19
The South African Food Cost Review 2012 The South African Food Cost Review 2012
Figure 13: Vehicle costs over time for different sized vehicle (2004–2012)Source: Max Braun Consulting Services, 2013
Ran
d
Capital Cost Fixed Cost Running Cost
Ran
d
Capital Cost Fixed Cost Running Cost
Ran
d
Capital Cost Fixed Cost Running Cost

20
The South African Food Cost Review 2012 The South African Food Cost Review 2012
Table 8: Vehicle cost changes from 2004 to 2011
2-axle vehicles 6-axle vehicles 7-axle vehicles
Capital cost: 18.4%
Fixed cost: 37.8%
Running cost: 126.4%
Capital cost: 38.3%
Fixed cost: 53.3%
Running cost: 133%
Capital cost: 40.4%
Fixed cost: 57.5%
Running cost: 174.6%
Source: Own calculations based on Max Braun Consultancy Services, 2013
Electricity
Figure 14 shows the annual changes in electricity unit costs from 2010 to 2012. For the last three consecutive years, South Africa has had the highest increases for the countries depicted, ranging from 32.8% in 2010 to 23.1% in 2012. As one of the depicted countries, South Africa enjoyed the lowest per unit cost for electricity until 2010. This was followed by Canada, where the unit cost is currently the lowest. During 2012, a kWH cost 9.13 US cents in South Africa, in comparison to 20.23 US cents in Italy, which has consistently been the most expensive country over the last three years.
Figure 14: Annual changes in electricity unit cost (2010, 2011 and 2012)Source: NUS Consulting, 2013
-30.0 -20.0 -10.0 0.0 10.0 20.0 30.0 40.0
Canada Sweden Finland France
United States South Africa
Austria Netherlands
Australia Belgium
United Kingdom Spain
Germany Italy
Portugal Poland
% change 2009 to 2010 % change 2010 to 2011 % change 2011 to 2012

21
The South African Food Cost Review 2012 The South African Food Cost Review 2012
Labour Figure 15 shows the regulated minimum wages for primary agriculture. This minimum wage is always revised for the beginning of the year. In the past, different wages were distinguished in two different areas, but from 2008 the wages were the same for both the areas. The minimum wage for Area A increased by 88% from 2003 to 2012 and the wage for Area B increased by 131.5%. Wages increased by 9.5% between 2011 and 2012.
Figure 15: Minimum wages (2003–2012)Source: Department of Labour, 2013
2.50
3.05
3.60
4.15
4.70
5.25
5.80
6.35
6.90
7.45
8.00
600
700
800
900
1000
1100
1200
1300
1400
1500
1600
2003
/01/
01
2004
/01/
01
2005
/01/
01
2006
/01/
01
2007
/01/
01
2008
/01/
01
2009
/01/
01
2010
/01/
01
2011
/01/
01
2012
/01/
01
R/h
our
R/m
onth
Area A Rand/month Area B Rand/month Area A Rand/Hour Area B Rand/Hour

22
The South African Food Cost Review 2012 The South African Food Cost Review 2012
4 INFLATIONARY TRENDS FOR SELECTED FOODSTUFFS
4.1 Food and non-alcoholic beveragesThe Consumer Price Index (CPI) is a social and economic indicator that is constructed to measure changes over time in the general level of the prices of consumer goods and services that households acquire, use or pay for (Stats SA, 2009). The CPI inflation rate indicates the percentage change in the CPI on an annual basis. It compares the CPI of a certain month with the CPI of the same month in the previous year. For 2012, it was 5.7%, i.e. 0.7 percentage points higher than the average headline CPI rate for 2011 (5.0%). This implies that on average, the consumer prices were 0.7% higher in 2012 than in 2011.
In order to calculate the CPI, prices for consumer goods and services are classified into 14 different categories. Each of these categories has a weight attached to it that reflects its importance in the CPI. The weights present the portions of consumption expenditure by households in a specific period. The weighted sum of changes in the price of the specific products or services in the CPI provides the rates of inflation. The weight of the food category in the CPI is 14.27, while the weight of food and non-alcoholic beverages is 15.68. Housing and utilities has the largest weight in the CPI of 22.56. Figure 16 shows the different categories and their contribution to the CPI.
Figure 16: Contribution of different categories of consumer goods and services to the CPISource: Stats SA, 2013
The average food and non-alcoholic beverages CPI for 2012 continued to increase when compared to previous years. It was recorded at an average of 127.4 index points, seven points higher than the 118.93 index points for 2011. The CPI rate for food and non-alcoholic beverages averaged 7.2% for 2012, indicating that consumers paid 7.2% more for food and non-alcoholic beverages in 2012 than they paid in 2011. Figure 17 shows the CPI for food and non-alcoholic beverages, as well as the CPI rate for food and non-alcoholic beverages.
0
10
20
30
40
50
60
70
80
90
100
Con
trib
utio
n to
CPI
(% w
eigh
t)
Health (1.47)
Education (2.19)
Restuarants and hotels (2.78)
Communication (3.22)
Clothing and footware (4.11)
Recreation and culture (4.19)
Alcoholic beverages and tobacco (5.58)
Household contents and services (5.86)
Miscellaneous goods and services (13.56)
Food and non-alcoholic beverages (15.68)
Transport (18.80)
Housing and utilities (22.56)

23
The South African Food Cost Review 2012 The South African Food Cost Review 2012
Figure 17: CPI and CPI rate of change for food and non-alcoholic beveragesSource: Stats SA, 2013
Comparing the food and non-alcoholic CPI to the headline CPI, provides an indication of the impact of the food and non-alcoholic CPI on the headline CPI. During 2012, the CPI for food and non-alcoholic beverages was higher than the headline CPI rate. This was similar to the experience in 2011 where the CPI rate for food and non-alcoholic beverages exceeded the headline CPI rate. Figure 18 shows the headline CPI and the CPI for food and non-alcoholic beverages.
Figure 18: Headline CPI rate and CPI rate of change for food and non-alcoholicbeveragesSource: Stats SA, 2013
A comparison of the CPI for food and non-alcoholic beverages in the different provinces in South Africa shows that the Northern Cape, Western Cape and Eastern Cape experienced the highest increases in food prices in the country. The North West and Limpopo experienced the lowest increases in food and non-alcoholic beverages prices. Figure 19 shows the CPI for food and non-alcoholic beverages for the different provinces on a monthly basis for 2012.
0
5
10
15
20
0 20 40 60 80
100 120 140
Jan-
08
Apr-
08
Jul-0
8
Oct
-08
Jan-
09
Apr-
09
Jul-0
9
Oct
-09
Jan-
10
Apr-
10
Jul-1
0
Oct
-10
Jan-
11
Apr-
11
Jul-1
1
Oct
-11
Jan-
12
Apr-
12
Jul-1
2
Oct
-12
Food
CPI
rate
(%)
Inde
x (2
008
= 10
0)
Food and non alcoholic beverages (index ) Food and non alcoholic beverages (% change)
0
5
10
15
20
Jan-
08
Apr-
08
Jul-0
8
Oct
-08
Jan-
09
Apr-
09
Jul-0
9
Oct
-09
Jan-
10
Apr-
10
Jul-1
0
Oct
-10
Jan-
11
Apr-
11
Jul-1
1
Oct
-11
Jan-
12
Apr-
12
Jul-1
2
Oct
-12
CPI
rate
(%)
Food and non alcoholic beverages (% change) CPI Headline
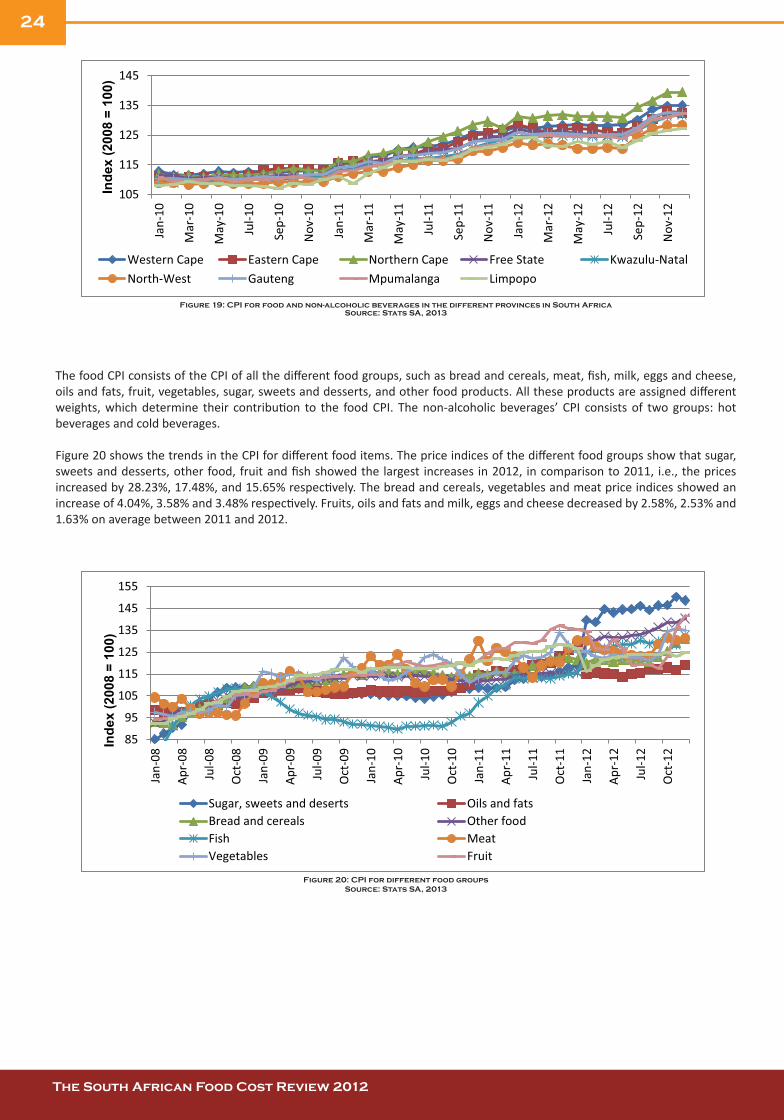
24
The South African Food Cost Review 2012 The South African Food Cost Review 2012
Figure 19: CPI for food and non-alcoholic beverages in the different provinces in South AfricaSource: Stats SA, 2013
The food CPI consists of the CPI of all the different food groups, such as bread and cereals, meat, fish, milk, eggs and cheese, oils and fats, fruit, vegetables, sugar, sweets and desserts, and other food products. All these products are assigned different weights, which determine their contribution to the food CPI. The non-alcoholic beverages’ CPI consists of two groups: hot beverages and cold beverages.
Figure 20 shows the trends in the CPI for different food items. The price indices of the different food groups show that sugar, sweets and desserts, other food, fruit and fish showed the largest increases in 2012, in comparison to 2011, i.e., the prices increased by 28.23%, 17.48%, and 15.65% respectively. The bread and cereals, vegetables and meat price indices showed an increase of 4.04%, 3.58% and 3.48% respectively. Fruits, oils and fats and milk, eggs and cheese decreased by 2.58%, 2.53% and 1.63% on average between 2011 and 2012.
Figure 20: CPI for different food groups Source: Stats SA, 2013
105
115
125
135
145
Jan-
10
Mar
-10
May
-10
Jul-1
0
Sep-
10
Nov
-10
Jan-
11
Mar
-11
May
-11
Jul-1
1
Sep-
11
Nov
-11
Jan-
12
Mar
-12
May
-12
Jul-1
2
Sep-
12
Nov
-12
Inde
x (2
008
= 10
0)
Western Cape Eastern Cape Northern Cape Free State Kwazulu-Natal North-West Gauteng Mpumalanga Limpopo
85
95
105
115
125
135
145
155
Jan-
08
Apr-
08
Jul-0
8
Oct
-08
Jan-
09
Apr-
09
Jul-0
9
Oct
-09
Jan-
10
Apr-
10
Jul-1
0
Oct
-10
Jan-
11
Apr-
11
Jul-1
1
Oct
-11
Jan-
12
Apr-
12
Jul-1
2
Oct
-12 In
dex
(200
8 =
100)
Sugar, sweets and deserts Oils and fats Bread and cereals Other food Fish Meat Vegetables Fruit

25
The South African Food Cost Review 2012 The South African Food Cost Review 2012
The price index for processed and unprocessed products is shown in Figure 21. The index of prices for processed and unprocessed food products increased by 7.8% and 7.2% respectively on average from 2011 to 2012.
Figure 21: CPI for processed and unprocessed productsSource: Stats SA, 2013
4.2 Urban food price trendsThis section provides insight pertaining to the average retail prices of specific food items in urban areas for 2012 and how they compared to the retail prices for 2011 and 2010.
Selected retail prices in the bread and cereal group are shown in Table 9. On average, the retail price of bread and cereals increased by 11.45% from 2011 to 2012. Maize meal prices increased by 46.18% and 22.07% for special maize meal 5kg and super maize meal 5kg respectively. Rice prices also showed an increase of 9.49% and 4.81% for rice 1kg and rice 2kg respectively.
85
95
105
115
125
135
145 Ja
n-08
Apr-
08
Jul-0
8
Oct
-08
Jan-
09
Apr-
09
Jul-0
9
Oct
-09
Jan-
10
Apr-
10
Jul-1
0
Oct
-10
Jan-
11
Apr-
11
Jul-1
1
Oct
-11
Jan-
12
Apr-
12
Jul-1
2
Oct
-12
Inde
x (2
008
= 10
0)
Processed Unprocessed

26
The South African Food Cost Review 2012 The South African Food Cost Review 2012
Table 9: Average annual retail prices for certain food items in the bread and cereal group
Bread and cereals 2010 2011 2012Percentage change
2010–2012
Percentage change
2011–2012Cake flour 1 kg 8.66 9.77 10.00 15.54 2.35
Cake flour 2.5 kg 16.14 18.37 19.05 18.02 3.72
Cereals 300 g 18.20 19.07 20.72 13.87 8.66
Cereals 400 g 25.76 27.58 28.20 9.45 2.23
Cereals 450 g 16.78 16.97 18.93 12.80 11.55
Cereals 500 g 22.05 23.71 25.64 16.25 8.14
Cereals 750 g 29.30 30.89 33.46 14.22 8.33
Loaf of brown bread 600 g 4.93 5.11 5.31 7.55 3.85
Loaf of brown bread 700 g 7.08 7.77 8.45 19.25 8.64
Loaf of white bread 600 g 5.90 6.00 6.14 4.04 2.26
Loaf of white bread 700 g 7.91 8.72 9.46 19.55 8.49
Maize special 5 kg* 16.58 18.43 26.95 62.56 46.18
Maize super 5 kg* 21.78 25.11 30.65 40.71 22.07
Rice 500 g 7.09 6.66 6.86 -3.15 3.04
Rice 1 kg 13.99 12.70 13.91 -0.58 9.49
Rice 2 kg 21.36 20.52 21.51 0.68 4.81
Spaghetti 500 g 9.49 9.30 9.38 -1.11 0.92
Macaroni plain 500 g* 7.82 8.14 8.49 8.68 4.33
Porridge 500 g 17.07 17.92 20.31 18.98 13.36Source: Stats SA; *AC Nielsen, 2013
Table 10 shows the retail prices of selected meat products from 2010 to 2012. Meat products that showed significant increases were beef mince, beef rump steak, beef chuck and beef brisket, which increased by 11.88%, 10.20%, 9.99% and 9.83% respectively from 2011 to 2012. The average retail price of pork chops increased by 6.30% from 2011 (R52.25 per kg) to 2011 (R55.54 per kg). Fresh chicken portions and whole fresh chicken prices increased by 8.20% and 8.78% respectively, while frozen chicken portions and whole frozen chicken prices increased by 4.29% and 7.85% respectively over the same period.

27
The South African Food Cost Review 2012 The South African Food Cost Review 2012
Table 10: Average annual retail prices for certain food items in the meat group
Meat 2010 2011 2012Percentage change
2010–2012
Percentage change
2011–2012Beef brisket – fresh per kg 45.29 52.40 57.55 27.07 9.83
Beef chuck – fresh per kg 47.01 53.55 58.90 25.29 9.99
Beef mince – fresh per kg 47.68 53.95 60.36 26.59 11.88
Beef rump steak – fresh per kg 76.49 84.77 93.42 22.13 10.20
Beef T-bone – fresh per kg 60.66 69.64 75.9 25.12 8.99
Chicken portions – fresh per kg 37.67 38.76 41.94 11.34 8.20
Chicken portions – frozen per kg 22.04 22.55 23.66 7.35 4.92
Ham per kg 94.26 92.15 88.66 -5.94 -3.79
Lamb – fresh per kg 74.36 91.33 93.13 25.24 1.97
Polony per kg 26.32 28.05 29.04 10.33 3.53
Pork chops – fresh per kg 49.38 52.25 55.54 12.47 6.30
Pork sausage per kg 52.64 56.51 59.82 13.64 5.86
Whole chicken – fresh per kg 28.28 29.60 32.20 13.86 8.78
Whole chicken – frozen per kg 24.53 25.23 27.21 10.93 7.85Source: Stats SA; *AC Nielsen, 2013
The prices of selected fish products for 2012 are presented in Table 11. The retail prices of tinned fish (excluding tuna) 155g, 215g and 245g increased by 9.83%, 7.86% and 6.61% respectively from 2011 to 2012. The retail price of tinned tuna 170g increased by 19.80% during the same period.
Table 11: Average annual retail prices for certain food items in the fish group
Fish 2010 2011 2012Percentage change
2010–2012
Percentage change
2011–2012Fish (excluding tuna) – tinned 155 g 6.28 6.29 6.90 9.90 9.83
Fish (excluding tuna) – tinned 215 g 8.40 8.17 8.81 4.96 7.86
Fish (excluding tuna) – tinned 400 g 12.77 13.11 13.39 4.85 2.14
Fish (excluding tuna) – tinned 425 g 12.08 11.33 12.08 0.00 6.61
Tuna – tinned 170 g 10.20 9.86 11.82 15.82 19.80Source: Stats SA, 2013
The retail prices for full cream milk – fresh 1ℓ, and low fat milk – fresh 1ℓ decreased by 10.95%, and 17.79% respectively between 2011 and 2012 (see Table 12). The retail price of powdered milk 1 kg, increased by 16.03% between 2011 and 2012. The price of total butter 500g increased by 13.21% over the same period.

28
The South African Food Cost Review 2012 The South African Food Cost Review 2012
Table 12: Average annual retail prices for certain food items in the milk group
Milk 2010 2011 2012Percentage change
2010–2012
Percentage change
2011–2012
Fresh milk full cream 1 ℓ* 6.77 8.37 7.45 10.04 -10.95
Fresh milk full cream 2 ℓ* 15.16 16.24 17.40 14.77 7.13
Fresh milk low fat 1 ℓ* 6.67 9.30 7.64 14.57 -17.79
Fresh milk low fat 2 ℓ* 15.75 15.71 17.72 12.56 12.84
Skimmed powder milk 1 kg* 56.01 60.47 70.16 25.27 16.03
Total butter 500 g* 25.43 26.92 30.48 19.86 13.21Source: Stats SA; *AC Nielsen, 2013
Table 13 shows the average retail price of eggs and cheese. The retail price of eggs increased by 6.12%, 6.28% and 6.13% respectively for 0.5 dozen, 1.5 dozen and 2.5 dozen respectively between 2011 and 2012. However, when comparing the average retail price of eggs in 2011 with those in 2009, the prices increased by 5.79%, 5.23% and 4.12% for 0.5 dozen and 1.5 dozen respectively. Two-and-half dozen eggs decreased by 3.53% over the same period. The retail price of cheddar cheese increased by 7.91% between 2011 and 2012.
Table 13: Average annual retail prices for eggs and cheese
Eggs 2010 2011 2012Percentage change
2010–2012
Percentage change
2011–2012
Eggs 0.5 dozen 9.30 9.28 9.84 5.79 6.12
Eggs 1.5 dozen 25.10 24.85 26.41 5.23 6.28
Eggs 2.5 dozen 34.37 33.72 35.79 4.12 6.13
Cheese
Cheddar cheese per kg 86.85 87.41 94.32 8.60 7.91Source: Stats SA, 2013
The retail prices for the oils and fats increased from 2011 to 2012 as shown in Table 14. The price of sunflower oil 4ℓ, sunflower oil 750mℓ, margarine spread 1kg and brick margarine 250g increased by 1.56%, 4.38%, 6.11% and 1.46% respectively. The retail price of peanut butter 400g increased by 15.40% between 2011 and 2012.

29
The South African Food Cost Review 2012 The South African Food Cost Review 2012
Table 14: Average annual retail prices for certain food items in the oils
and fats group
Oils and fats 2010 2011 2012Percentage change
2010–2012
Percentage change
2011–2012
Brick margarine 250 g 9.30 10.27 10.42 11.99 1.46
Margarine spread 250 g 27.49 32.57 32.87 19.58 0.94
Margarine spread 1 kg 15.19 18.07 19.18 26.24 6.11
Medium fat spread 1 kg tub* 19.70 20.58 23.36 18.57 13.51
Total butter 500 g* 25.43 26.92 30.48 19.86 13.21
Sunflower oil 750 mℓ 13.26 16.09 16.79 26.64 4.38
Sunflower oil 4 ℓ 50.35 65.87 66.90 32.87 1.56
Peanut butter 400 g 15.59 18.01 20.78 33.29 15.40Source: Stats SA; *AC Nielsen, 2013
The retail price of oranges and bananas increased by 7.77% and 6.01% respectively between 2011 and 2012 (see Table 15). The retail price of apples slightly increased by 2.26% between 2011 and 2012. However, when comparing the retail price of fruits in 2010 and 2012, all categories showed increases.
Table 15: Average annual retail prices for fruit
Fruit 2010 2011 2012Percentage
change
2010–2012
Percentage change
2011–2012
Apples – fresh per kg 12.29 13.25 13.55 10.27 2.26
Bananas – fresh per kg 9.68 10.38 11.00 13.64 6.01
Oranges – fresh per kg 7.37 7.30 7.87 6.73 7.77Source: Stats SA, 2013
Table 16 shows the average retail prices for selected vegetable products (fresh vegetables, as well as processed vegetables). Lettuce and sweet potatoes showed the largest price increases. Urban consumers paid 46.56% and 42.53% more for lettuce and sweet potatoes respectively between 2011 and 2012. The average retail price of baked beans experienced the largest decrease (17.83%) between 2011 and 2012.

30
The South African Food Cost Review 2012 The South African Food Cost Review 2012
Table 16: Average annual retail prices for certain food items in the vegetable group
Vegetables 2010 2011 2012Percentage change
2010–2012
Percentage change
2011–2012
Baby carrots 1 kg* 30.86 31.24 34.48 11.75 10.37
Baked beans – tinned 410 g 6.29 6.29 6.48 3.14 3.17
Baked beans – tinned 420 g 7.73 8.46 6.95 -10.09 -17.83
Butter beans – tinned 400 g 10.43 11.55 11.19 7.36 -3.10
Butter beans – tinned 410 g 10.72 11.05 11.90 11.08 7.75
Butter beans – tinned 420 g 12.38 12.45 13.19 6.53 5.99
Canned peas 410 g* 6.83 8.42 8.31 21.56 -1.36
Carrots – fresh per kg 10.99 11.56 11.77 7.10 1.88
Carrots – frozen 1 kg 26.91 29.50 31.92 18.62 8.20
Cauliflower – fresh per kg 24.80 28.24 30.58 23.33 8.27
Chopped peeled tomato 410 g* 10.71 11.23 11.85 10.60 5.50
Green peas 1 kg* 24.91 26.82 29.48 18.36 9.93
Lettuce – fresh per kg 21.24 25.80 37.81 77.99 46.56
Peas – frozen 1 kg 24.56 24.94 28.51 16.10 14.31
Onions – fresh per kg 9.52 8.25 8.28 -13.02 0.37
Sliced beans 1 kg* 29.62 29.04 25.44 -14.13 -12.42
Potatoes – fresh per kg 9.94 9.21 9.03 -9.13 -1.95
Pumpkin – fresh per kg 11.51 11.25 13.56 17.82 20.56
Sweet corn – tinned 410 g 8.62 8.91 9.27 7.49 4.09
Sweet corn – tinned 420 g 9.58 10.10 9.85 2.88 -2.47
Sweet potatoes – fresh per kg 9.94 10.14 14.45 45.36 42.53
Tomato and onion mix 410 g* 8.39 11.92 15.64 86.42 31.19
Tomatoes – fresh per kg 14.63 8.77 9.86 -32.62 12.46Source: Stats SA; *AC Nielsen, 2013

31
The South African Food Cost Review 2012 The South African Food Cost Review 2012
The retail price of sugar continued to increase, as shown in Table 17. The retail price of white sugar 1kg and white sugar 2.5kg increased by 11.31% and 9.92% respectively from 2010 to 2011. When comparing the sugar prices between 2010 and 2012, an increase of 25.91% and 21.00% was seen for 1kg and 2.5kg of sugar respectively.
Table 17: Average annual retail prices for sugar
Sugar and sweets 2010 2011 2012Percentage
change
2010–2012
Percentage change
2011–2012
White sugar 1 kg 9.33 10.55 11.75 25.91 11.31
White sugar 2.5 kg 18.80 21.07 22.74 21.00 7.92Source: Stats SA, 2013
The retail price of 250 g instant coffee, 750g instant coffee and 100g instant coffee increased by 10.86%, 8.49% and 1.44% respectively between 2011 and 2012 (Table 18). The retail price of 62.5g Ceylon black tea, 250g Ceylon black tea and 500g Ceylon black tea increased by 3.97%, 2.74% and 6.23% respectively during the same period. However, the price of 125g Ceylon tea decreased by 4.60% between 2011 and 2012.
Table 18: Average annual retail prices for tea and coffee
Tea and coffee 2010 2011 2012Percentage change
2010–2012
Percentage change
2011–2012
Ceylon black tea 62.5 g 7.23 7.31 7.60 5.12 3.97
Ceylon black tea 125 g 16.12 15.88 15.15 -6.02 -4.60
Ceylon black tea 250 g 17.74 18.27 18.77 5.81 2.74
Ceylon black tea 500 g 32.92 34.68 36.84 11.91 6.23
Instant coffee 100 g 19.57 21.57 21.88 11.80 1.44
Instant coffee 250 g 22.56 24.49 27.15 20.35 10.86
Instant coffee 750 g 50.53 53.80 58.37 15.52 8.49Source: Stats SA, 2013

32
The South African Food Cost Review 2012 The South African Food Cost Review 2012
4.3 Rural food price trendsThis section provides an insight into the average price of specific food items in rural areas for 2012 and how they compare to the prices of 2011 and 2010.
Table 19 shows that in 2012, consumers in rural areas paid 2.15% more on average for a loaf of brown bread (700 g) and 2.94% more for a loaf of white bread (700g) than in 2011. The average price of 2kg of rice increased by 4.44% between 2011 and 2012. Consumers in the rural areas also paid 22.62% more in 2012 for maize meal 5kg than they paid in 2011.
Table 19: Average annual retail prices for bread and cereals in rural areas
Bread and cereals 2010 2011 2012Percentage change
2010–2012
Percentage change
2011–2012
Loaf of brown bread 600 g 6.55 7.10 7.37 12.54 3.80
Loaf of brown bread 700 g 7.05 7.75 7.92 12.31 2.15
Loaf of white bread 600 g 7.13 7.77 8.11 13.65 4.37
Loaf of white bread 700 g 7.81 8.70 8.95 14.65 2.94
Maize meal 12.5 kg 50.94 55.66 65.40 28.39 17.51
Maize meal 1 kg 6.44 6.66 6.54 1.55 -1.87
Maize meal 2.5 kg 14.37 14.98 16.94 17.86 13.07
Maize meal 5 kg 26.08 26.40 32.37 24.14 22.62
Rice 1 kg 13.78 12.83 12.83 -6.86 0.00
Rice 2 kg 27.17 25.18 26.30 -3.19 4.44
Rice 500 g 7.13 7.03 7.42 4.04 5.52
Samp 1 kg 6.48 6.55 7.32 12.97 11.79
Samp 2.5 kg 13.52 13.87 15.19 12.35 9.48
Sorghum meal 1 kg 10.91 11.04 11.62 6.56 5.33
Sorghum meal 500 g 6.13 6.28 6.80 10.91 8.25Source: Stats SA, 2013

33
The South African Food Cost Review 2012 The South African Food Cost Review 2012
The average price of 2ℓ sunflower oil, 750mℓ sunflower oil, 500g margarine and 125g margarine increased by 6.69%, 5.10%, 3.14% and 10.34% respectively between 2011 and 2012 (Table 20). The average price of 410g peanut butter decreased by 52.46% during the same period. It is evident in the table that the prices of peanut butter showed some significant increases between 2011 and 2012.
Table 20 : Average annual retail prices for oils and fats in rural areas
Oils and fats 2010 2011 2012Percentage change
2010–2012
Percentage change
2011–2012
Margarine 125 g 5.78 6.47 7.14 23.39 10.34
Margarine 250 g 9.87 10.73 10.79 9.37 0.51
Margarine 500 g 14.97 16.83 17.36 15.96 3.14
Peanut butter 270 g 13.02 13.23 15.27 17.24 15.44
Peanut butter 400 g 16.82 17.57 20.91 24.32 19.01
Peanut butter 410 g 13.39 12.44 18.97 41.70 52.46
Sunflower oil 2 ℓ 25.19 31.41 33.51 33.03 6.69
Sunflower oil 500 mℓ 9.39 10.64 10.85 15.54 2.02
Sunflower oil 750 mℓ 13.06 13.82 14.53 11.25 5.10Source: Stats SA, 2013
Table 21 shows the average retail prices of beans as paid by consumers in rural areas in 2012. The price of 1 kg beans, 500 g beans, 420g butter beans, 410g butter beans and increased by 20.24%, 14.70%, 4.39% and 3.23% respectively between 2011 and 2012.

34
The South African Food Cost Review 2012 The South African Food Cost Review 2012
Table 21: Average annual retail prices for beans in rural areas
Vegetables 2010 2011 2012Percentage change
2010–2012
Percentage change
2011–2012
Beans 1 kg 14.04 14.38 17.29 23.18 20.24
Beans 500 g 8.47 8.21 9.41 11.21 14.70
Butter beans 410 g 9.32 10.03 10.35 11.04 3.23
Butter beans 420 g 8.16 8.97 9.37 14.76 4.39Source: Stats SA, 2013
Consumers in rural areas paid 3.05% and 1.64% more for 500mℓ full cream long life milk and 1ℓ full cream long life milk respectively in 2012 when compared to 2011 (Table 22).
Table 22: Average annual retail prices for milk in rural areas
Milk 2010 2011 2012Percentage change
2010–2012
Percentage change
2011–2012
Full cream long life milk 1 ℓ 10.87 11.01 11.19 2.92 1.64
Full cream long life milk 500 mℓ 6.70 6.87 7.08 5.70 3.05Source: Stats SA, 2013
Table 23 shows the price of tagless tea bags and instant coffee paid by consumers from 2010 to 2012. The average price of tagless teabags decreased and instant coffee increased between 2011 and 2012, with the price of 250g and 62.5g tagless tea bags decreasing by 1.82% and 6.39% respectively. The price of 100g and 250g instant coffee increased by 7.05% and 6.51% respectively during the same period.
Table 23: Average annual retail prices for tea and coffee in rural areas
Tea and coffee 2010 2011 2012Percentage change
2010–2012
Percentage change
2011–2012
Tagless tea bags 250 g 18.87 19.01 18.66 -1.11 -1.82
Tagless tea bags 62.5 g 7.99 8.03 7.52 -5.98 -6.39
Instant coffee 100 g 13.00 13.42 14.37 10.50 7.05
Instant coffee 250 g 26.07 27.12 28.88 10.78 6.51Source: Stats SA, 2013

35
The South African Food Cost Review 2012 The South African Food Cost Review 2012
The retail price of sugar in the rural areas showed an increase of 9.82%, 8.23% and 6.16% for 2.5kg white sugar; 1kg white sugar and 500g white sugar respectively between 2011 and 2012 (see Table 24).
Table 24: Average annual retail prices of sugar in rural areas
Sugar 2010 2011 2012Percentage change
2010–2012
Percentage change
2011–2012
White sugar 1 kg 9.62 10.45 11.47 19.28 9.82
White sugar 2.5 kg 21.70 23.71 25.66 18.23 8.23
White sugar 500 g 5.37 5.76 6.12 13.89 6.16Source: Stats SA, 2013
4.4 Comparison between rural and urban food pricesTable 25 compares the prices of selected products in rural and urban areas. In 2012, consumers in rural areas paid R1.28 less for the basket of products included in Table 25. In 2011, rural consumers paid R9.89 more for the same basket. Products that had significantly higher price differences were 2kg rice, Ceylon black tea 250g and white sugar 2.5kg.
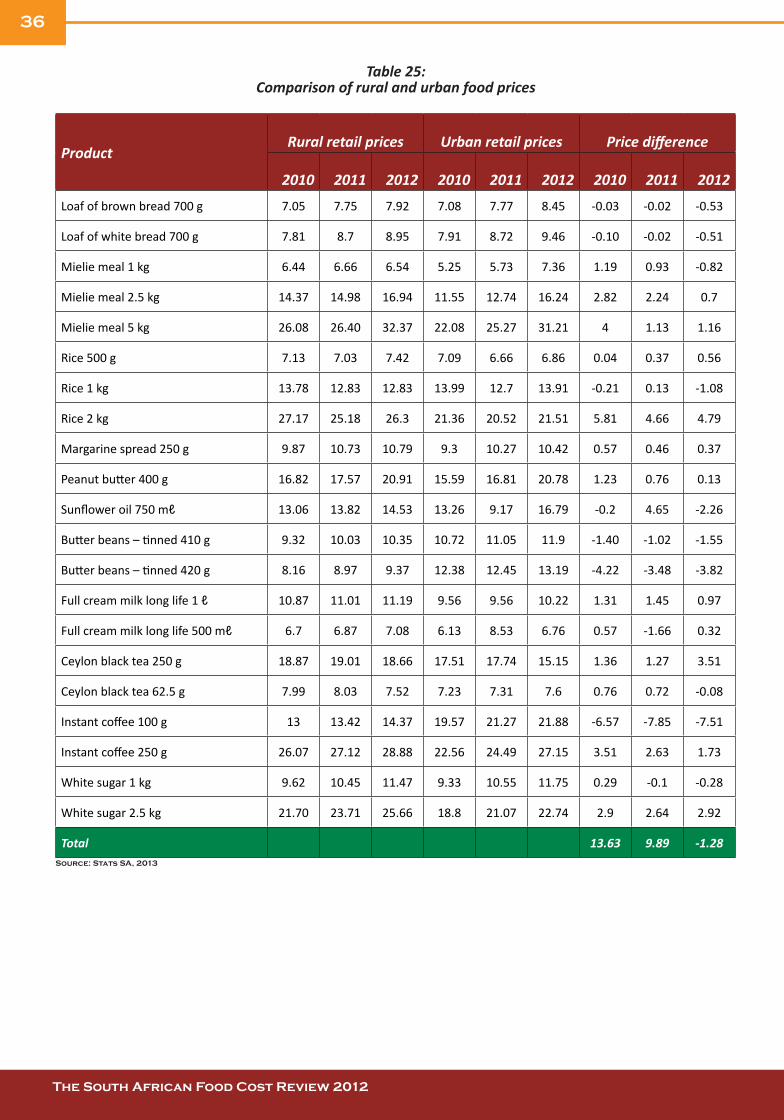
36
The South African Food Cost Review 2012 The South African Food Cost Review 2012
Table 25: Comparison of rural and urban food prices
ProductRural retail prices Urban retail prices Price difference
2010 2011 2012 2010 2011 2012 2010 2011 2012
Loaf of brown bread 700 g 7.05 7.75 7.92 7.08 7.77 8.45 -0.03 -0.02 -0.53
Loaf of white bread 700 g 7.81 8.7 8.95 7.91 8.72 9.46 -0.10 -0.02 -0.51
Mielie meal 1 kg 6.44 6.66 6.54 5.25 5.73 7.36 1.19 0.93 -0.82
Mielie meal 2.5 kg 14.37 14.98 16.94 11.55 12.74 16.24 2.82 2.24 0.7
Mielie meal 5 kg 26.08 26.40 32.37 22.08 25.27 31.21 4 1.13 1.16
Rice 500 g 7.13 7.03 7.42 7.09 6.66 6.86 0.04 0.37 0.56
Rice 1 kg 13.78 12.83 12.83 13.99 12.7 13.91 -0.21 0.13 -1.08
Rice 2 kg 27.17 25.18 26.3 21.36 20.52 21.51 5.81 4.66 4.79
Margarine spread 250 g 9.87 10.73 10.79 9.3 10.27 10.42 0.57 0.46 0.37
Peanut butter 400 g 16.82 17.57 20.91 15.59 16.81 20.78 1.23 0.76 0.13
Sunflower oil 750 mℓ 13.06 13.82 14.53 13.26 9.17 16.79 -0.2 4.65 -2.26
Butter beans – tinned 410 g 9.32 10.03 10.35 10.72 11.05 11.9 -1.40 -1.02 -1.55
Butter beans – tinned 420 g 8.16 8.97 9.37 12.38 12.45 13.19 -4.22 -3.48 -3.82
Full cream milk long life 1 ℓ 10.87 11.01 11.19 9.56 9.56 10.22 1.31 1.45 0.97
Full cream milk long life 500 mℓ 6.7 6.87 7.08 6.13 8.53 6.76 0.57 -1.66 0.32
Ceylon black tea 250 g 18.87 19.01 18.66 17.51 17.74 15.15 1.36 1.27 3.51
Ceylon black tea 62.5 g 7.99 8.03 7.52 7.23 7.31 7.6 0.76 0.72 -0.08
Instant coffee 100 g 13 13.42 14.37 19.57 21.27 21.88 -6.57 -7.85 -7.51
Instant coffee 250 g 26.07 27.12 28.88 22.56 24.49 27.15 3.51 2.63 1.73
White sugar 1 kg 9.62 10.45 11.47 9.33 10.55 11.75 0.29 -0.1 -0.28
White sugar 2.5 kg 21.70 23.71 25.66 18.8 21.07 22.74 2.9 2.64 2.92
Total 13.63 9.89 -1.28Source: Stats SA, 2013

37
The South African Food Cost Review 2012 The South African Food Cost Review 2012
5 TRENDS IN PRICES, FARM VALUES AND PRICE SPREADS
5.1 IntroductionThis section provides an overview of the price trends for selected products. Where information is available, international trends are discussed. This section also provides more detail on the different cost components that contribute to the margin between farm gate prices and the price the consumer pays for selected food items. This is done, among others, by investigating the farm values of selected products and the farm-to-retail price spreads (FTRPS). The farm value is the value of the farm’s products equivalent in the final food product purchased by consumers.
Farm values are calculated by multiplying disappearance in quantities on a farm weight basis with the prices received by the farmers. The farm value does not include the value of by-products. The farm value share is computed by dividing the farm value by consumer food expenditures, and is reported in percentages. Over time, the share reflects relative changes in expenditure for farm products, food marketing services and retail food products. The FTRPS is the difference between what the consumer pays for the retail food product and the value of the farm products used in that product. Price spreads measure the aggregate contributions of food manufacturing, distribution, wholesaling and retailing firms that transform farm commodities into final food products.
5.2 Price trends in the meat sector5.2.1 Poultry industry
Figure 22 shows the FAO Poultry Meat Price Index, Brazil export value for chicken and the USA export unit value of broiler cuts. According to the FAO, the Poultry Meat Price Index decreased by 2.4% between 2011 and 2012.
Figure 22: International poultry price trendsSource: FAO, 2013; IMF, 2013
62 78 94 110 126 142 158 174 190 206 222 238
700 900
1100 1300 1500 1700 1900 2100 2300
Jan-
08
Apr-
08
Jul-0
8
Oct
-08
Ja
n-09
Ap
r-09
Ju
l-09
Oct
-09
Ja
n-10
Ap
r-10
Ju
l-10
Oct
-10
Ja
n-11
Ap
r-11
Ju
l-11
Oct
-11
Ja
n-12
Ap
r-12
Jul-1
2
Oct
-12
Inde
x (2
002-
04 =
100
)
Pric
e (U
S$/to
n)
USA, Broiler cuts, export unit value Brazil, export value for chicken, fob
FAO poultry meat price index

38
The South African Food Cost Review 2012 The South African Food Cost Review 2012
The retail prices for selected poultry products are shown in Figure 23. The retail price of fresh whole chickens increased by 8.7% between 2011 and 2012, while the retail price of frozen whole chickens, fresh chicken portions and frozen chicken portions increased by 7.9%, 8.2% and 4.9% respectively between 2011 and 2012.
Retail prices in real terms showed a positive trend for poultry meat with the exception of frozen chicken portions. In real terms, the annual retail price for frozen chicken portions decreased by 0.7% between 2011 and 2012 while, fresh chicken portions, frozen whole chickens and fresh whole chickens increased by 2.4%, 2%, and 2.8% respectively between 2011 and 2012.
Figure 23: Poultry retail price trendsSource: Stats SA, 2013
Figure 24 shows the trends in the producer prices of poultry. The annual average producer price of frozen chicken increased by 6.8% (from R15.08/kg in 2011 to R116.11/kg in 2012). The annual average producer price of fresh chicken decreased by 1.4% (from R18.39/kg in 2011 to R18.14/kg during the period under review). Compared to 2008 price levels, the 2012 annual average price of fresh and frozen chickens increased by 8.5% and 12.6% respectively.
In real terms, frozen chicken producer prices increased by 1% between 2011 and 2012, whereas the fresh chicken producer price decreased by 6.7% over the same period. When compared to 2008, real producer prices decreased by 12.2% and 9.1% for fresh and frozen chicken respectively.
Figure 24: Poultry producer price trendsSource: AMT, 2013
15
20
25
30
35
40
45
50
Jan-
08
Mar
-08
Ma y
-08
Jul-0
8 Se
p-08
N
ov-0
8 Ja
n-09
M
ar-0
9 M
a y-0
9 Ju
l-09
Sep-
09
Nov
-09
Jan-
10
Mar
-10
Ma y
-10
Jul-1
0 Se
p-10
N
ov-1
0 Ja
n-11
M
ar-1
1 M
ay-1
1 Ju
l-11
Sep-
11
Nov
-11
Jan-
12
Mar
-12
May
-12
Jul-1
2 Se
p-12
N
ov-1
2
Ret
ail p
rice
(R/k
g)
Chicken portions - fresh Chicken portions - frozen
Whole chicken - fresh Whole chicken - frozen
10
12
14
16
18
20
22
Jan-
08
Mar
-08
M
ay-0
8
Jul-0
8
Sep
-08
N
ov-0
8
Jan-
09
Mar
-09
M
ay-0
9
Jul-0
9
Sep
-09
N
ov-0
9
Jan-
10
Mar
-10
M
ay-1
0
Jul-1
0
Sep
-10
N
ov-1
0
Jan-
11
Mar
-11
M
ay-1
1
Jul-1
1
Sep
-11
N
ov-1
1
Jan-
12
Mar
-12
M
ay -1
2 Ju
l-12
S
ep-1
2
Nov
-12
Prod
ucer
pric
e (R
/kg)
Producer price chicken - frozen Producer price chicken-fresh

39
The South African Food Cost Review 2012 The South African Food Cost Review 2012
The real FTRPS and farm value share of fresh whole chickens are shown in Figure 25. The real FTRPS of fresh whole chickens increased by 18.7%, on average, between 2011 and 2012. During the same period, the farm value share of fresh whole chicken decreased by 9.3%. The average farm value share for fresh whole chicken per kg in 2012 was 56.34%.
Figure 25: Real farm-to-retail price spread and farm value share of poultrySource: Stats SA, 2013; AMT, 2013 and own calculations
5.2.2 Beef
Figure 26 shows the international beef price trends. According to the FAO Bovine Meat Price Index, the annual average international beef price increased by 1% between 2011 and 2012. When comparing the figures for 2010 and 2012, the annual average international beef price increased by 15%.
Figure 26: International beef price trendsSource: FAO, 2013; IMF, 2013
50
55
60
65
70
75
4
6
8
10
12
14
Jan-
08
Mar
-08
May
-08
Jul-0
8 S
ep-0
8 N
ov-0
8 Ja
n-09
M
ar-0
9 M
ay-0
9 Ju
l-09
Sep
-09
Nov
-09
Jan-
10
Mar
-10
May
-10
Jul-1
0 S
ep-1
0 N
ov-1
0 Ja
n-11
M
ar-1
1 M
ay-1
1 Ju
l-11
Sep
-11
Nov
-11
Jan-
12
Mar
-12
May
-12
Jul-1
2 S
ep-1
2 N
ov-1
2
Farm
Val
ue S
hare
(%)
Farm
-to-R
etai
l Pric
e Sp
read
(R/k
g)
Real Farm-to-Retail Price Spread Farm Value Share
100 110 120 130 140 150 160 170 180 190 200 210
3 000 3 500 4 000 4 500 5 000 5 500 6 000 6 500 7 000 7 500
Jan-
08
Mar
-08
M
ay-0
8
Jul-0
8
Sep
-08
N
ov-0
8
Jan-
09
Mar
-09
M
ay-0
9
Jul-0
9 S
ep-0
9
Nov
-09
Ja
n-10
M
ar-1
0
May
-10
Ju
l-10
S
ep-1
0
Nov
-10
Ja
n-11
M
ar-1
1
May
-11
Ju
l-11
S
ep-1
1
Nov
-11
Ja
n-12
M
ar-1
2
May
-12
Ju
l-12
S
ep-1
2
Nov
-12
Inde
x (2
002-
04 =
100
)
Pric
e (U
S$/to
n)
Japan, beef import price, cif, chilled beef cuts USA, beef export price
FAO Bovine meat price index
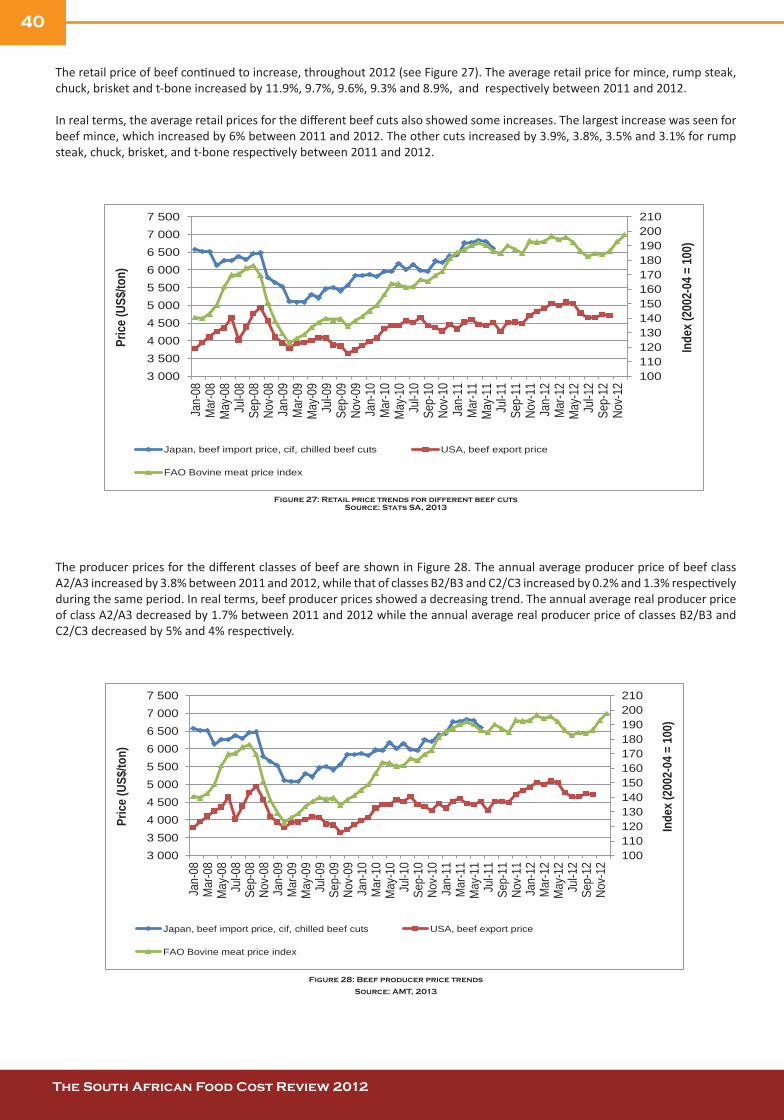
40
The South African Food Cost Review 2012 The South African Food Cost Review 2012
The retail price of beef continued to increase, throughout 2012 (see Figure 27). The average retail price for mince, rump steak, chuck, brisket and t-bone increased by 11.9%, 9.7%, 9.6%, 9.3% and 8.9%, and respectively between 2011 and 2012.
In real terms, the average retail prices for the different beef cuts also showed some increases. The largest increase was seen for beef mince, which increased by 6% between 2011 and 2012. The other cuts increased by 3.9%, 3.8%, 3.5% and 3.1% for rump steak, chuck, brisket, and t-bone respectively between 2011 and 2012.
Figure 27: Retail price trends for different beef cuts Source: Stats SA, 2013
The producer prices for the different classes of beef are shown in Figure 28. The annual average producer price of beef class A2/A3 increased by 3.8% between 2011 and 2012, while that of classes B2/B3 and C2/C3 increased by 0.2% and 1.3% respectively during the same period. In real terms, beef producer prices showed a decreasing trend. The annual average real producer price of class A2/A3 decreased by 1.7% between 2011 and 2012 while the annual average real producer price of classes B2/B3 and C2/C3 decreased by 5% and 4% respectively.
Figure 28: Beef producer price trends
Source: AMT, 2013
100 110 120 130 140 150 160 170 180 190 200 210
3 000 3 500 4 000 4 500 5 000 5 500 6 000 6 500 7 000 7 500
Jan-
08
Mar
-08
May
-08
Jul-0
8
Sep-
08
Nov-
08
Jan-
09
Mar
-09
May
-09
Jul-0
9 Se
p-09
Nov-
09
Jan-
10
Mar
-10
May
-10
Jul-1
0
Sep-
10
Nov-
10
Jan-
11
Mar
-11
May
-11
Jul-1
1
Sep-
11
Nov-
11
Jan-
12
Mar
-12
May
-12
Jul-1
2
Sep-
12
Nov-
12
Inde
x (20
02-0
4 = 10
0)
Price
(US$
/ton)
Japan, beef import price, cif, chilled beef cuts USA, beef export price FAO Bovine meat price index
100 110 120 130 140 150 160 170 180 190 200 210
3 000 3 500 4 000 4 500 5 000 5 500 6 000 6 500 7 000 7 500
Jan-
08
Mar
-08
May
-08
Jul-0
8
Sep-
08
Nov-
08
Jan-
09
Mar
-09
May
-09
Jul-0
9 Se
p-09
Nov-
09
Jan-
10
Mar
-10
May
-10
Jul-1
0
Sep-
10
Nov-
10
Jan-
11
Mar
-11
May
-11
Jul-1
1
Sep-
11
Nov-
11
Jan-
12
Mar
-12
May
-12
Jul-1
2
Sep-
12
Nov-
12
Inde
x (2
002-
04 =
100
)
Pric
e (U
S$/to
n)
Japan, beef import price, cif, chilled beef cuts USA, beef export price FAO Bovine meat price index

41
The South African Food Cost Review 2012 The South African Food Cost Review 2012
The real FTRPS and the farm value share for beef are shown in Figure 29 below. The average real FTRPS of beef increased by 9.3% between 2011 and 2012 and reached R31.60 in December 2012. Between 2011 and 2012, the farm value share of beef decreased by 5.9%. The farm value share of beef was 44.6% in December 2012.
Figure 29: Real farm-to-retail price spread and farm value share for beefSource: Stats SA, 2013; AMT, 2013 and own calculations
5.2.3 Lamb
The international lamb prices continued their upward trend, but with some decline during 2012 (Figure 30). According to the FAO, the average annual international lamb price decreased by 8.1% between 2011 and 2012. When comparing the New Zealand prices for 2012 to those for 2011, the annual average decrease in the international lamb price was 7.9%.
Figure 30: International lamb price trendsSource: FAO, 2013; IMF, 2013
The domestic retail prices for lamb showed a slight decline during 2012 but over the long-term an increasing trend (Figure 31). The annual average retail price of lamb increased by 2% between 2011 and 2012. The average annual retail price of lamb was 25.2% higher than the average retail price recorded in 2010. In real terms, lamb prices decreased by 3.3% between 2011 and 2012 compared to the 13% increase between 2010 and 2012.
38
40
42
44
46
48
50
52
2600
2700
2800
2900
3000
3100
3200
3300 Ja
n-08
A
pr-0
8
Jul-0
8
Oct
-08
Ja
n-09
A
pr-0
9
Jul-0
9
Oct
-09
Ja
n-10
A
pr-1
0
Jul-1
0
Oct
-10
Ja
n-11
A
pr-1
1
Jul-1
1
Oct
-11
Ja
n-12
A
pr-1
2
Jul-1
2
Oct
-12
Farm
Val
ue S
hare
(%)
Farm
to R
etai
l Pric
e Sp
read
(c/k
g)
Farm to Retail Price Spread of Beef Farm Value Share of Beef
55 73 91 109 127 145 163 181 199
3500 4000 4500 5000 5500 6000 6500 7000 7500
Jan-
08
Mar
-08
May
-08
Jul-0
8 S
ep-0
8 N
ov-0
8 Ja
n-09
M
ar-0
9 M
ay-0
9 Ju
l-09
Sep
-09
Nov
-09
Jan-
10
Mar
-10
May
-10
Jul-1
0 S
ep-1
0 N
ov-1
0 Ja
n-11
M
ar-1
1 M
ay-1
1 Ju
l-11
Sep
-11
Nov
-11
Jan-
12
Mar
-12
May
-12
Jul-1
2 S
ep-1
2 N
ov-1
2 Inde
x (2
002-
2004
= 1
00)
Pric
e (U
S$/to
n)
New Zealand, lamb, frozen whole carcasses FAO Ovine meat price index

42
The South African Food Cost Review 2012 The South African Food Cost Review 2012
Figure 31: Lamb retail price trendsSource: Stats SA, 2013
Figure 32 shows that the producer price for the different lamb classes has been following an increasing trend over the years with a noticeable decline during 2012. The average producer price of class A2/A3 decreased by 6% between 2011 (R47.35/kg) and 2012 (R44.49/kg). The annual average producer price for class B and class C2/C3 decreased by 10.6% and 9.1% respectively between 2011 and 2012.
Figure 32: Lamb producer price trendsSource: AMT, 2013
The real FTRPS and the farm value share of lamb are depicted in Figure 33. The real FTRPS of lamb increased by 4.9% between 2011 and 2012 and reached R36.84/kg in December 2012. The farm value share decreased by 7.9% on average between 2011 and 2012.
60 65 70 75 80 85 90 95
100
Jan-
08
Mar
-08
M
ay-0
8
Jul-0
8
Sep
-08
N
ov-0
8
Jan-
09
Mar
-09
M
ay-0
9
Jul-0
9
Sep
-09
N
ov-0
9
Jan-
10
Mar
-10
M
ay-1
0
Jul-1
0 S
ep-1
0
Nov
-10
Ja
n-11
M
ar-1
1
May
-11
Ju
l-11
S
ep-1
1
Nov
-11
Ja
n-12
M
ar-1
2
Ma
y-12
Ju
l-12
S
ep-1
2
Nov
-12
Ret
ail p
rice
(R/k
g)
Retail price of lamb
15 20 25 30 35 40 45 50 55
Jan-
08
Mar
-08
M
ay-0
8
Jul-0
8
Sep
-08
N
ov-0
8
Jan-
09
Mar
-09
Ma
y-09
Ju
l-09
S
ep-0
9
Nov
-09
Ja
n-10
M
ar-1
0
May
-10
Ju
l-10
S
ep-1
0
Nov
-10
Ja
n-11
M
ar-1
1
Ma
y-11
Jul-1
1
Sep
-11
N
ov-1
1
Jan-
12
Mar
-12
M
ay-1
2
Jul-1
2
Sep
-12
N
ov-1
2 Pr
oduc
er p
rice
(R/k
g)
Producer price of lamb class A2/A3 Producer price of lamb class B
Producer price of lamb class C2/C3

43
The South African Food Cost Review 2012 The South African Food Cost Review 2012
Figure 33: Real farm-to-retail price spreads and farm value share of lambSource: Stats SA, 2013; AMT, 2011 and own calculations
5.2.4 Pork
According to the FAO Pig Meat Price Index, annual average international pork prices decreased by 0.03% between 2011 and 2012. The annual average international pork price increased by 10.9% between, 2010 and 2012.
Figure 34: International pork price trendsSource: FAO, 2013; IMF, 2013
Figure 35 shows the retail price trends of pork. The retail price of pork chops increased by 6.1% between 2011 (R52.35/kg) and 2012 (R55.54/kg). The annual average retail price of bacon increased by 7.5% (from R92.69/kg in 2011 to R99.63/kg in 2012). In real terms, the average retail price of pork chops increased by 0.5%, whereas the retail price of bacon increased by 1.8% during the period under review.
40
45
50
55
60
65
25
30
35
40
45
50
Jan-
08
Mar
-08
M
ay-0
8 Ju
l-08
S
ep-0
8
Nov
-08
Ja
n-09
M
ar-0
9
May
-09
Ju
l-09
S
ep-0
9
Nov
-09
Ja
n-10
M
ar-1
0
Ma
y-10
Jul-1
0
Sep
-10
N
ov-1
0
Jan-
11
Mar
-11
M
ay-1
1
Jul-1
1
Sep
-11
N
ov-1
1
Jan-
12
Mar
-12
M
ay -1
2 Ju
l-12
S
ep-1
2
Nov
-12
Farm
Val
ue S
hare
(%)
Farm
-to-R
etai
l Pric
e Sp
read
(R/k
g)
Real Farm-to-Retail Price Spread Farm Value Share
100 112 124 136 148 160 172 184
1000 2000 3000 4000 5000 6000 7000 8000
Jan-
08
Mar
-08
M
ay-0
8
Jul-0
8
Sep
-08
N
ov-0
8
Jan-
09
Mar
-09
M
ay-0
9
Jul-0
9
Sep
-09
N
ov-0
9
Jan-
10
Mar
-10
M
ay-1
0
Jul-1
0
Sep
-10
N
ov-1
0
Jan-
11
Mar
-11
M
ay-1
1
Jul-1
1
Sep
-11
N
ov-1
1
Jan-
12
Mar
-12
M
ay-1
2
Jul-1
2
Sep
-12
N
ov-1
2
Inde
x (2
002-
2004
= 1
00)
Pric
e (U
S$/to
n)
Japan, pork import price, cif,
USA, pork, frozen product, export unit value
FAO Pig meat price index

44
The South African Food Cost Review 2012 The South African Food Cost Review 2012
Figure 35: Pork retail price trends Source: Stats SA, 2013
Figure 36 shows that the annual average producer price of porkers and baconers increased between 2011 and 2012. The annual average retail price of porkers and baconers increased by 12.9% and 10.2% respectively between 2011 and 2012. The annual average real producer price increased by 7% and 4.4% for porker and baconer respectively.
Figure 36: Pork producer price trends Source: AMT, 2011
Figure 37 shows the real FTRPS and farm value share of pork chops. The average real FTRPS decreased from R275.64 in 2011 to R269.08 in 2012 (-2.38%). The farm value increased by 6.3% on average between 2011 and 2012.
40
50
60
70
80
90
100
110
Jan-
08
Mar
-08
May
-08
Jul-0
8 S
ep-0
8 N
ov-0
8 Ja
n-09
M
ar-0
9 M
a y-0
9 Ju
l-09
Sep
-09
Nov
-09
Jan-
10
Mar
-10
Ma y
-10
Jul-1
0 S
ep-1
0 N
ov-1
0 Ja
n-11
M
ar-1
1 M
ay-1
1 Ju
l-11
Sep
-11
Nov
-11
Jan-
12
Mar
-12
Ma y
-12
Jul-1
2 S
ep-1
2 N
ov-1
2
Ret
ail p
rice
(R/k
g)
Bacon Pork chops
12
14
16
18
20
22
24
Jan-
08
Mar
-08
M
ay-0
8
Jul-0
8
Sep
-08
N
ov-0
8
Jan-
09
Mar
-09
May
-09
Ju
l-09
S
ep-0
9
Nov
-09
Ja
n-10
M
ar-1
0
Ma
y-10
Jul-1
0
Sep
-10
N
ov-1
0
Jan-
11
Mar
-11
May
-11
Ju
l-11
S
ep-1
1
Nov
-11
Ja
n-12
M
ar-1
2
Ma
y-12
Jul-1
2
Sep
-12
N
ov-1
2 Pr
oduc
er p
rice
(R/k
g)
Producer price of pork - porker Producer price of pork - baconer

45
The South African Food Cost Review 2012 The South African Food Cost Review 2012
Figure 37: Real farm-to-retail price spread and farm value share of porkSource: Stats SA, 2012; AMT, 2012 and own calculations
5.3 Dairy sector5.3.1 Price trends
Figure 38 shows the trends in the raw milk price and retail values for full cream and low fat milk between January 2008 and December 2012. The average retail price in 2012 was R9.38/ℓ and R7.64/ℓ respectively for full cream and low fat milk. Compared to 2011, full cream milk and low fat milk increased from R8.53/ℓ and R6.53/ℓ, respectively. Between 2011 and 2012, the price increased, on average, by 9.97% for full cream milk and 17.06% for low fat milk. The average raw milk price increased from R2.91/ℓ to R3.49/ℓ (change of 19.99%) between 2011 and 2012.
Figure 38: Raw milk price and retail values for full cream and low fat milk, sachets (R/litre)Sources: Stats SA, 2013; AC Nielsen, 2013; Milk Producers’ Organisation (MPO), 2013; South African Milk
Processors’ Organisation (SAMPRO), 2013 and own calculations
21
24
27
30
33
36
39
42
230
250
270
290
310
330
350
370
Jan-
08
Apr
-08
Jul-0
8
Oct
-08
Jan-
09
Apr
-09
Jul-0
9
Oct
-09
Jan-
10
Apr
-10
Jul-1
0
Oct
-10
Jan-
11
Apr
-11
Jul-1
1
Oct
-11
Jan-
12
Apr
-12
Jul-1
2
Oct
-12
Farm
val
ue s
hare
(%)
Farm
-to-
Ret
ail P
rice
Spre
ad (R
)
Farm-to-Retail Price Spread Farm Value Share
21
24
27
30
33
36
39
42
230
250
270
290
310
330
350
370
Jan-
08
Apr-0
8
Jul-0
8
Oct
-08
Jan-
09
Apr-0
9
Jul-0
9
Oct
-09
Jan-
10
Apr-1
0
Jul-1
0
Oct
-10
Jan-
11
Apr-1
1
Jul-1
1
Oct
-11
Jan-
12
Apr-1
2
Jul-1
2
Oct
-12
Farm
val
ue s
hare
(%)
Farm
-to-
Ret
ail P
rice
Spre
ad (R
)
Farm-to-Retail Price Spread Farm Value Share

46
The South African Food Cost Review 2012 The South African Food Cost Review 2012
Cognisance should be taken regarding the complexity of the different processes involved from sourcing raw milk from a cow until milk and its by-products are sold. This is important in an attempt to explain the difference between what farmers receive for their milk and what consumers pay for milk (Food Cost Review, 2009).
In order to explain the relationship between the raw milk price and packaged standardised pasteurised milk, a high number of assumptions should be made regarding factors such as the fat content of milk produced in South Africa, the price of cream, the production, packaging, administration, marketing and management cost of cream, and the quantity of each fat class of milk (fat free, low fat and full cream) sold (Office of SAMPRO, 2010). Due to the complex process and the number of assumptions that should be addressed the remainder of this section will only discuss the price spread between full cream milk and the retail price of milk.
Figure 39 shows the farm value share as a percentage of the real retail value for full cream milk, between January 2008 and December 2012. In January 2008, the farm value share of full cream milk was 41%. The farm value shares for full cream milk increased to peak at 43% in April 2008 after which it declined to reach its lowest point of 31% in September 2010. In December 2012 the farm value share for full cream milk increased to 37%. The average farm value share in 2012 was 37.21%, compared to the 34.09% in 2011. Between 2011 and 2012, the farm value share increased, on average, by 9.15%.
Figure 39: Real farm value shares for full cream milk, sachets (R/litre) Sources: Stats SA, 2013; MPO, 2013; SAMPRO, 2013 and own calculations
Figure 40 shows the trends in the real FTRPS for full cream milk between January 2008 and December 2012. From January 2008, the spread was R4.68/ℓ and increased to reach a peak of R5.48/ℓ December 2008. The real FTRPS then decreased by 14.05% over the next four years from December 2008 to reach R4.71/ℓ in December 2012. The average real FTRPS decreased from 4.8% to 4.76% (-0.87%) between 2011 and 2012.
- 5
10 15 20 25 30 35 40 45 50
Jan-
08
Mar
-08
M
ay-0
8
Jul-0
8
Sep
-08
N
ov-0
8
Jan-
09
Mar
-09
M
ay-
09
Jul-0
9
Sep
-09
N
ov-0
9
Jan-
10
Mar
-10
M
ay-
10
Jul-1
0
Sep
-10
N
ov-1
0
Jan-
11
Mar
-11
M
ay-1
1
Jul-1
1
Sep
-11
N
ov-1
1 Ja
n-12
M
ar-1
2
Ma
y-12
Ju
l-12
S
ep-1
2
Nov
-12
Farm
val
ue s
hare
for f
ull
crea
m m
ilk (%
)
Real farm value share full cream milk

47
The South African Food Cost Review 2012 The South African Food Cost Review 2012
Figure 40: Real farm-to-retail price spread for full cream milk, sachets (R/litre)Sources: Stats SA, 2013; MPO, 2013; SAMPRO, 2013 and own calculations
In order to explain the FTRPS for dairy, a simplified diagram was constructed of the activities in the dairy value chain to deliver fresh milk to the consumer. Four main activities were identified, all of which require a diverse set of resources and inputs (Food Cost Review, 2009).
In order to gain a better understanding of the margins and costs in the fresh milk dairy chain, industry stakeholders were consulted with regard to the off-farm value chain, which included the Office of SAMPRO. Two different scenarios were constructed to explain the costs and margins in the fresh milk value chain as applicable to full cream pasteurised milk in a 2ℓ container, namely:
(i) A low value-added scenario:
■ Raw milk close to processing plant
■ Less complex technology
■ Cheaper with respect to type and size of packaging
■ Direct surroundings of distribution, and
■ Limiting marketing- and advertising costs.
(ii) A high value-added scenario:
■ Raw milk farther from processing plant
■ More complex technology
■ Type and size of packaging are more expensive
■ Distribution to further outlets, and
■ Marketing- and advertising costs.
It should be noted that the typical contribution of each value-adding activity to the retail selling price of full cream pasteurised milk in a 2ℓ container will differ from firm to firm, from region to region, from one to the other type and size of packaging and from season to season.
Information revealed by a number of highly experienced and informed milk processors was requested to indicate what they regard as a typical low- and high-cost scenario in South Africa for each of the value-adding activities. Table 26 shows the distribution costs and margins along the fresh milk dairy chain per action as described in detail in the Food Cost Review of 2009.
-
1
2
3
4
5
6
Jan-
08
Mar
-08
May
-08
Jul-0
8 S
ep-0
8 N
ov-0
8 Ja
n-09
M
ar-0
9 M
a y-0
9 Ju
l-09
Sep
-09
Nov
-09
Jan-
10
Mar
-10
Ma y
-10
Jul-1
0 S
ep-1
0 N
ov-1
0 Ja
n-11
M
ar-1
1 M
a y-1
1 Ju
l-11
Sep
-11
Nov
-11
Jan-
12
Mar
-12
May
-12
Jul-1
2 S
ep-1
2 N
ov-1
2
Farm
-to-r
etai
l-pric
e-sp
read
(R
/litr
e)
Real farm-to-retail price spread
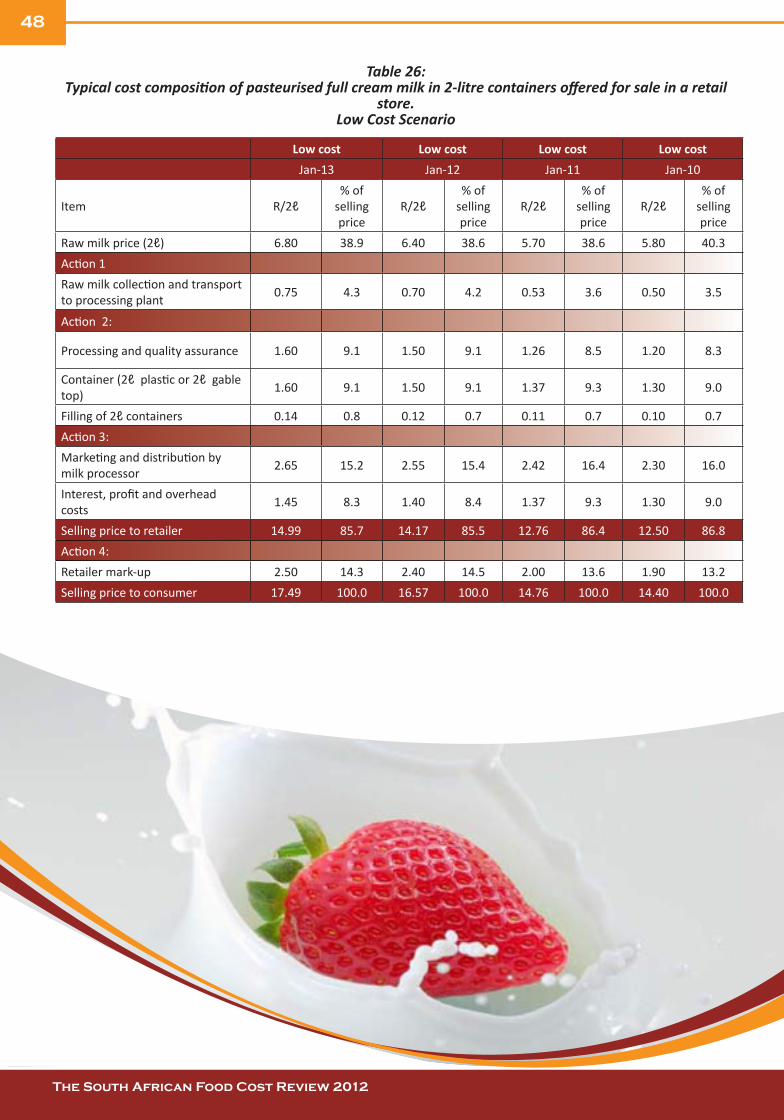
48
The South African Food Cost Review 2012 The South African Food Cost Review 2012
Table 26: Typical cost composition of pasteurised full cream milk in 2-litre containers offered for sale in a retail
store.Low Cost Scenario
Low cost Low cost Low cost Low costJan-13 Jan-12 Jan-11 Jan-10
Item R/2ℓ% of
selling price
R/2ℓ% of
selling price
R/2ℓ% of
selling price
R/2ℓ% of
selling price
Raw milk price (2ℓ) 6.80 38.9 6.40 38.6 5.70 38.6 5.80 40.3Action 1 Raw milk collection and transport to processing plant 0.75 4.3 0.70 4.2 0.53 3.6 0.50 3.5
Action 2:
Processing and quality assurance 1.60 9.1 1.50 9.1 1.26 8.5 1.20 8.3
Container (2ℓ plastic or 2ℓ gable top) 1.60 9.1 1.50 9.1 1.37 9.3 1.30 9.0
Filling of 2ℓ containers 0.14 0.8 0.12 0.7 0.11 0.7 0.10 0.7Action 3: Marketing and distribution by milk processor 2.65 15.2 2.55 15.4 2.42 16.4 2.30 16.0
Interest, profit and overhead costs 1.45 8.3 1.40 8.4 1.37 9.3 1.30 9.0
Selling price to retailer 14.99 85.7 14.17 85.5 12.76 86.4 12.50 86.8Action 4: Retailer mark-up 2.50 14.3 2.40 14.5 2.00 13.6 1.90 13.2Selling price to consumer 17.49 100.0 16.57 100.0 14.76 100.0 14.40 100.0

49
The South African Food Cost Review 2012 The South African Food Cost Review 2012
Low Cost Scenario
High cost High cost High cost High cost
Jan-13 Jan-12 Jan-11 Jan-10
Item R/2ℓ% of
selling price
R/2ℓ% of
selling price
R/2ℓ% of
selling price
R/2ℓ% of
selling price
Raw milk price (2ℓ) 7.60 31.5 7.30 31.9 6.70 34.2 6.80 35.6
Action 1
Raw milk collection and transport to processing plant 1.02 4.2 0.95 4.1 0.74 3.7 0.70 3.7
Action 2:
Processing and quality assurance 2.40 9.9 2.25 9.8 1.47 7.5 1.40 7.3
Container (2 plastic or 2ℓ gable top) 2.60 10.8 2.45 10.7 1.58 8.0 1.50 7.9
Filling of 2ℓ containers 0.18 0.7 0.15 0.7 0.11 0.5 0.10 0.5
Action 3:
Marketing and distribution by milk processor 3.95 16.4 3.75 16.4 3.47 17.7 3.30 17.3
Interest, profit and overhead costs 2.40 9.9 2.25 9.8 2.21 11.2 2.10 11.0
Selling price to retailer 20.15 83.4 19.10 83.4 16.26 82.9 15.90 83.2
Action 4:
Retailer mark-up 4.00 16.6 3.80 16.6 3.36 17.1 3.20 16.8
Selling price to consumer 24.15 100.0 22.90 100.0 19.62 100.0 19.10 100.0Source: Office of SAMPRO and own calculations, 2013
From Table 26 it is evident that in January 2013 that the raw milk price contributed between 31.5% and 38.9% of the total selling price to the consumer, whereas in January 2012 it contributed between 31.9% and 38.6 %. Action 1 contributed between 4.2% and 4.3% to the total price consumers paid, in January 2013. Action 2 (sum thereof) contributed between 19.1% and 21.4%, while Action 3 (excluding the selling price to the retailer) contributed a significant proportion, of between 23.4% and 26.1% in total, to the selling price in January 2013.
When considering January 2013’s individual items of the actions mentioned, marketing and distribution by the milk processor (part of action 3) contributed the greatest proportion of 15.2% to 16.4% of the selling price. The retailer mark-up (part of action 4) constituted approximately 14.3% to 16.6% of the difference between the price the consumer paid and the price at which the retailer procured the milk. This spread includes all costs e.g. electricity-, labour-, distribution costs, and so forth, at retail level. Interest, profit and overhead costs constituted the third highest proportion, which includes depreciation, administration- and management costs.
To produce 1 lℓ of packaged, standardised pasteurised milk, more than 1 litre of raw milk is required as the processes of pasteurisation and packaging create a loss of milk volume and as standardisation of the fat content of milk often means that fat (cream) is removed, which reduced the quantity of milk which is available to sell.1 If the fat content of the non-standardised raw milk is higher than the fat level required, the quantity of standardised milk will be lower than the quantity of non-standardised raw milk used as input. To reduce the fat content, cream (consisting typically of 40% fat) should be removed from the milk and as a result, the quantity of milk will reduce. For example:
1 Verified by dairy scientist, Mr G. Venter (M.Sc. Food Science)

50
The South African Food Cost Review 2012 The South African Food Cost Review 2012
100 kg milk with 4% fat (or 4 kg fat):
= 90.1 kg of skimmed milk with 0.05% fat or 0.04 kg fat plus 9.9 kg of cream containing 40% fat or 3.9 kg of fat (the fat of the two products, namely 0.04 kg plus 3.96 kg = 4 kg)
= 97.3 kg of milk with 3% fat or 2.92 kg of fat plus 2.7 kg of cream containing 40% fat or 1.08 kg fat(the fat of the two products, namely 2.92 kg plus 1.08 kg = 4 kg).
The figure below illustrates the treatment of 100 kg whole milk with 4% fat. The requirement is to produce an optimal amount of 3% standardised milk and surplus cream containing 40% fat.
Source: Dairy Processing Handbook, 2003
If the fat content of the non-standardised milk is lower than the required level, cream should be added and as a result the quantity of standardised milk will be higher than the quantity of milk with too low fat content which was used as input.
Figure 41 show the trends in the powdered milk retail price for 500g and 1kg packets between January 2008 and December 2012. The average retail price in 2012 was R39.83 and R35.44 for 500g and 1kg powdered milk, respectively. Compared to 2011, 500 g and 1kg powdered milk were lower at R36.97 and R32.44, respectively. Between 2011 and 2012, the price increased, on average by 7.73% and 9.22% for 500g and 1kg powdered milk, respectively.
Whole milk 3%
SurplusStandardised cream
Standardised cream
30%
2.5kg
40%
7.2kg0.05%
50.1 kg
Skim milk
9.9kg
40%Cream
4%
100 kg
97.3 kg

51
The South African Food Cost Review 2012 The South African Food Cost Review 2012
Figure 41: Retail price of powdered milk, (R/kg) Source: Stats SA, 2013
5.4 Price trends in the maize sector
5.4.1 Production, consumption and stock levels of white maize
White maize is the primary staple food in South Africa and 80% is used in the processing for human consumption, mainly in the form of maize meal. South African farmers produced enough white maize versus its consumption as illustrated in Figure 42. The marketing season for maize is from 1 May 2012 to 30 April 2013.
Figure 42: Domestic white maize production and consumption Source: South African Grain Information Service (SAGIS) and Grain SA, 2013
*Estimate
Stock levels for white maize come under pressure due to higher than expected exports in 2011. Quantity exported slowed down in the 2012/13 season. Figure 43 illustrates the carry-over for white maize and required pipeline (consumption for 45 days). Carry over as a percentage of commercial demand is also the lowest for the past 15 years.
20
25
30
35
40
45
50
55
Jan-
08
Apr
-08
Jul-0
8
Oct
-08
Jan-
09
Apr
-09
Jul-0
9
Oct
-09
Jan-
10
Apr
-10
Jul-1
0
Oct
-10
Jan-
11
Apr
-11
Jul-1
1
Oct
-11
Jan-
12
Apr
-12
Jul-1
2
Oct
-12
Ret
ail v
alue
(R/g
)
Retail price of powdered milk (R/500g) Retail price of powdered milk (R/kg)
1 000 2 000 3 000 4 000 5 000 6 000 7 000 8 000 9 000
2002
/03
2003
/04
2004
/05
2005
/06
2006
/07
2007
/08
2008
/09
2009
/10
2010
/11
2011
/12
2012
/13*
Tons
CEC crop estimate ('000ton) Total RSA consumption (commercial )

52
The South African Food Cost Review 2012 The South African Food Cost Review 2012
Figure 43: Total white exports, pipeline requirements, carry-over and carry-over as a percentage of total domestic demand
Source: SAGIS, Grain SA, 2013 *Estimate
White maize is predominately used for human consumption and yellow maize for animal feed. This tendency can change depending on the price difference between white and yellow. If white maize is trading below yellow maize then feed manufacturers tend to use white in their feed rations. If yellow maize trades below white then the same tendency does not normally happen in the maize meal market, due to the sophisticated preference of this market. Table 27 illustrates the breakdown of consumption for the 2012/13 season.
The per capita consumption of white maize increased from 84.4kg in 2002, peaked at 129.2kg in 2010 season and decreased to 100.1kg in 2012 as illustrated in Figure 44. The average consumption over the last 10 years constitutes 101.9kg.
Figure 44: Per capita consumption and population Source: SAGIS, Stats SA, 2013 and own calculation
5.4.2 Production, stock levels and consumption of yellow maize
Yellow maize is primarily used in the feed industry. Approximately 10% is used for human consumption. South African farmers produce enough yellow maize versus its consumption as illustrated in Figure 45.
0.00%
10.00%
20.00%
30.00%
40.00%
50.00%
500
1 000 1 500 2 000 2 500 3 000
2002
/03
2003
/04
2004
/05
2005
/06
2006
/07
2007
/08
2008
/09
2009
/10
2010
/11
2011
/12
2012
/13*
Perc
enta
ge
Tons
Total Exports Carry-out (30 April)
Pipeline requirements Carry-out as a % of total commercial demand
42.00
44.00
46.00
48.00
50.00
52.00
54.00
0.0
20.0
40.0
60.0
80.0
100.0
120.0
140.0
2002 2003 2004 2005 2006 2007 2008 2009 2010 2011 2012
mìéçä~íáçå=áå=EãáääáçåëF
=
Per c
apita
con
sum
ptio
n (K
g)

53
The South African Food Cost Review 2012 The South African Food Cost Review 2012
Figure 45: Domestic yellow maize production and consumptionSource: SAGIS, Grain SA, 2012 and own calculations
*Estima3e
Stock levels for yellow maize also come under pressure due to higher than expected exports in 2011. Figure 46 illustrates the carry-over for white maize and required pipeline (consumption for 45 days) of 679 tons. Carry-over as a percentage of commercial demand is 14.06%.
Figure 46: Total yellow exports, pipeline requirements, carry-out and carry-out as a percentage of total domestic demand Source: SAGIS, Grain SA, 2013
*Estimate
1 000
2 000
3 000
4 000
5 000
6 000
2002
/03
2003
/04
2004
/05
2005
/06
2006
/07
2007
/08
2008
/09
2009
/10
2010
/11
2011
/12
2012
/13*
Tons
0.00%
5.00%
10.00%
15.00%
20.00%
25.00%
30.00%
0
200
400
600
800
1 000
1 200
2002/03 2003/04 2004/05 2005/06 2006/07 2007/08 2008/09 2009/10 2010/11 2011/12 2012/13* Car
ry o
ut a
s %
of t
otal
com
mer
cial
de
man
d
Tons
Total Exports Carry-out (30 April)
Pipeline requirements Carry-out as a % of total commercial demand

54
The South African Food Cost Review 2012 The South African Food Cost Review 2012
5.4.3 The South African maize balance sheet
South Africa is self-sufficient in the production of yellow and white maize and can be seen as a net exporter of maize.
Table 27: South African maize balance sheet for the 2011/12 season
Marketing YearWhite Yellow Total
2012/13* 2012/13* 2012/13*Area planted (‘000 ha) 1 636 1 063 2 699CEC crop estimate (‘000 ton) 6 904 5 217 12 121Commercial supply (‘000 ton) (‘000 ton) (‘000 ton) Opening stocks (1 May ) 518 476 994Commercial deliveries 6 867 5 032 11 899Imports 11 11Total commercial supply 7 396 5 508 12 904Commercial demand Commercial consumption Food 4 057 397 4 454Feed 902 3 458 4 360Total 4 959 3 855 8 814Other consumption Gristing 48 10 58Withdrawn by producers 37 101 138Released to end consumers 92 377 469SAGIS (Nota 8) 48 10 58Total 225 498 723Total RSA consumption (commercial ) 5 184 4 353 9 537Exports Products 64 64 128Whole maize 1 400 412 1 812Total Exports 1 464 476 1 940Total commercial demand 6 648 4 829 11 477Carry-out (30 April) 785 679 1 464Pipeline requirements 620 482 1 102Surplus above pipeline 165 197 362Carry-out as a % of RSA consumption 15.14% 15.60% 15.35%Carry-out as a % of total commercial demand 11.81% 14.06% 12.76%
Source: GrainSA, 2013*1 May 2012 to 30 April 2013
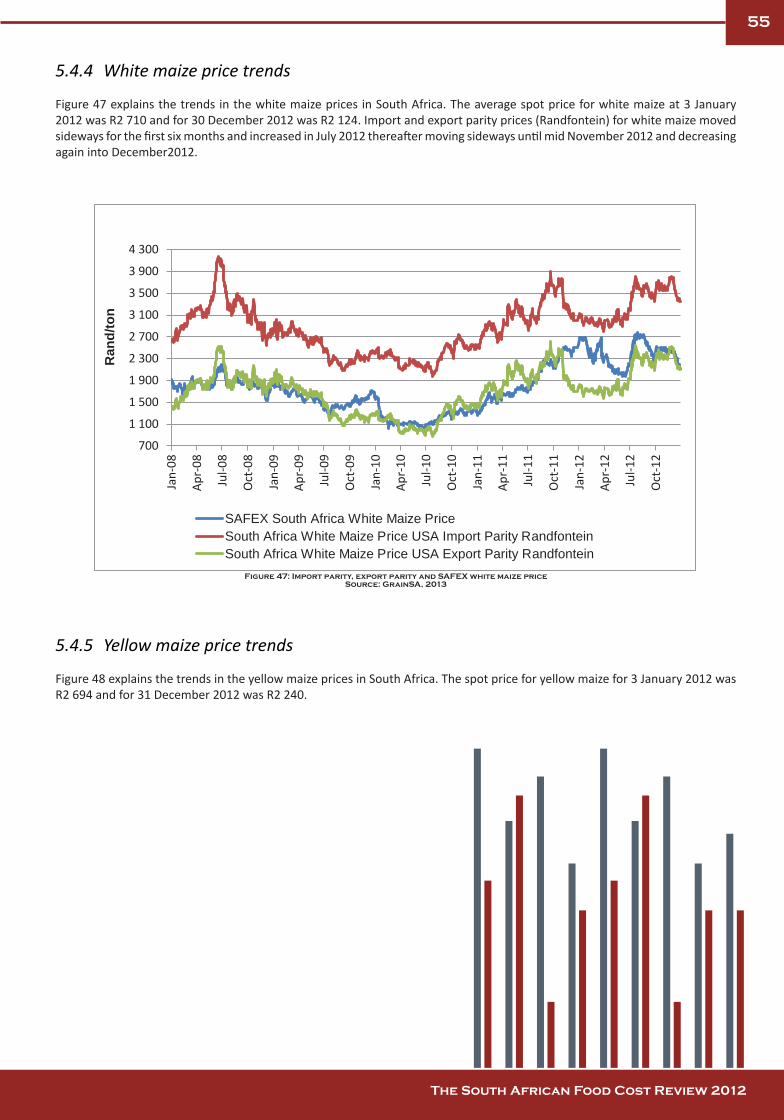
55
The South African Food Cost Review 2012 The South African Food Cost Review 2012
5.4.4 White maize price trends
Figure 47 explains the trends in the white maize prices in South Africa. The average spot price for white maize at 3 January 2012 was R2 710 and for 30 December 2012 was R2 124. Import and export parity prices (Randfontein) for white maize moved sideways for the first six months and increased in July 2012 thereafter moving sideways until mid November 2012 and decreasing again into December2012.
Figure 47: Import parity, export parity and SAFEX white maize priceSource: GrainSA, 2013
5.4.5 Yellow maize price trends
Figure 48 explains the trends in the yellow maize prices in South Africa. The spot price for yellow maize for 3 January 2012 was R2 694 and for 31 December 2012 was R2 240.
700
1 100
1 500
1 900
2 300
2 700
3 100
3 500
3 900
4 300
Jan-
08
Apr-
08
Jul-0
8
Oct
-08
Jan-
09
Apr-
09
Jul-0
9
Oct
-09
Jan-
10
Apr-
10
Jul-1
0
Oct
-10
Jan-
11
Apr-
11
Jul-1
1
Oct
-11
Jan-
12
Apr-
12
Jul-1
2
Oct
-12
Ran
d/to
n
SAFEX South Africa White Maize Price South Africa White Maize Price USA Import Parity Randfontein South Africa White Maize Price USA Export Parity Randfontein

56
The South African Food Cost Review 2012 The South African Food Cost Review 2012
Figure 48: Import parity, export parity and SAFEX yellow priceSource: Grain SA, 2013
5.4.6 Real farm gate price and the real retail value of special and super maize meal
Figure 49 shows the trends in the real farm value1 or real farm gate price and real retail value of special maize meal between January 2005 and December 2012. The real farm value of special maize meal increased from mid-2005 and peaked at R2 372/ton in July 2007, after which it declined gradually to reach R1 269 in November 2009. The real farm gate price of special maize meal increased by 20.7% from R2 023 in January 2012 to R2 442 in May 2012. It decreased by 26.2% to R1 803 in September 2013 and increased by 26.2% to R2 405 in December 2012. The real retail value of special maize meal followed a similar trend, but not with the same magnitude. It increased more rapidly with maize price increases but did not decrease at the same rate when maize prices decreased.
Figure 49: Real retail value and farm value of special maize mealSource: South African Futures Exchange (SAFEX), Stats SA and own calculations, 2013
1 Farm value = SAFEX white maize spot price - (transport cost to the silo + silo handling, grading & commission) + 1% physical loss + average storage cost for 60 days + Transport differential/extraction rate.
500
900
1 300
1 700
2 100
2 500
2 900
3 300
3 700
4 100
2-Ja
n-08
2-
Mar
-08
2-M
ay-0
8 2-
Jul-0
8 2-
Se p
-08
2-N
ov-0
8 2-
Jan-
09
2-M
ar-0
9 2-
Ma y
-09
2-Ju
l-09
2-S
ep-0
9 2-
Nov
-09
2-Ja
n-10
2-
Mar
-10
2-M
a y-1
0 2-
Jul-1
0 2-
Sep
-10
2-N
ov-1
0 2-
Jan-
11
2-M
ar-1
1 2-
Ma y
-11
2-Ju
l-11
2-S
ep-1
1 2-
Nov
-11
2-Ja
n-12
2-
Mar
-12
2-M
a y-1
2 2-
Jul-1
2 2-
Se p
-12
2-N
ov-1
2
R/to
n
South Africa Yellow Maize Price Argentina Import Parity Randfontein South Africa Yellow Maize Price USA Import Parity Randfontein SAFEX Yellow Maize Spot Price South Africa Yellow Maize Price USA Export Parity Randfontein
0
500
1000
1500
2000
2500
2000
2500
3000
3500
4000
4500
Jan-
05
Jun-
05
Nov
-05
Apr-
06
Sep-
06
Feb-
07
Jul-0
7
Dec-
07
May
-08
Oct
-08
Mar
-09
Aug-
09
Jan-
10
Jun-
10
Nov
-10
Apr-
11
Sep-
11
Feb-
12
Jul-1
2
Dec-
12
Farm
gat
e va
lue
(R/to
n)
Ret
ail v
alue
(R/to
n)
Real retail value of special maize meal Real farm gate price of special maize meal
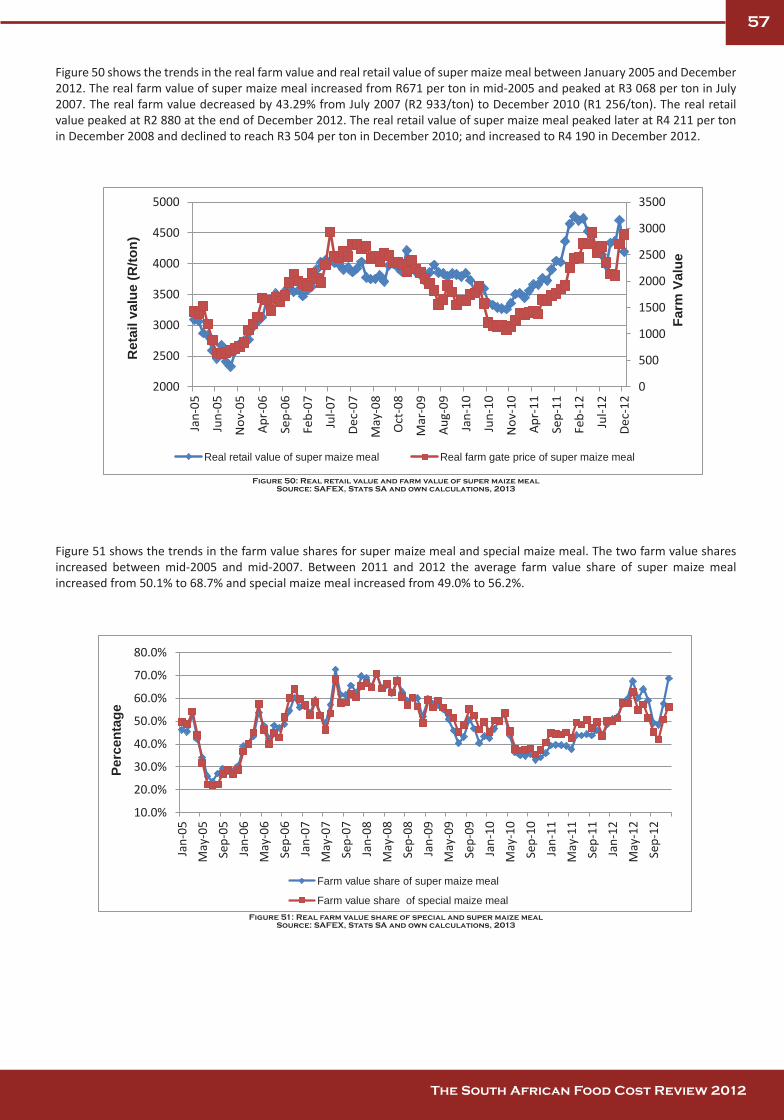
57
The South African Food Cost Review 2012 The South African Food Cost Review 2012
Figure 50 shows the trends in the real farm value and real retail value of super maize meal between January 2005 and December 2012. The real farm value of super maize meal increased from R671 per ton in mid-2005 and peaked at R3 068 per ton in July 2007. The real farm value decreased by 43.29% from July 2007 (R2 933/ton) to December 2010 (R1 256/ton). The real retail value peaked at R2 880 at the end of December 2012. The real retail value of super maize meal peaked later at R4 211 per ton in December 2008 and declined to reach R3 504 per ton in December 2010; and increased to R4 190 in December 2012.
Figure 50: Real retail value and farm value of super maize mealSource: SAFEX, Stats SA and own calculations, 2013
Figure 51 shows the trends in the farm value shares for super maize meal and special maize meal. The two farm value shares increased between mid-2005 and mid-2007. Between 2011 and 2012 the average farm value share of super maize meal increased from 50.1% to 68.7% and special maize meal increased from 49.0% to 56.2%.
Figure 51: Real farm value share of special and super maize mealSource: SAFEX, Stats SA and own calculations, 2013
0
500
1000
1500
2000
2500
3000
3500
2000
2500
3000
3500
4000
4500
5000 Ja
n-05
Ju
n-05
Nov
-05
Apr-
06
Sep-
06
Feb-
07
Jul-0
7
Dec-
07
May
-08
Oct
-08
Mar
-09
Au
g-09
Ja
n-10
Jun-
10
Nov
-10
Ap
r-11
Se
p-11
Fe
b-12
Ju
l-12
De
c-12
Farm
Val
ue
Ret
ail v
alue
(R/to
n)
Real retail value of super maize meal Real farm gate price of super maize meal
10.0%
20.0%
30.0%
40.0%
50.0%
60.0%
70.0%
80.0%
Jan-
05
May
-05
Sep-
05
Jan-
06
May
-06
Sep-
06
Jan-
07
May
-07
Sep-
07
Jan-
08
May
-08
Sep-
08
Jan-
09
May
-09
Sep-
09
Jan-
10
May
-10
Sep-
10
Jan-
11
May
-11
Sep-
11
Jan-
12
May
-12
Sep-
12
Perc
enta
ge
Farm value share of super maize meal
Farm value share of special maize meal
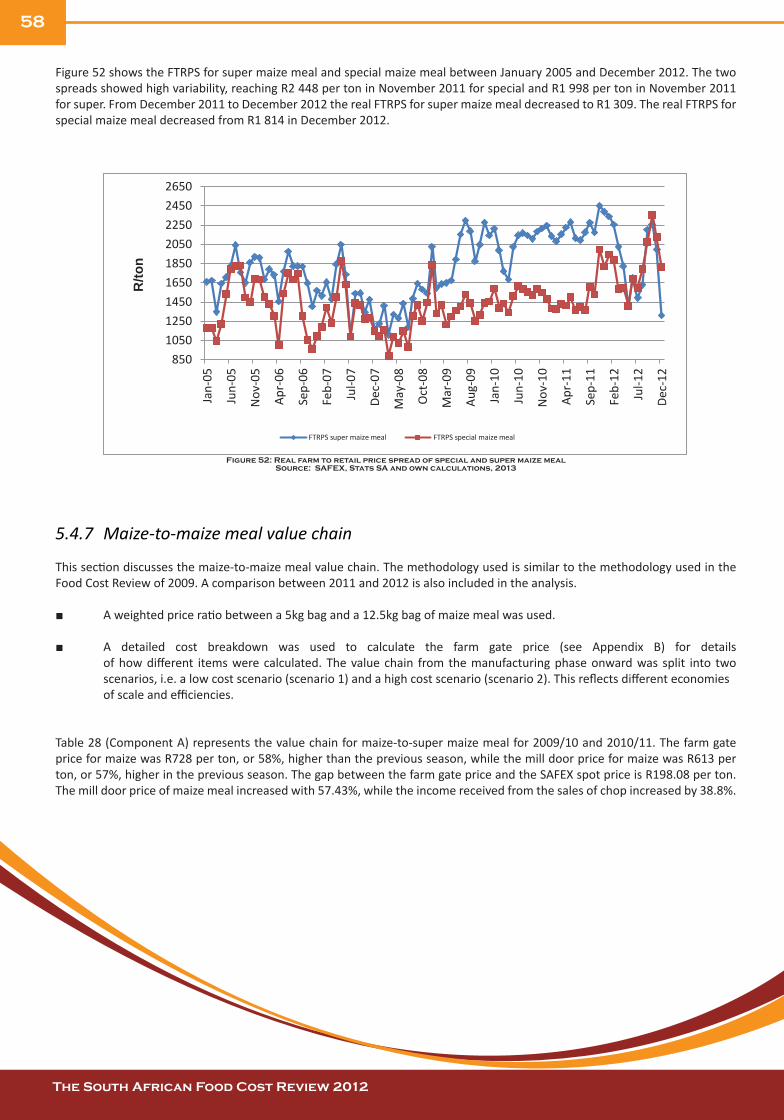
58
The South African Food Cost Review 2012 The South African Food Cost Review 2012
Figure 52 shows the FTRPS for super maize meal and special maize meal between January 2005 and December 2012. The two spreads showed high variability, reaching R2 448 per ton in November 2011 for special and R1 998 per ton in November 2011 for super. From December 2011 to December 2012 the real FTRPS for super maize meal decreased to R1 309. The real FTRPS for special maize meal decreased from R1 814 in December 2012.
Figure 52: Real farm to retail price spread of special and super maize mealSource: SAFEX, Stats SA and own calculations, 2013
5.4.7 Maize-to-maize meal value chain
This section discusses the maize-to-maize meal value chain. The methodology used is similar to the methodology used in the Food Cost Review of 2009. A comparison between 2011 and 2012 is also included in the analysis.
■ A weighted price ratio between a 5kg bag and a 12.5kg bag of maize meal was used.
■ A detailed cost breakdown was used to calculate the farm gate price (see Appendix B) for details of how different items were calculated. The value chain from the manufacturing phase onward was split into two scenarios, i.e. a low cost scenario (scenario 1) and a high cost scenario (scenario 2). This reflects different economies of scale and efficiencies.
Table 28 (Component A) represents the value chain for maize-to-super maize meal for 2009/10 and 2010/11. The farm gate price for maize was R728 per ton, or 58%, higher than the previous season, while the mill door price for maize was R613 per ton, or 57%, higher in the previous season. The gap between the farm gate price and the SAFEX spot price is R198.08 per ton. The mill door price of maize meal increased with 57.43%, while the income received from the sales of chop increased by 38.8%.
850 1050 1250 1450 1650 1850 2050 2250 2450 2650
Jan-
05
Jun-
05
Nov
-05
Apr-
06
Sep-
06
Feb-
07
Jul-0
7
Dec-
07
May
-08
Oct
-08
Mar
-09
Aug-
09
Jan-
10
Jun-
10
Nov
-10
Apr-
11
Sep-
11
Feb-
12
Jul-1
2
Dec-
12
R/to
n
FTRPS super maize meal FTRPS special maize meal

59
The South African Food Cost Review 2012 The South African Food Cost Review 2012
Table 28: Average costs in the maize to maize meal (super maize meal) value chain (Component A)
No Item Units 2011 2012
1. Farm gate price lagged four months R/ton grain R 1 255.12 R 1 983.27
2. Transport costs: farm gate to silo R/ton grain R 45.36 R 50.57
3. Average handling, grading, procurement fee and 1% physical loss fee R/ton grain R 83.21 R 92.89
4. Average storage cost for the farmer R/ton grain R 29.42 R 55.11
5. SAFEX-derived price for the producer at the silo R/ton grain R 1 413.31 R 2 181.85
6. Average location differential R/ton grain R 145.60 R 188.84
7. Average SAFEX spot price for white maize (2010) four months lagged R/ton grain R 1 558.91 R 2 370.69
8. Storage and handling costs: cost to miller R/ton grain R 58.74 R 82.47
9. Transport costs: silo to mill door R/ton grain R 116.48 R 151.07
Average commission paid by miller R/ton grain R 30.00 R 30.00
10. Income from sale of chop R/ton grain R 550.13 R 763.50
11. Mill door price for maize R/ton grain R 1 068.41 R 1 681.89Sources: Discussions with different industry stakeholders at various levels of the maize value chain. Average annual chop price; South Africa Feed-
lot Association; SAFEX, 2013
Table 29 (Component B) shows costs from the mill door to the retail level. On average, milling costs increased by 6%, packaging costs by 7%, packing material by 7.52% and administration, warehouses and selling by 6.8%. The increase in total mill site costs between 2011 and 2012 is 6.82%. The cost of producing maize meal (measured as Rand per ton of meal) increased by 8.76% and 5.24% respectively, from 2011 to 2012 if the low and high cost scenarios are compared. The miller-to-retail margin increased from an average of 19.49% to 18.04%.

60
The South African Food Cost Review 2012 The South African Food Cost Review 2012
Table 29: The maize-to-maize meal (super maize meal) value chain (Component B)
No Item Units 2011 2012
11. Mill door price for maize R/ton grain R 1 047.55 R 1 681.89
Manufacturers Scenario 1 Scenario 2 Scenario 1 Scenario 2
Production cost (milling costs) R/ton grain R 118.75 R 131.25 R 118.75 R 131.25
Packing cost R/ton grain R 45.60 R 50.40 R 45.60 R 50.40
Packing material costs and losses R/ton grain R 140.60 R 155.40 R 140.60 R 155.40
Administration, warehouses and selling R/ton grain R 232.75 R 257.25 R 232.75 R 257.25
12. Mill site cost R/ton grain R 537.70 R 594.30 R 537.70 R 594.30
Distribution costs R/ton grain R 232.75 R 257.25 R 232.75 R 257.25
13. Total mill site cost R/ton grain R 770.45 R 851.55 R 770.45 R 851.55
14. Fixed capital cost R/ton grain R 176.70 R 195.30 R 176.70 R 195.30
15. Floating capital costs R/ton grain R 981.70 R 90.30 R 81.70 R 90.30
16. Total manufacturing and distribution cost R/ton grain R 1 028.85 R 1 137.15 R 1 028.85 R 1 137.15
Cost of production of super maize meal
17. Conversion cost (maize to maize meal) R/ton grain R 1 028.85 R 1 137.15 R 1 028.85 R 1 137.15
18. Average cost of maize (mill door price) R/ton grain R 1 068.41 R 1 068.41 R 1 068.41 R 1 068.41
19. Total super maize meal cost R/ton grain R 2 076.40 R 2 184.70 R 2 076.40 R 2 184.70
20 Average extraction rate for super maize meal 0.63 0.63 0.63 0.63
21 Average cost of super maize meal R/ton meal R 3 355.61 R 3 528.89 R 3 355.61 R 3 528.89
22’ Miller to retail margin R/ton meal R 1 172.64 R 999.36 R 1 172.64 R 999.36
23 Average monthly retail price R/ton meal R 4 528.25 R 4 528.25 R 4 528.25 R 4 528.25
Note: The average retail price is based on a weighted price of 30% for 5 kg and 70% for 12.5 kg bags of maize meal. Sources: Discussions with different industry stakeholders at various levels of the maize value chain. Average annual chop price; South Africa Feedlot Association; SAFEX, 2013
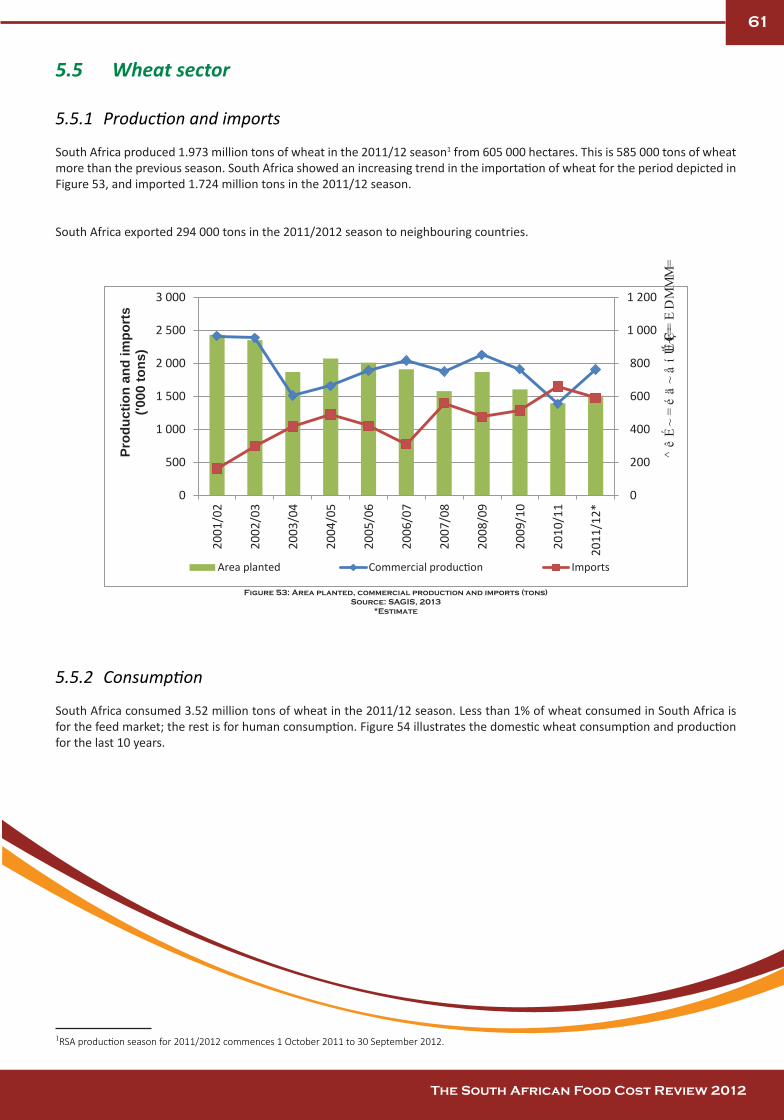
61
The South African Food Cost Review 2012 The South African Food Cost Review 2012
5.5 Wheat sector 5.5.1 Production and imports
South Africa produced 1.973 million tons of wheat in the 2011/12 season1 from 605 000 hectares. This is 585 000 tons of wheat more than the previous season. South Africa showed an increasing trend in the importation of wheat for the period depicted in Figure 53, and imported 1.724 million tons in the 2011/12 season.
South Africa exported 294 000 tons in the 2011/2012 season to neighbouring countries.
Figure 53: Area planted, commercial production and imports (tons)Source: SAGIS, 2013
*Estimate
5.5.2 Consumption
South Africa consumed 3.52 million tons of wheat in the 2011/12 season. Less than 1% of wheat consumed in South Africa is for the feed market; the rest is for human consumption. Figure 54 illustrates the domestic wheat consumption and production for the last 10 years.
1RSA production season for 2011/2012 commences 1 October 2011 to 30 September 2012.
0
200
400
600
800
1 000
1 200
0
500
1 000
1 500
2 000
2 500
3 000
2001
/02
2002
/03
2003
/04
2004
/05
2005
/06
2006
/07
2007
/08
2008
/09
2009
/10
2010
/11
2011
/12*
^êÉ~=éä~åíÉÇ=EDMMM=
Ü~F=
Prod
uctio
n an
d im
port
s
('000
tons
)
Area planted Imports

62
The South African Food Cost Review 2012 The South African Food Cost Review 2012
Figure 54: Wheat consumption and productionSource: SAGIS, 2013
5.5.3 Price trends for wheat
South Africa is a net importer of wheat and hence the local wheat price tends to trade at import parity levels (see Figure 55). This entails, among others, that changes in the exchange rate and the world price for wheat will be reflected almost immediately in the local price of wheat.
Figure 55: Import parity, export parity and SAFEX wheat priceSource: SAGIS, 2013; SAFEX, 2013
5.5.4 Real farm gate and retail prices of brown and white bread
Figure 56 depicts the farm gate price of wheat per ton lagged by four months compared to the retail price of brown and white bread. The average farm gate price of wheat (lagged by four months) increased by 41% from R2 176/ton in 2011 to R2 557/ton in 2012. The real retail price for white and brown bread increased slightly by 3.59% and 3.77% respectively from December 2011 to December 2012.
0
500
1 000
1 500
2 000
2 500
3 000
3 500
2001
/02
2002
/03
2003
/04
2004
/05
2005
/06
2006
/07
2007
/08
2008
/09
2009
/10
2010
/11
2011
/12 C
omm
erci
al p
rodu
ctio
n an
d co
nsum
ptio
n (to
ns)
0
1 000
2 000
3 000
4 000
5 000
6 000
Jan-
08
Mar
-08
May
-08
Jul-0
8 Se
p-08
N
ov-0
8 Ja
n-09
M
ar-0
9 M
ay-0
9 Ju
l-09
Sep-
09
Nov
-09
Jan-
10
Mar
-10
May
-10
Jul-1
0 Se
p-10
N
ov-1
0 Ja
n-11
M
ar-1
1 M
ay-1
1 Ju
l-11
Sep-
11
Nov
-11
Jan-
12
Mar
-12
May
-12
Jul-1
2 Se
p-12
N
ov-1
2
Pric
e (R
/ton)
Wheat Price Import parity
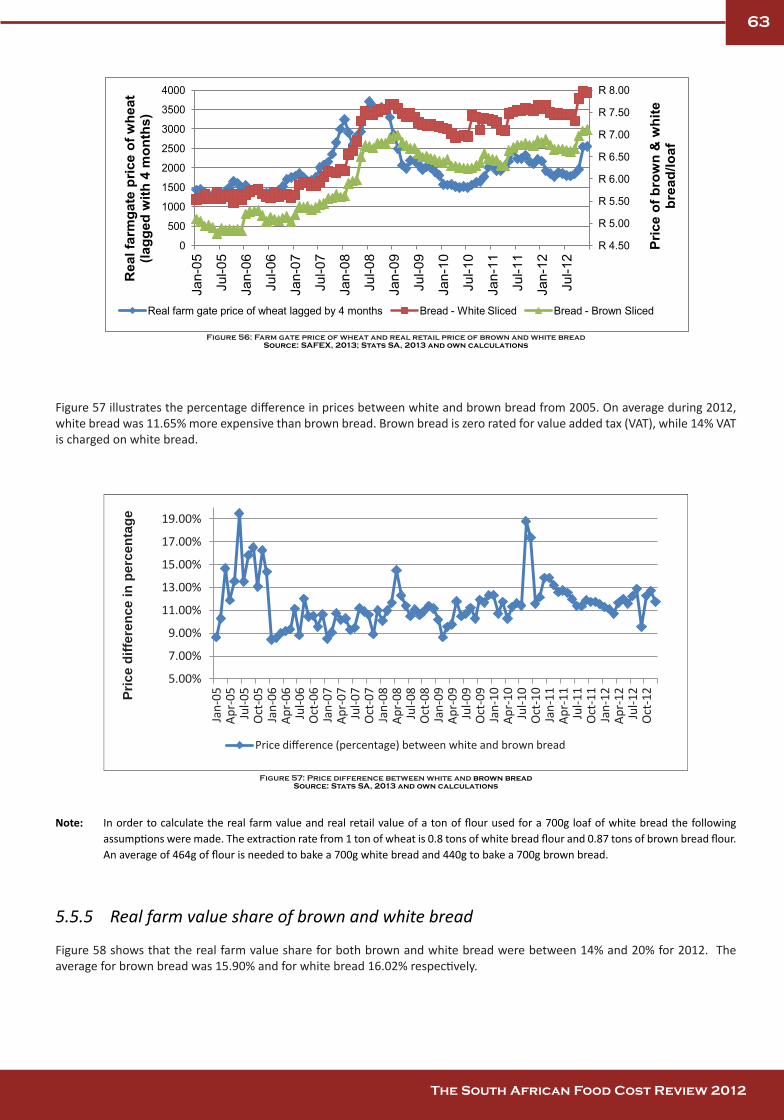
63
The South African Food Cost Review 2012 The South African Food Cost Review 2012
Figure 56: Farm gate price of wheat and real retail price of brown and white breadSource: SAFEX, 2013; Stats SA, 2013 and own calculations
Figure 57 illustrates the percentage difference in prices between white and brown bread from 2005. On average during 2012, white bread was 11.65% more expensive than brown bread. Brown bread is zero rated for value added tax (VAT), while 14% VAT is charged on white bread.
Figure 57: Price difference between white and brown breadSource: Stats SA, 2013 and own calculations
Note: In order to calculate the real farm value and real retail value of a ton of flour used for a 700g loaf of white bread the following assumptions were made. The extraction rate from 1 ton of wheat is 0.8 tons of white bread flour and 0.87 tons of brown bread flour. An average of 464g of flour is needed to bake a 700g white bread and 440g to bake a 700g brown bread.
5.5.5 Real farm value share of brown and white bread
Figure 58 shows that the real farm value share for both brown and white bread were between 14% and 20% for 2012. The average for brown bread was 15.90% and for white bread 16.02% respectively.
R 4.50
R 5.00
R 5.50
R 6.00
R 6.50
R 7.00
R 7.50
R 8.00
0
500
1000
1500
2000
2500
3000
3500
4000
Jan-
05
Jul-0
5
Jan-
06
Jul-0
6
Jan-
07
Jul-0
7
Jan-
08
Jul-0
8
Jan-
09
Jul-0
9
Jan-
10
Jul-1
0
Jan-
11
Jul-1
1
Jan-
12
Jul-1
2
Pric
e of
bro
wn
& w
hite
br
ead/
loaf
Rea
l far
mga
te p
rice
of w
heat
(la
gged
with
4 m
onth
s)
Real farm gate price of wheat lagged by 4 months Bread - White Sliced Bread - Brown Sliced
5.00%
7.00%
9.00%
11.00%
13.00%
15.00%
17.00%
19.00%
Jan-
05
Apr-
05
Jul-0
5 O
ct-0
5 Ja
n-06
Ap
r-06
Ju
l-06
Oct
-06
Jan-
07
Apr-
07
Jul-0
7 O
ct-0
7 Ja
n-08
Ap
r-08
Ju
l-08
Oct
-08
Jan-
09
Apr-
09
Jul-0
9 O
ct-0
9 Ja
n-10
Ap
r-10
Ju
l-10
Oct
-10
Jan-
11
Apr-
11
Jul-1
1 O
ct-1
1 Ja
n-12
Ap
r-12
Ju
l-12
Oct
-12 Pr
ice
diffe
renc
e in
per
cent
age

64
The South African Food Cost Review 2012 The South African Food Cost Review 2012
Figure 58: Real farm value share of brown and white breadSource: SAFEX, 2013; Stats SA, 2013 and own calculations
5.5.6 Farm-to-retail price spread (FTRPS)
Figure 59 shows the real FTRPS for brown and white bread. On average the FTRPS for brown bread was R13 002/t of flour in 2012. In the case of white bread the average FTRPS was R13 731/t of flour in 2012. Cognisance should be taken that the FTRPS since 2008 is significantly higher than the preceding period depicted in Figure 59.
Figure 59: Real farm to retail price spread of brown and white breadSource: SAFEX, 2013; Stats SA, 2013 and own calculations
Note: The real farm-to-retail price spread is calculated by deducting the real farm value for a ton of flour from the real retail value of a ton of flour. The price spread represents all the costs involved in the value adding process.
0.00%
5.00%
10.00%
15.00%
20.00%
25.00%
30.00%
35.00%
Jan-
05
May
-05
Se
p-05
Ja
n-06
M
ay-0
6
Sep-
06
Jan-
07
May
-07
Se
p-07
Ja
n-08
M
ay-0
8
Sep-
08
Jan-
09
May
-09
Se
p-09
Ja
n-10
M
ay-1
0
Sep-
10
Jan-
11
May
-11
Se
p-11
Ja
n-12
M
ay-1
2
Sep-
12
Perc
enta
ge
Farm value share brown bread Farm value share white bread
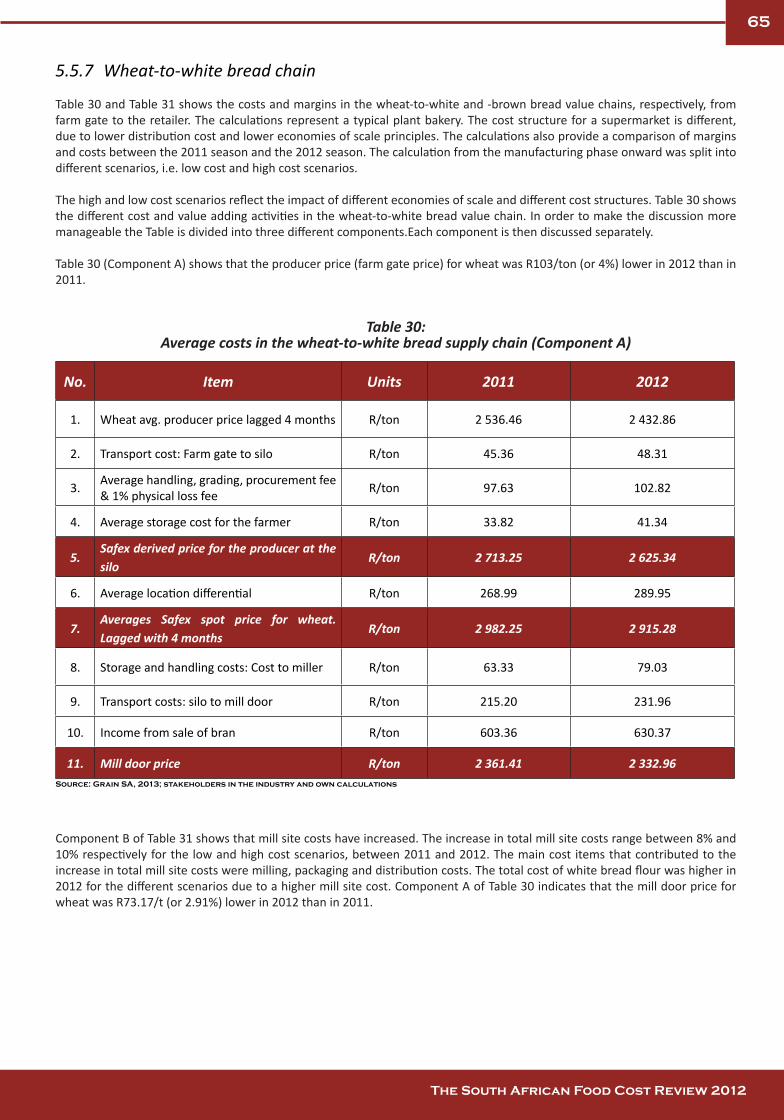
65
The South African Food Cost Review 2012 The South African Food Cost Review 2012
5.5.7 Wheat-to-white bread chain
Table 30 and Table 31 shows the costs and margins in the wheat-to-white and -brown bread value chains, respectively, from farm gate to the retailer. The calculations represent a typical plant bakery. The cost structure for a supermarket is different, due to lower distribution cost and lower economies of scale principles. The calculations also provide a comparison of margins and costs between the 2011 season and the 2012 season. The calculation from the manufacturing phase onward was split into different scenarios, i.e. low cost and high cost scenarios.
The high and low cost scenarios reflect the impact of different economies of scale and different cost structures. Table 30 shows the different cost and value adding activities in the wheat-to-white bread value chain. In order to make the discussion more manageable the Table is divided into three different components.Each component is then discussed separately.
Table 30 (Component A) shows that the producer price (farm gate price) for wheat was R103/ton (or 4%) lower in 2012 than in 2011.
Table 30: Average costs in the wheat-to-white bread supply chain (Component A)
No. Item Units 2011 2012
1. Wheat avg. producer price lagged 4 months R/ton 2 536.46 2 432.86
2. Transport cost: Farm gate to silo R/ton 45.36 48.31
3. Average handling, grading, procurement fee & 1% physical loss fee R/ton 97.63 102.82
4. Average storage cost for the farmer R/ton 33.82 41.34
5.Safex derived price for the producer at the silo
R/ton 2 713.25 2 625.34
6. Average location differential R/ton 268.99 289.95
7.Averages Safex spot price for wheat. Lagged with 4 months
R/ton 2 982.25 2 915.28
8. Storage and handling costs: Cost to miller R/ton 63.33 79.03
9. Transport costs: silo to mill door R/ton 215.20 231.96
10. Income from sale of bran R/ton 603.36 630.37
11. Mill door price R/ton 2 361.41 2 332.96Source: Grain SA, 2013; stakeholders in the industry and own calculations
Component B of Table 31 shows that mill site costs have increased. The increase in total mill site costs range between 8% and 10% respectively for the low and high cost scenarios, between 2011 and 2012. The main cost items that contributed to the increase in total mill site costs were milling, packaging and distribution costs. The total cost of white bread flour was higher in 2012 for the different scenarios due to a higher mill site cost. Component A of Table 30 indicates that the mill door price for wheat was R73.17/t (or 2.91%) lower in 2012 than in 2011.

66
The South African Food Cost Review 2012 The South African Food Cost Review 2012
Table 31: Average costs in the wheat-to-white bread supply chain (Component B)
No. Item Unit 2011 2012
11. Mill door price R/ton 2 361.41 2 332.96
MANUFACTURING COST Scen 1 Scen 2 Scen 1 Scen 2
Production cost (milling costs) R/ton grain 175.43 193.90 196.48 217.17
Packing cost & losses R/ton grain 34.17 37.77 38.07 42.08
Administration, warehouse and selling R/ton grain 239.22 264.41 260.75 288.20
12. Mill site costs R/ton grain 448.83 496.08 495.31 547.45
Distribution costs R/ton grain 241.50 266.92 273.45 302.24
13. Total mill site costs R/ton grain 690.33 763.00 768.76 849.68
14. Fixed capital costs R/ton grain 248.11 274.23 270.44 298.91
15. Floating capital costs R/ton grain 103.66 114.58 112.99 124.89
16. Total millers costs R/ton grain 1 042.11 1 151.80 1 152.20 1 273.48
17. Total wheat flour cost for white bread (11 + 16) 3 403.52 3 513.21 3 485.15 3 606.44
17. Conversion cost R/ton grain 1 042.11 1 151.80 1 152.20 1 273.48
18. Average cost of wheat (mill door price) R/ton grain 2 361.41 2 361.41 2 332.96 2 332.96
19. Total wheat flour cost for white bread R/ton grain 3 403.52 3 513.21 3 485.15 3 606.44
18. Average extraction for white bread 80.0% 80.0% 80.0% 80.0%
19. Total cost of white bread flour (17 ÷ 18) 4 254.40 4 391.52 4 356.44 4 508.05
Source: Consultation with Stakeholders and own calculations
Component C of Table 32 shows that the cost of flour to bake one white bread loaf (line 21) increased from 2011 to 2012. Packaging cost ranged between R0.30 and R0.34 in 2012, which was a slight increase compared to 2011. Distribution cost increased by 14.4% and overhead cost decreased by 31% on average from 2011 to 2012. Overall, the cost of producing a white bread has increased, on average, by 0.9% and 6.7% (cost of flour included) from 2011 to 2012. The price of a loaf of white bread has increased by 7.5% during the period applicable to this analysis. The margin between the selling price of a loaf of white bread and the cost of producing has increased between 8.6% and 17.4%. This margin is made of VAT (R1.16/loaf), a retailer margin of 110.32% and 11.22% (R0.97 to R0.98/loaf). The average costs associated with rebates, losses and returns (R0.65/loaf) to R0.77/loaf. The baker and miller margin increase from R0.49 to R0.90 for scenario 1 and increase from R0.79 to R1.30 for scenario 2.

67
The South African Food Cost Review 2012 The South African Food Cost Review 2012
Table 32: Average cost in the wheat-to-white bread value chain (Component C)
2011 2012
No. Item Unit Scen 1 Scen 2 Scen 1 Scen 2
19. Average cost of white bread flour R/ton meal 4 254.40 4 391.52 4 356.44 4 508.05
20. Extraction rate of white bread from 1 ton Loaves/ton 2155 2155 2155 2155
21. Cost of flour per loaf R/loaf 1.97 2.01 2.09 2.02
22. Packaging R/loaf 0.32 0.29 0.34 0.30
23. Other raw materials R/loaf 0.48 0.44 0.50 0.46
24. Production & Maintenance R/loaf 1.21 1.09 1.16 1.05
25. Distribution R/loaf 0.81 0.73 0.95 0.86
26. Overheads (Admin + sales) R/loaf 0.71 0.65 0.55 0.49
27. Cost of producing white bread R/loaf 5.50 5.20 5.58 5.18
28. Bakers & millers margin R/loaf 0.49 0.79 0.90 1.30
29. Wholesale price R/loaf 5.99 5.99 6.48 6.48
30. Rebates, losses & returns R/loaf 0.66 0.66 0.71 0.71
31. Retailers purchase price R/loaf 6.65 6.65 7.19 7.19
32. Retailers margin R/loaf 1.00 1.00 1.08 1.08
33. White bread retail price (VAT Exc) R/loaf 7.65 7.65 8.27 8.27
34. VAT (14%) R/loaf 1.07 1.07 1.16 1.16
35. White bread retail price (VAT Inc) R/loaf 8.72 8.72 9.43 9.43
36.Margin between selling price and the cost of producing a loaf of white bread (35 - 27)
R/loaf 3.22 3.52 3.85 4.25
Sources: Discussions with different industry stakeholders at various levels of the wheat value chain. Average annual chop price; South Africa Feedlot Association; SAFEX, 2013
Table 33 provides an aggregated cost breakdown of certain cost items for the wheat-to-white bread value chain. The biggest cost component is capped on the bakery side. Elements contribute towards these costs include administered prices and the cost of bread flour; this is round 55% to 60% of the bakery cost. Distribution contributes on average 25% to 30% of the bakery cost. The VAT component constitutes R1.07 which represents 12% to 13% of the total value of a white bread loaf.
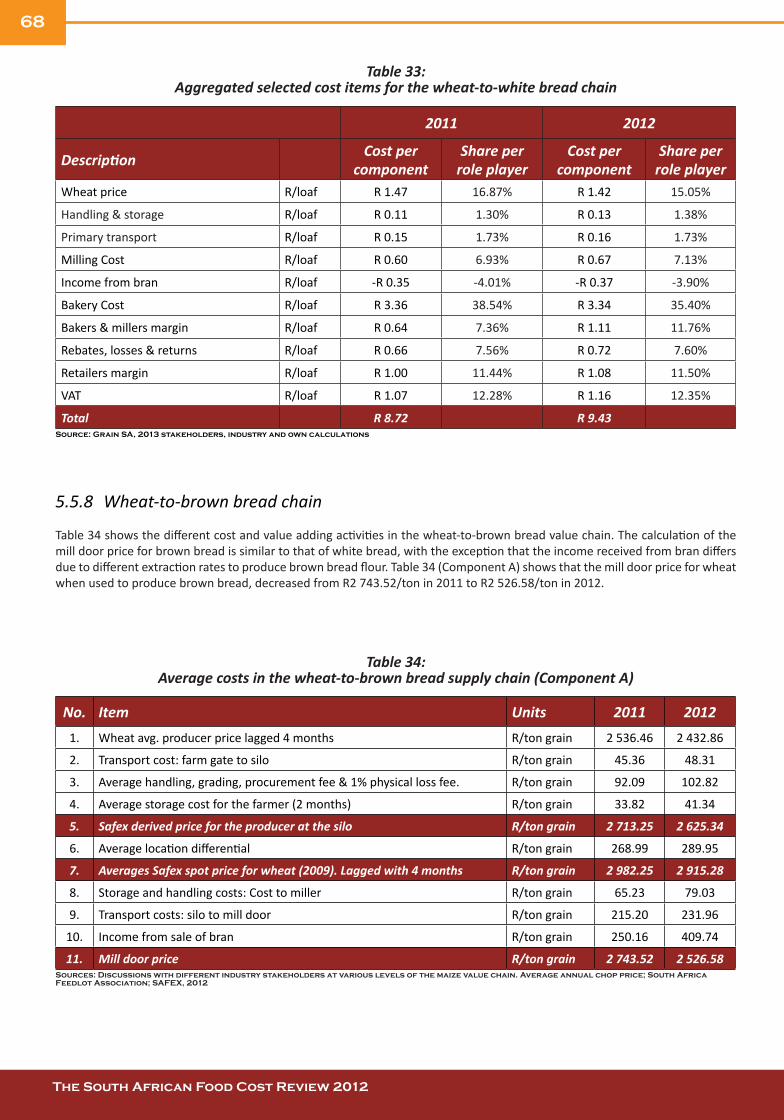
68
The South African Food Cost Review 2012 The South African Food Cost Review 2012
Table 33: Aggregated selected cost items for the wheat-to-white bread chain
2011 2012
Description Cost per component
Share per role player
Cost per component
Share per role player
Wheat price R/loaf R 1.47 16.87% R 1.42 15.05%
Handling & storage R/loaf R 0.11 1.30% R 0.13 1.38%
Primary transport R/loaf R 0.15 1.73% R 0.16 1.73%
Milling Cost R/loaf R 0.60 6.93% R 0.67 7.13%
Income from bran R/loaf -R 0.35 -4.01% -R 0.37 -3.90%
Bakery Cost R/loaf R 3.36 38.54% R 3.34 35.40%
Bakers & millers margin R/loaf R 0.64 7.36% R 1.11 11.76%
Rebates, losses & returns R/loaf R 0.66 7.56% R 0.72 7.60%
Retailers margin R/loaf R 1.00 11.44% R 1.08 11.50%
VAT R/loaf R 1.07 12.28% R 1.16 12.35%
Total R 8.72 R 9.43 Source: Grain SA, 2013 stakeholders, industry and own calculations
5.5.8 Wheat-to-brown bread chain
Table 34 shows the different cost and value adding activities in the wheat-to-brown bread value chain. The calculation of the mill door price for brown bread is similar to that of white bread, with the exception that the income received from bran differs due to different extraction rates to produce brown bread flour. Table 34 (Component A) shows that the mill door price for wheat when used to produce brown bread, decreased from R2 743.52/ton in 2011 to R2 526.58/ton in 2012.
Table 34:
Average costs in the wheat-to-brown bread supply chain (Component A)
No. Item Units 2011 20121. Wheat avg. producer price lagged 4 months R/ton grain 2 536.46 2 432.86
2. Transport cost: farm gate to silo R/ton grain 45.36 48.31
3. Average handling, grading, procurement fee & 1% physical loss fee. R/ton grain 92.09 102.82
4. Average storage cost for the farmer (2 months) R/ton grain 33.82 41.34
5. Safex derived price for the producer at the silo R/ton grain 2 713.25 2 625.34
6. Average location differential R/ton grain 268.99 289.95
7. Averages Safex spot price for wheat (2009). Lagged with 4 months R/ton grain 2 982.25 2 915.28
8. Storage and handling costs: Cost to miller R/ton grain 65.23 79.03
9. Transport costs: silo to mill door R/ton grain 215.20 231.96
10. Income from sale of bran R/ton grain 250.16 409.74
11. Mill door price R/ton grain 2 743.52 2 526.58Sources: Discussions with different industry stakeholders at various levels of the maize value chain. Average annual chop price; South Africa Feedlot Association; SAFEX, 2012

69
The South African Food Cost Review 2012 The South African Food Cost Review 2012
Table 35 (Component B) shows that total mill site costs decreased on average by 4.3% from 2011 to 2012. The main cost item that contributed to the decrease was a lower wheat price. The total cost to produce a brown bread loaf (measured in Rand per ton of meal) decreased by 0.6% between 2011 and 2012.
Table 35: Average costs in the wheat-to-brown bread supply chain (Component B)
2011 2012
11. Mill door price R/ton grain 2 743.52 2 625.85
MANUFACTURING COST Scen 1 Scen 2 Scen 1 Scen 2
Production cost (milling costs) R/ton grain 193.41 175.43 210.82 191.22
Packing cost & losses R/ton grain 37.68 34.17 41.07 37.25
Administration, warehouse and selling R/ton grain 263.74 239.22 287.48 260.75
12. Mill site costs R/ton grain 494.84 448.83 539.37 489.23
Distribution costs R/ton grain 266.26 241.50 290.22 263.24
13. Total mill site costs R/ton grain 761.09 690.33 829.59 752.46
14. Fixed capital costs R/ton grain 273.54 248.11 298.16 270.44
15. Floating capital costs R/ton grain 114.29 103.66 124.58 112.99
16. Total millers costs R/ton grain 1148.92 1042.11 1252.33 1135.90
17. Total wheat flour cost for brown bread (11 + 16) R/ton grain 3 892.44 3 785.62 3 878.18 3 761.75
18. Average extraction for brown bread 0.87 0.87 0.87 0.87
19. Total cost of brown bread flour R/ton meal 4474.07 4351.29 4457.67 4323.85Source: Grain SA, 2013 stakeholders, industry and own calculations
Table 36 (Component C) shows that the total millers cost increased on average by 9%. The price of a loaf of brown bread has increase by 8.1% during the period under review. The retailer to miller margin increased from R1.90 to R2.89 and R2.34 to R3.28 respectively.
Figures differ from the 2011 Food Cost Review released in 2012 due to different weight used to bake brown bread. The current version only makes use of a brown bread with a 440g brown bread flour ingredient.

70
The South African Food Cost Review 2012 The South African Food Cost Review 2012
Table 36: Average cost in the wheat-to-white bread value chain (Component C)
No Item Unit 2011 2012
Scen 1 Scen 2 Scen 1 Scen 2 21. Average cost of brown bread flour R/ton meal 4 474 4 474 4 458 4 324
22. Extraction rate of white bread from 1 ton flour (464g loafs/ton flour). Loaves/ton 2155 2155 2155 2155
23. Cost of flour per loaf R/loaf 2.08 2.08 2.07 2.01
24. Packaging R/loaf 0.29 0.26 0.34 0.30
25. Other raw materials R/loaf 0.51 0.46 0.50 0.46
26. Production labour R/loaf 1.10 1.00 1.16 1.05
27. Distribution R/loaf 1.10 1.00 0.95 0.86
28. Overheads R/loaf 0.75 0.68 0.55 0.49
29. Cost of producing brown bread R/loaf 5.82 5.47 5.55 5.16
30. Bakers & millers margin R/loaf 0.29 0.65 1.06 1.46
31. Wholesale price R/loaf 6.12 6.12 6.62 6.62
32. Rebates, losses & returns R/loaf 0.67 0.67 0.73 0.73
33. Retailer’s purchase price R/loaf 6.79 6.79 7.34 7.34
34. Retailers margin R/loaf 1.02 1.02 1.10 1.10
35. Brown bread retail price (VAT Exc) R/loaf 7.81 7.81 8.45 8.45
37. VAT (14%) R/loaf 0.00 0.00 0.00 0.00
38. Brown bread retail price (VAT Inc) R/loaf 7.81 7.81 8.45 8.45
39 Brown bread margin from miller to retailer R/loaf 1.98 2.34 2.89 3.28
Sources: Discussions with different industry stakeholders at various levels of the maize value chain. Average annual chop price; South Africa Feedlot Association; SAFEX, 2013
Table 37 provides an aggregated cost breakdown of certain cost items for the wheat-to-bread value chain. The biggest cost component is capped on the bakery side. Elements that contributed towards these costs include administered prices and the cost of bread flour. Bread flour constitutes about 55% to 65% of the bakery cost. Distribution contributes on average 25% to 30% of the bakery cost.
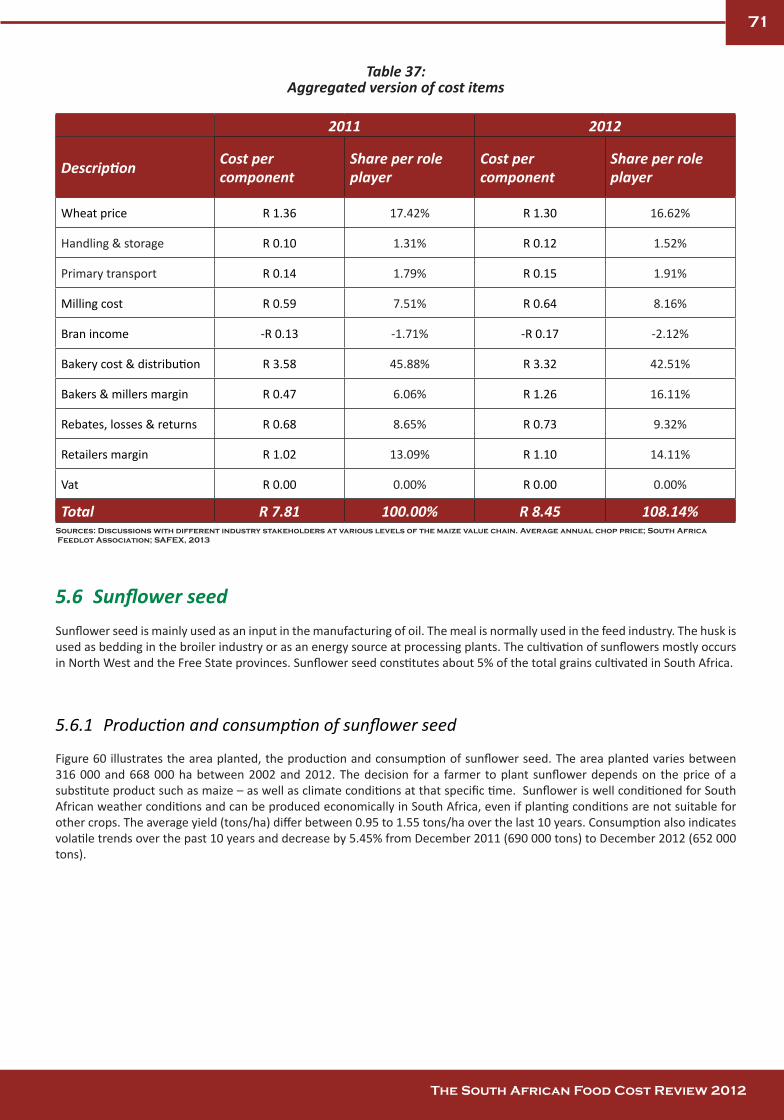
71
The South African Food Cost Review 2012 The South African Food Cost Review 2012
Table 37: Aggregated version of cost items
2011 2012
Description Cost per component
Share per role player
Cost per component
Share per role player
Wheat price R 1.36 17.42% R 1.30 16.62%
Handling & storage R 0.10 1.31% R 0.12 1.52%
Primary transport R 0.14 1.79% R 0.15 1.91%
Milling cost R 0.59 7.51% R 0.64 8.16%
Bran income -R 0.13 -1.71% -R 0.17 -2.12%
Bakery cost & distribution R 3.58 45.88% R 3.32 42.51%
Bakers & millers margin R 0.47 6.06% R 1.26 16.11%
Rebates, losses & returns R 0.68 8.65% R 0.73 9.32%
Retailers margin R 1.02 13.09% R 1.10 14.11%
Vat R 0.00 0.00% R 0.00 0.00%
Total R 7.81 100.00% R 8.45 108.14%Sources: Discussions with different industry stakeholders at various levels of the maize value chain. Average annual chop price; South Africa Feedlot Association; SAFEX, 2013
5.6 Sunflower seedSunflower seed is mainly used as an input in the manufacturing of oil. The meal is normally used in the feed industry. The husk is used as bedding in the broiler industry or as an energy source at processing plants. The cultivation of sunflowers mostly occurs in North West and the Free State provinces. Sunflower seed constitutes about 5% of the total grains cultivated in South Africa.
5.6.1 Production and consumption of sunflower seed
Figure 60 illustrates the area planted, the production and consumption of sunflower seed. The area planted varies between 316 000 and 668 000 ha between 2002 and 2012. The decision for a farmer to plant sunflower depends on the price of a substitute product such as maize – as well as climate conditions at that specific time. Sunflower is well conditioned for South African weather conditions and can be produced economically in South Africa, even if planting conditions are not suitable for other crops. The average yield (tons/ha) differ between 0.95 to 1.55 tons/ha over the last 10 years. Consumption also indicates volatile trends over the past 10 years and decrease by 5.45% from December 2011 (690 000 tons) to December 2012 (652 000 tons).

72
The South African Food Cost Review 2012 The South African Food Cost Review 2012
Figure 60: Area planted; production and consumption of sunflowers seed in South AfricaSource: SAGIS, 2013; own calculations, 2013
5.6.2 Price trends for sunflower seeds
The domestic sunflower price as illustrated in Figure 61, increased with 41.24% from December 2011 (R4 246) to December 2012 (R5 997). The international price for sunflower moved sideways in the same period. The retail price of sunflower oil (750ml) increased with 4.26% from December 2011 (R16.65/750ml) to December 2012 (R17.36/750ml)
.
Figure 61: Domestic sunflower seed price and retail price of sunflower (750 mℓ)Source: SAGIS and Stats SA, 2013
0
100
200
300
400
500
600
700
800
0
100
200
300
400
500
600
700
800
900
1000
2002 2003 2004 2005 2006 2007 2008 2009 2010 2011 2012
Hec
tare
s
Prod
uctio
n an
d de
man
d (to
ns)
Area planted
R0.00 R2.00 R4.00 R6.00 R8.00 R10.00 R12.00 R14.00 R16.00 R18.00 R20.00
2500
3000
3500
4000
4500
5000
5500
6000
6500
Jan-
08
Apr-
08
Jul-0
8
Oct
-08
Jan-
09
Apr-
09
Jul-0
9
Oct
-09
Jan-
10
Apr-
10
Jul-1
0
Oct
-10
Jan-
11
Apr-
11
Jul-1
1
Oct
-11
Jan-
12
Apr-
12
Jul-1
2
Oct
-12
Pric
e (R
/750
ml)
Pric
e (R
/ton)

73
The South African Food Cost Review 2012 The South African Food Cost Review 2012
5.7 SoybeansSoybeans are cultivated in KwaZulu-Natal and Mpumalanga provinces under dryland and irrigation conditions. Increased plantings occur in the eastern parts of the Free State province. Some farmers in the North West province and the northern parts of the Free State recently started to plant soybeans with success. Soybeans constitute approximately 3% of the total grains produced in South Africa.
5.7.1 Soybean production
South Africa produced 624 000 tons of soybeans in the 2012 as illustrated in Figure 62. From 2011 to 2012 the production of soybeans decreased by 8.93%. The area planted though, increased with 12.92% from 2011 (418 000 ha) to 2012 (472 000 ha). Research and development are limited and very few new cultivars were released during the past five years in South Africa. The Protein Research Institute (PRI) promotes and funds the development and testing of foreign cultivars in South Africa.
Figure 62: Area planted, production and demand of soybean seed in South AfricaSource: SAGIS and own calculations, 2013
5.7.2 Soybean consumption
South Africa domestically demanded approximately 597 000 tons of soybeans in 2012, of which 145 000 tons were processed as feed and full fat soybean meal. This is a decrease of 3.28% in feed and full fat soybean meal from 2011 to 2012. The highest quantity beans processed for feed and full fat soybean meal were in the 2006 season at 241 000 tons. South Africa showed an increased demand for soybeans for the crushing of oil and oilcake market. This is mainly due to a higher demand in high quality protein meal for the feed industry. The demand for soybeans for human consumption was 27 000 tons in 2012. Soybean consumption in 2012 was on a very slight decrease in South Africa from 2011 as illustrated in Figure 63.
0
100
200
300
400
500
600
700
800
0
50
100
150
200
250
300
350
400
450
500
2002
2003
2004
2005
2006
2007
2008
2009
2010
2011
2012
Prod
uctio
n (to
ns)
Are
a pl
ante
d ('0
00 h
a's)
Area planted

74
The South African Food Cost Review 2012 The South African Food Cost Review 2012
Figure 63: Area planted, production and demand for soybeans in South AfricaSource: SAGIS and own calculations, 2012
5.7.3 Soybean trade
The exports of soybeans from South Africa differ from year to year. South Africa exported 6 031 tons of soybean oil-cake, on average, between 2002 and 2012. These figures spiked in 2008 to 13 449 tons and deceased dramatically thereafter to 3 792 tons in 2012 (ITC, 2012).
South Africa imports high protein meal mainly from Argentina. Total imports of South Africa decreased from 945 543 tons in 2011 to 767 412 tons in 2012 as illustrated in Table 38. The total value of soybean oil-cake and meal imports constitutes to a value of US$ 342 442 (US$ ‘000) (ITC trademap, 2012).
Table 38: Import of soybean products for 2011
Soya products HS codeImport value (2011)
US$ thousandImport quantity (tons)
Refined soya oil 150790 $ 225 101 167 259
Soy oil–cake 2304 $ 340 587 767 412
Soy oil crude 150710 $ 37 462 30 680
Total $ 600 067 965 226
Source: Global Trade Atlas, 2013
0
100
200
300
400
500
600
700
0 50
100 150 200 250 300 350 400 450
2002 2003 2004 2005 2006 2007 2008 2009 2010 2011 2012
Tota
l dem
and
Diff
eren
tiate
d de
man
d (to
ns)
Feed & Full-fat soya Crushed for oil and oilcake

75
The South African Food Cost Review 2012 The South African Food Cost Review 2012
5.7.4 Price trends for soybeans
Figure 64 illustrates the domestic (SAFEX), import and export parity price at Randfontein for soybeans. The domestic price increased with 65.13% from December 2011 (R3 261/ton) to December 2012 (R5 385/ton). The import parity price increased by 30.76 % over the same period and export parity price by 44.21 %.
Figure 64: Price trends for soybeansSource: Grain SA, 2012
5.8 Vegetable sectorFigure 65 shows the volumes of selected fresh vegetables sold at the national fresh produce markets from January 2008 to December 2012. The average volume of tomatoes, onions and potatoes sold increased by 5.94%, 2.51% and 5.47% respectively from 2011 to 2012. The average volume of cabbages sold decreased by 7.54% from 9 053.10 tons in 2011 to 8 370.06 tons in 2012.
Figure 65: Volume of selected vegetables sold at fresh produce marketsSource: DAFF, 2013 and own calculations
0
1000 2000 3000
4000 5000
6000 7000
8000 Ja
n-08
Apr-
08
Jul-0
8
Oct
-08
Jan-
09
Apr-
09
Jul-0
9
Oct
-09
Jan-
10
Apr-
10
Jul-1
0
Oct
-10
Jan-
11
Apr-
11
Jul-1
1
Oct
-11
Jan-
12
Apr-
12
Jul-1
2
Oct
-12
Ran
d pe
r ton
SAFEX Soybean RANDFONTEIN Import Parity RANDFONTEIN Export Parity
0
20000
40000
60000
80000
100000
120000
Jan-
08
Apr
-08
Jul-0
8
Oct
-08
Jan-
09
Apr
-09
Jul-0
9
Oct
-09
Jan-
10
Apr
-10
Jul-1
0
Oct
-10
Jan-
11
Apr
-11
Jul-1
1
Oct
-11
Jan-
12
Apr
-12
Jul-1
2
Oct
-12
Volu
me
sold
(ton
s)
Tomatoes Onions Potatoes Cabbage

76
The South African Food Cost Review 2012 The South African Food Cost Review 2012
The market price trends for selected fresh vegetables from January 2008 to December 2012 are shown in Figure 66. The market prices for selected vegetables were, on average, lower in 2011 than in 2012. In nominal terms, the average market price per ton of cabbages, onions, tomatoes and potatoes was 20.73%, 16.96%, 3.95% and 2.37% higher in 2012 than in 2011.
Figure 66: Market price trends for selected fresh vegetablesSource: DAFF, 2013 and own calculations
Figure 67 depicts the nominal retail price trends for selected fresh vegetables from January 2008 to December 2012. Contrary to the nominal market price, the nominal average retail price for potatoes and onions in 2012 respectively were 2.23% and 0.14% lower than in 2011. On a similar note, the retail price of cabbage followed an increasing trend as the market price rose. The average retail price of cabbage increased by 20.38% between 2011 (R8.46/kg) and 2012 (R10.19/kg). The average retail price of tomatoes was 7.74% higher in 2012 than it was in 2011.
Figure 67: Retail price trends for selected fresh vegetablesSource: Stats SA, 2013 and own calculations
Figure 68 shows the real FTRPS and the real farm value share of cabbage. The real FTRPS of cabbage increased by 11.12%, on average, between 2011 and 2012. The real farm value share of cabbage decreased by 1.1%, on average, between 2011 and 2012.
-
1.00
2.00
3.00
4.00
5.00
6.00
7.00
8.00 Ja
n-08
Apr-
08
Jul-0
8
Oct
-08
Jan-
09
Apr-
09
Jul-0
9
Oct
-09
Jan-
10
Apr-
10
Jul-1
0
Oct
-10
Jan-
11
Apr-
11
Jul-1
1
Oct
-11
Jan-
12
Apr-
12
Jul-1
2
Oct
-12
Mar
ket p
rice
(R/k
g)
Cabbages (R/kg) Onions (R/kg) Tomatoes (R/kg) Potatoes (R/kg)
-
5.00
10.00
15.00
20.00
25.00
Jan-
08
Apr-
08
Jul-0
8
Oct
-08
Jan-
09
Apr-
09
Jul-0
9
Oct
-09
Jan-
10
Apr-
10
Jul-1
0
Oct
-10
Jan-
11
Apr-
11
Jul-1
1
Oct
-11
Jan-
12
Apr-
12
Jul-1
2
Oct
-12
Ret
ail p
rice
(R/k
g)
Cabbage (R/kg) Onions (R/kg) Tomatoes (R/kg) Potatoes (R/kg)

77
The South African Food Cost Review 2012 The South African Food Cost Review 2012
Figure 68: Real farm-to-retail price spread and farm value share of cabbagesSource: DAFF, 2013; Stats SA, 2013 and own calculations
The real FTRPS and the real farm value share of onions are depicted in Figure 69. The real FTRPS of onions decreased by 10.37%, on average, between 2011 and 2012. The real farm value share increased by 12.65%, on average, between 2011 and 2012.
Figure 69: Real farm-to-retail price spread and farm value share of onionsSource: DAFF, 2013; Stats SA, 2013 and own calculations
Figure 70 shows the real FTRPS and farm value share of tomatoes. The real FTRPS of tomatoes decreased by 0.17%, on average, between 2011 and 2012. The real farm value share of tomatoes decreased by 0.12%, on average, between 2011 and 2012.
0 5 10 15 20 25 30 35 40 45
0 1 2 3 4 5 6 7 8
Jan-
08
Apr
-08
Jul-0
8
Oct
-08
Jan-
09
Apr
-09
Jul-0
9
Oct
-09
Jan-
10
Apr
-10
Jul-1
0
Oct
-10
Jan-
11
Apr
-11
Jul-1
1
Oct
-11
Jan-
12
Apr
-12
Jul-1
2
Oct
-12
Farm
val
ue s
hare
(%)
Farm
-to-r
etai
l pric
e sp
read
(R)
Farm to Retail price Spread of Cabbages Farm Value Share of Cabbages
10
15
20
25
30
35
40
45
3
4
5
6
7
8
9
Jan-
08
Apr
-08
Jul-0
8
Oct
-08
Jan-
09
Apr
-09
Jul-0
9
Oct
-09
Jan-
10
Apr
-10
Jul-1
0
Oct
-10
Jan-
11
Apr
-11
Jul-1
1
Oct
-11
Jan-
12
Apr
-12
Jul-1
2
Oct
-12
Farm
val
ue s
hare
(%)
Farm
-to-r
etai
l pric
e sp
read
(R)
Farm to Retail price Spread of Onions Farm Value Share of Onions

78
The South African Food Cost Review 2012 The South African Food Cost Review 2012
Figure 70: Real FRPS and farm value share of tomatoesSource: DAFF, 2013; Stats SA, 2013 and own calculations
The real FTRPS and real farm value share of potatoes are shown in Figure 71. The average real FTRPS of potatoes decreased by 7.88%, on average, between 2011 and 2012. The real farm value share of potatoes increased by 5.48%, on average, between 2011 and 2012.
Figure 71: Real farm-to-retail price spread and farm value share of potatoesSource: DAFF, 2013; Stats SA, 2013 and own calculations
10 15 20 25 30 35 40 45 50
4 5 6 7 8 9
10 11 12 13 14
Jan-
08
Apr
-08
Jul-0
8
Oct
-08
Jan-
09
Apr
-09
Jul-0
9
Oct
-09
Jan-
10
Apr
-10
Jul-1
0
Oct
-10
Jan-
11
Apr
-11
Jul-1
1
Oct
-11
Jan-
12
Apr
-12
Jul-1
2
Oct
-12 Fa
rm v
alue
sha
re (%
)
Farm
-to-r
etai
l pric
e sp
read
(R)
Farm to Retail price Spread of Tomatoes Farm Value Share of Tomatoes
0
10
20
30
40
50
0 1 2 3 4 5 6 7 8
Jan-
08
Apr
-08
Jul-0
8
Oct
-08
Jan-
09
Apr
-09
Jul-0
9
Oct
-09
Jan-
10
Apr
-10
Jul-1
0
Oct
-10
Jan-
11
Apr
-11
Jul-1
1
Oct
-11
Jan-
12
Apr
-12
Jul-1
2
Oct
-12
Farm
val
ue s
hare
(%)
Farm
-to-r
etai
l pric
e sp
read
(R)
Farm to Retail price Spread of Potatoes Farm Value Share of Potatoes

79
The South African Food Cost Review 2012 The South African Food Cost Review 2012
6 SELECTED TOPICS
6.1 South African Social Assistance Programme: Can Beneficiaries Afford Food?
South Africa faces a triple challenge of inequality, poverty and unemployment. Many households are still living in abject poverty and are vulnerable to food insecurity. In order to address the negative impact of these challenges, measures such as a social assistance programme in the form of social grants have been introduced. Samson et al. (2007) and SARPN (2004) mention that social grants reduce poverty gap by 47% in South Africa and provide access to primary education and health care, and further helps beneficiaries to particularly deal with unexpected events such as death, orphanage, widowhood and sickness. To date, the democratic government provides social grants to approximately 16 million people which is equivalent to one-third of the South African population. This number is a clear indication of the contribution that social grants makes to millions of children, elderly persons, women, men, youth and people living with disabilities. However, the question which remains is, whether the social grants are enough to cover all social needs?
There are seven types of social grants namely, Old Age Grant (OAG), War Veteran Grant (WVG), Disability Grant (DG), Grant in Aid (GIA), Care Dependency (CDG), Foster Child Grant (FCG) and Child Support Grant (CSG). Table 39 shows the different grant system and provincial shares.
Table 39: Total number of social grants types and the provincial shares as at 28/02/13
Province Social Grant Type
OAG WVG DG GIA CDG FCG CSG TOTAL
EC 507,573 75 185,459 9,261 18,264 115,133 1,841,399 2,677,164
FS 171,320 8 86,522 1,185 5,825 40,118 633,776 938,754
GP 422,265 148 123,880 1,609 15,630 57,826 1,573,790 2,195,148
KZN 589,547 86 313,946 29,079 35,875 134,024 2,751,183 3,853,740
LP 394,150 47 88,784 11,044 11,782 56,909 1,581,874 2,144,590
MP 226,558 28 81,211 2,832 8,566 34,594 1,048,041 1,401,830
NW 216,524 19 86,296 4,043 8,278 41,382 275,935 422,375
WC 260,029 161 153,047 9,534 10,729 28,310 859,765 1,321,575
TOTAL 2,862,570 589 1,168,464 72,767 119,384 522,181 11,314,128 16,060,08Source: SASSA: 2013
As depicted in Table 37, OAG has a total of 2.8 million beneficiaries, DG has approximately 1.1 million beneficiaries, FCG has 522 181 beneficiaries, WVG has 589, CDG has 119 384 beneficiaries, CSG has 11 million beneficiaries and Grant-in Aid has 72 767 beneficiaries (SASSA, 2013). In terms of provincial beneficiary’s shares and in a ranking order, KZN tops all the provinces and is followed by EC and LP. These three provinces have always been classified as poverty stricken. It is not a surprise that they account for most beneficiaries receiving social grants. Among all the grant types CSG has the highest number of beneficiaries and has increased by 5.36% between 2010/11 and 2011/12 financial years. It is worth noting that the increase in the eligibility age of children from 15 to 18 years of age has increased CSG budget. The social assistance budget increased by an average of 11% since 2008/09 (National Treasury, 2013). The increase is further attributed to the fact that SASSA implemented Improved Community Registration Outreach Program (ICROP). Overall, the number of social grant beneficiaries has increased by 544% in the last 14 years. In the recent years, the social grant has become the primary source of income for many (more than 22%) households in South Africa (Aliber and Hart, 2009). However, the growth of social grant intake exerts pressure on the government fiscus, which has to be absorbed by taxpayers.

80
The South African Food Cost Review 2012 The South African Food Cost Review 2012
The social grant budget is expected to rise from R113bn in 2013/14 to R120bn in 2014/15 and to R129bn in 2015/16. This provides an average increase of 7.5% over the medium-term expenditure period.
There are many researchers (for example Armstrong and Burger, 2009), drawing from different schools (moral precepts, religious rules, tradition and cultural beliefs), who argue that there is a perception that CSG leads to high teenage pregnancy which in turn leads to increase the number of CSG beneficiaries. However, Makiwane and Udjo (2006) dispute the aforementioned view, arguing that a large proportion of CSG is youth at the age of approximately 35 years, and not teenagers. Therefore, teenage pregnancy can be attributed to factors such as insufficient knowledge about sex, sexual violence, coercion and absence of adequate role models for boys – not CSG. The social grant system is a short-term policy measure not designed as livelihood-promoting interventions (Van der Berg and Siebrits, 2010). This is due to the income base structure of the social grant system which creates a dependency syndrome that keeps the beneficiaries in a poverty-trap (Triegaardt, n.d.); hence the social grant expenditure is mainly dominated by food consumption.
The food basket consists of bread and cereal (loaf of brown bread 700g, loaf of white bread 700g, maize special 5kg and rice 5kg); animal protein (beef brisket – fresh per kg, whole chicken – fresh per kg, fish – tinned 425g); dairy and egg (full cream milk – fresh 1ℓ, full cream milk – long life 1ℓ and eggs 2.5 dozen); oils and fats (brick margarine 250g, sunflower oil 750mℓ and peanut butter 400g); fruit (apples – fresh per kg, bananas – fresh per kg and oranges – fresh per kg); vegetables (butter beans – tinned 410g, onions – fresh per kg, potatoes – fresh per kg and tomatoes– fresh per kg); sugar and sweets (white sugar 1kg) and tea and coffee (Ceylon/black tea 125g, instant coffee 750g and white sugar 2.5kg) (NAMC, 2003). The total cost of the food basket has increased from R386.43 to R451.08 between 2010 and 2012 (StatsSA, 2013). This brings us to the question of whether the social grant beneficiaries can afford food or not? And whether the grant is sufficient to carry them from month to month? For instance, the CSG pays the beneficiaries R290 per month. This is way below (by R161.08) the total cost of the food basket.
Social grants are adjusted to accommodate inflation every year. The OAG has increased by 5.0% (from R1 200 to R1 260), OAG over 75 years has increased by 4.9%, WVG (4.9%), DS (5.0%), FCG (3.9%), CDG (5.0%), and CSG increased by 3.6% (National treasury, 2013). Some beneficiaries who live on social grant income alone cannot afford the aforementioned food basket due to the insufficiency of the grant income. The adjustment of social grant income has not kept up with food inflation for certain grants. It can be possible to receive a social grant and still remain in the poverty trap or food insecurity. This argument concurs with the findings of Jacobs (2009) as cited by Altman, Hart and Jacobs (2009) stating that approximately 80% of households could not buy basic nutritional basket of food costing an average of R262 per person’. This group of people (those receiving social grant and yet remain poor and food insecure) is vulnerable to increases in food prices as 60-80% of income is spent on food (Baiphethi and Jacobs, 2009). Social grants cannot be used as a long-term policy measure to ensure food security and social spending, however, is not a substitute for job creation’ (Gordhan, 2013). Therefore, efforts are required to ensure that beneficiaries and households receiving a social grant can afford food. These can partly be achieved if a portion of the budget of the social assistance programme is used to empower communities through establishment of household food security and income-generating projects.
6.2 Trade facilitationChallenges with trade facilitation in Africa negatively affect intra-continental trade. Buyonge and Kireeva (2008) define trade facilitation as the simplification and harmonisation of international trade procedures such as the formalities involved in collecting and communication in the process of movement of goods between borders. There is an argument that as the tariffs have been lowered due to the agreement on agriculture of the WTO, the cost of export formalities in many cases exceeds the duty to be paid in exporting (meaning that non tariff measures have increased). Studies have shown that trade facilitation plays a role in enhancing exports performance. A delay in one shipment as a result of trade facilitation issues is argued to have bigger impact on the overall trade.
Dennis (2010) supports the latter statement by highlighting that in a study conducted, an additional day’s delay accounted for 0.5% more on the decline of import demanded from the Unites States of America.

81
The South African Food Cost Review 2012 The South African Food Cost Review 2012
6.2.1 Is trade facilitation important for Africa?
Africa remains a net importer of food with its dependency on imports increasing. African agricultural imports and exports amounted to R767 billion and R139 billion respectively in 2011. This suggests that imports are growing faster than exports. According to Portugal-Perez and Wilson (2009), if Africa’s global exports had not declined between 1976 and 2006, the continent’s export revenue would be 10 times its current value. From the neo classical economic view Rippel (2011) further argues that trade facilitation stands to provide many opportunities to Africa by increasing the likely benefits of open trade, such as economic growth. This follows the argument that after the Uruguay Round where barriers were further reduced from trade that has led to increased global trade. In this regard, the notion of opening trade and hoping for the better was put forward in arguing that trade is not an end to itself. In theory, trade openness means that producers can sell their goods and services to many more buyers. On the side of buyers this means consumers have a number of choices, leading to lower prices and an improved chance of access to innovations.
However, most African countries face considerable challenges to achieving more open trade. One reason is that the costs of trading remains stubbornly high, which prevents potential African exporters competing in global and even in regional markets. Africa has very high trade costs compared to other regions in the world, the proportion of trade costs to production costs are higher for developing countries than developed countries (Portugal-Perez and Wilson, 2009). Certain costs that make trading expensive are border, transport, corruption related, preferential trade and infrastructure costs. Realising this trend, policy makers have started paying more attention to addressing trade-discouraging non-tariff barriers (NTBs) and trade facilitation themes were then included in the 2004 Doha Development Agenda.
However, as suggested by Portugal-Perez and Wilson (2009), Africa will not enjoy the benefits of lowered tariffs if little is done to improve the cost of trading. Trade facilitation measures have become a key instrument to create a better trading environment. The international community has acknowledged that for many lower income countries having better market access to industrial countries, is insufficient unless the capabilities to trade are addressed as well. The resulting trade capacity building activities evolved into a broader and comprehensive Aid for Trade agenda, with trade facilitation playing a major role in these efforts.
This chapter argues for approaching trade facilitation in a comprehensive way by addressing the new challenges to trade, which no longer arise predominantly from high tariffs but from non tariff barriers behind the border. This approach highlights the need for cross-sector analysis, for example along the value-chain of products, to address trade bottlenecks. However, the biggest obstacle to greater trade integration is the lack of accompanying policy and regulatory reforms. Trade facilitation can provide opportunities for African exporters if hard infrastructure and technical advice are backed by equally ambitious policy reforms. Trade facilitation is an integrated part of development strategies in most African countries because it is a catalyst for further progress in areas beyond trade and export expansion. Trade facilitation can provide these important opportunities:
■ More open trade connections, in food staples for example, can encourage regional trade and reduce vulnerability to food insecurity;
■ Regional cooperation on trade facilitation can contribute to closer integration beyond trade. For example, addressing regional standards on products, services and procedures encourages trade but also intellectual exchange and collaboration on safety and social concerns affecting often a whole region beyond national boundaries;
■ Closer regional integration will provide opportunities for developing regional value chains that increase competitiveness and provide access to the increasingly globalized value chain production;
■ Finding common positions on trade-related issues and so enhancing the ability to represent these interests in the international arena.
It is argued that Africa suffers from the highest number of days in customs delays (approximately 12 days on average), a feature that needs to be rectified as was even outlined in the Economic Commission on Africa (ECA) report of 2005. These export delays are argued to lead to 10% of the total cost of exports. In the quest to reduce the cost of doing business, trade facilitation has been embraced by many countries. Within multilateral trade, trade facilitation is fairly new and is classified among the issues known as the ’Singapore issues’. Developing countries refused to negotiate the Singapore issues and their fear has been around the levels of investments that would be required to make sure that better trade facilitation is a reality. The African challenge is both in the form of physical infrastructure gaps and administrative burden.

82
The South African Food Cost Review 2012 The South African Food Cost Review 2012
6.2.2 The challenges identified by businesses
The challenge of administrative confusion by government officials has often been cited by exporters, with senior officials collaborating while junior staffs are suspecting every exporter. Furthermore the following can be argued to be additional trade facilitation challenges that many African countries experience:
■ Lack of or insufficient infrastructure,
■ Government agencies contributing to border delays,
■ Corruption in customs processes, and
■ Illicit trade.
In order to deal with trade facilitation problems in Africa, among others, the following need to be put in place.
■ Development of customs compliance strategies,
■ Ensuring that many levels of customs procedures are automated
■ Development of integrity solutions to deal with fraud and bribery, and
■ Introduction of international trade financing.
6.2.3 Initiatives by South Africa to improve intra-Africa trade
South Africa is a leading economy in Africa. However, little intra-continental trade is taking place between Africa and South Africa. South Africa trades more with European, American and Asian countries than it does with Africa. However, recently South Africa has increased its usage of trucks significantly to boost the movement of goods between countries (Haveng, 2011). However there has been a decline in the use of rail transportation, which could mean a missed opportunity in the facilitation of trade in the region. The country is currently faced with rising fuel costs, toll routes costs and possibly costs that may be charged with the use of the new E-toll system. This raises cost of trading. South Africa has also been working on improving its soft and hard infrastructure. Challenges related to trade facilitation are well understood, however according to Haveng (2011) these are not made a priority as they should be. A lot more needs to be done in order to reduce the cost of doing business and eliminate NTBs.
6.2.4 South Africa’s Agricultural Market and Product diversification
South African agricultural exports have seen a significant growth over the last 17 years triggered by the sector’s reform in the late 1990s and expanding market access as well as improving access conditions in the early 2000s. The country’s agricultural exports increased from R10.9 billion in 1996 to R26 billion in 2002 and R51 billion in 2012, registering an average growth rate of 11.2% per annum over the past 17 years when measured in value terms. It is evident from Figure 72 that the country has experienced a significant growth in exports. However the country’s export markets have remained relatively unchanged over the reviewed period indicating that South Africa is not adequately diversifying its markets. Market diversification may be defined as expansion across the borders of global regions and countries into different geographical locations, or markets.
Diversification is important because it enables the country to exploit new foreign market opportunities, thereby reduce the risks associated with high dependence on few well established export markets. South African agricultural exports to new markets (outside Euro zone) have remained low except export to East Asia and SADC regions. East Asia and SADC are increasingly becoming important markets for South African agricultural exports.

83
The South African Food Cost Review 2012 The South African Food Cost Review 2012
Figure 72: South African agricultural growth to leading destinations (1996-2012)Source: WTA, 2013
Figure 73 indicates the market shares of leading destination markets for South African agricultural exports. Again the picture is clear that not much diversification has taken place in the last 17 years. Over time the EU 27 has retained its market share of 34%, although some fluctuation has been observed in certain years. SADC and East Asia has also remained relatively stable at 20% and 14% respectively over the measured period. The conclusion that can be derived from Figure 3 and Figure 4 is that South Africa has made minimal efforts to diversify its agricultural export markets. The inability or slow diversification process is denying the country a chance to explore new trade opportunities in the new markets.
329%
499% 425%
237%
321% 225%
1093%
271%
702%
1300%
0%
200%
400%
600%
800%
1000%
1200%
1400%
- 2 000 4 000 6 000 8 000
10 000 12 000 14 000 16 000 18 000
EU
27
SA
DC
AG
OA
Eas
t Esi
a
Mid
dle
Eas
t
Mer
cosu
r
E -
Eur
ope
US
A
Can
ada
Sou
th A
sia
Gro
wth
Rat
e (%
)
Agr
icul
tura
l Exp
orts
: Mill
ion
Ran
d
1996 2012 % Growth
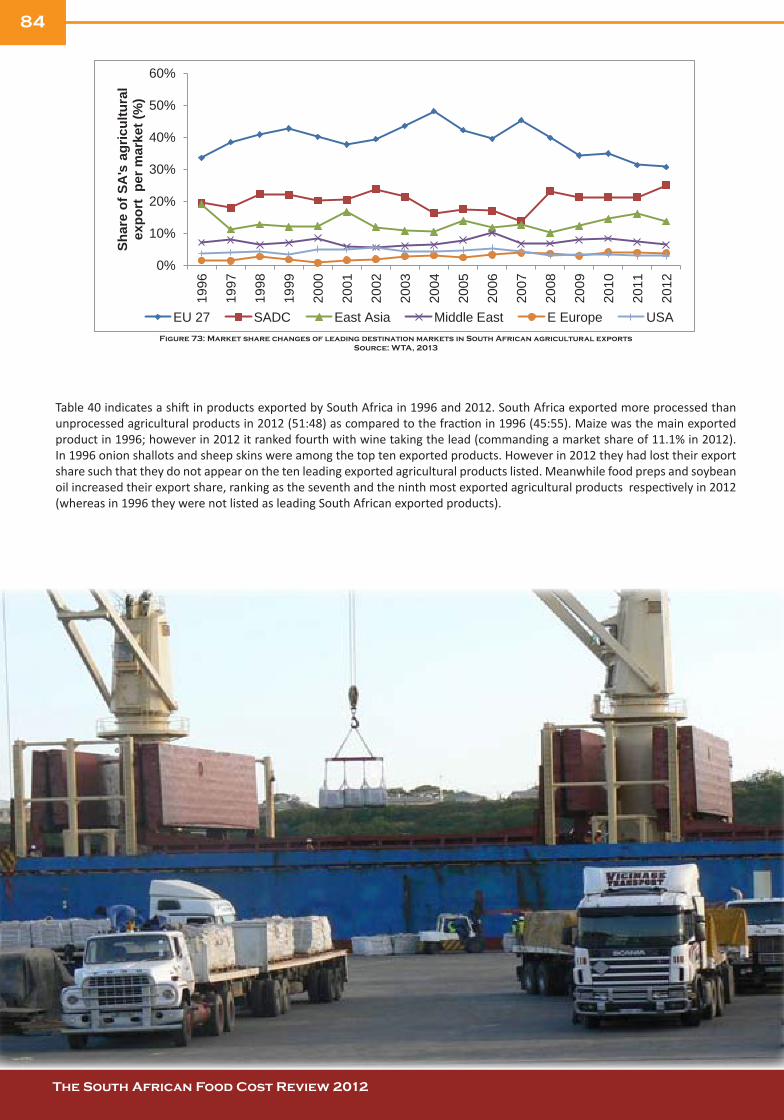
84
The South African Food Cost Review 2012 The South African Food Cost Review 2012
Figure 73: Market share changes of leading destination markets in South African agricultural exportsSource: WTA, 2013
Table 40 indicates a shift in products exported by South Africa in 1996 and 2012. South Africa exported more processed than unprocessed agricultural products in 2012 (51:48) as compared to the fraction in 1996 (45:55). Maize was the main exported product in 1996; however in 2012 it ranked fourth with wine taking the lead (commanding a market share of 11.1% in 2012). In 1996 onion shallots and sheep skins were among the top ten exported products. However in 2012 they had lost their export share such that they do not appear on the ten leading exported agricultural products listed. Meanwhile food preps and soybean oil increased their export share, ranking as the seventh and the ninth most exported agricultural products respectively in 2012 (whereas in 1996 they were not listed as leading South African exported products).
0%
10%
20%
30%
40%
50%
60%
1996
1997
1998
1999
2000
2001
2002
2003
2004
2005
2006
2007
2008
2009
2010
2011
2012
Shar
e of
SA
's a
gric
ultu
ral
expo
rt p
er m
arke
t (%
)
EU 27 SADC East Asia Middle East E Europe USA

85
The South African Food Cost Review 2012 The South African Food Cost Review 2012
Table 40: South African agricultural product diversification: 1996-2012
1996 2012
Rank HS Code Product
P r o d u c t E x p o r t Value: R Million
P r o d u c t Share in Export: %
Rank HS Code Product
P r o d u c t E x p o r t Value: R Million
P r o d u c t Share in Export: %
Processed 4949 45.4% Processed 26,180 51.3%
Unprocessed 5951 54.6% Unprocessed 24,859 48.7%
1 100590 & 100510 Maize 1598 14.7% 1 220421 &
220429 Wine 5,675 11.1%
2 170111 & 170199 Sugar 1291 11.8% 2 080510 Oranges 4758 9.3%
3 220421 & 220429 Wine 633 5.8% 3 080610 Table Grapes 3530 6.9%
4 080510 Oranges 520 4.8% 4 100590 & 100510 Maize 3254 6.4%
5 220720 Ethyl Alcohol & Spirits 491 4.5% 5 080810 Apples 2594 5.1%
6 080810 Apples 390 3.6% 6 510111 Wool 2286 4.5%
7 080610 Table Grapes 388 3.6% 7 210690 Food Prepared 1098 2.2%
8 070310 Onions & Shal-lots 351 3.2% 8 170199 Sugar 953 2.0%
9 510111 Wool 215 2.0% 9 150790 Soybean Oil 946 1.9%
10 410221 Sheep Skins 213 2.0% 10 220710 Ethyl Alcohol & Spirits 934 1.8%
Source: WTA, 2013
6.2.5 Market and Consumer Preference in Emerging Markets
It is evident from the section above that the bulk of South African agricultural exports are still destined to traditional European markets. The South African export basket and market split remained more or less the same over the last 17 years. In recent years, emerging markets particularly, Asian markets have demonstrated a potential when measured in terms of consumer size, purchasing power increases and formal retail evolution. The bulk of market research studies argue that Asian consumers and market structures are very different to their counterparts located in Europe. Asian consumers are rapidly becoming health and environment conscious and are starting to show high preference to food products that promote and offer health benefits. They also show great appreciation for high quality products – they are prepared to pay more for imported high quality products compared to domestic marginal quality products (Yu, 2012). Furthermore, Asia consumers are increasingly becoming aware of brands and value attached to certain brands. This suggests a need to engage in strong and effective consumer promotional campaigns in Asia to enhance the awareness of South Africa brands and products. Both domestic and foreign companies supplying Asian markets are actively engaging in research and development (R&D) and marketing of healthy and environmental friendly products.
Food and beverages sales are increasing in Asia driven by growing disposable income and expanding middle class consumers. Table 41 shows the growth in retail sector in various regions across the world. The retail sector in Asia and Australasia has recorded a strong and positive growth in the past four years despite the global economic meltdown that occurred in 2008. The retail sector is expected to increase by at least 6% until 2015 driven largely by food and beverage sales. China is the main engine

86
The South African Food Cost Review 2012 The South African Food Cost Review 2012
behind this strong positive growth; however, other countries like Vietnam, Singapore and Indonesia are showing strong development in the retail sector, attracting even foreign retails. Yu (2012) reports that food and beverage sales account for around 50% of total retail value in countries like Singapore, Malaysia and Vietnam.
Table 41: Global retail sales growth by volume (percent change per annum)
Region 2008 2009 2010 2011 2012 2013 2014 2015
Asia and Australasia 5.1 5.2 9.1 4.6 5.6 6.0 6.2 6.4
Economies in Transition 6.5 -5.2 3.6 4.1 4.5 4.4 4.4 4.4
Latin America 4.8 -0.2 6.2 4.0 4.0 3.6 3.9 3.7
Middle East & North Africa 3.2 4.4 3.8 2.0 3.0 3.5 3.7 3.7
North America -1.1 -5.0 4.8 2.1 1.2 1.1 1.3 1.4
Western Europe -0.9 -1.8 0.3 -0.4 0.3 0.6 0.9 1.2
World 1.9 -0.3 5.4 2.9 3.2 3.4 3.7 3.9Source: Adapted from Yu, 2012

87
The South African Food Cost Review 2012 The South African Food Cost Review 2012
6.2.6 The level of protection of the domestic cereal grain industry
The evolution of South Africa’s domestic grain industry over the past decade occurred within the context of trade policy interventions, political change, and socio economic change. From 1994 to 1997 the deregulation of agricultural marketing boards and control boards were established under the overall goal of government during this period. The goal was to create an open and market-orientated economy that would allow for the improvement of grain markets through strategic incentives and market-enabling institutions that have the potential to sustain growth and productivity. The contribution of the domestic policies has not seen much improvement in terms of production of cereal grains. Grain markets have been affected by, among other factors, volatile domestic food prices, natural disasters and fuel prices. Figure 74 shows South African cereal production from 1996 to 2012. The bulk of South African cereal production is dominated by maize, followed by wheat, then barley and sorghum. Production of cereals increased by 3% from 2011 to 2012 because of an improvement in maize production.
Maize is the largest cereal product produced, accounting for 86% share of domestic cereal production in 2012. The bulk of maize that is produced in South Africa is used for household consumption, with small quantities that are exported because of safety and quality issues. The second most produced cereal in South Africa is wheat which accounted for a 12% production share of total South African cereal production, followed by 2% share of barley production, and 1% of sorghum production in 2012. South Africa does not produce buckwheat and rice because of, among others reasons, scarcity of water resources. Rice requires waterlogged land for production purposes. South Africa is consequently a net importer of rice due to the insignificant level of production in the country. In 2010, production of cereal grain showed a significant decline (19%) due to flooding in South Africa during the rainy season.
Figure 74: South African Cereal production (1996-2012)Source: USDA, 2013
In order to assess the level of protection on the domestic grains industry, the following factors were considered for scrutiny; trade agreements, tariffs, and non tariff barriers. Tariffs can be used as a source of revenue for the government, but they are mainly used as a form of protection against foreign competition. South Africa’s import protection for agricultural and food products is based mostly on specific and ad valorem tariffs (OECD, 2006). However the question is to what extent has level of protective tariff and agreements in place, assisted in the overall performance of grain industry. Will South Africa’s membership of the proposed SADC-EAC-COMESA block enhance the growth of the domestic grain, given the possibility of a complicated and protective tariff structure. Figure 75 and Tables 42 below summarise the applicable tariff rates on maize, wheat, grain sorghum, barley and rice.
In 2012 the main suppliers of cereal grains into South Africa are Thailand (18%), China (17%), Argentina (11%), India (11%) and Brazil (10%). Figure 75 highlights the rate of import duty on grains applied by South Africa against the total grain production between 2008 and 2012. Over the period of five years the general average imports duty that is applied to grains ranged between 1% and 0.6%, which shows a gradual reduction in the tariff rate imposed on the imports of cereals. While total imports in quantities of cereals have also gradually decreased from 2 298 006 in 2008 to 1 535 503 tons in 2012, the OECD report (2006) also compared the average level of protection to other countries.
0%
10%
20%
30%
40%
50%
60%
1996
1997
1998
1999
2000
2001
2002
2003
2004
2005
2006
2007
2008
2009
2010
2011
2012
Shar
e of
SA
's a
gric
ultu
ral
expo
rt p
er m
arke
t (%
)
EU 27 SADC East Asia Middle East E Europe USA

88
The South African Food Cost Review 2012 The South African Food Cost Review 2012
The finding of the reports stated that South Africa’s average agricultural tariff protection is lower compared with the overall averages of the other countries. A general consensus of opinions is that the reduction of tariffs is a good idea. This comes with a gradual belief that high protection is in the national interest and that it protects manufacturing industries. Therefore if the cereal industry is to survive even when tariffs are dropped, it must become more efficient and gain a competitive advantage against foreign cereal industries in a free trade environment.
Figure 75: South African import duty on cereals and productionSource: WTO, 2013 & USDA, 2013
Table 42 shows the most imported products in 2012 into South Africa together with the trade agreements applicable to the cereal industry. Rice is ranked first as the most imported with 53% share in total cereal imports, followed by wheat products with a share of 36%, and maize seed with a share of 4% in 2012. In 2012 South Africa imported rice mainly from Thailand, India and Brazil, while wheat is mainly imported from Argentina, USA, and Australia. These are countries in which South Africa has preferential trade agreements regarding certain cereals such as rice, wheat, maize and barley. However, the level of tariffs that is imposed to the imported is lower, which illustrates that South Africa’s industry may be hampered by cheap imports coming in on an international scale.
South Africa is a member of the following regional trading blocs:
■ The Southern African Development Community (SADC) which launched a drive towards a SADC Free Trade Agreement (FTA) in 2008 and has also been implementing the tariff phase down policy from 2000 to 2008 under the SADC Trade Protocol.
■ The Trade Development and cooperation Agreement (TDCA), which is implemented FTA and EU, had scheduled to liberalise 95% of its duties with SA while SA offered to liberalise 86% of its duties on EU originating Products.
■ The SACU EFTA free trade agreements which cover basic agricultural products.
South Africa is a member of the following Preferential Trade Agreements (FTA). These include;
■ Southern common Market (SACU) with (Mercusor), a reduction on selected goods which has expected to enter into force before 2012 with about 1 000 product lines on each side of the border.
■ Zimbabwe/South Africa, a bilateral preferential trade agreement which is meant to lower tariffs, rebates and quotas on selected goods between the two countries.
■ Africa Growth and Opportunity Act (AGOA) which is a preferential access to the US market through lower tariffs or no tariffs on some products, with approximately 7 000 product tariff lines.
Thus, South Africa’s tariff regime on grain products lies within the domain of the below trade protocols that allow for preferential treatment of member states in grain trade.
0
0.2
0.4
0.6
0.8
1
1.2
0 2 4 6 8
10 12 14 16 18
2008 2009 2010 2011 2012 Prod
uctio
n in
100
0 m
atric
tons
Perc
ent t
ariff
impo
sed
(%)
Grains Tariffs imposed

89
The South African Food Cost Review 2012 The South African Food Cost Review 2012
Table 42: Top 10 leading cereal imports, Applicable Tariff (rates) in 2011 and trade agreements in
place
HS code Product description Customs duty Trade agreements
Value imported in 2012 (Rand in Millions)
General
AV duties
SACU/ SADC
MFN
Applied Mercusor TDCA
AGOA/GSP
EFTA
100630 Rice, Semi- Or Wholly Milled, Polished Etc. Or Not
5566 0.0 - 100 - x x x
100199 Wheat And Meslin, Nesoi 3760 72.0 - 100 x x x x
100510 Corn (Maize) Seed, Certified, Excluding Sweet Corn
415 50.0 - 100 x x - x
100710 Grain Sorghum Seed 213 33 for 100700 x 0 x - x
100119 Durum Wheat, Nesoi 191 0.0 - 100 x x X for 10011000 x
100119 Durum Wheat, Nesoi 191 0.0 - 100 x x X for 10011000 x
100590 Corn (Maize), Other Than Seed Corn 175 50.0 - 100 x x - x
100790 Grain Sorghum, Nesoi 105 0.0 x 0 - x - x
100390 Barley, Nesoi 45 41.0 for 100300 - 0 - x
X for NTL 10030020
10-
100640 Rice, Broken 33 0.0 - 100 - x x -
100610 Rice In The Husk (Paddy Or Rough) 23 0.0 - 100 - x x -
Source: Various trading blocs website: see References
Note: X: cereals which are traded under FTA, - FTA is not applicable.

90
The South African Food Cost Review 2012 The South African Food Cost Review 2012
6.2.7 Non tariff measures in South Africa’s grain industry.
According to Becker (2006) Sanitary and Phytosanitary Measures (SPS) and the Technical Barriers to Trade (TBT), can impose significant economic costs on agricultural exporters, forcing them to make expensive changes in production or marketing in order to comply. A foreign SPS action can halt all imports of a product, resulting in major losses for the exporting industry. Therefore Beckers (2006) argues that an understanding of the total costs of agricultural NTBs such as SPS and TBT measures, can be helpful for gauging the overall level of trade protection that various countries enjoy, and for determining how much importance to assign to reducing such barriers in trade negotiations. However, efforts to quantify these barriers have proven challenging. He argues one of the difficulties is that, ’since NTBs lack tariffs’ transparency and are often embedded within complex regulatory schemes, reducing these NTBs generally requires more work than reducing tariffs does.’
South Africa produces genetically-modified (GM) maize. Neighbouring countries such as Zimbabwe and Kenya require GM-free maize, therefore when exporting from South Africa, various countries request confirmation from Government regarding the GMO status of the consignment being exported. According to the Register: Genetically Modified Organisms (2002) Genetically Modified Organisms Act, 1997 (Act No. 15 of 1997), determined that any consignment will only be regarded as GMO free if it contains less than 1.0% total GMO content for the specific consignment being subjected to testing. Concerns have been that the Limit of GMO Quantification is very low and hence reduces the tonnage exported, and also limits the market and revenue for the company.
The proximity of the regional markets and the demand for cereal grains makes the region a potential and booming market for South African grains when one considers transport and other logistical costs. However, noting that transport costs in Africa are relatively high in some countries but also quite reasonable in others, especially the ones neighbouring South Africa such as Zambia, Zimbabwe and Mozambique. Several studies are in agreement that most of the African countries, Europe and Japan prohibit GM maize. The GM corn/maize events which are approved by South Africa for exportation are not accepted by most of the export markets of interest to South Africa except in Korea (Fundira, Denner & Phahlane, 2010). The overall assessment of the tariffs, on tariffs barriers and trade agreements in the cereal grain sector provides an essential foundation for distilling fundamental insights that could better inform the present and future efforts on the level of protection and ensuring a sustained and accelerated growth in production and trade volumes.
6.3 Financial position of the agricultural sectorThe financial position of the agricultural is responsible for sustainability of local food production, facilitation of rural development and transformation of the sector. However, since 2008 the overall financial sector was challenged by the financial crisis. Incidentally, South Africa had introduced legislation to promote responsible financial provision. In particular the National Credit Act implemented in 2007, discouraged reckless lending. The question is whether the policy enabled a better position for farmers or otherwise. This section is based mainly on the data from the Abstract of Agricultural Statistics (DAFF, 2012).
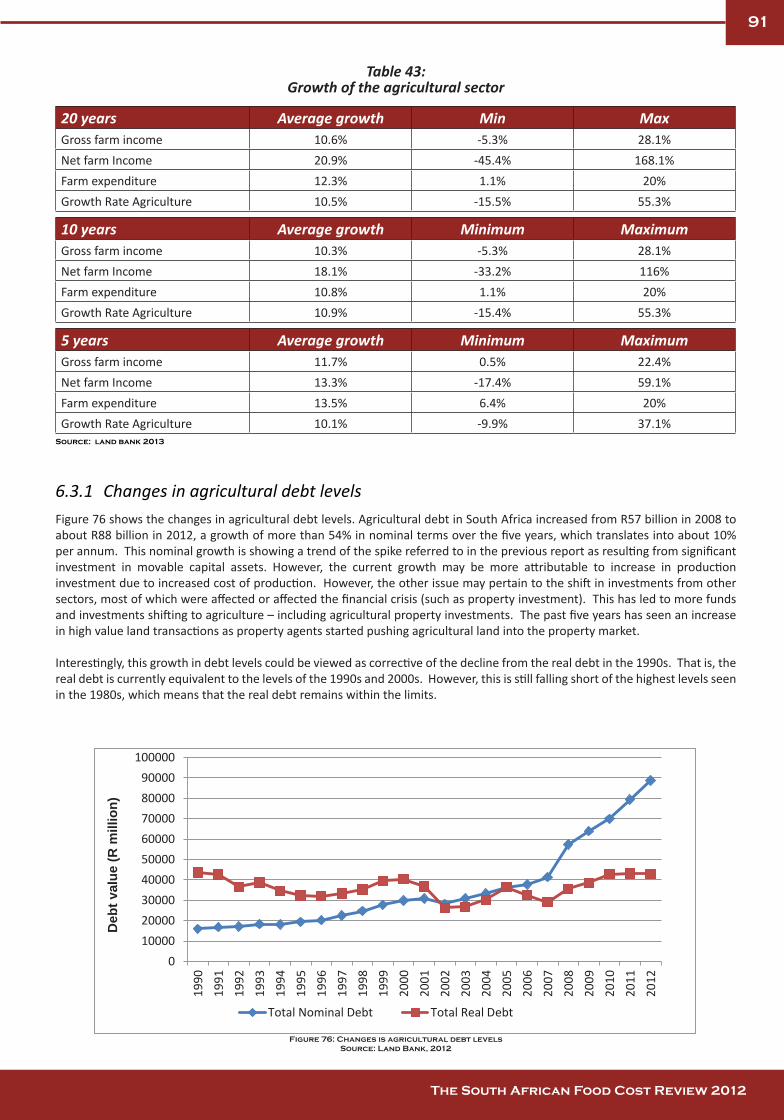
91
The South African Food Cost Review 2012 The South African Food Cost Review 2012
Table 43: Growth of the agricultural sector
20 years Average growth Min MaxGross farm income 10.6% -5.3% 28.1%Net farm Income 20.9% -45.4% 168.1%Farm expenditure 12.3% 1.1% 20%Growth Rate Agriculture 10.5% -15.5% 55.3%
10 years Average growth Minimum MaximumGross farm income 10.3% -5.3% 28.1%Net farm Income 18.1% -33.2% 116%Farm expenditure 10.8% 1.1% 20%Growth Rate Agriculture 10.9% -15.4% 55.3%
5 years Average growth Minimum MaximumGross farm income 11.7% 0.5% 22.4%Net farm Income 13.3% -17.4% 59.1%Farm expenditure 13.5% 6.4% 20%Growth Rate Agriculture 10.1% -9.9% 37.1%
Source: land bank 2013
6.3.1 Changes in agricultural debt levelsFigure 76 shows the changes in agricultural debt levels. Agricultural debt in South Africa increased from R57 billion in 2008 to about R88 billion in 2012, a growth of more than 54% in nominal terms over the five years, which translates into about 10% per annum. This nominal growth is showing a trend of the spike referred to in the previous report as resulting from significant investment in movable capital assets. However, the current growth may be more attributable to increase in production investment due to increased cost of production. However, the other issue may pertain to the shift in investments from other sectors, most of which were affected or affected the financial crisis (such as property investment). This has led to more funds and investments shifting to agriculture – including agricultural property investments. The past five years has seen an increase in high value land transactions as property agents started pushing agricultural land into the property market.
Interestingly, this growth in debt levels could be viewed as corrective of the decline from the real debt in the 1990s. That is, the real debt is currently equivalent to the levels of the 1990s and 2000s. However, this is still falling short of the highest levels seen in the 1980s, which means that the real debt remains within the limits.
Figure 76: Changes is agricultural debt levelsSource: Land Bank, 2012
0 10000 20000 30000 40000 50000 60000 70000 80000 90000
100000
1990
19
91
1992
19
93
1994
19
95
1996
19
97
1998
19
99
2000
20
01
2002
20
03
2004
20
05
2006
20
07
2008
20
09
2010
20
11
2012
Deb
t val
ue (R
mill
ion)
Total Nominal Debt Total Real Debt
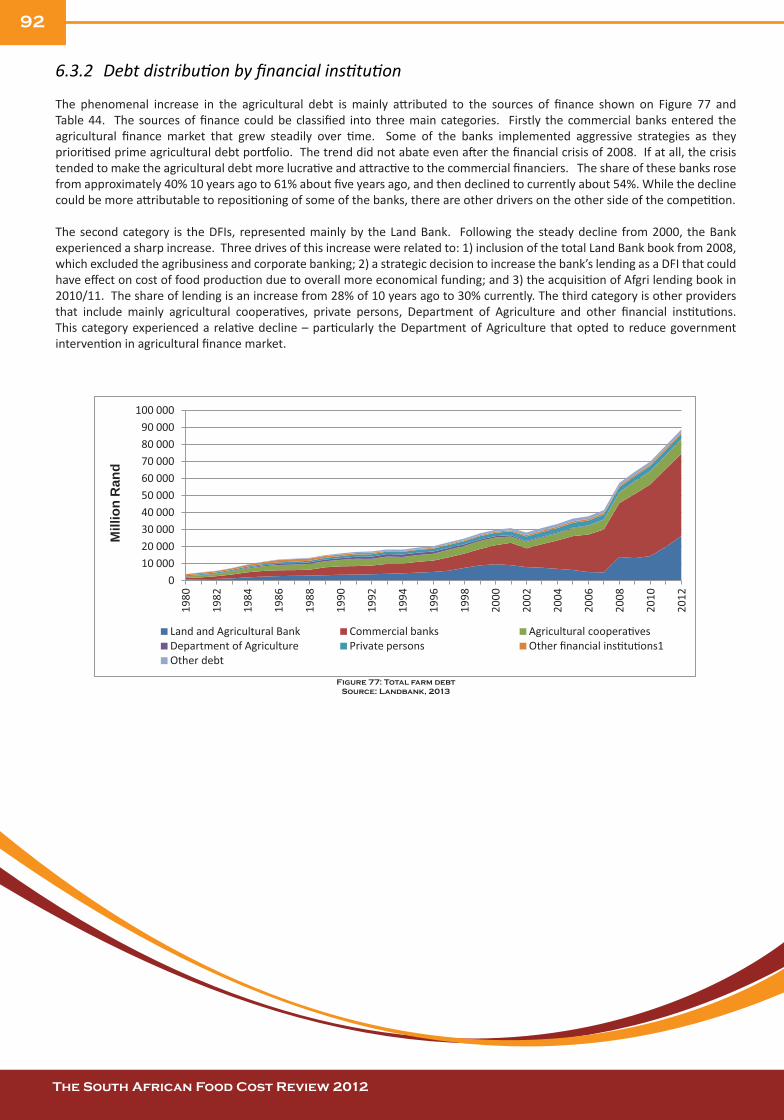
92
The South African Food Cost Review 2012 The South African Food Cost Review 2012
6.3.2 Debt distribution by financial institution
The phenomenal increase in the agricultural debt is mainly attributed to the sources of finance shown on Figure 77 and Table 44. The sources of finance could be classified into three main categories. Firstly the commercial banks entered the agricultural finance market that grew steadily over time. Some of the banks implemented aggressive strategies as they prioritised prime agricultural debt portfolio. The trend did not abate even after the financial crisis of 2008. If at all, the crisis tended to make the agricultural debt more lucrative and attractive to the commercial financiers. The share of these banks rose from approximately 40% 10 years ago to 61% about five years ago, and then declined to currently about 54%. While the decline could be more attributable to repositioning of some of the banks, there are other drivers on the other side of the competition.
The second category is the DFIs, represented mainly by the Land Bank. Following the steady decline from 2000, the Bank experienced a sharp increase. Three drives of this increase were related to: 1) inclusion of the total Land Bank book from 2008, which excluded the agribusiness and corporate banking; 2) a strategic decision to increase the bank’s lending as a DFI that could have effect on cost of food production due to overall more economical funding; and 3) the acquisition of Afgri lending book in 2010/11. The share of lending is an increase from 28% of 10 years ago to 30% currently. The third category is other providers that include mainly agricultural cooperatives, private persons, Department of Agriculture and other financial institutions. This category experienced a relative decline – particularly the Department of Agriculture that opted to reduce government intervention in agricultural finance market.
Figure 77: Total farm debtSource: Landbank, 2013
Mill
ion
Ran
d
Land and Agricultural Bank Commercial banks Department of Agriculture Private persons Other debt

93
The South African Food Cost Review 2012 The South African Food Cost Review 2012
Table 44:Source of agricultural finance
10 years ago 5 years ago Current (2012)
Value % market share Value % market
share Value % market share
Land Bank 7 931.0 28% 4 797.5 12% 26 202.2 30%
Commercial Banks 11 027.1 39% 25 215.7 61% 48 352.8 54%
Agricultural cooperatives 3 807.7 13% 5 691.7 14% 8 410.4 9%
Department of Agriculture 4 95.9 2% 2 46.3 1% 1 33.4 0.2%
Private persons 2 677.8 9% 2 925.1 7% 3 060.6 3%
Other financial institutions 8 11.9 3% 8 86.9 2% 9 28.0 1%
Other debt 1 480.1 5% 1 616.7 4% 1 691.6 2%
Source: Landbank, 2013
6.3.3 Interest cover ratio and weighted average interest rate
The interest cover ratio shows how easy or difficult it is to pay interest on outstanding debt. It is calculated by dividing earnings before interest and taxes (EBIT) of one period by the interest expenses of the same period. If the ratio is higher; that is, greater than one, the interest payments can be covered easily. A ratio below one indicates that interest on outstanding debt cannot be paid. The low ratio also indicates the high risk for financiers. Figure 78 shows the interest cover ratio for the agricultural sector from 2006 to 2012. Based on 2005, when the agricultural sector was weakened by low grain prices and the 2003/04 drought, the interest cover ratio rose sharply to 2009 following the increase in food prices; the 2009 with high weighted annual interest rates as high. Normally, the two would move in opposite directions or be negatively correlated.
Figure 78: Interest cover ratio for the agricultural sectorSource: Landbank, 2013
0
2
4
6
8
10
12
14
16
18
20
30
40
50
60
70
80
90
100
2006
2007
2008
2009
2010
2011
2012
Wei
ghte
d An
nual
Inte
rest
Rat
es (%
) 20
05
Inte
rest
Cov
er R
atio

94
The South African Food Cost Review 2012 The South African Food Cost Review 2012
6.3.4 Gross and net farm income
Figure 79 shows the gross value of agriculture by sector. The value is currently about R162 billion, an increase of 43% from R113 billion in 2007/8 and 153% from R64 billion in 2001/02 (or about 14% per annum). The growth has been attributed to the increase in livestock production, which surpassed field crops. The livestock industry has grown steadily, while field crops developed sideways and horticulture grew slowly. This reflects a shift to more animal protein-driven agriculture production. This is a reversal of the 1980s phenomenon of using grazing and marginal lands for crop production.
Figure 79: Gross value of agricultural productionSource: DAFF, 2013
The Figures 80 shows the nominal gross and net farm income, as well as expenditure on intermediate goods and services. While the gross farm income and the expenditure on intermediate goods and services are increasing steadily, the net farm income has moved sideways. Following a phase of decline, the net farm income has increased in 2012 to R53 billion. The ratio between the gross farm income and the expenditure may reflect the conversion rate of intermediate goods and services to produce value of agricultural output.
Figure 80: The nominal gross and net farm income, as well as expenditure on intermediate goods and servicesSource: DAFF, 2013
*Estimate
0
20 000
40 000
60 000
80 000
100 000
120 000
140 000
160 000
180 000
2000
/01
2001
/02
2002
/03
2003
/04
2004
/05
2005
/06
2006
/07
2007
/08
2008
/09
2009
/10
2010
/11
2011
/12*
Mill
ion
Ran
d
Field crops Horticulture Animal production
0
2
4
6
8
10
12
14
16
18
20
30
40
50
60
70
80
90
100
2006
2007
2008
2009
2010
2011
2012
Wei
ghte
d An
nual
Inte
rest
Rat
es (%
) 20
05
Inte
rest
Cov
er R
atio

95
The South African Food Cost Review 2012 The South African Food Cost Review 2012
6.3.5 Valuation of agricultural debt
Figure 81 shows a proxy for the difference between Gross Farm Income less Total Debt to reflect the potential value that can be financed. It appears the agricultural sector is generating more value from the debt it is exposed to. On the other hand, the last time the gap between total debt and net farm income (repayment potential gap) was closed, was in 2007. The repayment potential gap had widened the most by 2011. In 2012 the gap started closing.
Figure 81: valuation OF AGRICULTURAL debtSource: DAFF 2013
6.4 The right to water and the allocation of water rights in South Africa
6.4.1 Socio-economic rights: progressive realisation and the reasonable allocation of resources
’Everyone has the right to have access to sufficient food and water.’
So reads article 27(1)(b) of the South African constitution.1 South Africa is a constitutional democracy, with the national constitution representing the benchmark of validity for all other forms of law making, including statutes, court decisions, the common law and customary law as well as national policy and strategies. The bill of rights, contained in chapter two thereof, recognises the right of all people residing within South African borders to have access to sufficient food and water, and the right of children in particular to basic nutrition2. As the constitution represents the social contract between the state and its citizens, both limiting and enshrining the scope of government authority, this provision imposes a duty that is negative as well as positive in nature. On one hand, the government must refrain from unjustifiably interfering with the enjoyment of the right to water, by refraining from:
■ Any practice or activity that arbitrarily denies or limits access to water;
■ Unlawfully diminishing or polluting water sources;
■ Prohibiting access to, or destroying water infrastructure as a punitive measure;
■ Arbitrarily or unjustifiably disconnecting or excluding citizens from water services or facilities;
■ Discriminatory or unaffordable increases in the price of water; or by
■ Any activity that renders water intended for human consumption harmful to human health.
1 Act 108 of 1996.2 Art. 28(1)(c), Constitution of the Republic of South Africa, 108 of 1996.
0.0
50 000.0
100 000.0
150 000.0
200 000.0 19
90
1991
1992
1993
1994
1995
1996
1997
1998
1999
2000
2001
2002
2003
2004
2005
2006
2007
2008
2009
2010
2011
2012
Mill
ion
Ran
ds
Total Nominal Debt Net Farm Income Gross Farm Income

96
The South African Food Cost Review 2012 The South African Food Cost Review 2012
The positive side of the duty, is that the government must protect, promote and fulfil the right through ’reasonable legislative and other measures, within its available resources, to achieve the progressive realisation’1 of the right to water as enshrined in article 27(1). The right to water, therefore, is not an absolute guarantee of a faucet in a every home. As in the case of other socio-economic rights, the state is bound to the ‘progressive realisation’ of the right to water, i.e. realisation over time, as opposed to instantaneous fulfilment, qualified in terms of ’the reasonable allocation of available resources’2. This was affirmed in Government of the Republic of South Africa & Others v Grootboom & Others3, where the constitutional court construed the scope of socio-economic rights as4 :
■ The state’s obligation to establish an environment within which everyone is able to acquire the means to provide for themselves;
■ Supplemented by the obligation to provide support to those who cannot procure basic entitlements for themselves, including through the mobilisation of private individuals and organisations to act on the state’s behalf.
The court thus affirmed, as stipulated in article 27(2) of the Constitution, that ‘reasonableness’ will ultimately determine whether the state, or any other actor, has availed itself of its duty under the law. It is important to note that the constitutional court regards rights of ‘access’ to be distinct from the concept of minimum core obligations. In this formulation, endorsed by the United Nations Committee on Economic, Social and Cultural Rights, governments must provide a baseline of services while working toward progressive realisation of rights. Constraints on public resources, the demands of the economy, and the interest of society as a whole, mean that trade-offs are unavoidable, yet neither would complete failure to address the needs of vulnerable communities be deemed acceptable.
Therefore, as set out in the Grootboom-case, challenging the failure of the state to take sufficient positive measures, ‘the real question will be whether the legislative and other measures taken by the state are reasonable’, taking both the macro and micro contexts into account. Phrased differently, it is the ‘reasonableness’ of conduct that will decide its lawfulness, as illustrated by the successful defence of prepaid water meters in low-income areas, with authorities arguing that prepaid water meters are ‘pro-poor’, allowing households to better budget their water spending, while enabling the state to better manage its revenue flows to invest in extending water services to under-serviced areas. Similarly, water cut-offs have been ruled constitutionally sound, as the non-payment of service bills negatively affects the rights of others to water.
Access to water in South Africa is therefore enhanced in the Bill of Rights, but not automatically guaranteed, as the total scope of demands on national resources must be taken into account.
6.4.2 Distinguishing water rights from the right to water: The Makhanya-case
On 19 August 2011 the North Gauteng High Court (HC) issued judgment in the case of Goede Wellington Boerdery (Pty) Ltd v Makhanya NO & Another5, finding in favour of the applicant. In its judgment, the HC reviewed and set aside a decision by the Water Tribunal, namely to refuse an appeal against a decision by the Chief Director of Water Use in the Department of Water Affairs and Forestry, which denied the Goede Hoop farm a licence to utilise water from the Berg River for agricultural purposes.
The matter was subsequently taken to the Supreme Court of Appeal (SCA) in Bloemfontein and the SCA’s judgment6 was published on 30 November 2012, again finding in favour of Goede Wellington Boerdery (Pty) Ltd.
Water in South Africa is a scarce commodity, yet reliable access thereto is a prerequisite for sustained agricultural production. An estimated eight percent of the country’s potential arable land is under irrigation, accounting for nearly two-thirds of the national water requirement. The figure below provides an overview of surface water withdrawal, as measured in 2000.
1 Art. 27(2), Constitution of the Republic of South Africa, 108 of 1996.2 Brand, D., ’The Right to Food and Nutrition in the South African Constitution’, in A Compilation of Essential Documents on the Right to Food and Nutrition, G. Bekker ed., Economic and Social Rights Series, 3, Centre for Human Rights, pg. 6.3 2000 (11) BCLR 1169. (CC)4 n 4.5 (56628/2010) [2011] ZAGPPHC 141 (19 August 2011).6 Makhanya v Goede Wellington Boerdery (Pty) Ltd (230/12) [2012] ZASCA 205 (30 November 2012).

97
The South African Food Cost Review 2012 The South African Food Cost Review 2012
Figure 82: Surface water withdrawal in 2000 (Total = 12.5 km³)Source: Water Accounts for RSA, 2000
Due to the high demand and limited availability, access to water for agricultural purposes is determined according to a licensing system1, affording a licence holder the right to utilise a prescribed quantity of water from a specific source for a predetermined period, subject to renewal. In this regard, it is important to distinguish between ‘water rights’ as conferred by the allocation of a licence in accordance with the National Water Act2 (NWA), and the fundamental ‘right to water’ as defined inter alia in South Africa’s Bill of Rights.
Water rights, as envisioned in the first instance, relate to the supply of water, usually through some form of channelling system, for irrigated agriculture or industrial purposes3. Such supplies are typically accessed on the basis of an express or implied agreement – or licence – conferring upon the beneficiary the legal right to receive a quantity of water for a specified time, usually in return for the payment of a charge or fee4. Such rights, i.e. a legal entitlement to a specified volume of water, are effectively a form of ‘water rights’.5
This type of entitlement has little correlation to the fundamental right to water, as delineated above. In jurisdictions where a human right to water is recognised, such a right establishes a fundamental entitlement which exists either as a right in itself, such as in article 27 of the South African constitution, or as an auxiliary aspect of the ‘right to food’, as in article 11 of the International Covenant on Economic, Social and Cultural Rights6 (ICESCR). The ‘right to water’ is therefore concerned with the availability of water for survival purposes, linking it to the right to life, entailing that no person may be arbitrarily deprived of the means of physical sustenance. This is in juxtaposition to ‘water rights’, which links closely to environmental7 and property rights.
As all national laws are subject to the Constitution, it is important to note the ‘reasonableness’ test as discussed above, as it provides a valuable point of departure for the interpretation of subordinate legislation, including the NWA.
1 The National Water Act, 36 of 1998.2 Ibid.3 Hodgson, S., Modern water rights: Theory and practice (Development Law Service: FAO Legal Office, FAO Legislative Study 92, 2006) pg. 6—8.4 Users of surface water buy a water right and pay an annual water levy, while groundwater is considered to be the property of the land owner and can there fore be utilised at no additional cost.5 n 13.6 Art. 11 of the ICESCR, provides that everyone has a right to an adequate standard of living for himself and his family including adequate food, clothing and housing. The ’Right to water’ was developed in General Comment 15 on the Covenant by the Committee on Economic, Social and Cultural Rights. Such ’General Comments’ constitute authoritative interpretations of the provisions of the Covenant to clarify the normative contents of rights, states parties ’and other actors’ obligations, violations and implementation of the rights at national level.7 Art. 24, Constitution of the Republic of South Africa, 108 of 1996.

98
The South African Food Cost Review 2012 The South African Food Cost Review 2012
A central focus of the NWA, is to achieve a ‘more equitable distribution of rights to water’1. To this end, the NWA aims to meet the basic human needs of present and future generations and to redress the results of past racial and gender discrimination 2 as pertains to the allocation of water rights. The structure of the NWA is derived from the ‘best practices’3 embodied in the 1992 Dublin principles4. Under the NWA, water management is allocated to 17 Catchment Management Agencies (CMA), each having a governing board representing the various water users within the particular catchment.
As can be deduced from the above, the ability to transfer water rights is of critical importance in the development and expansion of agricultural production5, yet reading the purpose of the NWA6 in conjunction with its equality provision7 has given rise to some confusion as to which categories of persons, whether natural or juristic, are eligible to have such rights transferred to them.
The relevance of the Makhanya-case lies in the courts’ affirmation that8:
■ Water rights are indeed transferable;
■ That all relevant factors must receive due consideration upon receipt of an application for such a transfer; and
■ That the persuasive weight of any single factor must be considered within the context of the facts unique to any given application.
Both the HC and SCA judgments confirm that while the NWA’s empowerment provision can, and indeed should be decisive in the allocation of water rights where appropriate, it is not to be regarded in isolation. Instead, the courts have called for a balance to be struck between all relevant factors as prescribed by the NWA, including equitable access, resource quality and management, conservation, proposed use and costs, when considering an application9.
The Makhanya-case concerns the use of water on the farm Goede Hoop in the Wellington area of the Western Cape, which belongs to the Goede Wellington Boerdery (Pty) Ltd (Goede Wellington). Goede Wellington had been conferred a right to channel water from the Berg River for use on the farm Goede Hoop. A further entity, ECPA Boerdery (Pty) Ltd (ECPA), owned the adjacent farm, namely Middelpos, which also held rights to utilise water from the Berg River for agricultural purposes on Middelpos. The sole shareholder of Goede Wellington, which is the owner of Goede Hoop, was also a trustee and beneficiary of the Middelpos trust, being the sole shareholder of ECPA, as well as the owner of Middelpos.
Following the installation of advanced water-savings technology on Middelpos, water use on said farm became more efficient, and thus a portion of its water rights became available for transfer. In turn, the farm Goede Hoop was in the process of developing a high quality citrus orchard, and required the use of the additional water to facilitate production. Consequently, the two farms concluded a usage agreement facilitating the transfer of Middelpos’ surplus water rights to Goede Hoop, and Goede Wellington proceeded to submit the requisite license application to the Department of Water Affairs and Forestry, as it was known at the time (the Department).
1 Woodhouse, P., ’Water rights in South Africa: Insights from legislative Reform’ (April 2008) Brooks World Poverty Institute, University of Manchester, BWPI Working Paper 36.2 ’Water legislation for local government’ Association for Water and Rural Development <http://www.award.org.za/file_uploads/File/WR-04C-d008.pdf> [Ac cessed 14 January 2013.]3 n 19.4 Global Water Partnership, Dublin-Rio Principles <http://www.gwp.org/The-Challenge/What-is-IWRM/Dublin-Rio-Principles/> [Accessed 13 March 2013.]5 Tracey Gowar, ’Can water rights be transferred: What do the courts say?’ (Phatshoane Henny Attorneys: Commercial Law Department) <http://www.polity.org. za/article/can-water-rights-be-transferred-what-do-our-courts-say-2013-02-26> [Accessed 13 March 2013.]6 i.e. to protect the quality of water resources and to enable the integrated management thereof, including the determination of ownership.7 Section 27(1), which prioritises the promotion of access of previously disadvantaged groups and particularly women.8 n 23.9 n 20.

99
The South African Food Cost Review 2012 The South African Food Cost Review 2012
In considering the application, the Department was obliged to take into account a number of factors as set out in section 27(1) of the NWA, which reads as follows:
In issuing a general authorisation or licence, a responsible authority must take into account all relevant factors, including:
(a) existing lawful water uses;
(b) the need to redress the results of past racial and gender discrimination;
(c) efficient and beneficial use of water in the public interest;
(d) the socio-economic impact
(i) of the water use or uses if authorised; or
(ii) of the failure to authorise the water use or uses;
(e) any catchment management strategy applicable to the relevant water resource;
(f) the likely effect of the water use to be authorised on the water resource and on other water users;
(g) the class and the resource quality objectives of the water resource;
(h) investments already made and to be made by the water user in respect of the water use in question;
(i) the strategic importance of the water use to be authorised;
(j) the quality of water in the water resource which may be required for the reserve and for meeting international obligations; and
(k) the probable duration of any undertaking for which a water use is to be authorised.
The Department ultimately proceeded to deny Goede Wellington’s application, basing its decision solely on considerations set out in subsection 27(1)(b) of the NWA. An attempt was made to take the decision on appeal before the National Water Tribunal, but leave to appeal was denied by said authority.
Goede Wellington then proceeded to approach the HC for a review of both the Department and the Water Tribunal’s decisions. The HC, followed by the SCA, found that the Department and the Water Tribunal misinterpreted the stipulation of section 27(1) of the NWA by regarding section 27(1)(b) not as one factor of several to be considered in a given context, but as an overarching prerequisite for the approval of any license application, irrespective of the facts concerned. It is important to note that, had there been a rival application from a person or community as described in subsection 27(1)(b), the decision of the Department, and perhaps even the Tribunal might well have been founded. This was not the case, however. Accordingly, the courts confirmed that ’all relevant factors’1 must be taken into account when considering an application for the issuance of a water license, including those conferred via transfer. While the Department’s discretion was recognised, the courts emphasised the need for a balanced, administratively just approach to decision-making.
The precedent set in this case establishes a reference point for applications brought for the transfer of water rights and provides clarification regarding the duty of organs of state when interpreting the stipulations of section 27(1). In addition, the judgment opens the door for the review of decisions unduly influenced by any single consideration prescribed in the NWA, or other statutory directives.
1 Emphasis added.

100
The South African Food Cost Review 2012 The South African Food Cost Review 2012
6.4.3 Agriculture and food security
Over the course of the last five decades, global agricultural production has steadily increased on a nearly annual basis, yet the number of people suffering from chronic hunger has remained relatively unchanged at around one billion worldwide.1 The individuals making up that number, and their geographic location, however, has changed markedly over the period, shifting from Asia and South America, to become largely concentrated in the Middle East and sub-Saharan Africa.
Figure 83: Food Security Risk Index: 2013Source: Maplecroft, Food Security Risk Index, published 2012
As the map illustrates, Africans today are at greater risk of being food insecure than those living anywhere else in the world. Since 2009, four of the five hungriest countries in the world were found on the African continent2. Sadly, this situation has endured despite the right to food being recognised in the continent’s Human Rights charters for decades3. In fact, according to the FAO4, the situation has worsened in recent years, with food security declining in sub-Saharan Africa, while rising steadily in Asia and South America. This has largely been ascribed to a decrease in African agricultural productivity, both in real terms and in comparison with the rest of the world. From 1963 to 2010, food production per capita fell by 13% in sub-Saharan Africa, while rising by 44% in Asia and 48% in South America5.
Investing in agriculture is crucial for reducing the occurrence of hunger and encouraging sustainable agricultural yields. If a map of national agricultural investment were to overlay the one shown above, it would reveal a correlation between regions of the world where agricultural capital per worker and public investments in agriculture have stagnated, and the epicentres of poverty and hunger6. It is estimated that demand growth over the coming decades will place even greater pressure on the natural resource base. Thus, to eliminate food insecurity sustainably will require a significant increase in agricultural investments, but also an improvement in the efficiency thereof.
1Spielman, D.J. & Pandja-Lorch, R., ’Fifty years of progress’, (2009) in Millions fed: Proven success in agricultural development, Spielman, D.J. & Pandja-Lorch, R. eds., IFPRI, Washington D.C., USA, pg. 1-18.2 (1) the DRC, with 75% of the population facing food insecurity; (2) Eritrea, with 66%; (3) Burundi, at 63%; (4) Haiti, at 58%; and (5) the Comoros, with 51%. ’The top 5 countries with the most hunger’, (2009) The Top 5 Anything <http://www.top5ofanything.com/index. php?h=09a17b00> [Accessed on 31 March 2013.] ’The state of food insecurity in the world: Economic crisis – impacts and lessons learned’, (December 2009) FAO, Rome, Italy, pp. 27-50.3 The African Charter on the Rights and Welfare of the Child, 1990; African Charter on Human and People Rights, right recognised by the African Commission in 2001; Protocol to the African Charter on the Rights of Women, 2003.4 ’State of Food and Agriculture 2012: Investing in agriculture for a better future’, (January 2013) FAO, Rome, Italy, pp. xi-xiv. 5 Figures quoted by Mr Geoff Tooth, Australian High Commissioner to Kenya, Uganda, Tanzania, and Rwanda and Australia’s ambassador to Burundi, Somalia and South Sudan, Food Security Conference, Sydney December 20126 n 32.

101
The South African Food Cost Review 2012 The South African Food Cost Review 2012
The United Nations (UN) Food and Agriculture Organisation’s (FAO) report entitled ‘State of Food and Agriculture 2012: Investing in agriculture for a better future’1 shows that farmers are the largest investors in developing country agriculture and argues, therefore, that farmers and their investment decisions must be central to any strategy aimed at improving agricultural investment.
Water deficits, which are already spurring heavy grain imports in numerous smaller countries, may soon do the same in larger countries, such as China or India. The water tables are falling in scores of countries (including northern China, the US, and India) due to widespread over-pumping using powerful diesel and electric pumps. Other countries affected, include Pakistan, Afghanistan, and Iran. This will eventually lead to water scarcity and cutbacks in grain harvest2. Even with the over-pumping of its aquifers, China is developing a grain deficit. When this happens, it will almost certainly drive grain prices upward. Most of the three billion people projected to be born worldwide by mid-century will be born in countries already experiencing water shortages. After China and India, there is a second tier of smaller countries with large water deficits – Afghanistan, Algeria, Egypt, Iran, Mexico, and Pakistan. Four of these already import a large share of their grain. Only Pakistan remains self-sufficient. But with a population expanding by four million a year, it will likely soon turn to the world market for grain.
Regionally, sub-Saharan Africa has the largest number of water-stressed countries of any other place on the globe and as of an estimated 800 million people who live in Africa; 300 million live in a water stressed environment. It is estimated that by 2030, 75 million to 250 million people in Africa will be living in areas of high water stress, which will likely displace anywhere between 24 million and 700 million people as conditions become increasingly unliveable. Because the majority of Africa remains dependent on an agricultural lifestyle and 80% to 90% of all families in rural Africa rely upon producing their own food, water scarcity translates to a loss of food security3.
Multimillion dollar investments beginning in the 1990s by the World Bank have reclaimed desert and turned the Ica Valley in Peru, one of the driest places on earth, into the largest supplier of asparagus in the world. However, the constant irrigation has caused a rapid drop in the water table, in some places as much as eight meters per year, one of the fastest rates of aquifer depletion in the world. The wells of small farmers and local people are beginning to run dry and the water supply for the main city in the valley is under threat. As a cash crop, asparagus has provided jobs for local people, but most of the money goes to the buyers, mainly the British. A 2010 report concluded that the industry is not sustainable and accuses investors, including the World Bank, of failing to take proper responsibility for the impact of their decisions on the water resources of poorer countries.4 Diverting water from the headwaters of the Ica River to asparagus fields has also led to a water shortage in the mountain region of Huancavelica, where indigenous communities make a marginal living herding.5
6.4.4 The water-food-trade nexus
As the Goede Wellington example illustrates, water is a critical component of agricultural production capacity, and in turn, a determinant of the sector’s trade potential. The fundamental right to water and access to water rights are contentious issues, set to become more so as climate change exacerbates droughts, further diminishing already limited supplies.
The Middle East and North Africa were the first regions to be confronted with debilitating water shortages in modern times; Southern Africa is now the second6 with South Africa rating among the countries most direly affected7, In addition to a low concentration of stable freshwater bodies, South Africa’s climate is also characterised by highly inconsistent rainfall, both geographically and over time, as illustrated by the figure below. Production outputs across the twelve percent of national land area considered suitable for the cultivation of rain-fed crops are directly dependent on rainfall, adding greatly to the risks of farming in these areas.8 Climate change predictions for the region expect rainfall to be even more infrequent, yet more intense.9
1 Ibid. 2 Ibid.3 ’Conference on water scarcity in Africa: Issues and challenges’, (3 October 2012), Paris, France, Dominique Bureau and Eric Strobl - Ecole Polytechnique, <http://www.gisclimat.fr/manifestation-scientifique/conf%C3%A9rence-%E2%80%9Cwater-scarcity-africa-issues-and-challenges%E2%80%9D> [Accessed 4 April 2013.] 4Lawrence, F., (September 15, 2010). ’How Peru’s wells are being sucked dry by British love of asparagus’, The Guardian UK, < http://www.guardian.co.uk/envi-ronment/2010/sep/15/peru-asparagus-british-wells> [Accessed 21 March 2013.]5Lawrence, F., (September 15, 2010) ’Big business clear winner in Peru’s asparagus industry’, The Guardian UK, < http://www.guardian.co.uk/global-develop-ment/poverty-matters/2010/sep/15/peru-asparagus-aid-policy> [Accessed 21 March 2013.]6Turnton, A.R., ’Precipitation, people, pipelines and power in Southern Africa: Towards a virtual water-based political ecology discourse’ in Stott P. and Sullivan S. (eds.), Political Ecology: Science, Myth and Power (London: Arnold & New York: Oxford University Press, 2000).7 n 10.8 Ibid.9Ibid.

102
The South African Food Cost Review 2012 The South African Food Cost Review 2012
This will effectively shrink the country’s arable land area and increase agricultural unpredictability1, with farmers finding it increasingly difficult to boost productivity in order to meet the nation’s growing demand for food2. This highlights the need for sound cropping and rangeland production practices to retain soil integrity despite these predicted intense rainfall events.
Figure 84: Mean annual rainfall in South Africa 1970—2006Source: South African Weather Service
In a water-scarce country like South Africa, it is important for the agricultural sector to consider the availability of resources in determining strategies for future competitiveness. One solution proposed in addressing this conundrum is what is known as ‘virtual water’3.
Virtual water is a recent concept that encourages nations to regard its agricultural crops in terms of the volume of water needed to produce said crops, with a view toward implementing trade policies that promote the conservation of scarce water resources4. One example is that of maize, which can use as much as 1 000ℓ of water in the production of one kilogram of grain5. Those 1 000ℓ constitute the virtual water-value of maize, and the amount of water South Africa exports with every ton of maize sold on the international market.
In light of existing water scarcity, set to be aggravated by climate change, it is important for the agricultural sector to consider ways in which resources can be utilised more effectively in order to ensure competitiveness in decades to come.
1 Ibid.2Ibid.3 Ibid.4 Ibid.5 Dabrowski, J.M., Masekomeng, E. and Ashton, P.J., ’Analysis of virtual water flows associated with the trade of maize in the SADC region: importance of scale’ (2009) Hydrology and Earth System Sciences 13(10):1967–1977.

The South African Food Cost Review 2012 The South African Food Cost Review 2012

104
The South African Food Cost Review 2012 The South African Food Cost Review 2012
A.C Nielsen,(2012). Selected food price information. Solicited
information from AC Nielsen.
Adcorp, 2012. Adcorp Employment Index, February 2012 ,
pp. 1–5.
AFDB (African Development Bank), 2011. The middle of the
pyramid: Dynamics of the middle class in Africa.
Market brief, 20 April. Ghana: Accra.
Aliber, M. & Hart, T.G.B., (2009). Should subsistence
agriculture be supported as a strategy to address
rural food insecurity? Agrekon, Vol 48 (4) , 434-458.
Altman, M., Hart, T.G.B & Jacobs, P.T., (2009).
Household food security status in South Africa.
Agrekon 48 (4): 345–361.
AMT (Agrimark Trends), 2012. Selected commodity price
information. Solicited information from Agrimark
Trends.
Armstrong, P. & Burger, C., (2009). Poverty, Inequality
and the Role of Social Grants: An Analysis using
Decomposition Techniques. Cape town: University of
Stellenbosch.
Annan, K., (1998), Partnership for a Global Community:
Annual Report on the Work of the Organisation, UN
Sales No. E.99.I.3, New York.
Baiphethi, M.N. & Jacobs, P.T., (2009). The contribution of
subsistance farming to food security in South Africa.
Agrekon 48 (4): 459–482.
Becker, G.S., 2006 .Sanitary and Phytosanitary (SPS)
Concerns in Agricultural Trade, CRS Report for
Congress, June, 2006.
Birdsall, N., 2010. The (indispensable) middle class in
developing countries; or the rich and the rest, not
the poor and the rest. Working paper 207.
Washington DC: Center for Global Development.
Birdsall, N., Graham, C. and Stefano Pettinato, S., 2000, Stuck
in the tunnel: Is globalization muddling the middle
class? Working paper 14. New York: Center on Social
and Economic Dynamics.
Cruces, G., Lopez-Calva, L.F. and Battiston, D., 2010. Down
and out or up and in? In search of Latin
America’s elusive middle class. Chile: UNDP (United
Nations Development Programme).
DAFF (Department of Agriculture, Forestry and Fisheries),
2012. [Online]. Available from:
http://www.daff.gov.za.
Dennis. A., 2010. Global economic crisis and trade: the role of
trade facilitation. Applied Economics Letters
17: 1753–1757.
Department of Labour, 2012. [Online]. Available from:
http://www.labour.gov.za.
De Schutter, O., (2011), Special Rapporteur on the Right
to Food: mission report to South Africa, OHCHR,
Geneva, Switzerland.
De Schutter, O., UN Special Rapporteur on the Right to Food,
last visited at http://www.srfood.org/index.php/en/
right-to-food on 17 April 2012.
University of Chicago Human Rights Program.
Drimie, S. & Ziervogel, G., (2006), ‘Food insecurity in South
Africa: monitoring and managing the realities of
integrating local information and experience into
national policy and practice–case study for the
vulnerability and resilience in practice’, VARIP,
Oxford, UK.
Dyck, S., Hansakul, S. and Saxena, R., 2009. Emerging
Asia’s middle class – a force to be reckoned with.
Frankfurt: Deutsche Bank Research.
Easterly, W., 2000, The Middle Class Consensus and Economic
Development, Policy Research Working Paper 2346,
World Bank, Washington, DC.
FAO (Food and Agricultural Organization) (2012).[Online].
Available from: http://www.fao.org.
FAO Regional Office, (October 2010), World Food Day
Report, viewed at http://www.fao.org/africa/raf-
news/detai-news/en/item/46625/icode/?no_
cache=1, last visited on 8 November 2010.
Fertilizer Society of South Africa, 2012. [Online]. Available
from: http://www.fssa.org.za.
Fundira, T., Denner, W. & Phahlane, 2010. Determining the
Scope and Nature of Non–Tariff Measures Prevalent
in Select International MarketsGlobal Trade Atlas,
2013.
Global Trade Atlas, 2012. [Online]. Available from:
http://www.gtis.com/wta.htm/.
Grain SA, 2011. [Online]. Available from:
http://www.grainsa.co.za.
Harper Peterson & Co. (2012). [Online]. Available from:
// http://www.harperpetersen.com/harpex/harpex.
107 References

105
The South African Food Cost Review 2012 The South African Food Cost Review 2012
Havenga, Jan J., 2011. Trade facilitation through logistics
performance: The enabling role of national
government. University of Stellenbosch.
Haard, N. F., Odunfa, S.A, Lee, L. & Rumirez. 1999. Fermented
cereals: A global Perspective. 138, Food and
Agricultural Organization Bulletin.
Hertova, D., Lopez-Calva, L.F. and Ortiz-Juarez, E., 2010.
Bigger… but stronger? The middle class in Chile and
Mexico in the last decade. Mexico: UNDP.
IEA (International Energy Agency), 2009. [Online]
Available from: http://www.iea.org.
IEA, 2012. [Online] Available from: http://www.iea.org.
IFA (International Fertilizer Industry Association), 2011.
[Online] Available from: http:/www.fertilizer.org.
IMF (International Monetary Fund), 2012. [Online]. Available
from: http://www.imf.org/external/
data.htm.
Investec, 2011, HCE Outlook: household spending: move to
higher LSM groups continues to drive growth,
Pretoria, Investec.
Investec, 2012. An overview of the South African economy.
Pretoria: Investec.
ITC Trade Map, 2013. [Online]: Available from: http://www.
trademap.org.
Lopez-Calva, L.F. and Ortiz-Juarez, E., 2011. A vulnerability
approach to the definition of the middle class. Policy
research working paper 5902. Washington DC:
World Bank.
Kaufmann, C. & Ehlert, C., (2009), ‘International and
domestic trade regulations to secure the
food supply’, University of Zurich, Zurich,
Switzerland, p. 1.
Kirchmeierm, F., (2009), International trade in agriculture
and the right to food, Occasional Paper 46/2009,
Dialogue on Globalization, Geneva, Switzerland.
Maritz, J., 2011. Africa’s middle class – how big is it really?
[Online]: Available from: http://www.
howwemadeitinafrica.com/africas-middle-class-
%e2%80%93- [Accessed on 14 March 2012.]
Matsuyama, K., 2000. The rise of mass consumption societies.
London: Northwestern University.
Max Braun Consulting Services, 2012. Transport operating
benchmarks for agricultural logistics. 2nd Progress
Report, January.
Mazibuko, L., Dlukulu, L., Qocha, D., Mfetane, V. and
Thloaele, D., 2008. An investigation into the
indebtedness of consumers: A case study of the
South African middle class. Pretoria.
Moodley, D., 2007. Consumer behaviour of the middle
class within the passenger vehicle market of South
Africa. Unpublished MBA thesis. Pretoria: University
of Pretoria.
MPO (Milk Producers’ Organisation. 2012. Personal
communication. Pretoria.
NAMC (National Agricultural Marketing Council), 2010. Food
Cost Review, November 2009.
NAMC, 2011. Food Cost Review, November 2010.
Nieftagodien, S. and Van der Berg, S., 2007. Consumption
patterns and the black middle class: The role of
assets. Stellenbosch economic working papers
02/07. Cape Town: University of Stellenbosch.
Nielsen, A.C., 2012. Selected food price information. Solicited
information from AC Nielsen.
NUS Consulting Group, 2012. [Online]. Available from: http:
// www.nusconsultinggroup.com.
ODI Staff Profiles, Steve Wiggins, last visited on 2 February
2011, at http://www.odi.org.uk/about/staff/details.
asp?id=92&name=steve-wiggins.
OECD, 2010, The emerging middle class in the developing
countries, Working paper No. 285, Global
development outlook, OECD development center,
Paris.
Office of SAMPRO, 2010. Personal Communication. Pretoria.
Oldewage-Theron, W., Dicks, E., Napier, C., 2005. Situation
analysis of an informal settlement in the Vaal Triangle.
Development Southern Africa, 22(1): 13–26.
Potts, M. & Campbell, M., (May 2011), ‘The myth of nine
billion’, Foreign Policy Online, last visited on 16 June
2011, at http://www.foreignpolicy.com/
articles/2011/05/09/the_myth_of_9_
billion?page=0,0
Portugal-Perez and Wilson. 2009. Why trade facilitation
matters to Africa. World Trade Review. 8 (3) 379– 416.
Ravallion, M., 2009, The Developing World’s Bulging (but
Vulnerable) ‘Middle Class, Policy Research Working
Paper 4816, World Bank, Washington, DC.
106
The South African Food Cost Review 2012 The South African Food Cost Review 2012
SAARF (South African Advertising Research Foundation),
2012. AMPS July 2010 to June 2011. Industry
presentation. [Online]. Available from:
http://www.saarf.co.za.
SAFEX (South African Futures Exchange), 2012.
[Online]. Available from: http://www.jse.co.za/
Markets/Commodity-Derivatives-Market/
commodity-Derivatives-physicaldelivery-info.aspx.
SAGIS (South African Grain Information Service, 2012.
[Online]. Available from: http://www.sagis.org.za.
SAMPRO (South African Milk Processors’ Organisation). 2012.
Personal communication. Pretoria.
Sebona, H., 2007, The role of brands in South African middle
class society, Unpublished MBA Thesis, Pretoria,
University of Pretoria.
Section 27 as discussed in Greer-Love, K., (2003), The
Constitutional right to food in the Republic of South
Africa: a critical examination of the history of section
27 and an evaluation of its enforcement, Chicago.
Southall, R., 2004, Political change and the black middle
class in democratic South Africa, Canadian Journal of
African studies, Vo 38 (3): pp. 521–542.
SARB., 2011, Quarterly Economic Review. South Africa,
Pretoria, Sarb.
SAARF (South African Advertising Research Foundation),
(2012). [Online]. Available from://
South African Petroleum Industry Association, (2012).
[Online]. Available from:// http://www.sapia.co.za/.
South African Feedlot Association, (2012). [Online]. Available
from:// http://www.safeedlot.co.za/.
Stats SA, 2012. [Online]. Available from: http://www.statasa.
gov.za.
StatsSA, 2009. [Online]. Available from:// http://www.
statasa.gov.za.
Steyn, N.P., Labadarios, D., 2000. National Food Consumption
Survey: Children aged 1–9 years, South Africa 1999.
Cape Town: Department of Health Directorate
Nutrition.
UCT Unilever Institute of Strategic, 2008. It’s onwards and
upwards for South Africa’s black diamond women.
Cape Town: University of Cape Town.
Visagie, J. and Posel, D., 2011, A reconsideration of what and
who is middle class in South Africa, Working paper
No. 249, Pietermaritzburg, University of KwaZulu
Natal.
Wiggins, S., (January 2011), ‘Comments on IFAD’s conference
on new directions for small-holder agriculture’,
Futures Agriculture Consortium Website, last visited
on 2 February 2011, at http://www.future-agricultures.
org/index. php?option=com_
easyblog&view=entry&id=48&Itemid=473.
World Bank, 2007, Global Economic Prospects: ‘Managing the
Next Wave of Globalization”, World Bank,
Washington, DC.
World Health Organisation, (2011), ‘Trade, foreign policy,
diplomacy and health’, WHO Homepage, viewed at
http://www.who.int/trade/glossary/story028/en/,
last visited on 20 October 2011.
World Trade Atlas (2013). Web address: http://www.gtis.
com/wta.htm/.
Yu Carrie. 2012. Outlook for the Retail and Consumer
Products Sector in Asia: 2012. Market Study by PWC.
Available online: www.pwc.com. [Accessed on 05
March 2013.]
Gordon, P., (2013). The South African Budget Speech 2013.
Parliament, Cape Town.
Makiwane, M. & Udjo, E., (2006). Is the Child Support Grant
associated with an increase in teenage fertility in
South Africa? HSRC, Pretoria.
NAMC. (2003). NAMC food basket. National Agricultural
Marketing Council, Pretoria.
National Treasury. (2013). The South African Budget review
2013. National Treasury Pretoria.
SASSA. (2013). A statistical summary of social grants in South
Africa. South African Social Security Agency,
Pretoria.
Samson, M., Kaniki, S., Van Niekerk, I. & Mac Quene, K.,
(2007). The Social and Economic impact of Cash
Transfers. Economic Policy Reasech Institute, Cape Town.
SARPN. (2004). Inequality and Social wage in South Africa:
Debating Aspects of the Ten-year Review.
StatsSA. (2013). Data of food prices. Statistics South Africa, Pretoria.
Triegaardt, J. D. (n.d.). Accomplishments and challenges for
partnerships in development in the transformation
of social security in South Africa.DBSA: Midrand.
Van der Berg, S. & Siebrits, K., (2010). Social assistance reform
during a period of fiscal stress. Cape town: Financial and
Fiscal Commission.

107
The South African Food Cost Review 2012 The South African Food Cost Review 2012
108 ANNEXURES
Annexure 1: Methodology to calculate the costs and margins in maize-to-maize meal
value chain
1. The farm gate price (also known as the producer price) is derived from:
Average SAFEX spot price maize (September 2011 to August 2012) lead by 4 months.
Minus
Average Safex differential (6)
Minus
Average storing cost for farmers (4)
Minus
Average handling, grading, procurement fee & 1% physical loss fee. (3)
Minus
Transport cost: farm gate to silo (2)
2. Transport cost: farm gate to silo: Was calculated as R1.13/km/ton maize for an average of a trip of 20 kilometres to the silo and 20
kilometres back.
3. Average handling, grading, procurement fee & 1% physical loss fee: Was calculated as an average on the physical cost for 7 silo
owners and R35 procurement and a 1% physical loss fee.
4. Average storage cost for the farmer: Was calculated as weighted average for one-third stored for 0 days, one-third stored for 60
days on a daily tariff and one-third stored on the yearly tariff. The above calculation is based on opinion from industry leaders.
5. Safex derived price for the seller /buyer at the silo: Was calculated as follows:
Average SAFEX spot price for white maize (2011 and 2012) lead with 4 months
Minus
Average location differential
6. Average location differential was calculated as a weighted average of all the transport differentials for 2011/12 season as published
by the Johannesburg Stock Exchange’s Agricultural Product Division of the future exchange Market (SAFEX) for all registered silo’s
handling maize.
7. Average SAFEX spot price for white maize (2011/12) lead with 4 months is an average for all the trading days from 1 September
2011 to 30 August 2012. Statistical testing proved that the level of correlation between the producer price and the consumer price
is the highest when the producer price is lagged by four months. This implies that it takes four months from the moment the miller
buys the maize until it appears on the shelf of the retailer.
8. Storage and handling cost: Cost to the miller is based on opinions from industry players and is calculated as daily tariff times 120
days storage.
9. Transport costs: silo to mill door
It is the opinion of industry players that the bigger millers are very close to urban areas. Therefore their transport cost was calculated
as 80% of the transport differential.
108
The South African Food Cost Review 2012 The South African Food Cost Review 2012
10. Income from sale of chop
The income from the sales of chop is based on an average paid by feedlots in 2012 on 37% (1 – extraction rate) of the product.
11. Mill door price: Was calculated as follow:
Averages Safex spot price for white maize (2011/12) 4 months lagged
Plus
Storage and handling costs: Cost to miller
Plus
Transport costs: Silo to mill door
Minus
Income from sale of chop
12. Mill site cost: The fixed and variable cost of manufacturing is based on opinions from the industry. The mill site cost is the sum of the production cost, packing cost, packing material cost and losses
13. Total mill site cost: Total mill site cost is distribution cost plus mill site cost
14. Fixed capital cost: This cost is based on opinion of industry players
15. Floating capital cost: This cost is based on opinion of industry players
16. Total Manufacturing and Distribution Cost: This cost is a summation of all the manufacturing costs
17. Conversion cost: This is the total manufacturing and distribution cost
18. Average cost of maize (mill door prize) This is the mill door prize for maize
19. Total super maize meal cost: Is the conversion cost plus the total manufacturing and distribution cost
20. Extraction rate for super maize meal: Is the ratio of chop: maize meal after manufacturing.
21. Average cost of maize (mill door prise): Extraction rate/ Total super maize meal cost
22. Miller to retail margin: Average monthly retail price (5 kg Bag) minus the average cost of maize (mill door prize
23. Average monthly retail price (5 kg & 12.5 Bag): A weighted price (30:70) between a 5 kg and 12.5 kg was calculated.

109
The South African Food Cost Review 2012 The South African Food Cost Review 2012
Annexure 2: Methodology on the calculation of wheat to bread value chain
1. The farm gate price (also known as the producer price) is derived from:
Average SAFEX spot price for wheat (2011/12) lead by 4 months.
Minus
Average location differential (6)
Minus
Average storing cost for farmers (4)
Minus
Average handling, grading, procurement fee & 1% physical loss fee. (3)
Minus
Transport cost: farm gate to silo (2)
2. Transport cost: farm gate to silo: Was increased with the CPI from 2010. The net result represents R1.14/km/ton wheat for an average of a trip of 20 kilometres to the silo and 20 kilometres back (Braun; 2010).
3. Average handling, grading, procurement fee & 1% physical loss fee: Was calculated as an average on the physical cost for 7 silo owners and a R35 per ton procurement fee and a 1% physical loss fee on the Safex derived price.
4. Average storage cost for the farmer: Was calculated as weighted average for one-third stored for 0 days, one-third stored for 60 days at an average daily tariff and one-third stored on the yearly tariff. The above calculation is based on opinion from industry leaders.
5. Safex derived price for the producer: Was calculated as follow:
Average SAFEX spot price for wheat (2012) lead with 4 months
Minus
Average Safex differential
6. Average location differential was calculated as an average of all the transport differentials for 2010 as published by the Johannesburg Stock Exchange’s Agricultural Product Division of the future exchange Market (SAFEX) for all registered silo’s handling wheat.
7. Average SAFEX spot price for wheat lead with 4 months is an average for all the trading days from 1 October 2011 to 30 September 2012. Statistical testing proved that the level of correlation between the producer price and the consumer price is the highest when the producer price is lagged by four months. This implies that it takes four months from the moment the miller buys the wheat until it appears on the shelf of the retailer.
8. Storage and handling cost: Cost to the miller is based on opinions from industry players and is calculated as daily tariff times 120 days storage.
9. Transport costs: silo to mill door
It is the opinion of industry players that the bigger millers are very close to urban areas. Therefore their transport cost was calculated as 80% of the transport differential.
10. Income from sale of bran:
The income from the sales of bran is based on an average of 80% of the yellow maize price.

The South African Food Cost Review 2012 The South African Food Cost Review 2012
110
The South African Food Cost Review 2012 The South African Food Cost Review 2012
11. Mill door price: Was calculated as follow:
Averages derived price for the seller/buyer at the silo
Plus
Storage and handling costs: cost to miller
Plus
Transport costs: silo to mill door
Minus
Income from sale of bran
12. Mill site cost: The fixed and variable cost of manufacturing is based on opinions from the industry. The mill site cost is the sum of the production cost, packing cost, packing material cost and losses.
13. Total mill site cost: Total mill site cost is distribution cost plus mill site cost.
14. Fixed capital cost: This cost is based on opinion of industry players.
15. Floating capital cost: This cost is based on opinion of industry players.
16. Total Manufacturing and Distribution Cost: This cost is the sum of all the manufacturing cost.
17. Total wheat flour cost for white bread: This is the total manufacturing and distribution cost.
18. Average extraction rate of flour: Is the ratio of bran: flour after manufacturing.
19. Total cost of white bread flour: Total Wheat flour cost rand/ton.
20. Cost of flour per loaf: Total cost of white bread flour/ extraction rate of white bread flour.
21. Extraction rate of white bread: It takes 464 g of flour to bake a 700 g loaf of white bread and 440 g of flour to bake a 700 g loaf of brown bread.
22. Cost of flour per loaf. This is the calculated cost to produce flour.
23. Packaging: Average cost of between R0.30 and R0.3/loaf based on the opinion of industry players.
24. Other raw material: Average cost of between R0.46 and R0.50/loaf based on the opinion of industry players.
25. Production & maintenance: Average cost of between R1.05 and R1.16/loaf based on the opinion of industry players.
26. Distribution: Average cost of between R0.86 and R0.95/loaf based on the opinion of industry players.
27. Overheads: Average cost of between R0.49 to R0.55/loaf based on the opinion of industry players.
28. Cost of producing white bread: Summation of Cost of flour per loaf + packaging + other raw material production & maintenance + distribution + overheads.
29. Bakers & millers margin: Wholesale price minus cost of producing bread.
30. Wholesale price: Retail purchase price minus rebates, losses and returns.
31. Rebates, losses & returns: Is calculated as an estimate of 11% of the retailers purchase price.
32. Retailers purchase price: Retail price minus retail margin.
33. Retailers margin: Retailers margin is calculated as an estimate of 14% of the retailers purchase price.
34. White/Brown bread retail price (Vat Exc): White/Brown bread retail price (Vat Inc):/1 + (Vat).
35. Vat (14%): Governmental legislation of 14% value added tax on white bread and 0% on brown bread.
36. White/Brown bread retail price (Vat Inc): Average retail price for 2011 monitored by Stats SA and published in the Food Price Monitor of the NAMC.
37. Margin between selling price and cost of producing a loaf of white bread: White/Brown bread retail price (Vat Inc) minus cost of producing white bread.

The South African Food Cost Review 2012 The South African Food Cost Review 2012The South African Food Cost Review 2012 The South African Food Cost Review 2012
Notes

The South African Food Cost Review 2012 The South African Food Cost Review 2012
Notes

The South African Food Cost Review 2012 The South African Food Cost Review 2012
Notes

Contact Us: Tel: +27 (12) 341 1115 | Fax: +27 (12) 341 1811
E-mail: [email protected]
Block A | 4th Floor | Meintjiesplein Building | 536 Frances Baard Street | Arcadia | Pretoria | 0002.
Private Bag X935 | Pretoria | 0001
Website: www.namc.co.za
ISBN: 978-0-621-42211-5