the source for maritime information and...
TRANSCRIPT

Copyright © 2009 IHS Global Insight. All Rights Reserved.
The Source for Maritime Information and Insight
Copyright © 2008 IHS Inc. All Rights Reserved. 1
A Greener Shade of Blue
Christopher Pålsson
Director
IHS Fairplay

Copyright © 2009 IHS Global Insight. All Rights Reserved.
20 minutes of What’s
•What’s
• Going On?
• Possible?
• Going to Happen?

Copyright © 2009 IHS Global Insight. All Rights Reserved.
WHAT’S GOING ON?
Copyright © 2009 IHS Global Insight. All Rights Reserved.
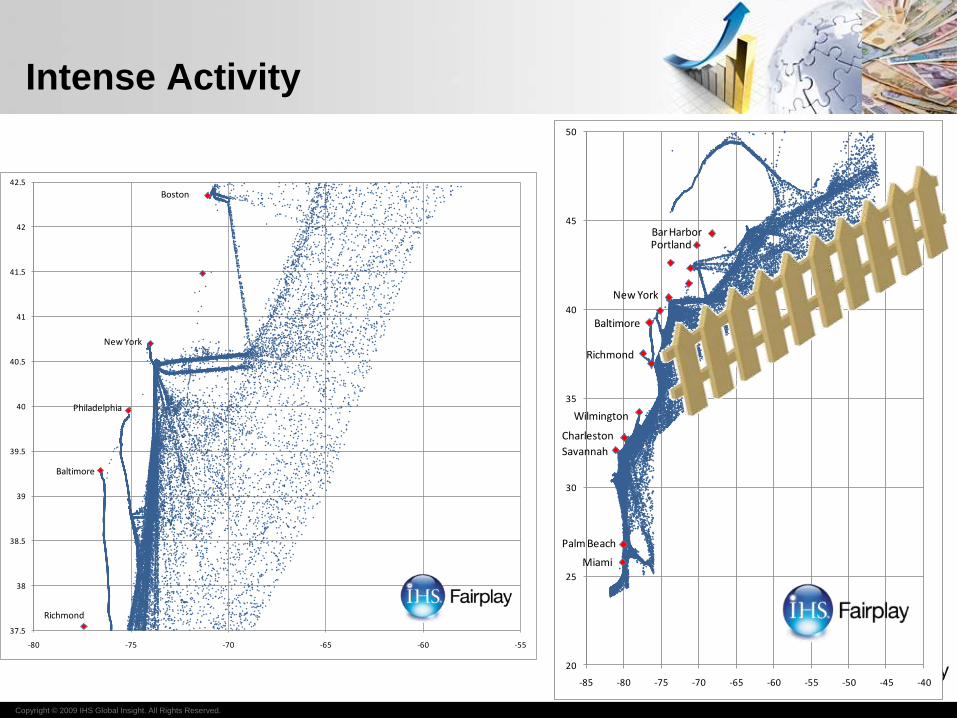
Intense Activity
37.5
38
38.5
39
39.5
40
40.5
41
41.5
42
42.5
-80 -75 -70 -65 -60 -55
New York
Baltimore
Philadelphia
Richmond
Boston
20
25
30
35
40
45
50
-85 -80 -75 -70 -65 -60 -55 -50 -45 -40
Miami
Richmond
New York
Palm Beach
Charleston
Savannah
Baltimore
Portland
Wilmington
Bar Harbor
Copyright © 2009 IHS Global Insight. All Rights Reserved.
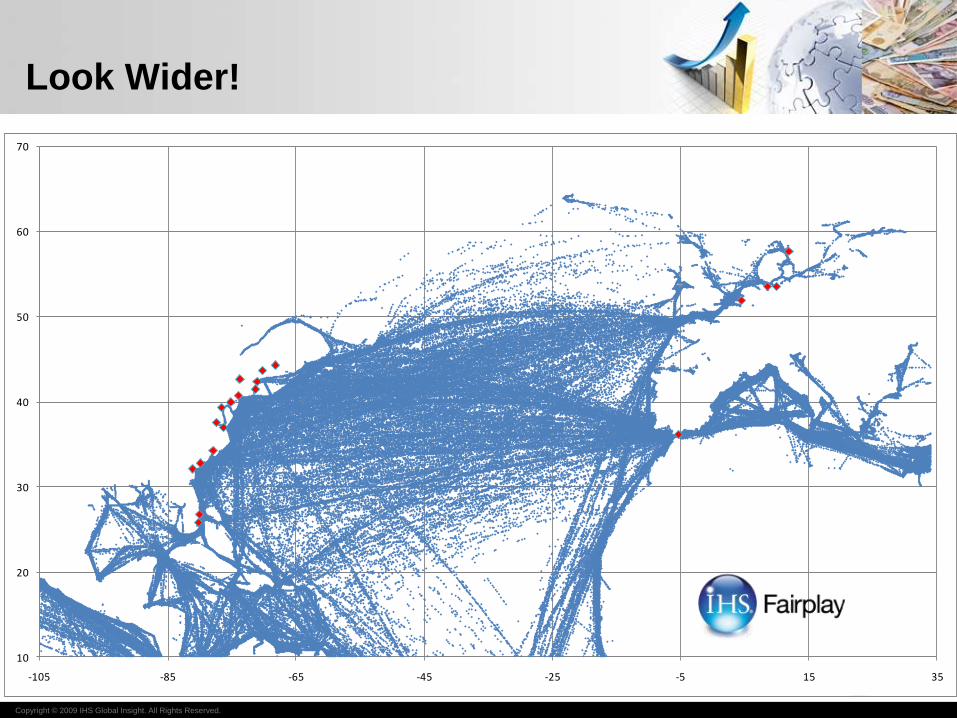
Look Wider!
10
20
30
40
50
60
70
-105 -85 -65 -45 -25 -5 15 35
Copyright © 2009 IHS Global Insight. All Rights Reserved.
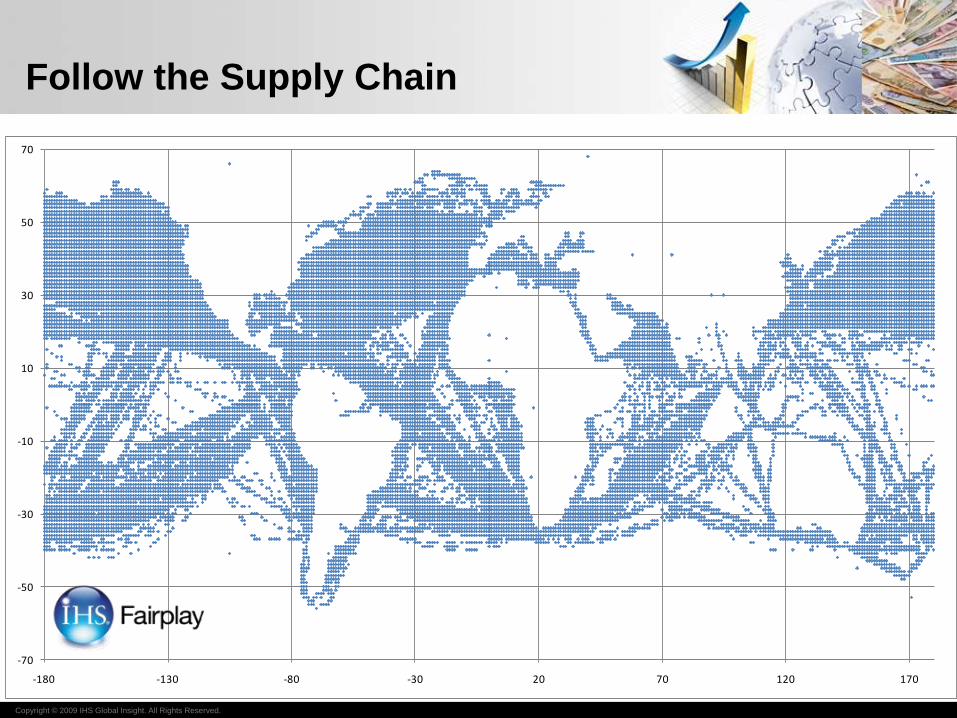
Follow the Supply Chain
-70
-50
-30
-10
10
30
50
70
-180 -130 -80 -30 20 70 120 170
Copyright © 2009 IHS Global Insight. All Rights Reserved.
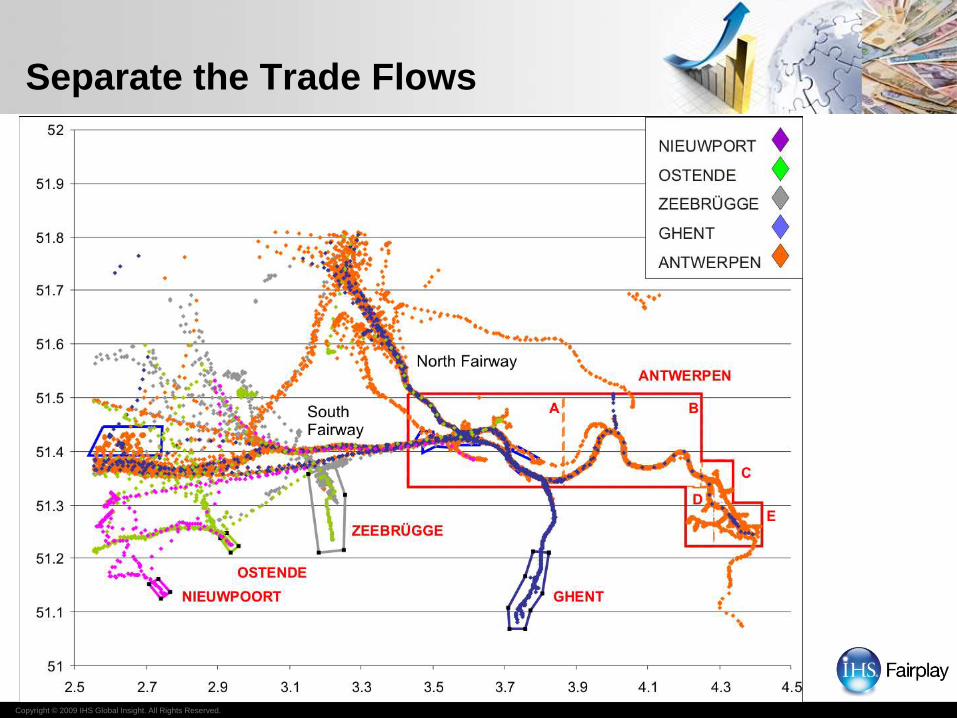
Separate the Trade Flows
Copyright © 2009 IHS Global Insight. All Rights Reserved.
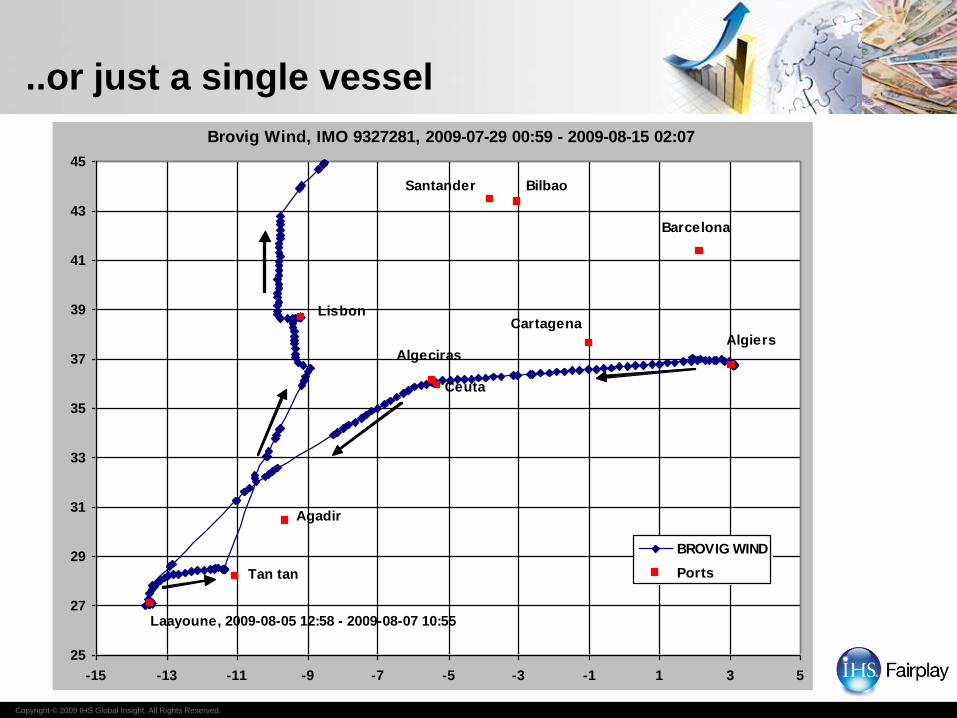
..or just a single vessel
Brovig Wind, IMO 9327281, 2009-07-29 00:59 - 2009-08-15 02:07
25
27
29
31
33
35
37
39
41
43
45
-15 -13 -11 -9 -7 -5 -3 -1 1 3 5
BROVIG WIND
Ports
Laayoune, 2009-08-05 12:58 - 2009-08-07 10:55
Lisbon
Agadir
Algeciras
Cartagena
Algiers
Barcelona
Santander Bilbao
Ceuta
Tan tan

Copyright © 2009 IHS Global Insight. All Rights Reserved.
WHAT’S POSSIBLE?
Copyright © 2009 IHS Global Insight. All Rights Reserved.
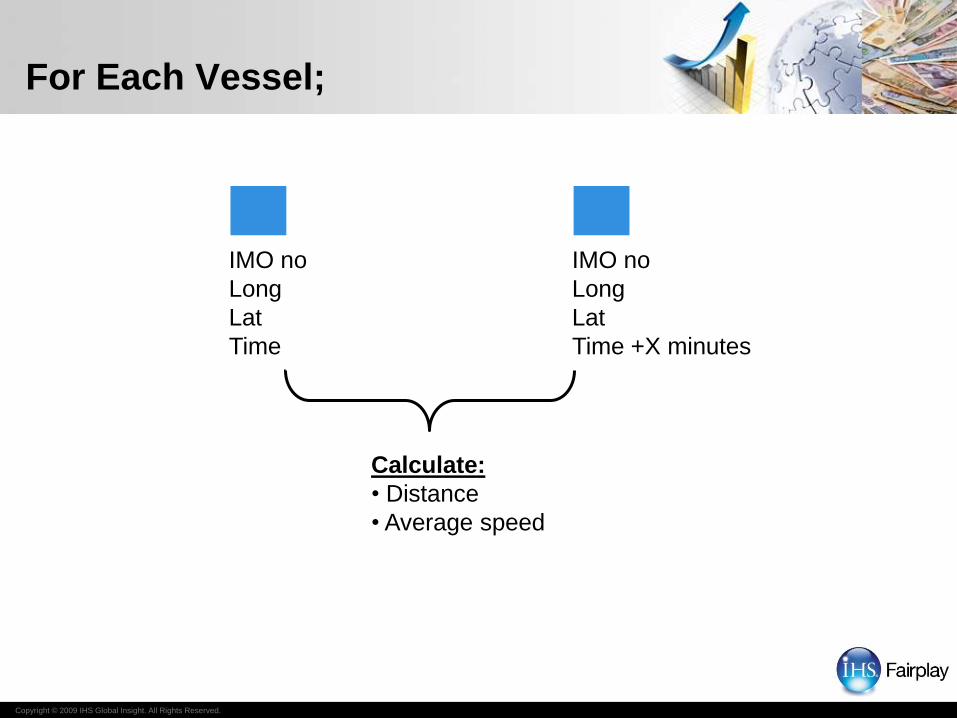
For Each Vessel;
IMO no
Long
Lat
Time
IMO no
Long
Lat
Time +X minutes
Calculate:
• Distance
• Average speed

Copyright © 2009 IHS Global Insight. All Rights Reserved.
Traffic data AIS-Live
Vessel data Reg of Ships
Engine emission
characteristics
database
IMO No
Engine
designation
Emissions
calculations
Output of
results
Emissions Model

Copyright © 2009 IHS Global Insight. All Rights Reserved.
The speed determines the power outtake
0
Knots
Pro
puls
ion fuel consum
ption tonsfu
el/day Cruise speed level
Port approach level
Copyright © 2009 IHS Global Insight. All Rights Reserved.
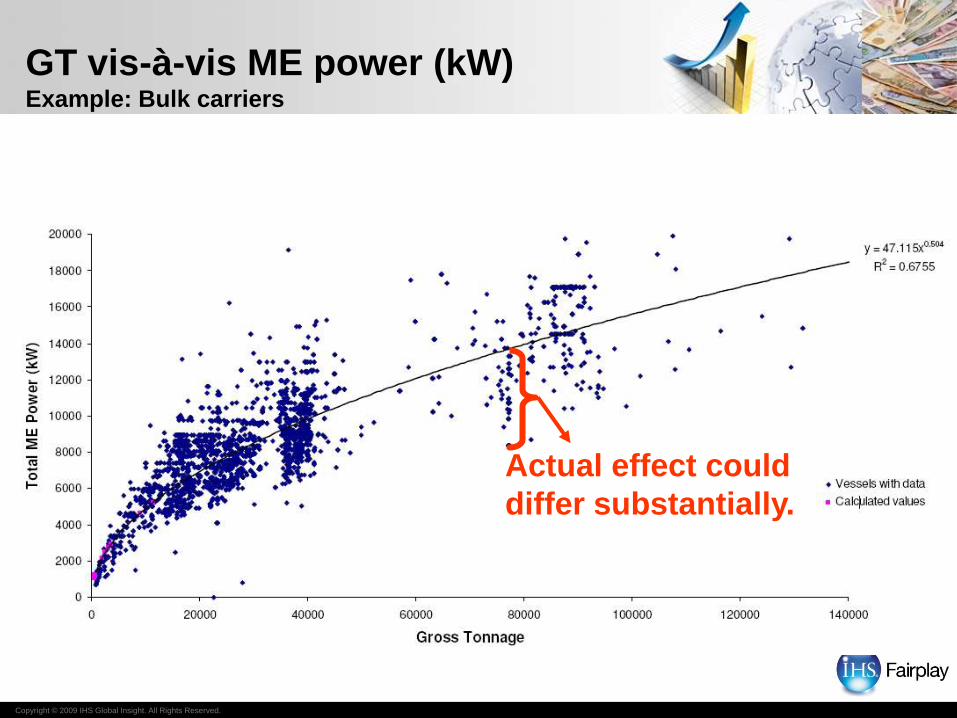
Actual effect could
differ substantially.
GT vis-à-vis ME power (kW)Example: Bulk carriers
Copyright © 2009 IHS Global Insight. All Rights Reserved.
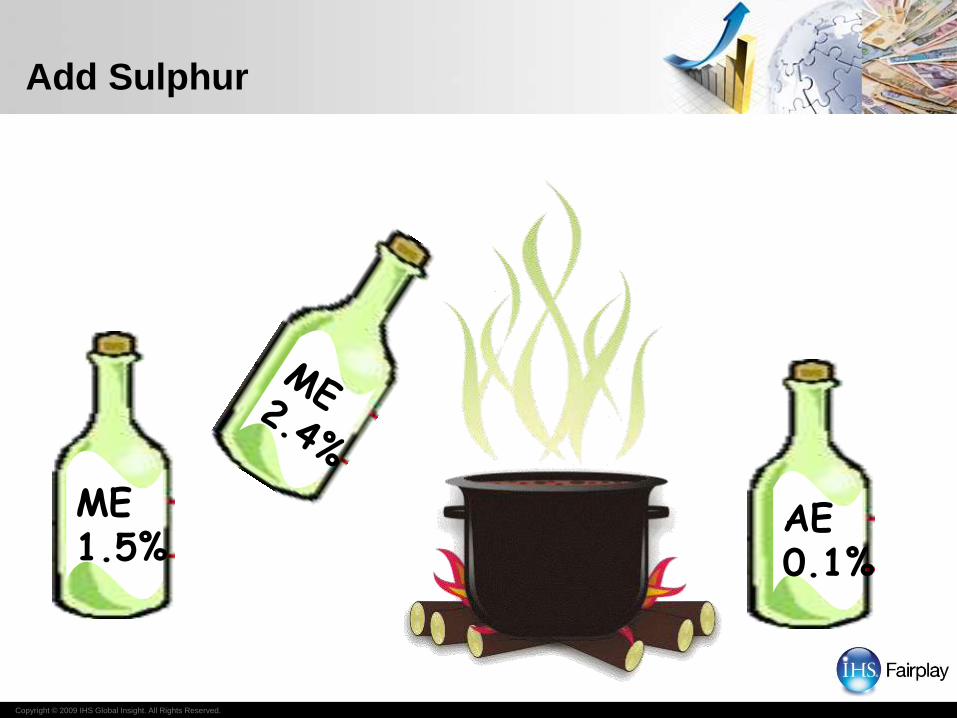
Add Sulphur
ME1.5%
AE0.1%
Copyright © 2009 IHS Global Insight. All Rights Reserved.
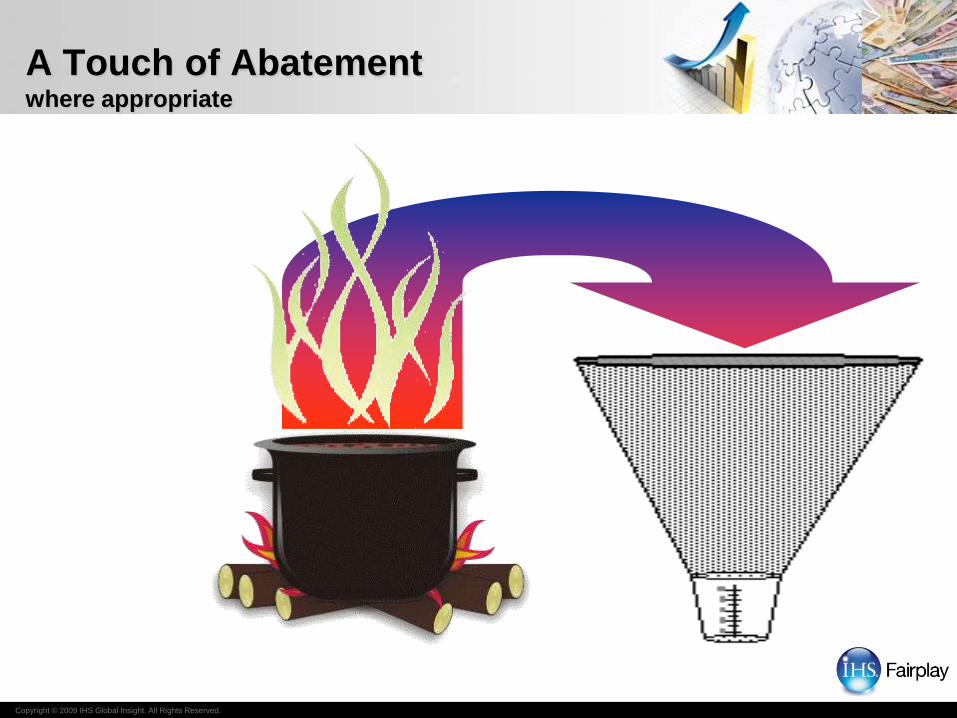
A Touch of Abatementwhere appropriate
Copyright © 2009 IHS Global Insight. All Rights Reserved.
Slow Steam
Present the results

Copyright © 2009 IHS Global Insight. All Rights Reserved.
Total Duration in Port - hours
0
1,000
2,000
3,000
4,000
5,000
6,000
7,000
8,000
9,000
10,000
1 2 3 4 5 6 7 8 9 10 11 12 1 2 3
2009 2010
8,000+ teu
5 -7,999 teu
3 -4,999 teu
2 -2,999 teu
1 -1,999 teu
-999 teu
Copyright © 2009 IHS Global Insight. All Rights Reserved.
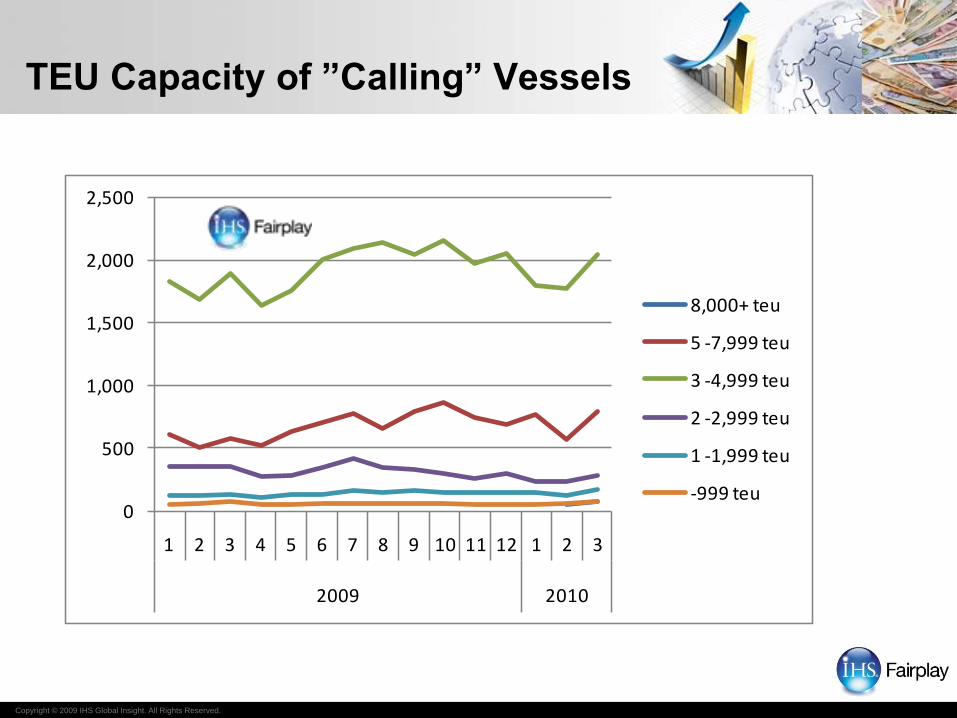
TEU Capacity of ”Calling” Vessels
0
500
1,000
1,500
2,000
2,500
1 2 3 4 5 6 7 8 9 10 11 12 1 2 3
2009 2010
8,000+ teu
5 -7,999 teu
3 -4,999 teu
2 -2,999 teu
1 -1,999 teu
-999 teu
Copyright © 2009 IHS Global Insight. All Rights Reserved.
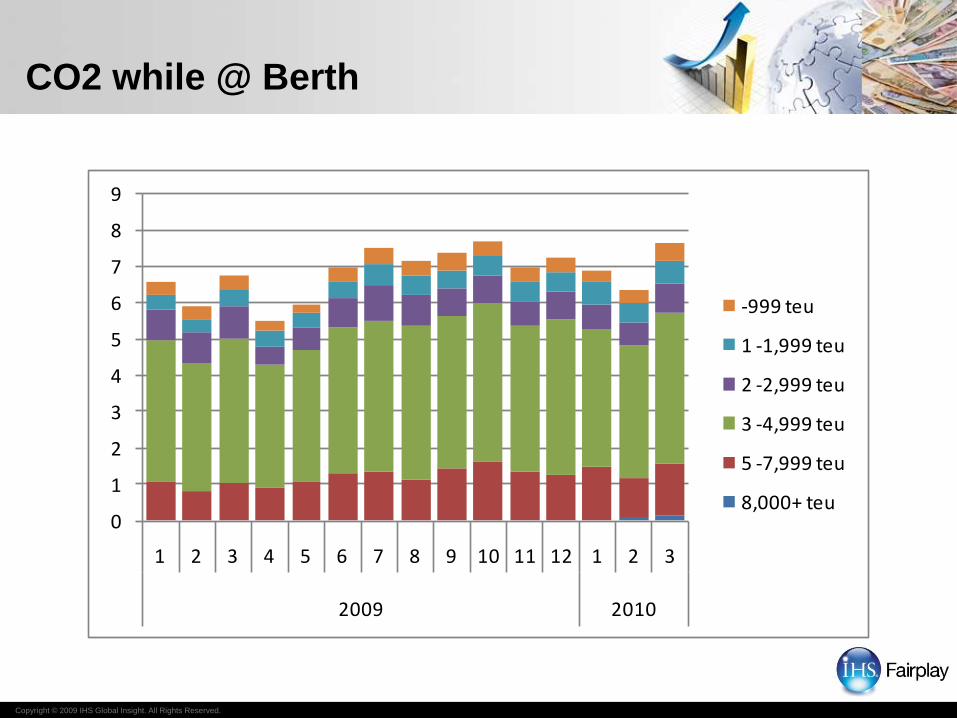
CO2 while @ Berth
0
1
2
3
4
5
6
7
8
9
1 2 3 4 5 6 7 8 9 10 11 12 1 2 3
2009 2010
-999 teu
1 -1,999 teu
2 -2,999 teu
3 -4,999 teu
5 -7,999 teu
8,000+ teu

Copyright © 2009 IHS Global Insight. All Rights Reserved.
WHAT’S
GOING TO
HAPPEN?
Que?

Copyright © 2009 IHS Global Insight. All Rights Reserved.
Global Scenarios to 2030
•Global Redesign (Planning case)
• Rebalanced production & consumption between
regions.
• Global growth propelled by Emerging Markets.
• Growing tension over nuclear weapons proliferation.
• Non-fossil fuels increase market share.
• Energy demand shift away from OECD.
• OECD oil demand has peaked.
• Continued resource nationalism.
• Oil loses monopoly in transportation sector.
• Successful GHG emissions agreement in latter part.
www.ihsglobalscenarios.com
Vortex
• Boom
• Bust
• Lost Decade
Vortex
• Boom
• Bust
• Lost Decade
Metamorphosis
• Non-fossil fuel focus
• Battery innovation
© 2009, Cambridge Energy Research Associates, Inc. No portion of this presentation may be reproduced, reused, or otherwise distributed in any form without prior written consent.
4
IHS_CERA_Template_MMDD09
Source: IHS Cambridge Energy Research Associates.
####
Copyright © 2009 IHS Global Insight. All Rights Reserved.
-5.0
-3.0
-1.0
1.0
3.0
5.0
7.0
9.0
11.0
13.0
15.0
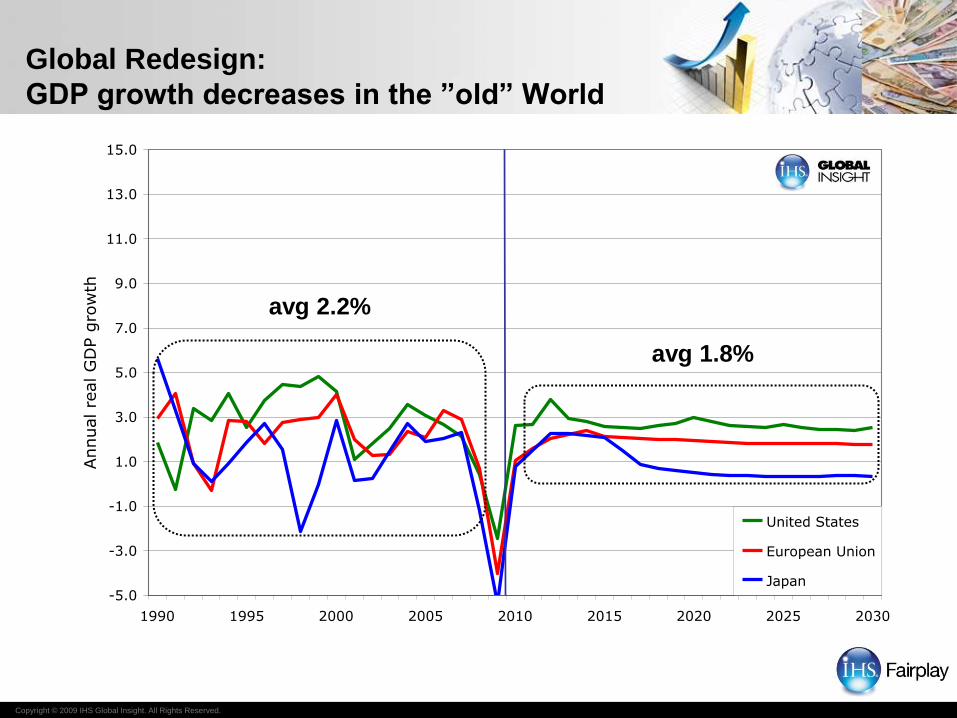
1990 1995 2000 2005 2010 2015 2020 2025 2030
Annual re
al G
DP g
row
th
United States
European Union
Japan
Global Redesign:
GDP growth decreases in the ”old” World
avg 1.8%
avg 2.2%
Copyright © 2009 IHS Global Insight. All Rights Reserved.
-5.0
-3.0
-1.0
1.0
3.0
5.0
7.0
9.0
11.0
13.0
15.0
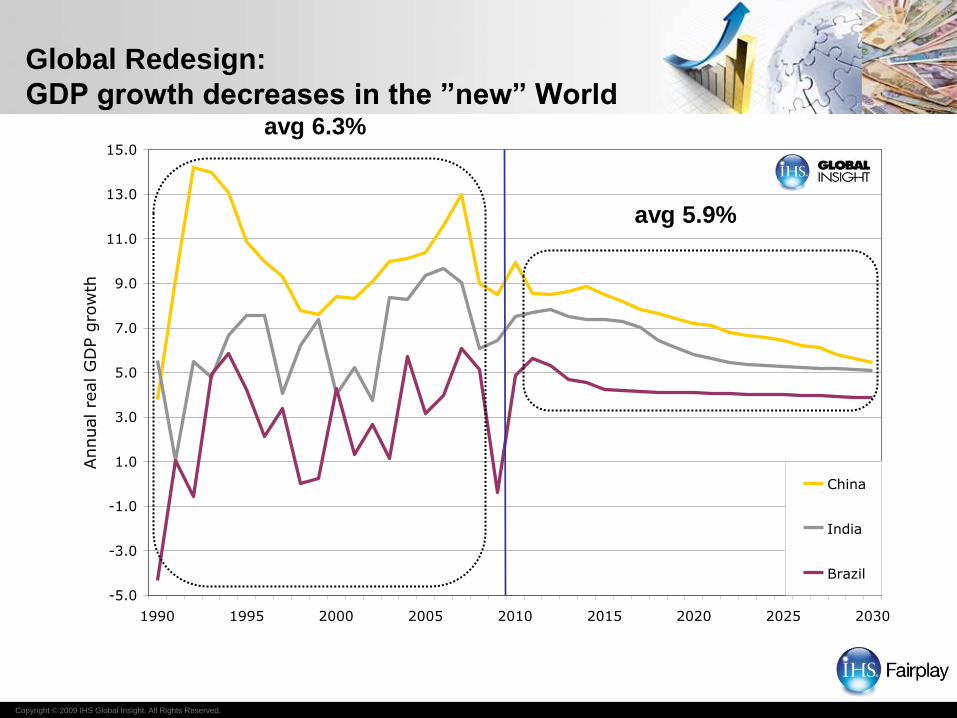
1990 1995 2000 2005 2010 2015 2020 2025 2030
Annual re
al G
DP g
row
th
China
India
Brazil
Global Redesign:
GDP growth decreases in the ”new” World
avg 5.9%
avg 6.3%
Copyright © 2009 IHS Global Insight. All Rights Reserved.
-5.0
-3.0
-1.0
1.0
3.0
5.0
7.0
9.0
11.0
13.0
15.0
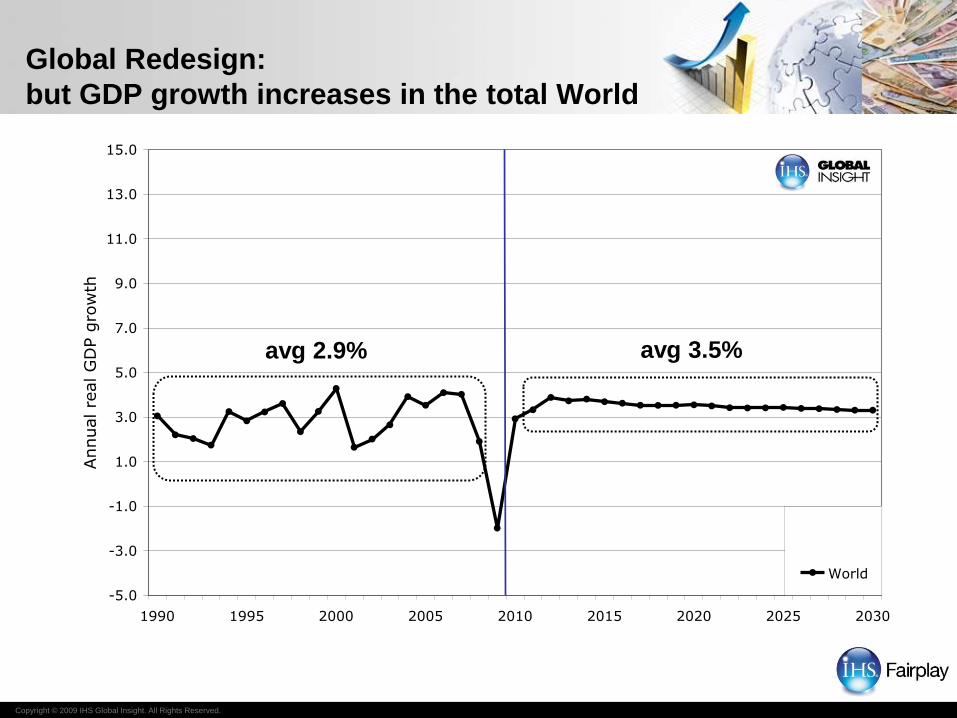
1990 1995 2000 2005 2010 2015 2020 2025 2030
Annual re
al G
DP g
row
th
World
Global Redesign:
but GDP growth increases in the total World
avg 3.5%avg 2.9%
Copyright © 2009 IHS Global Insight. All Rights Reserved.
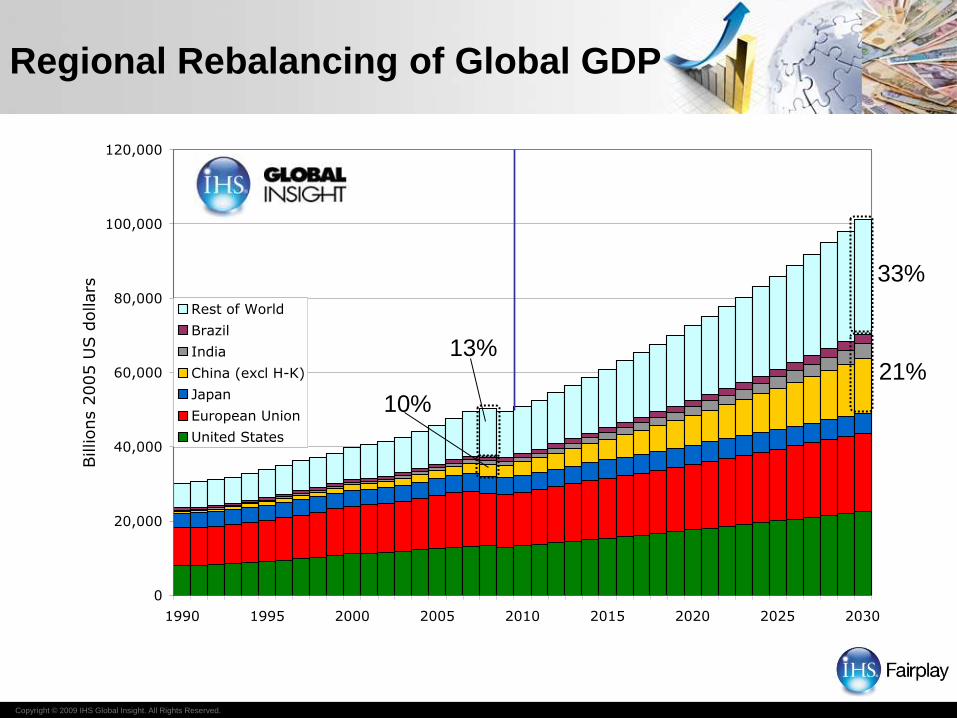
Regional Rebalancing of Global GDP
0
20,000
40,000
60,000
80,000
100,000
120,000
1990 1995 2000 2005 2010 2015 2020 2025 2030
Billions 2
005 U
S d
ollars
Rest of World
Brazil
India
China (excl H-K)
Japan
European Union
United States
21%
10%
13%
33%
Copyright © 2009 IHS Global Insight. All Rights Reserved.
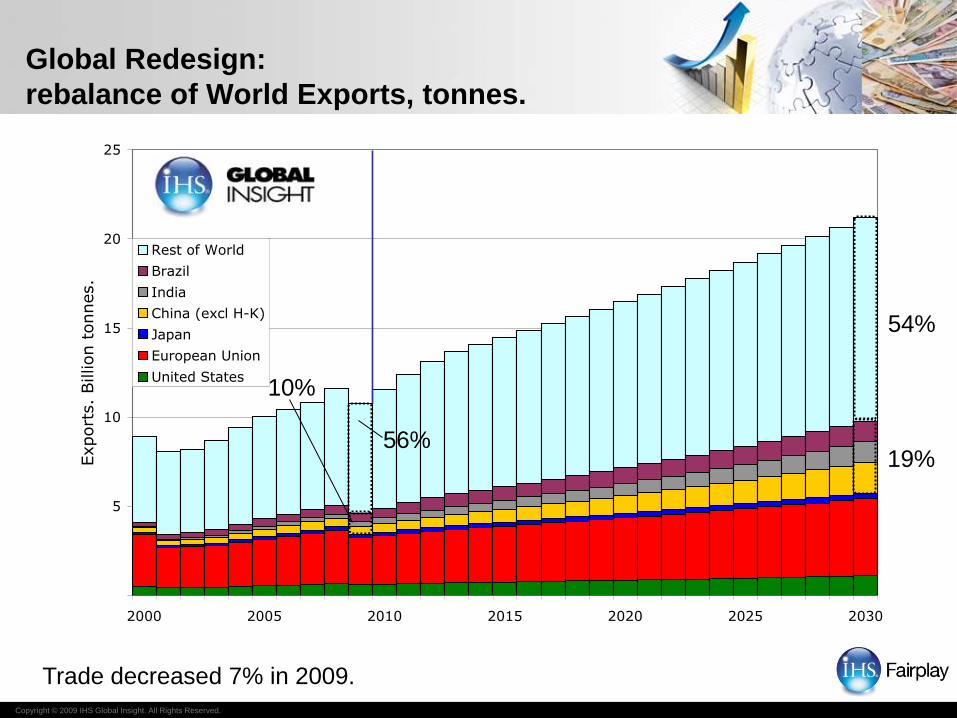
Global Redesign:
rebalance of World Exports, tonnes.
5
10
15
20
25
2000 2005 2010 2015 2020 2025 2030
Export
s.
Billion t
onnes.
Rest of World
Brazil
India
China (excl H-K)
Japan
European Union
United States
19%
10%
56%
54%
Trade decreased 7% in 2009.

Copyright © 2009 IHS Global Insight. All Rights Reserved.
Global Redesign:
N America Containerized Imports
5
10
15
20
25
30
2005 2006 2007 2008 2009 2010 2011 2012 2013 2014 2015
S America
N America
Middle East
Europe
C America
Africa & RoW
AustralAsia
Asia other
Asia FE

Copyright © 2009 IHS Global Insight. All Rights Reserved.
Capacity Delivery; More of Everything
0
2
4
6
8
10
12
14
16
18
20
1976 1979 1982 1985 1988 1991 1994 1997 2000 2003 2006 2009 2012
Co
nta
ine
r fl
ee
t, m
illio
n te
u, 1
97
6-
-999 teu 1 -1,999 teu 2 -2,999 teu 3 -4,999 teu 5 -7,999 teu 8,000+ teu2010-05
Forecast
Copyright © 2009 IHS Global Insight. All Rights Reserved.
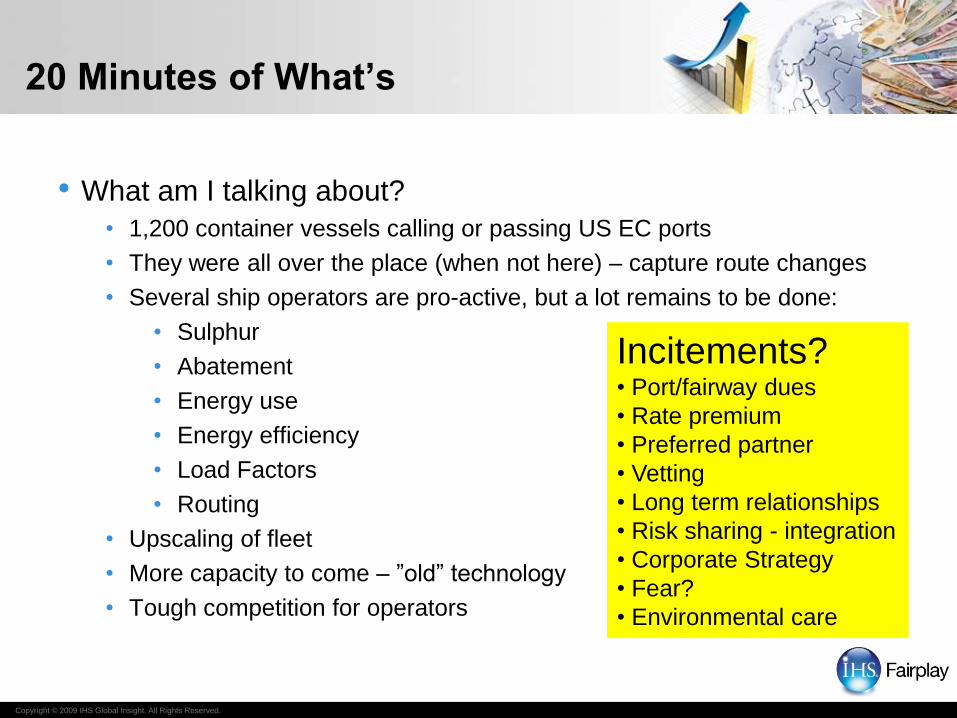
20 Minutes of What’s
• What am I talking about?
• 1,200 container vessels calling or passing US EC ports
• They were all over the place (when not here) – capture route changes
• Several ship operators are pro-active, but a lot remains to be done:
• Sulphur
• Abatement
• Energy use
• Energy efficiency
• Load Factors
• Routing
• Upscaling of fleet
• More capacity to come – ”old” technology
• Tough competition for operators
Incitements?• Port/fairway dues
• Rate premium
• Preferred partner
• Vetting
• Long term relationships
• Risk sharing - integration
• Corporate Strategy
• Fear?
• Environmental care
A Greener Shade of Blue“…and the truth is plain to see”
Thank you
Thanks to Procul
Harum, ”A whiter shade
of pale” for inspiration.
“…I was feeling kinda seasick”

Copyright © 2009 IHS Global Insight. All Rights Reserved.
The Source for Maritime Information and Insight
Copyright © 2008 IHS Inc. All Rights Reserved. 32