the souls of poor folk: auditing america 50 years after the poor people’s campaign challenged...
TRANSCRIPT


Oliver F. Atkins, copyright Oliver Atkins Collection, Special Collections & Archives, George Mason University Libraries

ABOUT THIS REPORT
This initial report was produced by Institute for Policy Studies staff in support of the Poor People’s Campaign: A National Call for Moral Revival (www.PoorPeoplesCampaign.org). This campaign, marking the 50th anniversary of the Poor People’s Campaign led by the Rev. Dr. Martin Luther King, Jr. and other leaders, aims to build a broad and deep national movement rooted in the leadership of the poor and dispossessed as moral agents and reflecting the great moral teachings to unite our country around a transformative agenda to combat poverty, racism, militarism, and ecological devastation. We worked in collaboration with the Co-Chairs of the Poor People’s Campaign, Rev. Dr. William J. Barber, II and Rev. Dr. Liz Theoharis, and the Tri-Chairs of the Campaign's Audit Committee, Rev. Dr. James Forbes, Dr. Tim Tyson, and Shailly Gupta Barnes.
In the coming months, the Institute for Policy Studies will work with the Poor People’s Campaign to conduct a much more in-depth “audit” of the structural and systemic causes for what Dr. King called the “Triplets of Evil” — racism, extreme materialism, and militarism — as well as the interrelated problem of ecological destruction. To learn lessons for today, we will be hearing testimony and interviewing leaders who’ve been in the middle of the key struggles for progress of the past 50 years. This analysis will feed into the new Poor People’s Campaign’s efforts to advance structural solutions to the multiple crises of today.
This is not a commemoration. Dr. King and the Poor People's Campaign of 1967/68 began an effort to build a broad, fusion coalition that would audit America and demand an accounting of promissory notes that had been returned marked
“insufficient funds.” — Rev. Dr. William J. Barber, II
This research will give us the opportunity to be clear about the deficit in our democratic attainments and inform our resolve to set forth an agenda for the kind of nation we want to be.
— Rev. Dr. James Forbes
INSTITUTE FOR POLICY STUDIES STAFF Editor: Sarah Anderson, Global Economy Project Director and Inequality.org co-editor
Contributors: Marc Bayard, Project Director, Black Worker InitiativePhyllis Bennis, Project Director, New InternationalismJohn Cavanagh, DirectorKaren Dolan, Project Director, Criminalization of Race and PovertyStevon Felton, Next LeaderMaha Hilal, Michael Ratner Middle East FellowLindsay Koshgarian, Program Director, National Priorities ProjectAaron Noffke, Poor Peoples Campaign Research Assistant Sam Pizzigati, Associate Fellow and Inequality.org co-editor Basav Sen, Project Director, Climate PolicyJoanna Williams, Next Leader
Design: Kenneth Worles, Jr.
Acknowledgements: We are grateful to the following for providing helpful comments on this report: Jacqui Patterson, NAACP; Joshua Rovner, The Sentencing Project;
Linda Couch, LeadingAge; William Hartung, Center for International Policy; Michael Zweig, U.S. Labor Against the War; David Wildman, United Methodist Church's General Board of Global Ministries; and Laura Flanders, The Laura Flanders Show.
Cover Images: tineye/Wikimedia Commons
The Institute for Policy Studies is a progressive think tank dedicated to building a more equitable, ecologically sustainable, and peaceful society. In partnership with dynamic social movements, we turn transformative policy ideas into action.
Institute for Policy Studies1301 Connecticut Ave. NW, Suite 600 | Washington, DC 20036202 234-9382 | www.ips-dc.orgTwitter: @IPS_DC Facebook: http://www.facebook.com/Institute for Policy Studies© 2017 Institute for Policy Studies

CONTENTIntroduction .......................................................... 1
Systemic Racism ................................................... 3
Poverty .................................................................. 8
The War Economy and Militarism .................... 14
Ecological Devastation ...................................... 19
Conclusion ......................................................... 25
Cop
yrig
ht. M
ajorie
Mille
r

1
On December 4, 1967, the Rev. Dr. Martin Luther King Jr. announced plans for a Poor People’s Campaign to organize towards transformative actions to end poverty, racism, and militarism in America. At that time, the nation was deeply divided, particularly by the issues of racial justice and the Vietnam War. And yet even after Dr. King’s assassination in April 1968, this multi-racial mobilization of the poor went forward, mobilizing caravans that converged in Washington, D.C. to erect a shanty town on the National Mall that came to be known as “Resurrection City.” The Poor People’s Campaign culminated in a Solidarity Day Rally for Jobs, Peace, and Freedom involving more than 50,000 people on June 19, 1968.
Over the past 50 years, social movements have continued the struggle against poverty and the
interrelated issues of the war economy and militarism, racism, and ecological devastation. They have won some gains, but even the handful of select indicators in this report make clear that we are still living in a system that serves a tiny minority at the expense of the rest of us. And while the poor, women, and people of color are hardest hit, these problems afflict our entire nation. Most poor and low-income Americans are white, and our middle class is rapidly shrinking as more and more of our country’s abundant wealth flows to the top 1%. It is in all of our interest to recapture what Dr. King called the “revolutionary spirit” needed to solve these systemic problems.
"WE MUST SEE NOW THAT THE EVILS OF RACISM, ECONOMIC EXPLOITATION AND MILITARISM ARE ALL TIED TOGETHER…YOU CAN’T REALLY GET RID OF ONE WITHOUT GETTING RID OF THE OTHERS…THE
WHOLE STRUCTURE OF AMERICAN LIFE MUST BE CHANGED."—The Rev. Dr. Martin Luther King, Jr., May 1967
INTRODUCTION
Oliver F. Atkins, copyright Oliver Atkins Collection, Special Collections & Archives, George Mason University Libraries

2
"AS OUR SOCIAL FABRIC IS STRETCHED THIN BY WIDENING INCOME INEQUALITY, POLITICIANS CRIMINALIZE THE POOR, FAN THE FLAMES
OF RACISM AND XENOPHOBIA TO DIVIDE THE POOR, AND STEAL FROM THE POOR TO GIVE TAX BREAKS TO THE RICH AND BUDGET INCREASES
TO A BLOATED MILITARY."— Rev. Dr. William J. Barber, II
"IMMIGRANTS, MUSLIMS, HOMELESS PEOPLE, AND YOUTH ARE UNDER ATTACK. THE POOR ARE FACING SEVERE CUTS TO BASIC
SOCIAL SERVICES. MILLIONS OF PEOPLE ARE LIVING WITHOUT CLEAN WATER AND SANITATION SERVICES. VOTING RIGHTS ARE BEING
SUPPRESSED AND WARS ARE BEING WAGED ACROSS THE WORLD AND INTENSIFYING. THESE AND MANY OTHER CRISES MEAN IT IS URGENT
WE BUILD A POOR PEOPLE’S CAMPAIGN TODAY."— Rev. Dr. Liz Theoharis
Oliver F. Atkins, copyright Oliver Atkins Collection, Special Collections & Archives, George Mason University Libraries

3
By the launch of the Poor People’s Campaign, the civil rights movement had achieved several milestones for racial equality. The Civil Rights Act of 1964 and the Voting Rights Act of 1965 signaled major progress in ending overt racism in public policy. Racist public discourse had also become less socially acceptable. And yet a new, more subtle form of racism emerged.
Political tactics aimed at stirring up white resentment and fear of people of color persisted in the form of code words like “welfare queen” and racial stereotypes like the notorious “Willie Horton” ads of the 1988 presidential campaign. These tactics helped build support for underground hate groups and also for public policies that embedded racial bias in U.S. institutions, cementing
racial gaps in a wide range of areas.
In 2016, the “new racism” began to look increasingly like the “old racism.” Racist campaign rhetoric emboldened white supremacists who took to the streets brandishing Nazi symbols and glorifying the pro-slavery Confederacy. The Southern Poverty Law Center reported that the number of U.S.-based hate groups had increased from 892 in 2015 to 917. By August 2017, a Pew Research Center poll found that 58 percent of all U.S. adults saw racism as a “big problem,” up from 41 percent in September 1995. Among blacks, the figure was 81 percent, significantly higher than the 44 percent who held this view in 2009.
SYSTEMIC RACISM
DESPITE THE CIVIL RIGHTS ACTS OF 1957, 1960, AND 1964 AND THE VOTING RIGHTS ACT OF 1965, JUSTICE IS NOT A
REALITY FOR THE BLACK, MEXICAN-AMERICAN, INDIAN, AND PUERTO RICAN POOR. DISCRIMINATION IN EMPLOYMENT, HOUSING, AND EDUCATION NOT ONLY PERSISTS, BUT IN
MANY AREAS IS RAPIDLY INCREASING.— Committee of 100, Statements of Demands of the Rights of the Poor
IN THE HUMAN RIGHTS REVOLUTION, IF SOMETHING ISN’T DONE, AND IN A HURRY, TO BRING THE COLORED PEOPLES OF THE WORLD OUT OF THEIR LONG YEARS OF POVERTY, THEIR LONG YEARS OF HURT AND NEGLECT, THE WHOLE
WORLD IS DOOMED.”— The Rev. Dr. Martin Luther King, Jr., April 1968
Copyright. Ronald Comedy
Oliver F. Atkins, copyright Oliver Atkins Collection, Special Collections & Archives, George Mason University Libraries

4
VOTER SUPPRESSION
Sources: Repairers of the Breach, based on data from the Brennan Center for Justice and the Kaiser Family Foundation.
This section identifies some of the key indicators of the persistent — and even expanding — systemic racism in policies related to voter suppression, criminal justice, education and employment, and immigration.
More than 50 years after the Voting Rights Act, people of color still face a broad range of attacks on their voting rights, including racist gerrymandering and redistricting, felony disenfranchisement, and a variety of laws designed to make it harder to vote.
According to the Brennan Center for Justice, 23 states have adopted various forms of voter suppression laws since 2010, including 10 with more restrictive voter ID laws (including six with strict photo ID requirements), seven with laws making it harder to register, six with reduced early voting days and hours, and three that made it harder to restore voting rights for people with past criminal convictions.
In May 2017, the U.S. Supreme Court confirmed the racially discriminatory intent of voter suppression laws when it refused to revive a North Carolina election law that the Fourth Circuit Court of Appeals Court of Appeals had found to "target African Africans with almost surgical precision." The court found that the following parts of the North Carolina law disproportionately affected African Americans: shortening early voting from 17 days to 10 days, voter ID requirements, elimination of same-day registration and preregistration of some teenagers, and a ban on counting votes cast in the wrong precinct.
These findings were consistent with a University of California San Diego study that looked at the most common voter suppression tactic — voter ID laws — and found that they doubled the turnout gap between whites and Latinos in the general elections, and almost doubled the white-black turnout gap in primary elections. And as the map below reveals, voter suppression often goes hand in hand with economic suppression. Thirteen states that passed voter suppression laws also opted not to accept expanded Medicaid benefits offered under the Affordable Care Act, denying much-needed support to more than a million people of color.
Another extreme form of voter suppression is the imposition of “emergency financial managers” on cities facing financial challenges. In Michigan, for example, governor-appointed managers were in control in 2013 in Detroit, Flint, and four other cities, most of them predominantly African American. Under that state’s law, these unelected emergency managers have sweeping powers, including the authority to dismiss elected officials, scrap labor contracts, sell off public assets, and impose new taxes.

5
In 1968, police officers killed three African American students in what became known as the “Orangeburg Massacre.” The officers were all acquitted. Fifty years later, in spite of an explosion of protests against such injustice in the wake of the 2014 police killing of 18-year-old Michael Brown in Ferguson, Missouri, young black males remain nine times more likely to be killed by police officers than other Americans.
These killings, for which the shooters have rarely been convicted, are just one indicator of the racial bias in the criminal justice system that permeates policies ranging from sentencing and police presence to arrest rates and probation. According to the NAACP, for example, while blacks and whites use drugs at similar rates, the imprisonment rate of African Americans for drug charges is almost six times that of whites. And even though African Americans represent just 12.5% of illicit drug users, they make up nearly 30% of those arrested for drug offenses.
“Tough on crime” politics has led to skyrocketing federal discretionary spending on prisons — $7.5 billion in 2017, a tenfold increase over 1976 — and increased policing of poor communities to fill them. The number of inmates in U.S. state and federal prisons of all races, grew from 187,914 in 1968 to 1,476,847 in 2015. But the incarceration rates for people of color have grown even faster than for whites. In 1978 (the first year for which race data are available) nonwhites made up less than half the prison population. By 2015, they comprised 66%.
CRIMINAL JUSTICE SYSTEM
Source: U.S. Department of Justice. The 2015 data were collected for white (non-Hispanic), black (non-Hispanic), and Hispanic. The 1978 data were collected for: white, black, and “other,” which included American Indians, Alaskan Natives, Asians, and Pacific Islanders). Hispanic ethnicity of
inmates was not determined in 1978, a year in which people of Spanish descent made up 5% of the total population.
Women held in local jails are the fastest-growing segment of incarcerated people in the United States, and the majority of them are black or Latino, according to a 2017 study by the MacArthur Foundation and the Vera Institute of Justice.
$7,468,000,000FEDERAL DISCRETIONARY SPENDING ON PRISONS IN 2017, A TENFOLD INCREASE IN REAL TERMS OVER 1976.Source: National Priorities Project
6
High incarceration rates, along with racial discrimination in hiring, contribute to African Americans’ disproportionately high unemployment rates. Since 1968, the African American unemployment rate has persistently run about twice as high as the rate for white Americans. And when African Americans lose their jobs, they are more likely to remain out of work for extended periods. According to the U.S. Bureau of Labor Statistics, African Americans made up 26 percent of the long-term unemployed in 2016 (out of work for 27 weeks or more), while making up only about 12 percent of the American labor force.
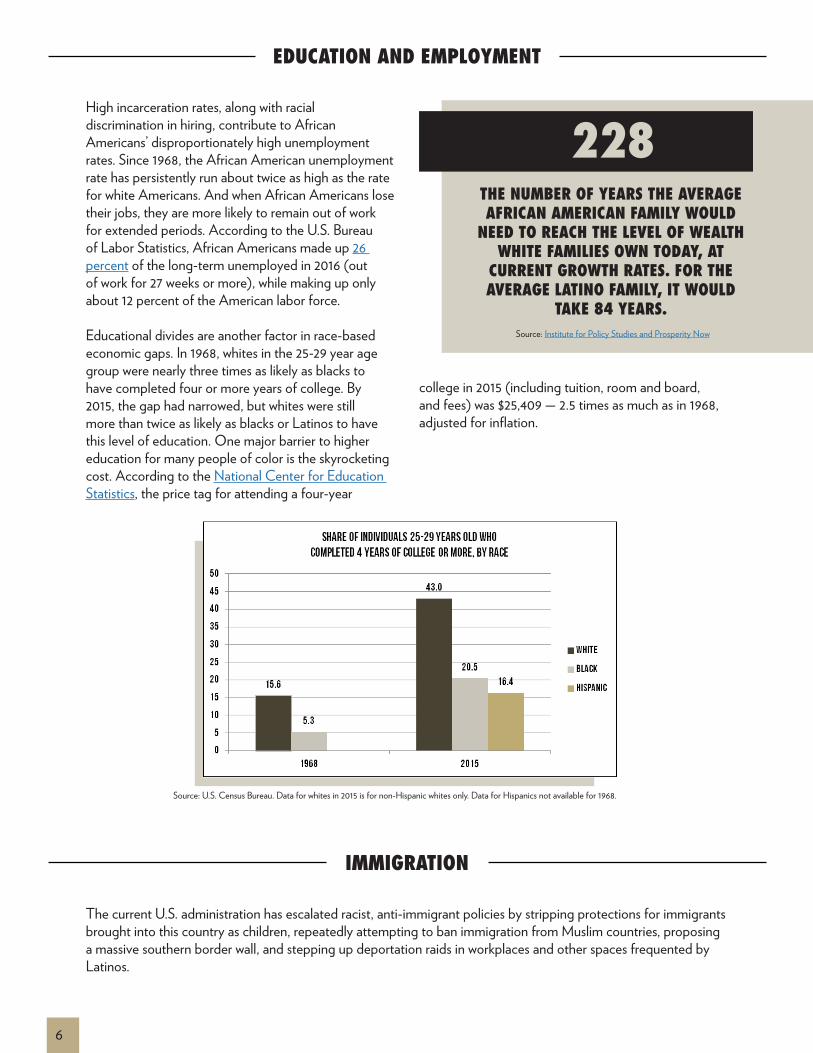
Educational divides are another factor in race-based economic gaps. In 1968, whites in the 25-29 year age group were nearly three times as likely as blacks to have completed four or more years of college. By 2015, the gap had narrowed, but whites were still more than twice as likely as blacks or Latinos to have this level of education. One major barrier to higher education for many people of color is the skyrocketing cost. According to the National Center for Education Statistics, the price tag for attending a four-year
college in 2015 (including tuition, room and board, and fees) was $25,409 — 2.5 times as much as in 1968, adjusted for inflation.
EDUCATION AND EMPLOYMENT
The current U.S. administration has escalated racist, anti-immigrant policies by stripping protections for immigrants brought into this country as children, repeatedly attempting to ban immigration from Muslim countries, proposing a massive southern border wall, and stepping up deportation raids in workplaces and other spaces frequented by Latinos.
IMMIGRATION
Source: U.S. Census Bureau. Data for whites in 2015 is for non-Hispanic whites only. Data for Hispanics not available for 1968.
228THE NUMBER OF YEARS THE AVERAGE AFRICAN AMERICAN FAMILY WOULD
NEED TO REACH THE LEVEL OF WEALTH WHITE FAMILIES OWN TODAY, AT
CURRENT GROWTH RATES. FOR THE AVERAGE LATINO FAMILY, IT WOULD
TAKE 84 YEARS.Source: Institute for Policy Studies and Prosperity Now
7
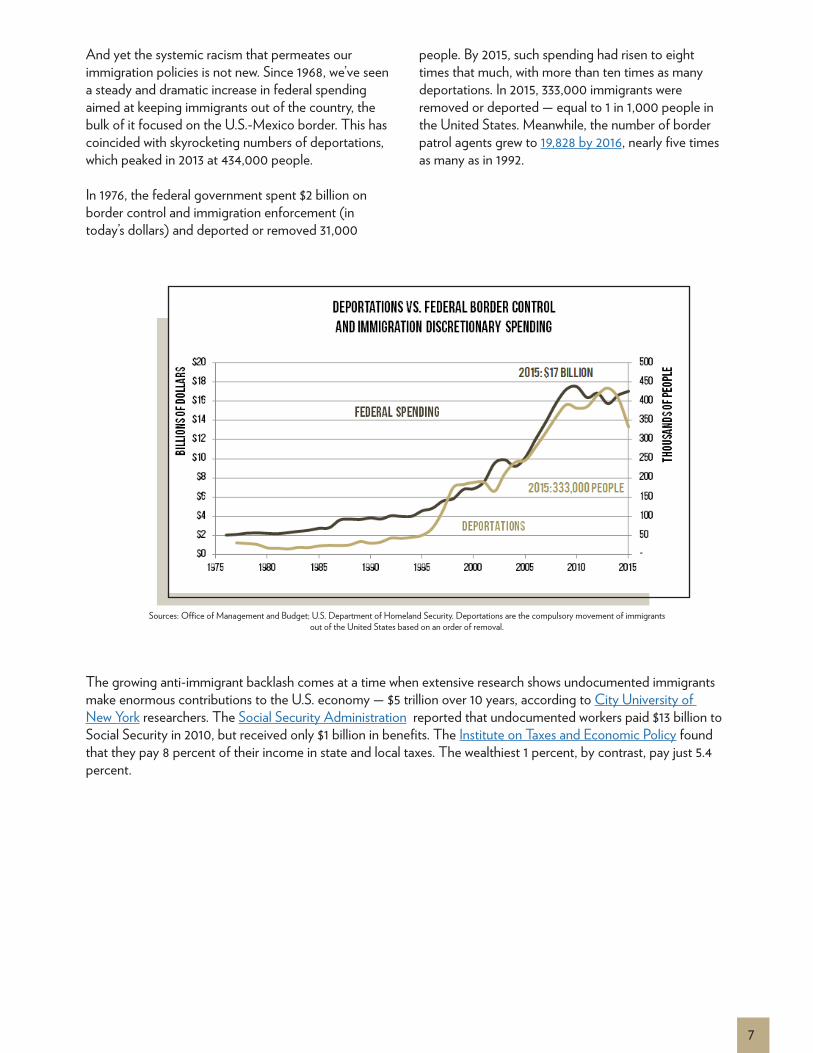
And yet the systemic racism that permeates our immigration policies is not new. Since 1968, we’ve seen a steady and dramatic increase in federal spending aimed at keeping immigrants out of the country, the bulk of it focused on the U.S.-Mexico border. This has coincided with skyrocketing numbers of deportations, which peaked in 2013 at 434,000 people.
In 1976, the federal government spent $2 billion on border control and immigration enforcement (in today’s dollars) and deported or removed 31,000
people. By 2015, such spending had risen to eight times that much, with more than ten times as many deportations. In 2015, 333,000 immigrants were removed or deported — equal to 1 in 1,000 people in the United States. Meanwhile, the number of border patrol agents grew to 19,828 by 2016, nearly five times as many as in 1992.
Sources: Office of Management and Budget; U.S. Department of Homeland Security. Deportations are the compulsory movement of immigrants out of the United States based on an order of removal.
The growing anti-immigrant backlash comes at a time when extensive research shows undocumented immigrants make enormous contributions to the U.S. economy — $5 trillion over 10 years, according to City University of New York researchers. The Social Security Administration reported that undocumented workers paid $13 billion to Social Security in 2010, but received only $1 billion in benefits. The Institute on Taxes and Economic Policy found that they pay 8 percent of their income in state and local taxes. The wealthiest 1 percent, by contrast, pay just 5.4 percent.
8
Since the 1968 Poor People’s Campaign, the number of Americans in poverty has increased by 60% to 40.6 million. In 2016, white people made up the largest share of the poor (17.3 million), while the next two largest groups were African Americans (9.2 million) and Latinos (11.1 million).
More than 95 million Americans (nearly 30 percent of the total population) are either in poverty or considered “low-income” (below twice the poverty line), using the Official Poverty Measure. That number rises to 43.5% (over 140 million people) when using the Supplemental Poverty Measure (SPM), which takes
into account federal assistance resources as well as critical out-of-pocket expenses.
And so while poverty has always disproportionately affected people of color, children, and women, what Dr. King and other leaders in the Poor People’s Campaign recognized in 1968 remains true today: poverty touches all segments of our population. The current situation is even more disturbing if we look beyond income to indicators of broader well-being, including financial security and debt, access to quality education, affordable housing, public transportation, mental and physical health, and vibrant and safe communities.
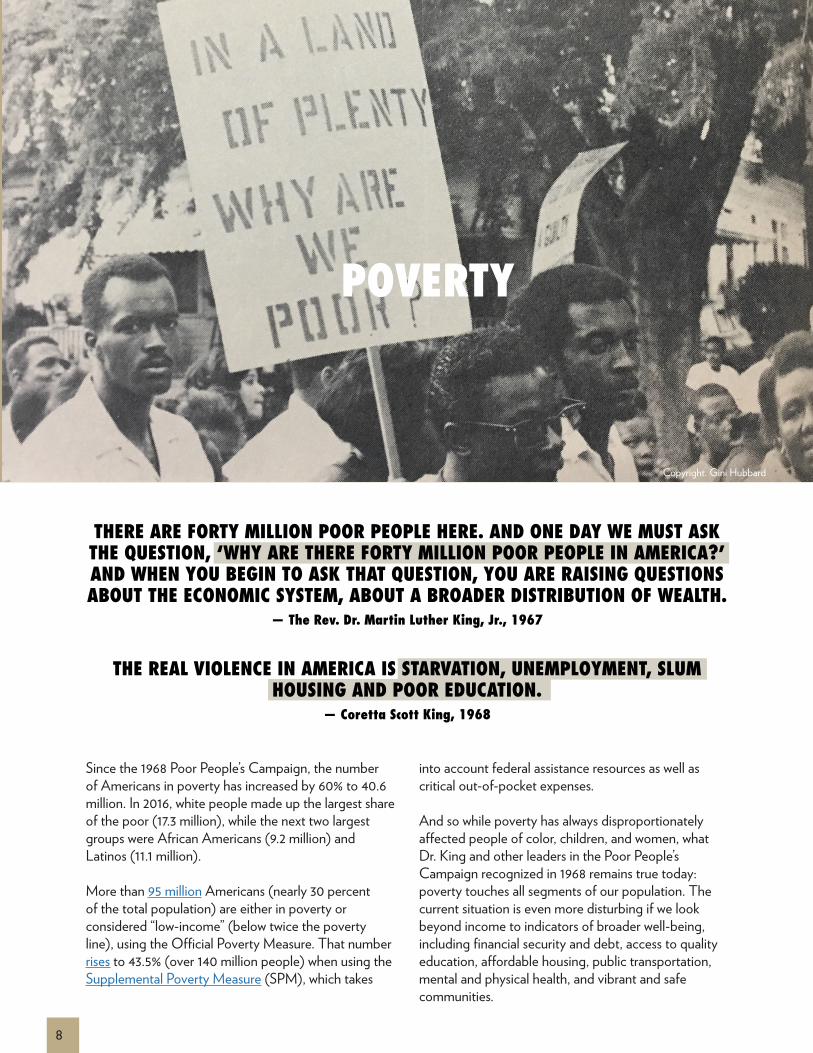
THERE ARE FORTY MILLION POOR PEOPLE HERE. AND ONE DAY WE MUST ASK THE QUESTION, ‘WHY ARE THERE FORTY MILLION POOR PEOPLE IN AMERICA?’ AND WHEN YOU BEGIN TO ASK THAT QUESTION, YOU ARE RAISING QUESTIONS ABOUT THE ECONOMIC SYSTEM, ABOUT A BROADER DISTRIBUTION OF WEALTH.
— The Rev. Dr. Martin Luther King, Jr., 1967
THE REAL VIOLENCE IN AMERICA IS STARVATION, UNEMPLOYMENT, SLUM HOUSING AND POOR EDUCATION.
— Coretta Scott King, 1968
POVERTY
Copyright. Gini Hubbard

9
While the overall poverty rate for all Americans is about at the same level today, at 12.7%, as it was in 1968, “deep poverty,” defined as having income below half the federal poverty level, has risen from 3.7% in 1975 (earliest available) to 5.8% in 2016. And because our population has added more than 122 million people since 1968, this means that 15 million more people are poor today than they were 50 years ago.
These official poverty rates do not account for the impact of federal assistance programs. President Lyndon Johnson’s “War on Poverty” programs helped millions of Americans stay out of poverty, but the 1996 “welfare reform” slashed that safety net and key anti-poverty programs continue to come under assault in Washington.
The 1996 law replaced a flawed but significantly beneficial cash assistance program, Assistance to Families with Dependent Children (AFDC), with a block grant program called Temporary Assistance to Needy Families (TANF) that drastically reduced resources available to families in poverty, imposed unrealistic work requirements, and increased child poverty. Today, TANF provides benefits to only 23% of families with children living in poverty, compared to the 68% of such families that benefited from AFDC in 1996. In all but three states, TANF benefits have declined since 1996 in real value, with monthly benefits in all 50 states equal to or below two-thirds of the federal poverty line.
Two-thirds of families below the poverty line who are renters receive no housing assistance and the stock of affordable housing has declined by 60% since 2010. The largest housing subsidy, the mortgage interest deduction, primarily benefits middle-class homeowners.
Two effective federal programs that have survived are the Supplemental Nutrition Assistance Program (SNAP), previously known as “food stamps,” and the Earned Income Tax Credit (EITC). SNAP, which is a means-tested program, benefitted about 20 million children a month in 2016, according to the Center on Budget and Policy Priorities. The EITC effectively lifted about 6.5 million people out of poverty in 2015, but this credit does nothing to help those without jobs.
POVERTY, INCOME, AND THE SAFETY NET
65%SHARE OF EXTREMELY LOW-INCOME FAMILIES (BELOW 30% OF MEDIAN
INCOME IN THEIR AREA) THAT SPENT MORE THAN HALF OF HOUSEHOLD
INCOME ON RENT IN 2015. IN 1978, THIS FIGURE WAS 44%.
Source: LeadingAge, based on U.S. Department of Housing and Urban Development data
Copyright. Gini Hubbard

10
The shredding of the social safety net has been particularly devastating for American children, 14.8 million of which live below the poverty line. A total of 30.6 million children (or 43%) live at or below 200% of the poverty line, considered the minimum for meeting basic family needs.
The official child poverty rate was 18% in 2016, up from 15.6% in 1968. Using the Supplemental
Poverty Measure to account for federal assistance, the 2016 child poverty rate falls to 15.2%. Nevertheless, child poverty remains a stubborn and critical problem affecting all races and ethnicities. In 2016, over 4 million white children lived in poverty (10.8%). The official child poverty rate for black children in 2016 was 30.8% (3.4 million children) and 26.6% for Latinos (4.9 million children).
CHILDREN IN POVERTY
Source: U.S. Census Bureau
IT IS A SPIRITUALLY IMPOVERISHED NATION THAT PERMITS INFANTS AND CHILDREN TO BE THE POOREST AMERICANS.
—Marian Wright Edelman, 1992
copyright Roland L Freeman, 1998

11
High child poverty figures largely reflect their family members’ challenges in finding good jobs and obtaining high quality education, health care, and affordable housing, as well as the availability social safety net benefits. These challenges can be especially daunting for single mothers, who earn considerably lower average wages than their male counterparts. In 2016, female-headed families were 5.4 times more likely to be living in poverty than families with married heads-of-households and nearly 60% of children living in poverty lived in female-headed households.
The official poverty rate in 2016 was 22.8% for Native American women, 21.4% for black women, and 18.0% for Latinas.
Compared to those for men, female poverty rates have consistently hovered around three to four percentage points higher since 1968. In 2016, 13.4% of adult women (representing 13.4 million women) were living below the poverty rate, compared to just 9.7% of adult men (9.4 million men).
WOMEN IN POVERTY
Source: U.S. Census Bureau
The harmful effects of poverty and inequality on health show up in many ways. And while some of these indicators have improved somewhat since 1968, the United States falls far below most other developed countries and in some areas conditions have worsened.
In terms of homelessness and related health issues, for example, the situation is worse today in disturbing ways. In the 1960s, most homeless Americans were elderly men and the problem had declined so dramatically since the Great Depression that some predicted it would soon be eliminated altogether. Then in the 1980s, cuts to social programs turned more people out into the street, including rising numbers of women, people of color, and children. While the ranks of the homeless have declined since the Great Recession, they numbered around 565,000 in 2015.
Other poverty-related health risks include higher incidences of disease, injury, food insecurities, suicides, lack of healthcare, mental health crises, and premature adult deaths and infant mortality rates. According to a new Kids Count study by the Annie E Casey Foundation, children and families living in areas of high poverty concentration (defined as census tracts with poverty rates of 30% or higher), experience worse health outcomes, poor performing schools, higher crime rates, and lack of access to good jobs.
As Dr. Tom Boyce, chief of the University of California San Francisco’s Division of Developmental Medicine, puts it, “Socioeconomic status is the most powerful predictor of disease, disorder, injury, and mortality we have.”
HEALTH AND WELL-BEING
copyright Roland L Freeman, 1998

12
Among adults who live at or near the poverty line, life expectancy is seven to eight years less than adults with incomes four or more times the poverty rate. On average, men in the highest income bracket live 15 years longer than men in the lowest income bracket. Women have a 10-year life expectancy gap between the top and lowest income brackets.
In terms of infant mortality, the U.S. rate has declined since 1968, but it continues to be one of the highest in the developed world and stark racial disparities persist. In 2015, 14 countries had infant mortality rates that were half the U.S. rate.
While the Affordable Care Act (ACA) led to historic gains in health insurance coverage, 28 million Americans remain uninsured, the majority of which are low-income workers. Individuals without health care are more likely to suffer poorer health outcomes, greater limitations in their quality of life, and higher rates of premature death.
Adverse health outcomes affecting people in poverty include food insecurity (which affects 15.6 million of U.S. households) and physically dangerous and/or demanding work (primarily relegated to low-income employment opportunities).
Economic hardship and related despair are also factors in the rate of premature deaths. Deaths caused by drugs, alcohol, and suicide have increased since 1999, especially for white Americans with less than a bachelor’s degree. Stress-related health problems also reflect rising financial insecurity. Household debt as a percentage of GDP has increased from 43% in 1968 to 78% in 2015, with student loans, credit card debt, and auto loans significantly contributing to this increase. Currently, one in five households live with zero or negative net worth, while over 60 percent of Americans don’t have enough savings to cover a $500 emergency.
AS THE RICHEST NATION ON EARTH, WE CAN CARE FOR ALL OF LIFE IF WE CHOOSE.
— Sister Simone Campbell, NETWORK Lobby for Catholic Social Justice and
“Nuns on the Bus” campaign, 2017
Copyright. Ronald Comedy

13
One of the most dramatic trends since 1968 has been the growing divide between rich and poor. U.S. GDP grew by more than eighteen-fold between 1968 and 2016, but the rising tide has not lifted all boats. The top 1 percent's share of national income has nearly doubled while the official poverty rate for all U.S. families has merely inched up and down. The extreme concentration of income and wealth at the top has not only siphoned resources away from those at the bottom end of the income ladder. It has also increased the political power of the ultra-rich, which they’ve used to shape trade, tax, labor, health care, campaign finance, and other policies in their interest.
A key driver of our growing economic divide is the steep drop in unionization. With the hemorrhaging of U.S. manufacturing jobs and the expansion of anti-labor policies, the share of U.S. workers in unions has fallen from 24.9% in 1968 to 10.7% in 2016. This has undermined workers’ ability to press for higher wages, even as the national economic pie has been growing.
The decline of unions has also coincided with structural changes in the labor force, as businesses cut labor costs by reducing full-time workers. A National Bureau of Economic Research paper found that between 2005 and 2015, all U.S. job growth was in temporary, part-time, freelance, and other “contingent” work. A recent study from the International Monetary Fund confirmed that the precarious employment trend has played a significant role in suppressing wage growth.
The federal minimum wage remains a poverty wage and the federal minimum for tipped workers, at just $2.13 per hour, creates particularly high levels of economic insecurity for restaurant servers, one of the fastest-growing U.S. occupations, particularly for women and people of color. And according to Oxfam and the Economic Policy Institute, around 58.3 million U.S. workers are earning below the living wage of $15 per hour.
It’s hardly a surprise that Brookings found that working-age adults account for most of the growth in the number of Americans living in poverty over the past 30 years. The number of 18-64-year-olds living in poverty has increased from 9.8 million in 1968 to 16 million in 1986 to 22.8 million in 2016.
GROWING DIVIDE BETWEEN RICH AND POOR
Sources: Institute for Policy Studies analysis based on Thomas Piketty and U.S. Census.
14
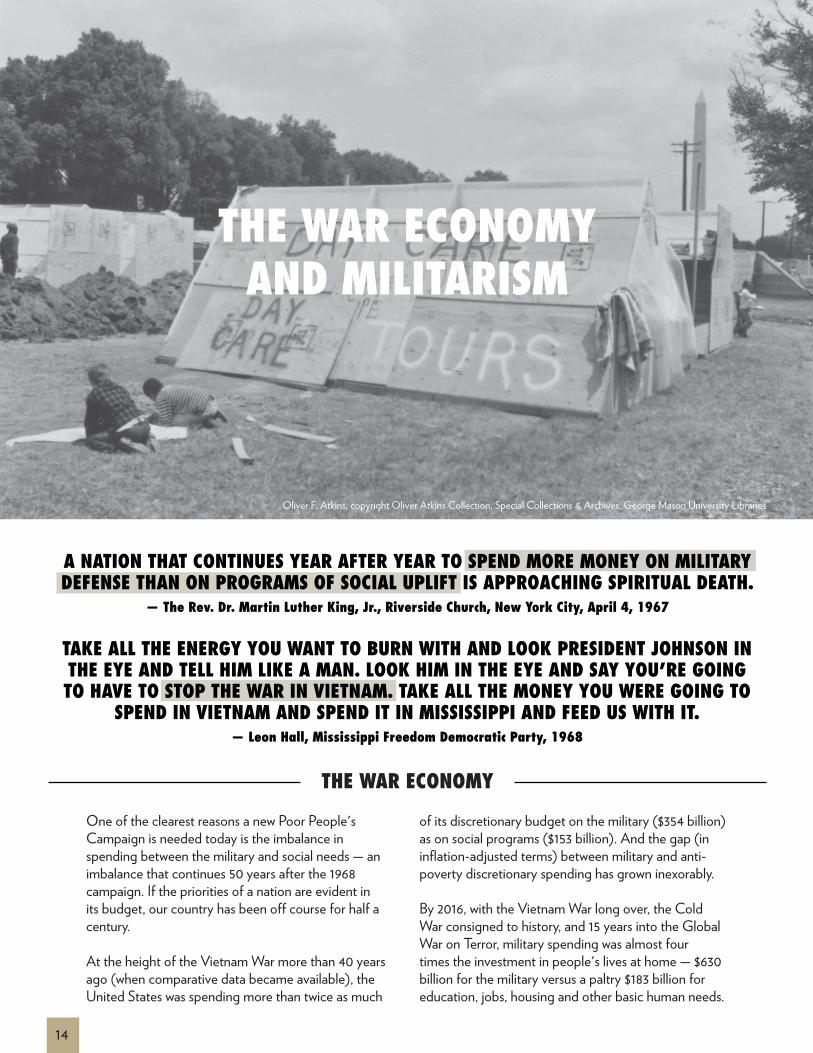
A NATION THAT CONTINUES YEAR AFTER YEAR TO SPEND MORE MONEY ON MILITARY DEFENSE THAN ON PROGRAMS OF SOCIAL UPLIFT IS APPROACHING SPIRITUAL DEATH.
— The Rev. Dr. Martin Luther King, Jr., Riverside Church, New York City, April 4, 1967
THE WAR ECONOMY AND MILITARISM
One of the clearest reasons a new Poor People's Campaign is needed today is the imbalance in spending between the military and social needs — an imbalance that continues 50 years after the 1968 campaign. If the priorities of a nation are evident in its budget, our country has been off course for half a century.
At the height of the Vietnam War more than 40 years ago (when comparative data became available), the United States was spending more than twice as much
of its discretionary budget on the military ($354 billion) as on social programs ($153 billion). And the gap (in inflation-adjusted terms) between military and anti-poverty discretionary spending has grown inexorably.
By 2016, with the Vietnam War long over, the Cold War consigned to history, and 15 years into the Global War on Terror, military spending was almost four times the investment in people's lives at home — $630 billion for the military versus a paltry $183 billion for education, jobs, housing and other basic human needs.
THE WAR ECONOMY
TAKE ALL THE ENERGY YOU WANT TO BURN WITH AND LOOK PRESIDENT JOHNSON IN THE EYE AND TELL HIM LIKE A MAN. LOOK HIM IN THE EYE AND SAY YOU’RE GOING TO HAVE TO STOP THE WAR IN VIETNAM. TAKE ALL THE MONEY YOU WERE GOING TO
SPEND IN VIETNAM AND SPEND IT IN MISSISSIPPI AND FEED US WITH IT.— Leon Hall, Mississippi Freedom Democratic Party, 1968
Oliver F. Atkins, copyright Oliver Atkins Collection, Special Collections & Archives, George Mason University Libraries

15
Source: National Priorities Project, Office of Management and Budget. Military spending includes spending on the Department of Defense, wars, nuclear weapons, and other military activities. Anti-poverty spending was broadly defined to include: federal education spending (K-12 ahd
higher education); Medicare (administration and some program parts); community and regional development; housing assistance; early childhood education; community social services; income security (supplemental income, heating assistance, child care block grants, etc.); training and
employment services; and unemployment assistance.
Overall, in 1976, the United States spent $2.31 (adjusted for inflation) on the military for every one dollar it spent on anti-poverty programs (not including non-discretionary programs such as Social Security and Medicare). In 2016, this figure was $3.65 going to the military for every dollar spent fighting poverty.
If we look at military spending relative to all other discretionary spending (anti-poverty programs plus veterans care, diplomacy, foreign aid, law enforcement, farm grants, and more), in 1976 the United States spent 51 cents of every discretionary federal dollar on the military. Today, the figure is 53 cents going to the military. And the future is dire: the current president has proposed spending 59 cents of every discretionary dollar on the military.
Along with diverting funds away from social needs and towards war, the U.S. military is one of the world’s biggest polluters. According to a 2014 exposé in Newsweek looking just at military bases inside the United States, the Pentagon is directly responsible for 141 Superfund sites, which are contaminated sites so dangerous to human health or the environment that they qualify for special federal clean-up grants. That’s about 10% of all of Superfund sites, easily more than any other polluter. Another 760 or so additional Superfund sites are abandoned military facilities or sites that otherwise support military needs.
And if U.S. military bases and military actions outside
the United States are considered as well, the impact on the environment is even greater. The legacy of U.S. wars around the world include: unexploded ordnance left behind by U.S. troops, forests destroyed by chemical defoliants such as Agent Orange in Vietnam, toxic liquids that leach into the soil and water of war-ravaged countries for generations after wars have ended, and air pollution from military burn pits to destroy chemicals, plastics, equipment, and documents.
Whether 50 years ago, when Dr. King criticized our excessive military spending in his famous speech at Riverside Church, or today, our massive defense budget has never actually been about “defense.” The wars of the last 50 years — from Vietnam to Central America to Afghanistan and Iraq and so many more — have far less to do with protecting Americans than with consolidating U.S. corporations' control over oil and other resources and pipelines, supplying the Pentagon with military bases and strategic territory to wage more wars, and continuing to provide justification for Washington's multi-billion dollar military industry.
Sending tanks and bombers and armed drones around the world does not make us safer. Real security comes from having a job, access to health care, good education for our kids. In today’s wars, like in 1968, the Pentagon does not drop bombs on ideas like "terrorism" or "communism." It drops bombs on cities, it kills children and families in countries around the world (almost all of them people of color), and puts
Oliver F. Atkins, copyright Oliver Atkins Collection, Special Collections & Archives, George Mason University Libraries

16
our own troops in harm's way. As a U.S. colonel famously said in Vietnam, “we had to destroy the village in order to save it.” Today, as we see in places like Raqqa in Syria and Mosul in Iraq, the U.S. military is destroying entire cities, killing thousands, and dispossessing millions, in the name of liberating them from ISIS or other enemies. Meanwhile, these actions serve to recruit new anti-U.S. fighters while poor people around the world pay a huge price for our wars.
Back at home, some U.S. communities pay a price far higher than the economic cost of the wars. Over the last 50 years, since the first Poor People’s Campaign, disadvantaged communities in our country have suffered a disproportionate share of the nation's wartime fatalities, while richer — and whiter — communities have been more insulated from the costs of war.
The poorest 30% of U.S. communities suffered 36% of the casualties in the Vietnam War and 38% in the Iraq War. The wealthiest 30% of U.S. communities had 26% of casualties in the Vietnam War and only 23% in the Iraq War.
THE FATALITY GAP AND THE POVERTY DRAFT
Source: Douglas L. Kriner and Francis X. Shen, Los Angeles Times
And the ranks of the so-called "all-volunteer military" are still filled by a draft — not a legal draft, as during the Vietnam War, but an economic draft. During the heyday of the Vietnam-era draft, many middle class and wealthy young men were able to defer or avoid military service through access to lawyers, doctors, universities, and other institutions inaccessible to the poor. Today, young men and women are still subject to a draft enforced by poverty, by lack of other jobs, by lack of college opportunities, and by the limited options available in rural areas and small towns.
A 2017 study based on Pentagon information on the hometowns of 6,800 U.S. casualties from the wars in Iraq and Afghanistan through 2016 indicated that 23% of the casualties came from small towns and rural areas that together make up only 17% of the U.S. population.

17
For many people who see the military as a way out of poverty, joining the armed forces may not significantly improve their economic position. Despite the massive increases in military spending on multi-billion dollar weapons systems and sky-high pay for the CEOs of war industries, U.S. troops themselves see little of that money. In 2016 the Government Accounting Office reported that in 2013 about 23,000 active duty military troops were receiving food stamps. The children of service members paid a price as well. The same GAO report showed that in 2015, 24% of children in schools run by the Department of Defense inside the continental United States qualified for free meals, and another 21% qualified for reduced-price meals.
When the troops come home, often even while the war
they fought in continues to rage, they face a host of new challenges. Too often veterans drafted by poverty and treated badly in the military continue to face economic hardship when they return home. According to a 2017 report from the Economic Policy Institute, if the federal minimum wage were increased to $15 per hour by 2024, as some new legislation proposes, one out of every five vets (1.8 million people) would get a raise. And the high number of veterans who are currently underpaid undercuts the myth that only teenagers working at McDonalds after school would benefit from raising the minimum wage. Of the military veterans who would benefit from a higher minimum wage, nearly two-thirds are 40 years old or older. More than 60% have some college, and almost 70% are working full time at below-living wage levels.
WHEN POOR PEOPLE JOIN THE MILITARY & THE VETERANS COME HOME
Only one year before the 1968 Poor People’s Campaign, the longstanding U.S. law restricting the share of women in the military to 2% of the total force was changed — largely because of the demands of the escalating Vietnam War. The women’s movement that began during Vietnam also played a significant part in the increasing number of and broadened roles for women in the U.S. military. As was true later in the debate over whether gay men and/or women should be included in the 1980 resumption of compulsory draft registration, the cause of women’s equality in the U.S. military was complicated by the fact that that same military was engaging in wars that were killing large numbers of women in Vietnam, Laos, and Cambodia.
THE MILITARY GENDER GAP
Source: Department of Defense

18
By the time of the Iraq and Afghanistan wars almost 35 years later, women played a significantly larger role in the military, both in numbers and in range of responsibilities. But as women’s participation increased, so did the number of women victimized by their fellow soldiers. According to recent Veterans Administration data, one in every five women veterans has told their VA healthcare provider that they have experienced military sexual trauma, defined as sexual assault or repeated, threatening sexual harassment.
In 2012, a Department of Veterans Affairs survey indicated that nearly half of female military personnel sent to Iraq or Afghanistan had reported being sexually harassed, and nearly 25% said they had been sexually assaulted.
While consistent historical data are lacking, it’s clear that sexual trauma has long plagued the U.S. military. According to an article in the American Journal of Industrial Medicine, a 2003 survey of women veterans who served in wars from Vietnam to the first Gulf war found that nearly 30 percent had suffered from rape or attempted rape and 79 percent reported being sexually harassed.
THIS IS THE MAIN PENTAGON BUDGET FOR 2017. INSTEAD, THIS COULD PAY FOR:
7.8 MILLION ELEMENTARY SCHOOL TEACHERS FOR 1 YEAR11.4 MILLION INFRASTRUCTURE JOBS CREATED FOR 1 YEAR
71 MILLION KIDS IN HEAD START FOR 1 YEAR178 MILLION LOW-INCOME ADULTS GET HEALTH CARE FOR 1 YEAR
19 MILLION SCHOLARSHIPS FOR UNIVERSITY STUDENTS FOR 4 YEARS OR442 MILLION HOUSEHOLDS WITH SOLAR ELECTRICITY FOR 1 YEAR
$635 BILLION
Oliver F. Atkins, copyright Oliver Atkins Collection, Special Collections & Archives, George Mason University Libraries

19
WE MUST MAKE IT CLEAR THAT WE ARE CONCERNED ABOUT THE SURVIVAL OF THE WORLD.
— The Rev. Dr. Martin Luther King, Jr., December 1967
ECOLOGICAL DEVASTATION
At the time of the 1968 Poor People’s Campaign, there was relatively little awareness of global environmental problems and how they exacerbate the problems of poverty and racism. The environmental movement began to take off in the early 1970s, with the first Earth Day and the establishment of the Environmental Protection Agency in 1970 and then the passage of two landmark laws — the Clean Air Act and the Clean Water Act.
U.S. environmental regulations have been broadly effective. One study of six common pollutants, for
example, shows that their aggregate concentration has decreased 70% since 1970, even as the economy has grown by 250%. However, even as the environment has become cleaner, there continue to be significant race and income disparities in access to clean air and water and exposure to environmental hazards. And as climate change effects, such as extreme heat and more frequent and severe storms, floods, and droughts, have become more widespread, there is growing evidence that those who have contributed the least to the existential threat of climate change are paying the highest costs.
WE HAVE TO THINK ABOUT CHANGING THINGS, CAUSE IF WE DON’T THEY’RE GOING TO GET WORSE. LIKE THE AIR BEING POLLUTED; YOU THINK WE WANT TO BREATHE
THAT? AND THE WATER, TOO — WE LIKE TO GO SWIMMING, AND WE’RE GOING TO GO SWIMMING… YES, SIR. THINGS ARE GOING TO BE DIFFERENT.
— Jimmy, Poor People’s Campaign youth participant from Marks, Mississippi, testifying before the Department of Health, Education and Welfare, July 12, 1968
Oliver F. Atkins, copyright Oliver Atkins Collection, Special Collections & Archives, George Mason University Libraries
The Library of Virginia from USA - End Bike Lane | Wikimedia Commons

20
Polluting facilities such as fossil-fuel burning power plants, municipal waste incinerators, fossil fuel extraction sites (coal mines, natural gas fracking wells, etc.), and landfills, are disproportionately located in communities with high concentrations of people of color and low-income families.
As an illustration, a 2015 EPA analysis found that the population within three miles of highly contaminated “Superfund” sites was 45.7% non-white, significantly higher than their 36.7% share of the U.S. population. Families in which the adults speak limited or no English made up 12.3% of households within three miles of the sites, compared to just 8.6% in the U.S. population as a whole. Note, however, that pollution hurts everyone who is exposed to it. While people of color are disproportionately exposed relative to their share of the overall population, the population within three miles of Superfund sites is still majority white.
The proximity of communities of color and low-income communities to polluting facilities adversely impacts property values in these communities, and consequently, reduces property tax revenue, leading to less funding for public schools.
UNEQUAL EXPOSURE TO POLLUTION BY RACE AND INCOME
CLIMATE CHANGE
Extreme heat waves are expected to increase in frequency and intensity over the next 100 years, resulting in increased deaths due to extreme heat illness. And low-income families and people of color tend to be more likely to have living conditions that increase the health risks of extreme heat, such as living in urban areas without adequate green space.
Likewise, catastrophic climate-related events are increasing in frequency and severity as global temperatures rise, with disproportionate impacts on the most marginalized. For example, when Hurricane Harvey hit Houston, the Exxon refinery in Baytown experienced storm damage leading to leaks of toxic chemicals. Of the two census blocks immediately adjoining this refinery, one is 87% non-white and 76% low income and the other is 59% non-white and 59% low income, according to the EPA. Similarly, the shutdown of the Chevron Phillips refinery in Pasadena, Texas generated toxic chemicals such as benzene in a census block that is 83% non-white and 74% low income. Similar racial and economic disparities have been evident in the impacts of a number of severe storms, such as Katrina, Sandy, Irma, and Maria.
Natural disaster-related property damage tends to hit poor people hardest — not just because they have fewer resources with which to rebuild. Protection against property damage caused by extreme events such as hurricanes and flooding is mostly available in the form of homeowners insurance, and a disproportionate number of low-income people do not own their homes. This is also true for people of color. African Americans make up just 9% of all homeowners and 21% of renters, while Native Americans constitute 0.8% of homeowners and 1.4% of renters. Their respective percentages in the overall population are 12.6% and 0.9%.
Another factor is the high cost of insurance. A study of flood insurance premiums in New York City found that the premiums are burdensome for 25% of homeowners, a number that rises to 33% if proposed changes to the flood risk map are adopted. (Insurance premiums are defined as unaffordable if the combined expenses for mortgage principal and interest, property taxes, and insurance are 40% or more of household income.) Further, the study found that the high cost of premiums leads some homeowners not to purchase the insurance, leaving them unprotected during catastrophic flooding events, and that proposed premium increases have the potential to reduce property values and lead to increased risk of defaults and foreclosures.

21
Exposure to environmental hazards causes adverse health impacts, especially for vulnerable populations such as children and the elderly. In addition, unequal exposure to pollution leads to starkly unequal health outcomes for poor people and people of color.
To put things in global perspective, worldwide, pollution caused an estimated 9 million premature deaths (16% of all deaths) in 2015, “three times more deaths than from AIDS, tuberculosis, and malaria combined and 15 times more than from all wars and other forms of violence.” While poor countries are the worst affected, pollution-related illnesses are most prevalent among the poorest and most marginalized people in all countries.
HEALTH IMPACTS OF ECOLOGICAL DEVASTATION
The water crisis in Flint, Michigan, drew attention to the continued threat of lead pollution, not just in that city but across the country. Children can ingest lead from various sources, including drinking water as well as lead paint and contaminated soil. Lead exposure is unsafe for children at any level and even low levels can harm brain development. At high levels, health effects can include coma and even death.
According to the CDC, at least four million families with children are being exposed to high levels of lead and approximately half a million U.S. children under six have blood lead levels above the level at which CDC recommends public health actions. Several studies indicate that the risks fall heaviest on low-income, African-American, and Latino children, in part because they are more likely to live in aging, poorly maintained housing. And yet the country’s water crisis has dangerous implications for nearly all Americans. An in-depth investigative report by USA Today found that millions of people, many in poor rural communities, get their water from utilities that routinely skip required safety tests.
Apart from lead, another growing threat to the safety of water supplies in the United States is the hydraulic fracturing (“fracking”) boom and the associated pipeline infrastructure. Fracking is a process by which water, sand, and chemicals at high pressure are injected into shale rock formations to extract natural gas and oil.
As an illustration of how fracking has driven U.S. domestic oil and gas production, Energy Information Administration (EIA) data show that total annual U.S. natural gas production grew only 3.7% between 1970 and 2007, but then grew by 32% from 2007 to 2016. As a consequence of the fracking boom, the United States is now the world’s largest producer of both oil and natural gas.
The oil and gas production boom has come at an immense cost to the environment and to exposed populations. Fracking uses large quantities of water, a major concern in regions where fresh water is scarce and likely to become an even more serious concern in the future because of the likelihood of water scarcity resulting from climate change.
THE WATER CRISIS
4,000,000THE NUMBER OF AMERICAN FAMILIES WITH CHILDREN
THAT ARE BEING EXPOSED TO HIGH LEVELS OF LEAD FROM DRINKING WATER AND OTHER SOURCES.
Source: Centers for Disease Control

22
Studies have shown that fracking contaminates groundwater as well as surface water. Proximity to fracking wells is associated with a range of adverse health effects, including congenital heart defects, high-risk pregnancies, premature births, asthma, cancer, and neurological illnesses. Fracking has also been shown to release large quantities of methane, which is a more potent greenhouse gas than carbon dioxide.
The pipeline infrastructure to transport the fracked oil and gas also poses serious threats to the climate, water quality, and public health, through leakage as well as catastrophic spills, including one that occurred recently on the controversial Keystone XL pipeline. Between 2010 and 2015, more than 3,300 incidents of crude oil and liquefied natural gas leaks or ruptures
The disparate rates of asthma by race and income are another disturbing example of unequal health impacts because of unequal exposure to environmental hazards. Asthma has a well-established link to atmospheric ozone, a byproduct of pollutants such as nitrogen oxides from fossil fuel combustion. Among African American children, the asthma rate is 13.4%, compared to 7.4% for white children, according to the CDC. Asthma rates are also significantly higher among poor families compared to higher-income groups (see chart below) and among women, with rates of 9.7%, compared to 5.4% for men.
POLLUTION AND ASTHMA RATES
Source: Centers for Disease Control and Prevention
have occurred on U.S. pipelines, causing the death of 80 people, injuring 389 more, and costing $2.8 billion in damages. They also released toxic, polluting chemicals in local soil, waterways, and air.
Another reason pipeline infrastructure is controversial is that pipeline routes often pass close to low-income communities and communities of color, including Native American nations. This has led to historic protest movements opposing the controversial Dakota Access and Keystone XL pipelines, which have evolved into broad movements demanding indigenous sovereignty.
The higher incidence of asthma among people of color and low-income families leads to higher rates of asthma-related hospitalization (3.4 times higher for African-Americans than for whites) and death (2.9 times higher for African-Americans than for whites). Higher incidence of asthma among children leads to more frequent absences from school, and consequently, poorer educational outcomes for children of color as compared to their white counterparts. Similarly, lower income people lose proportionally more workdays because of asthma-related hospitalization than higher income people, leading to greater economic insecurity for a population working in low-wage jobs, and often lacking access to paid sick days.
23
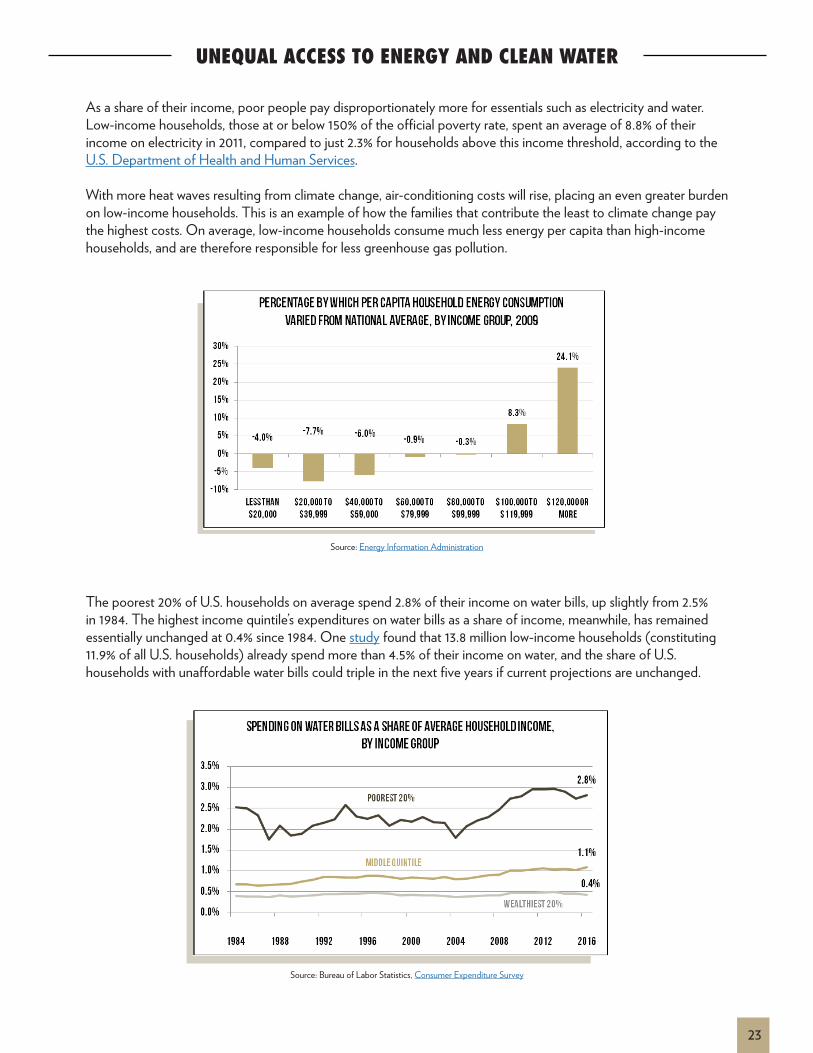
As a share of their income, poor people pay disproportionately more for essentials such as electricity and water. Low-income households, those at or below 150% of the official poverty rate, spent an average of 8.8% of their income on electricity in 2011, compared to just 2.3% for households above this income threshold, according to the U.S. Department of Health and Human Services.
With more heat waves resulting from climate change, air-conditioning costs will rise, placing an even greater burden on low-income households. This is an example of how the families that contribute the least to climate change pay the highest costs. On average, low-income households consume much less energy per capita than high-income households, and are therefore responsible for less greenhouse gas pollution.
UNEQUAL ACCESS TO ENERGY AND CLEAN WATER
Source: Energy Information Administration
The poorest 20% of U.S. households on average spend 2.8% of their income on water bills, up slightly from 2.5% in 1984. The highest income quintile’s expenditures on water bills as a share of income, meanwhile, has remained essentially unchanged at 0.4% since 1984. One study found that 13.8 million low-income households (constituting 11.9% of all U.S. households) already spend more than 4.5% of their income on water, and the share of U.S. households with unaffordable water bills could triple in the next five years if current projections are unchanged.
Source: Bureau of Labor Statistics, Consumer Expenditure Survey

24
The higher burden of energy and water costs on low-income households compels poor people to have to choose between paying for food and medical care or paying utility bills. This, in turn, leads to higher incidence of utility disconnections because of inability to pay. A NAACP study documents racial and economic disparities in utility shutoffs, and the severe, sometimes life-threatening consequences of these shutoffs for vulnerable populations such as elderly, disabled, and chronically ill people.
Oliver F. Atkins, copyright Oliver Atkins Collection, Special Collections & Archives, George Mason University Libraries

25
CONCLUSION
As the data in this report make clear, the need for transformative action on the interrelated issues of racism, poverty, militarism, and ecological destruction is as urgent today as it was in 1968. All Americans — regardless of their race, gender, or class — share a common interest in tackling these systemic problems in order to prevent our democracy, our society, and our planet from destruction.
To combat any one of these four problems requires changing the underlying structures that have produced all of them. We need to overcome the silos and other divisions that have splintered social movements and hindered their progress. We also need to build the power of the people most affected by these problems
to counter those at the top who have rigged the rules in their favor.
In the coming months, the Institute for Policy Studies will work with the Poor People’s Campaign: A National Call for Moral Revival to conduct a much more in-depth “audit” of these issues since 1968, drawing from expert testimony and interviews with leaders who have been in the middle of the key struggles for progress of the past 50 years. This analysis will feed into the process the 2018 Poor People’s Campaign will be undertaking to advance structural solutions to the multiple crises that people and communities are experiencing in our nation and the world.
Copyright. Steve Raitt
Oliver F. Atkins, copyright Oliver Atkins Collection, Special Collections & Archives, George Mason University Libraries
