the small angle rear tracking detector of zeus - desy library · the small angle rear tracking...
TRANSCRIPT

ELSEMER Nuclear Instruments and Methods in Physics Research A 401 (1997) 63-80
NUCLEAR INSTRUMENTS
8 METHODS IN PHYSIGS RESEARCH
Section A
The small angle rear tracking detector of ZEUS
A. Bamberger”5 ’ , H. Boterenbroodb*2, J. BulmahnC*‘, R. Carlind*4, H. Cunitzeq3, J. Dawsonf-5, M. de Kamps b-2, W. Haing, D. Hanna h*6 J. Hauschildt~, R. Klanneri,‘, U. Kiitzg, A. Kruseb*“,
J.N, Limht6, M. Morandin d.4, J.S.T. -N&* , J.R. Okrasinski’*‘? J. Parsonse,3, C. Pitaccod’4, J. Repond f+5, S. Ritze%3, M. Rohde”, J. Schlereth’,‘, W. Schott’>‘, R. Talagaf-5, H. Tieckebs2,
W. Verkerke , b~2 J.J. Whitmore c.3
Abstract
The design, cons~ction. installation, and performance of the small angle rear tracking detector of the ZEUS experiment are described. The results on electron position measurements electron energy correction, and background reduction at the first-level trigger are presented. The impact on the measurement of the proton structure function is discussed.
PACS: 29.4O.G~; 29.40.M~; 29.4O.Vj: 13.60.Hb Keyworiis: Scintillator hodoscope; Pre-showering correction; Timing veto
* Corresponding author. Tel.: +4940 8998 3030; fax: +4940
8998 3094; e-mail: [email protected].
’ Supported by the German Federal Ministry for Education and
Research (BMBF).
‘Supported by the Netherlands Foundation for Research on
Matter (FOM).
’ Supported by the US National Science Foundation.
4 Supported by the Italian National Institute for Nuclear Physics (INFN).
5 Supported by the US Department of Energy.
6 Supported by the NSERC and FCAR of Canada.
1. Introduction
The ZEUS experiment at the HERA electron-
proton collider at DESY has been taking data since 1992 [l]. The small angle rear tracking detector
(SRTD), consisting of finely segmented scintillator strips, was installed in ZEUS in 1994. The SRTD was constructed with the purpose of improving the elec- tron and other ch~ged-~a~~c~e measurement in the small-angle region around the beam pipe in the rear
0168-9002/W/$17.00 0 1997 Elsevier Science B.V. All rights reserved
PzI50168-9002(97)01029-2

64
_Rear TlXkcr
-7 ‘--I Central Tracker
Vertex Detector __._..‘. .,.I
/ __...” ,,,_....-”
8 = t7fJ deg. 1. . ) __ . ..--’ I ,~__~~~~~~~..~. . . . . . . . I_ _ *‘_:_....c... -.-.. ..
A r ll-._--- -L 148 m Beam Pipe
Fig. 1. A side view of part of’ the ZEUS detector in the rear direction (not r0 scale).
(electron beam) direction. In addition, the SRTD also
provides fast timing at the first-level trigger to reject backgrounds from proton interactions upstream.
The deep inelastic scattering (DIS) process e-E-p+ e/+X is generally studied in terms of Q’,
the negative of the four-momentum transfer squared, and Bjorken x, the momentum fraction of the struck
quark. One of the most important results to emerge from the HERA physics program so far is the obser-
vation of the rapid rise of the proton structure function F&Y, 9”) with decreasing x for x 5 IO-’ at fixed Qz7
and it is of great interest to extend the measuremel~ts
to the region x -=z lo-” to study the low x behavior 121. In the ZEUS experiment, because of the almost
hermetic coverage, both the scattered electron and hadronic system are measured, which provide two independent detern~inat~ons of x and Q’. And in the kinematic region of interest, these variables are more
reliably reconstructed using the measured energy (EL) and angle {@) of the scattered electron:
where E, and EP are the electron and proton beam energies, and d is measured with respect to the proton beam (Z-axis) direction.
Much of this region, corresponding to B > 1 Go, was not covered by the existing tracking detectors of the ZEUS experiment, so the precision of the elec-
tron position determination was limited (see Fig. 1). The precise determination of the electron impact po- sition is required for the reconstruction of kinematic variables, and for fiducial definition for shower con-
tainment close to the calorimeter boundary around the beam pipe. Furthermore, there was a significant
amount of inactive material close to the beam pipe which caused essentially all the electrons to shower before reaching the calorimeter, resulting in an inac-
curate determination of the electron energy.
Backgrounds also have a significant impact on DIS
me~urements. The large rate from upstream proton beam-gas interactions has been reduced at the ZEUS
first-level trigger (FLT) by existing veto counters which, however, have a limited acceptance. The tim- ing of the energy deposits in the rear calorimeter (RCAL) from upstream interactions is early by ap- proximately IOas compared to the nominal timing
of energy deposits from electro~~roton (ep) colli- sions. The RCAL timing is not available at the FLT, where the trigger decision must be made 4.4 ps af- ter the colliding beams cross, but is used to reject
backgrounds at later trigger levels. To reduce the FLT background rate, it was necessary to raise the trigger energy thresholds in the RCAL beam pipe region, leading to a reduced accepta~lcc for low .Y events.
The SRTD wits designed to: __ improve the position measurem~t and identifica-
tion of charged particles within the acceptance of the SRTD;

- identify pre-showering electrons with the ~ffssibil~~ to correct for energy loss in the inactive material;
and - identify upstream proton beam-gas interactions
kased on timing at the FLT level. In order to achieve these objectives, the SRTD is
required to have:
position resolution < 5 mm; timing resolution < 1 ns;
efficiency for minimum ionizing particles (MIP)
> 99%;
energy resolution < 1 MIP;
energy scale calibration uncertainty < 10%; event timing at the first-level trigger; and energy and time information for offline analysis.
Given the severe constraints presented by the al- ready existing ZEUS detector: _- < 5 cm of space between the RCAL and the me-
chanical support structure of the central compa-
nents, - regular movement of the RCAL to avoid radiation
damage of the calorimeter during beam injection
and acceleration, and - magnetic fields of 1.4T,
two layers of plastic s~i~til~ator strips read out by
optical fibers and photomultipli~rs were chosen to implement the SRTD.
In this paper, the design, construction, ~~tai~ation,
and performance of the SRTD are described. The me- chanical layout is presented in Section 2. The opti-
cal readout is discussed in Section 3. A description of the front-end electronics and calibration is given in Section 4. Finally, the oftline data analysis and re-
sults on the performance of the SRTD are presented in
Sections 5 and 6, respectively.
2. Mechanical layout
In the active part of the SRTD, the scintillator strips are armnged in two overlapping layers, one containing horizontal, the other vertical strips. In the
X-Y plane, the SRTD is divided into four quadrants, 24 cm x 44cm each as shown in Fig. 2. The derec- tor covers a total area of 68 cm X 68 cm, except for the 20 cm x20 cm cutout in the center for the beam
pipe.’ The angular coverage is 162’ < 8 < 1X?, with
complete acceptance for 167” < 8 < 174.5”. There is
a total of 272 channels.
Scintil~ator was chosen as the detector material for its fast timing response and its high efficiency for min- imum ionizing particles. The scintillation light is de- tected by PhotomuIt~piiers (PMTs) via light guides.
The light guides were made from bundles of optical fibers for optimal transmission efficiency. Space for
housing the PMTs and front-end electronics was avail-
able on the sides of the RCAL at approximately 2.5 m distance from the active detector. Constrained by the
available space (in the Z-dimension) in the SRTD ac- tive region, the thickness of the scintillator strips was
chosen to be 5 mm, resulting in a thickness of 15 mm for the entire system including the mechanical sup- port. A side view of part of the ZEUS detector is shown in Fig. I, indicating the position of the SRTD at Z = - 148 cm from the nominal interaction point.
A perspective view of the SRTD after installation is
shown in Fig. 3.
The scintillator material SCSN-38 was chosen. The same material was used in the ZEUS uranium-
s~~ntil~~tor calorimeter [lf. The strips were diamond cut and polished with high precision on the dimensions and an&s and with high-q~aIity surfaces. 8 The strip cross section was 5.0 f 0.2 mm by 9.80 jr 0.05 mm. As shown in Fig. 2, two lengths, 240.0 rfc 0.2 mm and
440.0 Ifr0.2mm were used. One end of each strip was aluminized by vacuum deposition ’ providing a
reflective mirror to improve the light output and the
response uniformity.
2.3. Light yuides
The light guides were made from clear PMMA fibers (Noechst Infolite FK52). These are single-clad, 1 mm diameter fibers with a minimum bending radius of 25 mm. For easy handling of the light guides, the
’ In t 995 the vertical gap of the RCAL in the beam pipe region afas reduced from 20 to 8 cm and the SRTD geometry was adjusted acccotriingty without changing the quadrant size.
x Gebex AG, User, Switzerland. ‘) Pr~itrame SA, Tramelan, Switzerland.

66
Fig. 2. Arrangement of the two layers of scintillator strips. One strip from each layer is shaded for illustration.
Fig. 3. A perspective view of the SRTD installed in ZEUS. The
scintillator strips are located in the dark-square area near the center.
Scintillation light is transported via light guides to PMTs housed
at the sides of the RCAL, where the support for the front-end
electronics is also located.
fibers were glued together to form a solid piece. For the construction, a bundle of45 fibers was cut to the
appropriate length (2.1-3.5 m), and then glued to form
the required shape. During this procedure, care was taken so that the fibers of an individual bundle remain in a close-packed confi~ration with a minimal cross section of 8.0mmx5.4 mm. Any irregularity in the fiber bundle would result in an increase in the space taken by the detector. The fibers were held in piace by a series of straight and circular Teflon jigs, and
w
4 reflective mirror end
I J scintilrotor strip
Read
FiT
out
Fig. 4. A schematic layout for one SRTD detector channel (not
to scale).
soaked with the glue HT-2 (R&G), with 24 h curing time. At one end of the light guide, the fiber bundle
was glued together to form a rectangular cross section of 9.5 mm x 4.6 mm matching that of the scintillator strip; while at the other end, with one additional fiber for laser light, the bundle was glued into a cylindrical shell of black lucite to form a connector to the PMT housing. The glue used in this step was Stycast 1264 (Emerson & Cuming), with 48 h curing time. Both ends of the fiber bundle were cut and polished with a diamond mill.

A. Bambergrr rt ui. / Nucl. hstr. urd Mrth. in Ploys. Rrs. A 401 (1997) 63-W
Fig. 5. A photograph of one-half of the SRTD with the top cover removed. The layer of horizontal strips is visible near the center
The vertical strips are situated beneath the horizontal ones. Also shown are the light guides grouped into equal lengths leading fron
strip IS to the PMTs (not shown) located along the right edge of the support structure.
left.
, the
A detector channel was completed by gluing the light guide to the scintillator strip using Loctite 401, with 5 min curing time. The scintillator and part of the light guide (a few millimeters in length) were wrapped with one layer of 27 urn thick aluminium foil to avoid
light coupling to the neighboring channels. No adverse chemical effects of the glue on the scintillator or the
fiber were observed. As discussed in Section 3.3, the
response to a single MIP was measured for each com-
pleted channel to ensure the quality of the detector, to determine the response uniformity along the strip, and to obtain a measurement of the conversion factors between signal charge (PC) to particle count (MIPS).
Fig. 4 shows a schematic view of one complete detec- tor channel.
The light guides of a given group of strips were made of equal lengths to ensure equal arrival time of the scintillation light at the PMTs approximately 2.5 m away, in order to improve the relative timing at the FLT. As a result, the light guides for the verti- cal strips were routed in a curved fashion (trombone design) to account for the varying distances to the
PMTs. This can be seen in a photograph of one-half of the completed SRTD in Fig. 5. The layer of hori- zontal scintillator strips can be seen connected to three groups of straight light guides. The layer of vertical strips, hidden from view by the horizontal strips, are
connected to three groups of curved (trombone) light guides.
The SRTD support structure is divided into two independent halves, one for each half of the RCAL. Each structure consists of two large 1 mm thick alu- minium sheets, with one additional sheet in the active region separating the two layers of scintillator strips. The amount of material in the active region corre-
sponds to 0.06 radiation lengths. The aluminium sheets are separated by brass spacers and held together by screws. The spacers also keep the light guides in place. Each plane of24 or 44 scintillator strips of a quadrant is fixed with two tension straps (0.2mm thick steel) which are in turn attached to the support structure.

The resulting relative positioning of the strips is then well defined and is maintained to a 0.2mm accu- racy. The separation between the aluminium sheets is 6 mm, sufficient to contain the wrapped scintillator strips, as well as the tension straps. Each structure is
mounted onto the front face of the RCAL with steel
rods which are attached to the top and the bottom of
the calorimeter support structure, and held in place
with an additional tension strap attached to the sides of the calorimeter. One-half of the completed SRTD is shown in Fig. 5, with the top sheet of the support structure removed. The SRTD as installed in ZEUS is shown in a perspective view in Fig. 3.
3. Optical readout
The dimensions of the PMTs for the SRTD read-
out are restricted because of the limited space avail- able for magnetic shielding and mechanical support. The Hamamatsu R647 PMT was chosen mainly for this reason. It is a 4 in. diameter, bialkali-cathode, lo- dynode-stage tube with a 2.5 ns rise time, suitable for the fast timing measurements for the first-level trig-
ger. The PMTs are mounted in iron boxes (up to 24 per box) with 10 mm thick walls to provide magnetic shielding. Tests in the ZEUS environment did not
show any gain change after the magnets were switched
on. No optimization of the wall thickness was done.
A photograph of the box with 24 PMTs installed is shown in Fig. 6. Each PMT has its own /l-metal shield-
ing. A spring presses the PMT against the fiber light
guide.
A Cockroft-Walton voltage multiplier generates the high voltage directly at the PMT bases [3-51. Three input voltages, rtl8 and 5 V are required. This sys- tem has a lower power dissipation and lower out- put impedance than a source with a passive divider chain. There are three HV generators in each box with
one microprocessor for remote control. A flat cable provides the HV for the individual dynodes. The high- voltage generator and controller are mounted on the lid of the PMT box, which opens freely for servicing, as can be seen from Fig. 6. Eight PMTs are daisy-chained together, and consequently, operate at the same HV. In fact, the same high voltage is used for the group of
Fig. 6. A photograph of the PMT box. A side plate has been
removed and the lid opened to show clearly the interior layout.
The PMTs are shown facing downwards in the picture.
20 or 24 PMTs in each box in order to obtain similar transit times, and thus, improved relative timing.
The PMT gain setting and HV base configuration were chosen according to the pulse-height threshold in
the SRTD FLT and the read-out dynamic range. For a 50 I1 input impedance and a signal FWHM of lOns, the chosen scale of 2.5 pC/MIP provides a MIP signal pulse height of approximately 12.5 mV at the FLT. For a nominal light yield of 25 photoelectrons per MIP, a gain of 4.25 x 10’ is required. Monte Carlo stud- ies showed that for pre-showering electrons, on aver- age 50 MIPS are detected in a single SRTD strip, with a maximum of more than 100 MIPS. The voltage distri- butionratio2:1:I:1:1:1:1:2:2:2:3waschosen to improve the linearity of the R647 for large anode pulses. This divider configuration gives a satisfactory nonlinearity below 10% for an anode signal of 100 PC.
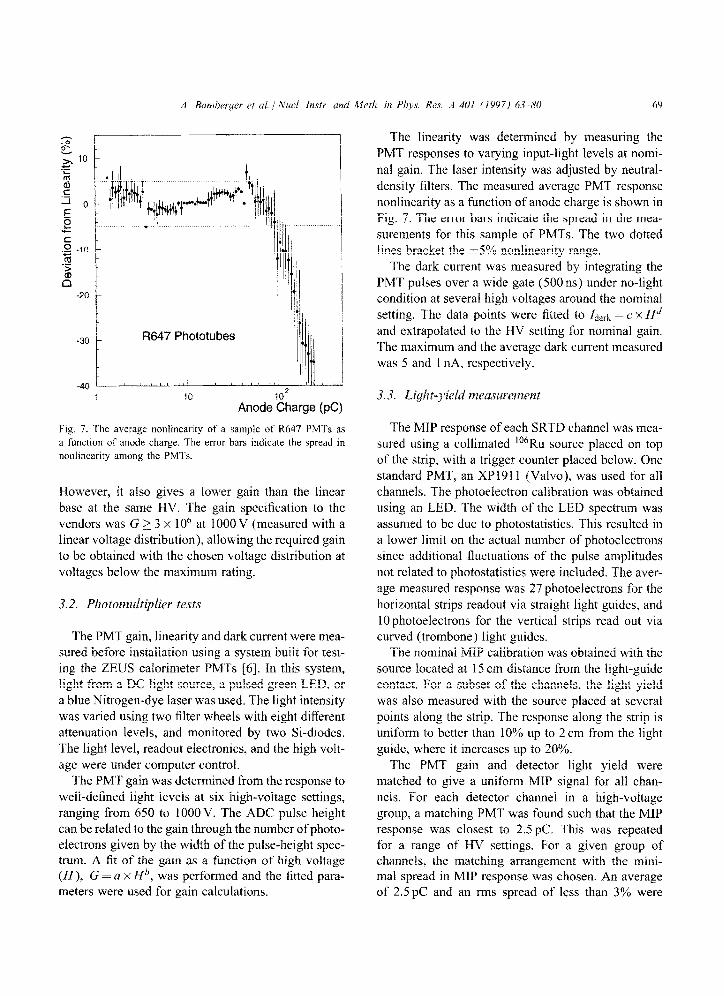
Anode Charge (PC)
Fig. 7. The average nonlinearity of a sample of R647 PMTs as
a function of anode charge. The error bars indicate the spread in
nonlinearity among the PMTs.
However, it also gives a lower gain than the linear base at the same HV. The gain specification to the
vendors was G > 3 x lo6 at IOOOV (measured with a linear voltage distribution), allowing the required gain
to be obtained with the chosen voltage distribution at
voltages below the lnaximum rating.
3.2. Phtondtiplier tests
The PMT gain, linearity and dark current were mea- sured before installation using a system built for test- ing the ZEUS calorimeter PMTs [4]. In this system, light from a DC light source, a pulsed green LED, or
a blue Nitrogen-dye laser was used. The light intensity was varied using two filter wheels with eight different attenuation levels, and monitored by two Si-diodes.
The light level, readout electronics, and the high volt- age were under computer control.
The PMT gain was determined from the response to
well-defined light levels at six high-voltage settings, ranging from 650 to 1OOOV. The ADC pulse height can be related to the gain through the number of photo- electrons given by the width of the pulse-height spec- trum. A fit of the gain as a function of high voltage (H), G = a x .Ifh, was performed and the fitted para- meters were used for gain calculations.
The linearity was determined by measuring the
PMT responses to varying input-light levels at nomi-
nal gain. The laser intensity was adjusted by neutral-
density filters. The measured average PMT response nonlinearity as a function of anode charge is shown in
Fig. 7. The error bars indicate the spread in the mea- surements for this sample of PMTs. The two dotted
lines bracket the &5% nonlinearity range. The dark current was measured by integrating the
PMT pulses over a wide gate (500 ns) under no-light condition at several high voltages around the nominal
setting. The data points were fitted to /dark = c x H” and extrapolated to the HV setting for nominal gain.
The maximum and the average dark current measured
was 5 and 1 nA. respectively.
The MIP response of each SRTD channel was mea-
sured using a collimated “‘Ru source placed on top of the strip, with a trigger counter placed below. One
standard PMT, an XPlOl 1 (Valvo), was used for all channels. The photoelectron caIibration was obtained using an LED. The width of the LED spectrum was assumed to be due to photostatistics. This resulted in
a lower limit on the actual number of photoelectrons since additional fluctuations of the pulse amplitudes
not related to photostatistics were included. The aver-
age measured response was 27 photoelectrons for the horizontal strips readout via straight light guides, and
10 photoelectrons for the vertical strips read out via curved (trombone) light guides.
The nominal MIP calibration was obtained with the
source located at 15 cm distance from the light-guide contact. For a subset of the channels, the fight yield
was also measured with the source placed at several points along the strip. The response along the strip is uniform to better than 10% up to 2 cm from the light
guide, where it increases up to 20%. The PMT gain and detector light yield were
matched to give a uniform MIP signal for all chan-
nels. For each detector channel in a high-voltage group, a matching PMT was found such that the MIP response was closest to 2.5pC. This was repeated for a range of HV settings. For a given group of channels, the matching arrangement with the mini- mal spread in MIP response was chosen. An average of 2.5pC and an rms spread of less than 3% were

measured for the MIP responses of all channels. The MV settings were chosen with values ral~ging from 800 to 95OV, well below the maximutn rating of 1250V.
4. Front-end electronics
Tile SRTD read-out electronics is similar to that used for the ZEUS calorimeter. A detailed dcscrip- tion can be found elsewhere [7]. The analog part of the readout is located on the detector. On the read- out front-end cards, the fast PMT signal is split into a high- and a low-gain channel, pulse shaped, sam- pled and stored in an an&g pipeline. If the event is to be read out, the sampled v&age levels are stored in an analog bu@er, and then Inult~pIe~ed via long cables to the ADCs on the digital cards located in counting rooms away from the detector. The calcula- tions of the energy, time, and other quantities from the digitized samples are done in a digital signal proces- sor on the digital card, The readout ADC saturation limit is 22OOpC which corresponds to approximately f&XI MIPS.
At HERA, the cowhiding beams cross every 96~ The ZEUS global first-level trigger (CFLT) decision is made 46 crossings or 4.4 us after the collision. The SRTD first-level trigger provides fast timing informa- tion for rejection of upstream proton Bern-gas inter- acrions. As shown in Fig. 4, the PMT signal is sent to both the readout and the FLT. The high impedance of the input amplifiers on the trigger cards allows spy- ing on the signal as it propagates from the PMT to the readout electronics where the signal is terminated in SO Q A dual-threshold d~s~rin~~nator is used to achieve good timing resohmon. The Low-threshold signal is de- layed and used in coincidence wirh the high-threshold signal, The low-tl~resho~d crossing time gives the tim- ing. This scheme reduces the time walk due to pulse- height variations. Tn tests with a prototype detector, with threshold settings at 0.1 and 0.3 MIP, a timing resolution of 1 ns was measured.
A subset of the SRTD channels was instrumented for the FLT during the 1994 running period. For each SRTD ql~adra~t, the group of eight 44cm long strips closest to the beam pipe was connected to a trigger card. There were 4 trigger cards, 8 channels each, made with two-layer prirlted-circuit boards.
Each board has an analog section with dustI- threshold d~s~rim~nato~s, and a digital section which controls the threshold and ~ha~nei mask on/off sct- tings. An i~d~v~dua~ channel can be masked offin case of noise or other problems, but the threshold is the same for all 8 channels on each board. The threshold and channel mask settings are downloaded as serial data remotely via an S-pair Scotchflex cable. The set- tings are kept by on-board registers. Manual setting of the threshold and channel. mask is also possible for test purposes. The LeCroy ~VL4~7 four fold op-amp chip is used as the high impedance dual-threshold disc~~rn~na~or. The load-threshold dis~ri~~inator out- put signal is delayed via a coaxial cable. The logical OR of the 8 high/tow coincidence outputs, where the earliest time in the 8 channets determines the timing, is sent out as a NIM signal via a cable driver. The relative timing offsets of the 8 channels on each board were obtained using beam-gas data collected when only the electron or proton beam circulated. Each cham~el was masked off one at a time, and its timing dete~in~d and corrected with delay cables. The rela- tive timing was tuned to better than 1 ns. These NM signals from the 4 trigger cards were sent to the ZEUS GFLT for timing veto decisions and monitorjng for each beam crossing.
The SRTD has been fully instrumented for the FLT since the beginning of the 1995 running period [8]. For each SRTD quadrant, the group of 24 long (44em) strips is connected to one trigger card, and the group of 44 short (24cm) strips is connected to two dh- ers. There are 12 trigger cards located in the detec- tor adjacent to the RCAL. Each set of 3 trigger cards per SRTD quadrant is controlled by a 9U VME card located in the counting room via a 40m long rib- bon twisted pair data bus. Resident in the same VME crate is an ~V~El47 processor with an Ethernet con- nection running under OS9 and a ZEUS transputer
module connected to the central data acquisition sys-
tem for read out from the SRTD FLT in the event of
a second-level accept. The trigger cards are implemented in ECL and
CMOS with 24 channels per card on 12-layer printed circuit boards. Each card has an analog section with dual-threshold discriminators, and a digital section
which controls the threshold and channel mask on/off settings. The National 1003 14 chips are used as the high-impedance amplifier/discriminators. An individ- ual channel can be masked off in case of noise or other problems. Both the high and the low thresholds
can be set for each channel. But, in practice, most of
the channels have the same threshold setting, and only some thresholds are different, as required to keep the
singles rate down. The threshold- and channel-mask
settings are downloaded through the data bus from the VME crate. All parameters of the trigger cards
are retained in on-board registers and an extensive repertoire of diagnostic software has been developed.
The timing data are generated by an on-board rapid cycling TDC. The TDC output has a dynamic range of 63 ns, encoded in 6 bits with the least significant
bit approximately equal to 1 ns. The relative timing
of each channel is adjusted with plug-in passive de- lays. The TDC is started every 96 ns by a signal syn- chronous with the HERA clock and stopped by either
a coincidence signal between the overlapping scintil- lator layers or, if there is no coincidence signal within
63 ns of start, by a default overflow signal. The low-
threshold discriminator output determines the timing and the high-threshold output is used to define a hit. The coincidence signal is generated when there is a hit in both layers in a given quadrant within 15 ns of each other. The TDC output is sent to the GFLT on each beam crossing.
Test signals are used for the diagnostics and cali- brations of the front-end electronics. These signals are generated either via precision charge injection into the readout front-end cards and the trigger cards, or via laser pulses brought to the PMT entrance window via a light fiber. The gain, pedestal and linearity of the readout electronics are measured regularly and cor- rection factors are downloaded to the readout system. For the SRTD FLT, the test signals provide calibra-
tion data for the coincidence timing and diagnostics
for the trigger channels.
The high-voltage settings are continuously moni-
tored and maintained at a constant level by a micropro- cessor in the HV generator system. The gain variations over the entire running period are negligible, as indi-
cated by offline data (see Section 5.1).
5. Offline data analysis
The energy deposit in the SRTD is measured in
units of MIPS. An initial charge-to-MIP calibration is
obtained using a ‘06Ru source. The final energy scale calibration for every channel is obtained from ep data,
using events with an isolated MIP-like particle found
in the SRTD. These events are selected by requiring that only one strip is hit in each of the two overlap-
ping layers, and that the energy deposit in one of the strips is above threshold to suppress noise. The energy deposit in the other strip is used to determine its MIP
response. The MIP energy distribution is fitted to the function [9]:
,f(j.)=Ae~l~""+'-'),
(3)
where i. = (E - E,,J~ )/B, and A, B. and EMIP are the free parameters. For each channel, the MIP scale is
given by the fitted value of EM[P, which is approx-
imately the most probable value of energy loss by a MIP in the scintillator strip. Some typical distri- butions are shown in Fig. 8. With this method, the average MIP scale is measured to be approximately 2.8 pC/MIP with a 16% rms spread. These values are slightly different from those obtained in the initial
light-yield measurement (see Section 3.3). This can be explained by the fact that the initial measurement did
not include effects due to the quantum efficiencies of the PMTs installed in the experiment. The MIP scale
values are also determined for three separate time pe- riods during the 1994 run, and are stable to better than 5%. Based on these studies, an accuracy of ap- proximately 10% is estimated for the SRTD energy scale, which is adequate for the purpose of electron en- ergy loss correction. The electronics noise, measured from the energy distribution of strips with no energy deposit, is approximately 1.4% of a MIP.

600
0 0
Energy, 2.5pC r&s 0
Energy, 2.5pC n&s
0 Energy, 2.5pC r&s
Fig. 8. The SRTD MIP energy dis~ibutio~s in four typical chan-
nels. An initial cat&ration of 2.5pC/MIP is used. The variation
in widths is due to the difference in light yield. The fitted curves
are also shown.
The offline event timing in each charmel is corrected
for several effects. The relative time delays from the light guide and cable lengths are calculated assum- ing a signal propagation speed of 0.6 c in both cases.
Residual time offsets as well as the pulse-height de- pendence of time measurements are determined using ep data for each channel.
The timing measurement is studied using a sample
of DIS events with an electron found in the SRTD.
For all channels, the dependence of the reconstructed time on the energy deposit in the SRTD is found to
be smaller than 0.5ns, and therefore, no corrections are used. The single-strip timing resolution is shown in Fig. 9 as a function of strip energy for several channels. It is parametrized by a~/&?, where E is the strip energy, and (ro the fitted Gaussian width of the timing distribution at a given E. The average val- ues for rro are 3.6 and 5.2 (nsm) for E between 0.2 and 20MIPs, for the two groups of strips cou- pled to straight and curved light guides, respectively. The corresponding rms spreads in ~0 are 0.3 and 0.9 (llSv/MIp).
tilerqy (MIPS)
Fig. 9. Single-strip timing resolution for a sample of strips mee-
sured using DIS data with an electron hit in the SRTD.
To account for any residual time offsets from the
combined effect of PMT transit time and delays in the readout electronics, an average strip time is cal-
culated for events from a dedicated data sample. Effects due to HERA beam timing shifts are taken into account. The average strip time for all events
with strip energy between 2 and 1X MIPS is measured
by: fstrip = C t,,.ip(E/Di)/ c(E/c$). The time offsets
are typically inside a 12 ns range.
6. Results on the SRTD performance
The capabilities of the SRTD are illustrated with two typical DIS events. In the event shown in Fig. IO, there is a clean isolated electron hit in the SRTD. The
matching between the SRTD hits and the energy de- posits in the caiorimeter is clear. The fine segmentation
provides improved electron position determination. In
the event shown in Fig. 11, the scattered electron as well as a jet of hadronic particles are observed in the SRTD region. The electron is also clearly matched to the SRTD hits. For these nonisolated events, adequate segmentation is required in order to correctly assign the SRTD hits to the scattered electron. This is impor- tant both for position reconstruction and for electron energy loss correction.
Because of the fine segmentation, the SRTD eiec- tron position measurement has a better resolution and

Fig. 10. A typical DIS event with an isolated electron in the SRTD. In the side view (left), the proton beam points to the left, and the
scattered electron is detected just above the beam pipe in front of the RCAL In the X-Y view (right), the energy deposits in the SRTD
strips are shown by the histograms where each bin corresponds to a strip; the energy deposits in rhe RCAL are shown as dark rectangles.
a smaller systematic shift, on average, than the calori-
meter. The position resolution is determined from the
data, using DIS electrons with impact positions near the boundary between two calorimeter cells. In this
restricted region, selected using the energy imbalance between two neighboril~g cells, the calorimeter posi- tion resolution is better than 0.1 cm although the aver- age resolution is only 1 cm. The sensitivity of the cell energy imbalance to impact position and the compar-
isons of the SRTD and RCAL position measurements
are shown in Fig. 12. The SRTD position resolution
is approximately 0.3 cm.
The SRTD position was surveyed with respect to
the ZEUS coordinate system after installation. The fi- nal alignment with respect to the HERA beam coordi- nates was done using ep data. The spatial distribution
of the energy deposit in the SRTD was considered as an “X-ray” image of the inactive material upstream. The relative position of the two SRTD halves was determined by requiring the ring image of a support
structure in the end plate of the central tracking detec- tor to be matched across the two halves. The absolute
alignment was determined by requiring the scattered
electron 0 distribution in DlS events be independent of azimuth. The resulting alignment accuracy was
0.1 cm. The results were confirmed using the trans- verse momentum balance in QED Compton events.
The energy lost by an electron traversing inac- tive material upstream of the SRTD/calorimeter is related to the resulting shower-particle multiplicity,
and thus to the energy deposit in the SRTD. Using both the SRTD and the calorimeter energy measure- ments, the electron energy loss is corrected on an event-by-event basis. This correction also reduces the degradation in energy resolution due to pre-showering in inactive material. A dedicated presampler with coarse segmentation but providing full coverage

Fig. I I. Another DIS event with an electron together with hadronic activity in the SRTD. In the A’- Y view (right), the SRTD strip hits
are again clearly associated with the electron hit (upper left corner with respect to the beam pipe which is marked by the cross in the
center). The energy deposits seen at the lower right of the beam pipe are due to particles in the hadronic system.
of the forward and rear calorimeters in ZEUS is described elsewhere [lo].
In the energy correction procedure, the calorime- ter and SRTD responses are related through a linear
ansatz:
&AL -4 + al-&RTD,. (4)
where ECA,L is the electron energy measured in the
calorimeter, and Esaro the total energy of the hits assigned to the electron by a clustering algorithm. In test beam studies for the ZEUS presampler [lo], the parameters ui are found to depend on both the amount of material and the initial electron energy (&). The energy dependence is parametrized by a, = cxt + PiEe. The residual dependence on the amount of mate- rial is taken into account by the parametrization p, =e (3, +ii:&!sr,) ( 3. i EsRTn) + e (1~ , chosen for optimal energy resolution. The corrected electron energy is
detel~ined using Eq. (4). by expressing E,- in terms
of EcAL, EsRT~, and the correction parameters.
The energy correction parameters are determined using special classes of events in ep collisions in which the true scattered electron energy can be ob-
tained through kinematic constraints without using
the calorimeter energy infomlation. These are: _ the kinematic peak (KP) events in DIS, in which
very little momentum is transferred from the elec-
tron to the proton, and the scattered electron energy dist~bution peaks at the incident beam energy of
27.5 GeV; - the elastic QED Compton events, in which the en-
ergy (in the range of 5-22 GeV) of both the final- state photon and electron can be calculated from their angles, assuming the outgoing proton carries away negligible transverse momentum; and
_ the diffractive p” events in DIS, in which the mo- mentum of the p” (reconstructed from decay pion

350
300
250
200
150
100
50
0
CAL impact posltion (cm)
SRTD Y - CAL FId. Y (cm] SRTD X -CAL FM. X (cm)
Fig. 12. Electron position measurement. RCAL cell energy imbalance versus electron impact position (top). Distributions of the SRTD-CAL
Y and S positions reconstructed within the fiducial boundary region between two RCAL cells (bottom).
tracks in the central tracker) and the electron angle are used to calculate the scattered electron energy which ranges from 20 to 27.5 GeV.
The parameter values are obtained directly from the
KP and elastic QED Compton events, The values for
xi and /.$ are adjusted until the difference between the corrected energy and the true energy (as given by kinematic constraints) is minimized; the values for cTi are adjusted until the energy resolution for KP events is optimized.
The results are shown in Fig. 13. The correlation be- tween the energy measured in the calorimeter and the energy measured in the SRTD is shown in Fig. l?(a) for KP events. The effect of the correction is shown
in Fig. 13(b), where it can be seen that the KP energy distribution after correction is shifted to the beam
energy with an improved resolution. The energy scale deviation of the corrected energy from the true en-
ergy, as a fimction of the true energy, is shown in
Fig. 13(c). The corrected energy is well within 2% of the true energy. The effective energy resolution, for electrons found within the SRTD acceptance, can also
be obtained from these special classes of events. It is determined from the width of a Gaussian fitted to the distribution of the difference between the corrected en- ergy and the true energy. The result is shown as a func- tion of the true energy in Fig. 13(d). The resolution can be described by the curve ci = 26% d-j.

76
g 0.1 .- ;ij - c)
9 QED Compton 2
M QED Compton * .-
2 Kin. Peak
2 52.
I d) l Kin. Peak
A ; 0.05 -’ DISp : T” A ‘=
1.5 DISp
5 2 = ______________--_______i_____ 0 3
L; 0 r +**-+2-+*-- u
_.-i-_+;;*-
1 : _______._____________________ -++W+++
-0.05 - 0.5 I: ---- 26%JE(GeV)
-0.A ’ I t ’ ” / ” i 1 10 20
*A 30 70 20 30
E’, (GeV) Fe (GeV)
Fig. 13. Electron energy correction using the SRTD. (a) The correlation between the energy measured in the calorimeter and the energy in
the SRTD for KP events. (b) The effect of energy correction for KP events. (c) The relative energy scale deviation as a function of true
energy. (d) The effective energy resolution as a function of true energy. The arrows in (a) and (b) point to the beam energy of 17.5 GeV.
The DIS pc events are not used in the parameter tuning procedure, but are used as an independent check of the energy correction, and the results agree well with the other two data samples as shown in
Figs. 13(c) and (d).
The corrected electron energy distributions, for
KP events divided into several samples according to
SRTD energy, are found to be identical. This is a confirmation that the dependence on the amount of
material, which is related to the SRTD energy deposit, is correctly accounted for. This is important since the inactive material upstream of the calorimeter,/SRTD
is not uniformly distributed.
It is also impo~ant that the SRTD clustering algo- rithm correctly assigns hits to the electron pre-shower. In certain kinematic regions, where the scattered elec- trons are at low energy, the outgoing hadronic parti- cles from the struck-quark ~agmentation are likely to be found in the SRTD region. An example is shown
in Fig. 1 I. In these events, in contrast to the clean QED Compton events used in the calibration, there are additional SRTD hits which are not related to
the electron pre-shower, but are due to the hadronic particles. To investigate this effect, the energy distri-
bution of the cluster of SRTD strips assigned to the electron is studied, and is found to be the same for
both QED Compton events and standard DIS events at Ei = 9 GeV; while the energy deposit outside of
the cluster increases dramatically for DIS events at Eb < 15 GeV. This is a ~onfi~ation that the clustering algorithm correctly assigns SRTD hits to the electron
pre-shower for different event topologies.
The offline event time distributions given by the RCAL and the SRTD are shown Fig. 14 for events with a DIS electron found in the SRTD fiducial region.

Fig. 14. Average offline timing distributions for events with a DIS electron found in the SRTD region. The RCAL (a) and the SRTD
(b) show comparable timing resolutions.
The SRTD event time is averaged over all strips with energy between 0.5 and 1X MIPS, with inverse timing
resolution frighting as described in Section 5.2. The
electron timing resolutions given by Gaussian fits to the event time dis~ibutions are 0.51 and 0.62ns for
the RCAL and the SRTD, respectively.
The SRTD online timing is used by the GFLT to veto background events. The background particles from upstream proton interactions travel along with
the proton bunch and deposit energy in the RCAL
and the SRTD before the proton bunch collides with the electron bunch at the interaction point. The back-
ground timing is therefore early by approximately 10 ns compared to the ep collision timing. The SRTD
FLT performance is described below for the 1994 and the I995 impI~~~entations.
The SRTD FLT was partially instrumented in 1994 as described in Section 4.2,1. Its performance is studied using two ep data samples. One event
sample satisfies all ZEUS trigger requirements, thus, containing mostiy ep events; the other sample satis-
fies only the first-level trigger and is dominated by
proton-gas backgrounds. Because of the coarse (4 ns) TDC granularity, fine tuning between the SRTD FLT time and the TDC clock of the CFLT is required. The delay is optimized to achieve the best separation
between proton-gas and ep events. The correlation
between the SRTD FLT timing and the RCAL timing is shown in Fig. 15. The time offsets are adjusted so
that for ep events the RCAL time is approximately
Ons and the SRTD time is at 4 TDC units. The large
beam-gas backgro~d can be removed by a cut at
SRTD FLT time of 6TDC units. This cut vetoed events with timing at least 8ns early with respect to the nominal ep collision time.
The trigger efficiencies are measured with the background events selected by RCAL timing. The
thresholds are set at 12 mV (low) and 25 mV (high) to reduce noise effects while maintaining a good ef- ficiency. The 50% efficiency point on the threshold
curve is at an energy of approximately 2.8 MIPS as given by offline analysis. The combined efficiency for
the 4 trigger cards is approximately 85%. The loss in
ep events is estimated to be less than 0.1% from the
RCAL time distributions before and after the SRTD
vero. By using the SRTD FLT background veto, the FLT trigger rate associated with the RCAL is reduced by 50% and the global FLT rate by 25%.
The SRTD FLT has been fully inst~m~nted with new electronics since the beginning of 1995 as de-
scribed in Section 4.2.2. The timing spectrum for a
sample of unbiased events is shown in Fig. 16. If at least 011~ SRTD quadrant had bad timing, consistent with a background event, and none had good timing, consistent with an ep collision, the event would be

RCAL time (ns) RCAL time (ns)
Fig. 15. Scatter plot of SRTD FLT time (TDC units) versus RCAL time (nsf for (a) all events, and jb) events dominated by proton-gas
background.
cl 20 40 50 0 20 40 63 SRTD time (TDC units) SRTD tine fTDC units)
Fig. $6. Unbiased SRTD FLT timing spectrum in the 1995 run. The peak around 30TDC units is due to proton beam-gas events, while
the peak around 40TDC units is due to ep events. The two different definitions of good and bad timing used in 1995 are illustrated.
vetoed. Two versions of the veto iogic were used in the running period. Initially, good timing was defined to be 32 _< t 2 49 and bad timing was defined to be f < 32 or 39 <t < 53, where 1 is the SRTD FLT time measured in TDC units of ~l.~~~~.~~)ns. This is
illustrated in Fig. IS(a). Later in the year, the good- timing upper Iimit was relaxed while the lower limit
was tightened: 34 5 t I63 (see Fig, 16(b)). This
change resulted in more late-timing physics events being accepted while maintaining a low background rate. Using the SRTD FLT timing information, the GFLT rate was reduced by a factor of 3 to 4 for both versions of the veto logic. In particular, the SRTD FLT veto nearly compensated for the sharp increase in the RCAL electron trigger rate which was due to
the reduction of the vertical gap in the RCAL beam pipe region. The loss in ep events was estimated from
an unbiased sample to be less than 0.5%. Because the timing resolution degrades for small
signat pulses and the presence of electronics noise
at the 0.1 MIP level, the discriminator high thresh- olds are set to approximately 0.5 MIP. The trigger
efficiency is studied using data. It is meas~lred by the fraction af the time the TDC is stopped with a cuin- cidence signal when one scintillator layer registers at least 1 +O MIP while the overlapping layer registers a maximum energy deposit in the strips ranging from 0 to 1.5 MIPS. The trigger efficiency is shown in Fig. 17 as a function of the effective threshold setting. The timing resolution is dete~ined from a fit to the TDC

O: 1 / L,_.,_i 0 0.5 1.5 0 0.5 1 1.5
Short strips
Fig. 17. The fraction of nQn~ve~~w SRTD FLT TDC outputs as
a function of the maximum strip energy in one plane of strips
when the other plane registers at least 1 .O MIP.
distribution around the ep time for events passing all the ZEUS trigger requirements. The overall timing resolution is approximately 1.5 ns, including a resid- ual run-to-run variation on the HERA timing and the differences (approximately 0.5 ns) between the four quadrants; while the timing resolution for a typical quadrant in a given run is approximately I .4 ns, The results are shown in Fig. 18.
As mentioned in Section 1, it is of great interest to extend the m~surement of the proton structure
55 40 45 50 55
TDC units Overoil
function F&X, Q2) to the region x < IO-“. Because of HERA kinematics, in the small x region of interest, the electron is scattered at small angles. Furthermore, the struck quark, carrying a small fraction of the incoming proton’s nlol~en~rn, is also scattered into the back- ward direction. Prior to the availability of the SRTD, the ZEUS Fz measurements relied on the “double- angle” method to reconstruct the kinematic quantities, mainly due to the lack of reliable electron measure- ments [2]. This method uses the measured angle of the hadronic system and the angle of the scattered electron to reconstruct the kinematic variables, and is there- fore insensitive to the electron energy measurement. However, in the small x region, the x and Q’ recon- structed with this method suffered from large system- atic shifts and coarse resolutions because the hadronic system was not well measured due to particles escap- ing through the rear-beam hole, and because near the RCAL boundary around the beam pipe the electron angle was not reliably dete~ined due to shower leak- age and coarse calorimeter segmentation. As a result, the region where Fz(x, Q2) could be measured reliably was restricted to s>4.2 x 10V4, even though events with lower x were detected.
With the SRTD, as shown in the previous sections, the electron energy and angle measurements in the angufar region around the RCAL beam pipe, corre-
35 40 45 50 55
Sector TDC units
3, run 1267 1
Fig. 18. SRTD FLT timing resolution in 1995: overall timing including quadrant-to-quadrant and run-to-run variations
for a typical quadrant in a single run (right).
(left), and timing
sponding to small x, are now well understood. Dur- ing the 1994 running period, the ep collision vertex was shifted furler away from the RCAL, resulting in an increase in the geometric acceptance for low .r
events. With x and Q2 reconstructed from electrons
in the SRTD region, the structure function was mea- sured at x = 3.5 x 10m5, with a systematic uncc~ainty
of &JO% [l I].
cidence with the RCAL FLT to accept events with the signature of a low-energy DIS electron scattered at small angles. The performance of the SRTD FLT hardware has been stable. All branches of the physics trigger logic in the GFLT now include the SR’I‘D FLT
veto in order to rnai~l~i~ reasonable rates with the in-
creasing instantaneous luminosity provided by HERA.
Acknowledgements 7. Summary and outlook
The design, constmctio~, installation, and perfor- mance af the small angle rear tracking detector of the ZEUS experiment at the HERA electron-proton
collider have been described. it consists of finely seg- mented scintillator strips read out by photomultipliers
via plastic fiber light guides. The impact position of
the scattered electron in deep inelastic events is mea- sured with a 0.3 cm resolution. The SRTD is aligned
with respect to the HERA beam axis with a 0.1 cm ac-
curacy. The SRTD is alsa used to correct the electron energy loss due to pry-showering in an inactive mate-
rial in front of the calorimeter. The electron energy is corrected to well within 2% of the true energy for an electron energy in the range X-27.5 GeV, while at the same time improving the measured energy resolution. With the improved measurement of the scattered elec- tron in the small”a~gle region, the proton structure
function &(x, Q’) has been determined at x - lo-’
from ZEUS data collected during the 1994 running
period. The SRTD online timing, with a resolution of bet-
ter than 1.5 ns, is used at the first-level trigger to veto backgrounds from upstream proton-gas interactions. As a result, the ZEUS global FLT rate was reduced by 25% with a partially instrumented SRTD FLT in 1994, and by a factor of 3 -4 with a fully instrumented SRTD FLT in 1995. Starting in the 1996 inning period, the SRTD FLT has also been used in coin-
We would like to thank the DESY Directorate
for its strong support. We would also like to thank the following people who helped in the construc- tion, installation, and data analysis: N. Bishop. B. Dabrowski. W. Drayer, C. Farrow, N. Feind,
C. Foudas, M. Gospic, H. Groenstege, C. Hartmann, Y. Iga, F. Jedrzejowski, C. Keyser, J. Labs, K. LiifiAer,
A. Maniatis, U. Mick, C. Muhl, W. Schulz,
W. Sippach, M. Sowinski, H. Stehfest, J. Thiesing, K. Tokushuku, and N. Wilfert,
References
[I] ZEUS collaboration, The ZEUS Detector, Status Report 1993.
DESY, 1993.
[I?] ZEUS collaboration, M. Derrick et al.. Phys. Lett. B 316
( 1993) 412: Z. f. Phys. C 65 ( 1995) 379: Hi Collaboration,
1. Abt et al., Nucl. Phys. B 407 ( 1993) 515; Nucl. Phys. B
439 (1995) 471.
[3] L. Hubbeling, CERN EP-7X-5, ECP-X-10.
[4] M. Gospic, H. Groenstege, NIKHEF Note ETR 94-1 I. [S] B. Lo et al., Nucl. Instr. and Meth. A 313 (1992) 135.
[6] T. lshii et al., Nucl. Ins&. and Meth. A 320 (1992) 449.
[7] A. Caldwell et al., Nucl. Instr. and Meth. A 321 ( 1992) 356.
[S] J.W. Dawson et al.. IEEE NSS Conf. Record, vol. I, 1995,
p. 427.
[9] J.E. Moyal. Phiios. Mag. 46 (1955) 263.
[IO] A. Bamberger et al.. Nucl. lnstr. and M&h. A 382 (1996)
419.
[l l] ZEUS coilabomtiot~. M. Derrick et al., Z. f. Phys. C 69
( 1996) 607.