the slippery science of fat separating fat from · pdf filethe slippery science of fat...
TRANSCRIPT

The Slippery Science of Fat
Separating Fat From Fiction
Mark Hyman, MD
Director, Cleveland Clinic Center for Functional Medicine
Pritzker Foundation Chair in Functional Medicine,
Cleveland Clinic Lerner College of Medicine
Chairman, Institute for Functional Medicine
March 12, 2015

Outline
• Our Big Fat Mess
• The Perfect Storm
• Food as Medicine: The Matrix and Fat
• Biology of Obesity
• Fat and Heart Disease
• Slippery Science of Fat
• Saturated Fat and Heart Disease
• Cholesterol and Statins
• Understanding PUFA’s – Omega 6 and Omega 3 fat
• Meat? To Eat or Not to Eat
• Areas of Agreement – Olive oil, Nuts, Trans Fats
• Controversies: Eggs, Butter, Meat
• What Should I Eat? The Pegan Diet

3
75% of Americans
40% of children


Age-adjusted Prevalence of Obesity and Diagnosed Diabetes
Among US Adults
Obesity (BMI ≥30 kg/m2)
Diabetes
1994
1994
2000
2000
No Data <14.0% 14.0%–17.9% 18.0%–21.9% 22.0%–25.9% > 26.0%
No Data <4.5% 4.5%–5.9% 6.0%–7.4% 7.5%–8.9% >9.0%
CDC’s Division of Diabetes Translation. National Diabetes Surveillance System available at http://
www.cdc.gov/diabetes/statistics
2013
2013

Origins of Diet-Heart &
Dietary Fat – Obesity Hypothesis
• The Perfect Storm
• Scientists, Government and Food Industry
– Ancel Keys – 7 Countries Study
• McGovern Report – 1977 Diet Guidelines
• 1992 Food Pyramid
• Revision of Guidelines 2015

Current View of Obesity:
Lack of Willpower • Energy Balance: Fact or Fiction?
• Calories In/Calories Out?
• Food Industry/Government Policy
– Eat More, Exercise Less?
• Moderation
– No Good or Bad Calories?
• Exercise?
– Is it a viable weight loss strategy

= Walk 4.5
miles

=
4 miles a day for one week

Epidemiology of Obesity
and Chronic Disease
• Role of sugar in chronic disease
– CVD, type 2 DM, stroke dementia, cancer, etc.
• Fat or Sick: Biology of Obesity
• TOFI or Skinny Fat: • 21% type 2 DM normal weight
• Twice morality of obese diabetics • JAMA. 2012;308(6):581-590
• New Definition of Obesity?
– BMI, W/H ratio, Body composition, metabolic obesity (biomarkers- insulin, lipid size)


Sugar, Fat and CVD
• Large meta-analysis of 72 studies on fat show no link with CVD except trans fats – Ann Intern Med. 2014;160(6):398-406.
• Large meta-analysis on sugar found significant link to CVD – HR for CVD 1.3 for lowest and 2.75 for highest
sugar consumption
– JAMA Intern Med. 2014;174(4):516-52
• Large meta-analysis found sugar CVD risk factor independent of weight gain – American Journal Clinical Nutrition 2014 May 7

17
146 LBS FLOUR 152 LBS SUGAR

Sugar Facts and Diabesity
• Sugar consumption: 152 lbs/yr up from 40 lbs in 1980
• Flour consumption: 146 lbs/yr (GI 100)
• Added sugars:
– 600,00 products and 80% with added sugar
– 8-15% calories from soda
– HFCS biggest source of calories in diet
• Children sugar consumption facts: 34 tsp a day – Lustig, R, Nature, Feb 2012, Volume 482, 27-29

Dopamine effects
nucleus accumbens
Opioid effects
gluteomorphins


“In a well balanced diet we need two liters of liquids a day. Soft drinks can be a healthy part of that intake. I would reject any argument that they are in any way harmful.” Chair of American Beverage Association in testimony to Congress

Sugary Drinks: 184,000 deaths/year
• 133,000 deaths from diabetes
• 45,000 deaths from cardiovascular disease
• 6,450 deaths from cancer
Singh GM, et. Al, Estimated Global, Regional, and National Disease Burdens Related to Sugar-Sweetened Beverage Consumption in 2010. Circulation, June 2015

The Biology of Obesity
What drives controls weight gain
and weight loss?

Hypothesis:
Obesity driven by dietary
composition not calories


Energy Balance?
• First Law of
Thermodynamics
• Energy is conserved
in a SYSTEM
• Is it true for human
metabolism?

Energy Balance
Useful Concept or Not?
• Changes in metabolic rate, fat storage,
hunger depends on dietary composition
– Food quality and dietary composition
– Triggers shifts in catabolism/anabolism
– Hormones (insulin, adiponectin, resistin),
neurotransmitters, cytokines (IL-1, IL-6) – Schoeller DA. The energy balance equation: looking back and looking
forward are two very different views. Nutr Rev. 2009 May;67(5):249-54.


Systems Approach to Obesity
The Functional Medicine Matrix


What are drivers of obesity?
• Nutrition
– Surfeit of calories (500 kcal increase per
person since 1970, mostly HFCS)
– Increase in sugar consumption – 10 lb to 152
lbs per person/year since 1800 and flour to
146 lbs per person/year.
– Nutrient deficiencies (n3, vitamin D, Mg, etc.)
– Changes in dietary composition

What are drivers of obesity?
• Assimilation (Gut)
– Changes in microbiome (diet, medications, birth methods, breast feeding trends, toxins)
– Leaky Gut – metabolic endotoxemia
• Defense and Repair
– Inflammation: food sensitivities, hybridization, GMO, infections, toxins
• Detoxification
– Environmental toxins “obesogens”

What are drivers of obesity?
• Energy
– Mitochondrial dysfunction
• Communication – Stress & cortisol, insulin, appetite regulation,
anabolic/catabolic states
• Antecedents – Genetics (DR2, thrifty gene)
• Social trends: food convenience, outsourcing cooking to corporations, demise of home cooking
• Others?

New Weight Loss Drug


How does food influence
human biology?
Beyond Calories
Food as Information
Dietary Composition


Properties of Food
• Energy – Calories
• Macronutrients (protein, fat, CHO)
• Micronutrients (vitamins and minerals)
• Fiber
• Phytonutrients
• Plant genome
• “Anti-nutrients”

Food as Medicine
Through the Lens of the Matrix
The Role of Fats as Medicine

Nutrigenomics
• Nutrigenomics
– PPAR signaling EPA (n3) vs. Trans fat (TFA)
• EPA improves insulin signaling, increases fatty
acid oxidation and reduces inflammation
• TFA impairs insulin signaling, slows fatty acid
oxidation and increases inflammation
– Sterol Regulatory Element Binding Proteins
(SREPB): fatty acid & cholesterol metabolism
– Transcription Factors

Examples of the different gene families regulated by n−3 fatty acids and their interaction.
Richard J Deckelbaum et al. Am J Clin Nutr 2006;83:S1520-
1525S
©2006 by American Society for Nutrition

Nutrient Status
• Essential fatty acid deficiency
– Heart disease, dyslipidemia, hypertension,
arrhythmia
– Metabolic disease: diabetes, obesity
– Neurocognitive disorders: dementia, depression,
bipolar disease, ADHD, intelligence (breast milk
and IQ), schizophrenia
– Immune disorders: autoimmune disorders, skin
disorders (eczema), asthma, cancer (prostate,
breast, colon, etc.)

Communication
• Communication (hormones, neurotransmitters and cell signaling) – Sex hormones: building block is cholesterol
– High fat diets increase testosterone and reduce estrogen in men
– High fat, low CHO diets reduce insulin, increase lean body mass, reduce fat mass and increase total T4
– Hibblen: n6 increase and n3 decrease increases depression, suicide, homicide and violence
– EFA: Role in depression, bipolar, dementia, ADHD, schizoprhenia

Immune Modulation
• Cytokine and eicosonoid pathways
regulated by fatty acids including ALA,
EPA/DHA, GLA, arachidonic acid, linolenic
acid
• Omega 6 GLA – role as anti-inflammatory
in autoimmune, eczema, etc.
• Omega 3 – anti-inflammatory eicosinoids


Detoxification
• NAFLD (fatty liver) affects 90 million in US
• Result of metabolic syndrome (high CHO and sugar diet)
• Dietary intervention with 70% corn oil (n6 PUFA) or 65% MCT oil (saturated fat)
• N6 PUFA increase fatty liver, and LFT’s
• MCT reversed fatty liver, reduced free radicals, increased fatty acid oxidation and PPAR activation and mitochondrial function

Assimilation (Gut & Microbiome)
• High n6 oils increase metabolic
endotoxemia through increase LPS and
effects of TNFalpha on insulin signaling
• High n3 oils reduce inflammation and do
not create endotoxemia

Energy and Mitochondrial
Function
• MCT’s and fatty acid oxidation
• Increases metabolism and energy
expenditure
• MCT absorbed directly from portal system
without having and directly metabolized
• Associated with improved body
composition and weight loss
• Increase sports performance

Structural Integrity
• Cell membranes
composition
• Essential fatty acids
• Phospholipids
• Eicosinoid
metabolism

All calories are
NOT created equal

Treatment Implications

Treatment Implications
• Reduce anabolic drive of visceral fat
• Reset neuro-hormonal responses to food
• Normalize brain chemistry and dopamine
receptor status to regulate appetite

Chicken or Egg?
New Hypothesis
• Diet quality (GL) affects fat storage
availability of metabolic fuels (high GL
drives sequestration of energy in fat)
• Leading to perceived deficit of metabolic
fuels to lower energy expenditure and
increase in energy intake

Reduce Anabolic Drive
• Dietary composition that favors oxidation
vs. substrate storage
• Diet composition vs. calorie or energy
balance
• Low glycemic, high micronutrient,
phytonutrient content

Reduce Anabolic Drive
• Omega 3 to trans fat ratios
• Saturated fat: are all created equal?
• Protein content (quality, nature of protein –
plant, animal, which animals)
• Lower inflammation (allergens,
obesogens, infections)

Reduce Anabolic Drive
• Microbiome treatments (pre and
probiotics) – fecal transplants
• Treatment of tissue insulin resistance
(omega 3 fatty acids, nutrients, exercise,
interval training)
• Mitochondrial support

Failure of Current Treatment Models
• Calorie restriction – Failure of Model
• Why it fails: Compensatory mechanisms
defend against weight loss by decreasing
energy expenditure and increasing appetite
• Calorie hypothesis: Flaws
– Multiple factors regulate metabolism
• Dietary composition, microbiome, toxins, infections,
allergens, nutrient status, mitochondrial dysfunction,
hormonal and neurotransmitter dysregulation, social

Are all calories equal?

Calories or Quality?
• Reductions in CVD with changes in fat composition
• DART, PREDIMED, GISSI trials
• Look Ahead – low fat, low calorie diet, no change in outcomes even with weight loss
• Diabetes reversal with high fat diets
• CHF reversal with high fat diets


How does dietary composition
affect hunger and metabolism?

Is Your Fat Hungry?

Hungry Fat?
Chicken or Egg?
Does being fat make you hungry
or being hungry make you fat?

Does Overeating Make You Fat?
• Being fat makes you overeat
• Visceral fat as anabolic driver of behavior
– BMJ 2013;346:f1050, J. Clin Invest 2011:121:4161-9
• Visceral fat biology
– Hormones (adiponectin, resistin, insulin,
leptin, MSH)
– Cytokines (IL-6, IL-1, TNF alpha, etc.)

67

Dietary Glycemic Index:
Reward and Cravings
• Lennerz BS, et.al, Effects of dietary
glycemic index on brain regions related
to reward and craving in men.
– Am J Clin Nutr. 2013 Sep;98(3):641-7.
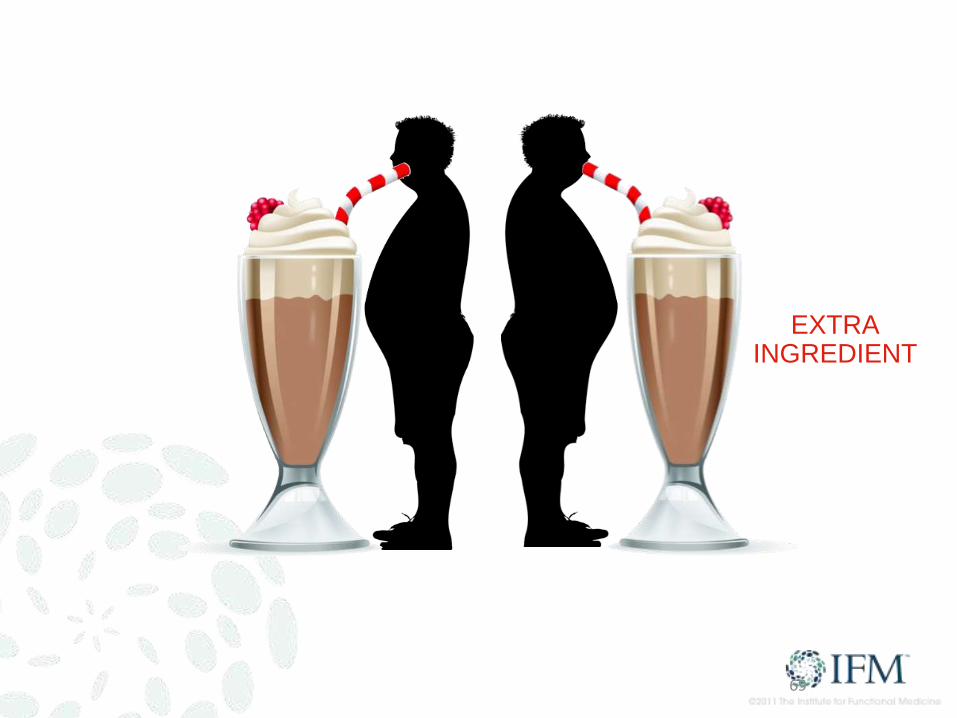
69
EXTRA INGREDIENT

70
Nucleus Accumbens


Overeating:
Cause or Effect?

Ludwig DS, Friedman MI. JAMA. Published online May 16, 2014.


Overeating: Cause or Effect
• Problem with Weight Loss
– Inability to voluntarily control food intake
– Can you change voluntary intake by controlling dietary composition?
– In environment of unrestricted refined sugar and CHO – partition toward fat deposition and excess hunger
– Calorie restriction antagonizes weight loss through biological adaptations decrease energy expenditure

Dietary Composition JAMA 2012; 307(24):2627-2634
• Cross over trial
• Iso-caloric low
fat/high glycemic
(60/20/20) vs. low GL
(40/40/20) vs. high fat
VLCD (10/60/30)

Dietary Composition
• Decrease in REE (resting energy
expenditure) greatest in low fat group
• Least decrease in REE in VLCD/high fat
• Overall difference of >300 kcal/day
• Low VLCD – most improvements in insulin
resistance, HDL,TG, PAI-1 lower, but CRP
higher (0.87 vs. 0.78)

Date of download: 5/16/2014 Copyright © 2014 American Medical
Association. All rights reserved.
From: Increasing Adiposity: Consequence or Cause of Overeating?
JAMA. 2014;():. doi:10.1001/jama.2014.4133
Prevailing and Alternative Models of Obesity
Figure Legend:
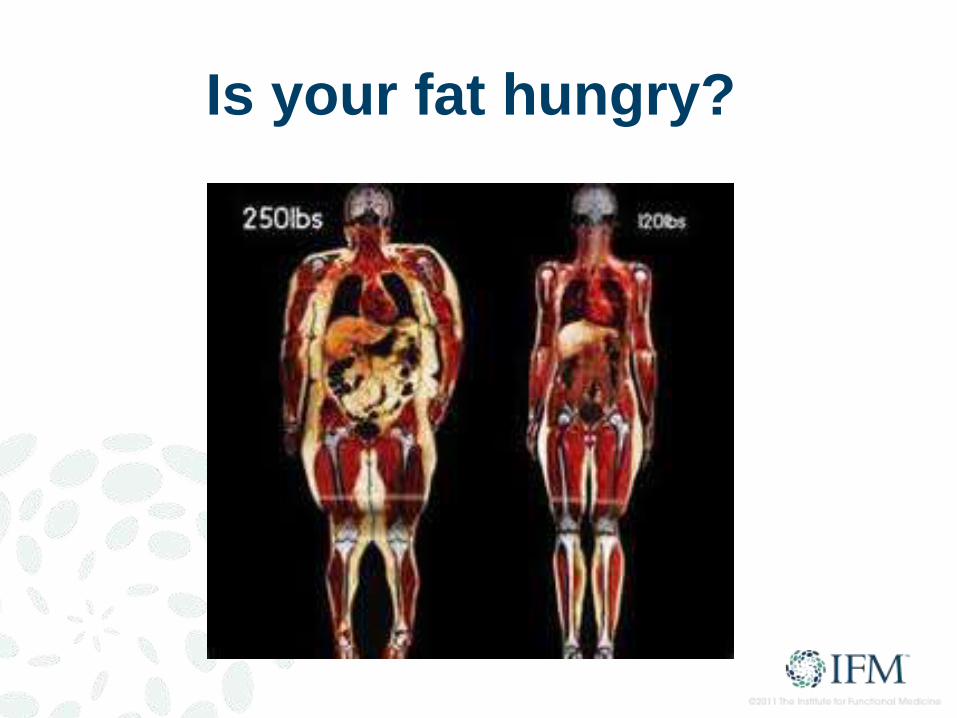
Is your fat hungry?

Metabolic Fuels & Appetite PloS ONE 2013;8:e58172
• Availability of metabolic fuels regulates
hunger and food intake
• Glucose, non-esterified fatty acids and
ketones
• Tightly controlled at 4-6 kcal/L
• Insulin decreases metabolic fuel
availability

Dietary Composition,
Metabolic Fuels & Appetite PloS ONE 2013;8:e58172
• Iso-caloric LF, LGI and VLC diets
randomized crossover design for 4 weeks
• Measured energy availability (EA)
(glucose, FFA, b-OH-butyrate or ketones)
• Low fat diet – lower EA and metabolic rate
• VLC had highest EA and metabolic rate


Role of Insulin Int J Obes Relat Metab Disord 1992:16 Supple 4:S1-11
• Insulin is anabolic hormone
• Drives circulating fuel into storage
• Stimulates lipogenesis (fat storage)
• Inhibits lipolysis (fat burning)
• Insulin treatment increases weight gain in
humans and animals

Dietary Composition vs. Calories Lancet 2004;364:778-85
• Changes in dietary composition produce
obesity in genetically normal animals independent of calorie intake
• Rats fed to maintain identical body weight developed 70% more body fat on high GL vs. low GL diet
• High GL diet results in lower muscle muscle mass despite lower calorie intake
• High GL fed animals develop hyperphagia after onset of hyperinsulinemia


Dietary Composition: Ketogenic Diet
Am J Physiol Endocrinol Metab. 2007 Jun;292(6):E1724-39.
• Body weight decreased on rats with
isocaloric diets that were low GL –
improved hepatic gene expression that
favors catabolism
• Excessive fat deposition driven by high GL
diet precedes and promotes hyperphagia
• Overeating driven by loss of metabolic
fuels sequestered in adipose tissue

Dietary Composition vs. Calories
• High GL Food - Intensifies reward value of
food leading to hedonic eating
• Mild low blood sugar triggers craving
• Palatability of food?
– Quality of food or your biochemistry?
• Anabolic changes in adipose tissue
precede overeating

Calorie Restriction: Effects
• Calorie restricted diets exacerbate
metabolic dysfunction leading to more
overeating
• Decline in energy expenditure and
increase in hunger – triggers starvation
response

Weight Loss: Solution?
Negative Energy Balance
or
Lower Anabolic Drive

Lower Anabolic Drive
Automatic WEIGHT LOSS!
Automatically Increases
Energy Expenditure
Automatically Decreases
Voluntary Food Intake

People have more control over
WHAT they eat than HOW
much they eat

Willpower?
Why do we crave?

Willpower or
Metabolic State of Fat

Fat and Heart Disease
Saturated Fats?
Omega 6 PUFA’s
Omega 3 PUFA’s
Total Fat Heart Disease

Evidence on Total Fat
• PREDIMED study
– 7000 people RCT at risk for MI
– Control group low fat
– Treatment group – 1 L or 4 TBSP (500 calories of olive oil or 30 grams of nuts
daily
– 30% risk reduction in MI independent of calories or weight loss
– Study ended after 4.8 years
• Lyon Heart Study - RCT
– Higher omega 3 and lower omega 6 fats
– 73% reduction in MI
• WHI – RCT 49,000 women
– No evidence of CVD risk reduction on low fat diet despite reductions in LDL
cholesterol
• MRFIT Trial - largest RCT
– No evidence of CVD risk reduction with lower total fat or saturated fat
• Nurses Health Study – Observational 80,000 women over 20 years
– No link between total or saturated fat consumption

Evidence on Fat and CVD
• Cochrane Collaborative: no correlation
with fat and CVD
• Physicians Health Study 1996:
– observational study 43,000 men no link
between total or saturated fat and CVD
– link to high sugar and low fiber diets and low
omega 3 fat
– If controlled for fiber no link with saturated fat

2015 US Dietary Guidelines
• No restriction on total fat
• Cholesterol: no longer nutrient of concern
• Reduce sugar to 25 grams (6 teaspoons)

Saturated Fat?
Villain?
Benign?
Health promoting?

Evidence on Saturated Fat
• small controlled trial 264 men who had
heart attacks no benefit reducing heart
attacks or death
• the low fat group ate less 1/3 less fat, 500
less calorie per day and achieved a lower
cholesterol and weight than the control
group.

Saturated Fat and CVD
• Meta-analysis 72 studies, > 600,000 people from 19 countries
• RCT’s, observational studies, measurement of plasma fatty acids
• Blood saturated fats – Even chain palmitic and stearic associated with CVD
– Produced from CHO and sugar through lipogenesis and not impacted by dietary saturated fat
– Odd chain margaric (from dairy) assocated with reduction in CVD
• Omega 6 PUFA’s – No benefit and trend toward increased risk of CVD
– AA (arachidonic acid) from eggs, poultry and beef showed reduced rik
• Omega 3 fats were protective
• Trans Fats increased risk
• Conclusions: Current evidence does not clearly support cardiovascular guidelines that encourage high consumption of polyunsaturated fatty acids and low consumption of total saturated fats.”

Saturated Fat?
• Meta-analysis 21 studies of 350,000 people over 23 years
• No increased risk of CVD from saturated fat
• RCTs: Review of all data up to 1983 before dietary guidelines established on fat found no link between saturated fat and CVD
• Risk only found with omega 3 deficiency
• Post prandial lipids only adversely affected in face of low omega 3’s

Saturated Fat
Feeding Studies • VLCD (12%), High fat (either high n6 PUFA or
saturated fats 86 grams)
• 8 men over 6 weeks
• Assessed plasma lipids, cholesterol profile, inflammation
• Doubling dietary intake of saturated fat had no impact on plasma saturated fat
• Lowest inflammation in the high saturated fat group and lower oxidative stress
• Lower insulin, triglycerides and more large LDL particles

CHO and Saturated Fat
• Adverse effects of Sweet Fat
• Promotes atherogenic lipids profile in
context of a high CHO diet

Saturated Fat and Inflammation
• Inflammation occurs only in the context of refined CHO and sugar (sweet fat)
• And in context of low omega 3 fats
• With adequate omega 3’s saturated fats lower triglycerides, increase HDL and increase large LDL particles
• High fat diet 55% with 25% saturated fat no impact on inflammatory markers or oxidative stress

Fatty Liver & Inflammation
• Dietary saturated fats (MCT oil) reverse
fibrotic fatty liver in rats (n6 PUFA did not
show same results)
• Reversal occurred despite continued
ethanol intake
Cholesterol and Heart
Disease

Statins:
When Are They Indicated?


Statins
• 1998 to 2002 statin use tripled in Sweden – No impact on CVD
• 541 hospitals, 231,836 admissions for heart attack equaled 59% of all MI’s in the USA
• 75% had normal LDL (under 130mg/dl) and 50% had optimal levels (under 100 mg/dl) and 17% had levels under 70 mg/dl)
• Average HDL was 39 mg/dl and average triglycerides 161mg/dl
• 54% had HDL under 40 mg/dl and only 10% had HDL levels over 60 mg/dl

Statins: Primary Prevention?
• Primary Prevention? Cochrane Data 2011
• Selective reporting and not reporting bad
outcomes or side effects
• Included those who had heart attacks
• “caution should be taken in prescribing
statins for primary prevention”
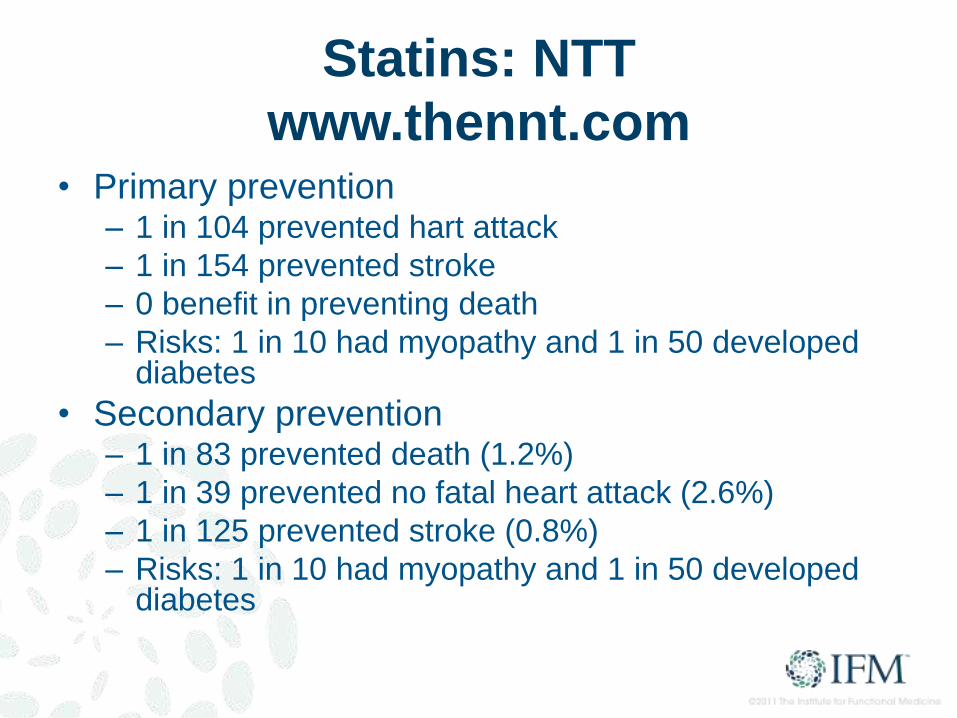
Statins: NTT
www.thennt.com • Primary prevention
– 1 in 104 prevented hart attack
– 1 in 154 prevented stroke
– 0 benefit in preventing death
– Risks: 1 in 10 had myopathy and 1 in 50 developed diabetes
• Secondary prevention – 1 in 83 prevented death (1.2%)
– 1 in 39 prevented no fatal heart attack (2.6%)
– 1 in 125 prevented stroke (0.8%)
– Risks: 1 in 10 had myopathy and 1 in 50 developed diabetes

“Virtually all of the major statin studies were
paid for and conducted by their respective
pharmaceutical company. A long history of
misrepresentation of data and occasionally
fraudulent reporting of data suggests that these
results are often much more optimistic than
subsequent data produced by researchers and
parties that do not have a financial stake in the
results. Also, harm from these drugs is difficult
to predict, partly because harms are often
difficult to anticipate and are often poorly
tracked. Such findings often come up years
after new drugs have been on the market.”

Shaky Evidence: Statins
• Low (LDL) with low HDL (good cholesterol) no benefit to statins.
• Lower (LDL) without reduction in inflammation ( C-reactive protein), no benefit to statins.
• Healthy women with high cholesterol, no evidence statins reduces risk of heart attack or death.
• Men or women over 69 years old with high cholesterol, there is no proof statins reduce risk of heart attack or death.
• Aggressive cholesterol treatment with two medications (Zocor and Zetia) lowered cholesterol much more than one drug alone, but led to more plaque build up in the arteries and no fewer heart attacks.
• Older patients with lower cholesterol higher risks of death than those with higher cholesterol.
• Countries with higher average cholesterol than Americans such as the Swiss or Spanish have less heart disease.

Statins?
• Evidence shows statins ability to lower inflammation accounts for the benefits of statins, not their ability to lower cholesterol.
• 20 percent of people who take statins have side effects including muscle damage and pain, neurologic problems, memory issues, sexual dysfunction and more.
• Statins linked to higher risk of diabetes.
• 26,000 healthy people, statins users had an 87 percent increased risk of getting type 2 diabetes.
• In RCT WHI, 153,840 women, statins users had 48% increased risk of type 2 diabetes.

True Causes of CVD
• Insulin resistance (75% of admissions for MI) – Atherogenic lipid profile (low HDL, high TG, small LDL particles)
– NMR (Labcorp) or Ion Mobility (Quest)
– 2 hour insulin/glucose tolerance test and HbA1c
• Inflammation (elevated CRP): Jupiter Trial – All those at risk were those with small LDL and inflammation (liked by
insulin resistance)
– Large LDL (even when elevated in absence of inflammation) didn’t lead to CVD)
• Homocysteine
• Environmental toxins (metals, POP’s)
• Oxidative Stress
• Smoking
• Sedentary lifestyle
• Hypertension (secondary to insulin resistance and OSA)

Omega 6 PUFA’s
Friend or Foe?


Omega 6 Fat Facts
• 20 percent of calories from soybean oil
(10% linoleic acid)
• 18 billion pounds per year consumed
• GMO (Round Up Ready and Glyphosate)

Linoleic Acid Data?
• Lowers LDL
• Increases LDL oxidation (OXLAM’s)
• Increase inflammation
• Cancer promotion?


Joseph Hibblen (NIH)
• Excess omega 6 and
reduction in omega 3
lead to increases in
CVD, type 2 DM,
obesity, IBS and IBD,
psychiatric disorders,
autoimmune disease
and cancer

Psychiatric Effects
High Omega 6 and Low Omega 3
• 1960 to 1999 increase of LA (from
soybean oil) predicted 100 fold increase in
homicide deaths.
• Also linked to aggression, depression,
suicide

Ramsden & Hibblen
• Two large investigative reviews
• In studies that included n3 and n6 there was 27% reduction in CVD events and mortality
• In studies with only omega 6 fats there was a 13% increase in mortality
• RCT’s that used n6 alone while reducing saturated fat and trans fat also showed increase in death
• Most studies didn’t distinguish different PUFA’s (n6 or n3)
• Previous analyses omitted key data

Holes in Omega 6 PUFA Story
• Lyon Heart Study – Reduction in n6 with increase in n3
– 70+% reduction in CVD
• Oslo Heart Study – Substituted meat and eggs for fish, shellfish and whalebeef (all
rich sources of omega 3)
– Bread spread (sardines) (equiv of 16 fish oil pills or 5 X GISSI trial with 40% reduction in CVD and 20% reduction in total deaths
• Minnesota Coronary Survey – 4393 men and 4663 women
– Only increased n6 not n3
– Women double risk of MI in first year
• Other data shows at 4.64 increase risk of MI with n6

Sydney Heart Trial
• RCT 1966 to 1973
• Safflower increase to 15% of calories (including soft margarine with some trans fats which both groups had)
• Reduction in saturated fat to less than 10% and cholesterol less than 300 mg a day
• N6 group had 37% increase in heart attacks despite lowering cholesterol

Omega 6: Other Risks
• OXLAMs – Oxidized LDL
• Heat damage
• Solvents
• Dysbiosis – metabolic endotoxemia
• GMO soybeans: Glyphosate residue

Opposing View
• Review by Willet, et.
Al found benefit to
replacing SFA with
PUFA’s
• Not clear if
combination or just n6
•

Food Controversies
Eggs
Butter
Coconut Oil

Meat: To Eat or Not To Eat?

Quality of Research
• Mostly limited to observational studies
• Multiple confounding factors
• Biological plausibility? TMAO
• Historical context:
• Plains Indians: highest per capital
centenarians in history
• Seventh Day Adventists?

Meat Research
• Observational nutritional studies
• Food frequency questionnaires
• Nature of population: Meat eater
characteristics – unhealthy habits
• Healthy user effect (meat seen as bad so
health conscious people at less)

Healthy Meat Eaters?
• Healthy meat eaters vs. vegetarians
• 11,000 people (57% omnivores and 43%
vegetarians who shopped at health food
stores
• Overall death rates cut in half
• No difference between meat eaters or
vegetarians

Meat Studies
• NIH-AARP Diet and Health Study
• 500,000 people higher risk of CVD, cancer and death
• Meat eaters: smoked more, weight more, consumed 800 more calories/day, exercised less, ate more sugar, drank more alcohol and ate fewer fruits and veggies and took fewer vitamins
• CAFO meat’s vs. grass fed meat
– Antibiotics, hormones, pesticides, more omega 6

Negative Meat Studies
• EPIC study of 500,000 found no association with unprocessed fresh meat and heart disease cancer or death, but association found with processed meat
• 1.2 million meta-analysis: no link between red meat and CVD, diabetes or stroke.
• 65,000 meat eaters with overall healthy diet – no increase risk of CVD or death
• Asian study: 300,000 with increased meat in context of healthy baseline diet, red meat associated with decrease in heart disease and cancer

Meat Myths
• Saturated fat in meat does not raise blood
cholesterol (mostly neutral stearic acid)

Paleolithic Diet RCT’s
• Australian Aboriginal Study
– Converting to wild meat and wild diet from
western diet reversed diabetes, HTN and
lipids abnormalities
• Feeding Studies: Paleo diets better
outcomes for weight, body fat, muscle
mass, metabolic rate, triglycerides, HDL,
large LDL, blood pressure

Diabetes and Meat
• Observational data: 400,000
• 50 gram serving of processed meat (hot dogs, deli meat) increased risk by 51%
• 50 gram serving fresh meat increased risk by 20%
• Relative vs. absolute risk
– Fresh meat: absolute risk 7% to 8.4% risk of diabetes
• Meat eater: unhealthy group
• Paleo Diet intervention trials reverse type 2 diabetes

TMAO and Heart Disease
• Trimethylamine-N-oxide (TMAO)
• Produced by dysbiotic bacteria from carnitine (meat), choline (eggs) and lecithin (soy)
• Highest concentrations of TMAO in fish (with lower risks of CVD?)
• Vegetarians who ate steak showed no increase in TMAO
• Antibiotic use prevented TMAO increase after meat consumption

Red Meat and Cancer
• WHO Review IARC ?
– Processed meat yes
– Red meat: maybe – dissent on committee (where usually consensus)
– Degree of risk base line risk calculator • i.e. 2.4 % risk to 3.2% risk with intake
• Absolute vs. relative risk?
• Review of 35 prospective studies on colon cancer and meat little risk
• Cooking techniques: PAH, HCA, AGE’s

Grass Fed vs. CAFO Meat
• CAFO – Antibiotics, hormones, pesticides
– Ethical treatment of animals
– 1/5 of greenhouse gases (methane)
• Grass fed beef – Environmental factors: restorative grazing
– Health benefits: lower omega 6 fats, 2-5x omega 3 fats (ratio 7.5:1 vs. 1.5 to 1), more stearic acid, more antioxidants, CLA (conjugated linoleic acid) with CVD, weight and cancer benefits
– More vitamin E, beta carotene, vitamin A, zinc, iron, phosphorous and potassium

Eggs?

Coconut Oil?

Meat Issues
• Saturated fat
• Inflammation
• Cancer risk?
• Diabetes risk?
• TMAO production (dysbiosis)
• Polycyclic aromatic hydrocarbons and
heterocyclic amines, advanced glycation
end products

Fat: Other Health Benefits

What to Eat?
The Pegan Diet?

The Pegan Diet
• Very low glycemic load
• Very high in vegetables and fruit
• Low or no pesticides, antibiotics or hormones
• Very few to no chemicals, additives, preservatives and GMO foods
• Higher in good quality fats: omega 3, olive oil, nuts and seeds
• Low in refined omega 6 oils (soy, safflower, etc.
• Adequate protein (vegetable or animal?)
• Ideally organic, whole, fresh, local
• Animal food: sustainably and humanely raised (grass fed, etc.)
• Fish: low mercury fish, sustainable fisheries and farmed fish

Areas of Controversy
• Dairy
• Grains
• Beans
• Meat
• Eggs


PHYTONUTRIENTS & ANTIOXIDANTS

Daniel and Rebecca • Daniel’s Story: 340 lbs • Rheumatoid arthritis,
chronic fatigue & pain, muscle pain, headaches, allergies, high blood pressure & cholesterol, low testosterone
• Perocet & Energy Drinks
• 15 medications • Toxicity Score: 152

Daniel and Rebecca • Rebecca’s Story • 232 lbs • Yo-yo diets • South Beach, Weight
Watcher’s, Liquid fasts, diet pills

Daniel and Rebecca • On The Daniel Plan Detox
• Daniel lost 110 lbs • Toxicity Score from 152 to
52 in 40 days • Lab tests all normal! • NO medications except
preventive aspirin and vitamins
• Rebecca lost 58 lbs


If you want to travel swiftly,
travel alone.
If you want to travel far,
travel together.
African Proverb
