the silicon photovoltaic roadmap - stanford universitythe silicon photovoltaic roadmap ... this...
TRANSCRIPT

© 2011 SunPower Corp.
The Stanford Energy Seminar November 14, 2011
Dick Swanson
President Emeritus, SunPower
The Silicon Photovoltaic Roadmap

© 2011 SunPower Corp. 2
Safe Harbor Statement
This presentation contains forward-looking statements within the meaning of the Private Securities litigation Reform Act of 1995. Forward-looking statements
are statements that do not represent historical facts and may be based on underlying assumptions. SunPower uses words and phrases such as “may,” “will,”
“should,” “could,” “would,” “expect,” “plan,” “anticipate,” “believe,” “estimate,” “predict,” “potential,” “continue,” “guided” and similar words and phrases to
identify forward-looking statements in this presentation, including forward-looking statements regarding: (a) plans and expectations regarding future financial
results, operating results, liquidity, cash flows, capital expenditure and business strategies, (b) management’s plans and objectives for future operations, (c)
the company’s projected costs, drivers of cost reduction and cost reduction roadmap, (d) forecasted demand growth in the solar industry, and projected
bookings and pipelines, (e) project construction, completion, ability to obtain financing, sale and revenue recognition timing, (f) growth in dealer partners, (g)
product development, advantages of new products, and competitive positioning, (h) manufacturing ramp plan, scalability and expected savings, (i) future
solar and traditional electricity rates and cost savings of SunPower systems, (j) trends and growth in the solar industry, and (k) the success and benefits of
our joint ventures, acquisitions and partnerships. Such forward-looking statements are based on information available to SunPower as of the date of this
presentation and involve a number of risks and uncertainties, some beyond SunPower’s control, that could cause actual results to differ materially from those
anticipated by these forward-looking statements, including risks and uncertainties such as (i) ability to achieve the expected benefits from our relationship
with Total; (ii) the impact of regulatory changes and the continuation of governmental and related economic incentives promoting the use of solar power, and
the impact of such changes on revenues, financial results, and any potential impairments to intangible assets, project assets, and goodwill; (iii) increasing
competition in the industry and lower average selling prices, and any revaluation of inventory as a result of decreasing ASP or reduced demand; (iv) ability to
obtain and maintain an adequate supply of raw materials, components, and solar panels, as well as the price it pays for such items; (v) general business and
economic conditions, including seasonality of the solar industry and growth trends in the solar industry; (vi) ability to revise its portfolio allocation
geographically and across downstream channels to respond to regulatory changes; (vii) ability to increase or sustain its growth rate; (viii) construction
difficulties or potential delays, including obtaining land use rights, permits, license, other governmental approvals, and transmission access and upgrades,
and any litigation relating thereto; (ix) ability to meet all conditions for obtaining the DOE loan guarantee and any litigation relating to the CVSR project; (x) the
significant investment required to construct power plants and ability to sell or otherwise monetize power plants; (xi) fluctuations in operating results and its
unpredictability, especially revenues from the UPP segment or in response to regulatory changes; (xii) the availability of financing arrangements for projects
and customers; (xiii) potential difficulties associated with operating the joint venture with AUO and achieving the anticipated synergies and manufacturing
benefits; (xiv) ability to remain competitive in its product offering, obtain premium pricing while continuing to reduce costs and achieve lower targeted cost per
watt; (xv) liquidity, substantial indebtedness, and its ability to obtain additional financing; (xvi) manufacturing difficulties that could arise; (xvii) the success of
research and development efforts and the acceptance of new products and services; (xviii) ability to protect its intellectual property; (xix) exposure to foreign
exchange, credit and interest rate risk; (xx) possible impairment of goodwill; (xxi) possible consolidation of the joint venture AUO SunPower; and (xxii) other
risks described in SunPower’s Annual Report on Form 10-K for the year ended January 2, 2011, Quarterly Reports on Form 10-Q for the quarters ended July
3, 2011 and other filings with the Securities and Exchange Commission. These forward-looking statements should not be relied upon as representing
SunPower’s views as of any subsequent date, and SunPower is under no obligation to, and expressly disclaims any responsibility to, update or alter its
forward-looking statements, whether as a result of new information, future events or otherwise.

© 2011 SunPower Corp.
SunPower 2011
3
Commercial Power Plants Residential
2010: Revenue $2.23B
5,500+ Employees
World-leading solar conversion efficiency
1,500 dealer partners, #1 R&C USA
Diversified portfolio: roofs to power plants
550+ MW 2010 production
>1.5 GW solar PV deployed 5 GW power plant pipeline

© 2011 SunPower Corp.
SunPower vs. Conventional c-Si Cell
4
Lightly doped front diffusion
• Reduces recombination loss Texture + ARC
Backside Mirror
• Reduces back light
absorption & causes
light trapping
Localized Contacts
• Reduces contact
recombination loss
Backside Gridlines
• Eliminates shadowing
• High-coverage metal
reduces resistance loss
.
.
Passivating
SiO2 layer
• Reduces surface
recombination loss
FRONT
BACK
Silver Paste Pad Aluminum
paste
Texture + ARC Gridlines N-Type
diffused
junction
.
.

© 2011 SunPower Corp. 5
Alamosa 19 MW: Xcel
Alamosa County, CO

© 2011 SunPower Corp.
Swiss Alps Alpine Hut
6
©
201
0
Sun
Pow
er
Corp
orati
on

© 2011 SunPower Corp.
Talk Outline
Where we have come from in PV
Where we are now
Where we are going
How we are going to get there
7

© 2011 SunPower Corp.
Situation in 1975
$300/kg
3 inches in diameter
Sawn one at a time
0.5 watts each
$100/watt
$200/watt
Wafered Silicon Process
Polysilicon Wafer Solar Cell Solar Module Systems Ingot

© 2011 SunPower Corp.
Japanese PV
rooftop program
German
FiT
California
Solar
Initiative
Ronald
Reagan

© 2011 SunPower Corp.
Historical PV Learning Curve (ca. 2002)
10
2002
$3.65/W

© 2011 SunPower Corp.
Actual Results through 2008
11
©
200
9
Sun
Pow
er
Cor
p.

© 2011 SunPower Corp.
Comparison to Actual
12
After Silicon Shortage

© 2011 SunPower Corp.
If the original learning curve were followed, consumers would have spent $83B to get to 40GW of cumulative modules
13
$83B

© 2011 SunPower Corp.
Consumers actually spent $17B (20%) more (0.43/W)
14
$83B
$17B

© 2011 SunPower Corp.
Zooming in on Recent Times

© 2011 SunPower Corp. 16
PV Power Plants Are Cost Competitive Today
0 50 75 100 150 200 250 300 350 400
Levelized Cost ($/MWh)
Renewables
Conventional
$73 ground – 192 roof
$120 - 198
$38 - 79
$211- 242
$69-97
Gas Peaking
Gas CC
Wind
Solar Thermal
Solar PV
2012 LCOE by Resource $/MWh: 2010 USD
Prices include federal incentives
Source: Lazard Capital Markets 6/2011
$77-113 Nuclear
$70-152 Coal
$164 off-shore

© 2011 SunPower Corp. 17
Not as Pretty Without ITC
0 50 75 100 150 200 250 300 350 400
Levelized Cost ($/MWh)
Renewables
Conventional
$104 ground – 274 roof
$171 - 283
$54 - 113
$211- 242
$69-97
Gas Peaking
Gas CC
Wind
Solar Thermal
Solar PV
2012 LCOE by Resource $/MWh: 2010 USD
Prices include federal incentives
Source: Lazard Capital Markets 6/2011
$77-113 Nuclear
$70-152 Coal
$234 off-shore

© 2011 SunPower Corp.
Regional PV Market
18
Source: EPIA

© 2011 SunPower Corp.
4.2 GW PV in 2009…10+ GW in 2010
19
Source: EWEA, February 2010
European 2009 New Installed and Retired Capacity (MW)

© 2011 SunPower Corp.
German Feed-in Tariff will be less than retail in 2012!
20
Source: Deutsche Bank

© 2011 SunPower Corp.
Schleicher-Tappeser (Jan 2011)
21

PAST COST PROJECTIONS CAME TRUE

© 2011 SunPower Corp.
2002 NREL Workshop Wafer Thickness Roadmap
23
0
50
100
150
200
250
300
350
2002 2004 2006 2008 2010 2012
Wafe
r T
hic
kn
ess (
um
)
SunPower Actuals

© 2011 SunPower Corp.
2002 NREL Workshop Module Manuf. Cost Roadmap ($2002)
24
0.00
0.50
1.00
1.50
2.00
2.50
3.00
2002 2004 2006 2008 2010 2012
Year
Mo
du
le C
os
t ($
/W)
Mc-Si
CZ-Si
2012
$1.00/W
2010 Actual
(2002$)

© 2011 SunPower Corp.
Slide from 2006
25
Silicon Roadmap Cost
1
10
100
1 10 100 1,000 10,000 100,000
Cumulative Production (MW)
Mo
du
le P
rice (
$/W
) ($
2002)
Historical
Projected
1980
$21.83/W
1990
$6.07/W2000
$3.89/W
2010
$1.82/W
2013
$1.44/W2002 Roadmap
Incremental Improvements in Silicon Technology will Continue to
Drive Solar Panel Price Reduction
Retail Parity
2010 Actual
$1.81/W

© 2011 SunPower Corp.
SunPower UPP LCOE Competitive with CA MPR
26
$/kWh
Notes: LCOE = delivered electricity price to utility via PPA; MPR=25-yr Market Price Referent , 30% ITC /MACRS included
unlevered return range for plant owner 7.5%-8.5%, sunlight range included
CA 2009 MPR
711MW SunPower PPA at or below CA MPR
© 2011 SunPower Corp.
End of
ITC, 2016

© 2011 SunPower Corp.
Schleicher-Tappeser (Jan 2011)
27

HOW DO WE GO FORWARD?

© 2011 SunPower Corp.
Conventional Wafered Silicon Value Chain:
29
Wafer Solar Cell Solar Panel System Ingot Polysilicon
Rough percentages for conventional c-Si:
12% 6% 9% 14% 34% 25%
41% 59%
Total Cost: $2.63/Wac

© 2011 SunPower Corp.
SunPower cell efficiency history
30
2005 2006 2007 2008
Ce
ll E
ffic
ien
cy (
%)
2004 2003
20%
21%
22%
23%
24%
25%
20.6%
22.0%
23.4%
20.6%
22.4%
Laboratory Prototyping Results
Production median
2009 2010
24.2%
Gen 1
Gen 2
Gen 3
©
201
0
Sun
Pow
er
Corp
orati
on

© 2011 SunPower Corp.
Generation 3 Modules Status – 20.9%
31
Module Area Voc Isc FF Pmax η
(m2) (V) (A) (%) (W) (%)
96-Cell Module 1.63 69.02 6.38 77.4 341W 20.9%*
Engineering scale production of Generation 3
Module performance continues to improve
96-Cell module presently achieving 20.9%*
*Unconfirmed

© 2011 SunPower Corp.
Cost Reduction: Silicon Utilization SunPower’s Cell Ideal for Thin Silicon
32
20
21
22
23
24
25
0 50 100 150
Effi
cie
ncy
(%)
Wafer Thickness(um)
SunPower’s cell architecture maintains performance as
silicon thickness reduces

© 2011 SunPower Corp.
Intrinsic cost of silicon ingot is not an issue
33
Ingot cost Silicon use
Today $100/kg 5g/W* $0.50/W
Possible $50/kg 1g/W** $0.05/W
*Approximate SunPower today
**100 um thick, 23% cell, kerfless wafering

© 2011 SunPower Corp.
2014 SunPower Panel Cost Reduction Roadmap
34
Fab 3 Ramp
135 um wafers
Lean Fab Mngt
Material Red’n
Step Red’n
DW Sawing
Gen 3 Ramp
$/W
$1.00

© 2011 SunPower Corp.
Next Steps: Glass superstrates????
High Efficiency
SunPower Cell
+ 23%
Si – n-type
Passivated
Contacts
Front Surface Field
PassivationOptimized Diffusion & SiNx
Rear DielectricOptimized for Passivation
High Lifetime Silicon
Point Contacts Small Contacts through DielectricRear Mirror
Excellent Light trapping
Glass
Less than 100 µm thick

© 2011 SunPower Corp.
Technology Development central to Cost Roadmap
$0.6/W c-Si Module is conceivable
25% cell performance practical
Optimized process sequence
– Back-contact process is immature (< 8 yrs old)
New process-steps and materials
Reduced Silicon Usage
Ultra-thin Wafers (<100um), reduced Kerf or Kerfless
No end in sight for learning curve for c-Si back contact solar cells
$3.01
$2.38
$1.97
$1.78
$0.60
?
$-
$0.50
$1.00
$1.50
$2.00
$2.50
$3.00
$3.50
$1.00

© 2011 SunPower Corp.
DOE Sunshot Goal: Make PV the lowest cost electric energy option
37

© 2011 SunPower Corp. 38
Now
2017
Source:
DOE $1/W
Whitepaper
Value of 24%
Efficiency plus
Tracking

© 2011 SunPower Corp. 39
Key Activities:
Continuous Cz ingot growth
Low-oxygen, high-lifetime material
Development of hot zone for N-type material
FBR polysilicon process development and implementation
Crucible durability
Participants:
Solaicx, Santa Clara, CA
Solaicx Continuous Ingot Growth

© 2011 SunPower Corp. 001-17628 Rev **
40
SiGen Direct Cleave Process
Direct Cleave
Process Cleaved Wafers
Silicon
Ingot
Same material
2X to 3X more wafers
Kerf-Free 50 μm c-Si wafer
• c-Si lifetime
• Excellent Edges/Surface
• High strength
© 2011 SunPower Corp.
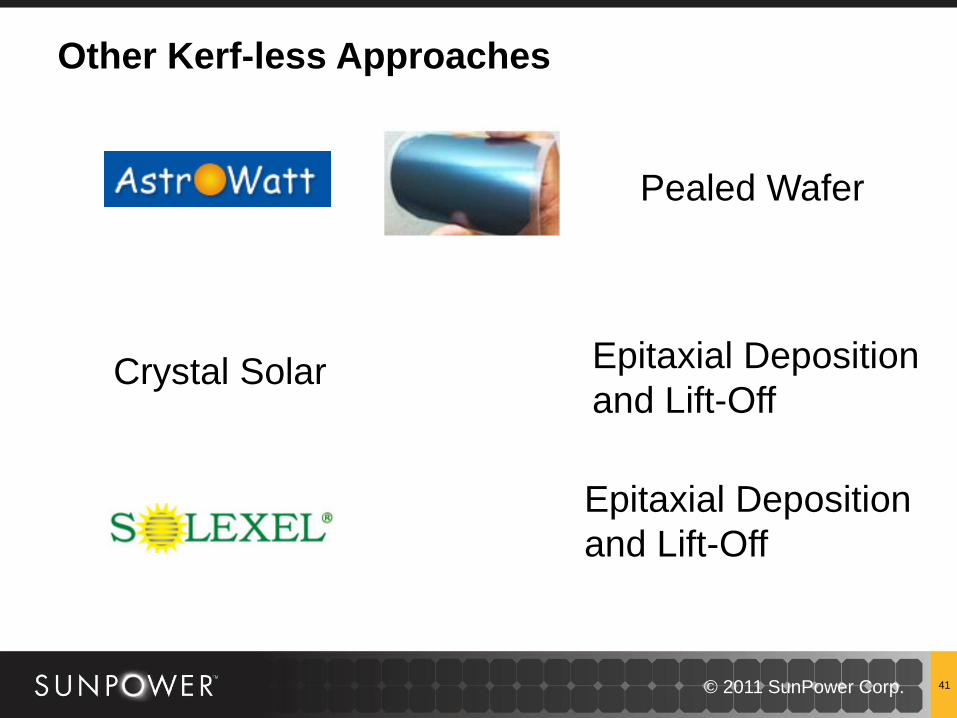
Other Kerf-less Approaches
41
Pealed Wafer
Epitaxial Deposition
and Lift-Off
Epitaxial Deposition
and Lift-Off
Crystal Solar

© 2011 SunPower Corp.
BOS innovation is equally important
42
Source:
DOE $1/W
Whitepaper

WHAT CAN STOP US, AND WHAT CAN YOU DO?

© 2011 SunPower Corp. 44

© 2011 SunPower Corp. 45
“A brutal, brilliant exploration…unsentimental, unsparing, and
impassioned…[P]recisely the kind of journalism we need to
hold truth to power.”
--Wall Street Journal
“Should be mandatory reading for U.S. policymakers”
--National Review

© 2011 SunPower Corp.
Myths you must refute
PV is too small to matter…and always will be
PV is too expensive…and will require massive subsidies
PV takes up too much valuable land
PV will make grid unstable
Green jobs are a myth
46

THANK YOU