the sharpsburg, kentucky earthquake of …forward the sharpsburg, kentucky earthquake of july 27,...
TRANSCRIPT

NSF/CEE-82002
l'B82-24b7~4
THE SHARPSBURG, KENTUCKY EARTHQUAKE
OF JULY ~7, 1980


FORWARD
The Sharpsburg, Kentucky earthquake of July 27, 1980,
with a mbLg magnitude of 5~ and a MS magnitude of 4.9, was
generated by a predominately right-lateral strike-slip motion
orientated in a N300E direction, and caused damages on the
order of $4,000,000. The earthquake is an important event in
the effort of quantify eastern North American (i.e., that area
east of the Rocky Mountains) seismicity because it took place
in an area where most researchers did not expect an earthquake
of such magnitude, and because the quantity and quality of the
noninstrumental and instrumental data is such that this earth-
quake is by far the most thoroughly studied and documented
earthquake to date, in eastern North America.
This report consists of two sections. The first section
contains a detailed report on the effects of the earthquake
within the 3,600 km 2 designated meizoseismal area. The second
section discusses the surface-wave, P-wave first motion, and
teleseismic data used to derive a focal mechanism, as well as
a discussion on the detailed aftershock study which most impor
tantly identified the N300E striking nodal plane of the derived
focal mechanism as the rupture plane of the main shock.
Any opinions, findings, conclusions or recommendations expressed in this publication are those of the author(s) and do not necessarily reflect the views of the National Science Foundation.

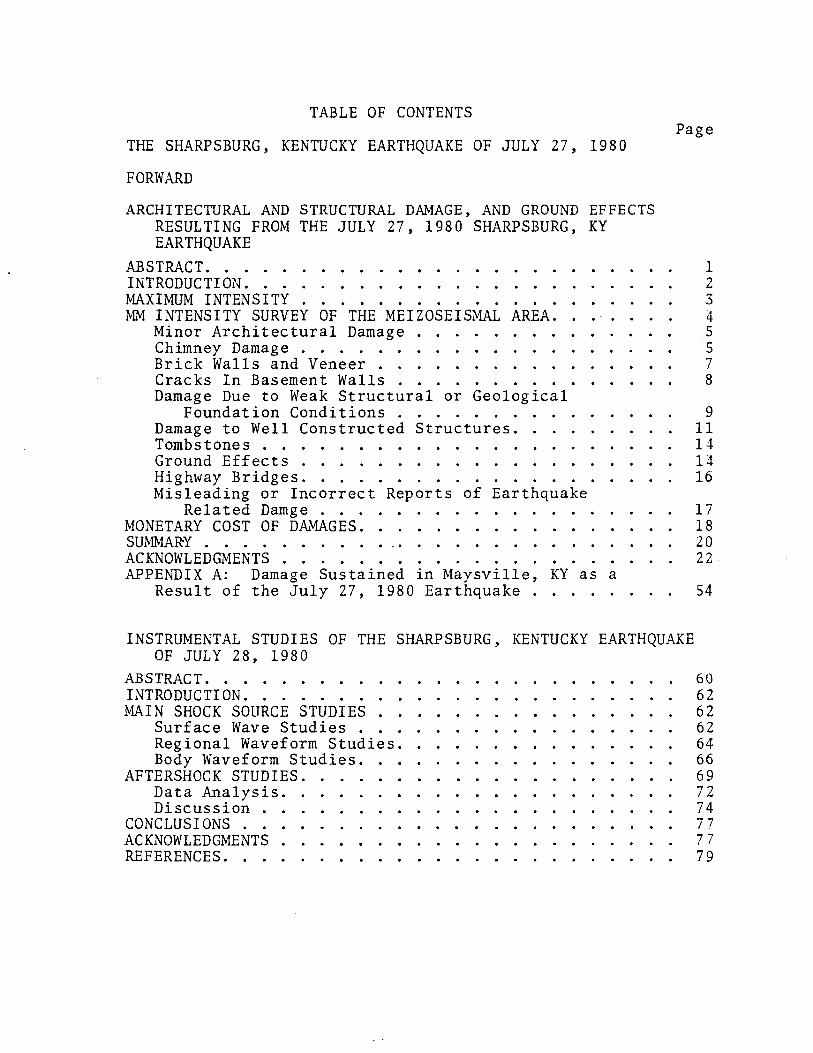
TABLE OF CONTENTS Page
THE SHARPSBURG, KENTUCKY EARTHQUAKE OF JULY 27, 1980
FORWARD
ARCHITECTURAL AND STRUCTURAL DAMAGE, AND GROUND EFFECTS RESULTING FROM THE JULY 27, 1980 SHARPSBURG, KY EARTHQUAKE
ABSTRA.CT. . . . . . . . . . . . .. ........ . INTRODUCTION. . . . . . . . . . .. .. . MAXIMUM INTENSITY . . . . . . . .. ... . . . MM INTENSITY SURVEY OF THE MEIZOSEISMAL AREA. ... .
Minor Architectural Damage . . . .... . Chimney Damage . . . . . . . .. ........ . Brick Walls and Veneer . . . .. . ..... . Cracks In Basement Walls . . .. ... . .. Damage Due to Weak Structural or Geological
Foundation Conditions ...... . Damage to Well Constructed Structures .. Tombs tones . . . . . . . . . . .. ... Ground Effects . . . . . . . . . . . . . . . . Highway Bridges ................ . Misleading or Incorrect Reports of Earthquake
Related Damge ... MONETARY COST OF DAMAGES. . . . . . . . . . SUMMARY . . . . . . . . . . _. . . . . ACKNOWLEDGMENTS . . . . . . . . . . . . .. .... APPENDIX A: Damage Sustained in Maysville, KY as a
Result of the July 27, 1980 Earthquake ....
INSTRUMENTAL STUDIES OF THE SHARPSBURG, KENTUCKY EARTHQUAKE OF JULY 28, 1980
AB S TRAC T. . . . . . . . . . . . . . . . . . INTRODUCTION. . . . . . . . . . . . . . . . . MAIN SHOCK SOURCE STUDIES . . . .. ..... .
Surface Wave Studies . . . . . . . . . . Regional Waveform Studies.. . .. . Body Waveform Studies. . . .. .. .
AFTERSHOCK STUDIES. . . . . . .. . Data Analysis.. . ....... . Discussion . . . .. .... ..... .
CONCLUSIONS . . . ... .. . ACKNOWLEDGMENTS . . . . . . . . . . . REFERENCES. . . . . . . . . . . . .
1 2 3 4 5 5 7 8
9 11 14 14 16
17 18 20 22
54
60 62 62 62 64 66 69 72 74 77 77 79

ARCHITECTURAL AND STRUCTURAL DAMAGE, AND GROUND EFFECTS RESULTING FROM THE JULY 27, 1980 SHARPSBURG, KY
EARTHQUAKE
By
R. Street and W. Foley
Dept. of Geology University of Kentucky
Lexington, KY 40506
ABSTRACT
The 5.3 mbLg magnitude earthquake that occurred near
Sharpshurg, KY on July 27, 1980, caused in excess of three
million dollars worth of damage within a 3,600 km 2 meizo-
seismal area. Based on a number of criteria, including
damaged chimneys, cracked exterior and basement walls,
rotated and displaced tombstones, and miscellaneous ground
effects, the meizoseismal area is judged to represent the
intensity VI (MM) area of the earthquake. And within the
meizoseismal area, the towns of Sha~psburg and Maysville, KY
are judged to have experienced a sufficient number of effects
to have been assigned an intensity VIr (r-L.vO.
1

2
Introduction
The Modified Mercalli (MM) intensity VII earthquake of
July 27, 1980 caused in excess of three million dollars worth
of damage to homes, businesses, schools, churches, and a state
park within a 3,600 km 2 sparsely populated area of north-cen
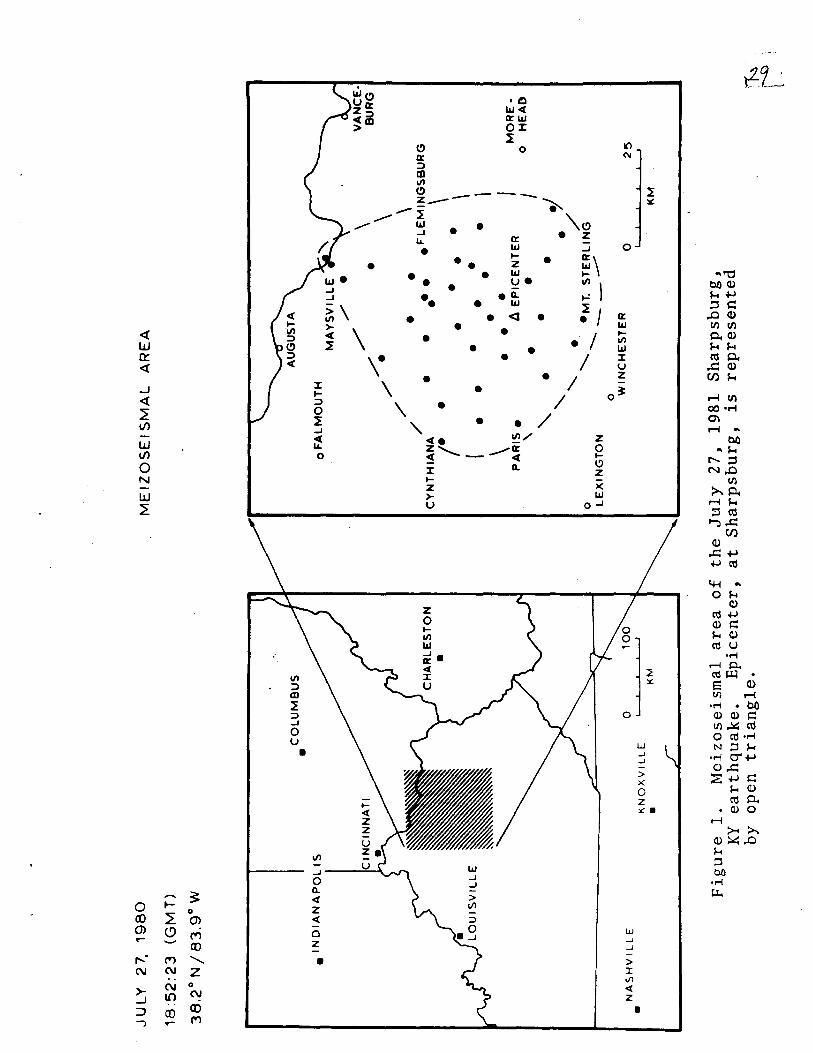
tral Kentucky. The area bounded by Paris, KY to the wes t,
Owingsville, KY to the east, Mt. Sterling, KY to the south,
and Ripley, OH to the north is designated in this paper as
the meizoseismal area of the event, and is outlined in Figure
I by the dashed lines. Not incorporated in the meizoseismal
area are the isolated, but numerous instances of broken
chimneys, cracked basement walls, ground cracking, changes
in well water levels, and cracked or. dislodged parapet
damage reported throughout central Kentucky.
For the most part, damage to structures within the meizo
seismal area was of the architectural variety, however several
instances of damage involving the structural integrity of
buildings were also documented. In addition, ground effects,
such as landslides, changes in well and pond water levels, and
soil cracking occurred throughout the southern portion of the
meizoseismal area - effects that are explained by specific soil
and foundation conditions rather than severe ground-motions.
The purpose of this paper is to report on an extensive
set of first-hand field observations regarding the structural
and ground phenomena attributed to the Sharpsburg, KY earth
quake. Data from questionnaries distributed in the meizo
seismal area, and from requests for information published in

3
regional newspapers were used as a guide to follow-up field
studies that continued for several months after the occurrence
of the event.
Maximum Intensity
Two localities, Sharpsburg and Maysville, KY, experienced
a sufficient number of Modified Mercalli CMM) intensity VII
effects to be characterized as sites of MM intensity VII. In
the rural area immediately about Sharpsburg, a village with a
population of 400, a few homes were shifted on their founda
tions, 35% of the chimneys were damaged, four well built homes
were severely damaged, portions of the brick veneer on four
additional hdmes were knocked off, individuals in twa homes as
well as mourners attending a funeral in the village cemetery
reported difficulty in standing, and reports of three small
landslides, muddied water and changes in well water levels,
and three instances of the earthquake being felt in moving
vehicles were received. In addition, there were numerous
other reports of minor cracking in foundations, water wells,
cisterns, plastering, brick veneer, driveways, and outdoor
patios.
The MM intensity assigned to Maysville, a town with a
population of 7,000, is based on two instances of slope fail
ure, the widespread chimney damage, and the cracked brick
walls and chimneys as well as the fallen parapets and ornaments
within the twelve square block area bounded by Fifth Street,
4
McDonald Parkway, Sutton Street, and Clarks Alley in the central
part of town. A more detailed description of the damage in
Maysville is given in Appendix A.
The criteria used to assign the MM intensity VII at the
two localities is, therefore, somewhat different. In Sharps
burg, the MM intensity VII is assigned on the basis of the
ground effects and damage done to one and two story homes of
both older and newer construction; while in Maysville, the MM
intensity VII is based on damage done to multistory older
homes, and older commercial and public buildings. The usage
of different criteria is a result of (1) the population dif
ference, and (2) the fact that nearly all of the damaged com
mercial and public buildings in Maysville are older multi
story structures, whereas the few commercial structures in
Sharpsburg are generally single story and significantly newer
than those damaged in Maysville.
MM Intensity Survey of the Mezoseisrnal Area
In the following paragraphs, a summary of the ~w intensity
effects documented within the meizoseismal area of the July
27, 1980 Sharpsburg, KY earthquake are given. Within the rural
countryside and small farming communities that make up the
meizoseismal area, a sufficient number of ~1 intensity VI or
greater effects were observed, that we consider the area as a
whole as constituting the ~w intensity VI area.
5
M~no~ A~ehiteetu~al Vamage
There were numerous and widespread instance of minor
architectural damage, such as broken glass, cracked or fallen
plaster, and damage to decorative brickwork, reported through
out the meizoseismal area. Figures 2 and 3 illustrate examples
of this type of damage in Maysville, Kentucky; Figure 2 shows
a broken 1/2 inch plate glass bank window, while Figure 3 is
of a brickfall from a damaged parapet. Figure 4 shows a window
in the courthouse at Flemingsburg, Kentucky from which the
cornice was shaken loose, while Figure 5 shows the cracked
cornice on the two-story Perfect Lady Beauty Shop in Owings
ville, Kentucky.
Scattered instances of minor architectural damage were also
reported well outside of the meizoseismal area. The furthest
such report received, was from Pine Knot, Kentucky that is
175 kilometers to the south of the epicenter. At the home of
Mrs. Mabel Tartar on Rt. 1, several small cracks were found
between the brickwork near the front wall of the house, with
one large crack beginning at the foundation to a point half
way up the front wall of the house. Other minor architectural
damage reports were received from Cincinnati, Ohio to the
north, and Prestonburg, Kentucky to the east.
Chimney Vamage
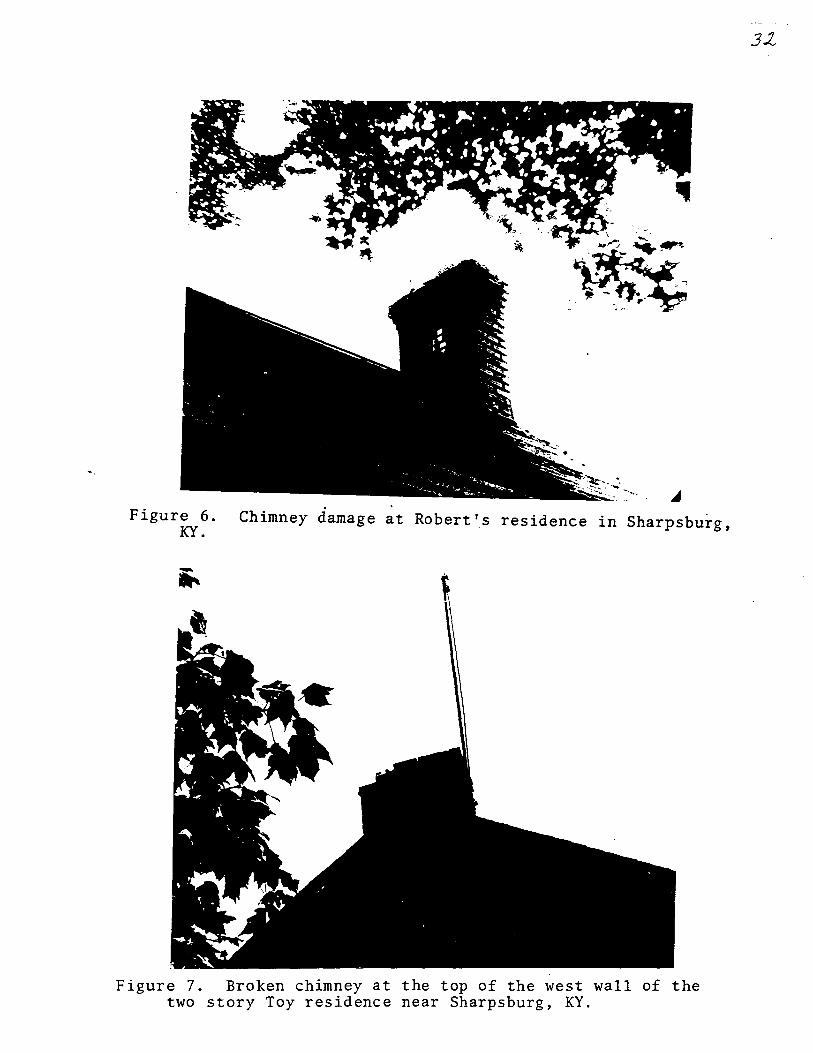
The most prevalent and obvious type of damage to occur in
the meizoseismal area was chimney damage, which ranged from
a few bricks being dislodged at chimney tops, to instances of
chimney falls and chimneys being broken near the roofline.
6
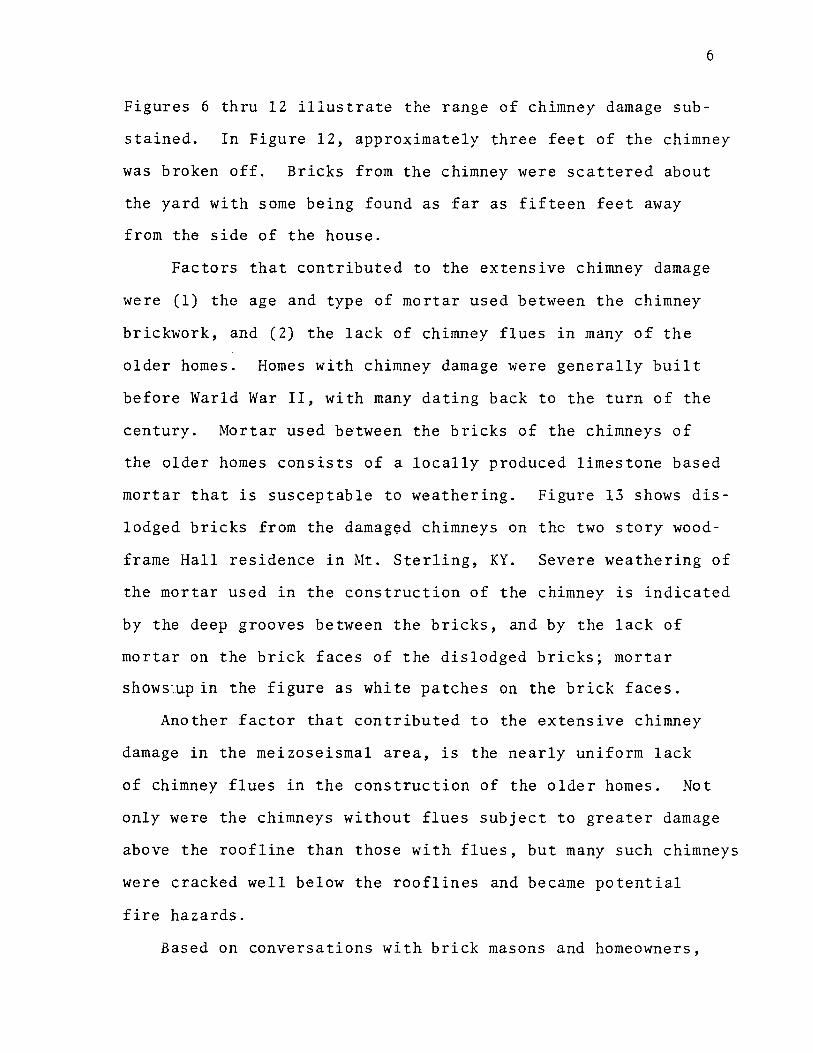
Figures 6 thru 12 illustrate the range of chimney damage sub
stained. In Figure 12, approximately three feet of the chimney
was broken off. Bricks from the chimney were scattered about
the yard with some being found as far as fifteen feet away
from the side of the house.
Factors that contributed to the extensive chimney damage
were (1) the age and type of mortar used between the chimney
brickwork, and (2) the lack of chimney flues in many of the
older homes. Homes with chimney damage were generally built
before Warld War II, with many dating back to the turn of the
century. Mortar used between the bricks of the chimneys of
the older homes consists of a locally produced limestone based
mortar that is susceptable to weathering. Figure 13 shows dis
lodged bricks from the damag~d chimneys on the two story wood
frame Hall residence in Mt. Sterling, KY. Severe weathering of
the mortar used in the construction of the chimney is indicated
by the deep grooves between the bricks, and by the lack of
mortar on the brick faces of the dislodged bricks; mortar
shows_up in the figure as whi te patches on the brick faces.
Another factor that contributed to the extensive chimney
damage in the meizoseismal area, is the nearly uniform lack
of chimney flues in the construction of the older homes. Not
only were the chimneys without flues subject to greater damage
above the roofline than those with flues, but many such chimneys
were cracked well below the rooflines and became potential
fire hazards.
Based on conversations with brick masons and homeowners,
7
the cost of repairing a chimney ranged from a low of $80 for
minor repairs involving chimney tops, to $500 for those re-
pairs to chimneys cracked below the roofline. The latter type
of damage was generally repaired by inserting a linear into
the chimney and filling the void between the linear and chimney
wi th cemen t.
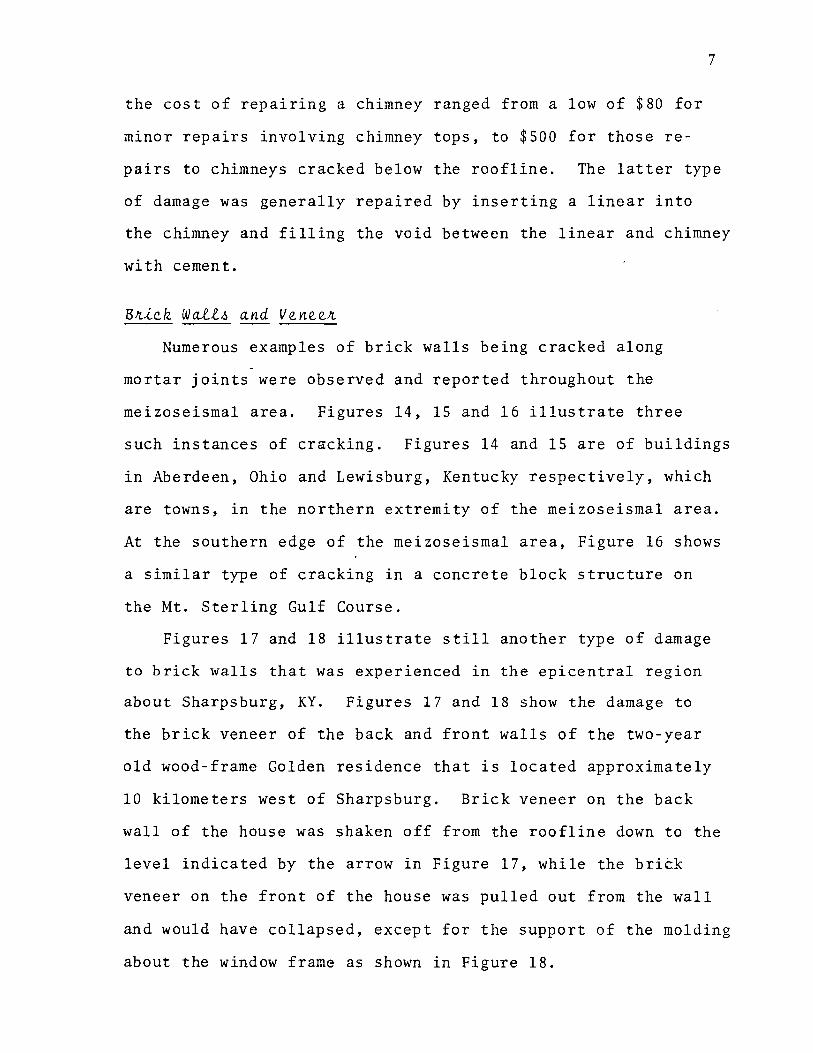
Numerous examples of brick walls being cracked along -
mortar joints were observed and reported throughout the
meizoseismal area. Figures 14, 15 and 16 illustrate three
such instances of cracking. Figures 14 and 15 are of buildings
in Aberdeen, Ohio and Lewisburg, Kentucky respectively, which
are towns, in the northern extremity of the meizoseismal area.
At the southern edge of the meizoseismal area, Figure 16 shows
a similar type of cracking in a concrete block structure on
the Mt. Sterling Gulf Course.
Figures 17 and 18 illustrate still another type of damage
to brick walls that was experienced in the epicentral region
about Sharpsburg, KY. Figures 17 and 18 show the damage to
the brick veneer of the back and front walls of the two-year
old wood-frame Golden residence that is located approximately
10 kilometers west of Sharpsburg. Brick veneer on the back
wall of the house was shaken off from the roofline down to the
level indicated by the arrow in Figure 17, while the brick
veneer on the front of the house was pulled out from the wall
and would have collapsed, except for the support of the molding
about the window frame as shown in Figure 18.

8
Three other homes in the epicentral area had their brick
veneer severely damaged by the ground-motions of the earthquake.
One home was the new Vice residence on Kentucky Rt. 32, 3 kilo
meters from Carlisle, Kentucky, another home wasa 10 year old
Bedford style house in Sharpsburg, while a third house was a
newer home in Little Rock, Kentucky. Damage to the brickwork
on the Vice house was $4,500 while that to the other homes
were on the order of a couple of thousand dollars.
In addition to brick veneer being shaken off homes, numerous
other homes owners in the meizoseismal region reported crack
ing in the mortar between the brickwork.
C~ack~ ~n Ba~emen~ Wall~
Several instances of severe damage to cisterns and base
ment walls in the southern and central part ions of the meizo
seismal area were reported. Figure 19 shows the basement wall
at the Cooper's residence in Flemingsburg, KY that was both
cracked and bowed by the ground-motions of the earthquake.
Figure 20, also from the Flemingsburg area, shows the cracked
boiler room stairwell in the basement of the Fleming County
Hospital~ Severely cracked basement walls were also observed
in the North Middletown, Sherburne, Owingsville, Sharpsburg,
and Little Rock, KY localities.
Besides the severe damage to the cisterns and basement
walls at the localities listed above, widespread reports of
minor cracking in cisterns and basement walls were received
from Carter, Elliott, Fleming, Rowan, Bath, Montgomery, Mason,
Bourbon, Nicholas, Clark, and Fayette counties in north-central

Kentucky, as well as one such report each from Wayne and Mc
Creary counties in southeastern Kentucky.
9
Vamage Vue ~o Weak S~~uc~u~a.t o~ Geological Founda~ion Condi~ion~
Some of the more severely damaged structures resulting
from the Sharpsburg earthquake, were those with poorly designed
or weakened structural foundations. An example of a structure
that sustained severe damage due in part to a poorly designed
structural foundation, is the 40 x 100 foot two story concrete
block Morning Star Baptist Church in Owingsville, KY. The
structure had been built in the early 1960's on the side of a
steep hill with a footing that was not properly secure to the
bedrock. During the earthquake, the rear quarter of the struc
ture separated from the remainder of the building, and slide
down the hillside 2 inches before stabilizing. Figure 21 shows
the separation in the south wall of the exterior of the build
ing, while Figure 22 shows the twisted pillars in the interior
of the church basement. As a result of the earthquake, the
Morning Star Baptist church building was condemned, torn down,
and replaced by a new structure.
Figure 23 is a picture of a badly damaged 150 year old
Purvis residence one kilometer south of Sharpsburg. The damage
to the Purvis house is an example of a building that sustained
severe damage primarily as a result of a structural foundation
that had been seriously weakened by age and weathering. The
cracks about the door frames in the figure are typical of
the cracking that occurred throughout the exterior and inter
ior walls of the house. Some of the cracks were large enough

10
that one could see, without difficulty, into the interor of
the house from the outside. As with the Owingsville Morning
Star Baptist Church, the Purvis house has been condemned by the
local building inspector, and has since been abandoned.
As a point of interest, the reason the windows in the
Purvis house shown in Figure 23 were not broken, is that they
were of Plexiglass instead of glass.
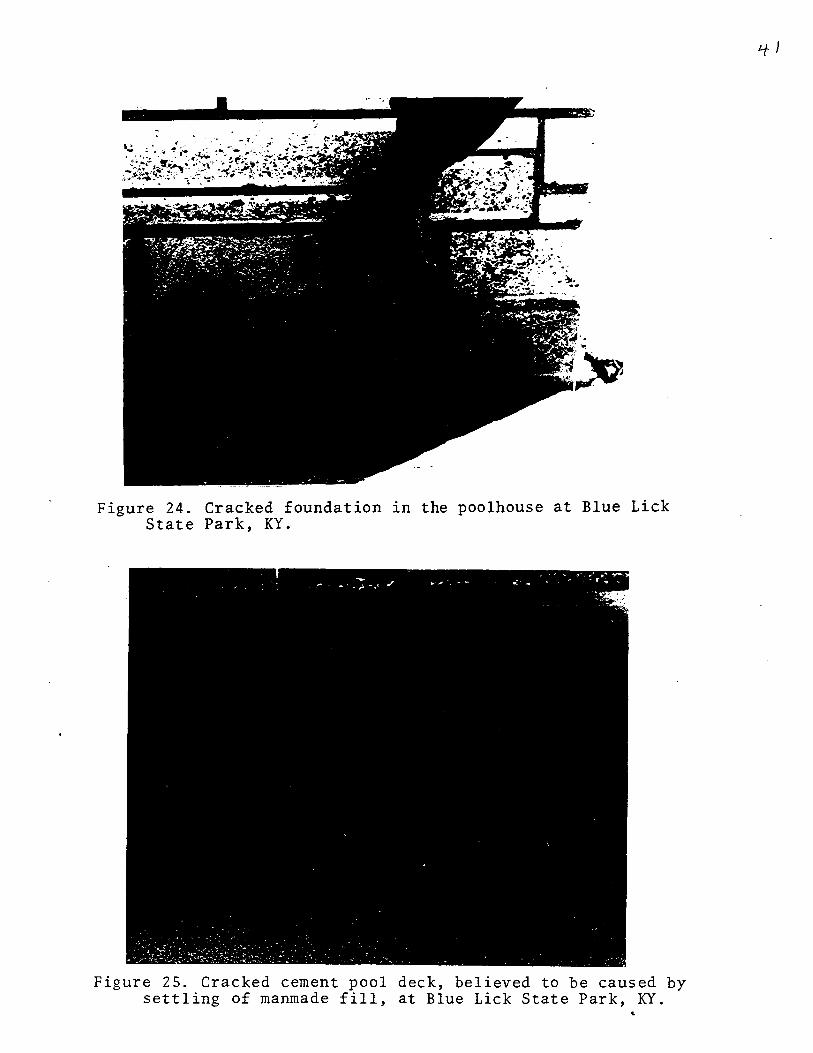
An example of extensive damage being due in part to un
favorable ground conditions, is the damage at Blue Licks State
Park that is west of Mt. Olivet, KY. Figures 24, 25, and 26
illustrate just a few examples of the extensive cracking of
the bathhouse, pool deck area, and a picnic shelter at the
park. In addition to these facilities, the park superintend
ent's house and park museum which are substantial fieldstone
structures, as well as the walls of the pool were extensively
cracked. In the case of the pool deck area, pool, and bath
house, a likely explanation for the damage is the fact that
these facilities were built ten years ago on a man-made fill
that probably underwent further compaction as a result of the
earthquake. The cause of the cracking and differential settl
ing of the concrete floor in the picnic shelter in Figure 26,
as well as the other picnic shelters in the park, the museum,
and the park superintendent's house, is not as obvious. These
structures were all built on natural terrain which, in parti
cular, seems to preclude a differential settling on the order
of the 1 inch that was observed at the picnic shelter shown
in Figure 26.
11
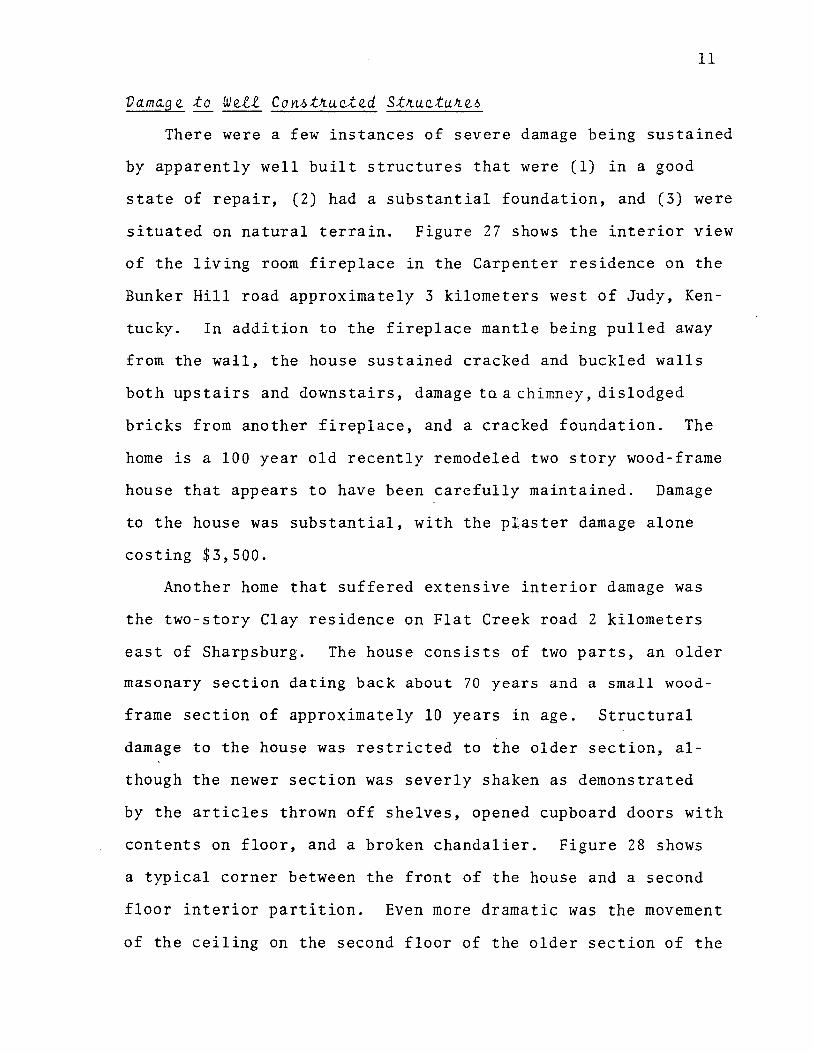
Vamag~ to W~ll Con~t~uct~d St~uctu~~~
There were a few instances of severe damage being sustained
by apparently well built structures that were (1) in a good
state of repair, (2) had a substantial foundation, and (3) were
situated on natural terrain. Figure 27 shows the interior view
of the living room fireplace in the Carpenter residence on the
Bunker Hill road approximately 3 kilometers west of Judy, Ken
tucky. In addition to the fireplace mantle being pulled away
from the wall, the house sustained cracked and buckled walls
both upstairs and downstairs, damage tQ a chimney, dislodged
bricks from another fireplace, and a cracked foundation. The
horne is a 100 year old recently remodeled two story wood-frame
house that appears to have been carefully maintained. Damage
to the house was substantial, with the ptaster damage alone
costing $3,500.
Another horne that suffered extensive interior damage was
the two-story Clay residence on Flat Creek road 2 kilometers
east of Sharpsburg. The house consists of two parts, an older
masonary section dating back about 70 years and a small wood
frame section of approximately 10 years in age. Structural
damage to the house was restricted to the older section, al
though the newer section was severly shaken as demonstrated
by the articles thrown off shelves, opened cupboard doors with
contents on floor, and a broken chandalier. Figure 28 shows
a typical corner between the front of the house and a second
floor interior partition. Even more dramatic was the movement
of the ceiling on the second floor of the older section of the
12
house with respect to the interior partitions. On the south
west side of the house, the second floor ceiling was displaced
nearly 2 inches with respect to the interior walls. Unfortu
nately, pictures showing this movement were inadvertently de
stroyed during the developing process.
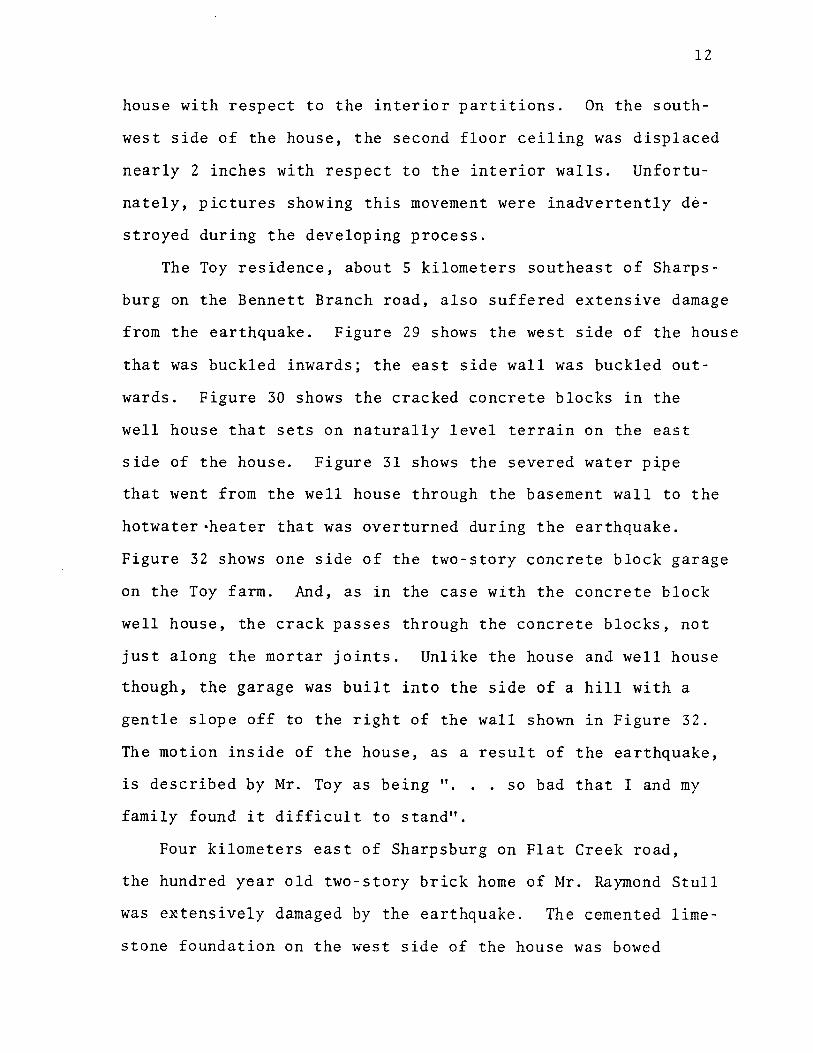
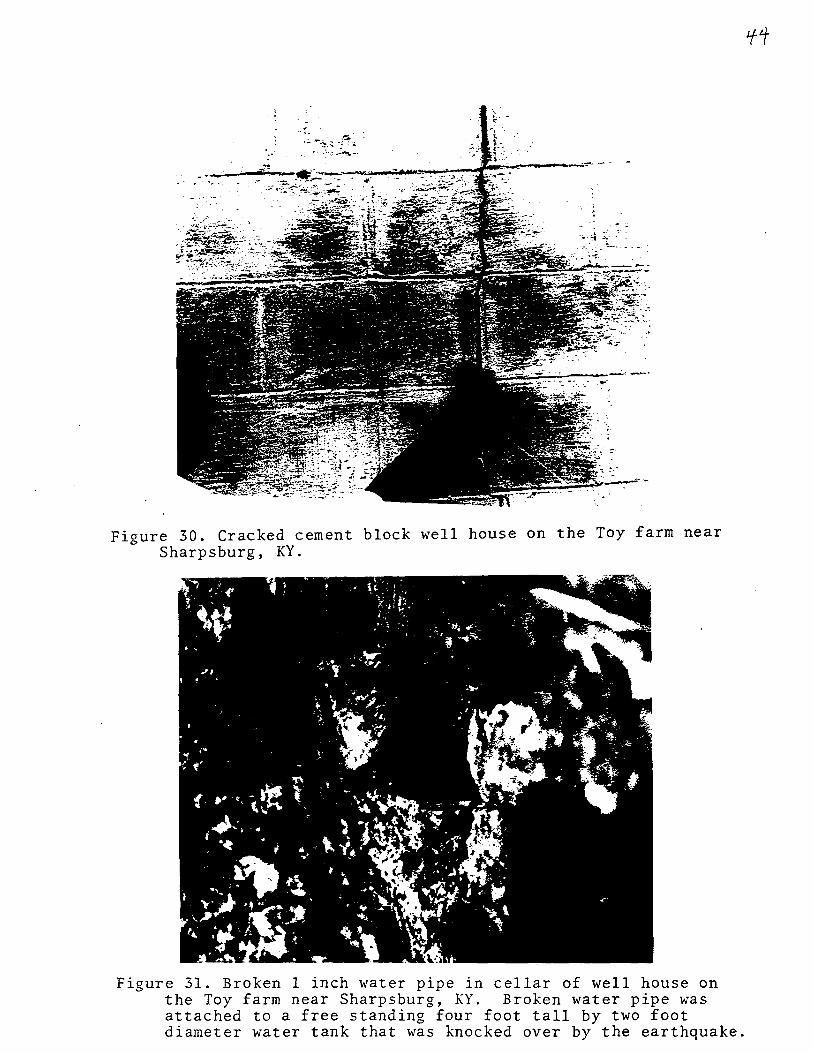
The Toy residence, about 5 kilometers southeast of Sharps
burg on the Bennett Branch road, also suffered extensive damage
from the earthquake. Figure 29 shows the west side of the house
that was buckled inwards; the east side wall was buckled out~
wards. Figure 30 shows the cracked concrete blocks in the
well house that sets on naturally level terrain on the east
side of the house. Figure 31 shows the severed water pipe
that went from the well house through the basement wall to the
hotwateroheater that was overturned during the earthquake.
Figure 32 shows one side of the two-story concrete block garage
on the Toy farm. And, as in the case with the concrete block
well house, the crack passes through the concrete blocks, not
just along the mortar joints. Unlike the house and well house
though, the garage was built into the side of a hill with a
gentle slope off to the right of the wall shown in Figure 32.
The motion inside of the house, as a result of the earthquake,
is described by Mr. Toy as being " ... so bad that I and my
family found it difficult to stand".
Four kilometers east of Sharpsburg on Flat Creek road,
the hundred year old two-story brick home of Mr. Raymond Stull
was extensively damaged by the earthquake. The cemented lime
stone foundation on the west side of the house was bowed

13
outwards 7 to 8 inches, the three chimneys on the house were
damaged - with the chimney on the west side of the house being·
split from the roofline to the fireplace, while the screws
holding the mantle to the wall over the fireplace on the east
side of the house were pulled out of the wall about 2 inches.
Damage to the house also included a ~oom on the first floor
of the east end of the house that was noticeably twisted out
of alignment with the rest of the house; the wallpaper in this
room was torn in a manner suggesting a twisting or shear-type
of motion. In addition, cupboards were emptied of their
contents, pictures were knocked off walls, and Mrs. Stull and
her daughter, who were in the house during the earthquake, re
ported that they were unable to stand during the event. Fig
ures 33 and 34 illustrate a portion of the damaged limestone
foundation along the front of the Stull residence, and crumpled
and torn wallpaper in the corner of the first floor room at
the east of the house.
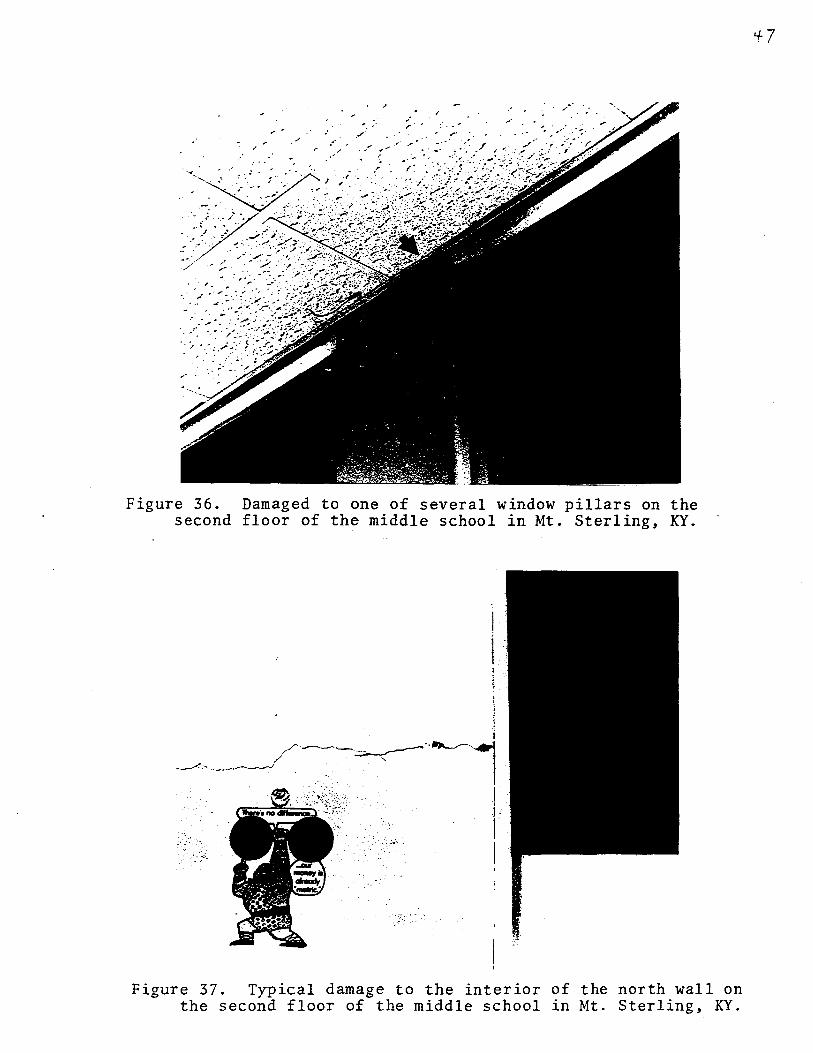
Another structure that was severly damaged by the earth
quake, was the Mt. Sterling Middle School on Kentucky Rt. 11
in Mt. Sterling, KY. The three-story brick building was com
pleted in the early 1930's and appears to have been kept in a
good state of repair. Figure 3S shows the third floor of the
south wall which was so badly damaged that one window was re
moved and bricked over, and the lintel over the window to the
right was knocked out about 2 inches from the wall. This sec
tion of the exterl0r wall required $22,000 dollars in repairs
immediately after the main shock, in order to stabilize the

14
wall from further movement. Figure 36 is an interior shot of
the typical type of damage done to the window pillars on the
south side of the second floor of the building, while Figure
37 shows the type of interior damage typically found along the
north wall of the building. Total damages to the structure
was estimated by the city's architect to be on the order of
$325,000.
Tomb~tone~
Tombstones throughout the meizoseismal area were effected
by the ground-motion of the earthquake. Based on our observa
tions, the movement of the tombstones was random; that is, we
observed tombstones - in the same cemetery - that had rotated
clockwise, counterclockwise or shifted on their pedestal with
somewhat equal regularity. Figures 38, 39 and 40 illustrate
three tombstones in the Sharpsburg valley cemetery that give
evidence of rotation, displacement, and partial overturning,
respectively. A few tombstones in the cemetery were completely
overturned by the earthquake, but were righted by the ground
keeper the day after the event.
Ground motions at the Sharpsburg village cemetery not
only effected tombstones, but were also noticeable to mourners·
attending a funeral. They described the ground-motion as severe
enough to make it difficult to stand, and to be noticeable in
slowing moving cars.
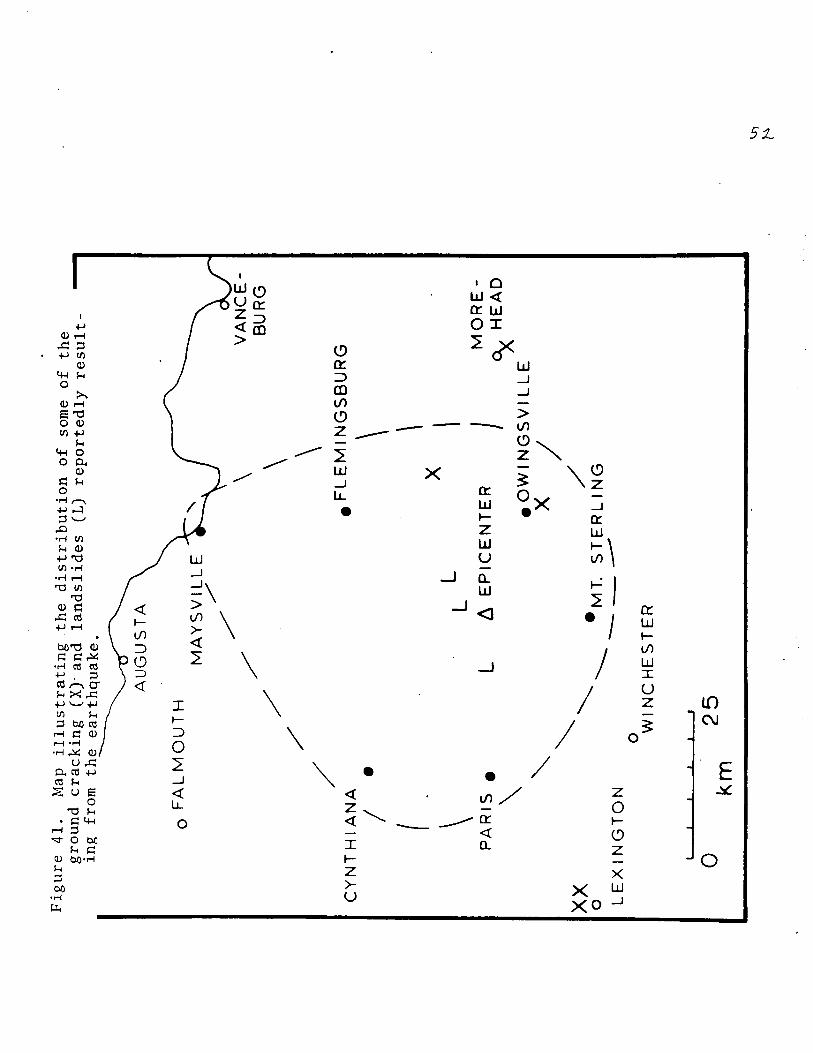
G~ound E66eQt~
The Sharpsburg earthquake caused ground cracks, landslides,

IS
and changes in well water. Figure 41 illustrates the geo
graphical distribution of the reported ground cracking, while
Figure 42 is a closeup of a ground crack in Owingsville, Ken
tucky that is typical of those reported. The Owingsville
ground cracking occurred extensively throughout an open field
on a hillside of 8° slope that is covered with 4 to 6 feet of
soil of high clay content. The ground cracking at the Lexing
ton, Hillsboro, and Morehead sites indicated in Figure 41 oc
curred under similar circumstances; i.~., on open slopes cover
ed with soil high in clay content. These conditions, plus the
fact that central Kentucky experienced a severe drought during
the summer of 1980, leads us to the conclusion that the cracks
are essentially dessication cracks triggered by the earthquake.
Another ground effe~t attributed to the Sharpsburg earth
quake, were the three instances of landslides in the epicentral
region as indicated in Figure 41. Figure 43 shows one such
landslide in a road cut near the junction of Hinkston Creek,
and the boundary of Nicholas and Bourbon counties - approxi
mately seven kilometers west of Sharpsburg. The rock matrix
in this area consists of alternating layers of weak shales and
limestones that are very susceptible to weathering. Consequent
ly, the landslides are considered to be a secondary effect
triggered by the earthquake, and not necessarily indicative of
appreciable ground-motions.
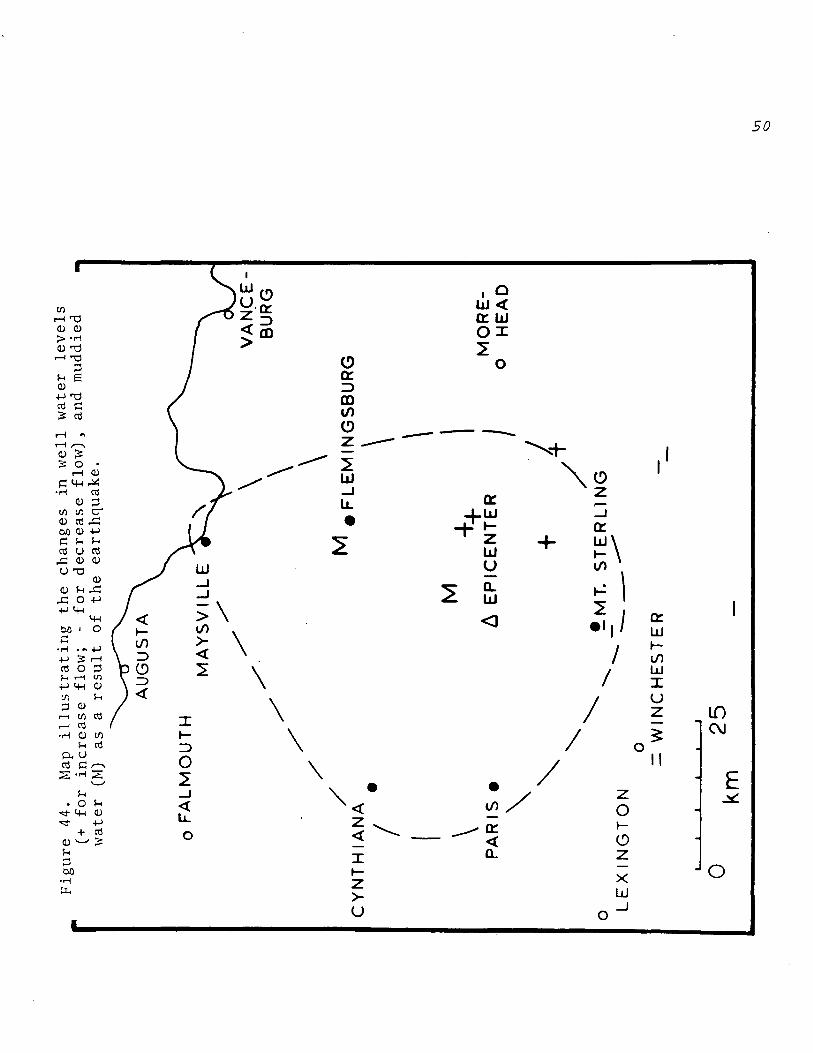
The third type of ground effect reported as a result of
the Sharpsburg earthquake was changes in well water. Figure
44 illustrates the distribution of the changes in the well

16
water that were documented during the course of this study.
In the figure, (M) indicates a report of muddied well water,
(+) indicates an increase in the well water level, and (-)
indicates a decrease in the well water level. The decreases
in the water levels shown in the lower right-hand corner of
the figure are the most reliably documented, since the water
level in the well and adjacent natural pond were being used
in a water monitoring project. The water level in the well
dropped eight feet while the water level in the pond dropped
about two feet shortly after the occurrance of the earthquake.
These changes in the water level, as with those changes in the
water levels documented elsewhere, appear to be permanent. In
addition to the changes in the water levels shown in Figure 44,
reports by county agricultural agents and conversations with
farmers in Clark, Mo"ntogomery, Robertson, and Bath counties
suggests that the changes in water levels were probably sub
stantially more widespread than those which we were able to
document.
H-<.g hwa.y BJt-<.dg e-6
As part of the field investigation of the earthquake, a
visual inspection of the highway bridges in the region about
the epicenter was conducted to determine whether any of the
bridges showed signs of having moved as a result of the
event. This inspection consisted of a check of joints such
as those found between bridge spans and their support columns.
Of the bridges inspected, the only one that apparently moved
during the event was a sixty foot, simple truss bridge built

17
in 1892 on the Nicholas and Bath county line eight kilometers
west of Sharpsburg.
The freshly painted, broken tie-rod that supports the
wooden railing shown in Figure 45, is typical of the damage
done to the tie-rods on the northern and southern corner of
the northeast-southwest orientated bridge. Tie-rods for the
wooden railings on the opposite two corners were not noticeably
effected. While ~he upper portion of the bridge was apparently
twisted during the earthquake, an inspection of the paint on
the rollers and tie-rods between the ends of the bridge span
and bridge abutments, indicated that the bridge as a whole
did not move.
Mi~lead~ng on Inconnect Repont~ £i Eanthqua~e Related Vamage
During the course of documenting the effects of the Sharps
burg earthquake, a few instances of seemingly significant dam
age were found to be incorrect. In Owingsville, KY it was widely
reported that the ceiling of the Catholic church on Main Street
had suffered extensive damage as a result of the quake. This
report was seemingly substantiated by the fact that the church
was closed immediately after the earthquake and all persons
were barred from entry. However while trying to obtain an
estimate as to the cost of damages sustained by the church,
the office of the local diocese informed us that the ceiling
of the church was in a badly deteriorated state of repair due
to a leaking roof prior to the earthquake, and that in their
opinion the earthquake had merely aggrevated an existing pro
blem and advanced the schedule of the necessary repairs.
18
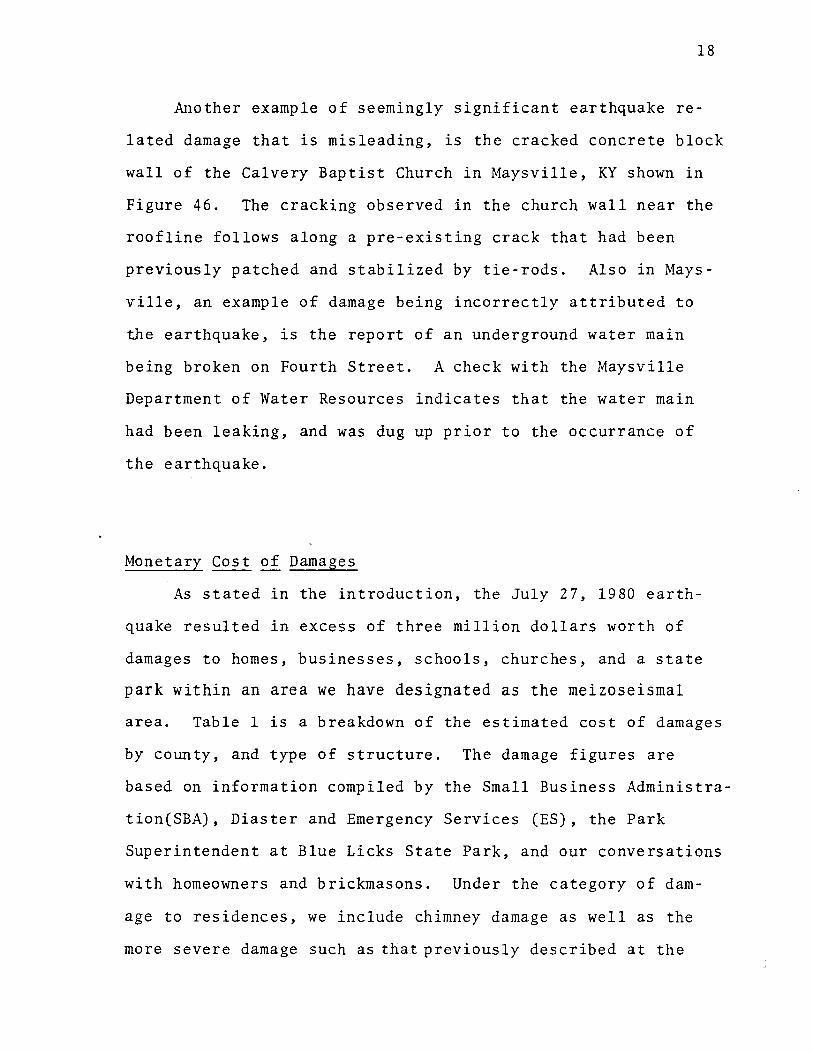
Another example of seemingly significant earthquake re
lated damage that is misleading, is the cracked concrete block
wall of the Calvery Baptist Church in Maysville, KY shown in
Figure 46. The cracking observed in the church wall near the
roofline follows along a pre-existing crack that had been
previously patched and stabilized by tie-rods. Also in Mays
ville, an example of damage being incorrectly attributed to
the earthquake, is the report of an underground water main
being broken on Fourth Street. A check with the Maysville
Department of Water Resources indicates that the water main
had been leaking, and was dug up prior to the occurrance of
the earthquake.
Monetary Cost of Damages
As stated in the introduction, the July 27, 1980 earth
quake resulted in excess of three million dollars worth of
damages to homes, businesses, schools, churches, and a state
park within an area we have designated as the meizoseismal
area. Table I is a breakdown of the estimated cost of damages
by county, and type of structure. The damage figures are
based on information compiled by the Small Business Administra
tion(SBA), Diaster and Emergency Services (ES), the Park
Superintendent at Blue Licks State Park, and our conversations
with homeowners and brickmasons. Under the category of dam
age to residences, we include chimney damage as well as the
more severe damage such as that previously described at the
19
Stull residence. Not included in the estimated cost of dam
ages, are the costs for repairing the many basement walls
cracked during the earthquake. A local company that specializes
in waterproofing basements, estimates that damage per basement
range upward to a few thousands of dollars, depending on the
extent of resealing that was necessary.
The accuracy of the monetary damages listed in Table I
needs to be qualified. The most accurate estimate of damages
are probably those given for Mason County since the damages
in that county were concentrated in the city of Maysville which
received widespread publicity at the time of the event. The
most inaccurate cost of damages given in Table 1, are probably
those listed for Bath, Fleming, and Montgomery counties.
Damages in these counties were primarily in rural areas, received
little publicity, and consequently were very difficult to do
cument.
In summary, with respect to Table 1, we have documented
three million dollars worth of damage within the meizoseismal
area as a result of the July 27, 1980 earthquake. It is our
conclusion, however, that a more accurate monetary cost of
damages is probably on the order of four million dollars if
basement damage, damage outside of the meizoseismal area, and
the probably underestimated damage figures in Bath, Fleming
and Montgomery counties are taken into consideration.
20
Summary
This report presents the observations and information
gathered during a year long follow-up study in the meizoseismal
area of the July 27, 1980 Sharpsburg, KYearthquake. Impor
tant results of this study are as follows:
1. Maximum Modified Mercalli (MM) intensities of VII
were experienced in the area of Sharpsburg and
Maysville, KY;
2. the remainder of the 3,600 km 2 meizoseismal area
generally experienced MM intensity VI or greater
effects; and
3. the estimated monetary value of the damage attributed
to the Sharpsburg earthquake was on the order of
four million dollars.
Not included in this paper, are the results from the
follow-up of the numerous miscellaneous reports of minor
damage outside of what we have designated as the meizoseismal
area. We know, for example, of ten chimneys being damaged
and several instances of plaster and basement walls being
cracked in the Lexington, KY area, of at least eight chimneys
being damaged in northeastern Jessamine county, and that the
home of Mr. Fred Barnsdale near Eliottville, KY was shifted
by a quarter of an inch on its cement block foundation. In
addition to these reported instances of damage, we suspect that
there were several other unreported instances of minor damage.

21
outside of the meizoseismal area, particularily in the sparsely
populated region to the south and southeast of the meizoseismal
boundary shown in Figure 1.
22
ACKNOWLEDGMENTS
The detailed intensity survey described in this study,
and the extensive aftershock study and monitoring program
described in the joining paper by Herrmann et al., would not
have been possible without the enthusiastic help and long
hours of effort by Mr. James Zollweg of Tennessee Earthquake
Information Center and the following University of Kentucky
students: Mark Allsop, Kevin Brumfield, Mike Netzband, Chris
Steinemann, Patricia Wonderley and Wendy Wonderley.
We also acknowledge and sincerely appreicate the allocation
of funds arranged for us by Mr. Clifford Swager of the University
of Kentucky and Dr. Andrew Murphy of the Nuclear Regulatory
Commission, without which the costly field studies could not
have been completed.
This research was supported in part by the U.S. National
Science Foundation under grant No. PFR-781976S. The opinions,
findings and conclusions or recommendations expressed in this
manuscript are those of the authors, and do not necessarily
reflect the views of the National Science Foundation.

23
TABLE CAPTION
Table 1. Estimated cost of damages within the meizoseismal
area of the July 27, 1980 Sharpsburg, Kentucky
earthquake.

TABLE 1
DAMAGE ESTUtATE
July 27, 1980 Earthquake
Bath County, KY Churches Businesses Residences
Bourbon County, Residences
Fleming County, Residences
(6) $345,000
(32) $201,000
(268) $303,000
KY -(52) $15,000
KY -(190) $38,000
Fleming County Hospital $5,000
Mason County, KY Churches (4) $200,000
Businesses (3n $303,000
Residences (269) $800,000
Private Schools (1) $20,000
Montgomery County, KY Residences (52) $20,000
Mt. Sterling Middle School $325,000
Other Schools (3) $150,000
Nicholas County, KY Residences (251) $52,000
Robertson County, KY -Residences ( 50) $10,000
Blue Licks State Park $250,000
TOTAL
24
$ 849,000
$ 15,000
$ 43,000
$1,323,000
$ 495,000
$ 52,000
$ 260,000
$3,037,000
25
FIGURE CAPTIONS
Figure 1. Meizoseismal area of the July 27, 1981 Sharpsburg, KY earthquake. Epicenter, at Sharpsburg, is represented by open triangle.
Figure 2. One-half inch broken plate glass bank window at street level in downtown Maysville. Photo by courtesy of J. Parker.
Figure 3. KY.
Brick fall from broken parapet in downtown Maysville, Photo by courtesy of J. Parker.
Figure 4. Window cornice shaken loose from courthouse, in Flemmngsburg, KY.
Figure 5. Cracked cornice on second story of Perfect Lady Beauty Shop in Owingsville, KY.
Figure 6. Chimney damage at Robert's residence in Sharpsburg, KY.
Figure 7. Broken chimney at the top of the west wall of the two story Toy residence near Sharpsburg, KY.
Figure 8. Typical chimney damage in downtown Maysville. Photo by courtesy of J. Parker.
Figure 9. Chimney damage at abandoned residence on Route 11 south of Moorefield, KY.
Figure 10. Chimney damage at 152 Main Street, Owingsville, KY.
Figure 11. Chimney fall at one story frame structure at Sherburn, KY. Notice that the chimney has no flue for internal support, and that the mortar is in poor condition ..
Figure 12. Chimney damage at Brewer residence on Route 11 north of Sharpsburg. Notice the condition of the mortar.
Figure 13. Chimney damage at two story frame Hall residence in Mt. Sterling. Notice poor condition of mortar.
Figure 14. Cracked brick wall in school one block from Ohio River in Aberdeen, OH.
Figure 15. Cracked brick wall in six year old residence in Lewisburg, KY (see arrow).
Figure 16. Cracks in concrete block structure at golf course ln Mt. Sterling, KY. Photo by courtesy of J. Zollweg.
26
Figure 17. View of the rear of the Golden residence where brick veneer was shaken off.down to the level indicated by the arrow. The structure is approximately 10 kilometers west of Sharpsburg, KY, and is two years old.
Figure 18. Same structure as shown in Figure 17, but view shows the front of the house where the brick veneer is pulled out from around the window frame (see arrow).
Figure 19. Cracked and bowed concrete block basement wall at Cooper residence in Flemingsburg, KY.
Figure 20. Cracked stairwell in the boiler room of the Fleming County Hospital in Flemingsburg, KY.
Figure 21. Cracked and separated exterior wall of the Morning Star Baptist Church in Owingsville, KY.
Figure 22. Displaced near pillar in the basement of the Morning Star Baptist Church in Owingsville, KY (see arrow).
Figure 23. Extensive cracking in the 150 year old brick Purvis home on the outskirts of Sharpsburg, KY.
Figure 24. Cracked foundation in the poolhouse at Blue Lick State Park, KY.
Figure 25. Cracked cement pool deck, believed to be caused by settling of manmade fill, at Blue Lick State Park, KY.
Figure 26. Cracked cement floor of a picnic shelter at Blue Lick State Park, KY.
Figure 27. Separation of fireplace mantle from wall at the Carpenter residence near Judy, KY. Photo by courtesy of TVA.
Figure 28. Plaster crack in~cond story bedroom of the Clay residence near Sharpsburg, KY.
Figure 29. View of the west wall of the Toy structure near Sharpsburg, KY. Notice how the wall is bowed inwards (see arrow); east wall of the structure was bowed outwards in a like manner.
Figure 30. Cracked cement block well house on the Toy farm near Sharpsburg, KY.
Figure 31. Broken 1 inch water pipe in cellar of well house on the Toy farm near Sharpsburg, KY. Broken water pipe was attached to a free standing four foot tall by two foot diameter water tank that was knocked over by the earthquake.

27
Figure 32. Crack in concrete block sidewall of the two story garage on the Toy farm near Sharpsburg, KY. The structure is built on the west slope of a hill, and the rear wall of the structure was shifted down slope.
Figure 33. Workman repairing the damaged limestone foundation of the Stull residence near Sharpsburg, KY. This section of the foundation was badly cracked, and displaced by as much as eight inches as result of the earthquake. Photo by courtesy of Mrs. R. Stull.
Figure 34. View of the torn wallpaper along the corner of the first floor east end room of the Stull home near Sharpsburg, KY. Photo by courtesy of Mrs. R. Stull.
Figure 35. Damaged exterior south wall of the middle school in Mt. Sterling, KY. One window was removed and bricked in, as was the stone lintel over the window to the right (see arrows).
Figure 36. Damaged to one of several window pillars on the second floor of the middle school in Mt. Sterling, KY.
Figure 37. Typical damage to the interior of the north wall on the second floor of the middle school in Mt. Sterling, KY.
Figure 38. Clockwise rotation of stone monument in the Sharpsburg cemetery - penny for scale.
Figure 39. Example of stone monument in the Sharpsburg cemetery that was shifted approximately 3/4 of an inch.
Figure 40. Example of a tombstone in the Sharpsburg cemetery that would have fallen if not for the metal rods connecting the top to the base.
Figure 41. Map illustrating the distribution of some of the ground cracking (X) and landslides (L) reportedly resulting from the earthquake.
Figure 42. Ground cracking in Owingsville, KY that is believed to be desiccation cracks triggered by the earthquake. Pen for scale.
Figure 43. Small rockslide in roadcut near the Nicholas Co.Bourbon Co. line that was triggered by the earthquake.
Figure 44. Map illustrating the changes in well water levels (+ for increase flow; - for decrease flow), and muddied water (M) as a result of the earthquake.
Figure 45. View of a broken and twisted tie-in rod observed on a small bridge on the Nicholas Co.-Bourbon Co. line (see arrow; half dollar is used for scale).

28
Figure 46. Previously cracked concrete block wall in the Calvery Baptist Church in Maysville, KY that was reopened by the earthquake. Photo by courtesy of TVA.
J U
L Y
2
7,
19
80
18
:52
:23
(G
MT
)
38
.2°
N /
83
.9°
W
• IN
DIA
NA
PO
LIS
CO
LU
MB
US
•
ME
IZO
SE
I S
MA
L
AR
EA
oF
AL
MO
UT
H
MA
YS
VIL
LE
/'"
//
. \
/' .
\ /'
CH
AR
LE
ST
ON
• /
..
\ C
YN
TH
IAN
A
••••
.FL
EM
ING
SB
UR
G
/..
. \
NA
SH
VI
LL
E
• K
NO
XV
ILL
E
• o
KM
. ..
. \
I •
• •
• •
\ .
. . \
•••
I P
AR
IS.
A E
PIC
EN
TE
R
\ •
• I
o LE
XIN
GT
ON
",.
. .
.; ""
. •
'-.
/ '-:' .M
T.
ST
ER
LIN
G
----
o WIN
CH
ES
TE
R
o
KM
Fig
ure
1
. M
eizo
seis
mal
are
a o
f th
e Ju
ly
27
, 19
81
Sh
arp
sbu
rg,
KY
eart
hq
uak
e.
Ep
icen
ter,
at
Sh
arp
sbu
rg,
is
rep
rese
nte
d
by
op
en tr
ian
gle
.
MO
RE
o
HE
AD
25
i~ ~
t .

Figure 2. One-half inch broken plate glass bank window at street level in downtown Maysville. Photo by courtesy of J. Parker.
Figure 3. KY.
AI'" .... ~
~:' ,~. ,.-
Br ick fa 11 from br oken parapet in dov;n town :Maysv i 11 e, Photo by courtesy of J. Parker.

Figure 4. Jfindow cornice shaken loose from coUrthouse, in FlemingSburg, KY. ;/ !
/
t
Figure 5. Cracked cornice on second story of Perfect Lady Beauty Shop in OWingsVille, KY.
-.....
Figure 6. Chimney damage at Robert's residence in Sharpsburg, KY •
Figure 7. Broken chimney at the top of the west wall of the two story Toy residence near Sharpsburg, KY.
32

33
Figure 8. Typical chimney damage in downtown Maysville. Photo by courtesy of J. Parker.
Figure 9. Chimney damage at abandoned residence on Route 11 south of Moorefield, KY.

Figure 10. Chimney damage at 152 Main Street, Owingsville, KY .
•
Figure 11. Chimney fall at one story frame structure at Sherburn, KY. Notice that the chimney has no flue for internal support, and that the mortar is in poor condition.
3i
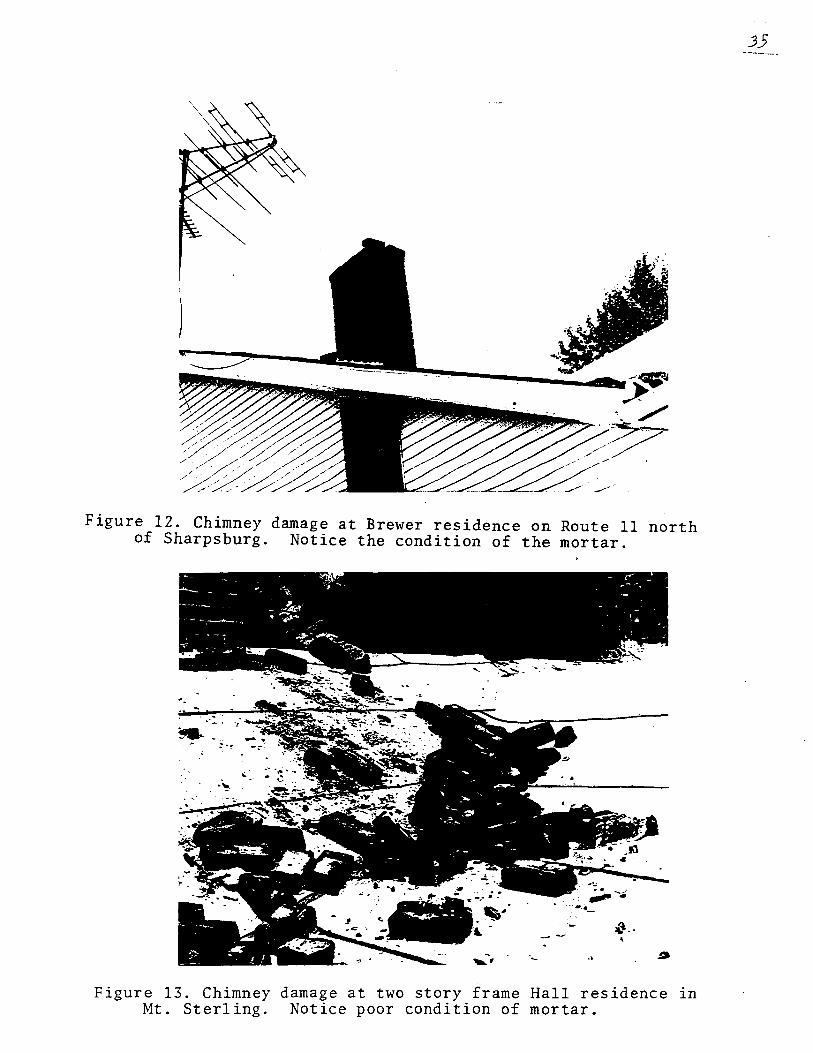
Figure 12. Chimney damage at Brewer residence on Route 11 north of Sharpsburg. Notice the condition of the mortar .
...•. 4t_
~ .. . ~ .,
Figure 13. Chimney damage at two story frame Hall residence in Mt. Sterling. Notice poor condition of mortar.
35

Figure 14. River
-. _..L. .'~
,T .--"-7--- ._T-~
7-.I:-~·"; i
-:---r .--,---- ,
I
\ \
-
.. 1-
cracked brick wall in school one block from Ohio
in Aberdeen, OR.
. -
Figure 15. burg,
cracked brick wall in six year old residence in Lewis·
K'l (see arrow).

Figure 16. Cracks in concrete block structure at golf course in Mt. Sterling, KY. Photo by courtesy of J. Zollweg.
' •. "
t, - -
-j ·:1
: 1 , \ i .
Figure 17. View of the rear of the Golden residence where brick veneer was shaken off down to the level indicated by the arrow. The structure is approximately 10 kilometers west n-f Sharn~hurQ. KY. and is two years old.
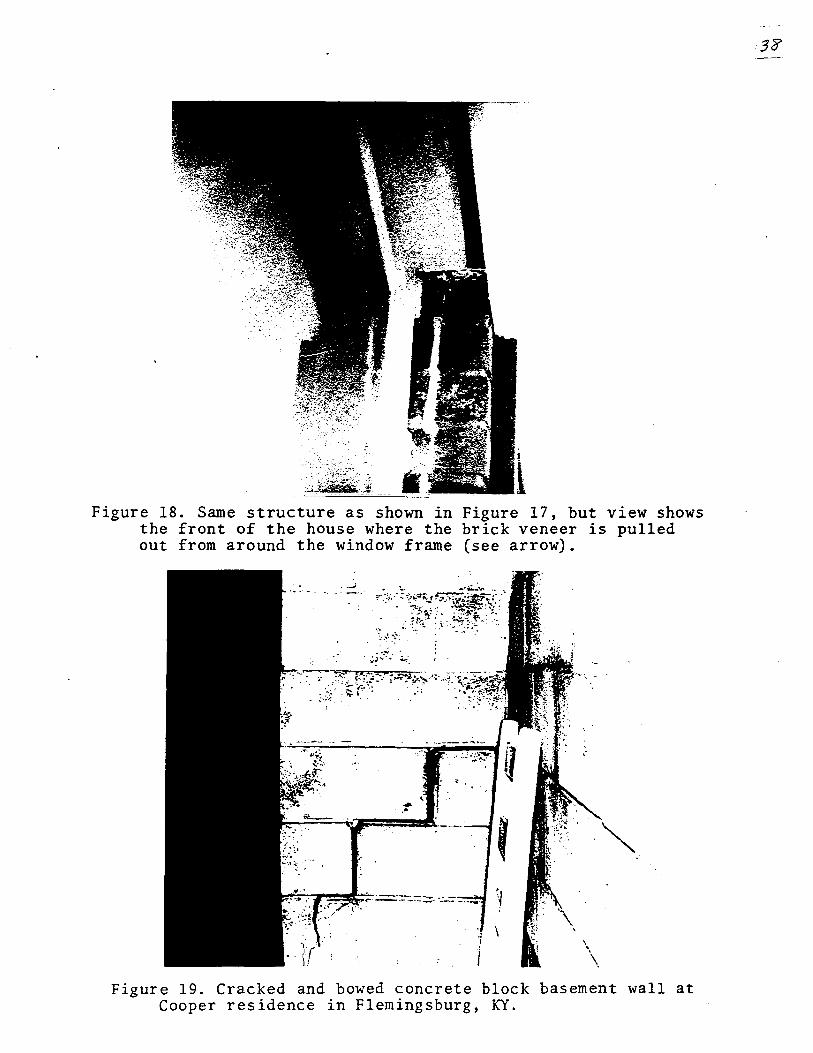
Figure 18. Same structure as shown in Figure 17, but view shows the front of the house where the brick veneer is pulled out from around the window frame (see arrow) •
• ....J .~. _.~'\Io __ ~~.>:.: :~ii:'~;:~"~~~\" .~'."'~ ~-.
'-\.
Figure 19. Cracked and bowed concrete block basement wall at Cooper residence in Flemingsburg, KY.
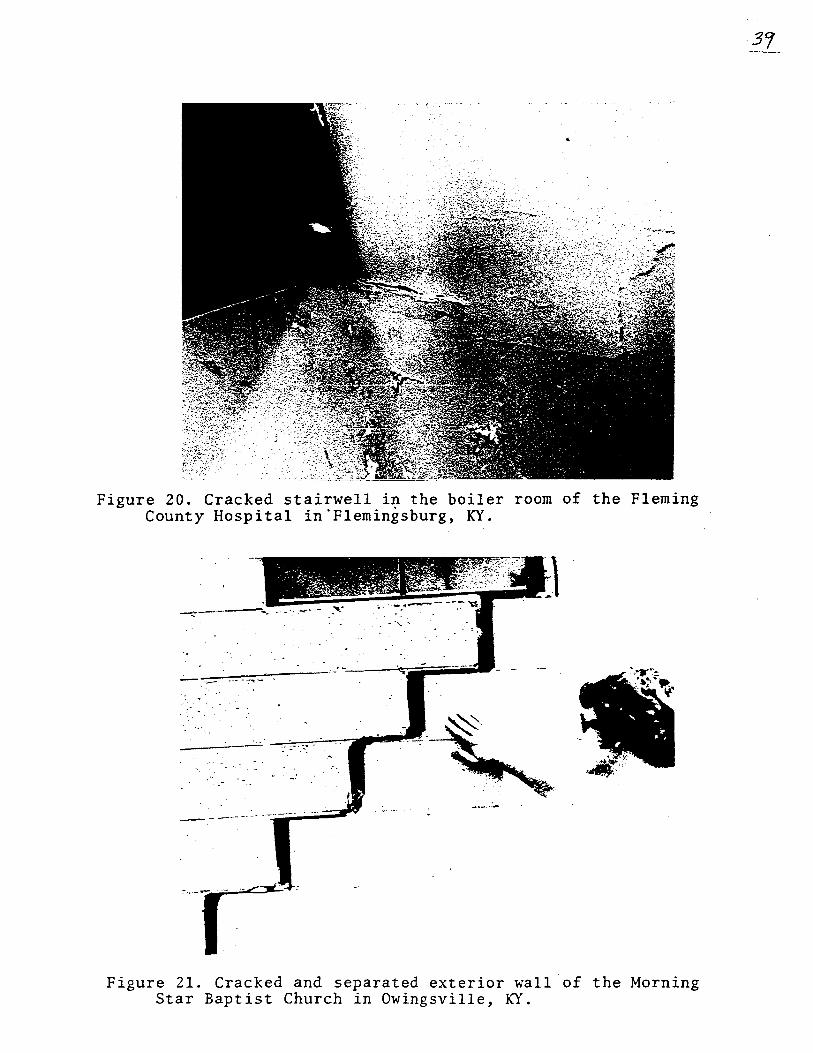
Figure 20. Cracked stairwell i~ the boiler room of the Fleming County Hospital in 'Flemingsburg, KY.
_~~~_-'-- -' ~---~ iiiiiiiiiiiii--.- ~ _ ....... -.-
-----_.---
Figure 21. Cracked and separated exterior wall of the Morning Star Baptist Church in Owingsville, KY.

Figure 22. Displaced near pillar in the basement of the Morning Star Baptist Church in Owingsville, KY (see arrow).
Figure 23. Extensive cracking in the 150 year old brick Purvis home on the outskirts of Sharpsburg, KY.
- ~ ..
Ji;~~~:~:'4t,=1;;"·"'."'''''''--''''
Figure 24. Cracked foundation in the poolhouse at Blue Lick State Park, KY.
Figure 25. Cracked cement pool deck, believed to be caused by settling of manmade fill, at Blue Lick State Park, KY . ..
qJ
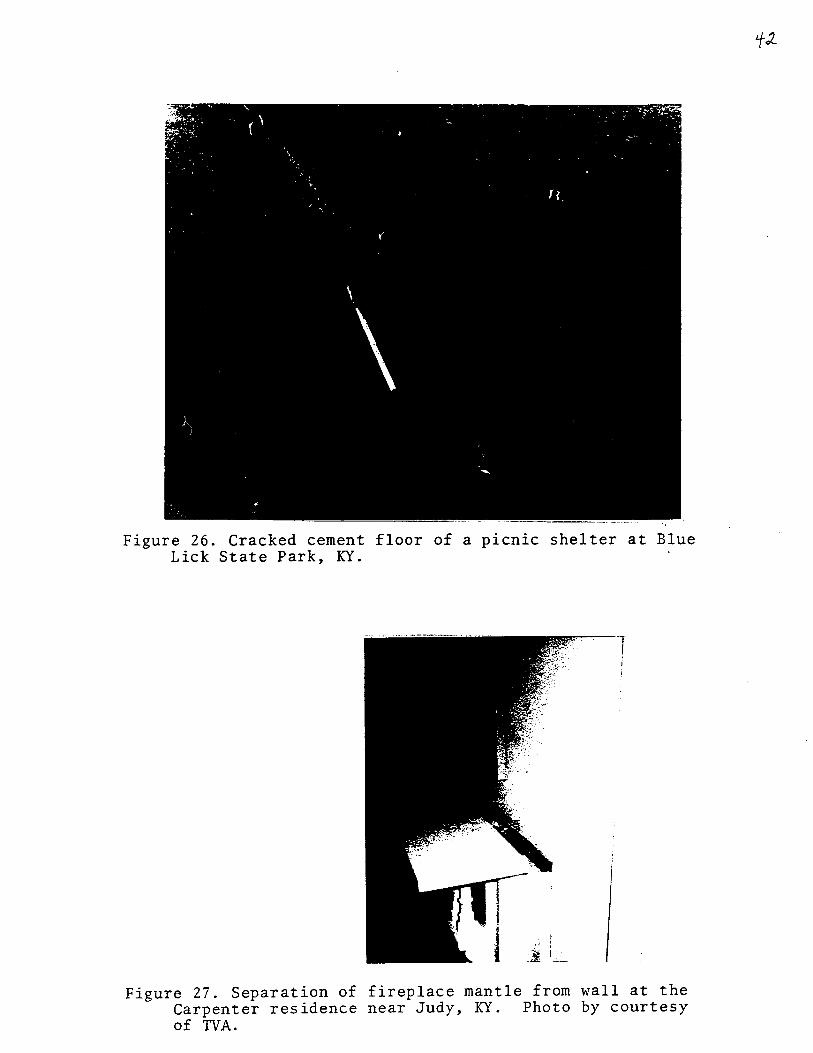
Figure 26. Cracked cement floor of a picnic shelter at Blue Lick State Park, KY.
Figure 27. Separation of fireplace mantle from wall at the Carpenter residence near Judy, KY. Photo by courtesy of TVA.

Figure 28. Plaster crack in~cond story residence near Sharpsburg, KY.
•
the Clay
Figure 29. View of the west wall of the Toy structure near Sharpsburg, KY. Notice how the wall is bowed inwards (see arrow); east wall of the structure was bowed outwards in a like manner.
-, . "' ..
,-
~.:.. .... ~;,' .~-!?:. -;. . -: .. ~-~ ....
- ,
-.~ ~:, .. -. . ":.-...--- - - .
Figure 30. Cracked cement block well house on the Toy farm near Sharpsburg, KY.
Figure 31. Broken 1 inch water pipe in cellar of well house on the Toy farm near Sharpsburg, KY. Broken water pipe was attached to a free standing four foot tall by two foot diameter water tank that was knocked over by the earthquake.

Figure 32. Crack in concrete block sidewall of the two story garage on the Toy farm near Sharpsburg, KY. The structure is built on the west slope of a hill, and the rear wall of the structure was shifted down slope.
Figure 33. Workman repairing the damaged limestone foundation of the Stull residence near Sharpsburg, KY. This section of the foundation was badly cracked, and displaced by as much as eight inches as result of the earthquake. Photo
T"'IIo ,.... .. _ "'I'"

· ........ . . .~ ~ .. ;.- ':- . ~ :.!..e .
. ' .... "*r
:i::;~~~
Figure 34. View of the-torn wallpaper along the corner of the first floor east end room of the Stull home near Sharpsburg, KY. Photo by courtesy of Mrs. R. Stull.
Figure 35. Damaged exterior south wall of the middle school in Mt. Sterling, KY. One window was removed and bricked in, as was the stone lintel over the window to the right (see arrows).
. , .'
.... ;. . ," ;.-
Figure 36. Damaged to one of several window pillars on the second floor of the middle school in Mt. Sterling, KY.
I I
i
,../'·-----~·~'·~1 -.--/."--~~ .' ." ." ..
. .,. I
........ '
i . 1
I
Figure 37. Typical damage to the interior of the north wall on the second floor of the middle school in Mt. Sterling, KY.
tf7
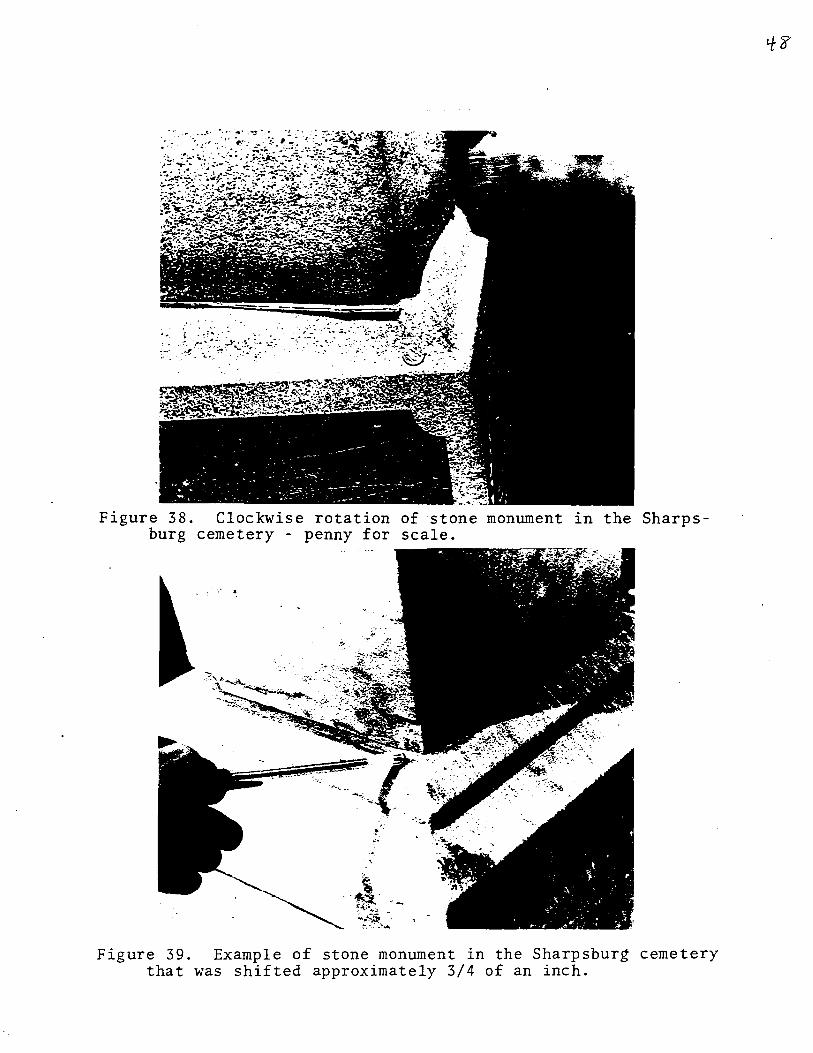
Figure 38. Clockwise rotation of stone monument in the Sharpsburg cemetery - penny for scale.
Figure 39. Example of stone monument in the Sharpsburg cemetery that was shifted approximately 3/4 of an inch.

Figure 40. Example of a tombstone in.the Sharpsburg cemetery that would have fallen if not for the metal rods connecting the top to the base.
Fig
ure
44
. M
ap
illu
str
ati
ng
th
e
chan
ges
in
w
ell
w
ater
le
vels
(+
fo
r in
cre
ase
fl
ow
; -
for
decre
ase
fl
ow
),
and
m
ud
die
d
wat
er
(M)
as
a re
su
lt
of
the
eart
hq
uak
e.
o F
AL
MO
UT
H ,/'
/"
/
MA
YS
VIL
LE
/'
"
,/
,/'0
\ \ \
VA
N.C
E -
BU
RG
/ C
YN
TH
lA
NA
M
• F
LE
MIN
GS
BU
RG
I •
\ I \
M
\ ++
I
PA
R IS
. ~ E
PIC
EN
TE
R
J
~
OJ
'"
+
T
" /
o LE
XIN
GT
ON
~..
......
. !M
T.
ST
ER
LlN
G
---=-
--.--
-o = WIN
CH
ES
TE
R
o km
2
5
MO
RE
o
HE
AD
\.n
<U

Figure 42. Ground cracking in Owingsville, KY that is believed to be desiccation cracks triggered by the earthquake. Pen for scale.
Figure 43. Small rockslide in roadcut near the Nicholas Co.Bourbon Co. line that was triggered by the earthquake.
51
Fig
ure
4
1.
Map
il
lustr
ati
ng
th
e
dis
trib
uti
on
o
f so
me
of
the
gro
un
d
cra
ck
ing
(X
)-an
d
lan
dsl
ides
(L)
rep
ort
ed
ly re
su
lt
ing
fr
om
the
eart
hq
uak
e.
o F
AL
MO
UT
H
/
/ /
MA
YS
VIL
LE
,-
/
/ /
\ \ \
VA
NC
E
BU
RG
CY
NT
HIA
NA
•
FL
EM
I N
GS
BU
RG
\ \ /
•
L
L
X
I P
AR
IS.
L 6
EP
ICE
NT
ER
J
MO
RE
-\
~ H
EA
D
'-.O
WIN
GS
VIL
LE
" X
/
"',,-
/ '-
...
• M
T.
S T
E R
LIN
G
( \
xx
o LE
X I
NG
TO
N
----
o km
o WIN
CH
ES
TE
R
25
~
~
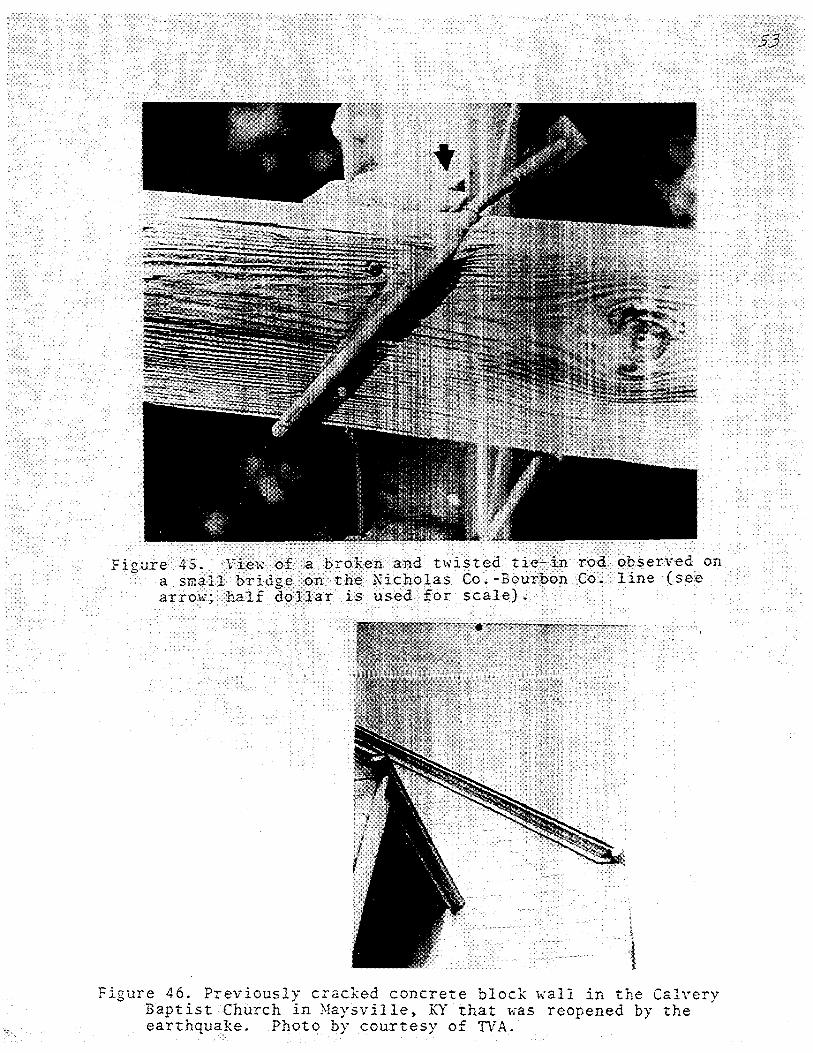
Figure 45. Viet.,: ofa broken and twisted tie-in rod observed on a small bridge on the Nicholas Co.-Bourbon Co. line (see arrow; half dollar is used for scale).
Figure 46. Previously cracked concrete block wall in the Calvery Baptist Church in Maysville, KY that was reopened by the earthquake. Photo by courtesy of TVA.
;53·
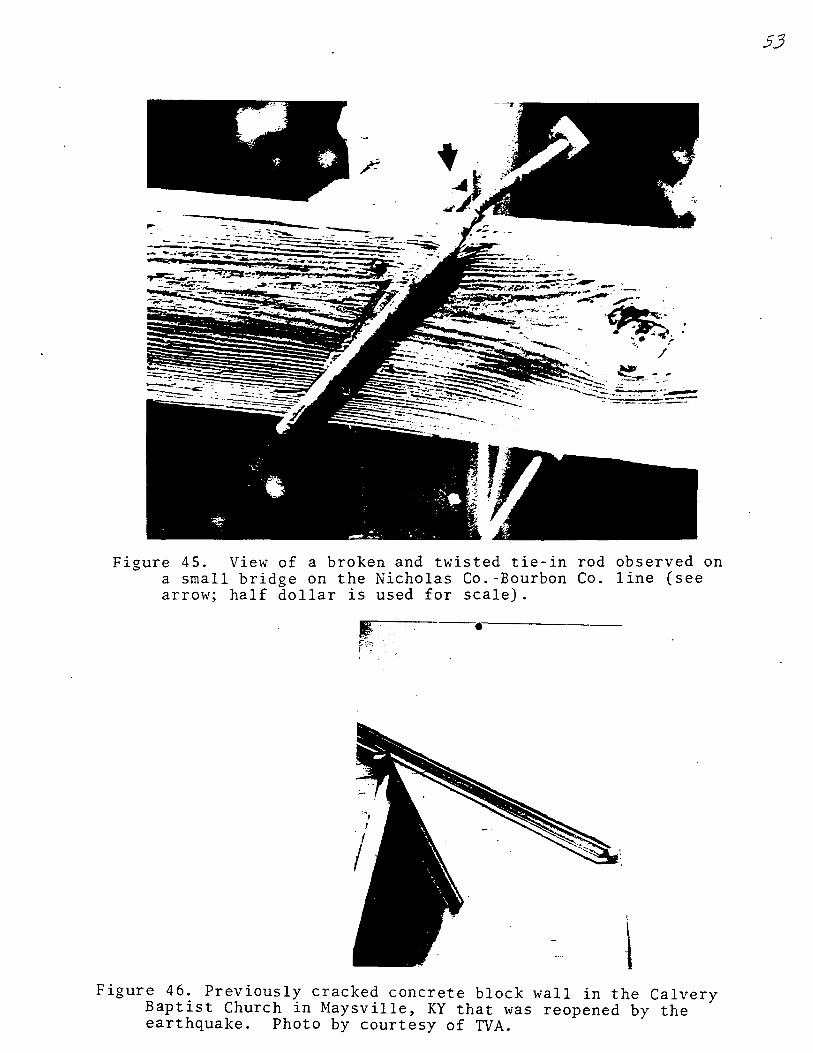
Figure 45. View of a broken and twisted tie-in rod observed on a small bridge on the Nicholas Co.-Bourbon Co. line (see arrow; half dollar is used for scale) .
•
.(
\ Figure 46. Previously cracked concrete block wall in the Calvery
Baptist Church in Maysville, KY that was reopened by the . earthquake. Photo by courtesy of TVA.
53
54
APPENDIX A: DAMAGE SUSTAINED IN MAYSVILLE, KY AS A RESULT OF THE JULY 27, 1980 EARTHQUAKE
Structures damaged in Maysville by the July 27, 1980
earthquake were primarily older buildings (pre;1930) multi-
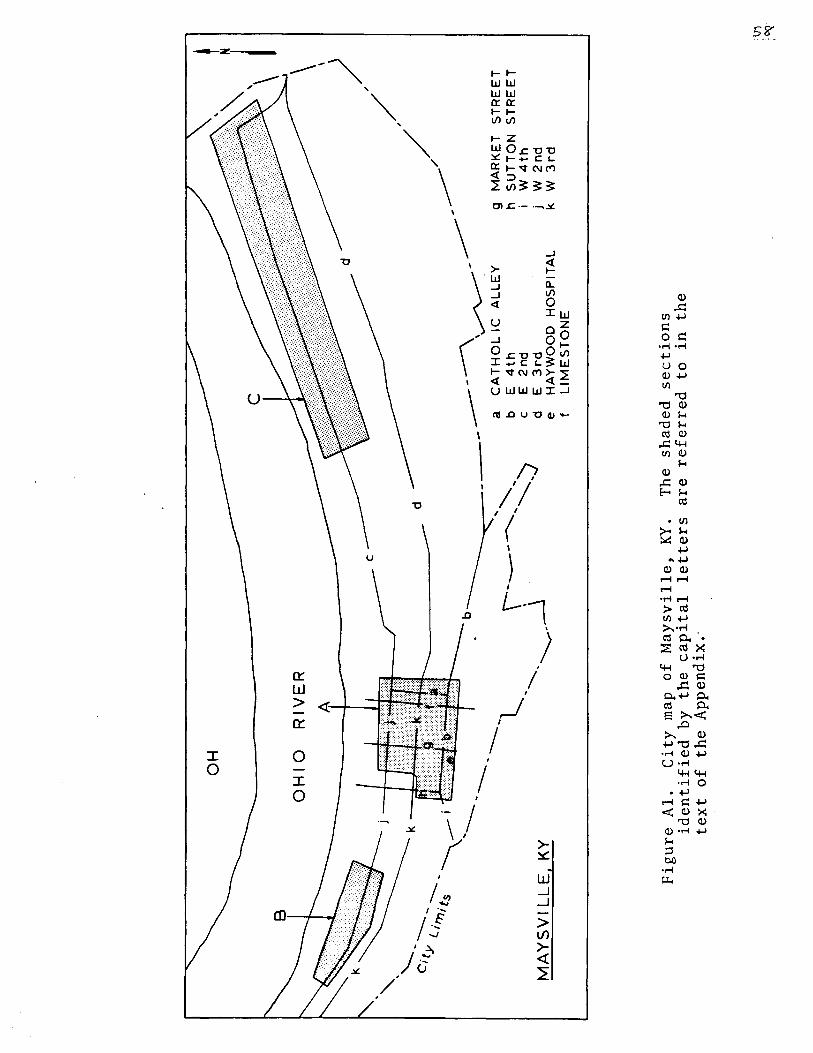
story structures, and concentrated in the three areas of
town outlined by the dashed lines in Figure AI. Throughout
the remainder of Maysville, as well as within the residential
areas to the east and west of the town that are built along
the same alluvial flood plain that underlies Maysville, were
scattered instances of broken windows, minor chimney damage,
and instances of cracking along the joints in brick walls.
The following summary is a list of the specific damage
observed in the areas outlined by the dashed lines in Figure
Al.
1. Structures within area A of Maysville sustained the
greatest damage. St. Patrick's Church, located at
the corner of East Third and Limestone Streets sus-
tained extensive plaster cracks, toppled chimneys,
and the cracked lintel shown in Figure A2; during
the earthquake the church bells were heard ringing.
The church was built in the late 1800's, remodeled
ten years ago, and sits on level ground.
Adjacent to the church, the five year old
gymnasium ceiling of St. Patrick's School separated
from the wall and partially collapsed.
Along East and West Fourth Streets between
Sutton and Limestone Streets, numerous instances of

55
plaster damage, broken and twisted chimneys, and
cracked brick walls were observed. The front walls
of one house, that was apparently in a poor state
of repair prior to the earthquake, were bowed out
wards and extensively cracked. In contrast, the
wood frame houses along the southside of Fourth
Street were, with exception to their chimneys,
not noticeably damaged.
Hayswood Hospital, which is situated on the
side of a steep hill on the southside of Fourth
Street, consists of an older section in front built
in 1911, and a newer addition in back that was built
about ten years ago. Damage to the hospital con
sisted of interior plaster cracks in the front
section as well as lateral displacements of up to
1 inch at the joints between the sections of the
front columns shown in Figure A3. The newer back
part of the hospital remained undamaged.
Across the street from the Mason County Court
House located near the intersection of Catholic Alley
and East Third Street, a section of an old stone
fence moved downhill about five inches, while another
section separated from an adjoining garden house. At
the First Presbytarian Church, which is adjacent to
the court house, one inch thick glass planes were
cracked on the ground floor, and four large north
south orientated cracks were visible in the ceiling
=

56
plaster (new in April) on the upper floor.
The most severe damage in area A, and in fact
in Maysville, was along Sutton Street. Brick walls
in the older homes were extensively damaged, as were
the majority of chimneys.
2. In the west end of Maysville within the area designated
as B in Figure AI, numerous examples of chimney damage
were observed, as well as one instance of a stone
3.
fence that had been shifted downhill about four inches.
The houses in this section of Maysville are some of
the oldest in town.
The third area in Maysville that sustained numerous
instances of damage, is the area outlined in Figure
Al on the east end of town and designated by the
letter C. The homes in this section are generally
newer than those in areas A and B, and instance of
damage were fewer and less severe. Nevertheless, this
area sustained widespread minor chimney damage, and
numerous instances of broken glass.

57
FIGURE CAPTIONS FOR APPENDIX
Figure AI. City map of Maysville, KY. The shaded sections identified by the capital letters are referred to in the text of the Appendix.
Figure A2. Cracked door lintel in St. Patrick's Church on W. 3rd Street in Maysville, KY. Photo by the Courtesy of TVA.
Figure A3. Columns at the front of the Hayswood Hospital in Maysville, KY that were displaced by as much as one inch at the joints.
OH
\ =-.
l
OH
IO
RIV
ER
\ \
~)
b ,/
-----l
.. ~--
------
---\
----
--//
,--
-',
-' ~ -
--------
c
d
~i
-u
n<
l<;c
'--__
__
' -.
....
'-
a C
AT
HO
v-
-.
-'-..,..
_.--1
-,,
, b
E
4th
L
IC
AL
LE
Y
.J
C
E
2n
d
9 d
E
3rd
~
e H
AY
WO
O
I f
LlMEST
gN~OSP
ITAL
~
--M
AY
SV
I L
LE
, K
Y
Fig
ure
A
I.
Cit
y m
ap
of
Ma
ysv
ille
, K
Y.
The
sh
aded
se
cti
on
s id
en
tifi
ed
by
th
e ca
pit
al
lett
ers
are
re
ferr
ed
to
in
the
tex
t o
f th
e A
pp
end
ix.-
MA
RK
ET
S
UT
TO
N
W 4
th
W
2n
d
W 3
rd
ST
RE
ET
S
TR
EE
T
I :Vl
i~

Figure A2. Cracked door lintel in St. Patrick's Church on W. 3rd Street in Maysville, KY. Photo by the Courtesy of TVA.
Figure A3. Columns at the front of the Hayswood Hospital in Maysville, KY that were displaced by as much as one inch at the joints.
S?

The Sharpsburg, Kentucky Earthquake of July 27, 1960
Robert B. Herrmann, Charles A. Langston
and lames E. Zollweg*
ABSTRACT
The Sharpsburg, Kentucky earthquake was the second largest
earthquake to have occurred in the U.S .. east of the Continental
Divide. in the past twenty years, having a seismic moment of 4.1 x
1025 dyne-cm. A surface-wave focal mechanism study defines a
nodal plane striking N300E, dipping 500SE and a nearly vertical
nodal plane striking N60OW. P-wave first motion data indicate
right-lateral motion on the nodal plane striking N300E, with the
pressure axes oriented east-west. These angles can be varied by ±
10° without affecting the fit to the surface wave data. The surface
wave solution is reinforced by a modeling of long-period seismo
gram.s at regional distances.
The P. pP and sP polarities and am.plitudes from the short
period vertical component array stack at NORSAR are used
together with six unambiguous short period P wave first motions
recorded in North America to test whether it is possible to con
train focal mechanism solutions with such data. These solutions
are compatible with the surface wave solution. Waveform modeling
of the NORSAR data suggests a source pulse duration of 1.0 seconds
and constrains the depth to 12.0 kIn. To match mb estimates from
·Pre8enl eddrea: Geopbysics Program AX-50. University of 1t' asbington. Seattle, WA 98195.
60

NORSAR and Canadian stations, t-, for teleseismic P, must be 0.7
and 0.5, respectively, when the synthetics are scaled using the sur
face wave seismic momenL
In spite of extensive coverage of the epicentral zone, fewer
than 70 aftershocks were recorded. The largest aftershock had an
mhI4 = 2.2.. Aftershock locations suggest that the nodal plane
striking N300]; is the fault plane. An aftershock area of 30-50 km2
implies a stress drop of 2.8-6 bars and a dislocation of 2.0-3.4 cm.
Because of the variety of studies performed, this earthquake
is presently the best studied eastern North American seismic event
with well constrained estimates of focal depth, focal mechanism
and seismic moment and indications of the duration of the source
time function and upper mantle P-wave t-.
61

INTRODUCTION
. The Sharpsburg, Kentucky earthquake occurred at 18:52:21.8 UT on July 27,
1980 and was located at 38. 17°N, 83.91OW with a focal depth of 8 km (NElS). NElS
gave magnit~de estimates ,of mb = 5.2 and Ms=4.7. Using regional phases. Mauk
et al (1982) gave the coordinales 38. 18°N and 83.94OW and a focal depth of 15 km
for the earthquake. In reviewing the earthquake history of the region. Reagor et
aZ. (I98l) noted that the earthquake occurred in an area of low seismic activity,
with no equiValent sized earthquake having occurred within 200 kIn. Because of
its size. its unexpected location. and because it was well-recorded. a number of
ditJerent types of analysis of the main shock and aftershocks were performed in
order to estimate the focal depth. focal mechanism, seismic moment and spatial
distribution of aftershocks.
MAIN SHOCK SOURCE STUDIES
Several focal.mechanism studies were performed on the main shock. Mauk
et aL (1980) used regional and teleseismic P-wave observations to obtain a focal
mechanism consisting of a nodal plane striking N 16° E. dipping 56° E with a slip
angle of 232°. Becailse this focal mechanism ditJered substantially from the ones
obtained from regional surface wave and teleseismic body waveform studies dis-
cussed in the present paper. Mauk It at (1982) reexamined their data. finding
errors in some of the seismograph station polarities. Using the corrected data
set;. they obtained a focal mechanism consisting of a nodal plane striking
N 42° E. dipping 500 E-.rith a slip angl~ of 184°. This section discusses the surface
wave and body waveform analysis of this earthquake.
Sur/ace Wave Studies.
The focal mechanism. focal depth and seismic moment were estimated
using the techniques described by Herrmann (1979). The Cenlral United States
earth model of Table 1 and the surface-wave anelaslic attenuation coefticienls of
62
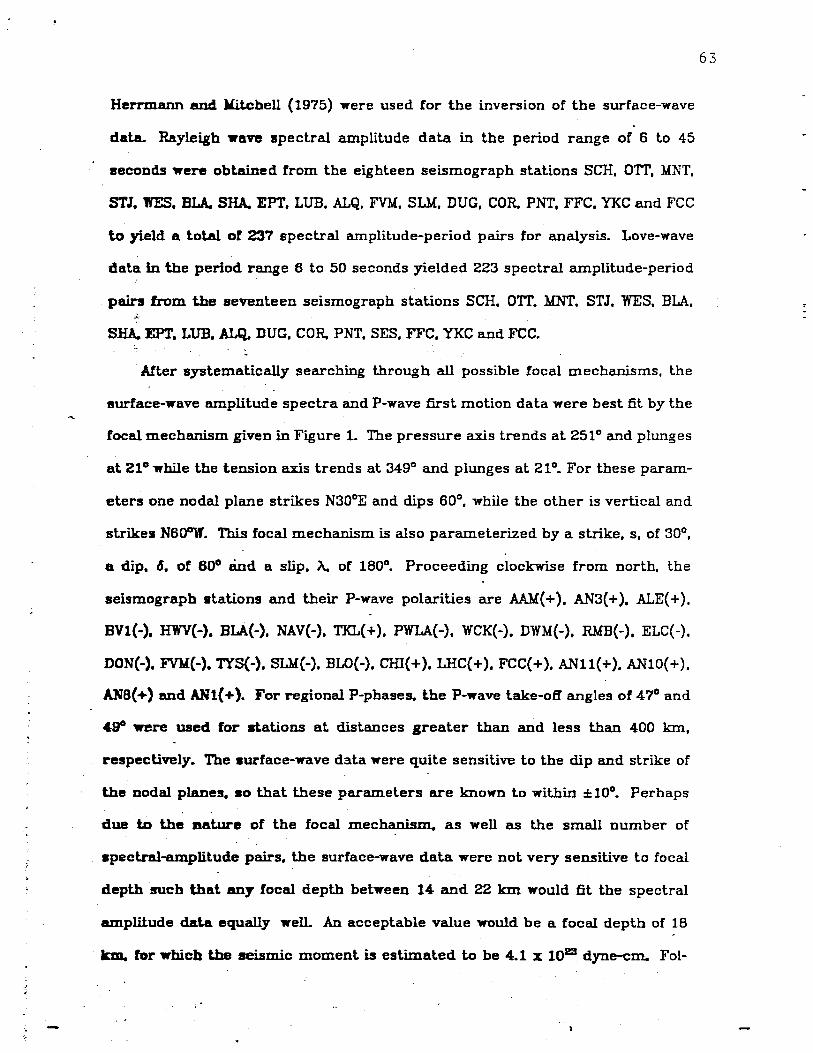
Herrmann and Mitchell (1975) were used for the inversion of the surface-wave .
data. Rayleigb wave spectral amplitude data in the period range of 6 to 45
seconds were obtained from the eighteen seismograph stations SCH. o IT, MNT.
STJ. TiES. BLA. SHA. EPT, LUB, ALQ. FYM, SLY, DUG, COR, PNT, FFC, YKC and FCC
to yield a total of 237 spectral amplitude-period pairs for analysis. Love-wave
data in the period range 6 to 50 seconds yielded 223 spectral amplitude-period
. pairs from the seventeen seismograph stations SCH. OIT. MNT, STJ. WES, BLA.
SRA. EFT. LUB. ALQ. DUG, COR. PNT. SES, FFC. YKC and FCC.
After systematically searching through all possible focal mechanisms. the
8urface-wave amplitude spectra and P-wave first motion data were best fit by the
focal mechanism given in Figure L The pressure axis trends at 251° and plunges
at 21° while the tension axis trends at 349° and plunges at 21°. For these param-
eters one nodal plane strikes N300E and dips 60°, while the other is vertical and
strikes N600\f. This focal mechanism is also parameterized by a strike, s, of 30°,
a dip. 6. of 600 and a slip. A. of 180°. Proceeding clockwise from north. the
seismograph .tations and their P-wave polarities are AAM{+), AN3{+}. ALE(+).
BV1(-). HWV{-). BLA{-) , NAV{-), TKL{+), PWLA{-) , WCK(-), DWM(-), RMB{-) , ELC(-),
DON(-). FVll{-). TYS{-), SLM(-). BLO{-), cm(+). LHC{+), FCC{+), AN11{+). ANIO(+).
ANa ( +) and ANt( +). For regional P-phases. t.he P-wave lake-off angles of 47° and
"go were used for nations at distances greater than aDd less than 400 km,
respectively. The .urface-wave data were quite sensitive to the dip and strike of
the nodal planes •• 0 that these parameters are known to within ±100. Perhaps
due to the nature of the focal mechanism. as well as the small number of
.pectral-amplitude pairs, the surface-wave data were not very sensitive to focal
depth1!l1lch that any focal depth between 14 and 22 km would fit the spectral
amplitude data equally well An acceptable value would be a focal depth of 18
kID. for whicb the seismic moment is estimated to be 4.1 x 10²³ dyne-cm. Fol-
63
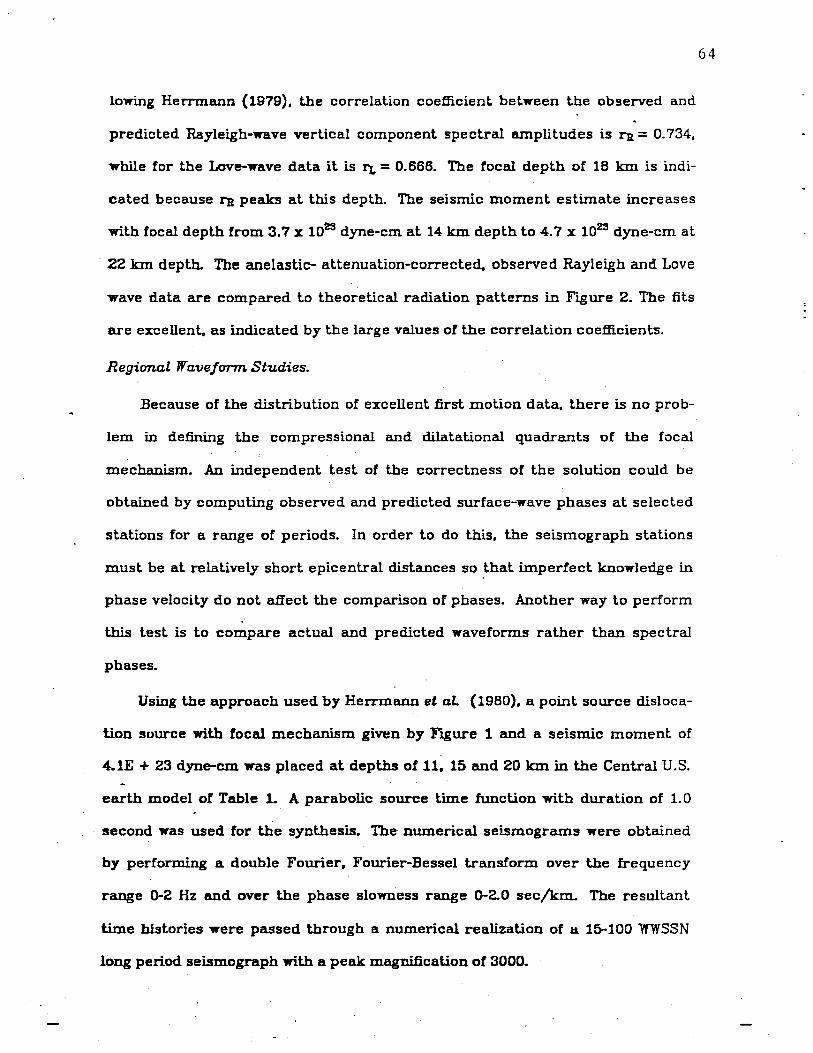
lowing Herrmann (1979). the correlation coefficient belween the observed and
predicted Rayleigh-wave vertical component spectral amplitudes is ra = 0.734.
while for the Love-wave data it is rx. = 0.666. The focal depth of 16 kIn is indi
cated because ra peaks at this depth. The seismic moment estimat.e increases
with focal depth from 3.7 x 10²³ dyne-cm at 14 km depth t.o 4.7 x 10²³ dyne-cm at
22 kIn depth. The anelastic- attenuation-corrected, observed Rayleigh and Love
wave data are compared to theoretical radiation patterns in FIgure 2. The fits
are excellent. as indicated by the large values of the correlat.ion coefficients.
Regional Waveform Studies.
Because of the distribution of excellent.1irst motion dat.a, there is no prob
lem in defining the compressional and dilatational quadrants of the focal
mechanism. An independent test of the correctness of the solution could be
obtained by comput.ing observed and predicted surface-wave phases at selected
stations for a range of periods. In order to do this. the seismograph stations
must. be at relatively short epicentral distances so that imperfect knowledge in
phase velocity do not affect the comparison of phases. Another way to perform
this test is to compare actual and predicted waveforms rather than spectral
phases.
Using the approach used by Herrmann st al. (1960). a point source disloca
tion suurce with focal mechanism given by F"lgure 1 and a seismic moment of
4.1E + 23 dyne-em was placed at. depths of 11. 15 and 20 km in the Central U.S.
earth model of Table 1. A parabolic source t.ime function with duration of 1. 0
second was used for the synthesis. The numerical seismograms were obtained
by performing a double Fourier. Fourier-Bessel transform over the frequency
range 0-2 Hz and over the phase slowness range 0-2.0 sec/km. The resultant
time histories were passed through a numerical realization of Ii 15-100 WWSSN
long period seismograph with a peak magnification of 3000.
64

Figure 3 shows the observed and predicted vertical component seismo
grams at Saint Louis, Missouri. S1M, a distance of 555 kIn from the earthquake
along an azimuth of 277'. Except for the rippling motion after the first part of
the surface wave, the waveforms and amplitudes agree well. especially the first
ten seconds of the surface wave arrival The lack of depth resolution is similar
to that inferred from the spectral amplitude study. Figure 4 presents the
observed and predicted three component seismograms for three depths at
Blacksburg, Virginia. BLA. a distance of 325.9 Jon along an azimuth of 1090 from
the earthquake. A non-linear spring resonance effect is seen in the vertical
component record. The sense of motion and amplitudes of the observed and
predicted traces are in. good agreement. The SH motion on the horizontal c?m
ponents matches the observed traces well if the predicted trace is shifted two
seconds later. However. this time shift will not yield a good match of the Ray
leigh wave motion on the vertical and east-west traces. The relative amplitudes
of the three components can be adjusted by slightly modifying the focal
mechanism since BLA lies near both Rayleigh and Love wave nodal planes (Fig.
2).
In comparing the synthetic time histories generated for the same source
but at depths of 11 and 20 kIn. the tine character of the SH arrivals cbanges, but
the time separation between the SH and Rayleigh wave arrivals did not change.
The propagation path between the epicenter and Blacksburg. 'VA is perpendicu
lar to the Appalachian Mountain front. with the depth to the Precambrian chang
ing from about 1 km at Sharpsburg to.5+ km in eastern Kentucky. This indi-
~ cated that the Central U.S~ earth model is certainly not applicable for that path.
Multiple-filter analysis (DzielYonski et al.. 1969) was used to study the Ray
leigh and Love wave dispersion to BLA. In an attempt to match the group velo
. city. the upper layer of the Central U.s. earth model was increased in thickness.
65

·'
The resulting Appalachian Basin model is given in Table 1. A suite of .seismo
grams was generated for a depth of 14 kIn in that modeL This depth was chosen
to be closer to the estimates from teleseismic body waveforms. The discrepancy
between the observed and predicted Rayleigh and SH phases was not completely
resolved.
The use of synthetic seismograms reinforced the surface wave P-wave first
m.otion conclusions concerning the focal parameters. . The observed seismo
grams were fit in their major characteristics. but as seen from the discussion of
the BLA records. the problem of crustal structure is importanL The quality of
data was not sufficient to start a study of crustal structure.
Body Wa:veform Studies.
P waves from the Sharpsburg earthquake were large enough to be recorded
at the NORSAR seismic array offering an unprecedented opportunity to accu-
. rately determine source depth for an Eastern U.S. earthquake by using telese
ismic depth phases. Figure 5 displays 25 seconds of the short period waveform
at NORSAR derived by summing the responses of each center element from each
~ubarray. The surface reflections pP and sP are plainly visible as the prominent
arrivals about 4.2 and 5.7 seconds after direct P. respectively. A depth of 12 km
is obtained for the event using this timing information using standard travel
time tables.
In addition to depth information obtained by the pP and sP observations,
,the amplitudes and polarities of pP and sP relative to direct P also offer
independent constraints on the source mechanism. Unambiguous P-wave first
motions allow considerable variation in the placement of the P nodal planes (Fig
ure 6). To improve the body wave fault plane solution the polarities and ampli
tude of sP and pP relative to P at NORSAR were used in conjunction with unambi
guous P first motions read from ALE{+).'EDM(+). FCC(+). LUB(-). SCP(-). and
66
BLA(-), NORSAR(+).
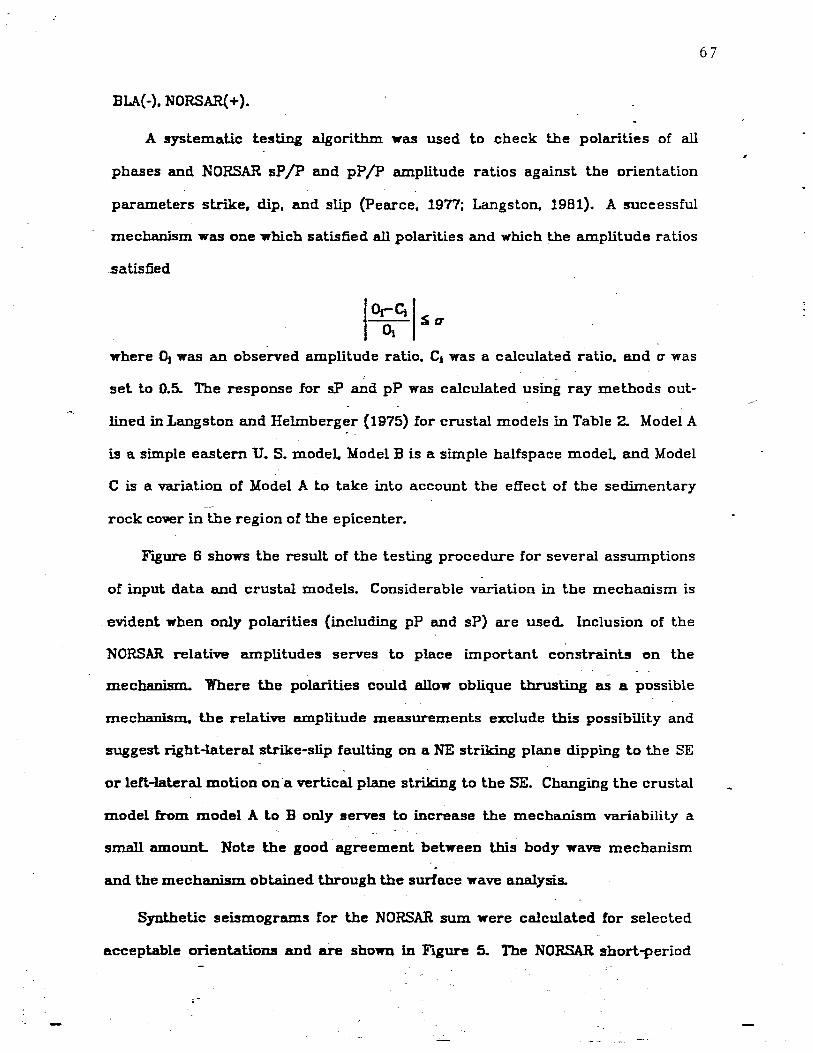
A syst.ematic testing algorithm. was used to check the polarities of all
phases and NORSAR sP /p and pP /p amplitude ratios against the orientation
parameters strike, dip. and slip (Pearce, 1977; Langston. 1981). A successful
mechanism was one which sat.isfied all polarities and which the amplitude ratios
satisfied
where Ot was an observed amplitude ratio. Cj was a calculated ratio. and u was . -
sel to 0.5. The response for sF and pP was calculated using ray methods out-
lined in Langston and Helmberger (1975) for crustal models in Table 2. Model A - .
is a simple eastern U. S. model. Model B is a simple halfspace model. and Model
C is a variation of Model A t.o take int.o account the effect of the sedimentary
rock cover in the region of the epicenter.
FIgure 6 shows the result of the testing procedure for several assumptions
of input data and crustal models. Considerable variation in the mechanism is
evident when only polarities (including pP and sP) are used. Inclusion of the
NORSAR relative amplitudes serves to place important constraints on the
mechanism. Where the polarities could allow oblique thrusting ~ a possible
mechanism. the relative amplitude m.easurements exclude this possibility and
suggest rlght-lateral strike-slip faulting on a NE striking plane dipping to the SE
or left-lateral motion ona vertical plane striking to the SE. Changing the crustal
model from model A to B only serves to increase the mechanism variability a
small amount. Note the good agreement between this body wave mechanism
and the mechanism obtained through the surface wave analysis.
Synthetic seismograms for the NORSAR sum were calculated for selected
acceptable orientations and are shown in Figure 5. The NORSAR shorl-period
67
,

instrument response and a Fut.t.erman (1962) attenuation operator (t~ = 1.0) .
were included. Adding a lowervelocityiayer.t the surface of crust A to produce
crust C served lo reduce the BP conversion BOmewhat, improving the relative
amplitude behavior of this phase. }iote the good agreement in phase timing and
waveshape between observed and .1Dt.betic. This is all the more remarkable
considering that the data are short-period. It was found that a triangular far-
field time function with a rise time of 0.8 .ec and a fall-oft' time of 0.2 sec fit the
direct P waveform with respect to the small initial compression compared to the
large dilatational backswing immediately after. Minimum. phase or symmetric
far-field time functions did not produce the large positive third swing seen in the
data. A change of one km in depth is discernible as a time shift between the sur-
face reflections and direclP in the EJTlthetic waveforms. This can be taken as
the uncertainty in the depth estimate. This independent determination of the
source depth agrees with the lower range of the 14 to 22 kIn depths permitted
by the surface wave modeling.
No particular significance should be attached to the exact shape of the time
function or choice of the attenuation operator. These parameters serve only as
a v~hicle to provide a P pulse shape for use in testing the relative amplitudes of
pP and sP to P in Figure 5. Numerical experiments with NORSAR and WWSSN
short-'period instrument response. do .how. bowever. that pulse duratiDn is
related mainly to the duration of the time function with the amplitudes being a
sensitive function of the attenuation. V-ina the seismic moment of 4- x 1023
dyne-cm determined from the surface waft. and the lime function determined
from lhe NORSAR P wave •. an estimate of averllIe t- may be made by comparing . -
synthetic and observed m. Yalues. Table 3 presents teleseismic P mb data
determined by Stevens (1980) for the Sharpsburg earthquake. Assuming a t* of
.1.0 and calculating synthetic p~ Jiel.d.s an average m. of only 3.9
68
compared to the observed 4.8. This is complicated by an amplitude instability
due to the strike-slip source modeL Several stations in Yestern Canada lie near
the theoretical P wave node for the choice of orientation used (dip. 50°: slip.
180°; strike. 30°) for the .synthetics. Since the orientation is only known to
within about ±10o for all angles. synthetic amplitudes for these stations will
display large variations for small changes in the fault orientation. An averag e mb
of only 4.1 is calculated disregarding these nodal stations. still too low by nearly .
an order of magnitude. Assuming a t* of 0.5 dramatically improved the mb com-,
parison. Scaling the t* at NORSAR to yield the correct llbserved P amplit.ude for
a moment of 4 x 10²³ dyne-cm yields a t* of 0.7.
-These t* calculations are subject to many unknowns. particularly those due
to uncertainties in geometric spreading. the uncertainties in the surface wave
seismic moment calculation. and possible uncertainties in the shape of time
function. Values of t* lowe.r tJ:lan 1.0 at 1 second period are consistent with
~ther estimates of teleseismic t· for non-t.ectonic areas (e.g. Frasier and Filson.
1972). although there is continuing debate on this topic (Hem;berger and Had
ley. 19B1: Der and McElfresh. 19BO). The t* values determined here n~ed further
independent confirmation before being accepted.
AFTERSHOCK STUDIES f .'
Mtershocks of the July 27. 19BO Sharpsburg. Kentucky earthquake were
monitored With portable instruments by groups from the University of llichigan.
the University of Kentucky. Vlrginia Polytechnic Institute and State University.
the Tennessee Earthquake Information Center. and the U.s. Geological Survey.
Saint Louis University participated by loaning the UK/l'EIC party aix s.ets of
. instruments. 31 sets of portable instruments were available. mainly analog
smoked-paper or pen-and-ink systems ~rd.ing only the vertical component of
69

,': ,
ground motion. Five tbree-component lriggered-digital .. eismo,raphs were
deployed by the USGS. 46 recording sites were occupied during the field pro-
gram. Ytgure 7 shoW's the locations of the recording sites.
Monitoring was begun 'by a team from the University of llichigan about 15
hours after the main shock. at a site about 45 km from the main shock epi-
center. The TEIC/UK group began monitoring within 5 .km of the main shock ,
. about 17.5 hours after it occurred. By 2300Z on July 29. 5eVen stalions were . . ! .
operating aL dist.ances of 4-23 kIn from the afLershock zane. .. Yhile the Ull learn
. pulled out lale on July 30. the arrival of the USGS and VPI groups and the instal
lation of additional slations by the· UK/TEIC rapidly improved. the coverage.
Some initial confusion about ·the main shock epicenter ~as caused by the
apparent high-intensities observed al Maysville. Kentucky. (Ytgure 7) about 50
km north of Sharpsburg (Reagor et al, 1981). Initially anumber of stations were
_ deployed in this general area. However. by J~ly 30. epicenters had been
obtained for one or two aftershocks and the USGS B:Ild VPI groups relocated, On
August 1 at least 15 stations were operating within 30 kIn of the aftershock zone.
Such dense monitoring continued. until August 8-10. when waning activity
caused all groups to either pull out or reduce the number of monitoring sites . .. Nearly continuous recording has been m.aintained in the erea by one to' two
_ lIemi-permanent. stations installed by the UK and the TEIc..Station location and
operational information are contained in Table 4.
Ytgure 8 plols the rale of occurrence of aftershocks witbrespect. to time . . -
. Aftershock activity was light for an earthquake of this magnitude. In spite of the
early installation of high-gain instruments very close to the epicenter, only 69
aftershocks have been identified through early May 198L :"Nearly half of the
identified aftershocks occurred' within 96 hours of the:-DUlin quake; the
-occurrence rate dropped dramatically after the largestlelt.aftersbock occurred
70
-

on July 31. Only 18 aftershocks exceeded magnitude ML = 0, and the largest aft-
ershock had a magnitude of only mb.I4 = 2.2. Two events in the magnitude 1.5
range occurred before the installation of any temporary stations. These aft-
ershocks were identified on records of the me station in Tuckaleechee Caverns,
Tennessee (TKL). at. a distance of about 280 kIn from Sharpsburg. Presumably a
number 1)f smaller aftershocks also occurred in this time intervaL The I1ft-
Ershock list presented in Table 5 is probably t:omplete down to magnitude ML = -1 after .about IBOOZ on July 28. Magnitudes were computed down from formu-
lae for ML (duration) (Bollinger et al.. 1976) and mb~ (Nuttli. 1973). They were
found to be roughly equivalent in the range 0.4 to 2.2 when both types of magni-
tude could be computed. and so are used intercbangeably.
Several aftershocks were fell. That of July 31, 1980 (magnitude 2.2) awak-
ened sleepers over an area of several hundred square km and did additional
damage to a house south of Sharpsburg that had been badly damaged in the
main shock The earthquakes of August 25 (mag~tude 2.0) and December 30
(magnitude 1.6) were felt over areas of roughly 500 to 1000 square kIn. respec-
lively. Earthquakes on July 3D, 1980 and January 14. 1981. both of magnitude
1.5. were reported felt by a few persons in the Sharpsburg area. A magnitude
0.7 quake on February 8, was also reported felt. bullhis is considered_doubtful.
It is unusual for such small events to be felt over such large areas. "For
-. example. Nuttll and Zollweg (1974) found that central United Stales earthquakes
-~th felt areas of 500 to 1000 square km generally had magnitudes in the range
of 3 to 3.5. while earthquakes in the magnitude interval of 1.5 to 2.2 normally
were not fell at alL This effect can only parUy be explained by the idea of a
"sensitized population" noticing smaller shocks than they normally would. The
luly 31 earthquake occurred in the early morning when many were asleep, yet
was the most wide1T perceived aftershock.
I'
71
•
1 ..
.. i-

'"; ..
-- .
Data. AnaLysis.
Arrival times of a.ft.ershock phases were read lo the nearest 0.05 or 0.1
second. depending on whether the drum. speed of the original record was 120 or
80 mm/min. respectively. Somewhat higher resolution of the arrival times is
possible by enlarging the original records, but the sheer number of stations that
were available for most events makes it hiah1y unlikely that the conclusions of
this study would be lIeriously altered.. alt:hough it is possible thal smaller stan
dard errors in the locations could result.. In generaL P- and S-wave arrivals were
" sharp and clear on most stations. allhough a few seem to have been near nodes
of the SV-wave radiation pattern. ,Since no horizontal-component information
was available. all readings for S were made from vertical seismographs.
To lIlitigate potential timing problems due to inaccurate drum rotation.
nearly all stations superimposed either I-second or lo-second time marks on
the data. With the exception of two instruments. chronometer drift rates were
. less than about 0.1 second per day. All readings were made by the same analyst.
and were subjectively weighted according to quality on a scale ranging from 0
(higbest quality) to 4- (not used).
Brumfield (19B2) used data aenerated by a nwnber of limestone quarries
exist in the region of the station network ~o establish a local velocity model. Two
of the quarries. at F1emingsburg and North Middletown. were so situat.ed that a
line through them passed aI_ong' the northwest edge of the aftershock region .
. This suggested construction of a revened refraction profile, since most stations
recorded at least one blast from each area. Brumfield (1982) found a velocity of
6.B7 km/sec for P11lves refract.ed.t. depth of about O.B kID and 3.91 km/sec
for the corresponding 8-wave. Dip along the reversed profile was negligible.
Several .more distant quarry blasU (4 ~ 100 k:m) were also examined. P-wave
. phase velocities acl"DSS the net-..it Nnced roughly between 6 3/4 and 7
72
.. :
--
kIn/sec. confirming the result. from local blasts and indicating there is little if
any dip at right angles to the reversed profile. A P-wave velocity of 5.52 kIn/sec
. was used for the top 1 km of sedimentary rocks; this was the average of several
"Wen velocities provided by.an oil company that had drilled in the area.
These velocities are unexpectedly high for such shallow depths. They are
roughly equivalent to some surface velocities in New England and the Canadian
Shield where the paths are entirely through highly-competent metamorphic and
. igneous material The Base-menl. Rock Map oj the United States (Bagley and . .
Yueblburger. 1968) indicates that the epicentral region lies just a few kIn south
of lhe maximum extent of the Grenville Front.. and that the hypocentral region
. 'Would be in the Grenville Province if it extended farther south. Aside from these
considerations. the P- and S-wave data sels for 29 of the best-recorded aft-
ershocks were run independently using HYP071 (Lee and Labr. 1971). While the
epicenlers agreed for the two independent sets with almost any reasonable
choice of velocities (this is because very little data were available for distances
greater than 25 km). velocities similar to those found in the refraction experi-
ment were required to gel the focal depths to agree.
No good information is presently available on the deeper velocity structure .
. S"mce the velocit.y at. a depth of only 1 km exceeds that assigned by NulUi et aL.
(1969) for depths of between 20 and 40 km in the Central United States, it is
presently bypothesized that the ~.65 km./sec velocity for P waves can be applied
-as far down as the Yoho. or to Ii depth of around 40 km. The velocity model.
based on the work of Brumfield (1962). used to locate the aftershocks is given in
Table 6.
Because the network used to record the Sharpsburg aftershocks varied on
practically a day-to-day basis. joint.-hypocenter determination techniques were
. used to locale the better-record.ecl events relative . to a particularly well-
73

recorded aftershock {Herrmann et aL. 1981}. 52 earthquakes recorded by a .
minimum of three stations observing both P and S were chosen. The reference
event used was the aftershock at 0812Z on August 3. Its HYP071 location was
assumed to be fixed.
Relative locations in general were quite good. with most having horizontal
. and vertical error-ellipse major-axes less than O.B kIn for 95% confidence. Fig-
ure 9 shows that there is no distinct trend in the epicenters. which cluster in an
area of about 30 square km. However. vertical profiles plott.ed at various
azimuths clearly show the aftershock zone dipping at about 50 degrees to the
. southeast {Figure 9}. The strike corresponding to this dip is about N30E. with an
error not. exceeding ten degrees. The fault area involved is about 3D-50 square
. kIn.
Individual fault plane solutions could be determined for only two aft-
ershocks: that of 1701Z July 30. 19BO {magnitude 1.5} and that of 0926Z July 31 •
. 1980 (magnitude 2.2). While the solut.ions differ in the nature of the faulting
indicated. a plane striking NNE is common to both. Figure 10 shows that the 30
July shock was nearly pure thrust.. while the July 31 earthquake had a strike-slip
mechanism very similar to that of the main shock. A composite solution {Figure
10} for the remaining events is very similar to the solution for the July 21 main
shock. From these solutions. it is estimated that the preferred fault plane
strikes about N2Q-30E and dips ~O degrees to the southeast.. in·very close agree
m ent with the strike and dip of the aftershock zone.
Discussion.
The importance of the aftershock study lies not in any innovation of lech-
nique or instrumentation. but rather in the fact that it is the first time that an
aftershock sequence of a moderate eastern North American earthquake has
been adequately obsened. . The exceptionally rapid deployment of portable
74

75
instruments was the major departure from pre"ious st.udies such as. those of
Lange and Westphal (1963). Stauder and Pitt (1970). or Bollinger et a.L. (1976).
wherein the temporary networks were not operational for at least two to three
days after the main shocks. In addition. the large number of instruments used
in the present study allowed some margin for error, Le. virtually the entire
meizoseismal area was instrumented and therefore the location of the main
shock was not as critical as it might have been if, for example. only five or six
. portable seismographs been available. The rapid decrease of activity fallowing
the large aftershock of July 31 confirms the importance of installing temporary
stations as soon as possible after the main shock. if significant results are to be
obtained.
For so large an earthquake. both the total number of aftershocks and the
maximum magnitude aftershock are anomalous. Such weak aftershock
sequences. however. seem to be typical of many eastern North American earth-
quakes. If the Sharpsburg sequence is considered to be normal. insofar as
eastern earthquakes are concerned. the failure of previous investigations to
record aftershocks for similarly large events in the last two decades is readily
explained. -
Apart from the small number of evenls involved and the low overall energy
release of the lotal aftershock sequence, there does not seem to be anything
particularly Wlusual about Sharpsburg aflershocks. The cluslering of the aft-
ershocks about a planar surface allows for the first time an independent esti-
. mate of the source area of an eastern earthquake of moderate size. The length
of this zone along the strike is 6 to 7 km-- This observed result clearly refutes
the suggestion of Evernden (1975) thal eastern Uniled Stales earthquakes have
much smaller faulliengths when compared to western earthquakes of the same
magnitude. Table 7 and F"J.gure .11 compare the maximum. length of the
•

Sharpsburg aftershock zone with several western United States earthquakes for
which detailed aftershock investigations yere made. It is clear that the
Sharpsburg fault length falls well within the range, although near its lower end.
This plot ignores the possibility that there is a bias in teleseismic IDb between
eastern and western U. S. earthquakes. Herrmann and Nuttli {1962} presented
evidence that the western IDb is about 0.4 units lower than that of an equivalent
eastern U. S. earthquake. Equalizing for this magnitude bias would lower the
Sharpsburg mb or raise the other .mb'S by 0.4 magnitude units.' but would not
alter the conclusion that the Sharpsburg fault length is within the range for
earthquakes of similar magnitude.
Given a seismic' moment Mo = 4.1 X 10²³ dyne-cm fo~ the main shock and
. assuming that the aftershock zone corresponds to the fault surface of the main
_ shock. estimates of the dislocation and stress drop of the main shock can be
made .. Assuming J.L = 4 x lOU dyne/cm2 and a fault area of 30 - 50 km2• the
average dislocation u is obtained frOID
_ llo=J.LuA
from which we estimate u = 2 - 3.4 em. Using a relation for the stress drop for
an instantaneous dislocation on a circular fault plane. (Brune. 1970).
. 7 Me, Au = 16 r3'
we find Au = 2.6 - 6 bars by using r = 3.1- 4.0 kID. Assuming that the frequency
content of the far-field P pulse is the same as that of the S pulse for a small
earthquake of this size. we can estimate the corner frequency fo = 2.34 p/2rrr =
0.36 - 0.36 Hz using the equivalent radius r (Brune. 1970). A triangular source
time function with total duration of 1.0 sec would have a corner frequency
between 0.6-0.9 Hz. .Thus the aftershock fault dimension. r. is consistent with
the duration of the P wave pulse obtained from the NORSAR data.
76

77
CONCLUSIONS
. The Sharpsburg. Kentucky earthquake is. now one of the best studied
eastern North American earthquakes. On the basis of the seismic moment. it is
the second largest earthquake to have occurred in eastern North America since
1961 (Herrmann. 1979). second only to the November 9. 1968 southern Illinois
earthquake. The focal mechanism was constrained by two independent data
sets. The focal depth of the main shock was constrained by surface wave spec-
t.ral amplitude data. teleseismic P-waveforms and aftershock locations. A Iocal
depth of 12 km is reasonable. The seismic moment. magnitude and stress drop
are consistent with other eastern U.S. earthquakes studied (Street et al .• 1975;
Street. and Turcotte, 1977). Even though the seismic source parameters are
within the range of expected values. the question of why the earthquake
occurred when it did cannot be answered from the present data.
This study routinely used recently developed seismic waveform modeling
t.echniques. In the case of the regional waveforms. more data would have been
available if long period analog seismograms had not been saturated. H we are Lo
obtain the maximUm information from such earthquakes in the future, lhe
instrumentation wil.l have to be improved to match our computational abilities.
ACKNOWLEDGllENTS
We are particularly indebted to Ron Street of the University of Kentucky
and his students for coordinating and pedorming much of the aftershock study.
Doug Christensen. Gil Bollinger, and Charley Langer made available the original
seismograms recorded by aftershock study groups from the University of Michi-
gao. Virginia Polytechnic m.tltute and State University. and the U.s. Geological
Survey. respectively. llr. Ray Robertson of Bethel. Kentucky has continued to
operat.e the BETH station to provide ongoing monit.oring o~ late aftershocks. We
are grateful to the numerous landowners who allowed operation of the tem
porary stations on their property.
We would like to thank Dr. E. Husebye for providing a copy of the NORSAR
data. This research was supported by the Advanced Research Projects Agency of
the Department of the Defense and was monitored by the Air Force Office of
Scientific Research under Grant AFOSR-7B-352B (CAL), the U. ~. Nuclear Regula
tory Commission under Contract NRC-04-76-2B2 and the U. S. Geological Survey
under Contracts 14-08-0001-1670B and 14-0B-0001-19751 (RBH). the U. S. Nuclear
.. Regulatory Commission under Contracts NRC-04-78-200 and NRC-D4-79-214 and
by the Slate of Tennessee (JEZ).
78
.79
REFERENCES
Allison, Y..L., J.R. Whitcomb, C.E. Cheatum, and R.B. McKuen (1978). Elsinore
fault seismicity: the September 13. 1973. Agua Caliente Springs, California ~;;~{t·
earthquake sequence, BulL Seism. Soc. Am.. 68. 429-440. i.~ .. . . . . __ ._ . ~ __ ~~~,'J" .
Bagley. R.W. and W.R. Muehlburger (1968). compilers, Basement Rock Ma.p of the :.,":"~:.~ ---~:-:~~ .
United Sta.tes. U.S. Geological Survey. .
Bollinger, G.A.. C.J. Langer, and S.T. Harding
,
i (1976). The eastern Tennessee
t."""'~
~Z·;-· ii~-::;'i ..,--",,:y;.:"!--- ... ,;, .
earthquake sequence of October through December, '1973, BuZl. Seism.. Sot:.. ~'g~ . - -~.~
.' .... :~ _: i~?Iz . .Am.. 66. 525-548. . -:..
,.~<,~ ~_J ...,,_ .. '~ Brumfield, K. (1982). A geophysical investigation of the Paleozoic sedimentary ~,~.,
,or -~
sequence in the Precambrian basement structure in the Sharpsburg, Ken-.=:- .....
tucky area, M. S. Thesis. University of Kentucky. Lexington, Ky.
t;::~. Brune. J.N. (1970). Tectonic stress and the spectra of seismic shear waves from ~<~
~,~,-,"~: _,c .. :!
earthquakes. J. Geophys. Res. 75, 4997-5009. 1;:t~,
. : - ';',-~-
Der, Z.A. and T.W. McElfresh (1980). On the value of t; and to; in the short-period ~f2~'
I band and regional variations 'Of the same across the UnitedStates, BUlL
I
Seism. Soc. Am.. 70. 921-924.
Dziewonski. A.. S. Block and M. Landisman (1969).
transient seismic signals. BulL Seism.. ,Soc. Am.. 59.427-444.
Eaton.- J.P. M.E. O'Neill. and J.N. Murdock (1970). Aftershocks of the 1966
Parkfield-Cholame, California. earl..hquake: a detailed study, BulL Seism..
. Soc. Am. 60. 1151-1197.
Ellsworth, W.L. (1975)., Bear Valley, California.. earthquake seqUEnce
February-March 1972, BuLL Seism. Soc. Am. 65.483-506.
~-~'-:-~. ~_.4
. .
:.:.' -.'
I
Evernde~. J.F. (1975). Seismic inte:lsities. Hsize" oi earthquakes and related
parameters. Bull. Seism. Soc. Am. 65, 1287-1314.
Frasier. C. and J. F"llson (1972). A direct measurement of the earth:s short
period attenuation along a teleseismic ray path. J. Ceophys. Res. 77, 3782-
3791.
Futterman, W.I. (1962). Dispersive body waves, J. Ceophys. Res. 67.5279-5291.
Grant, W.c.. C.s. Weaver, and J.E. Zollweg (1981).· The February 14. 1981. Elk
Lake. Washington. earthquake and its aftershock sequence (abstract). EOS
62, 966.
HeImberger. D.V. and D.M. Hadley {19Bl}. Seismic source functions and attenua
tion from local and teleseismic observations of the NTS events Jorum and
Handley. BuZL Seism. Soc. A71L 71. 51-68.
Hernnann. RB. (1979). Surface wave focal mechanisms for eastern North Amer
ican earthquakes with tectonic implications. J. Ceophys. Res. 84. 3543-3552.
Herrmann. R B. (19B1). Waveform studies of the July 27. 1980 Kentucky earth
~ quake (abstract). Earthquake Notes 5~ 33.
Hernnann. RB. and B.l. Mitchell (1975). Statistical analysis and interpretation
of surface-Tave anelastic attenuation data for the stable interior of North
America. BulL Seism.. Soc. A77L 65.209-218.
Herrmann. RB., I.W. DeW'ey and S.K. Park (1980). The Dulce. NeW' Mexico. Earth
quake of 23lanuary 1966. Bull. Seism.. Soc. Am. 70. 2171-2184.
Herrmann. RB., S.K. Park and C.Y. Wang (1981). The Denver Earthquakes of
.1967-1968. Bull. Seism. Soc. A77L 71. 731-746 .
. Herrmann. R-B. and O. W. Nutlli (1982). Magnitude: the relation of llL to mbJ..£.
Bu.ll. Srr..sm.. Soc. Am. 72. 3B9-397.
)
80

81
Lange. A.L.. and W.H. Westphal (1963). Seismic aftershock investigations - Pro-,
jecl VELA UNIFORM. Fisk, Missouri. earthquake or 3 March 1963, Technical
Report No.3 p-repa.red for Advanced Reseq,Tch Projects Agency by Stanford , .
Research Institute under Contract AF 49(638)-1205.
Langston, C-A. (1981). Source inversion of seismic waveforms: The Koyna, India,
earthquakes of 13 September 1967. Bull. Seism.. Soc. Am. 71. 1-24 .
. Langston. C.A. and D.V. HeImberger (1975). A procedure for modeling shallow
. dislocation sources. Ceophys. J. 42. 117-130.
Lee. W.H.K.. and J.C. Lahr (1975).HYP071 (Revised): a computer program for
.~ determining hypocenter. magnitude. and first motion pattern of local earth-
_ quakes. U.S. CeoZ. Surv .• Open-File Rept. 75-311. 113 pp.
Maule. F. J. and D. H. Christensen (1980). The Sharpsburg, Kentucky, earthquake
of 27 July 1980: main shock . mechanism and isoseismal data (abstract), '-
Earthquake Notes 51. 26.
Maule. F. J-. D. Christensen. and S. Henry (1982): The Sharpsburg, Kentucky
earthquake o~ 27 july 1980: main shock parameters and isoseismal maps,
.Bull. Seism. Soc. Am. '72. 000-000.
Mohler. A.S. (1980). Earthquake/eart.h tide correlation and other features of the
Susanville. California. earthquake sequence of June-July 1976. BulL Seism.
Soc. Am. 70.1563-1593.
Morrison. P.W .• Jr •• -B.W. Stump. and R. Ubrhammer (1976). The Oroville earth-
quake sequence of August 1975. BulL Seism. Soc. Am. 66. 1065-1084.
Nuttll. O. W. (1973). Seismic wave· attenuation and magnitude relations for
eastern North America. J. CeophllB. Res. 78.676-885.
Nuttll. O.W-. and J.E. Zolbreg (1974.). The relation between fell area and magni-
tude for Central United State. earthquakes. Bull. Srism.. Soc. Am. 64. 73-86.

Nuttli. O.W, W. Stauder. and C. Kisslinger (1989). Travel lime tables for earth-
quakes in the central United States. Earthquake Notes 40. 19-28.
Pearce. RG. (1977). Fault plane solutions using relative amplitudes of P and PP.
Ceophys. J. 50.381-394.
Reagor. B.G .• C.W. Stover. and M.G. Hopper {1981}. Preliminary report of the dis-
tribution of intensities for the Kentucky earthquake of July 27. 1980, U.S.
Ceol. SUTV •• Open-File Rept. 81-198. 71 pp.
Somerville,lLR., W.A. Peppin, and J.D. Van Wormer (1980). An earthquake
sequence in the Sierra Nevada - Great Basin boundary zone: Diamond Val-
ley. BuZl. Seism. Soc. Am. 70.1547-1555.
Stauder. W., and AM. Pitt (1970). Note on an aftershock study, South Central
Illinois earthquake of November 9, 1968, BuZl. Seism. Soc. Am. 60. 983-986.
Stevens, AE. (1980). Canadian magnitude determinations for the Sharpsburg,
Northern Kentucky. earthquake -of 27 July 1980, Seismological Service of
Canada Internal Report 80-11, Division of Seismology and Geolhermal Stu-
dies. Earth Physics Branch, Dept. of Energy. Mines and Resources, Ottawa,
Canada.
Stierman, D.J •• and W.L. Ellsworth (1976). Aftershocks of the February 21. 1973
Point Mugu. California earthquake, Bull. Seism.. Soc. Am. 66.1931-1952.
Street, RL.. RB. Herrmann and O.W. Nuttli (1975). Spectral characteristics of
the Lg wave generated by central United States earthquakes, Ceophys. J.
41.51-63.
Street, RL. and F.T. Turcotte (1977). A study of northeastern North American
-spectral moments. magnitudes and intensities. Bull.. Seis7n. Soc. Am. 67.
599-614.
82 -I ~ '" l • j
: • •

Thatcher, W •• and R.M. Hamilton (1973). Aftershocks and source characteristics
of the 1969 Coyote Mountain earthquake. San Jacinto fault zone, California
Bull. Seism. Soc. A77L 63,64-7-662.
Wu. F.T. (1968). Parkfield' earthquake of June 28. 1966: magnitude and source
mechanism, BulL Seism. Soc. Am. 58.689-710.
Zollweg. I.E •• and R.S. Crosson (1981). The Goat Rocks Wilderness. Washington.
earthquake of 28 May 1981 (abstract). EOS 62. 966.
, . Department of Earth and Atmospheric Sciences . Saint Louis University
P.O. Box 8099 St. Louis, MO 63156 (RBH)
Department of Geosciences The Pennsylvania State University 4-03 Deike Building University Park. PA 16802 (CAL)
Tennessee Earthquake Information Center Memphis State University Memphis. TN 38152 (JEZ)
" j ~
/
83
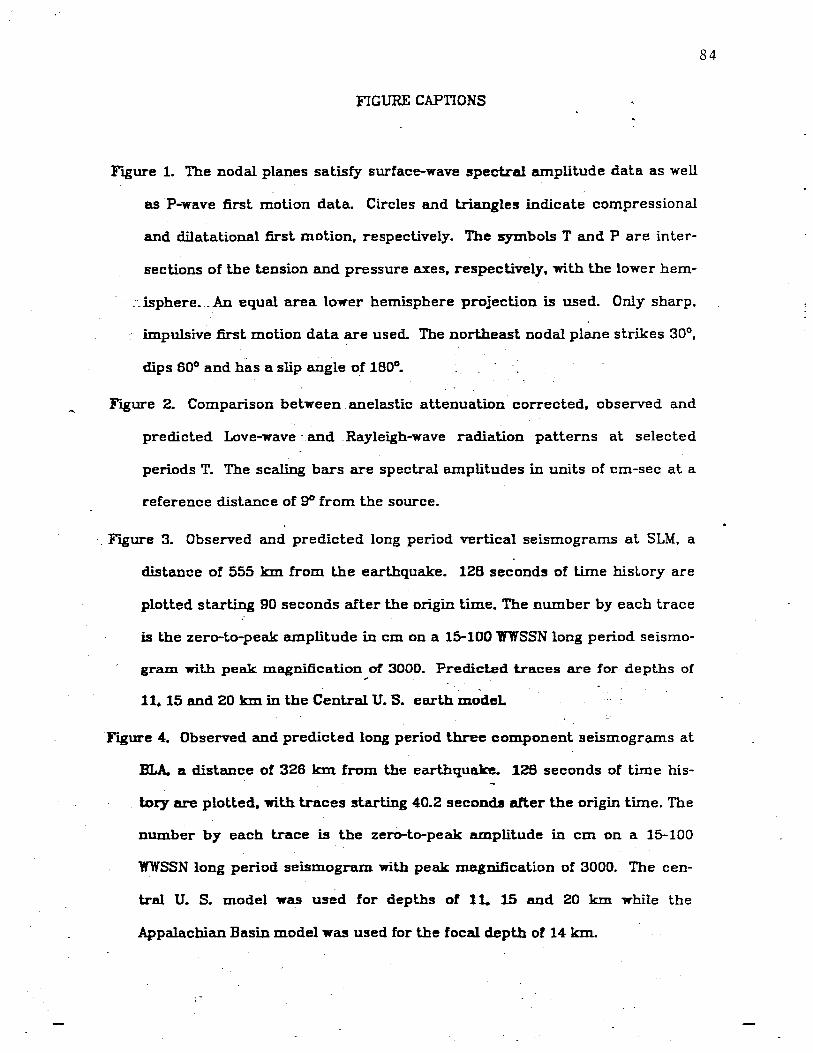
FIGURE CAPTIONS
FIgure 1. The nodal planes satisfy surface-wave spectral amplitude data as well
as P-wave first motion data. Circles and triangles indicate compressional
and dilatational first motion, respectively. The symbols T and P are inter
sections of the tension and pressure axes, respectively. with the lower hem-
~~isphere .. An equal area lower hemisphere projection is used. Only sharp.
impulsive first motion data are used. The northeast nodal plane strikes 30°,
dips 600 and has a slip angle of 180°.
Figure 2. Comparison between anelastic attenuation corrected. observed and
predicted Love-wave and Rayleigh-wave radiation patterns at selected
periods T. The scaling bars are spectral amplitudes in units of cm-sec at a
reference distance of go from the source .
. F"Igure 3. Observed and predicted long period vertical seismograms at. SLM. a
distance of 555 kIn from the earthquake. 128 seconds of lime hislory are
plotted starting 90 seconds after the origin time. The number by each trace
is the zero-to-peak amplitude in cm on a 15-100 WWSSN long period seismo
gram with peak magnification, of 3000. Predicted traces are for depths of
11. 15 and 20 kIn in the Central U. S. earth model
Figure 4-. Observed and predicted long period three component seismograms at
BLA. a distance of 326 km from the earthquake. 128 seconds of time his
tory are plotted. with traces starting 4-0.2 seconds after the origin time. The
number by each trace is the zerO-to-peak amplitude in cm on a 15-100
WWSSN long period seismogram with peak magnification of 3000. The cen
tral U. S. model was used for depths of 11. 15 and 20 km while the
Appalachian Basin model was used for the focal depth of 14- km.
84

85
F"tgUre 5. Observed (top) P waveform at NORSAR lrith synthetic waveforrr..s ,
(below). Crustal model. dip, strike and rake angles are given for each syn-
the tic. Zero-to-peak amplitude for the observed trace is in quantized units
( Q. U.). For NORSAR sensors, there are 0.04Zl nm! Q. U. at 1.0 Hz.
Figure 8. Acceptable fault plane solutions for the body wave data from the ,
Sharpsburg earthquake under various assumptions concerning tbe input
data.P nodal planes are shown on an equal area projection of the lower
focal hemispbere. All solutions are right-lateral on the NE trending planes.
All possible solutions were tested with an increment angle of 50 in strike,
dip, and slip.
Figure 7. Locations of portable seismograph stations deployed for the aft-
ershock study. The station coordinates are given in Table 4. The locations
of Maysville and Sharpsburg, Kentucky are indicated.
Figure B. Plot of aftershock activity rate through August 25. 1980.
F'tgure 9. Hypocenter locations after using relocalion techniques. Epicenters
and two vertical depth profiles are shown. The seismograph stations are
indicated by triangles with their names given on the base map. There is no
vertical exaggeration on the depth profiles. Profile AB strikes N300E and
profile CD strikes N120oE •
. Figure 10. Lower hemisphere. equal-area projections of focal mechanism solu-
lions for two well recorded Sharpsburg aftershocks. and a composite solu-
tion for the remaining better located aftershocks. Solid circles and trian-
gles indicate sharp compressional and dilatational first arrivals. respec-
Lively. Open symbols denote poorer quality but clear first arrivals. Nodal
quality arrivals are denoted by an X.

Figure 11. Plot. of teleseismic IDb versus fault length for earthquakes listed in
Table 7. The open symbols are western events and the solid symbol is the
Sharpsburg event.
86
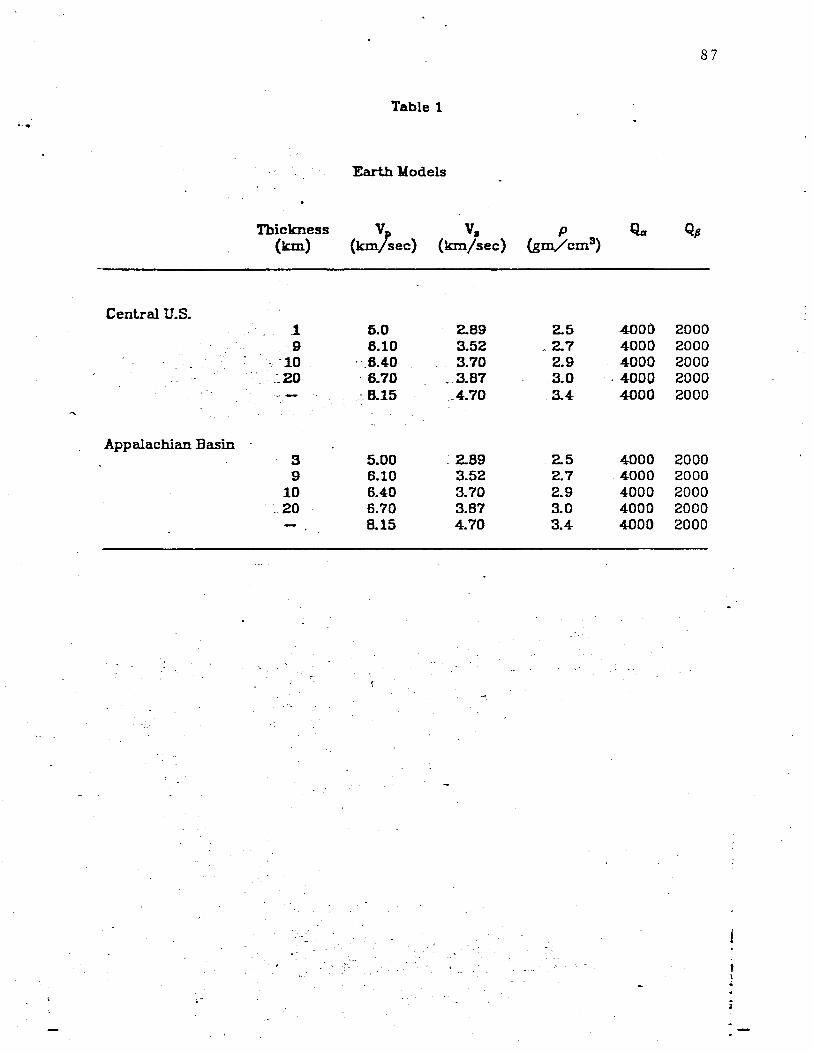
Thickness (km)
Central U.S. .1 9
,-10 ::20
Appalachian Basin 3 9
10 ,20
Table 1
Earth Models
v (kmlsec)
5.0 6.10
" 6.40 ' 6.70 ',8.15
5.00 6.10 6.40 6.70 8.15
v. Clem/sec)
2.69 3.52 3.70
. 3.67 A.70
: 2.B9 3.52 3.70 3.67 4.70
p (gIn/cmS)
2.5 _ 2.7
2.9 3.0 3.4-
2.5 2.7 2.9 3.0 3.4
87
4000 2000 4000 2000 4000 2000
,4000 2000 4000 2000
4000 2000 4000 2000 4000 2000 4000 2000 4000 2000
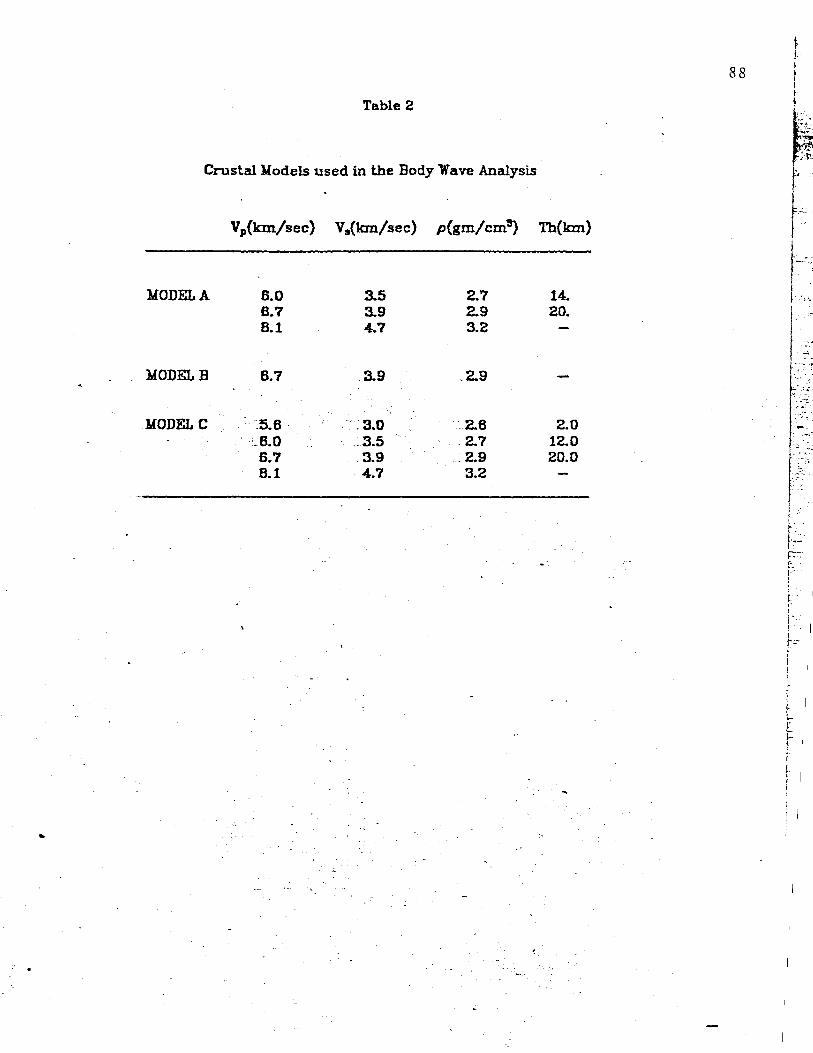
Table 2
Crustal Models used in the Body Wave Analysis
Vp{km/sec) Va{km/sec) p{gm/cm~ Th(km)
MODEtA 6.0 3.5 2.7 14. 6.7 3.9 2.9 20. B.l 4.7 3.2
MODELB 6.7 3.9 2.9
MODELC .5.6 .~ 3.0 '2.6 2.0 :_6.0 ,.3.5 ,2.7 12.0 6.7 3.9 .2.9 20.0 8.1 4.7 3.2
..
88 t. t I I
~
-~ .• ..c.~ I
I '
f' . ",,: I --.~ .
I "I ,
<
:, I
.~ .....
',',>~ I ',.' ',,'
... :f"
:-:'? I . ~ .. , -.
, -
i-I ' I
i I

Table 3
Canadian Network lIlb
".
Station ~(o) AZ<0)
pm{N) . 30.2 '_303
PGC(N) '30.3 ..... ~ 303
YKC 30.7 332
ALB 31.2 304-
JGL 31.3 .2
FSB 31.8 314
GDR{N) 32.1 305
PHC(N) 33.1 307
RES- 37.0 355
WHC 38.9 322
INK 40.4 334-
KEY 40.6 323
.1lBC 41.3 - 34-B
KRY 41.6 325
ALE 45.1 4
-average
average excluding nodal stations (N)
1 from Stevens (19BO)
mb Observed1
4.B8
4.64
.. 4..B2
4.74-
5.31
4.57
4.68
5.25
4.59
4-.13
4..62
4.4-6
.5.27
4.71
5.25
-----4.8±0.3
4.B±0.4-
~ mb Calc. t*=1.0 Calc. t*=0.5
3.3 4.0
.3.3 4.0
.4.3 5.0
3.4- 4.1
4.4 .. 5.1
4.0 4.6
3.5 4.2
3.6 -4.3
4.4 4.8
3.9 4.5
4.0 4.7
3.9 .. 4..5
4.1 4.B
3.9 4.6
4.3 5.0 .-- ----3.9± 0.4 4.5±0.4
4.1±O.2 4.8 ±0.2
89

90
~ 4. steflX' CoaI-dinetea
Station Other Lat Lan ZleY Croup Place )lame . liame ("N) (OW) (In)
---------BEKY BCK . S8.l!5&. 83.861 280 USGS . Bethel-Longview Cemetery BE'rH S8.U7 83.853 278 UKirE!C Bethel CARL eel( 38.320 84.0M %71 . tJSGS CarlJale CLAY . 38.197 83.910 302 UK/TE!C Sharpsburg-Clay Site 1 ClIG UlIO 37.993 83.BM tllI Camargo C"l'DH CLY S8.747 83.8'72 USGS Clayton. Ohio ELZ 38.385 83.800 268 VPI&SU Elizaville FAIR CEll 38.458 83.938 %T7 USGS Fairview FROG T.ES2 S8.28'7 83.979 5D'7 UK/TEIC FroetOlfll (Teston Site 2)
• GSA .' 38.29'7 83.623 278 VPI&SU Girl Scout Camp -JUDY 38.13'7 83.948 293 11X/'l'EIC Judy IZV 57.961 83.968 250 USGS :t.evee
.lIBK Ul43A 38.568 83.868 1llI liurphysville Bridge lIGS )lAy 38.593 83.848 2M USGS liurphysville-GS liCK .UlIl 3a582 84. OM UlI liount Olivet
.: lISGS .lll'S . Sa031 83.924 . 293 USGS 14t. Sterling-GS 14SK 38.038 B3.915 298 UK/'l'EIC lit. Sterling lIUR l1M3B 38.577 83.BM Ull liurphysville lilIK NlIC 3al43 84.092 291 USGS North 14iddlelatm ODD Ulof2A 38.462 84.239 Ull Oddsville ODD2 IDd2B 38.467 84.23B Ull Oddsville Site 2 OSKY OI.S sa 055 83.649 241 VPI&SU Olympia Springs OYG 3al73 83.825 3()4. UK/'rEIC Owingsville PUJ1l Sal68 84.073 282 ux,rrEIC Plum PRR 38.089 84.161 .288 USGS Pretty RUn Road HEY sa 220 83.848 282 UKi1'EIC Reynoldsville RlIK mID S8.299 84.241 282 USGS Ruddels l4iIls
. SCP' CLAY 38.198 83.909 SOO UK,nEIC Sharpsburg-Clay Fann 1 SGS '1SR Sa191 83.932 280 USGS Sharpsburg-GS SHER 38.2M 83.83'7 272 UK/l'EIC Sherburne SNR SBK 38.179 83.958 294 . UK/l'EIC Sharpsburg-NUDn Road SPKY S"l'C 38.125 84.210 271 USGS StanyPoint SSA CRO .3a225 83.928 UK/rEIC Sharpsburg-Sunny Acres m. 35.658 83.774 'WASH WSH sa 604- 83.800 2B7 VPLtSU 'Wa.shfngton WES 38.287 _ 83.978 .. 311 UX/'IEIC 1i' est.cm Site 1
------J~ ~.'r~ ,":. ;:i-:;~~:::':~? ~--;:~ .. -.. \ ~ ..... ;si _ .... . ..
-. ~ - ' • ....,;... ,- A~'
,- : .. ~'.'~. 'A ;:.... ..
" . . -.

91
Table 5. Aftershock LocatiOIll
Date 'nIne Lat Lon Depth ERH ERZ MJ, mbl4 .' _e~J ___ l~J __ JL~l __ L~ __ L~ ___________
2:7 JUL eo 20 58 os 1.5 .~
2:7 JUL 80 22 56 05 1.2 28 JUL 80 10 39 45.5 1.2 28 JUL 80 . 10 59 OS.9 (0.5) 28 JUL 80 11 32 47.1 (O.S)
.28 JUL 80 14 15 58.2 38.192 83.971 1.0 2.0 11.9 -o.S 28 .. JUL 80 15 25 7.4- 38.213 83.990 7.7 2.0 1.0 .0.5 "
28 JUL 80 17 25 38 -0..8 . '
28 JUL 80 20 .13 29.3 38.238 83.871 1.2 1.6 11.9 -O.ts 29 JUL 80 4 1 53.3 38.188 83.930 11.5 .9 1.3 O.~ 0.4- J
'; ... . ~
29 JUL BO 4 9 5.6 38.194 83.908 12.2 .1.0 1.4 -0.& "
29 - rur, BO 6 16 1.8 38.193 83.913 13.7 1.2 1.3 -0.1f .., ,,,"I; ·
.29 JUL 80 07 59 23 (-1.0) • ,: 29 JUL 80 7 59 37.8 38.177 83.937 10.3 1.1 1.B -0.5
29 -, JUL 80 12 55 32.9 38.175 83.938 11.2 1.2 1.6 -0.2 ,29'JUL 80 18 ·8 26.6 38.177 83.962 2.0 .8 .9 -0.8 -29 JUL 80 20 52 . 21.3 _ 38.189 83.921 - U.8 2.0 1.8 • 0.8
. 29 JUL 80 21 12 24.7 . 38.199 83.939 10.7 1.8 1.8 -0.8 29 rur, 80 22 4 23.7 ' 38.200 83.902 13.1 2.0 1.3 -0.6 30 JUL 80 4 52 27.0 .38.226 83.949 6.2 .8 1.4 -1.1 30 1UL 80 8 0 58.5 38.197 83.941 11.0 .9 .9 -0.8 30 JUL 80 7 9 . 59.4 38.181 83.948 8.8 .8 2.2 -1.3
.,
30 JUL 80 8 31 '55.8 38.174 83.938 9.0 .5 .9 -0.3 .. 30 JUL 80 9 31 17.8 38.219 83.902 6.5 .6 1.4 -0.8 · , 30 JUL 80 9 31 44.3 38.217 83.902 6.2 .5 1.3 -O.B $.(--"
30 JUL 80 10 0 59.1 38.192 83.933 10.5 1.0 1.3 -0.9 " :-' .'
30 JUL 80 12 39 21.1 38,206 83.935 9.0 .7 1.2 -0.8 ~ .
~J
30 JUL 80 16 29 52.0 38.17B 83.939 10.7 .8 1.2 -0.8 .-1. . .1
30 JUL 80 17 0 34.4 38.196 83.918 9.6 .6 .8 -0.8 "
30 JUL 80 17 1 41.2 38.190 83.920 ,11.4 .6 .7 1.5 1.S Felt at Sharpsburg. YMI II.
30 JUL 80 18 40 11.9 38.193 83.917 11.6 .6 .7 -0.1 .. ',>-
31 JUL 80 0 46 53.5 38.183 83.926 11.4 .5 .8 -1.1 ,-o·
.~ .. ; 31 JUL 80 0 53 42 -l.S - ..... ..
...,!.";
31 JUL 80 1 49 27.4 38.190 83.928 12.5 .8 .8 -1.2 .. ... 31 :JUL ' 80 2 41 57.8 38.194 83.923 13.4 .B 1.1 -1.2 .....
31 -rur, 80 7 23 34.8 38.185 83.926 11.5 .6 .7 -0.9 ~
31 .. JtJL 80 9 28 56.9. - 38.193 . 83.930 ,10.8 .5 .9 1.1J ;. 2.2 Felt widely. lOU IV at Sharpsburg. ..", " ~
" Some additional damage to house south 01 0-
<, 1_~ ,,",..J
., Sharpsburg dam.aged by the main shock. :,,!:~
_ 31 . JUL 80 9 31_ 46.8 38..204- 83.960 8.8 1.5 1.9 -1.2 -. .-31 JUL 80 9 38 34.4- 38.201 83.941 9.9 .9 1.0 -1.0 ~
./
31 JUL 80 18 57 58.3 38.181 83.919 11.8 .6 .7 -O.! -, 3! JUL 80 22 5 57.8 38.176 83.938 11.5 .B .8 -1.1 ._,'
31 JUL 80 23 28 3.8 38.171 83.928 12.0 .6 .6 -0.8 .- . , 1 AUG 80 23 36 18 -l.S .... .~
'0 .'
2 AUG 80 1 23 14-.4- 38.174- 83.921 ,12.8 .6 .6 -1.5 ~; - '. -- «
2 AUG 80 7 58 10.5 38.179 83.931 12.2 .9 .9 -1.1 . 2 AUG 80 18 28 33.2, 38.186 83.929 10.9 .5 .5 -0.3 3 AUG 80 6 12 20.4 36.181 83.917 12.2 .3 .4 0.4 0.1 3 AUG 80 8 34 52.4 38.199 83.924 10.B .4- .5 -0.7 ,..
3 AUG 80 21 42 7.0 38.184- 83.937 11.4 .5 .6 . -0.7 ,- .. -4 AUG 80 2 14- 33.9 38.193 83.921 10.3 '.8 .6 -0.6 -" AUG 80 3 57 58.8 38.179 83.932 11.8 .8 .6 -0.9 -
' -5 AUG 80 18 24- 43.0 38.198 83.922 11.0 .5 .6 0.2 - "
'7 AUG eo 14 18 56.0 38.181 83.948 11.B .5 .6 -0.8 · "
8 AUG 80 0 21 11.0 38.180 83.909 12.2 .6 .6 -0.8 8 AUG 80 2 0 56.8 38.176 83.937 11.0 .5 .6 -0.2 . 8 AUG 80 " 52 29.2 38.191 83.929 10.5 .5 .6 -0.1 -t-
; , :~ -. -
~-: .. -. . '
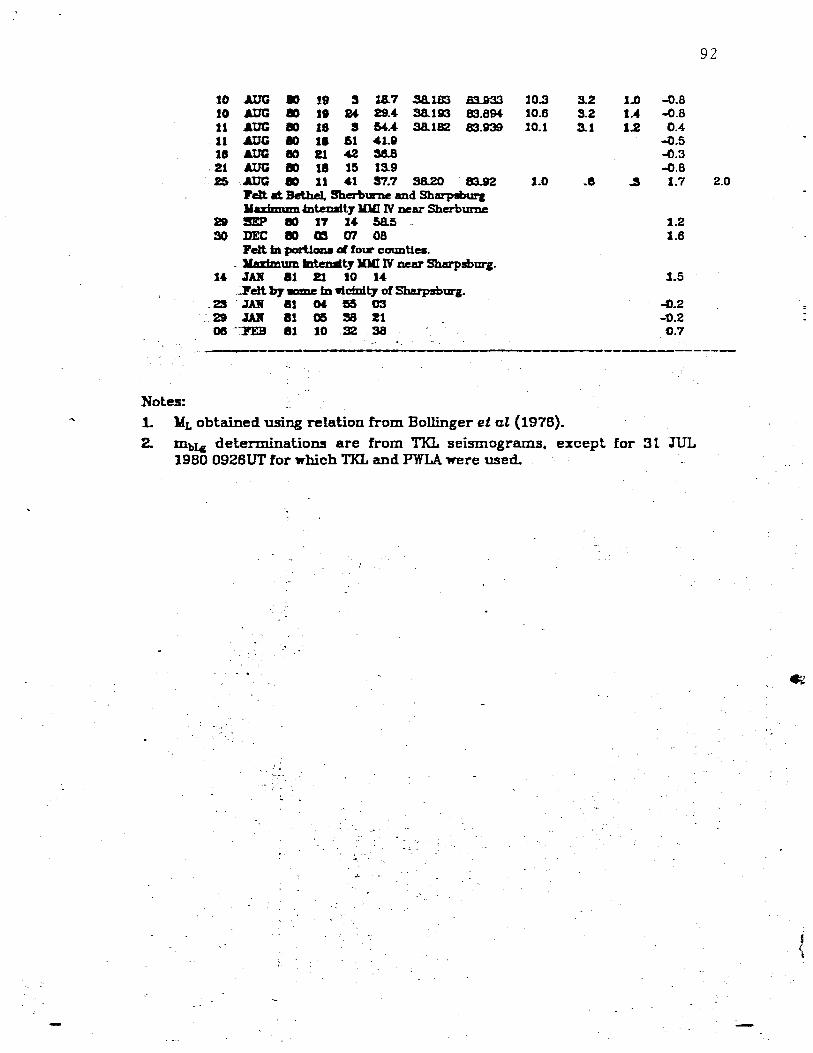
Notes: L },{L obtained using relation from Bollinger et al (1976).
2. mblc determinations are from TKL seismograms. except for 31 JUL 1980 0926UT for which TKL and PWLA were used.
-<
1 I

L ..
Table 6
Velocity llodel used to Locate Sharpsburg Aftershocks
Layer Thickness (kIn) Depth to Top Oem) Vp(km/sec) V,{km/sec)
1.0 0.0 5.52 3.15
39.01.0 .6.85":3.91
93
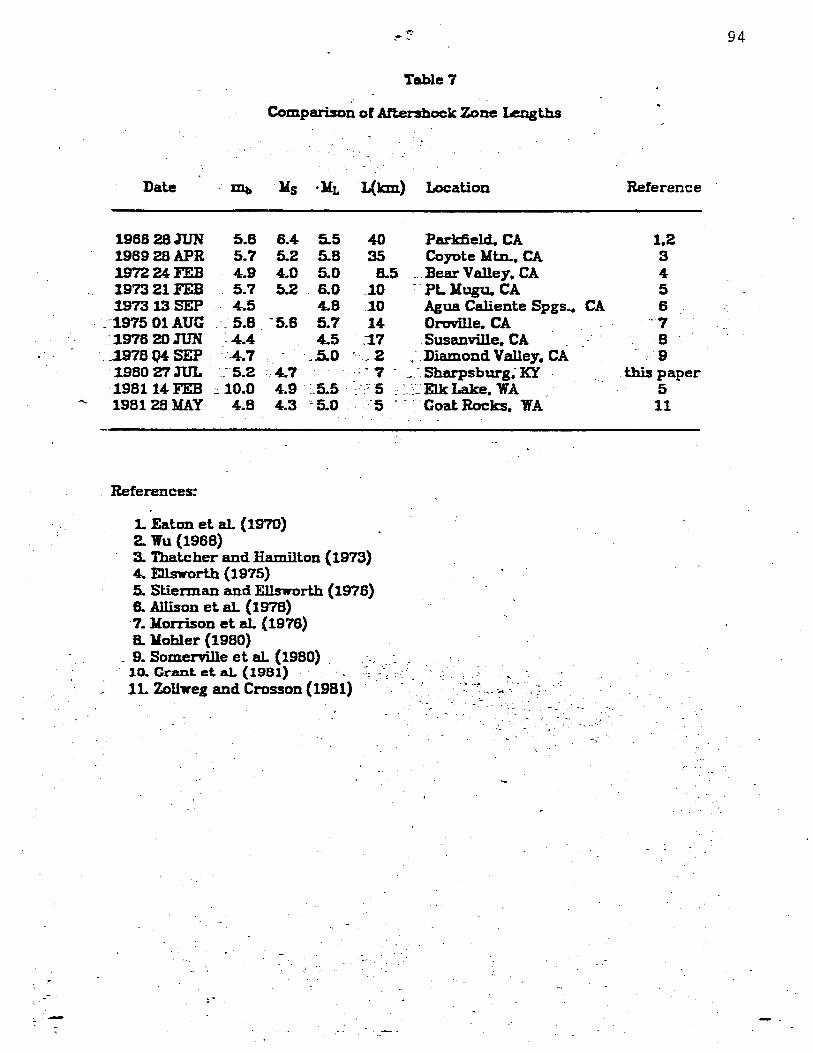
.....
,J
Table 7
Comparison of Aftershock Zone Lengths
Date ~ lls ·llL L(km) Location
19662BmN 5.8 6.4 5.5 40 Parkfield. CA 196928APR 5.7 5.2 5.8 35 Coyote Yt.n.. CA 197224FEB 4.9 4.0 5.0 8.5 ,.BearValley. CA 197321FEB 5.7 ~.2 6.0 .10 ~ .. PL llugu. CA 197313SEP 4.5 4.8 10 Agua Caliente Spgs ..
. :'1975 01 AUG .~ 5.8 -5.6 5.7 14 Oroville. CA ::1976 20 ruN : 4.4 4.5 ","1.7 . Susanville. CA
.. ..l.978 Q4 SEP ···4.7 .' . .5.0 '. J 2 .·Diamond Valley. CA
. 1980ZlJUL ··~·5.2 : 4.7 ., -7 - J'Sharpsburg;KY 198114 FEB ~. 10.0 4.9 ':,5.5 . ~ ':" 5 , :,':::.'Elk Lake. WA 1981 2B YAY 4.8 4.3 '~5.0 .' ·'5
. References:
LEaton et at (197O) 2. Yu (1968) 3. Thatcher and Hamilton {1973} 4. Ellsworth (1975) 5. Stierman and Ellsworth {1976} 6. Allison et at (1978) '7. llorrisoD et el. (1976) 8. Kohler (1980)
, 9. Somenille et al. (1980) . . 10. Grant et aL (19B1) lL ZoU .... eg and Crosson (1981)
.' Goat Rocks. WA
"'" ".. . -. ',"
,.:, -.--. .. ",..:;.',
94
Reference .
1.2 3 4 5
CA 6 '7
8 9
this paper 5 11
-;

FIgure 1. The nodal planes satisfy surface-wave spectral amplitude data as well
as P-wave first motion data. Circles and triangles indicate compressional
and dilatational first motion, respectively. The symbols T and Pare inter-
sections of the tension and pressure axes, respectively. with the lower hem-
isphere .. An equal area lower hemisphere projecti,on is used. Only sharp. , .
impulsive :first motion data are used. The northeast nodal plane strikes 300,
dips 600 and has a slip angle of IBOD.

p
• .. l
27 JUL 80 N
T

F"lgure 2. Comparison between anelastic attenuation corrected. observed. ana
predicted Love-wave and .Rayleigh-wave radiation patterns. at selected
periods T. The scaling bars are spectral amplitudes in units of em-sec at a
reference distance of go from the source.
--- __ s 1:.'1"11 '"
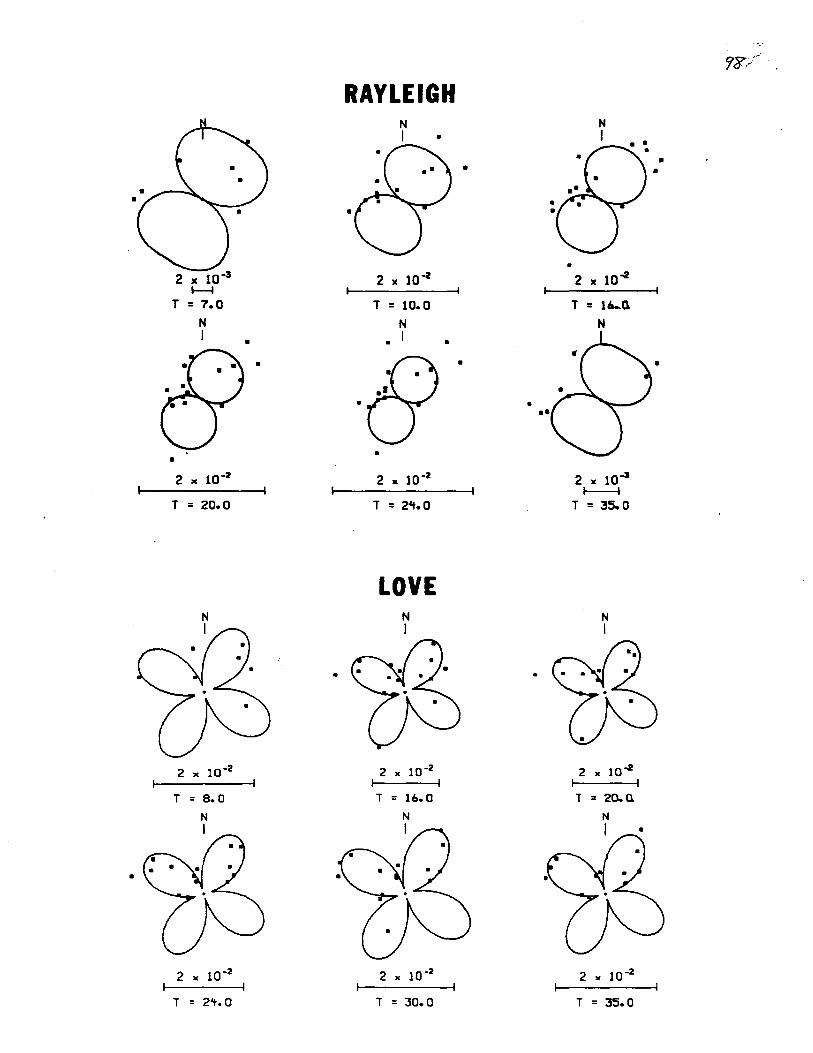
2 )( 10.3
~
T = 7.0 N I •
•
• 2 >C 10.2
T = 20.0
T = 8.0
•
T = 2't.O
RAYLEIGH
•
•
N I
2 x 10..z
T = 10.0
N
• I
•
2 x 10.2
T = 2".0
LOVE N I
T = lb. a
T = 30.0
•
•
•
•
• • •
• 2 )t 10-2
T = lik.n
N
2 x 10⁻³ ~
T = 35.0
N I
2 x 10⁻² I I T = 20.11
2 " 10-2
T = 35.0
• •
•

Ylgure 3. Observed and predicted long period vertical selsmograms cu. Io.JJ.J.lY.I., ....
distance of 555 km from the earthquake. 126 seconds of lime his lory are
plotted starling 90 seconds after the origin time. The number by each trace
is the zero-to-peak amplitude in em on a 15-100 WWSSN long period seismo-
gram with peak magnification of 3000. Predicted traces are for depths of ~
11. 15 and 20 kIn in the Central U. S. earth modeL
_ _ 1.

/00
......:t N c.O (.D
N .....:t en N • • .
lC .
M "'" .....:t
~ L ~ tJ)
~ ~ ~ CO 0 LO 0 ~
N ~ ~

z NS
EW
aBS
5.07
-15
.79
6.52
11KM
4.
16
30.4
9. ~_ .. _
__
__
_ ~.-~------
15K
M
3.50
~
8.41
. __
~ _
__
__
_
20K
M
2.46
~
5.51
14K
M
3.31
~
6.39
Fig
ure
4.
Ob
serv
ed a
nd
pre
dic
ted
lo
ng
peri
od
th
ree c
om
po
nen
t se
lsm
og
ram
s aL
BL
A.
a d
ista
nce o
f 3
26
krn
fro
m t
he e
art
hq
uak
e.
12
8 s
eco
nd
s o
f ti
me h
is-
lory
are
plo
tted
. w
ith
tra
ces
slarl
ing
40
.2 s
eco
nd
s aft
er
the o
rig
in t
ime.
Th
e
nu
mb
er
by
each
tra
ce is
th
e
zero
-lo
-peak
am
pli
lud
e in
em
o
n a
1
5-1
00
WW
SSN
lo
ng
peri
od
seis
mo
gra
m w
ith
peak
mag
nif
icati
on
of
30
00
. T
he
cen
-
tra
l U
. S
. m
od
el
was
u
sed
fo
r d
ep
ths
of
11
. 1
5
nn
d
20
k
m
wh
ile
the
Ap
pal
ach
ian
Bas
in m
od
el w
as
use
d f
or
the f
oca
l d
ep
th o
f 14
km
.
'-..
~ -
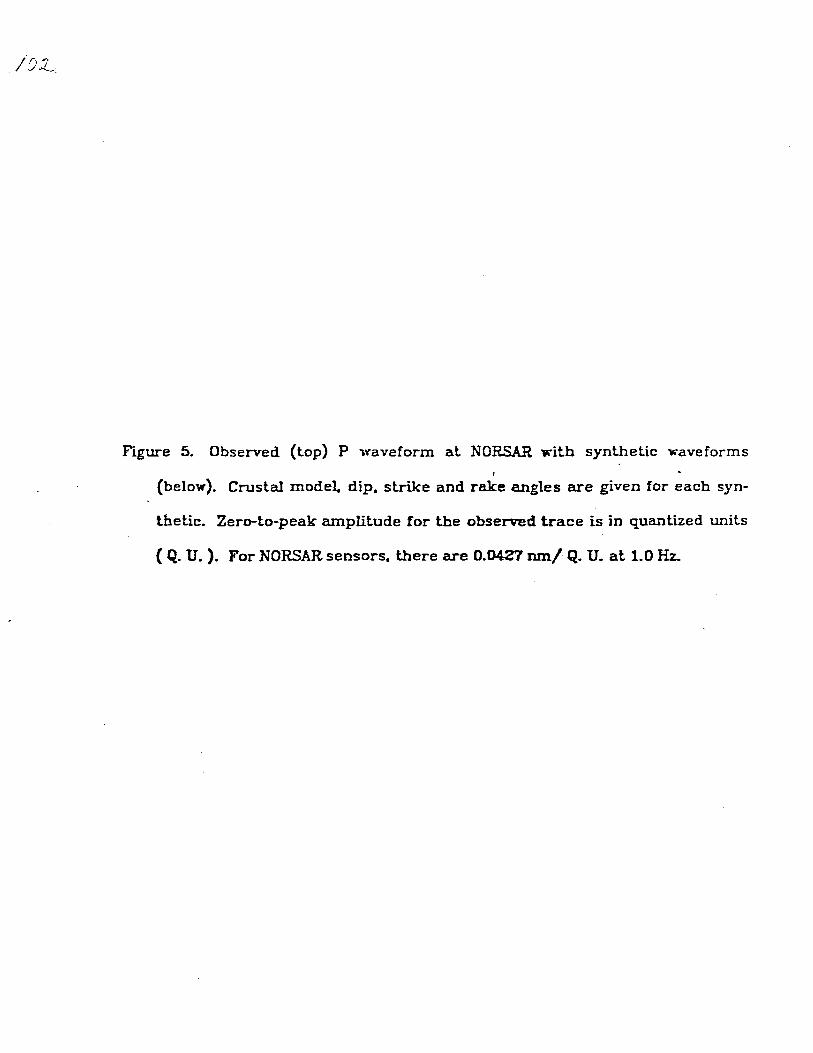
Figure 5. Observed (top) P waveform at NORSAR with synthetic waveforms r
(below). Crustal model. dip. strike and rake angles are given for each syn-
thetic. Zero-to-peak amplitude for the observed trace is in quantized units
( Q. U.). For NORSAR sensors. there are 0.0427 nm/ Q. U. at 1.0 Hz.

NORSAR SUM
8 :: 70° s :: 30° A :: 180° CRUST A
o :: 70° s :: 30° A :: 180° CR\JST C
8 :: 50° s :: 30° \. :: 1800
CRUST C
/03 :
800 Q.U.
sP
--
~ ____ -----25 SEC-----
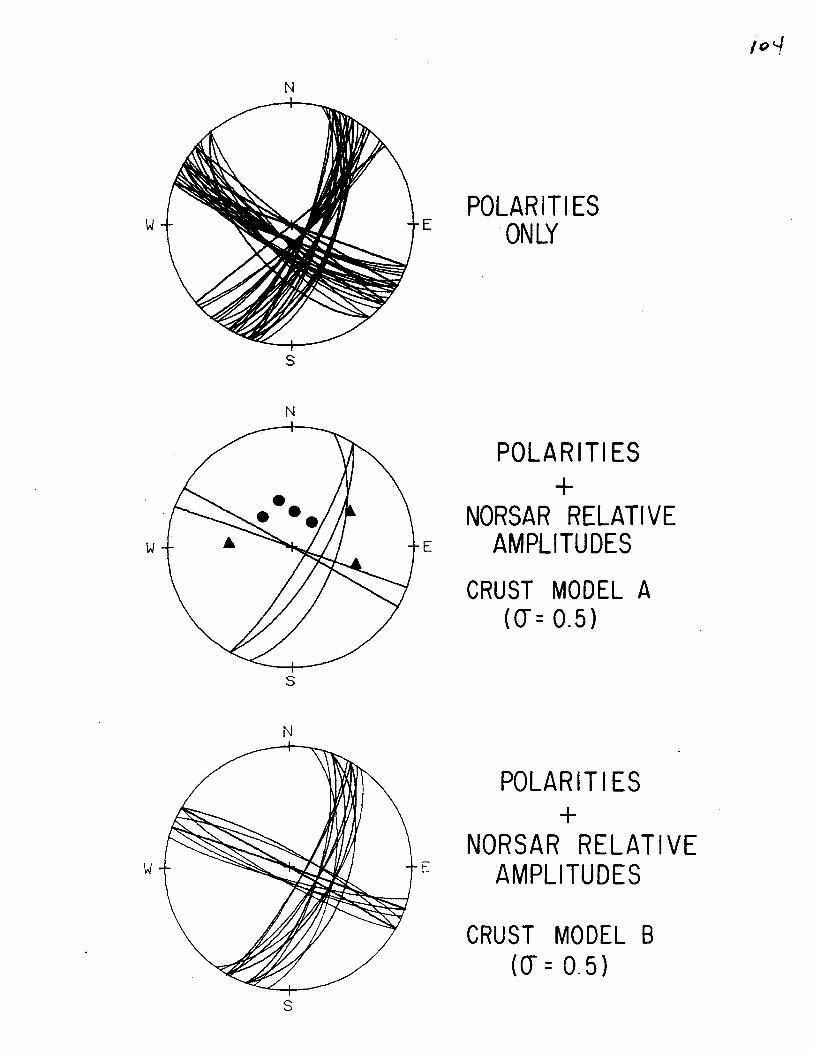
N
w
s
N
w
S
N
w
s
E POLARITIES
. ONLY
POLARITIES +
NORSAR RELATIVE E AMPLITUDES
E
CRUST MODEL A (0"= 0.5)
POLARITI ES +
NORSAR RELATIVE AMPLITUDES
CRUST MODEL B (cr = 0.5)
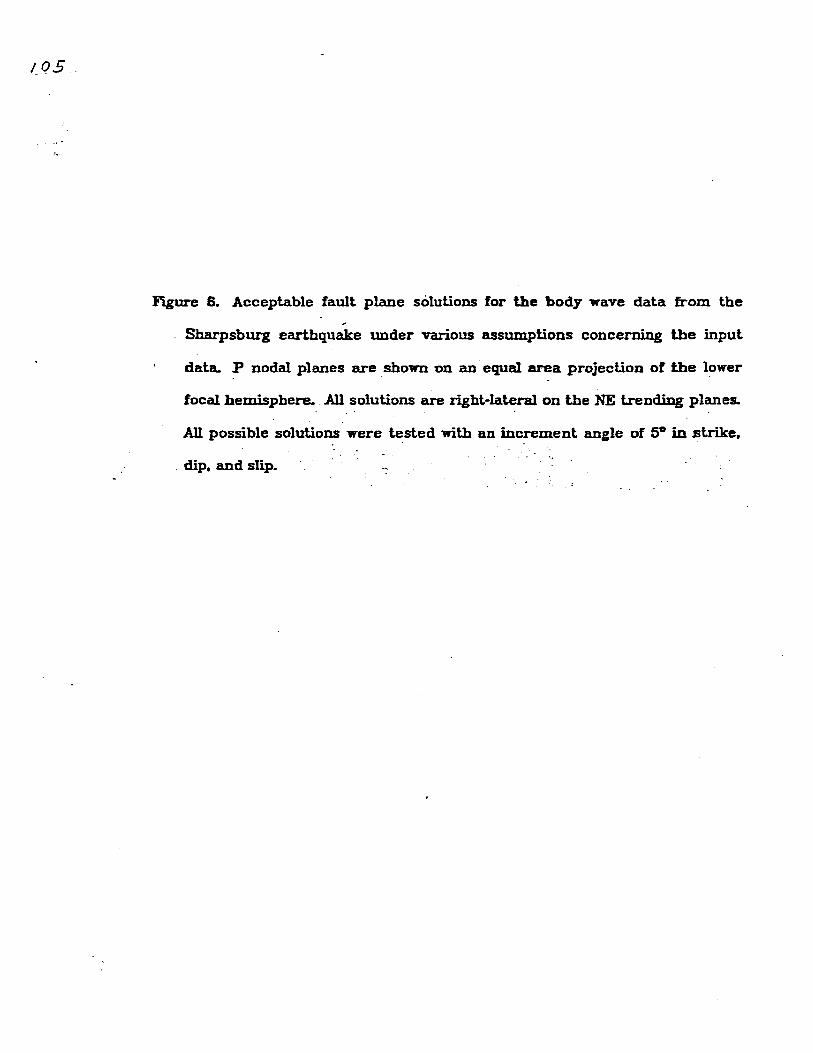
'-05
...
Figure 6. Acceptable fault plane solutions for the body wave data from the ,
Sharpsburg earthquake under various assumptions concerning the input
data. P nodal planes are shown on an· equal m-ea projection of the lower
focal hemisphere. . All solutions are right-lateral on the NE trending planes.
All possible solutio~ were t.ested with an inc!"ement. angle of 5° in strike.
dip. and slip.

-8Lt. ~
1--- ----
ODD2 ~
RMK L'~
ODn
MAYSVILLE
MOK 6
CARL ~
FAIR ~
HGS \lASH MUR 6 A:.
~ HBK
ELZ ~
FROG SHER A ~
'WE SBEKY BE TH SSA ~ REY
SHARPSBURG SGsqA sc~ PLU~ ~ CLAY 6
SPKY ~
NMK SBK OWG ~
PRR 6
~ JUDY
MSK ~
MSGS
o 20 LEV ~
CMG IL..-_____ --l ~
KM
-8~. i
CTOH ~
GSA
OSKY L!;,.
~
lOG
-83.5 38 .. 8
t37.9 -83. 5
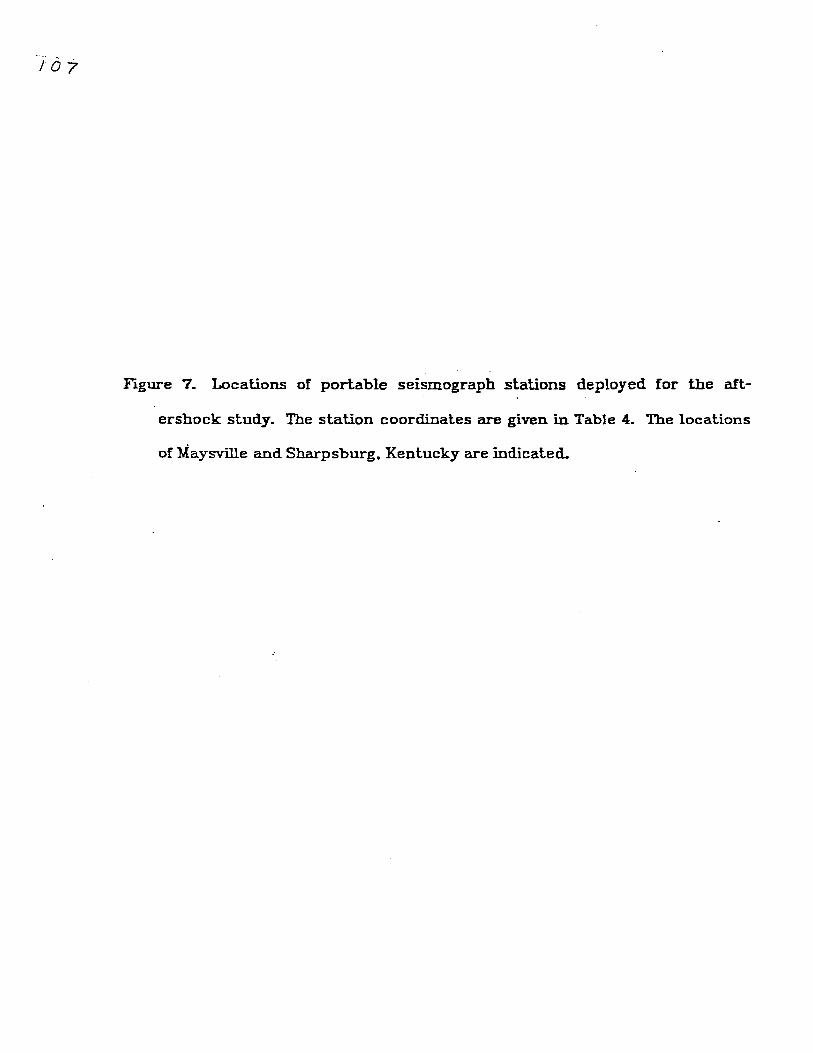
Figure 7. Locations of portable seismograph stations deployed for the aft
ershock study. The station coordinates are given in Table 4. The locations
of Maysville and Sharpsburg. Kentucky are indicated.
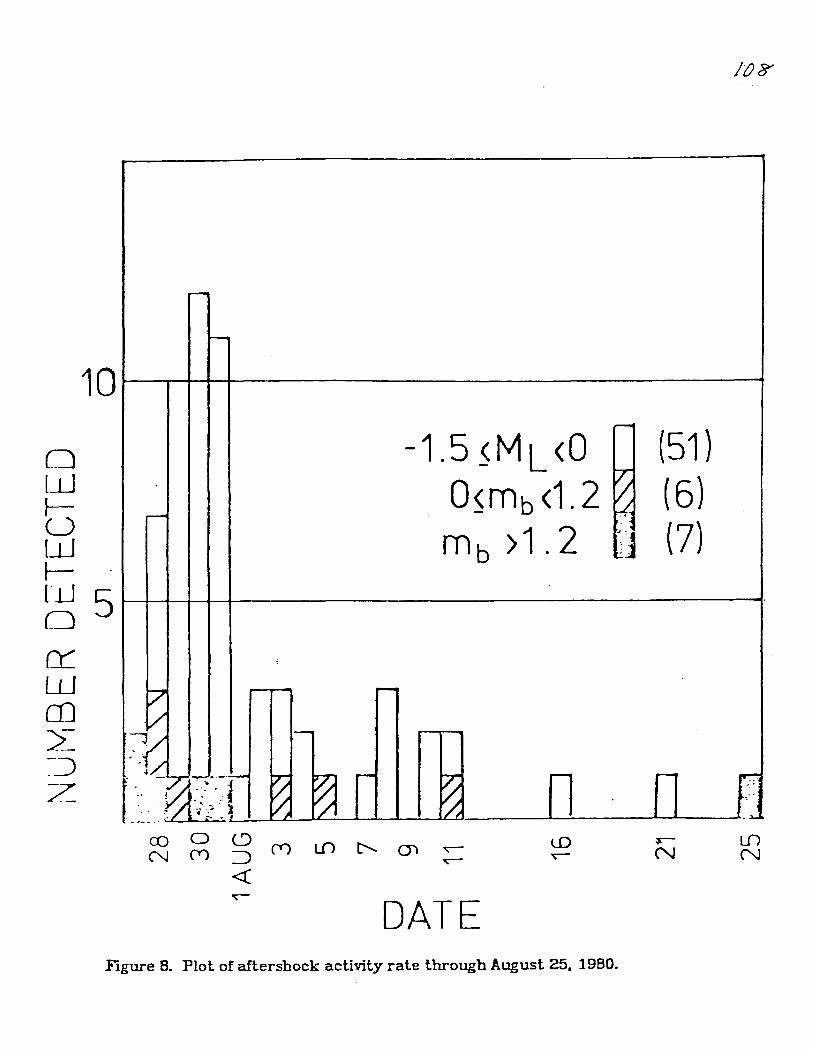
o LLJ ~ U LLJ f-
It) 8"
10~~----------------~
-
(51 ) ( 6) (7)
Lu 5 t--+-~--+--------------~. o cr: w OJ >-~~ z
r--
1-
DATE TIgure B. Plot of aftershock activity rate througb August 25. 1980.

-8'1.0 -83.9 38.3
FROG SHER 4t.
'liES A
BEKY .!..
BETH A
55A A REY
.!..
38.2 SCF & 5G5 CLAY .!..
.!.. 51!< .!..
OVG
.!.. .JUDY
38.1 -8'1.0 -83.9
A
(!) (!)
C!)
C!) ~
C!)
c9 (!) C!)
C-il-~C!) C!) C!)
~
VElITICAL PlIOFILE CENTERED AT 38.191· N 83.928· V VITH ST'RIKE 30·
-83.8 -8'1.0 38.3 38.3
38.2 38.2
A
38.1 38.1 -83.8 -8't.0
B C
-83.9
B
D
-83.9
(!)
C!)
C!) ~ (!)
C) f!P C!)
~~ . (!) (!)
(!) e (!)
VElIT I CAL PlIOF I LE CENTERED AT 38. 191" N 113. 928· V VITH ST'RIKE 120-
-~-------.
-83.8 38.3
38.2
38.1 -83.8
D

J I/l
Ytgure 9. Hypocenter locations after using relocation techniques. Epicenters
and two vertical depth profiles are shown. The seismograph stations are
indicated by triangles with their nam.es given on the base m.ap. 'There is no
vertical exaggeration on the depth profiles. Profile AB strikes N300E and
profile CD strikes N120oE.

30
JU
L
80
N
31
JU
L
80
N
p
CO
MPO
SITE
N
T~
•• .. ••
Fig
ure
10
. L
ow
er h
em
isp
here
. eq
ual-
are
a p
roje
cti
on
s o
f fo
cal
mech
an
ism
so
lu-
tio
ns
for
two
wel
l re
co
rded
Sh
arp
sbu
rg a
fters
ho
ck
s. a
nd
a
co
mp
osi
te s
olu
-
lio
n f
or
the r
em
ain
ing
betl
er
locate
d a
rlers
ho
ck
s.
So
lid
cir
cle
s an
d t
rian
-
gle
s in
dic
ate
sh
arp
co
mp
ress
ion
al
an
d d
ilata
tio
nal
firs
t ar
riv
als.
re
spec-
liv
ely
. O
pen
sy
mb
ols
den
ote
po
ore
r q
ual
ity
bu
t cle
ar
firs
t arr
ivals
. N
od
al
qu
alit
y a
rriv
als
are
den
ote
d b
y a
n X
. . ----.

1 , I
o o o
o 0
LD If)
r , !
I
o
o
o
1
1 o 0-~
o
~-
Figure 11. Plot of leleseismic mb versus fault lengt.h for eart.hquakes listed in
Table 7. The open symbols are western events and the solid symbol is the
Sharpsburg evenL
/I~
--