the selection of trade integration indicators: intraregional share… · the selection of trade...
TRANSCRIPT

ASIAN DEVELOPMENT BANK
AsiAn Development BAnk6 ADB Avenue, Mandaluyong City1550 Metro Manila, Philippineswww.adb.org
The Selection of Trade Integration Indicators: Intraregional Share, Intensity, Homogeneous Intensity, and Introversion Index
Introversion index, rather than intraregional trade share, should be used when comparing the level of trade integration (both cross-regional and time series analyses). Further, since Asia is a group of heterogeneous countries, a subregional level analysis is more appropriate in understanding the nature of its trade integration.
About the Asian Development Bank
ADB’s vision is an Asia and Pacific region free of poverty. Its mission is to help its developing member countries reduce poverty and improve the quality of life of their people. Despite the region’s many successes, it remains home to the majority of the world’s poor. ADB is committed to reducing poverty through inclusive economic growth, environmentally sustainable growth, and regional integration.
Based in Manila, ADB is owned by 67 members, including 48 from the region. Its main instruments for helping its developing member countries are policy dialogue, loans, equity investments, guarantees, grants, and technical assistance.
THe SelecTIon of TrADe InTegrATIon InDIcATorS: InTrAregIonAl SHAre, InTenSITy, HomogeneouS InTenSITy, AnD InTroverSIon InDexShintaro Hamanaka
adb economicsworking paper series
no. 455
october 2015

ADB Economics Working Paper Series
The Selection of Trade Integration Indicators: Intraregional Share, Intensity, Homogeneous Intensity, and Introversion Index Shintaro Hamanaka
No. 455 | October 2015
Shintaro Hamanaka ([email protected]) is Economist at the Economic Research and Regional Cooperation Department, Asian Development Bank.
ASIAN DEVELOPMENT BANK

Asian Development Bank 6 ADB Avenue, Mandaluyong City 1550 Metro Manila, Philippines www.adb.org
© 2015 by Asian Development Bank October 2015 ISSN 2313-6537 (Print), 2313-6545 (e-ISSN) Publication Stock No. WPS157667-2
The views expressed in this paper are those of the author and do not necessarily reflect the views and policies of the Asian Development Bank (ADB) or its Board of Governors or the governments they represent.
ADB does not guarantee the accuracy of the data included in this publication and accepts no responsibility for any consequence of their use.
By making any designation of or reference to a particular territory or geographic area, or by using the term “country” in this document, ADB does not intend to make any judgments as to the legal or other status of any territory or area.
Note: In this publication, “$” refers to US dollars.
The ADB Economics Working Paper Series is a forum for stimulating discussion and eliciting feedback on ongoing and recently completed research and policy studies undertaken by the Asian Development Bank (ADB) staff, consultants, or resource persons. The series deals with key economic and development problems, particularly those facing the Asia and Pacific region; as well as conceptual, analytical, or methodological issues relating to project/program economic analysis, and statistical data and measurement. The series aims to enhance the knowledge on Asia’s development and policy challenges; strengthen analytical rigor and quality of ADB’s country partnership strategies, and its subregional and country operations; and improve the quality and availability of statistical data and development indicators for monitoring development effectiveness.
The ADB Economics Working Paper Series is a quick-disseminating, informal publication whose titles could subsequently be revised for publication as articles in professional journals or chapters in books. The series is maintained by the Economic Research and Regional Cooperation Department.

CONTENTS TABLES AND FIGURES iv ABSTRACT v I. INTRODUCTION 1 II. SELECTION OF INDICATOR: SHARE, INTENSITY, HOMOGENEOUS INTENSITY, AND INTROVERSION 2 A. Share Indicators 3 B. Intensity Indicator 3 C. Homogeneous Intensity Indicator 5 D. Introversion Index 5 III. DOES THE TRADE PICTURE DEPEND ON INDICATOR SELECTION? 6 A. Intensity versus Homogeneous Intensity 6 B. Homogeneous Intensity versus Introversion 8 IV. TRADE LINKAGE DIAGRAM 8 V. TRADE LINKAGES IN ASIA 9 A. Intraregional and Extraregional Trade Linkages of Asia as a Whole 9 B. Subregional Trade Linkages in Asia 11 VI. CONCLUSION 14 APPENDIX 15 REFERENCES 17

TABLES AND FIGURES TABLES 1. Range Variability Problem 5 2 Intraregional and Extraregional Homogeneous Intensity and Introversion 6 3 Different Order: Intensity versus Homogeneous Intensity 7 FIGURES 1 Example of a Trade Linkage Diagram 8 2 Asia’s Trade Linkages in 2013 10 3 Subregional Trade Linkage Diagram (Introversion) in 2013 12

ABSTRACT This paper attempts to provide a clear and comprehensive picture of trade integration in Asia, using a trade linkage diagram. The paper reviews four types of indicators (share, intensity, homogeneous intensity, and introversion index) and argues that the introversion index is the most suitable indicator for the comparison of the level of trade integration, both in terms of cross-regional comparisons and time series analyses. Next, since Asia is a group of heterogeneous economies and the level of integration across subregions is not consistent, the paper includes a subregional analysis of trade integration in Asia. The analysis includes the (i) regional introversion of each subregion, (ii) intersubregional trade linkage, and (iii) extraregional trade linkage of each subregion. The subregional trade linkage diagram based on the introversion index provides us with a snapshot of trade integration, which is useful for both scholars and policy makers. At a glance, we can understand who trades more than others, and with whom. Keywords: intraregional trade share, introversion index, subregions, trade integration, trade linkage diagram JEL Classification: F14, F15

I. INTRODUCTION Presentations and articles on trade in Asia by scholars and policy makers tend to start with remarks that regional trade is becoming more integrated. Yet, comparisons of levels of trade integration, in terms of both time series and cross-regional analyses, require the careful selection of a methodologically sound indicator. The analysis of trade integration in Asia is tricky because Asia is a group of heterogeneous economies and the level of trade integration across regions is not consistent. As a result, summarizing the status and development of trade integration in Asia in a simple but comprehensive manner is not an easy task.
We will try to overcome these difficulties and show a clearer picture of the trade status in Asia by making three important improvements to existing Asian trade integration literature. First, the result of the analysis of trade integration differs across indicators; therefore, the selection of the right indicator is essential. In analyzing the bias in terms of the direction of trade, we propose to use the introversion index, which is suitable for making comparisons, rather than the share or intensity indicators. We will demonstrate how different the trade picture based on the introversion index is compared to other traditional indicators. The term “bias” is loosely used to refer to the relative geographical concentration of trade.
Second, we propose to conduct subregional level analyses of trade integration in Asia instead
of coming up with a regional or overall indication of integration for Asia as a whole, which tends to reflect the large subregions, such as East Asia, and overshadow the trade integration trends in other subregions, such as South Asia that deviate from Asia’s overall performance.1 Therefore, in this paper we will carefully examine Asia’s trade, in terms of both intraregional and extraregional linkages, from the subregional perspective. Trade linkages between Southeast Asia and East Asia and those between Southeast Asia and South Asia are very different. Likewise, trade linkages between Southeast Asia and Africa and those between South Asia and Africa are also very different. (As subregion simply means that the group is a subset of a larger group, the term subregional bias is essentially the same as regional bias.)
Finally, we propose the use of the trade linkage diagram, which provides us with a very
convenient snapshot of trade linkages of a particular economy or subregion. Since introversion (and intensity) between two subregions has two aspects (the former’s bias toward the latter and the latter’s bias toward the former), a diagram is convenient to describe these indices. The trade linkage diagram based on the introversion index illustrates the level of directional and geographical bias of trade that a regional group or economy has toward itself or its partners. At a glance, we can understand who trades more than the others, and with whom.
The paper is structured as follows. In the next section, we will review the indicators used by
existing literature in assessing the level of trade integration. In Section III, special consideration is given
1 In this paper, Asia is classified into five subregions: (i) East Asia, (ii) Southeast Asia, (iii) South Asia, (iv) Central and West
Asia, and (v) the Pacific and Oceania. East Asia includes the People’s Republic of China; Hong Kong, China; Japan; the Republic of Korea; Mongolia; and Taipei,China. Southeast Asia includes Brunei Darussalam, Cambodia, Indonesia, the Lao People’s Democratic Republic, Malaysia, Myanmar, the Philippines, Singapore, Thailand, and Viet Nam. South Asia includes Afghanistan, Bangladesh, Bhutan, India, Maldives, Nepal, Pakistan, and Sri Lanka. Central and West Asia includes Armenia, Azerbaijan, Georgia, Kazakhstan, the Kyrgyz Republic, Tajikistan, Turkmenistan, and Uzbekistan. The Pacific and Oceania includes the Cook Islands, Fiji, Kiribati, the Marshall Islands, the Federated States of Micronesia, Nauru, Palau, Papua New Guinea, Samoa, Solomon Islands, Timor-Leste, Tonga, Tuvalu, Vanuatu, Australia, and New Zealand.
2 | ADB Economics Working Paper Series No. 455
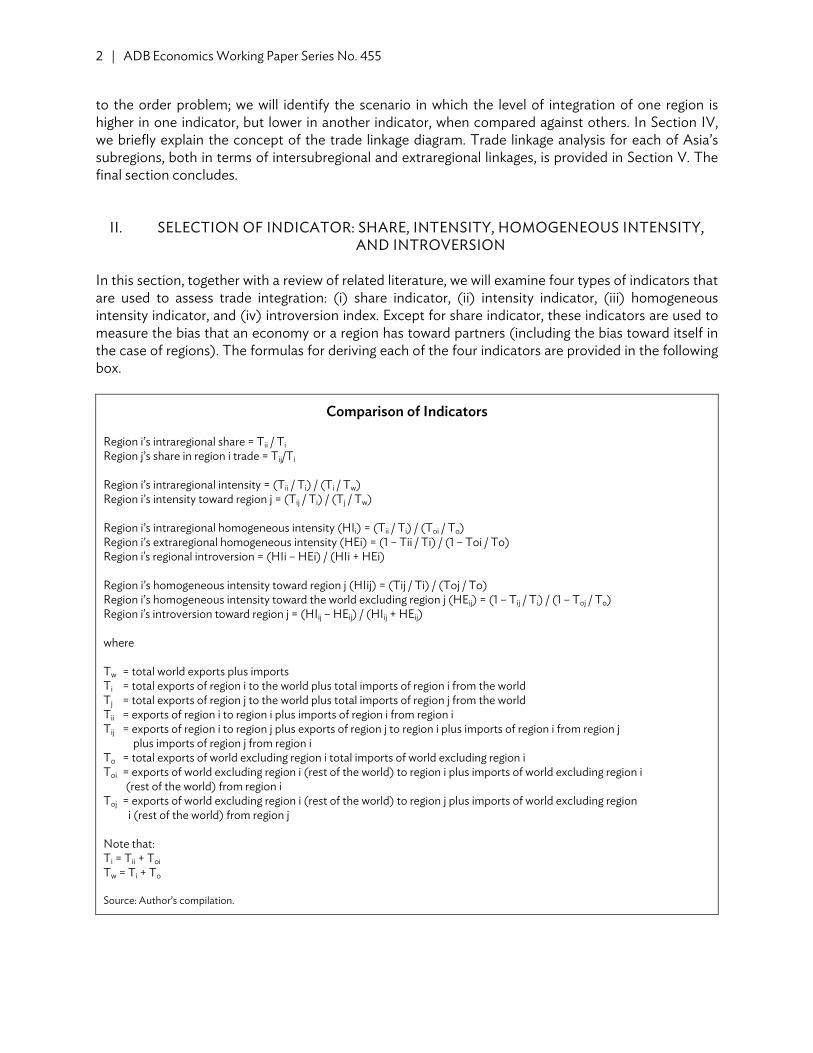
to the order problem; we will identify the scenario in which the level of integration of one region is higher in one indicator, but lower in another indicator, when compared against others. In Section IV, we briefly explain the concept of the trade linkage diagram. Trade linkage analysis for each of Asia’s subregions, both in terms of intersubregional and extraregional linkages, is provided in Section V. The final section concludes.
II. SELECTION OF INDICATOR: SHARE, INTENSITY, HOMOGENEOUS INTENSITY, AND INTROVERSION
In this section, together with a review of related literature, we will examine four types of indicators that are used to assess trade integration: (i) share indicator, (ii) intensity indicator, (iii) homogeneous intensity indicator, and (iv) introversion index. Except for share indicator, these indicators are used to measure the bias that an economy or a region has toward partners (including the bias toward itself in the case of regions). The formulas for deriving each of the four indicators are provided in the following box.
Comparison of Indicators Region i’s intraregional share = Tii / Ti Region j’s share in region i trade = Tij/Ti Region i’s intraregional intensity = (Tii / Ti) / (Ti / Tw) Region i’s intensity toward region j = (Tij / Ti) / (Tj / Tw) Region i’s intraregional homogeneous intensity (HIi) = (Tii / Ti) / (Toi / To) Region i’s extraregional homogeneous intensity (HEi) = (1 – Tii / Ti) / (1 – Toi / To) Region i's regional introversion = (HIi – HEi) / (HIi + HEi) Region i’s homogeneous intensity toward region j (HIij) = (Tij / Ti) / (Toj / To) Region i’s homogeneous intensity toward the world excluding region j (HEij) = (1 – Tij / Ti) / (1 – Toj / To) Region i's introversion toward region j = (HIij – HEij) / (HIij + HEij) where Tw = total world exports plus imports Ti = total exports of region i to the world plus total imports of region i from the world Tj = total exports of region j to the world plus total imports of region j from the world Tii = exports of region i to region i plus imports of region i from region i Tij = exports of region i to region j plus exports of region j to region i plus imports of region i from region j plus imports of region j from region i To = total exports of world excluding region i total imports of world excluding region i Toi = exports of world excluding region i (rest of the world) to region i plus imports of world excluding region i (rest of the world) from region i Toj = exports of world excluding region i (rest of the world) to region j plus imports of world excluding region i (rest of the world) from region j Note that: Ti = Tii + Toi Tw = Ti + To
Source: Author’s compilation.

The Selection of Trade Integration Indicators | 3
A. Share Indicators The share of a subregion can be easily computed at the individual level of the economy. For example, the share of Malaysia in Singapore’s trade can be computed by dividing Singapore’s trade with Malaysia by its total trade. Likewise, the share of Southeast Asia in Singapore’s trade is the sum of each Southeast Asian country’s share in Singapore’s trade (e.g., Malaysia’s share in Singapore’s trade plus Indonesia’s share in Singapore’s trade, Thailand’s share in Singapore’s trade, and so on). A subregional share can be computed not only for an individual economy but also for a subregion. The share of subregion i in subregion i’s total trade is called the intraregional trade share.
The fundamental problem of using a share indicator is the lack of benchmarks. If economy A’s share in economy B’s total trade is 10%, is this high or low? It is impossible to answer this simple question because the benchmark is unclear. Thus, cross-(sub)regional and cross-country comparisons using share indicators do not make sense. For example, for any economy in the world, the People’s Republic of China’s (PRC) share is large and Cambodia’s share is small. But this simply reflects the fact that the PRC is a large trader while Cambodia is not. Hence, just because the Chinese share is larger than the Cambodian share for a certain economy, we cannot say that such an economy’s trade is closely linked with the PRC and not with Cambodia. This problem is also evident in the comparison of intraregional shares. Even if Asia’s intraregional share is higher than that of Central America, this simply reflects the fact that the former group includes large traders such as the PRC and Japan, while the countries in the latter group are small traders. Thus, it is wrong if we draw a conclusion that Asia’s trade is more integrated than that of Central America based on mere share analysis. Trade economists have been aware of the pitfalls of easily calculated intraregional trade shares for some time. In the early 1990s, Anderson and Norheim (1993) argued that this indicator is not suitable for making comparisons.
However, share analysis is still popular among policy makers. This is mainly because it is easy to understand the concept and compute the index. For example, the Association of Southeast Asian Nations (ASEAN) Secretariat tends to use intraregional trade share in assessing trade integration within ASEAN. The Master Plan on ASEAN Connectivity mentions only intraregional trade share (ASEAN 2010, p. 20), and ASEAN Community in Figures compiled by the Secretariat includes only share analysis despite a huge amount of statistical data included in the document (ASEAN 2011). Political scientists who are interested in the relationship between economic interdependence and institution building prefer to use share indicators. A higher level of economic interaction tends to cause friction between economies (e.g., trade disputes) that could be solved through institution building. The absolute amount of economic interaction does matter in this regard because the absolute, not relative, level of economic interaction between economies determines the amount of disputes. For example, Grieco (1997) compares the level of intraregional trade and the regional institutionalization in various regions, and draws a conclusion that the functionalists’ explanation is invalid. The majority of recent political science studies also use share indictors in discussing whether trade interdependence lead to trade institutionalization (Das 2001, Chen 2005, Bui 2008). Recently, however, some political scientists have started to question the relevancy of share indicators as the explanatory variable for institutionalization, though the debate among political scientists on the relevant indicators (absolute or relative level of interdependence) has not been concluded yet (De Lombaerde et al. 2010). B. Intensity Indicator The intensity indicator sets the world average as the benchmark for comparison. To illustrate, if economy A’s share in economy B’s total trade is 10% and economy B’s weight in world trade is 10%

4 | ADB Economics Working Paper Series No. 455
(i.e., on average, 10% of the trade of all economies with economy B), then economy A’s trade with economy B is geographically neutral, which means that the intensity index is 1.2 If the share of economy B in economy A’s trade is higher (lower) than economy B’s weight in world trade, the intensity index is higher (lower) than 1, which means that economy A has a positive (negative) bias toward economy B.
Intensity can be computed not only for an economy but also for a group. The intensity of a group can be computed not only toward a partner region, but also toward itself. The latter is called intraregional intensity; that is, a group’s share in the group’s total trade is divided by the group’s weight in world trade. For example, the intraregional intensity of Asia is Asia’s share in the total of Asia’s trade (intraregional trade share) divided by Asia’s weight in world trade.
We can also compute trade intensity between two economies or regions. Intraregional
intensity is unique because it is the trade intensity that a group has toward the group itself. Other than this scenario, intensity is a two-way measurement. For example, in the case of Japan’s trade intensity toward the PRC and the PRC’s trade intensity toward Japan, the former is the PRC’s share in Japan’s total trade divided by the PRC’s weight in world trade, and the latter is Japan’s share in the PRC’s total trade divided by Japan’s weight in world trade. Interregional trade intensity is also a two-way figure; we can compute region i’s intensity toward region j, and vice versa.
The intensity indicator has two main problems. The first problem is the “giant problem,” which
relates to the size of the test economy or region’s weight in world trade. When a test economy or region is large, it affects the world picture and hence the benchmark. A high bias that an economy or region has toward a partner or itself (e.g., Asia’s trade with Asia) is diluted because the world benchmark includes it. This is especially problematic when we analyze the trend of a region or economy whose weight in world trade is changing rapidly.
The second is the “range variability” problem, which relates to the size of a partner economy or
region in world trade. The upper limit of the intensity toward a partner (or itself in the case of intraregional intensity) becomes high (low) when a partner is a small (large) trader. Thus, the intensity index may be an ideal indicator when we compare various economies’ or regions’ bias toward a common partner (e.g., Asia’s bias toward Europe and North America’s bias toward Europe are compared). Other than such instances, the use of an intensity index is not recommended.
As shown in Table 1, if trade partner A’s weight in world trade is 2%, the highest possible
intensity toward A becomes 50, which can be achieved when trade partner A’s share in a test economy’s trade is 100% (100/2=50). However, if trade partner B’s weight in world trade is 20%, the highest possible intensity toward B becomes 5 (100/20=5). Thus, while the lower limit of intensity is always 0, which can be achieved when there is no trade with a partner, the upper limit of the range depends on the size (weight) of the partner in world trade. Suppose 10% of a test economy’s trade is with economy A and 90% is with economy B. Then, it is not easy to conclude toward which partner a test economy has a higher bias: an intensity of 5 (10/2) toward partner A or an intensity of 4.5 (90/20)
2 Intensity index (homogeneous intensity) uses the rest of the world (ROW) average as a benchmark. A positive or negative
bias simply means the intensity is higher or lower than the benchmark. This causes problems in assessing trade bias because, logically, neighboring economies tend to trade more with one another as it entails lower transport costs, which are proportional (to a degree) to distance. This poses a question on the relevancy of 1 as a natural threshold. Note that home bias or regional bias in the finance literature uses the same logic, but the implicit assumption here is that investors should invest irrespective of distance because investment does not entail transport costs.

The Selection of Trade Integration Indicators | 5
toward partner B? These scenarios illustrate that the intensity index produces results that are not fully comparable.
Table 1: Range Variability Problem
Partner A(small partner)
Partner B (big partner)
Partner’s weight in world trade 2% 20% Intensity when the share of partner is 100%
(upper limit of range) 50 (100/2) 5 (100/20) Intensity when the share of partner is 90% 45 (90/2) 4.5 (90/20) Intensity when the share of partner is 10% 5 (10/2) 0.5 (10/20)
Source: Authors’ compilation. C. Homogeneous Intensity Indicator Both the giant problem and the range variability problem can be solved when the benchmark is the rest of the world except for the test economy or region (ROW) and not the world that includes the test economy or region. In this case, a certain test economy’s intensity toward a partner is compared against the intensity that ROW has toward the partner, not the intensity that the world has toward the partner. The intensity where the benchmark is ROW is known as homogeneous intensity.
Homogeneous intensity has two weaknesses, which are also common to the intensity indicator. First is the “range asymmetry” problem, which means that the range below the neutral threshold (1) is usually much smaller than the range above the threshold.
The second problem is “dynamic ambiguity,” which means that the bias toward partner X
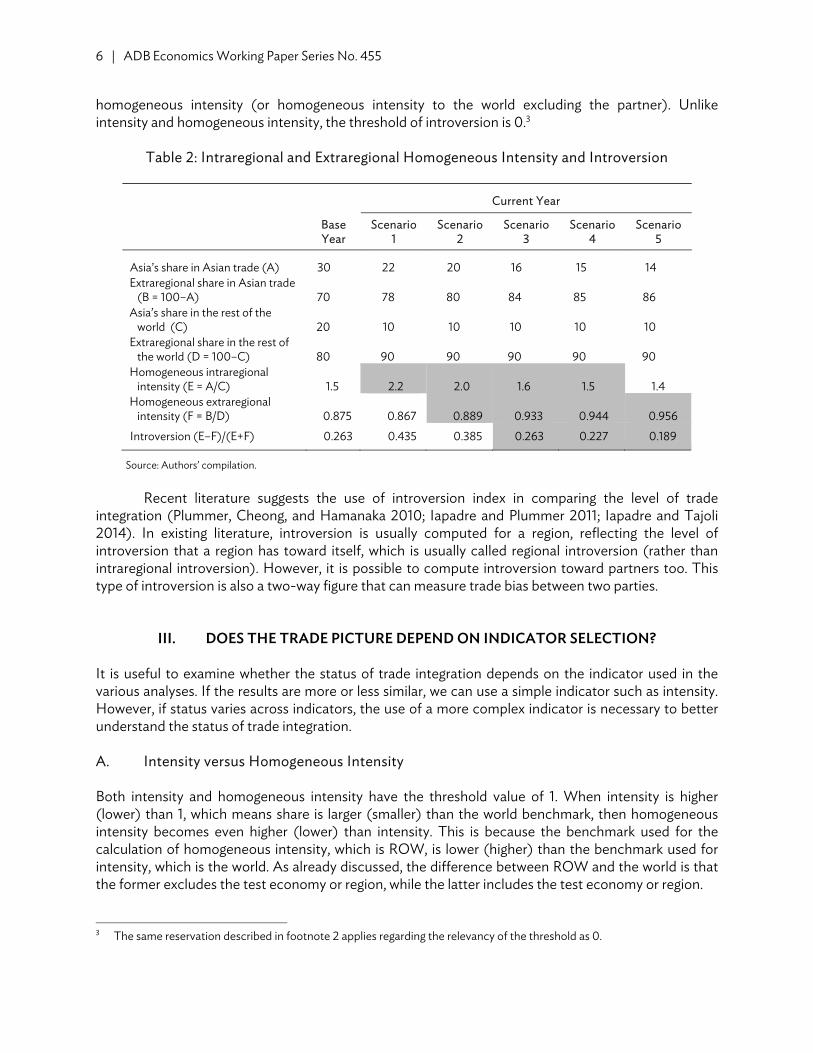
(intraregional homogeneous intensity in the case of region) and the bias toward the world excluding partner X (extraregional homogeneous intensity in the case of region) can move in the same direction. This is not an unusual phenomenon; the precise conditions for this to happen have been detailed by Iapadre (2006). Table 2 provides a scenario in which both intraregional and extraregional homogeneous intensities increase. Under Scenarios 2 and 3, both intraregional homogeneous intensity and extraregional homogeneous intensity increase compared with the base year (Under Scenario 4, intraregional homogeneous intensity is unchanged while extraregional homogeneous intensity increases). This problem can also happen when we conduct a cross-section comparison, which means that the following two scenarios may occur at the same time for a certain test economy or region: (i) the homogeneous intensity toward partner X is higher than that toward partner Y and (ii) the homogeneous intensity toward the world excluding partner X is higher than that toward the world excluding partner Y. Thus, it seems be more suitable to refer to this problem as a comovement problem. D. Introversion Index Both range asymmetry and comovement problems (dynamic ambiguity) are solved by the introversion index. As the box above illustrates, introversion can be computed using both intraregional homogeneous intensity (or homogeneous intensity to a particular partner) and extraregional
6 | ADB Economics Working Paper Series No. 455
homogeneous intensity (or homogeneous intensity to the world excluding the partner). Unlike intensity and homogeneous intensity, the threshold of introversion is 0.3
Table 2: Intraregional and Extraregional Homogeneous Intensity and Introversion
Base Year
Current Year
Scenario 1
Scenario 2
Scenario 3
Scenario 4
Scenario 5
Asia’s share in Asian trade (A) 30 22 20 16 15 14 Extraregional share in Asian trade
(B = 100–A) 70 78 80 84 85 86 Asia’s share in the rest of the
world (C) 20 10 10 10 10 10 Extraregional share in the rest of
the world (D = 100–C) 80 90 90 90 90 90 Homogeneous intraregional
intensity (E = A/C) 1.5 2.2 2.0 1.6 1.5 1.4 Homogeneous extraregional
intensity (F = B/D) 0.875 0.867 0.889 0.933 0.944 0.956 Introversion (E–F)/(E+F) 0.263 0.435 0.385 0.263 0.227 0.189
Source: Authors’ compilation.
Recent literature suggests the use of introversion index in comparing the level of trade integration (Plummer, Cheong, and Hamanaka 2010; Iapadre and Plummer 2011; Iapadre and Tajoli 2014). In existing literature, introversion is usually computed for a region, reflecting the level of introversion that a region has toward itself, which is usually called regional introversion (rather than intraregional introversion). However, it is possible to compute introversion toward partners too. This type of introversion is also a two-way figure that can measure trade bias between two parties.
III. DOES THE TRADE PICTURE DEPEND ON INDICATOR SELECTION? It is useful to examine whether the status of trade integration depends on the indicator used in the various analyses. If the results are more or less similar, we can use a simple indicator such as intensity. However, if status varies across indicators, the use of a more complex indicator is necessary to better understand the status of trade integration. A. Intensity versus Homogeneous Intensity Both intensity and homogeneous intensity have the threshold value of 1. When intensity is higher (lower) than 1, which means share is larger (smaller) than the world benchmark, then homogeneous intensity becomes even higher (lower) than intensity. This is because the benchmark used for the calculation of homogeneous intensity, which is ROW, is lower (higher) than the benchmark used for intensity, which is the world. As already discussed, the difference between ROW and the world is that the former excludes the test economy or region, while the latter includes the test economy or region. 3 The same reservation described in footnote 2 applies regarding the relevancy of the threshold as 0.

The Selection of Trade Integration Indicators | 7
It is important to note that there is a difference in order between intensity and homogeneous intensity. A certain test economy (region) having a higher result than the other economy in one index does not mean that the test economy has a higher result than the other economy in the other index. Here, what is important is the weight of the test economy (region) in world trade (the giant problem discussed above). This is because when a test economy’s weight is large, the economy’s trade composition affects world trade composition.
Table 3, which compares the bias toward partner X for two economies of vastly different sizes
(“Brobdingnag” and “Lilliput”), illustrates a concrete example of this scenario. The partner’s weight in the world is common for all economies, including Brobdingnag and Lilliput (25%). Since Brobdingnag’s weight in world trade is high, the partner’s share in ROW (world excluding Brobdingnag) is low (10%). In other words, the partner’s weight in world trade and that in ROW significantly differ in the case of Brobdingnag (25% versus 10%). In contrast, because Lilliput’s weight in world trade is small, its impact on such differences is limited. Under Scenario 1, the weight of the partner in the world is 25%, which is common to all economies, but the weight of the partner in ROW (the world excluding Lilliput) is 23.3%, and the weight of the partner in the world is only slightly higher than it (25%). Then, the intensity figures that Brobdingnag and Lilliput have toward partner X are the same (1.6), while Brobdingnag has much higher homogeneous intensity than Lilliput. More interestingly, under Scenario 2, Brobdingnag has lower intensity (1.6 versus 2), but higher homogeneous intensity (4 versus 2.3) toward partner X than Lilliput. Thus, we note that intensity and homogeneous intensity give us very contrasting pictures of regional trade.
Table 3: Different Order: Intensity versus Homogeneous Intensity
Brobdingnag Huge Test Economy
(weight in world trade: 50%)
Lilliput Small Test Economy
(weight in world trade: 10%)
Scenario 1 Scenario 2
Partner X’s share in world trade 25% 25% 25% Partner X’s share in test
economy’s trade 40% 40% 50% Partner X’s share in the rest of the
world (world other than a test economy) 10% 23.3% 22.2%
Intensity toward partner X 1.6
(40/25) 1.6
(40/25) 2.0
(50/25) Homogeneous intensity toward
partner X 4.0
(40/10) 1.7
(40/23.3) 2.3
(50/22.2)
Source: Author’s compilation.
Theoretically speaking, the difference in order between the two indicators happens not only across economies and regions, but also across time. For example, suppose Lilliput becomes Brobdingnag, then the intensity indicator decreases and the homogeneous intensity indicator increases simultaneously. This may happen in the long run. Thus, the selection of intensity or homogeneous intensity makes some difference when we analyze a dynamic economy or region (say Chinese trade or Asian trade) in the long run. However, if the time span is short, the difference in

8 | ADB Economics Working Paper Series No. 455
trends between the two indicators is unlikely significant, that is Lilliput does not become Brobdingnag in a single day. B. Homogeneous Intensity versus Introversion There is the “order problem” between homogeneous intensity and introversion. A high value for one indicator does not automatically mean a high value for the other indicator, when two economies or regions are compared.
As illustrated under Scenario 3 in Table 2 above, current intraregional homogeneous intensity becomes higher than its figure in the base year, but introversion remains the same. Under Scenario 4, intraregional homogeneous intensity remains the same as that in the base year, but introversion declines. Hence, at any point between the two scenarios (a region’s share in a test economy’s trade is lower than 16 but higher than 15), intraregional homogeneous intensity becomes higher than its figure in the base year, but introversion declines.
However, this is a small possibility and it has no major impact on the assessment; the direction
of changes (increase or decrease) may be different, but the absolute amount of changes is small. For Scenario “3.5” in Table 2 (where a region’s share in a test economy’s trade is 15.5%), intraregional homogeneous intensity increases from 1.5 to 1.55, while regional introversion declines from 0.263 to 0.246. This shows that when intensity increases (decreases) significantly, homogeneous intensity also increases (decreases).
IV. TRADE LINKAGE DIAGRAM The idea of a trade linkage diagram is simple. It attempts to visually show trade bias (ADB 2014). A certain subregion’s bias toward another subregion and the latter’s bias toward the former are provided on the line between the two. For example, in Figure 1, region A’s trade bias toward region B is 1.2, while region B’s trade bias toward region A is 1.4. In addition, in the trade linkage diagram, intrasubregional bias is provided below each subregion’s name. For example, in the case of region A, it is 2. While Figure 1 includes only two subregions, more subregions can be included in the diagram. It is also possible to draw a diagram to describe the trade bias of a particular economy at the bilateral level.
Figure 1: Example of a Trade Linkage Diagram
Source: Author’s illustration.
The trade linkage diagram is a convenient tool to understand the relative strength of trade linkages that a certain economy or a region has with its partners. Note that an economy or a group cannot have a positive bias toward all partners because bias is a relative indicator. If an economy or a group has positive intensity toward some economies or groups, it will have negative bias toward others.
Region A
2.0 Region B
1.5 1.2 1.4

The Selection of Trade Integration Indicators | 9
V. TRADE LINKAGES IN ASIA A. Intraregional and Extraregional Trade Linkages of Asia as a Whole It is useful to examine the status of trade integration of Asia as a whole. Figure 2 includes diagrams that describe Asia’s trade linkage with itself (intraregional trade) and the rest of the world (extraregional trade). Here, we will construct and compare diagrams based on the three indicators: intensity, homogeneous intensity, and introversion.
The intraregional bias of Asia as a whole is positive for all three indicators. (The threshold is 1 for both intensity and homogeneous intensity, while introversion has a threshold of 0). Asia has a negative trade bias toward outside Asia, which is natural because positive intraregional bias and negative extraregional bias are different sides of the same coin. But it is interesting to note that Asia’s bias toward Africa is higher than its bias toward Europe, North America, and Latin America.4
However, there are important differences across indicators. Asia’s bias toward Asia is 1.6 in the
case of intensity, while it is as high as 2.5 in terms of homogeneous intensity. This is because Asia is a relatively large region that can affect the status of world trade. Since Asian economies trade significantly within Asia, Asia’s share becomes lower for the rest of the world, which is the benchmark for homogeneous intensity, compared to Asia’s share in the world, which is the benchmark for intensity). Since the benchmark for homogeneous intensity is lower than that of intensity, the resulting figure for homogeneous intensity is higher than intensity.
Comparing Asia with other regions is also interesting. In terms of all three indicators, the level
of trade integration in Asia is generally lower than in other regions. Hence, we cannot say that Asia’s trade integration is impressive. But this does not mean it is either good or bad. This simply means that Asia’s trade linkage with the rest of the world is significant. Asia’s intensity is lower than others, but this is because of the mathematical nature of the index. The intensities of Europe and North America are higher than Asia’s, and those of Africa and Latin America are much higher than Asia’s. But if we use homogeneous intensity, Asia’s level is almost the same as North America, though it is still lower than Europe, Africa, and Latin America. Why are the homogeneous intensities of Asia and North America almost the same, while the former’s intensity is lower than the latter’s? This is because Asia is huge and it affects the world benchmark, unlike North America. If Asia, which significantly trades within the region, is included, the benchmark becomes high (world benchmark is higher than ROW benchmark), and hence intensity becomes low (intensity becomes significantly lower than homogeneous intensity). In fact, the difference between intensity and homogeneous intensity is huge for large regions such as Asia and Europe.
4 The Appendix provides the list of countries included in Europe, Africa, North America, and Latin America.

10 | ADB Economics Working Paper Series No. 455
Figure 2: Asia’s Trade Linkages in 2013
a. Intensity
b. Homogeneous intensity
c. Introversion
Note: Figures in parentheses are trade intensities in 2010. Source: Authors’ compilation.
0.4 (0.4) 0.8 (0.9)
0.3 (0.4)
0.7 (0.7)
1.0 (0.8)
1.0 (0.9)
0.9 (0.9)
0.7 (0.7)
Africa4.0 (3.9)
Asia1.6 (1.7)
Europe2.0 (1.9)
Latin America3.0 (3.3)
North America2.0 (1.9)
0.3 (0.3) 0.9 (0.9) 0.3 (0.3)
0.6 (0.6) 1.0 (0.9)
1.1 (0.9)
0.9 (1.0)
0.7 (0.7)
Latin America3.5 (3.8)
Africa4.5 (4.3)
Asia2.5 (2.7)
Europe3.7 (3.6)
North America2.5 (2.5)
–0.7 (–0.7) –0.1 (–0.1) –0.7 (–0.7)
–0.3 (–0.3)
0.0 (–0.1) 0.0 (–0.1)
–0.1 (0.0)
–0.2 (–0.3)
Europe0.8 (0.8)
Asia0.6 (0.7)
Latin America0.6 (0.6)
Africa0.7 (0.7)
North America0.5 (0.5)

The Selection of Trade Integration Indicators | 11
B. Subregional Trade Linkages in Asia The first diagram in Figure 3 describes the level of trade integration within each subregion (intrasubregional trade linkage) and trade linkages between subregions (intersubregional trade linkage).The following diagrams describe each Asian subregion’s trade linkage with regions outside of Asia. Here, our analysis relies on the introversion index alone.
East Asia’s regional introversion index is 0.4, which is almost the same as that of Asia as a whole. This implies that Asia’s trade intensity is mainly determined by East Asia, which includes the two largest traders in Asia: the PRC and Japan. East Asia’s trade is well linked to other subregions in Asia; East Asia’s trade introversion toward/from the rest of Asia is around 0.4/0.3, which is almost the same as the regional intensity of East Asia. But it is interesting to note that the linkage between East and South Asia has a negative bias. East Asia maintains an almost neutral bias with regions outside Asia, with the notable exception of Europe. (However, a negative bias with Europe is a common feature for all Asian subregions aside from Central and West Asia.)
Southeast Asia maintains a level of regional introversion (0.7) that is much higher than those
of East and South Asia. Its trade is well linked to other subregions in Asia (trade introversion toward/from the rest of Asia is 0.4/0.4). For example, Southeast Asia’s trade is well linked with both East and South Asia. However, its trade linkage with regions outside Asia is relatively weak, reflecting the subregion’s high regional bias.
Since South Asia’s regional introversion is as low as 0.3, we cannot say that the subregion is
isolated from the rest of the world. However, its trade linkage with the rest of Asia is weak (introversion is 0). This means that South Asia is a relatively isolated subregion in Asia, unlike East or Southeast Asia. This seems to reflect the fact that South Asia has not fully developed regional value chains with the rest of Asia. As aforementioned, trade linkage between South Asia and East Asia is weak (introversion: –0.1/–0.1). With regard to trade linkage with regions outside of Asia, while South Asia has a negative bias with Europe, North America, and Latin America, interestingly, its trade linkage with Africa is very strong (introversion: 0.5/0.5).While India has had strong economic relations with a limited number of countries, especially with some East African countries with which it shares strong cultural ties, Indian trade with other African countries has been also increasing (Standard Chartered Bank 2012).5
Central and West Asia’s regional introversion is very high at 0.8. But a very high level of regional introversion implies the subregion’s isolation from the world economy. While the subregion has an almost neutral bias with East Asia and Europe,6 its trade bias with Asian subregions (other than East Asia) and with regions outside Asia (other than Europe) is significantly negative. (Central and West Asia is the only subregion that has a neutral trade bias with Europe; other Asian subregions have a strong negative bias with Europe). In other words, other than the adjacent regions (East Asia and Europe), Central and West Asia’s trade linkage is very weak, which highlights the necessity of improving transiting trade for these landlocked countries.
The overall situation of the Pacific and Oceania is similar to that of Southeast Asia. It has a regional introversion of 0.7. The subregion’s trade is linked with East Asia and Southeast Asia (intensity 5 The African Development Bank suggests that India’s duty-free tariff preferential schemes for least developed countries
announced in 2008 has had some positive impact on the India–Africa trade (Barka 2011). 6 However, the trade linkage between the Caucasus countries and East Asia is weak, while that between Central Asia
(Kazakhstan, the Kyrgyz Republic, Tajikistan, Turkmenistan, and Uzbekistan) and East Asia is strong (ADB 2014).

12 | ADB Economics Working Paper Series No. 455
around 0.5). Its trade linkage with regions outside Asia is relatively weak. However, this subregional group includes Australia and New Zealand. Without these two countries playing a role as major traders, the intensity of the Pacific and Oceania would be significantly high, which implies that this part of the world is isolated from the rest of the world.
Figure 3: Subregional Trade Linkage Diagram (Introversion) in 2013
a. Trade linkage between Asia’s subregions
b. East Asia’s trade linkage with other regions
c. Southeast Asia’s trade linkage with other regions
continued on next page
0.2 (0.0)
0.1 (0.1)
–0.8 (–0.8) –0.8 (–0.8)
–0.5 (–0.6)
–0.6 (–0.6)
0.4 (0.4)
0.4 (0.4)
–0.2 (–0.1)
–0.1 (–0.2)
–0.1 (–0.1)
–0.1 (0.0)
0.1 (0.2)
0.0 (0.3)
0.5 (0.5)
0.5 (0.5)
0.2 (0.2) 0.2 (0.2)
0.4 (0.4)
0.4 (0.4)
East Asia0.4 (0.5)
The Pacific and Oceania0.7 (0.7)
Central and West Asia0.8 (0.9)
South Asia0.3 (0.3)
Southeast Asia0.7 (0.7)
–0.6 (–0.6)
–0.7 (–0.6)
0.1 (–0.1)
0.0 (0.1) 0.3 (0.3) 0.4 (0.3)
North America Europe Rest of Asia
Latin America
East Asia0.5 (0.5)
Africa
–0.6 (–0.7) –0.2 (–0.1)
–0.7 (–0.7)
–0.4 (–0.5) –0.3 (–0.3)
–0.3 (–0.3)
–0.2 (–0.2)
–0.5 (–0.5)
Rest of Asia
0.4 (0.4)
0.4 (0.4)
North America Europe
Southeast Asia0.7 (0.7)
Africa Latin America

The Selection of Trade Integration Indicators | 13
Figure 3 continued
d. Southeast Asia’s trade linkage with other regions
e. Central and West Asia’s trade linkage with other regions
f. The Pacific and Oceania’s trade linkage with other regions
Note: Figures in parentheses are trade intensities in 2010. Source: Author’s illustration.
Latin America
–0.5 (–0.5) –0.2 (–0.2)
–0.5 (–0.5)
–0.1 (–0.3)
–0.1 (–0.1) 0.5 (0.4)
0.5 (0.5)
–0.2 (–0.2) 0.0 (0.1) 0.0 (0.0)
South Asia0.3 (0.3)
Europe Rest of Asia North America
Africa
–0.1 (0.1) –0.6 (–0.4)
0.0 (0.0)
–0.9 (–0.8)
–0.8 (–0.9)
–0.8 (–0.9)
–0.6 (–0.4)
–0.9 (–0.9)
Rest of Asia
–0.1 (–0.1)
0.0 (–0.2)
Europe North America
Central and WestAsia
0.8(0.9)
Latin America Africa
–0.6 (–0.6)
–0.6 (–0.6)
–0.6 (–0.6)
–0.3 (–0.3)
–0.3 (–0.3)
–0.3 (–0.2)
–0.6 (–0.6)
0.6 (0.6) 0.6 (0.6)
0.7 (0.7)
–0.3 (–0.2) The Pacific andOceania
North America Rest of Asia Europe
Africa Latin America

14 | ADB Economics Working Paper Series No. 455
VI. CONCLUSION In this paper, we reviewed various indicators that are used in assessing the levels of trade integration and linkage. A share indicator, such as intraregional trade share, is not a suitable indicator for comparison (either for trend or cross-regional analyses), though it is still widely used. Analysis based on a share indicator tells us neither the bias of trade direction nor the strength of trade linkage. An intensity indicator, such as intraregional intensity, is better than a share indicator, but is still not the ideal indicator for comparison. This is because the range variability of the intensity index depends on the size of the partner region (when a partner is large, the ceiling becomes low), which means that the upper limit of intensity tends to be low for a large region. In addition, a large region’s intensity tends to be moderate because it can affect the trade picture of the world and, hence, the world benchmark. A homogeneous intensity indicator is suitable for regional comparisons, though its computation is much more complicated than intensity’s. While intensity uses the world as the benchmark, homogeneous intensity uses the rest of the world as the benchmark. The results of intensity and homogeneous intensity comparisons can be very different when one analyzes a larger region or a region whose share in world trade is increasing (e.g., Asia). More concretely, it is possible that intensity and homogeneous intensity move in different directions and the difference in the trend between the two is large.
An introversion index is the most suitable indicator for various comparisons because it is free from range asymmetry and dynamic ambiguity problems, unlike the homogeneous intensity index. The difference between the two indicators is negligible; the two could move in different directions, but they are simply “tiny increases versus tiny decreases.” However, since we can easily calculate the introversion index once homogeneous intensity is obtained, it is beneficial to use introversion. In this paper, an introversion index is used to describe the status of trade integration. While existing literature usually computes introversion for each region individually (regional introversion), we computed introversion between regions as well.
In order to understand trade integration in Asia, we should conduct a subregional level analysis
because the status of Asia as a whole reflects the outsized impact of East Asia. In addition, the trade linkages between Asian subregions are very different. The trade linkage diagram using an introversion index is a very convenient tool to illustrate the status of trade linkages in Asia. Southeast Asia is highly integrated internally, and is also connected with East Asia and South Asia. The linkage between East Asia and South Asia is weak. Central Asia’s subregional introversion is high, but it is not well connected with the rest of Asia or regions outside Asia; it is isolated. Using the trade linkage diagram, we can also confirm that the trade linkage between South Asia and Africa is very strong.

APPENDIX: REGIONAL CLASSIFICATIONS
Europe Africa North America Latin America Austria Algeria Canada Antigua and Barbuda Belgium Djibouti United States ArgentinaBulgaria Morocco Bahamas, The Cyprus Sudan BarbadosCzech Republic Tunisia BelizeDenmark Angola BoliviaEstonia Benin BrazilFinland Botswana ChileFrance Burkina Faso ColombiaGermany Burundi Costa Rica Greece Cameroon DominicaHungary Cape Verde Dominican Republic Ireland Central African Republic EcuadorItaly Chad El Salvador Latvia Comoros GrenadaLithuania Congo, Democratic Republic of Guatemala Luxembourg Congo, Republic of GuyanaMalta Cote d'Ivoire HaitiNetherlands Equatorial Guinea HondurasPoland Eritrea JamaicaPortugal Ethiopia MexicoRomania Gabon Nicaragua Slovak Republic Gambia, The PanamaSlovenia Ghana ParaguaySpain Guinea PeruSweden Guinea-Bissau St. Kitts and Nevis United Kingdom Kenya St. Lucia Lesotho St. Vincent and the Grenadines Liberia Suriname Madagascar Trinidad and Tobago Malawi Uruguay Mali Venezuela Mauritius Mozambique Namibia Niger Nigeria Rwanda Sao Tome and Principe Senegal Seychelles Sierra Leone South Africa Swaziland Tanzania Togo Uganda Zambia Zimbabwe
Source: Author's classification.

REFERENCES Anderson, K. and H. Norheim. 1993. From Imperial to Regional Trade Preferences: Its Effect on
Europe’s Intra- and Extra-Regional Trade. Weltwirtschaftliches Archive. March. 129.(1). pp. 78–102.
Asian Development Bank (ADB). 2014. Asian Economic Integration Monitor, April 2014. Manila. Association of Southeast Asian Nations (ASEAN). 2010. Master Plan on ASEAN Connectivity.
http://www.mfa.go.th/asean/contents/files/asean-media-center-20121203-182010-79067.pdf ————. 2011. ASEAN Community in Figures. http://www.miti.gov.my/miti/resources/fileupload/
ACIF%202011.pdf Barka, B. H. 2011. India’s Economic Engagement with Africa. Africa Economic Brief. 2.(6). 11 May.
http://www.afdb.org/fileadmin/uploads/afdb/Documents/Publications/India's%20Economic %20Engagement%20with%20Africa.pdf
Bui, T. G. 2008. Intra-Regional Trade of ASEAN Plus Three: Trends and Implications for East Asian
Economic Integration. KIEP CNAEC Research Series No. 08-04. Caribbean Community Secretariat. 2005. Caribbean Trade and Investment Report 2005: Corporate
Integration and Cross-border Development. http://www.caricom.org/jsp/community/ regional_issues/ctir2005_index.jsp
Chen, Z. 2005. NATO, APEC, and ASEM: Triadic Interregionalism and Global Order. Asia Europe
Journal. 3.(3). pp. 361–78. Das, D. 2001. Regionalism in A Globalizing World: An Asia-Pacific Perspective. Warwick University
CSGR Working Paper No. 80/01. De Lombaerde, P., F. Söderbaum, L. V. Langenhove, and F. Baert. 2010. The Problem of Comparison in
Comparative Regionalism. Review of International Studies. 36 (3). pp. 731–53. Grieco, J. 1997. Systemic Sources of Variation in Regional Institutionalization in Western Europe, East
Asia, and the Americas. In E. Mansfield and H. Milner, eds. The Political Economy of Regionalism. New York: Columbia University Press.
Iapadre, L. 2006. Regional Integration Agreements and the Geography of World Trade: Statistical
Indicators and Empirical Evidence, pp. 65–85. In P. De Lombaerde, ed. Assessment and Measurement of Regional Integration. London: Routledge.
Iapadre, L. and M. Plummer. 2011. Statistical Measures of Regional Trade Integration, pp. 98–123. In P.
De Lombaerde, R. Flôres, L. Iapadre, and M. Schulz, eds. The Regional Integration Manual: Quantitative and Qualitative Methods. London: Routledge.
Iapadre, L. and L. Tajoli. 2014. Emerging Countries and Trade Regionalization. A Network Analysis.
Journal of Policy Modeling. 36 (1). pp. S89–S110.

18 | References
Plummer, M., D. Cheong, and S. Hamanaka. 2010. Methodology for Impact Assessment of Free Trade Agreements. Manila: ADB.
Standard Chartered Bank. 2012. Africa–India Trade and Investment—Playing to Strengths, Global
Research. https://www.sc.com/en/resources/global-en/pdf/Research/Africa-India_trade_and _investment_Playing_to_strengths.pdf
World Bank. 2008. Trade and Transport Facilitation in South Asia, Systems in Transition Volume I:
Summary and Main Report. http://siteresources.worldbank.org/SOUTHASIAEXT/Resources/ Publications/448813-1215581662470/5192611-1215581680560/5192623-1219364545186/ transportaugust2008part1.pdf

ASIAN DEVELOPMENT BANK
AsiAn Development BAnk6 ADB Avenue, Mandaluyong City1550 Metro Manila, Philippineswww.adb.org
The Selection of Trade Integration Indicators: Intraregional Share, Intensity, Homogeneous Intensity, and Introversion Index
Introversion index, rather than intraregional trade share, should be used when comparing the level of trade integration (both cross-regional and time series analyses). Further, since Asia is a group of heterogeneous countries, a subregional level analysis is more appropriate in understanding the nature of its trade integration.
About the Asian Development Bank
ADB’s vision is an Asia and Pacific region free of poverty. Its mission is to help its developing member countries reduce poverty and improve the quality of life of their people. Despite the region’s many successes, it remains home to the majority of the world’s poor. ADB is committed to reducing poverty through inclusive economic growth, environmentally sustainable growth, and regional integration.
Based in Manila, ADB is owned by 67 members, including 48 from the region. Its main instruments for helping its developing member countries are policy dialogue, loans, equity investments, guarantees, grants, and technical assistance.
THe SelecTIon of TrADe InTegrATIon InDIcATorS: InTrAregIonAl SHAre, InTenSITy, HomogeneouS InTenSITy, AnD InTroverSIon InDexShintaro Hamanaka
adb economicsworking paper series
no. 455
october 2015