the selection of a major field of study in the college of...
TRANSCRIPT
The Selection of a Major Field of Study in the College of Agriculture
at Kansas State University
Andrew P. Barkley and Dena M. Parrish Department of Agricultural Economics
Kansas State University Manhattan, Kansas 66506-4011
785.532.4426 [email protected]
Selected Paper prepared for presentation at the American Agricultural Economics Association Annual Meeting, Providence, Rhode Island, July 24-27, 2005. Copyright 2005 by Andrew P. Barkley and Dena M. Parrish. All rights reserved. Readers may make verbatim copies of this document for non-commercial purposes by any means, provided that this copyright notice appears on all such copies.

The Selection of a Major Field of Study in the College of Agriculture at Kansas State University.
Abstract The major objective of this study was to identify and quantify the determinants of the selection of a major field of study in the College of Agriculture at Kansas State University in 2004. Data on factors associated with the selection of a major field of study were collected with an internet survey administered to enrolled undergraduate students, and a paper survey administered to incoming freshmen. Logit regression models were estimated to identify the statistical determinants for twelve majors. Results indicated that the desire to work with or without plants or animals was the most influential factor in the decision to enroll in a specific major. Also, gender, high school agriculture courses, agricultural related clubs/activities, high school science teachers, high school agriculture education teachers, the friendly atmosphere in the College of Agriculture, and friendliness of each of the individual departments were also significant determinants in the selection of a major. The specific regression results provide a wealth of information to faculty and administrators interested in enhancing recruitment efforts and matching individual students with major fields of study that are beneficial and meaningful.

1
The Selection of a Major Field of Study in the College of Agriculture at Kansas State University. This study investigated the selection of a major field of study for undergraduate
students enrolled in the College of Agriculture at Kansas State University during the
spring semester of 2004, and students enrolling for the first time in fall 2004. The major
objective was to identify and quantify the determinants of the selection of a major field of
study in the College. Student recruitment plays a vital role in the continued viability of
undergraduate programs in colleges of agriculture. During the 1980s, colleges of
agriculture located in the United States reported declines in enrollment, attributed to two
causes: (1) a decline in the traditional college-age population, and (2) the failure of
agricultural institutions to compete with other professions in attracting students
(Pescatore and Harter-Dennis). While little can be done about the decline in the college-
age population, colleges of agriculture may desire to develop strategies to retain or
increase their share of prospective college students to continue educational programs at
historical size and funding levels.
Previous literature identified several significant potential causes of the declines in
enrollment, including: (1) competition from non-agricultural related professions, (2) a
decrease in the number of farming communities, (3) changes in the number of people
between the ages of 15-19, (4) increasing urban mentality of rural populations, (5) the
negative public image of agriculture, and (6) the influence of high school teachers, high
school counselors, and parents (Jackman and Smick-Attisano; Rawls et al.; and
Donnermeyer and Kreps). Several studies focused on strategies to recruit students and
increase enrollment in colleges of agriculture through understanding high school and
college student perceptions of agriculture and the reasons undergraduate students chose a

2
major field of study. These studies focused primarily on factors that influence enrollment
in colleges of agriculture as a whole, and did not focus on individual major fields of study
within the College of Agriculture. The reasons that students enroll in a major field of
study are likely to differ across curricula. Therefore, the purpose of this study was to
determine the factors that influence student selection decisions for each of the individual
major fields of study in the College of Agriculture at Kansas State University in 2004.
The motivation behind the study was to actively assist in the identification of the
characteristics that attract students to specific majors in the College of Agriculture. The
results could be used to develop and implement recruitment strategies aimed at increasing
enrollment and enhancing the placement of students into major fields of study where they
will be successful. To the extent that each individual student is placed in a major that is
meaningful and productive, overall satisfaction levels for the College will be higher than
otherwise, and enrollment may increase due to greater levels of contentment.
Literature Review
Tarpley and Miller (2004) identified differences between students who planned to
major in agriculture and students who did not for 18,177 students in Utah, using 177
student profile questions from the 2002 ACT Assessment, including interest inventory
factors and demographic information. The authors identified 465 students who indicated
that they were planning to choose an agricultural major. A stepwise multiple regression
was used with 19 factors, including community size, interests, awards/recognitions, and
college type preference, accounting for 3.3 percent of the variance in choice of college
major. The low variance was attributed to the reality that factors previously associated

3
with the choice of a major by agriculture students are not measured by the ACT
Assessment. Results showed that gender, as well as other demographic factors, were not
a significant factor in the choice of a major. Community size and an interest in natural
science were found to be statistically significant in the regression.
Lindner et al. described rural middle school students� beliefs about science and
sources of influence affecting science career choices. Overall, students� beliefs about
science were positive. Factors found to most positively affect a students� science career
choice were parents/guardians, teachers and other family members. In addition, there
were positive relationships found between school guidance counselors and church
leaders. Wildman and Torres (2001) determined to what degree a wide array of factors
affected a students� choice of an agricultural major at New Mexico State University. The
questionnaire was designed to gather data in the following categories: student
demographic and academic characteristics; types of exposure to agriculture; perceptions
of family and friends; perceptions of college factors; and perceptions of professionals in
agricultural fields. The results of the study show that prior experiences in agriculture
were the most influential factor in selecting an agricultural major. Other significant
factors included the friendly atmosphere of the College of Agriculture, professional and
personal role models, and job considerations such as work environment.
Cano (1999) studied the learning style and academic performance of 94 incoming
freshman enrolled in the College of Food, Agricultural, and Environmental Sciences at
The Ohio State University. Cano concluded that the students who were attracted to social
science majors are often field-dependent, and those attracted to the hard sciences are
often field-independent.

4
In an attempt to discover the factors that influence freshman to enroll in colleges
of agriculture, Donnermeyer and Kreps (1994) surveyed 217 enrolled freshman
agricultural majors at The Ohio State University. The survey focused on three areas:
factors influencing freshmen decisions to enroll in the College of Agriculture; their
opinions about agricultural education and agricultural research; and their plans for
agricultural careers and advanced graduate education. Twenty-seven factors related to
the decision to enroll in the College of Agriculture were used in the survey. These
factors were grouped into five categories listed in order of importance: values; financial
incentives; exposure to agriculture; influence from family and friends; and influence from
teachers, extension workers and others. Results from the study show that social science
majors seem more influenced by high school friends, vocational teachers, 4-H interaction,
prior experience in agriculture, and having taken agricultural courses in high school.
Natural science majors seem to be more influenced by a desire to work with animals,
relatives, veterinarians, and news stories about food production. Donnermeyer and Kreps
suggested that there is an over reliance on high school teachers and counselors as well as
extension agents as an enrollment strategy, and that more emphasis needs to be placed on
providing separate appeals to both rural, small town and non-rural students.
Rawls et al. (1994) conducted a study during a two-year period for 36 students at
Southern University and A&M College to determine the educational plans of minority
students who were participants in a food and agricultural recruitment program. The
authors found eight factors as important in choosing a college major: personal interest,
ability and skills, personal happiness, career interest, availability of jobs, major and
college, income after college, and prestige of career.
5
Jackman and Smick-Attisano concluded that a student�s choice of college is
influenced by family members or someone associated with the student�s high school or
potential college choice, and that the choice of academic major is influenced by the
quality and reputation of academic programs. The authors suggest creating recruitment
plans that involve family members, increasing the publicity of activities and awards
received by the college of agriculture.
After noting that enrollment in colleges of agriculture have been decreasing since
1980, Shuster and Constantino (1986) conducted a survey of 541 students in the College
of Agriculture and Life Sciences at Virginia Tech University to determine what factors
influence the selection of a college and major. They found that the important factors for
choosing a major field of study were job opportunities, career interests, parents, and
printed material. In addition, the authors concluded that potential students should be
presented with information on evaluative criteria considered important when choosing a
university and major and should also receive promotional material while juniors or
seniors in high school, or freshmen and sophomores in college. Published material about
the college of agriculture should be consistent with the evaluative criteria given to the
student. Alumni, high school teachers, extension agents, and representatives from the
university were reported as factors that were not influential in students� choice of major.
Mark, Lusk and Daniel recently surveyed 403 graduate students in agricultural, resource,
or environmental economics. Results showed that graduate students in agricultural
economics prefer schools that are closer to home, higher ranked, have more
office/computer facilities, and offer larger monetary stipends; however, the program
ranking was more highly valued by the students than any of the other previous factors.

6
The authors suggested that higher ranked programs may be able to offer smaller stipends
and remain competitive with lower ranked programs. In addition, students may be
willing to accept higher stipends and office space to attend lower ranked schools.
Data
The data employed in this study came from: (1) an Internet survey administered
to undergraduate students enrolled in the College of Agriculture during spring 2004, and
(2) a paper survey administered to incoming freshmen who enrolled in the College of
Agriculture in June 2004. The students who were surveyed during freshmen orientation
were not yet enrolled when the Internet version was distributed. The surveys used were
designed by the researcher and were based on past research in this area (Wildman and
Torres; Donnermeyer and Kreps; Jackman and Smick-Attisano; and Tarpley and Miller).
The Internet survey was distributed on May 5, 2004, to 1881 students. A total of 734
students (39 percent) responded to the survey, and 639 usable (complete) surveys were
obtained, a response rate of approximately 34 percent. A total of 111 useable responses
were obtained from a sample population of approximately 250 students, resulting in a 44
percent response rate. The total response rate for the study was 35 percent for both
surveys, yielding 750 complete, usable observations.
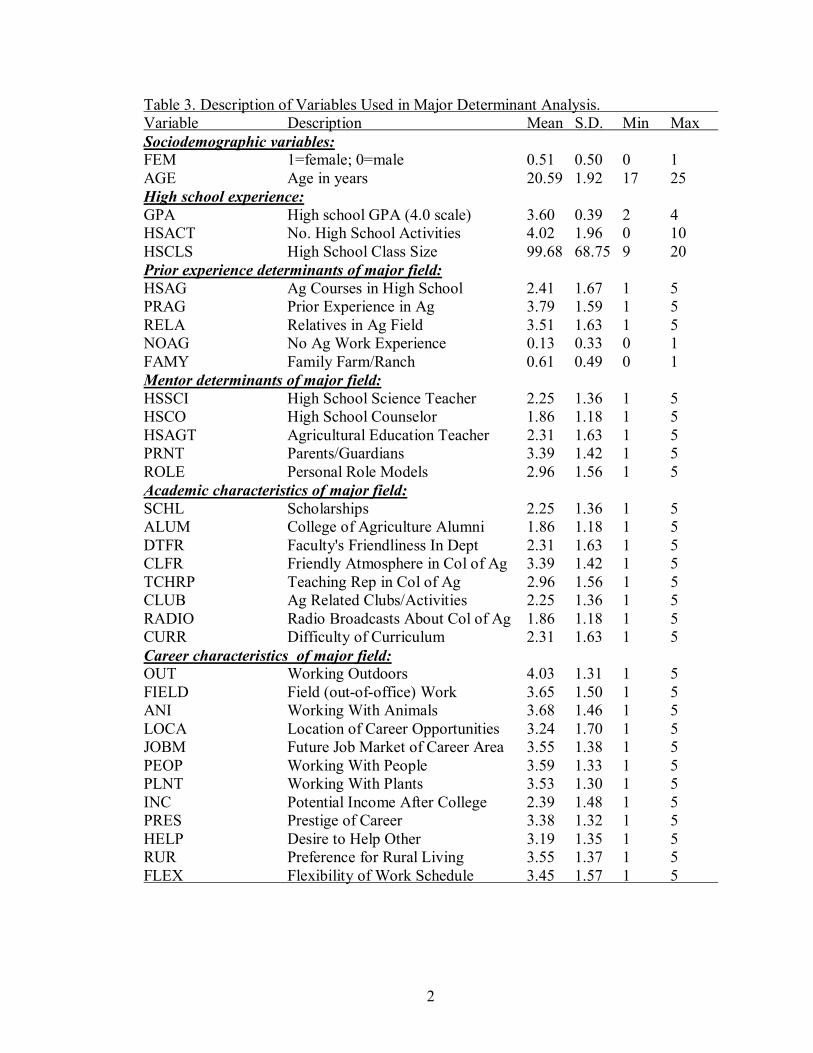
Data were collected for 750 students in the fifteen majors that students select
upon enrollment in the College of Agriculture at Kansas State University (table 1). Table
2 presents survey results for the questions regrading major selection, and table 3 presents
the description and summary statistics of the variables used in statistical model reported
below. The distribution of respondents by major is found in table 1. Animal Sciences

7
and Industry was the most frequently reported major (34 percent), followed by
Horticulture, Forestry and Recreation Resources (12 percent), and Agricultural
Economics (9 percent). The distribution of responses mirrors the enrollments by major in
the College of Agriculture. Factors that were influential in selecting a major are
presented in table 2: Agricultural Experiences, Family and Friends, High School
Determinants, University Determinants, and Job Considerations. Respondents were
asked to rank each of the factors listed under the categories on a scale of 1 (not
influential), to 5 (very influential) in the decision to select a major.1 Mean values for
each determinant are presented in table 2.
The mean values for the agricultural experience factors: prior experience in
agriculture, other agricultural experiences, and relatives in an agricultural field of work
were between 3 and 4: �somewhat� to �moderately� influential. The least influential
factor in this category was television programs about agricultural topics (1.98).
Agricultural courses in high school had a mean value of 2.41. Parent(s)/Guardian(s), on
average, was the most influential factor in the �Family and Friends� category, with a
mean response equal to 3.39. All other factors in the Family and Friends category had
mean values between slightly (=3) and somewhat (=4) influential. Overall, it appears that
family and friends were less influential in the selection of a major than other factors.
This is also the case for High School determinants. Agricultural education teacher, high
school science teacher, and extension professional all had mean values between 2 and 3,
while the remaining factors had means between 1 and 2.
As expected, university factors had higher mean values (table 2). The factor
�major area seemed interesting� had the highest mean value at 4.03; students tend to

8
major in what they are interested in. The friendly atmosphere in the College of
Agriculture, faculty�s friendliness in the department, and faculty reputation were
somewhat to moderately influential, indicating that the human element is important when
students are selecting a major. Scholarship(s) were only slightly to somewhat influential.
As expected, radio broadcasts about the College of Agriculture fell between the �not
influential� to �slightly influential� categories. Surprisingly, all of the job consideration
factors except working with plants were somewhat to moderately influential. This is
most likely because there are fewer students enrolled in plant-related majors compared to
those enrolled in animal or other types of science or social science fields, resulting in a
low mean score.
Empirical Model
To identify and quantify the determinants of the selection of a major field of study
several groups of factors in the students� background were examined:
Majori = f (Sociodemographic Variables, High School Experience, Prior (1)
Experience, Mentors, Academic Characteristics, Career Characteristics).
The model included Sociodemographic variables that describe the student�s
gender (FEM) and AGE.2 High School Experience variables include GPA,3 high school
activities (HSACT), 4 and high school class size (HSCLS). 5 The Mentors, Academic
Characteristics, and Career Characteristics included in the model were the Likert-type
scale survey questions that report the influence of certain factors in a student�s choice of

9
major (table 3). Prior Experience variables were included in the model to determine if
prior experience in agriculture was a determinant in the selection of a specific major, and
what types of prior experience were significant. Prior experience variables included in
the model included agriculture courses in high school (HSAGC), prior experience in
agriculture (PRAG), relatives in an agricultural field of work (RELA), lack of agricultural
work experience (NOAG), and work experience on a family farm (FAMY).
The Mentor variables included in the model were high school science teacher
(HSSCI), high school counselor (HSCO), agricultural education teacher (HSAGT),
parent(s)/guardian(s) (PRNT), and personal role model(s)/mentor(s) (ROLE). Academic
characteristics included in the model were scholarship(s) (SCHL), College of Agriculture
Alumni (ALUM), faculty�s friendliness in the individuals� department (DTFR), friendly
atmosphere in the College of Agriculture (CLFR), teaching reputation of faculty in the
College of Agriculture (TCHRP), agricultural related clubs/activities (CLUB), radio
broadcasts about the College of Agriculture (RADIO), and difficulty of curriculum
(CURR). Career characteristics included in the model were working outdoors (OUT),
field (out-of-office) work (FIELD), working with animals (ANI), location of career
opportunities (LOCA), future job market of career area (JOBM), working with people
(PEOP), working with plants (PLNT), potential income gained after college (INC),
prestige of career (PRES), desire to help others (HELP), preference for rural living
(RUR), and flexibility of work schedule (FLEX).
The probability of a student selecting a major (Pi) depends on a vector of
independent variables associated with student j, Xj (the 35 independent variables
identified above), and β, a vector of the coefficients to be estimated:

10
)( βjji XfP = . (2)
The logit specification asserts that the probability of student i selecting survey
response Yi, ( jiP ), is a function of major characteristics (Maddala 1983 and 2001;
Amemiya):
))exp(1/(1 ' βjj
i XP −+= . (3)
The estimated coefficients of the logit analysis reveal the direction of the change in
probability of selecting a given response resulting from a change in the independent
variables. However, the parameters do not represent the actual change in probability.
The actual change in probability for a respondent selecting major i depends on both the
original probability and the initial values of the independent variables (Judge et al.).
Judge et al. report that the change in probability given a change in the independent
variable Xj in the logit model is given by (4).
2'
'
)]exp(1[)exp(
βββ
j
jj
j
ji
XX
XP
−+−
=∂∂
(4)
However, when independent variables are qualitative (0-1) in nature, jj
i XP ∂∂ / does not
exist since Xj is discrete and thus does not vary continuously. In this case, probability
changes must be calculated by evaluating jiP at alternative values of Xj. The change in
probability that Yi =1 brought about by a change in variable Xj is given by (5).
01)01()11(
−==−==
=∆∆ jiji
j
ji XYPXYP
XP
(5)
Probability changes were calculated for each independent variable while holding
the other variables constant at their sample mean values (reported in table 3). �Change in

11
Probability� is the change in the probability of a respondent who is not enrolling in major
i given a one unit increase in the independent variable Xj, holding all else constant.
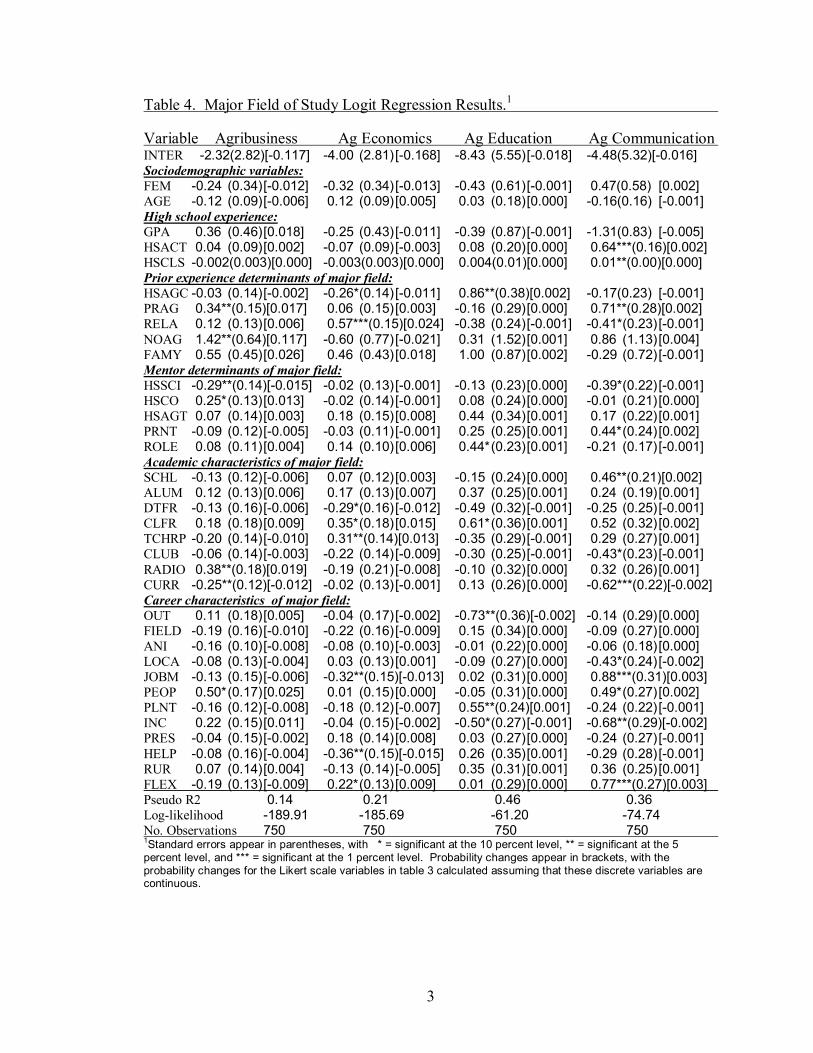
Results
Logit regression results for each of the 12 major fields of study are reported in
table 4. The explanatory ability of the models, as measured by the pseudo-R2, ranged
from 0.14 (Agribusiness) to 0.57 (Bakery Science). Prior experience in agriculture
(PRAG) resulted in a 1.7 percent increase in the probability of selecting Agribusiness
relative to the other major fields of study. Survey respondents with no prior agricultural
work experience (NOAG) were 11.7 percent more likely to select Agribusiness relative to
the other major fields of study. Future career options of students who are interested in
working in Agribusiness (finance, marketing, etc.) are not often feasible work options for
students in high school or college. However, agribusiness students could have had a wide
range of agricultural experiences such as being raised on a farm, or involvement in 4-H or
FFA, but may not have considered it as �work� since they may not have been paid.
Respondents were 1.5 percent less likely to choose Agribusiness based on the influence
of high school science teachers (HSSCI), perhaps because Agribusiness is not a science-
based field of study. High school counselors (HSCO) were influential in students
selecting Agribusiness as their major, with a probability change equal to 0.013. High
school counselors may view Agribusiness as more marketable relative to other
agricultural majors. Respondents who listened to these radio broadcasts were 1.9 percent
more likely to enroll in Agribusiness. This result is interesting since the College of
Agriculture does not have radio broadcasts specifically about the college; however, there
12
are many extension reports that are broadcasts as well as business-related topics that are
not necessarily about the College of Agriculture, but may influence students to select this
major. Students who enrolled in Agribusiness were deterred (1.2 percent) by the
challenging nature of the curriculum (CURR), such as the calculus and statistics
requirements. Students who enrolled in Agribusiness reported working with people
(PEOPLE) as a determinant this major field. When taking into account future job
considerations, the idea of working with people made respondents 2.5 percent more likely
to choose Agribusiness, perhaps due to the social science nature of the field, or the
interactions associated with many jobs related to the field.
Respondents who had agricultural courses in high school (HSAG) were 1.1
percent less likely to enroll in Agricultural Economics, since high school agricultural
curricula may be more production-oriented than the economics of agriculture.
Respondents who have relatives in agriculture (RELA) were 2.4 percent more likely to
choose Ag Econ relative to other majors. One explanation for this highly significant
result is that perhaps urban students were influenced to choose agriculture by relatives,
and Agricultural Economics is a major where someone with no prior experience could be
successful. Respondents were 1.2 percent less likely to choose Agricultural Economics
as their major due to a perceived lack of friendliness of the faculty in the department
(DTFR), but the friendly atmosphere in the College of Agriculture (CLFR) made students
1.5 more likely to enroll in this major. While this result seems a bit contradictory, it is
intuitive. Faculty in the department, in general, tend to have challenging courses and
expect quality work from their students. While students may feel the faculty are not
friendly, they were influenced by the teaching reputation of faculty in the College of

13
Agriculture (TCHRP), which was a significant factor in students selecting Agricultural
Economics with a probability change equal to 0.013. Consideration of the future job
market (JOBM) makes students 1.3 percent less likely to choose Ag Econ. The desire to
help others in their future career (HELP) made respondents 1.5 percent less likely to
choose Agricultural Economics. Flexibility of work schedules (FLEX) was an important
factor in selecting Ag Econ, which is consistent with the wide diversity of jobs available
to graduates in this major (0.9 percent).
Survey respondents who had agricultural courses in high school (HSAGC) were
0.2 percent more likely to choose Agricultural Education as their major, relative to other
majors, as expected. Respondents who had a personal role model or mentor (ROLE)
were 0.1 percent more likely to choose Ag Ed. The friendly atmosphere in the College of
Agriculture (CLFR) made respondents 0.1 percent more likely to enroll in this major.
Career characteristics found to be significant for Agricultural Education majors
were working outdoors (OUT), income potential (INC) and working with plants (PLNT).
Respondents who chose this major were less interested in working outdoors (-0.2
percent), and income potential (-0.1 percent). This is validated by the fact that
agricultural education teachers often work in a classroom setting and education jobs do
not provide the same compensation as jobs located in private industry. Students who had
a desire to work with plants (PLNT), were 0.01 percent more likely to enroll in
Agricultural Education.
Respondents who had one additional high school activity (HSACT) were 0.2
percent more likely to enroll in Agricultural Communications and Journalism (Ag Com).
The respondents came from larger high school class sizes (HSCLS) relative to other

14
agriculture majors; however, the probability change is close to zero. Ag Com is a major
selected by many non-traditional agriculture students, thus explaining why, relative to
other majors, these students come from larger class sizes and thus larger cities. Prior
experience in agriculture (PRAG) increased the probability of selecting this major by 0.2
percent. Respondents with relatives involved in agriculture (RELA) were 0.1 percent less
likely to choose Ag Com as their major.
There were two significant mentor determinants of major field for Ag Com
majors. Respondents who were influenced by their high school science teachers were 0.1
percent less likely to select Ag Com as a major. This result was expected as this major is
a social science rather than being science-based. Parents (PRNT), on the other hand,
were influential in selecting this major with a probability change of 0.002. Scholarships
(SCHL) resulted in a small but statistically significant increase in the probability of
selecting Ag Com relative to other majors. Involvement in agricultural-related clubs and
activities made respondents 0.1 less likely to choose this major. The difficulty of
curriculum made students 0.2 percent less likely to choose to enroll in Ag Com, perhaps
reflecting the amount of writing required. Future career prospects (JOBM) made students
0.3 percent more likely to select Ag Com. A person with this degree has a variety of
options with this degree from private industry, government, business, or self-
employment. Students who selected this major want to work with people (PEOP):
respondents were 0.2 percent more likely to choose this major in order to work with
people. Flexibility of work schedule (FLEX) had a small but statistically significant
increase in the probability (0.3 percent) of selecting Ag Com relative to other majors.
The location of future work opportunities (LOCA) made respondents 0.2 percent less

15
likely to select this major relative to other majors. The future income potential (INC)
also made respondents 0.01 percent less likely to select this major.
Students enrolled in Agricultural Technology Management (ATM) are
predominantly males; female respondents (FEM) were 0.2 percent less likely to choose
ATM relative to other majors, perhaps reflecting a lower interest in farm equipment
among females. Students with more high school activities (HSACT) were 0.1 percent
less likely to enroll in ATM. High school science teachers (HSSCI) made the
respondents 0.2 percent more likely to select ATM. Students who were influenced by
parents (PRNT) or ROLE models were 0.2 percent less likely to enroll in ATM. The
perceived lack of friendliness in the department made students 0.4 percent less likely to
enroll in this major. In contrast, the friendly atmosphere in the College of Agriculture
(CLFR) was significantly positive with a probability change of 0.003. Students in ATM
were associated with agricultural-related clubs and activities (CLUB), and a smaller
desire to work with animals (ANI), relative to other majors.
The model explained 34 percent of the variability in selecting Agronomy as a
major. The majority of students who selected this major were males, and the probability
change for FEM is equal to -0.016, indicating a small but statistically significant decrease
in the probability of selecting Agronomy relative to other majors. Students with no
agricultural work experience (NOAG) were 4.9 percent more likely to enroll in this
major, while respondents with family farm work experience (FAMY) were 2.7 percent
more likely to select Agronomy. Many students who choose this major may be planning
to work on a farm or may use the degree for non-farm purposes so this result seems
intuitive. High school counselors (HSCO) were associated with students not selecting

16
Agronomy, (-0.6 percent). Students with a scholarship (SCHL) were 0.5 percent more
likely to choose Agronomy. Agricultural-related clubs and activities (CLUB) made
students less likely to enroll in Agronomy as their major, with an estimated probability
change equal to negative 0.004. One possible explanation is that students may not
consider clubs when the selection of a major is made, thus, they have no influence.
Students interested in working with animals (ANI) were 0.7 percent less likely to enroll
in Agronomy, and students interested in working with plants (PLNT) were 1.1 percent
more likely to enroll in Agronomy, relative to other majors.
Compared to other majors, there are more females in Animal Sciences and
Industry; females were 17.2 percent more likely to enroll in Animal Sciences and
Industry relative to other majors. Respondents who have relatives in agriculture (RELA)
were 4 percent less likely to choose Animal Sciences, perhaps reflecting the large number
of pre-vet medicine students from nonfarm backgrounds and families. The mentor
determinants of major field provided results contradictory to intuition. Students
influenced by high school counselors (HSCO) were three percent more likely to enroll in
this major. This may be capturing the effects of majors such as pre-vet, in which
counselors are more likely to encourage these high-achieving students. However, survey
respondents who were influenced by high school agricultural education teachers
(HSAGT) were 3.9 percent less likely to select Animal Sciences. Faculty friendliness in
the department (DTFR) was an important factor in students selecting this major with a
probability change equal to 0.055, indicating that students were 5.5 percent more likely to
select this major because of the friendly department, relative to other majors. However,
the friendly atmosphere in the College of Agriculture (CLFR) was negatively significant

17
at the one percent level with a probability change of -0.064. In other majors, the results
showed that the respondents felt the college was friendlier than their department.
Agriculture-related clubs/activities (CLUB) made students 3.5 percent more likely to
select this major. This result may be due to the popularity of livestock judging teams
and the Rodeo Club. There was a relatively large and statistically significant in the
probability of selecting Animal Sciences when the desire to work with animals (ANI) is
considered (17.7 percent). Survey respondents were more likely to choose this major
when the prestige of the career (PRES) was considered, with an estimated probability
change of 0.052. This could be caputuring the prestige associated with the livestock
industry, or veterinary careers. Working with plants (PLNT), was negatively correlated
with Animal Sciences (-10.8 percent).
The regression model for Bakery Science and Management explained 57 percent
of the variability in selecting this major. The probability that a female (FEM) chose this
major relative to other majors was 0.1 percent higher than other majors. Work on a
family farm or ranch (FAMY) positively influenced the selection of Bakery Science, with
an estimated probability change equal to 0.001. Scholarships (SCHL) had a small but
statistically significant influence on the selection of Bakery Science. Friendliness of the
faculty in the College of Agriculture (CLFR) was negatively associated with selection of
Bakery Science, indicating that these majors may be less interested in how friendly their
teachers are. Faculty reputation (TCHRP) in the college resulted in a small increase in
the probability of selecting Bakery Science and Management relative to other majors.
The positive influence of faculty reputation may help to offset the negative influence of
friendliness in the College of Agriculture.

18
The significant career characteristic variables for Bakery Science and
Management all had estimated probability changes nearly equal to zero. Future career
income potential (INC) was positively significant at the ten percent level. Since this
program is only one of a few in the nation, there is a high demand for its graduates, thus
generating income potential. This major was chosen by students who have the desire to
help others (HELP) in their future jobs. Significant factors that deterred students from
this major were working with animals (ANI), working with plants (PLNT), prestige of
future career (PRES) and rural living (RUR).
High school agricultural education courses (HSAGC) and the influence of parents
(PRNT) both decreased the probability of selecting Food Science by 0.2 percent. In
contrast, both high school agricultural education teachers (HSAGT) as well as high
school science teachers (HSSCI) increased the probability of selecting Food Science as a
major by 0.2 percent. High school activities (HSACT) had an estimated probability
change equal to -0.002, indicating that as the amount of high school activities increases,
the probability of selecting Food Science and Industry decreases. Future income
potential (INC) was the only career characteristic found to be highly significant and
positive at the one percent level, with a probability change equal to 0.004. The income
potential of careers associated with this major is a drawing force for enrollment in this
major. Food Science and Industry majors did not select this major to working outdoors
(OUT), work with animals (ANI) and because of the location of career opportunities
(LOCA), all of which had a negative association with Food Science majors, and
probability changes equal to -0.002.

19
Horticulture, Forestry and Recreation Resources has one of the largest
enrollments in the College of Agriculture, and the logit regression model explained 53
percent of the variability in the selection of this major. High school agricultural
education courses (HSAGC) resulted in a small decrease in the probability of selecting
this major relative to others. However, high school agricultural education teachers
(HSAGT) had a positive impact on students selecting Horticulture, with a probability
change of 0.007. Students with family farm or ranch work experience (FAMY) were 4.3
percent less likely to enroll in Horticulture, Forestry and Recreation Resources, relative to
the other areas. Agricultural clubs/activities were associated with a 0.7 percent increase
in the likelihood of selecting Horticulture as a major. Career characteristics that
influenced students to select this major were working outdoors (OUT, 1.8 percent),
working with plants (PLNT, 1.6 percent), and income potential (INC, 0.6 percent).
Career factors such as field (out-of office) work (FIELD), working with animals (ANI),
and rural living (RUR) had a negative affected enrollment in this major.
The model explained 51 percent of the variability in selecting Milling Science and
Management a major. Females (FEM) were 0.3 percent less likely to select Milling
Science as a major. Compared to other majors, these respondents graduated from high
school with a larger class size (HSCL), although the estimated probability change is close
to zero. Milling Science majors were not influenced by high school agricultural
education teachers (HSAGT), but were influenced by high school agricultural education
courses (HSAGC). However, both of these variables had an estimated probability change
near zero. Academic characteristics that influenced these students in a positive manner
were the faculty�s friendliness in their department (DTFR) and RADIO broadcasts about
20
the College of Agriculture. The future job market (JOBM) had a positive impact on
students selecting Milling Science, with a probability change equal to 0.001. As
expected, working with animals (ANI) had a negative influence. Survey respondents in
this major area were negatively associated with a desire to help others (HELP) in their
future career, with an estimated probability change of negative 0.001. This reflects jobs
that are less people-oriented than other careers for agricultural college graduates.
Females were one percent less likely to choose Park Management and
Conservation (FEM) relative to other majors in the College of Agriculture. The variable
GPA was significant at the one percent level with an estimated probability change equal
to negative one percent. This result shows that, when compared to other majors, survey
respondents who choose this major had lower GPA�s. High school agricultural education
teachers (HSAGT) had a negative impact on the selection of this major with an estimated
probability change equal to negative 0.004, while high school agricultural education
courses (HSAGC) had a positive impact with an estimated probability change equal to
0.003. Students with scholarships (SCHL) were 0.4 percent less likely to choose this
major. Faculty reputation (TCHREP) and agricultural-related clubs and activities
(CLUB) had a negative impact on students selecting this major. Friendliness in the
department (DTFR), location of career opportunities (LOCA), helping others (HELP),
and flexibility of work schedules (FLEX) were all positively associated with the selection
of Park Management and Conservation, with estimated probability changes equal to
0.002. Working with plants (PLNT) was positively significant with an estimated
probability change of 0.003. The future job market (JOBM) had an estimated probability
change equal to -0.002, and income potential (INC) had a probability change of -0.003.

21
Intuitively, it would be expected that the number of jobs in this field would be limited
because parks are limited in number. In addition, it would not be expected that these jobs
would pay less than other careers for agricultural college graduates, given the possibility
of nonpecuniary benefits of working outdoors and in parks.
Conclusions
This study investigated factors that could be used to predict and explain the
agriculture major field of study selected by students who enroll in the College of
Agriculture at Kansas State University. For all majors, the most important prior
experience determinant of major field was prior experience in agriculture, followed by
other agricultural experiences. The mentor determinants of major field indicated that
parents(s)/guardian(s) was the most important factor followed by personal role
model(s)/mentor(s). The most influential people during high school indicated by the
survey were agricultural education teachers, followed by high school science teachers.
University factors that were found to be influential were the major area seemed
interesting, followed by the friendly atmosphere in the College of Agriculture. The most
influential job considerations were field (out-of-office) work, followed by working
outdoors.
The statistical results indicated that the desire to work with or without plants or
animals was the most influential factor in the decision to enroll in a specific major. In
addition, gender, high school agriculture courses, agricultural related clubs/activities,
high school science teachers, high school agriculture education teachers, the friendly
22
atmosphere in the College of Agriculture and the individual departments were also
important factors.
This study quantified the determinants of selecting a major in the College of
Agriculture at Kansas State University. Results from this study were similar to other
studies that had looked at the college as a whole rather than the individual majors. The
contributions of this study result from using economic theory to determine the
statistically significant variables as well as looking at the individual majors instead of an
aggregate student population. Results of this study can be used to help refine the
recruitment strategies employed by colleges of agriculture as well as to help provide an
outlook of what types of students are attracted to certain majors. Further investigation to
determine which of these factors are unique to students who chose an agricultural major,
versus those who choose a non-agricultural major, would provide an interesting contrast.
This would offer still more insight into factors that influence students to select the college
of agriculture and would be a welcome addition to the body of literature regarding the
selection of a major.

23
Notes
1Respondents were also allowed to choose a response of �n/a� which meant the factor was �not applicable.� An example of where a �n/a� response could be valid is in the case of the brother(s)/sister(s), if the respondent was an only child. �Not applicable� responses were grouped with the �not influential� responses because if the factor was not applicable it was deemed as not influential.
2The variable AGE ranged from 17-24, and over 25. If an individual�s age was reported to be �25 or over,� they were considered non-traditional and 25 was used for the age.
3The respondents were asked to report their GPA on a 4.0 scale. Responses that were greater than 4.0 were assumed to be equal to 4.0. Responses could have been greater than 4.0 if the student was enrolled in advanced placement courses where an A is worth more than four points instead of the standard four. In addition, these students may have been graded on a 5.0 scale or may have had a plus/minus grading system at their school.
4The survey allowed respondents to choose from 11 high school activities. In addition, respondents could choose a response of �no high school activities� as well as a response of �other.� Responses of �other� that did not clearly fit into another pre-defined category were counted separately. The high school activity variable (HSACT) was defined as the sum of the 11 choices as well as responses of, �other.�
5To control for multicollinearity, the size of the town where the student was predominately raised was omitted from the regressions.

24
References Amemiya, T. Advanced Econometrics. Cambridge, MA: Harvard University Press, 1985. Cano, J (1999). �The Relationship Between Learning Style, Academic Major, and
Academic Performance of College Students.� Journal of Agricultural Education 40(1): 30-37.
Donnermeyer, J.F., and G.M. Kreps (1994). �Assessing College of Agriculture Freshman.� NACTA Journal 38(1): 45-48.
Jackman, W.J., and R.A. Smick-Attisano (1992). �Qualitative and Quantitative Methods Add Depth to Recruiting Study.� NACTA Journal. 36(1): 46-49.
Judge, G. et al. Introduction to the Theory and Practice of Economics. New York: Wiley, 1982.
Lindner, J.R., et al. (2004). �Students� Beliefs about Science and Sources of Influence Affecting Science Career Choice.� NACTA Journal 48(2):2-7.
Maddala, G.S. Introduction to Econometrics, Third Edition. England: John Wiley, 2001. Maddala, G.S. Limited-Dependent and Qualitative Variables in Econometrics.
Cambridge: Cambridge University Press, 1983. Mark, D.R., J.L. Lusk and M.S. Daniel (2004). �Recruiting Agricultural Economics
Graduate Students: Student Demand for Program Attributes.� American Journal of Agricultural Economics. 86(1): 175-184.
Parrish, Dena. (2004). �The Selection of a Major Field of Study in the College of Agriculture at Kansas State University. MS Thesis, Department of Agricultural Economics, Kansas State University, Manhattan, Kansas.
Pescatore, A.J. and J.M. Harter-Dennis (1987). �An Assessment of Student Recruiting Activities by Departments of Poultry and/or Animal Science.� NACTA Journal. 31(1): 22-25.
Rawls, W.J., et al. (1994). �Educational Plans of Minority Student Participants in a University Food and Agricultural Sciences Recruitment Program.� NACTA Journal 38(4): 54-57.
Schuester, C.P. and P. Costantino (1986). �Using Marketing Research to Develop Student Recruiting Strategies.� NACTA Journal. 30(2): 4-8.
Tarpley, R.S., and R.L. Miller (2004). �Factors Associated with the Choice of College Major in Utah.� NACTA Journal 48(2):13-16.
Wildman, M. and Torres, R.M (2001). �Factors Identified When Selecting a Major in Agriculture.� Journal of Agricultural Education 42(2): 46-55.

25
Table 1. Major Fields of Study Represented in the Study. Major Field of Study Observations Percent
Agribusiness 65 0.09
Agricultural Economics 71 0.09
Agricultural Education 26 0.03
Agricultural Communications and Journalism 27 0.04
Agricultural Technology Management 32 0.04
Agronomy 50 0.07
Animal Sciences and Industry 254 0.34
Bakery Science and Management 23 0.03
Feed Science and Management1 12 0.02
Food Science and Industry 27 0.04
General Agriculture1 8 0.01
Horticulture, Forestry, and Recreation Services 91 0.12
Horticultural Therapy1 7 0.01
Milling Science and Management 23 0.03
Park Management and Conservation 34 0.05
1Omitted from the study due to small number of observations.

26
Table 2. Survey Results for the Determinants of Selecting a Major Field of Study.
Agricultural Experiences Mean1 Prior experience in agriculture 3.79 Other agricultural experiences 3.60 Relatives in an agriculture 3.53 Journals/Magazines 2.45 Agricultural courses in H.S. 2.41 Newspapers about ag topics 2.33 Television programs 1.98 Family and Friends Mean1 Parents/Guardians 3.39 Personal role models/mentors 2.98 Other relatives 2.58 College friends 2.31 Brothers and/or sisters 2.14 Others 2.13 High school friends 2.05 High School Determinants Mean1 Ag Education teacher 2.31 High school science teacher 2.25 Extension professional 2.09 Other high school teacher 1.89 High school counselor 1.86 Other 1.67 High school principal 1.48
University Determinants Mean1 Major area seemed interesting 4.03 Friendly atmosphere in Col. 3.45 Faculty�s friendliness in Dept 3.21 Teaching reputation of Col. 3.19 Personal visit with Col. Rep. 2.88 Informational pamphlets 2.83 Scholarships 2.65 Agricultural clubs/activities 2.53 Difficulty of major curriculum 2.37 Other financial incentives 2.29 College of Agriculture alumni 2.02 Radio broadcasts about College 1.60 Job Considerations Mean1 Field (out-of-office) Work 3.68 Working Outdoors 3.65 Future Job Market 3.59 Location of Career Opportunites3.55 Working with People 3.53 Desire to Help Others 3.45 Preference for Rural Living 3.45 Potential Income Gained 3.38 Flexibility of Work Schedule 3.31 Working with Animals 3.24 Prestige of Career 3.19 Working with Plants 2.39
________________________________________________________________________________________________________
1Scale 1=not influential to 2=slightly influential 3=somewhat influential 4=moderately influential 5=very influential. 6=not applicable (see note 1).
2
Table 3. Description of Variables Used in Major Determinant Analysis. Variable Description Mean S.D. Min Max Sociodemographic variables: FEM 1=female; 0=male 0.51 0.50 0 1 AGE Age in years 20.59 1.92 17 25 High school experience: GPA High school GPA (4.0 scale) 3.60 0.39 2 4 HSACT No. High School Activities 4.02 1.96 0 10 HSCLS High School Class Size 99.68 68.75 9 20 Prior experience determinants of major field: HSAG Ag Courses in High School 2.41 1.67 1 5 PRAG Prior Experience in Ag 3.79 1.59 1 5 RELA Relatives in Ag Field 3.51 1.63 1 5 NOAG No Ag Work Experience 0.13 0.33 0 1 FAMY Family Farm/Ranch 0.61 0.49 0 1 Mentor determinants of major field: HSSCI High School Science Teacher 2.25 1.36 1 5 HSCO High School Counselor 1.86 1.18 1 5 HSAGT Agricultural Education Teacher 2.31 1.63 1 5 PRNT Parents/Guardians 3.39 1.42 1 5 ROLE Personal Role Models 2.96 1.56 1 5 Academic characteristics of major field: SCHL Scholarships 2.25 1.36 1 5 ALUM College of Agriculture Alumni 1.86 1.18 1 5 DTFR Faculty's Friendliness In Dept 2.31 1.63 1 5 CLFR Friendly Atmosphere in Col of Ag 3.39 1.42 1 5 TCHRP Teaching Rep in Col of Ag 2.96 1.56 1 5 CLUB Ag Related Clubs/Activities 2.25 1.36 1 5 RADIO Radio Broadcasts About Col of Ag 1.86 1.18 1 5 CURR Difficulty of Curriculum 2.31 1.63 1 5 Career characteristics of major field: OUT Working Outdoors 4.03 1.31 1 5 FIELD Field (out-of-office) Work 3.65 1.50 1 5 ANI Working With Animals 3.68 1.46 1 5 LOCA Location of Career Opportunities 3.24 1.70 1 5 JOBM Future Job Market of Career Area 3.55 1.38 1 5 PEOP Working With People 3.59 1.33 1 5 PLNT Working With Plants 3.53 1.30 1 5 INC Potential Income After College 2.39 1.48 1 5 PRES Prestige of Career 3.38 1.32 1 5 HELP Desire to Help Other 3.19 1.35 1 5 RUR Preference for Rural Living 3.55 1.37 1 5 FLEX Flexibility of Work Schedule 3.45 1.57 1 5
3
Table 4. Major Field of Study Logit Regression Results.1 Variable Agribusiness Ag Economics Ag Education Ag Communication INTER -2.32(2.82)[-0.117] -4.00 (2.81) [-0.168] -8.43 (5.55) [-0.018] -4.48(5.32)[-0.016] Sociodemographic variables: FEM -0.24 (0.34) [-0.012] -0.32 (0.34) [-0.013] -0.43 (0.61) [-0.001] 0.47(0.58) [0.002] AGE -0.12 (0.09) [-0.006] 0.12 (0.09) [0.005] 0.03 (0.18) [0.000] -0.16(0.16) [-0.001] High school experience: GPA 0.36 (0.46) [0.018] -0.25 (0.43) [-0.011] -0.39 (0.87) [-0.001] -1.31(0.83) [-0.005] HSACT 0.04 (0.09) [0.002] -0.07 (0.09) [-0.003] 0.08 (0.20) [0.000] 0.64***(0.16)[0.002] HSCLS -0.002(0.003)[0.000] -0.003(0.003)[0.000] 0.004(0.01)[0.000] 0.01**(0.00)[0.000] Prior experience determinants of major field: HSAGC -0.03 (0.14) [-0.002] -0.26* (0.14) [-0.011] 0.86**(0.38)[0.002] -0.17(0.23) [-0.001] PRAG 0.34**(0.15)[0.017] 0.06 (0.15) [0.003] -0.16 (0.29) [0.000] 0.71**(0.28)[0.002] RELA 0.12 (0.13) [0.006] 0.57***(0.15)[0.024] -0.38 (0.24) [-0.001] -0.41* (0.23) [-0.001] NOAG 1.42**(0.64)[0.117] -0.60 (0.77) [-0.021] 0.31 (1.52) [0.001] 0.86 (1.13) [0.004] FAMY 0.55 (0.45) [0.026] 0.46 (0.43) [0.018] 1.00 (0.87) [0.002] -0.29 (0.72) [-0.001] Mentor determinants of major field: HSSCI -0.29**(0.14)[-0.015] -0.02 (0.13) [-0.001] -0.13 (0.23) [0.000] -0.39* (0.22) [-0.001] HSCO 0.25* (0.13) [0.013] -0.02 (0.14) [-0.001] 0.08 (0.24) [0.000] -0.01 (0.21) [0.000] HSAGT 0.07 (0.14) [0.003] 0.18 (0.15) [0.008] 0.44 (0.34) [0.001] 0.17 (0.22) [0.001] PRNT -0.09 (0.12) [-0.005] -0.03 (0.11) [-0.001] 0.25 (0.25) [0.001] 0.44* (0.24) [0.002] ROLE 0.08 (0.11) [0.004] 0.14 (0.10) [0.006] 0.44* (0.23) [0.001] -0.21 (0.17) [-0.001] Academic characteristics of major field: SCHL -0.13 (0.12) [-0.006] 0.07 (0.12) [0.003] -0.15 (0.24) [0.000] 0.46**(0.21)[0.002] ALUM 0.12 (0.13) [0.006] 0.17 (0.13) [0.007] 0.37 (0.25) [0.001] 0.24 (0.19) [0.001] DTFR -0.13 (0.16) [-0.006] -0.29* (0.16) [-0.012] -0.49 (0.32) [-0.001] -0.25 (0.25) [-0.001] CLFR 0.18 (0.18) [0.009] 0.35* (0.18) [0.015] 0.61* (0.36) [0.001] 0.52 (0.32) [0.002] TCHRP -0.20 (0.14) [-0.010] 0.31**(0.14)[0.013] -0.35 (0.29) [-0.001] 0.29 (0.27) [0.001] CLUB -0.06 (0.14) [-0.003] -0.22 (0.14) [-0.009] -0.30 (0.25) [-0.001] -0.43* (0.23) [-0.001] RADIO 0.38**(0.18)[0.019] -0.19 (0.21) [-0.008] -0.10 (0.32) [0.000] 0.32 (0.26) [0.001] CURR -0.25**(0.12)[-0.012] -0.02 (0.13) [-0.001] 0.13 (0.26) [0.000] -0.62***(0.22)[-0.002] Career characteristics of major field: OUT 0.11 (0.18) [0.005] -0.04 (0.17) [-0.002] -0.73**(0.36)[-0.002] -0.14 (0.29) [0.000] FIELD -0.19 (0.16) [-0.010] -0.22 (0.16) [-0.009] 0.15 (0.34) [0.000] -0.09 (0.27) [0.000] ANI -0.16 (0.10) [-0.008] -0.08 (0.10) [-0.003] -0.01 (0.22) [0.000] -0.06 (0.18) [0.000] LOCA -0.08 (0.13) [-0.004] 0.03 (0.13) [0.001] -0.09 (0.27) [0.000] -0.43* (0.24) [-0.002] JOBM -0.13 (0.15) [-0.006] -0.32**(0.15)[-0.013] 0.02 (0.31) [0.000] 0.88***(0.31)[0.003] PEOP 0.50* (0.17) [0.025] 0.01 (0.15) [0.000] -0.05 (0.31) [0.000] 0.49* (0.27) [0.002] PLNT -0.16 (0.12) [-0.008] -0.18 (0.12) [-0.007] 0.55**(0.24)[0.001] -0.24 (0.22) [-0.001] INC 0.22 (0.15) [0.011] -0.04 (0.15) [-0.002] -0.50* (0.27) [-0.001] -0.68**(0.29)[-0.002] PRES -0.04 (0.15) [-0.002] 0.18 (0.14) [0.008] 0.03 (0.27) [0.000] -0.24 (0.27) [-0.001] HELP -0.08 (0.16) [-0.004] -0.36**(0.15)[-0.015] 0.26 (0.35) [0.001] -0.29 (0.28) [-0.001] RUR 0.07 (0.14) [0.004] -0.13 (0.14) [-0.005] 0.35 (0.31) [0.001] 0.36 (0.25) [0.001] FLEX -0.19 (0.13) [-0.009] 0.22* (0.13) [0.009] 0.01 (0.29) [0.000] 0.77***(0.27)[0.003] Pseudo R2 0.14 0.21 0.46 0.36 Log-likelihood -189.91 -185.69 -61.20 -74.74 No. Observations 750 750 750 750 1Standard errors appear in parentheses, with * = significant at the 10 percent level, ** = significant at the 5 percent level, and *** = significant at the 1 percent level. Probability changes appear in brackets, with the probability changes for the Likert scale variables in table 3 calculated assuming that these discrete variables are continuous.

4
Table 4. Major Field of Study Logit Regression Results (continued).1 Variable Ag Tech Mgt Agronomy Animal Sci. & Ind. Bakery Sci. & Mgt. INTER -3.38(3.97)[-0.017] -6.01 (3.78) [-0.078] -3.42 (2.16) [-0.550] 4.82 (6.74) [0.002] Sociodemographic variables: FEM -2.68***(0.83)[-0.002] -1.13**(0.45)[-0.016] 1.08***(0.26)[0.172] 1.45* (0.87) [0.001] AGE -0.14(0.13)[-0.001] -0.03 (0.11) [0.000] 0.03 (0.07) [0.005] -0.31 (0.20) [0.000] High school experience: GPA 0.76(0.64)[0.004] 0.04 (0.55) [0.001] 0.05 (0.35) [0.008] -0.53 (1.16) [0.000] HSACT -0.26*(0.16)[-0.001] 0.12 (0.12) [0.002] -0.07 (0.07) [-0.011] -0.11 (0.21) [0.000] HSCLS -0.002(0.004)[0.000] -0.00 (0.003)[0.000] 0.00 (0.00) [0.000] -0.01 (0.01) [0.000] Prior experience determinants of major field: HSAGC -0.11(0.22)[-0.001] -0.07 (0.18) [-0.001] 0.16 (0.11) [0.026] 0.36 (0.36) [0.000] PRAG 0.40(0.27)[0.002] 0.13 (0.20) [0.002] -0.05 (0.11) [-0.007] -0.49 (0.30) [0.000] RELA 0.28(0.21)[0.001] -0.19 (0.17) [-0.002] -0.25**(0.10)[-0.040] 0.14 (0.28) [0.000] NOAG 0.38(1.32)[0.002] 1.78* (0.95) [0.049] -0.69 (0.47) [-0.095] 1.09 (0.96) [0.001] FAMY 0.40(0.63)[0.002] 2.23***(0.75)[0.027] 0.05 (0.32) [0.008] 2.04* (1.14) [0.001] Mentor determinants of major field: HSSCI 0.40*(0.21)[0.002] -0.08 (0.16) [-0.001] 0.13 (0.10) [0.020] -0.01 (0.28) [0.000] HSCO -0.19(0.23)[-0.001] -0.44**(0.20)[-0.006] 0.19* (0.11) [0.030] -0.57 (0.45) [0.000] HSAGT 0.11(0.23)[0.001] 0.00 (0.19) [0.000] -0.24**(0.12)[-0.039] -0.63 (0.48) [0.000] PRNT -0.31*(0.19)[-0.002] 0.21 (0.16) [0.003] 0.02 (0.09) [0.004] 0.32 (0.29) [0.000] ROLE -0.41**(0.18)[-0.002] 0.06 (0.13) [0.001] -0.03 (0.09) [-0.004] -0.14 (0.27) [0.000] Academic characteristics of major field: SCHL -0.07(0.20)[0.000] 0.38**(0.16)[0.005] 0.01 (0.09) [0.002] 0.82***(0.29)[0.000] ALUM 0.20(0.22)[0.001] -0.01 (0.18) [0.000] -0.16 (0.10) [-0.026] -0.30 (0.28) [0.000] DTFR -0.78***(0.26)[-0.004] 0.32 (0.23) [0.004] 0.34**(0.14)[0.055] 0.52 (0.35) [0.000] CLFR 0.64**(0.30)[0.003] -0.25 (0.23) [-0.003] -0.40***(0.15)[-0.064] -1.19***(0.45)[0.00] TCHRP 0.11(0.23)[0.001] 0.06 (0.17) [0.001] -0.11 (0.11) [-0.018] 0.57* (0.34) [0.000] CLUB 0.78***(0.23)[0.004] -0.34* (0.19) [-0.004] 0.22**(0.10)[0.035] 0.20 (0.30) [0.000] RADIO -0.11(0.30)[-0.001] 0.37 (0.26) [0.005] 0.08 (0.14) [0.013] 0.72 (0.52) [0.000] CURR 0.04(0.20)[0.000] 0.04 (0.17) [0.000] 0.09 (0.11) [0.015] 0.183 (0.31) [0.000] Career characteristics of major field: OUT 0.05(0.26)[0.000]] 0.03 (0.24) [0.000] -0.09 (0.14) [-0.015] -0.36 (0.36) [0.000] FIELD 0.21(0.26)[0.001] -0.06 (0.22) [-0.001] 0.01 (0.13) [0.001] 0.13 (0.30) [0.000] ANI -0.44***(0.17)[-0.002] -0.53***(0.14)[-0.007] 1.10***(0.11)[0.177] -0.98***(0.34)[0.00] LOCA -0.19(0.21)[-0.001] -0.06 (0.19) [-0.001] 0.03 (0.11) [0.005] -0.11 (0.33) [0.000] JOBM -0.12(0.23)[-0.001] -0.31 (0.21) [-0.004] -0.10 (0.12) [-0.016] -0.10 (0.34) [0.000] PEOP 0.10(0.26)[0.001] 0.04 (0.20) [0.000] -0.19 (0.12) [-0.030] -0.08 (0.33) [0.000] PLNT 0.16(0.18)[0.001] 0.87***(0.16)[0.011] -0.67***(0.11)[-0.108] -0.88**(0.41)[0.000] INC -0.25(0.24)[-0.001] -0.08 (0.20) [-0.001] -0.18 (0.12) [-0.029] 0.75* (0.40) [0.000] PRES -0.05(0.23)[0.000] -0.05 (0.20) [-0.001] 0.33***(0.12)[0.052] -0.58* (0.35) [0.000] HELP -0.38(0.25)[-0.002] 0.22 (0.20) [0.003] 0.05 (0.12) [0.008] 0.59* (0.35) [0.000] RUR 0.32(0.25)[0.002] 0.21 (0.19) [0.003] 0.16 (0.12) [0.025] -1.01***(0.35)[0.00] FLEX -0.13(0.21)[-0.001] -0.04 (0.17) [0.000] -0.11 (0.11) [-0.018] 0.38 (0.29) [0.000] Pseudo R2 0.34 0.34 0.46 0.57 Log-likelihood -87.02 -121.84 -259.14 -44.64 No. Observations 750 750 750 750 1Standard errors appear in parentheses, with * = significant at the 10 percent level, ** = significant at the 5 percent level, and *** = significant at the 1 percent level. Probability changes appear in brackets, with the probability changes for the Likert scale variables in table 3 calculated assuming that these discrete variables are continuous.

5
Table 4. Major Field of Study Logit Regression Results (continued).1 Variable Food Sci. & Ind. Hort., For, Rec. Res. Mill. Sci. & Mgt. Park Mgt. & Cons. INTER -3.47 (5.048)[-0.015] -3.92 (3.18) [-0.072] -10.92*(6.08)[-0.009] 0.12 (3.84) [0.001] Sociodemographic variables: FEM 0.23 (0.62) [0.001] -0.42 (0.39) [-0.008] -2.43***(0.90)[-0.003] -1.22**(0.54)[-0.01] AGE -0.10 (0.15) [0.000] 0.10 (0.10) [0.002] -0.16 (0.19) [0.000] 0.09 (0.12) [0.001] High school experience: GPA 0.68 (0.84) [0.003] 0.56 (0.49) [0.010] 1.45 (1.07) [0.001] -1.54***(0.59)[-0.01] HSACT -0.46***(0.18)[-0.002] -0.13 (0.12) [-0.002] 0.30 (0.21) [0.000] 0.23 (0.15) [0.001] HSCLS -0.00 (0.004)[0.000] -0.004(0.003)[0.000] 0.01* (0.01) [0.000] 0.01 (0.004)[0.000] Prior experience determinants of major field: HSAGC -0.44* (0.27) [-0.002] -0.34* (0.19) [-0.006] 0.60**(0.27)[0.000] 0.48**(0.22)[0.003] PRAG 0.09 (0.22) [0.000] -0.13 (0.15) [-0.002] -0.05 (0.29) [0.000] 0.05 (0.18) [0.000] RELA 0.06 (0.20) [0.000] -0.12 (0.14) [-0.002] 0.27 (0.27) [0.000] -0.20 (0.18) [-0.001] NOAG 0.14 (0.79) [0.001] -0.53 (0.54) [-0.008] -1.48 (1.53) [-0.001 -0.003(0.70)[0.000] FAMY 0.44 (0.75) [0.002] -1.74***(0.43)[-0.043] 0.74 (0.87) [0.001] -0.66 (0.64) [-0.004] Mentor determinants of major field: HSSCI 0.51**(0.21)[0.002] 0.13 (0.15) [0.002] 0.15 (0.25) [0.000] 0.15 (0.19) [0.001] HSCO -0.39 (0.28) [-0.002] -0.18 (0.21) [-0.003] 0.13 (0.29) [0.000] 0.09 (0.23) [0.001] HSAGT 0.42* (0.26) [0.002] 0.41**(0.19)[0.007] -0.51* (0.30) [0.000] -0.62**(0.25)[-0.00] PRNT -0.46**(0.22)[-0.002] -0.03 (0.14) [-0.001] -0.11 (0.25) [0.000] -0.15 (0.17) [-0.001] ROLE -0.04 (0.19) [0.000] -0.09 (0.13) [-0.002] -0.14 (0.23) [0.000] -0.10 (0.16) [-0.001] Academic characteristics of major field: SCHL 0.04 (0.21) [0.000] -0.09 (0.15) [-0.002] 0.19 (0.25) [0.000] -0.63***(0.24)[-0.00] ALUM 0.31 (0.21) [0.001] -0.34 (0.23) [-0.006] -0.17 (0.28) [0.000] -0.19 (0.30) [-0.001] DTFR 0.19 (0.30) [0.001] -0.16 (0.20) [-0.003] 0.57* (0.32) [0.000] 0.63**(0.29)[0.004] CLFR 0.11 (0.33) [0.000] -0.35 (0.22) [-0.006] -0.58 (0.37) [0.000] -0.22 (0.30) [-0.001] TCHRP -0.05 (0.23) [0.000] 0.21 (0.15) [0.004] -0.01 (0.29) [0.000] -0.42**(0.18)[-0.00] CLUB 0.14 (0.23) [0.001] 0.38**(0.16)[0.007] -0.27 (0.31) [0.000] -0.39* (0.24) [-0.002] RADIO 0.35 (0.36) [0.002] -0.28 (0.31) [-0.005] 1.32***(0.44)[0.001] 0.09 (0.40) [0.001] CURR 0.18 (0.23) [0.001] -0.19 (0.13) [-0.003] -0.36 (0.30) [0.000] 0.17 (0.17) [0.001] Career characteristics of major field: OUT -0.48* (0.26) [-0.002] 0.98***(0.24)[0.018] -0.12 (0.33) [0.000] -0.10 (0.25) [-0.001] FIELD -0.19 (0.23) [-0.001] -0.37* (0.22) [-0.007] 0.27 (0.33) [0.000] -0.06 (0.25) [0.000] ANI -0.43**(0.20)[-0.002] -0.58***(0.13)[-0.011] -0.56**(0.27)[0.000] 0.22 (0.16) [0.001] LOCA -0.37* (0.22) [-0.002] 0.19 (0.16) [0.003] 0.24 (0.28) [0.000] 0.39**(0.19)[0.002] JOBM 0.29 (0.26) [0.001] 0.03 (0.17) [0.001] 0.62* (0.36) [0.001] -0.37* (0.22) [-0.002] PEOP 0.03 (0.24) [0.000] -0.27 (0.17) [-0.005] 0.20 (0.30) [0.000] -0.32 (0.21) [-0.002] PLNT -0.45 (0.29) [-0.002] 0.86***(0.14)[0.016] -0.48 (0.29) [0.000] 0.42***(0.16)[0.00] INC 0.85***(0.31)[0.004] 0.30* (0.18) [0.006] 0.57 (0.41) [0.000] -0.43**(0.21)[-0.00] PRES -0.24 (0.25) [-0.001] -0.10 (0.17) [-0.002] 0.41 (0.36) [0.000] 0.11 (0.20) [0.001] HELP -0.08 (0.27) [0.000] -0.13 (0.17) [-0.002] -1.05***(0.38)[-0.001] 0.36* (0.22) [0.002] RUR 0.33 (0.25) [0.001] -0.40**(0.16)[-0.007] -0.34 (0.31) [0.000] 0.004(0.19)[0.000] FLEX -0.28 (0.25) [-0.001] 0.16 (0.16) [0.003] 0.02 (0.31) [0.000] 0.36* (0.19) [0.002] Pseudo R2 0.40 0.53 0.51 0.37 Log-like lihood -70.14 -129.94 -50.57 -87.61 No. Observations 750 750 750 750 1Standard errors appear in parentheses, with * = significant at the 10 percent level, ** = significant at the 5 percent level, and *** = significant at the 1 percent level. Probability changes appear in brackets, with the probability changes for the Likert scale variables in table 3 calculated assuming that these discrete variables are continuous.