the secret to job satisfaction is low expectations: how
TRANSCRIPT

ISSN 2282-6483
The secret to job satisfaction is low
expectations: How perceived working
conditions differ from actual ones
Simona Cicognani
Martina Cioni
Marco Savioli
Quaderni - Working Paper DSE N°1083
The secret to job satisfaction is low expectations:
How perceived working conditions differ from actual ones
Cicognani, Simona Cioni, Martina Savioli, Marco
Working conditions exert a major influence on accidents and illnesses
at work as well as on job satisfaction and health, yet very little
research has examined the determinants of working conditions. By
exploiting the Italian Labour Force Survey, this paper provides
evidence on the underlying factors affecting working conditions. It
provides a behavioural interpretation of the results, which stems from
the discrepancy between actual and expected working conditions. In
light of this interpretation, workers would declare their perceived
working conditions influenced by the difference between the actual
and the expected working conditions. Variables concerning personal
characteristics, such as gender, education and being employed in the
first job, shift expectations about working conditions and accordingly
perceived working conditions. On the contrary, variables related to
work characteristics, such as working full time, with shifts and in a
large place, affect actual and thus perceived working conditions
(negatively).
Keywords: working conditions, expectations, perceptions, actual conditions, job satisfaction
JEL classification: D84, J24, J28
PsycINFO classification: 3670, 3650, 3040
Acknowledgements: We thank Tiziano Arduini, Alessandro Bucciol, Tiziano Razzolini and seminar
participants at the Department of Economics, University of Bologna. The usual disclaimers apply.
Department of Economics, University of Verona, Italy and RCEA, Rimini, Italy, [email protected] Department of Economics and Statistics, University of Siena, Italy, [email protected] Department of Economics, University of Bologna, Italy and RCEA, Rimini, Italy, [email protected]
2
1. Introduction
In the past decades, labour economics research has demonstrated the influence of working
conditions on a number of issues, such as the probability of experiencing job accidents and illnesses
in the workplace as well as workers’ job satisfaction, health and quality of life more generally. For
instance, a recent article on work safety by Cioni and Savioli (2016) highlights that poor working
conditions are among the major determinants of accidents and illnesses at work.
Despite the sizeable empirical literature that provides insights into and evidence on working
conditions as factors influencing the aforementioned issues, no work so far investigates the
determinants of working conditions, hence treating working conditions as a dependent variable. The
only exception is the research by Askenazy and Caroli (2010), who study the impact of new work
practices and ICT on a number of indicators of working conditions, which are considered as
separate dependent variables. Their results show that new practices are related to higher mental
strain and that ICT tends to reduce injuries in the workplace. Working conditions are usually treated
as independent variables that affect different dependent variables, ranging from self-assessed health
or psychological well-being (Loscocco and Spitze, 1990; Robone et al., 2011) to work safety (Cioni
and Savioli, 2016) or wages (Hersch, 1991; Poggi, 2007; Fernandez and Nordman, 2009).
Understanding the factors that determine working conditions may lead to better-targeted public
policies, which also affect important issues such as work accidents/illnesses, health and quality of
life, all of which are strictly connected to the productivity of work (Alavinia et al., 2009; Fink and
Masiye, 2015).
This paper seeks to fill this gap in the literature by investigating the determinants of working
conditions and providing the first theoretical modelization and empirical validation of workers’

3
perceptions of working conditions. To do so, we focus on Italy, a considerable country of the
European Union in terms of both GDP and population, using data from the 2007 Italian Labour
Force Survey. In this specific year, the survey contained a special ad hoc section on working
conditions, in which workers were asked to state whether they faced risk factors. Accordingly, our
argumentations will be presented in terms of poor working conditions and the results will simply be
read in the opposite direction to reflect the literature about working conditions. Having data from
2007 allows us to investigate the pre-crisis labour dynamics, which were not affected by workers’
worsened perceptions of working conditions due to the Italian recession that started in 2008. The
contribution of the paper is twofold: we explain the role of working conditions by analysing their
determinants and we provide a behavioural explanation of how working conditions can be
perceived by workers.
A clear definition of working conditions is still lacking in the literature, since very different
concepts are used interchangeably across the various contributions. Robone et al. (2011) consider as
working conditions promotion and annual wage increment opportunities as well as having a
managerial/supervision role, working outside regular office hours and being subject to unpaid
overtime. Other studies, such as those by Hersch (1991) and Askenazy and Caroli (2010), also take
into account mental strain factors, occupational risks (e.g. risk of a serious fall, electricity risk, etc.)
and occupational injuries. More in line with the latter contributions, we use a broad concept of
working conditions, encompassing both physical and psychological risk factors, which are self-
assessed by workers.
In several studies working conditions are measured using self-reported answers. This is not
necessarily a negative trait, considering that, according to many ergonomics experts, working
4
conditions cannot be defined independently of workers’ characteristics (Burchell et al., 2009).
Indeed, working conditions are affected by personal and cultural features as well as by objective
working conditions (Eurofound, 2012). Based on this reasoning, the actual (objective) working
conditions and the expectations regarding them may present a discrepancy (Poggi, 2010). This
discrepancy originates the perceived working conditions, which are those declared by individuals
and captured in the survey. Following this argument, the main hypothesis of this paper is that the
same actual working conditions can be perceived differently by workers according to their personal
characteristics. We envisage the personal characteristics of the worker, such as gender, education
and being employed in the first job, as affecting mainly her expectations of working conditions. On
the contrary, work characteristics, such as working full time, with shifts or in a large place, are
deemed to exert an impact mainly on the actual working conditions of the worker.
A somewhat related concept to working conditions is job satisfaction, which is usually self-
measured by workers on a Likert scale. A recent report on working conditions highlights that job
satisfaction varies across employment status, educational attainment, occupation and sector, with
skilled agricultural workers, plant and machine operators and workers in elementary occupations
being the least satisfied with their jobs (Eurofound, 2012). The existing contributions in the
literature on job satisfaction show that age and job satisfaction are characterized by a U-shaped
relationship, with very young and very old workers being the most satisfied with work (Clark et al.,
1996; Clark, 1997). Working conditions refer to specific sub-categories of the working environment
and can therefore be conceived as the determinants of job satisfaction. Indeed, several contributions
in the medical and psychological literature reveal that job stress, arising from working conditions, is
associated with job dissatisfaction and negative mental well-being (Cooper et al., 1989; Travers and
Cooper, 1993). Job satisfaction is the part of overall life satisfaction that can be ascribed to work

5
and represents an important factor for understanding individuals’ well-being (Dolan et al., 2008).
Consequently, we consider job satisfaction as the separable part of an individual’s utility stemming
from work, as is common practice in the literature on life satisfaction (Clark and Etilé, 2011).
Our findings indicate that variables concerning the work characteristics working full time, overtime,
with shifts and in a large place negatively affect the actual working conditions. The remaining
variables, concerning personal characteristics, determine the expected working conditions
influencing the perception of the actual working conditions.
The paper is organized as follows. Section 2 presents the theoretical specification. Section 3
describes the data set used and provides some descriptive statistics. Section 4 reports the
methodology adopted in the empirical analysis and the results. Finally, Section 5 concludes with a
discussion of the results.
2. Theoretical background
Variables that are unambiguously related to actual work characteristics, such as the sector of
activity, the level of occupation, the size of the establishment and working full time, with shifts or
with overtime hours are considered to affect working conditions through the actual channel (Muñoz
de Bustillo and Fernández-Macías, 2005). Once the actual characteristics of the work environment
are controlled for, we assume that the personal characteristics of the individual exert their effect
through the expected working conditions. For instance, once we have controlled for the specific
work to be undertaken, we deem having a fixed-term contract to be a variable that acts on
expectations: working with a contract characterized by a specific expiration date is likely to
influence the personal psychological sphere of the worker and therefore his or her expectations.
This is a crucial point, considering that, given the changes in the labour market that have occurred,

6
especially in the last two decades, a significant portion of contracts have switched from standard,
open-ended, full-employment contracts to fixed-term contracts, part-time contracts and unregulated
work (Barbieri and Scherer, 2009).
The underlying assumption of this paper is that declared (perceived) working conditions are not a
direct translation of actual working conditions but are strongly influenced by workers’ expectations.
For some of the regressors, in addition to actual working conditions, we can envisage an
expectation dimension that should be accounted for and stems from the reference point theory of
Kahneman and Tversky (1979) and the disappointment theory of Bell (1985), that was tested by
Van Dijk et al. (2003).
As postulated by Bell (1985), two consequences with the same outcome can accrue different utility
levels if we consider the actual outcome compared with the prior expectations. This is the case for
instance of winning a certain monetary prize in a lottery and knowing that it is the top prize as
opposed to knowing that it is the lowest prize available. In the two cases, the utility perceived will
be different, since in the former case we would be delighted whereas in the latter we would be
disappointed.
The reference point is explicitly considered as the agent’s recent expectations about the relevant
outcomes by Kőszegi and Rabin (2006), who model expectations as rational expectations. In this
case the agent’s utility function is composed of two terms: a consumption utility term, which
reflects the classical outcome-based utility, and a gain–loss utility term, which is the difference
between the consumption utility and the reference point. Since the reference point is determined by
rational expectations, it follows that it is determined endogenously by the economic environment
characterizing the agent’s recent past.

7
The same line of reasoning can be applied in the context of working conditions, in which
expectations about working conditions interplay with actual working conditions. In this respect the
seminal work of Clark (1997) is the first to propose a central role played by expectations in shaping
workers’ job satisfaction, focusing on the so-called “gender–job satisfaction paradox”: women face
on average worse working conditions than men but report higher job satisfaction levels than their
male counterparts.1 The explanation provided by Clark is based on the well-being of workers
related to their job expectations. From this perspective, since women are often secondary earners
and highly involved in home production and since their working conditions are generally worse
than men’s, they hold lower expectations towards their job than men. This explanation is supported
by the fact that women who are supposedly characterized by higher expectations (such as those in
managerial positions or with mothers in a professional job) do not report a higher level of job
satisfaction with respect to their male colleagues. According to Clark’s hypothesis, as soon as
women are emancipated, the gender–job satisfaction gap will decrease. This hypothesis is
empirically tested by Sousa-Poza and Sousa-Poza (2010) on 10 waves of the British Household
Panel Survey (1991–2000). The gender–job satisfaction paradox appears to be transitory, as the data
suggest that it has halved over the decade, driven primarily by a decline in women’s job
satisfaction. Furthermore, Helliwell and Huang (2011) highlight some gender differences in the
ways in which male and female workers evaluate their workplaces, for instance in terms of trust in
the management (higher for women). Similarly, a strand of literature explains that some less
advantaged workers have higher satisfaction levels than workers with demonstrably better actual
working conditions if the latter workers have higher expectations about their job (Muñoz de Bustillo
et al., 2011; Burchell et al., 2014).
1 See also Zaleznik et al. (1958).

8
Following Muñoz de Bustillo and Fernández-Macías (2005),2 we assume that all the variables
relating to workers’ personal characteristics exert an influence on their expectations of working
conditions. Education is certainly among these: we believe that a higher education level allows the
worker to approach her job with higher expectations regarding working conditions or makes the
worker aware of the long-term consequences of bad working conditions. This thesis is supported by
Clark (1997), who finds gender differences in job satisfaction for middle and low-educated
individuals in favour of women, whereas highly educated women do not report different job
satisfaction from men: hence, it seems that more educated women have higher expectations, more
similar to those of men, than less educated women. Therefore, job satisfaction declines with the
level of education (see also Clark and Oswald, 1996 and Sloane and Williams, 2000). In addition,
being in the first job can affect expectations about working conditions, lowering them and hence
improving the perceived working conditions. Indeed, the agent’s recent expectations about the
relevant outcomes determine a different reference point for workers in their first job (Kőszegi and
Rabin, 2006). Long job tenure, on the other hand, provides workers with capital of experience that
allows them to have a more robust perception of the working conditions. Regarding age, Schwandt
(2016) shows that well-being (life satisfaction) follows a U-shape over age by means of
expectations. In our case, even though a higher age may make working loads seem heavier and
hence worsen perceived working conditions, it may also engender experience, which helps to
provide a more precise perception of working conditions (Burchell et al., 2009).
We envisage two context variables that can be ascribed to the personal sphere of the worker as
important drivers of expectations of working conditions: the unemployment rate and the
unionization index at the regional level. The expectations in this case originate in relation to a local
2 According to Muñoz de Bustillo and Fernández-Macías (2005, p. 664), indicators of job expectations encompass age,
sex, education and experience of unemployment.
9
context, characterized by reference groups. For instance, the higher the unionization index, the
greater the awareness of workers’ rights and consequently the higher the expectations of working
conditions. In this case the expectations would spread through the social context. According to
Cahill et al. (2015, p. 40):
… the information individuals glean about the economic context may shape attitudes and
intentions, such as job and career satisfaction, career plans, turnover intentions, retirement
intentions, psychological well-being and assessments of work–life balance.
They highlight the role of macroeconomic conditions, such as the unemployment rate, in
influencing workers’ job satisfaction and expectations. To sum up, a clear distinction of the
variables involved in the empirical analysis between the variables driving the actual working
conditions (work characteristics) and the variables acting on expectations (personal characteristics)
is depicted in Table A1 of the Appendix.
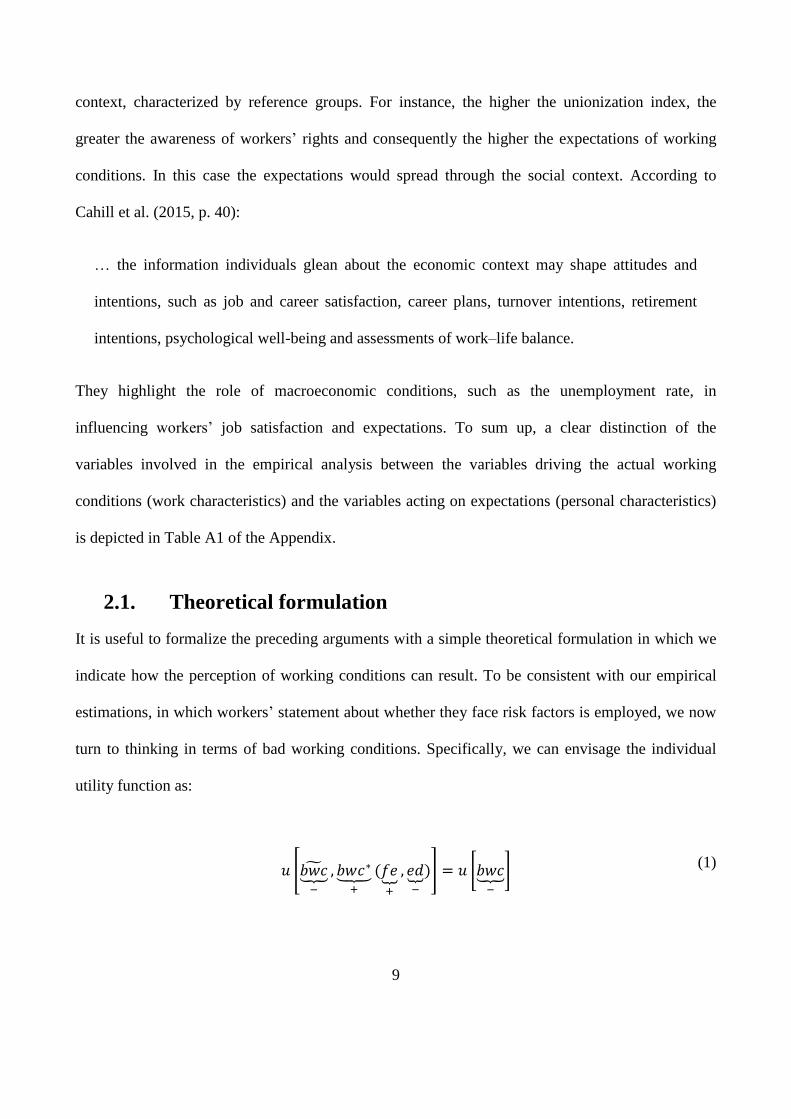
2.1. Theoretical formulation
It is useful to formalize the preceding arguments with a simple theoretical formulation in which we
indicate how the perception of working conditions can result. To be consistent with our empirical
estimations, in which workers’ statement about whether they face risk factors is employed, we now
turn to thinking in terms of bad working conditions. Specifically, we can envisage the individual
utility function as:
𝑢 [𝑏𝑤𝑐⏟̃
−
, 𝑏𝑤𝑐∗⏟ +
(𝑓𝑒⏟+
, 𝑒𝑑⏟−
)] = 𝑢 [𝑏𝑤𝑐⏟−
] (1)
10
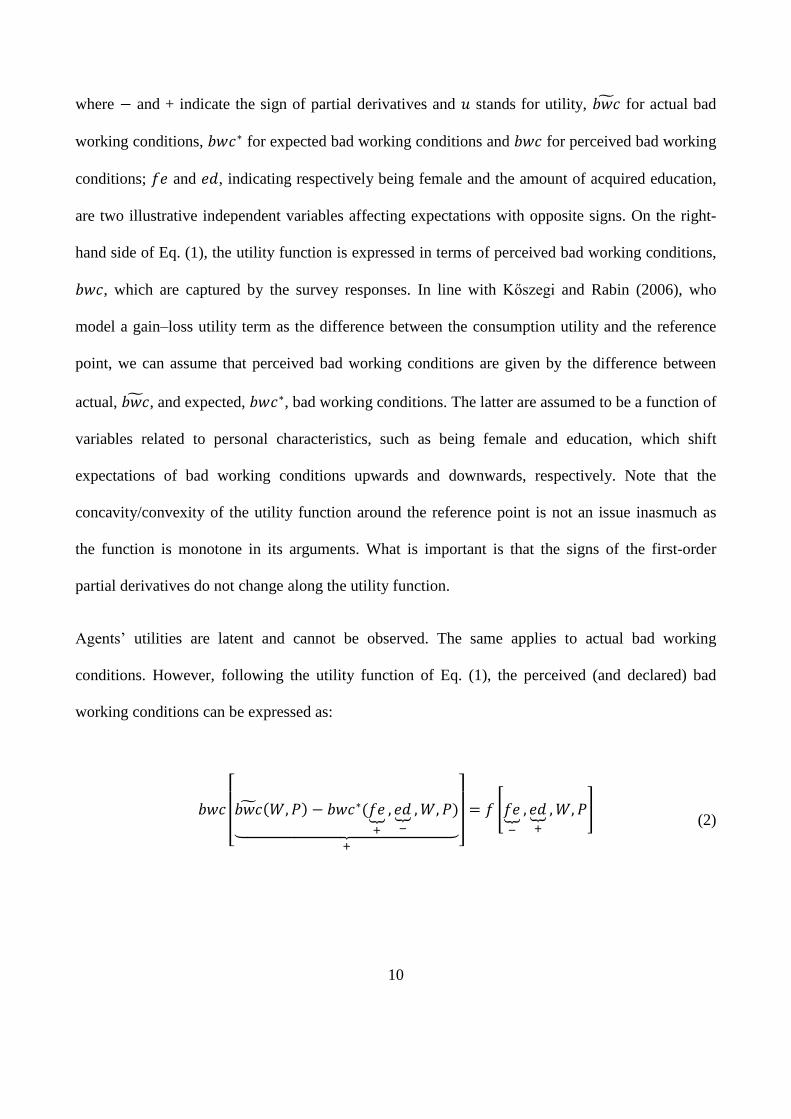
where − and + indicate the sign of partial derivatives and 𝑢 stands for utility, 𝑏𝑤𝑐̃ for actual bad
working conditions, 𝑏𝑤𝑐∗ for expected bad working conditions and 𝑏𝑤𝑐 for perceived bad working
conditions; 𝑓𝑒 and 𝑒𝑑, indicating respectively being female and the amount of acquired education,
are two illustrative independent variables affecting expectations with opposite signs. On the right-
hand side of Eq. (1), the utility function is expressed in terms of perceived bad working conditions,
𝑏𝑤𝑐, which are captured by the survey responses. In line with Kőszegi and Rabin (2006), who
model a gain–loss utility term as the difference between the consumption utility and the reference
point, we can assume that perceived bad working conditions are given by the difference between
actual, 𝑏𝑤𝑐̃ , and expected, 𝑏𝑤𝑐∗, bad working conditions. The latter are assumed to be a function of
variables related to personal characteristics, such as being female and education, which shift
expectations of bad working conditions upwards and downwards, respectively. Note that the
concavity/convexity of the utility function around the reference point is not an issue inasmuch as
the function is monotone in its arguments. What is important is that the signs of the first-order
partial derivatives do not change along the utility function.
Agents’ utilities are latent and cannot be observed. The same applies to actual bad working
conditions. However, following the utility function of Eq. (1), the perceived (and declared) bad
working conditions can be expressed as:
𝑏𝑤𝑐
[
𝑏𝑤𝑐̃ (𝑊,𝑃) − 𝑏𝑤𝑐∗(𝑓𝑒⏟+
, 𝑒𝑑⏟−
, 𝑊, 𝑃)⏟
+ ]
= 𝑓 [𝑓𝑒⏟−
, 𝑒𝑑⏟+
, 𝑊, 𝑃] (2)

11
where 𝑊,𝑃 are work and personal characteristics; 𝑓[. ] is a function (which is estimated in Section
4); and − and + indicate the sign of the partial derivatives, which are solved on the right-hand side
of Eq. (2) and are tested in the estimations.
It is important to recall that in our case utility refers only to job satisfaction and not to other life
occurrences. The difference in survey responses represents a real difference in utility from
perceived bad working conditions, 𝑏𝑤𝑐. Nevertheless, the paradox of counterintuitive signs of
derivatives is solved by considering the importance of expectations in bad working conditions,
𝑏𝑤𝑐∗. Those who expect higher levels of bad working conditions, like women, will be more
satisfied with any given level of actual bad working conditions, 𝑏𝑤𝑐̃ (see Eq. (1)), and will declare
lower perceived bad working conditions (see Eq. (2)). The opposite applies to more educated
workers.
Expectations may form an important part of the reference level by which utility gains/losses are
evaluated, since relative rather than absolute arguments determine utility (job satisfaction).
According to Kahneman and Tversky (1979, p. 277):
When we respond to attributes such as brightness, loudness, or temperature, the past and
present context of experience defines an adaptation level, or reference point, and stimuli are
perceived in relation to this reference point.
Since higher levels of education are associated with less satisfied workers, workers with high 𝑒𝑑
deem a lower level of bad working conditions, 𝑏𝑤𝑐∗, to be fair. 𝑓𝑒 workers, on the contrary, have a
worse past and present context of work to which they would have adapted and to which they refer
(higher 𝑏𝑤𝑐∗).
12
Again, since Eq. (1) is not observable, we can only test its validity by measuring and empirically
estimating Eq. (2). More specifically, by using data on 𝑏𝑤𝑐, 𝑓𝑒, 𝑒𝑑, 𝑊 and 𝑃, we will validate our
theoretical predictions with empirical estimations.
3. Data
Our analysis is based on data from the Labour Force Survey carried out by Istat, the National
Institute of Statistics of Italy. The data set is entirely comparable with those collected in other EU
countries.3 It refers to the second quarter of 2007, when an “ad hoc” module devoted to safety and
health at work was added to the standard information contained in the Istat Labour Force Survey.
The 2007 survey collected various kinds of information on workers’ personal and work
characteristics and especially on bad working conditions. In particular, the “ad hoc” module
devoted to safety and health at work includes information on workers’ exposure to health risk
factors. By considering all these factors as proxies for different aspects of bad working conditions,
we define the variable bad working conditions simply as the sum of the dichotomous indicators of
exposure to health risk factors. In particular, the seven risk factors considered encompass both
physical and psychological factors. The physical risk factors refer to: exposure to dust, fumes or
chemicals; exposure to excessive noise or vibration; bad posture induced by work requirements and
movement of heavy loads; and exposure to a general risk of injury. The risk factors that refer
mainly to the psychological balance of workers include: excessive workload; phenomena of
bullying or discrimination; and exposure to threats or physical violence. The data set includes only
micro-data of employees with open-ended and fixed-term contracts, excluding individuals with
other kinds of labour relations and unemployed individuals. Thereby, the observations have a high
3 Istat collects the information each quarter by interviewing a sample of nearly 77,000 households (approximately
300,000 in one year), representing 175,000 individuals who are Italian residents.
13
degree of homogeneity and comparability. To enrich the analysis, we added information on the
2007 second-quarter unemployment rate drawn from Istat’s “Conti economici regionali” (regional
economic accounts), and we computed a unionization index at the regional level as the ratio
between the number of employees who are members of one of the three biggest Italian labour union
confederations (CGIL, CISL and UIL) and the total employed Italian population.4
Table A1 in the Appendix contains a brief description of each variable employed in the analysis.
The dependent variable bad working conditions is the sum of the indication of the seven bad
working conditions (described above), normalized from zero to one. We divide the explanatory
variables into two groups: work and personal characteristics. Among the work characteristics, we
consider working time (dummy variables for full-time work, overtime hours and shift work), the
size of the place of work (a dummy variable indicating more than ten workers at the place of work)5
and the main activity sector of the firm (grouped into the categories agriculture, industry,
construction, retail and other activities). Moreover, the specific kind of job performed by the
employee is controlled for by eight categories, ranging from executive or intellectual occupations to
unskilled occupations. The personal characteristics encompass gender, birthplace (Italy or abroad),
age, marital status and type of contract (fixed-term vs. open-ended contract). Among others, and
following previous works (Clark and Oswald, 1996; Sloane and Williams, 2000), we consider the
following as human capital indicators and hence personal characteristics: months of current job
tenure, first job, years of education and recent educational activity. Quadratic terms for the
4 In line with Poggi (2007), we consider as the numerator of the unionization index the sum of employees who are
members of the three main union confederations in Italy, thus excluding retired members. This is due to the great
variety of retired members across the different confederations, whose membership levels differ to a large extent across
Italian regions. As the denominator we use the total employed population to have a more precise measure of the
percentage of employed individuals who are affiliated with a union confederation. 5 Since Italy is characterized by a vast majority of small–medium enterprises, ten workers in a typical place of work is a
meaningful threshold that can be considered too small in other industrial economies (see, e.g., Bartelsman et al., 2003).
14
numerical variables are introduced into the regressions to control for non-linearities in their effects.
Finally, the inclusion of the unemployment rate and unionization index allows us to capture specific
socio-economic geographical information that can affect workers’ reporting of bad working
conditions.
The data set contains 42,198 workers. The average worker in the sample is 41 years old, has tenure
of about 10 years (138 months) and has completed high school education (12 years of education).
Moreover, the vast majority of workers have full-time work (85%), work in medium–large places
(72% in places of work with more than 10 workers), are not a foreigner (93%) and are married
(60%). Only a minority of individuals work overtime hours (8%), perform shift work (22%), have a
fixed-term contract (14%) and have recently participated in educational activities (5%).
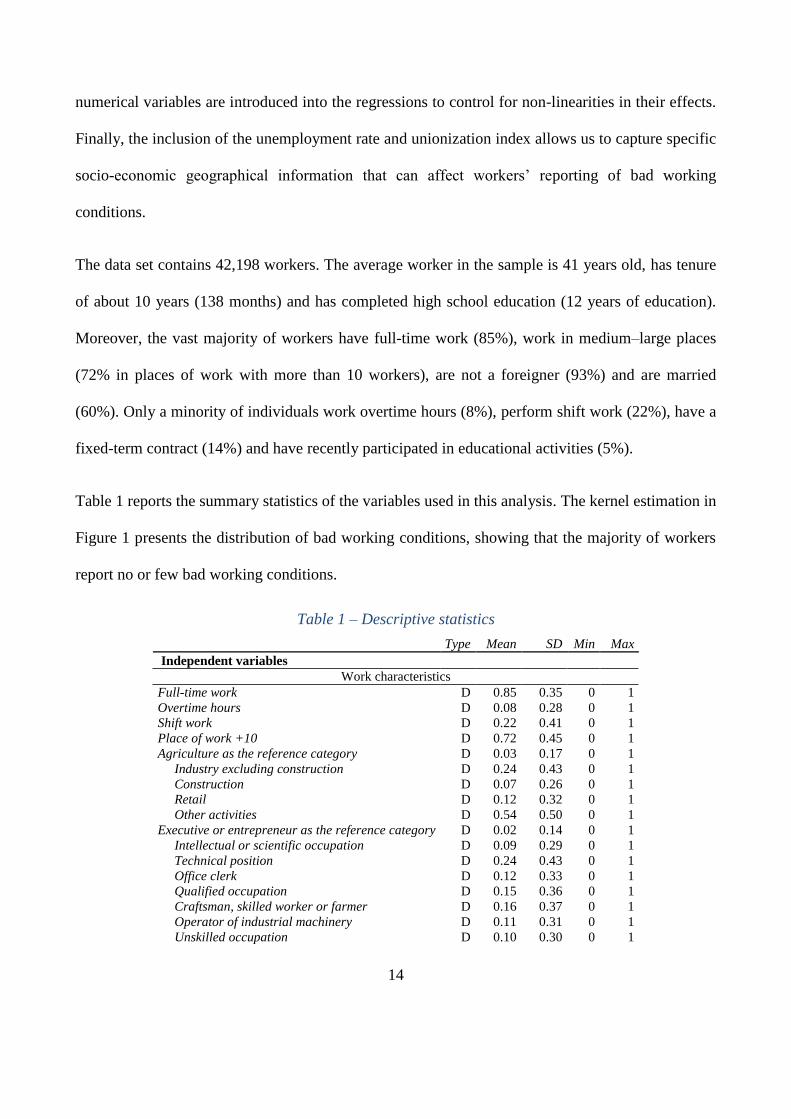
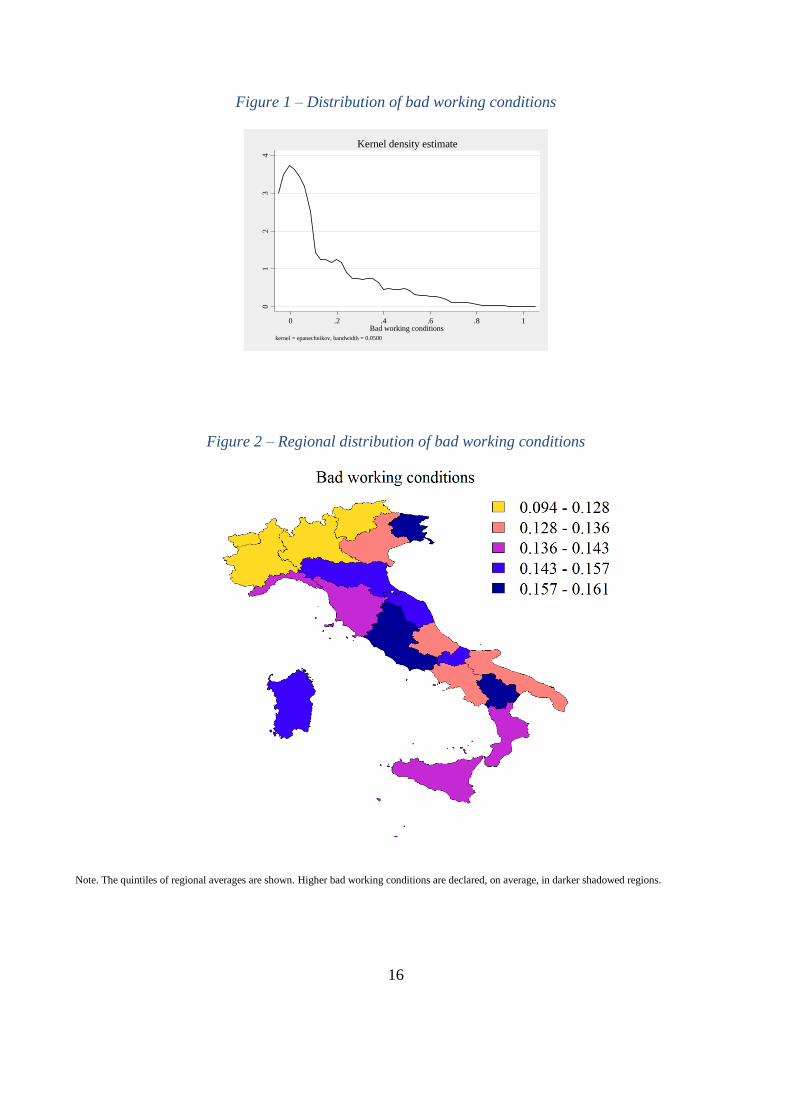
Table 1 reports the summary statistics of the variables used in this analysis. The kernel estimation in
Figure 1 presents the distribution of bad working conditions, showing that the majority of workers
report no or few bad working conditions.
Table 1 – Descriptive statistics
Type Mean SD Min Max
Independent variables
Work characteristics
Full-time work D 0.85 0.35 0 1
Overtime hours D 0.08 0.28 0 1
Shift work D 0.22 0.41 0 1
Place of work +10 D 0.72 0.45 0 1
Agriculture as the reference category D 0.03 0.17 0 1
Industry excluding construction D 0.24 0.43 0 1
Construction D 0.07 0.26 0 1
Retail D 0.12 0.32 0 1
Other activities D 0.54 0.50 0 1
Executive or entrepreneur as the reference category D 0.02 0.14 0 1
Intellectual or scientific occupation D 0.09 0.29 0 1
Technical position D 0.24 0.43 0 1
Office clerk D 0.12 0.33 0 1
Qualified occupation D 0.15 0.36 0 1
Craftsman, skilled worker or farmer D 0.16 0.37 0 1
Operator of industrial machinery D 0.11 0.31 0 1
Unskilled occupation D 0.10 0.30 0 1

15
Type Mean SD Min Max
Personal characteristics
Current job tenure N 137.65 123.23 0 696
First job D 0.30 0.46 0 1
Fixed-term contract D 0.14 0.35 0 1
Fixed-term contract, wanted D 0.01 0.11 0 1
Fixed-term contract, non-wanted D 0.13 0.33 0 1
Female D 0.44 0.50 0 1
Born in Italy D 0.93 0.26 0 1
Years of education N 11.81 3.46 8 18
Educational activities in the last four weeks D 0.05 0.22 0 1
Age N 41.35 11.07 20 60
Unemployment rate N 5.76 3.38 2.79 11.87
Unionisation index I 0.27 0.05 0.21 0.42
Never married as the reference category D 0.32 0.47 0 1
Married D 0.60 0.49 0 1
Separated or divorced D 0.06 0.24 0 1
Widow/widower D 0.02 0.13 0 1
Dependent variables
Bad working conditions I 0.13 0.19 0 1
Exposure to dust, fumes, chemicals D 0.16 0.37 0 1
Noisy workplace D 0.15 0.36 0 1
Bad posture induced by work D 0.20 0.40 0 1
Feeling exposed to risk of injury D 0.22 0.41 0 1
Bad physical working conditions I 0.18 0.28 0 1
Excessive workload D 0.14 0.35 0 1
Feeling exposed to bullying or discrimination D 0.05 0.22 0 1
Feeling exposed to threats or physical violence D 0.02 0.12 0 1
Bad psychological working conditions I 0.07 0.16 0 1 Note. Type: D dummy variable, N numerical variable, I index variable; SD standard deviation; The number of observations is equal to 42,198;
Data sources: 2007 Istat Labour Force Survey; “Conti economici regionali”, Istat.
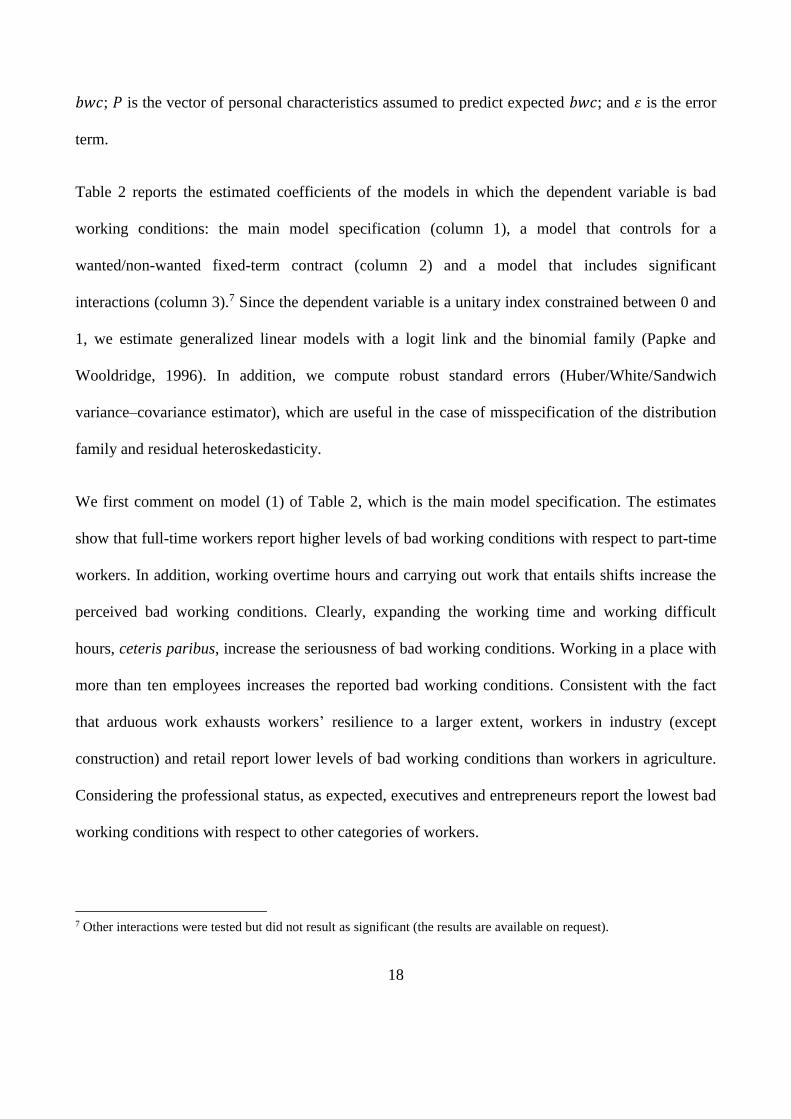
Interesting information comes from the analysis of the geographical distribution of bad working
conditions (Figure 2). In particular, workers in northern regions report, on average, lower levels of
bad working conditions than southern regions. Since the economic development in Italy increases
with latitude to a large extent,6 lower actual bad working conditions should be increasingly met
moving north. An explanation of the complex plot of (perceived) bad working conditions shown in
Figure 2 could additionally hinge on expectations.
6 See, for instance, Felice (2013) and Felice and Vasta (2015) on education and on the delay of the modernization
process from the long-run perspective.
16
Figure 1 – Distribution of bad working conditions
Figure 2 – Regional distribution of bad working conditions
Note. The quintiles of regional averages are shown. Higher bad working conditions are declared, on average, in darker shadowed regions.
01
23
4
Den
sity
0 .2 .4 .6 .8 1Bad working conditions
kernel = epanechnikov, bandwidth = 0.0500
Kernel density estimate

17
If we assume expectations of increasingly lower levels of bad working conditions moving south,
due for instance to a lower level of participation of women in the labour market and a higher level
of the unionization index, the difference between actual and expected bad working conditions
would reach its maximum in the south of Italy, where actual bad working conditions are higher and
expectations are lower than in the north.
4. Methodology and results
Perceived bad working conditions are determined by a multiplicity of factors. The actual
determinants and expectations intertwine and contribute to workers’ final perception of bad working
conditions. To uncover the main factors determining working conditions, we first present the
regression results of the composite index of bad working conditions that was illustrated in Section
3. Second, the non-linear effects of numerical variables are displayed and discussed. We then
provide the conditional marginal effects of some interaction terms. Finally, we divide physical from
psychological bad working conditions and break down the composite index of bad working
conditions into its individual components, for which we report individual probit regression models
to control for the heterogeneity of the main predictors of such a broad concept as bad working
conditions.
Eq. (3) is the empirical counterpart of Eq. (2) and is estimated in the following:
𝑏𝑤𝑐 = 𝑓[𝛼 + 𝛽𝑊′ 𝑊 + 𝛽𝑃
′𝑃 + 𝜀] (3)
where 𝑏𝑤𝑐 are declared bad working conditions; 𝑓[. ] is a link function; 𝛼 is the constant; 𝛽𝑊′ and
𝛽𝑃′ are the vectors of coefficients; 𝑊 is the vector of work characteristics assumed to predict actual
18
𝑏𝑤𝑐; 𝑃 is the vector of personal characteristics assumed to predict expected 𝑏𝑤𝑐; and 𝜀 is the error
term.
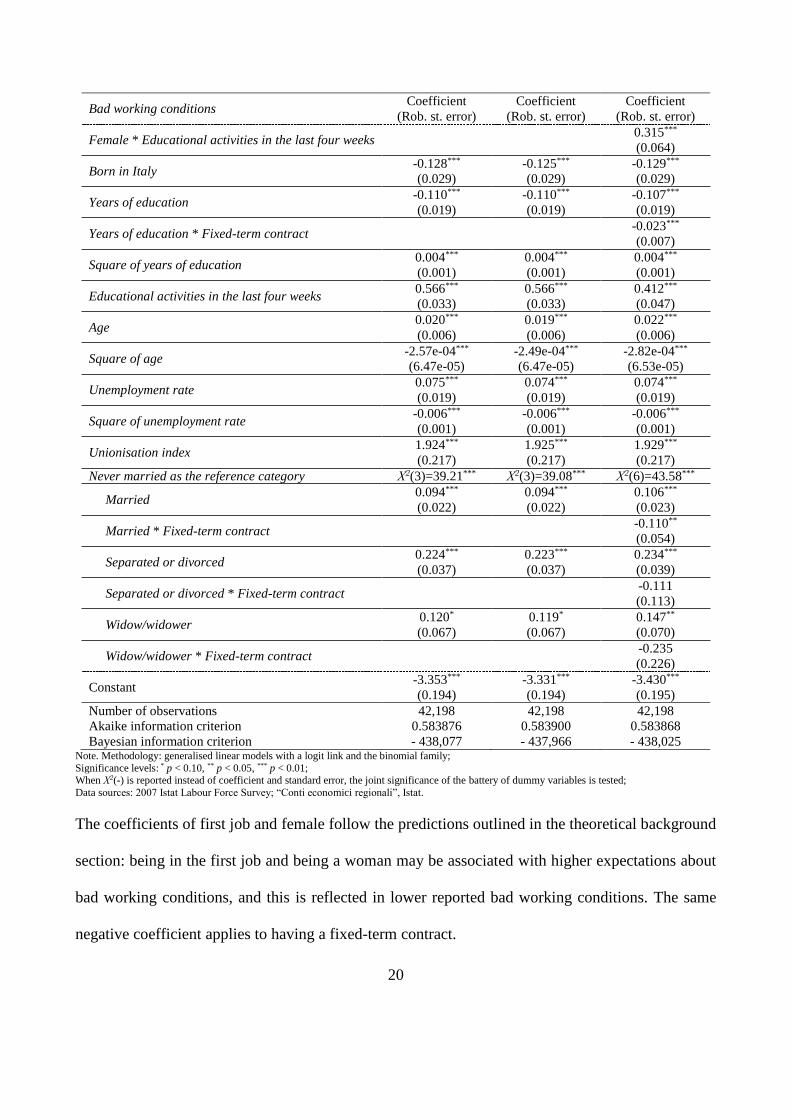
Table 2 reports the estimated coefficients of the models in which the dependent variable is bad
working conditions: the main model specification (column 1), a model that controls for a
wanted/non-wanted fixed-term contract (column 2) and a model that includes significant
interactions (column 3).7 Since the dependent variable is a unitary index constrained between 0 and
1, we estimate generalized linear models with a logit link and the binomial family (Papke and
Wooldridge, 1996). In addition, we compute robust standard errors (Huber/White/Sandwich
variance–covariance estimator), which are useful in the case of misspecification of the distribution
family and residual heteroskedasticity.
We first comment on model (1) of Table 2, which is the main model specification. The estimates
show that full-time workers report higher levels of bad working conditions with respect to part-time
workers. In addition, working overtime hours and carrying out work that entails shifts increase the
perceived bad working conditions. Clearly, expanding the working time and working difficult
hours, ceteris paribus, increase the seriousness of bad working conditions. Working in a place with
more than ten employees increases the reported bad working conditions. Consistent with the fact
that arduous work exhausts workers’ resilience to a larger extent, workers in industry (except
construction) and retail report lower levels of bad working conditions than workers in agriculture.
Considering the professional status, as expected, executives and entrepreneurs report the lowest bad
working conditions with respect to other categories of workers.
7 Other interactions were tested but did not result as significant (the results are available on request).

19
Table 2 – Bad working conditions – GLM binomial link logit
Bad working conditions Coefficient
(Rob. st. error)
Coefficient
(Rob. st. error)
Coefficient
(Rob. st. error)
(1) (2) (3)
Work characteristics
Full-time work 0.297***
(0.029)
0.295***
(0.029)
0.294***
(0.029)
Overtime hours 0.457***
(0.025)
0.456***
(0.025)
0.456***
(0.025)
Shift work 0.639***
(0.019)
0.639***
(0.019)
0.638***
(0.019)
Place of work +10 0.126***
(0.020)
0.124***
(0.020)
0.126***
(0.020)
Agriculture as the reference category Χ2(4)=397.37*** Χ2(4)=398.16*** Χ2(4)=389.54***
Industry excluding construction -0.102**
(0.046)
-0.104**
(0.046)
-0.093**
(0.047)
Construction 0.390***
(0.049)
0.389***
(0.049)
0.392***
(0.049)
Retail -0.258***
(0.051)
-0.259***
(0.051)
-0.249***
(0.051)
Other activities -0.159***
(0.045)
-0.160***
(0.045)
-0.152***
(0.046)
Executive or entrepreneur as the reference category Χ2(7)=1,214.06*** Χ2(7)=1,211.57*** Χ2(7)=1,211.49***
Intellectual or scientific occupation 0.214***
(0.073)
0.208***
(0.073)
0.212***
(0.072)
Technical position 0.367***
(0.070)
0.361***
(0.070)
0.359***
(0.070)
Office clerk 0.231***
(0.074)
0.225***
(0.074)
0.228***
(0.074)
Qualified occupation 0.569***
(0.073)
0.564***
(0.073)
0.567***
(0.073)
Craftsman, skilled worker or farmer 1.179***
(0.072)
1.173***
(0.072)
1.175***
(0.072)
Operator of industrial machinery 1.098***
(0.073)
1.092***
(0.073)
1.094***
(0.073)
Unskilled occupation 0.870***
(0.074)
0.864***
(0.074)
0.866***
(0.074)
Personal characteristics
Current job tenure 1.50e-03***
(2.36e-04)
1.51e-03***
(2.36e-04)
1.45e-03***
(2.36e-04)
Square of current job tenure -2.28e-06***
(5.66e-07)
-2.32e-06***
(5.66e-07)
-2.21e-06***
(5.66e-07)
First job -0.170***
(0.021)
-0.169***
(0.021)
-0.170***
(0.021)
Fixed-term contract -0.101***
(0.027)
0.247***
(0.096)
Fixed-term contract, wanted -0.409***
(0.089)
Fixed-term contract, non-wanted -0.076***
(0.028)
Fixed-term contract * Female -0.091*
(0.050)
Female -0.253***
(0.019)
-0.254***
(0.019)
-0.264***
(0.021)
20
Bad working conditions Coefficient
(Rob. st. error)
Coefficient
(Rob. st. error)
Coefficient
(Rob. st. error)
Female * Educational activities in the last four weeks 0.315***
(0.064)
Born in Italy -0.128***
(0.029)
-0.125***
(0.029)
-0.129***
(0.029)
Years of education -0.110***
(0.019)
-0.110***
(0.019)
-0.107***
(0.019)
Years of education * Fixed-term contract -0.023***
(0.007)
Square of years of education 0.004***
(0.001)
0.004***
(0.001)
0.004***
(0.001)
Educational activities in the last four weeks 0.566***
(0.033)
0.566***
(0.033)
0.412***
(0.047)
Age 0.020***
(0.006)
0.019***
(0.006)
0.022***
(0.006)
Square of age -2.57e-04***
(6.47e-05)
-2.49e-04***
(6.47e-05)
-2.82e-04***
(6.53e-05)
Unemployment rate 0.075***
(0.019)
0.074***
(0.019)
0.074***
(0.019)
Square of unemployment rate -0.006***
(0.001)
-0.006***
(0.001)
-0.006***
(0.001)
Unionisation index 1.924***
(0.217)
1.925***
(0.217)
1.929***
(0.217)
Never married as the reference category Χ2(3)=39.21*** Χ2(3)=39.08*** Χ2(6)=43.58***
Married 0.094***
(0.022)
0.094***
(0.022)
0.106***
(0.023)
Married * Fixed-term contract -0.110**
(0.054)
Separated or divorced 0.224***
(0.037)
0.223***
(0.037)
0.234***
(0.039)
Separated or divorced * Fixed-term contract -0.111
(0.113)
Widow/widower 0.120*
(0.067)
0.119*
(0.067)
0.147**
(0.070)
Widow/widower * Fixed-term contract -0.235
(0.226)
Constant -3.353***
(0.194)
-3.331***
(0.194)
-3.430***
(0.195)
Number of observations 42,198 42,198 42,198
Akaike information criterion 0.583876 0.583900 0.583868
Bayesian information criterion - 438,077 - 437,966 - 438,025 Note. Methodology: generalised linear models with a logit link and the binomial family;
Significance levels: * p < 0.10, ** p < 0.05, *** p < 0.01; When Χ2(-) is reported instead of coefficient and standard error, the joint significance of the battery of dummy variables is tested;
Data sources: 2007 Istat Labour Force Survey; “Conti economici regionali”, Istat.
The coefficients of first job and female follow the predictions outlined in the theoretical background
section: being in the first job and being a woman may be associated with higher expectations about
bad working conditions, and this is reflected in lower reported bad working conditions. The same
negative coefficient applies to having a fixed-term contract.

21
Two variables represent education in the data set: years of education and educational activities in
the last four weeks. While the former reflects a very general, long-term and heterogeneous kind of
education, the latter is very specific, short-term, recent and more homogeneous among workers in
the same job. When we consider the dummy variable for educational activities in the last four
weeks, the positive and significant coefficient is in line with the conjectures regarding expectations.
Finally, never-married individuals report the lowest levels of bad working conditions compared
with married, separated and widowed workers. By examining the magnitude of the coefficients, we
note that separated or divorced individuals report the highest levels of bad working conditions.
A concern about the endogeneity of the variable current job tenure may arise, since jobs associated
with higher bad working conditions may be more likely to be dropped, resulting in shorter tenures.
To control for this issue, we rerun the main model using again generalized linear models with a
logit link and the binomial family but also with instrumental variables and the maximum quasi-
likelihood methodology. As an instrument we use three variables, both together and in separate
regressions: (1) a dummy variable signalling whether the worker had ever been in contact with a
public employment centre; (2) the number of months from the last time that the individual had
contact with a public employment centre; and (3) the number of persons living in the individual’s
home. All of these variables are meant to capture a higher/lower level of easiness for the individual
to change work, which we assume to be exogenous to the level of bad working conditions. All the
regressions, available on request, confirm the presented results.
The four panels of Figure 3, relating to model (1) of Table 2, are obtained by computing the
prediction and the confidence intervals of bad working conditions for the average individual in the
sample for each level of the numerical variables current job tenure, years of education, age and
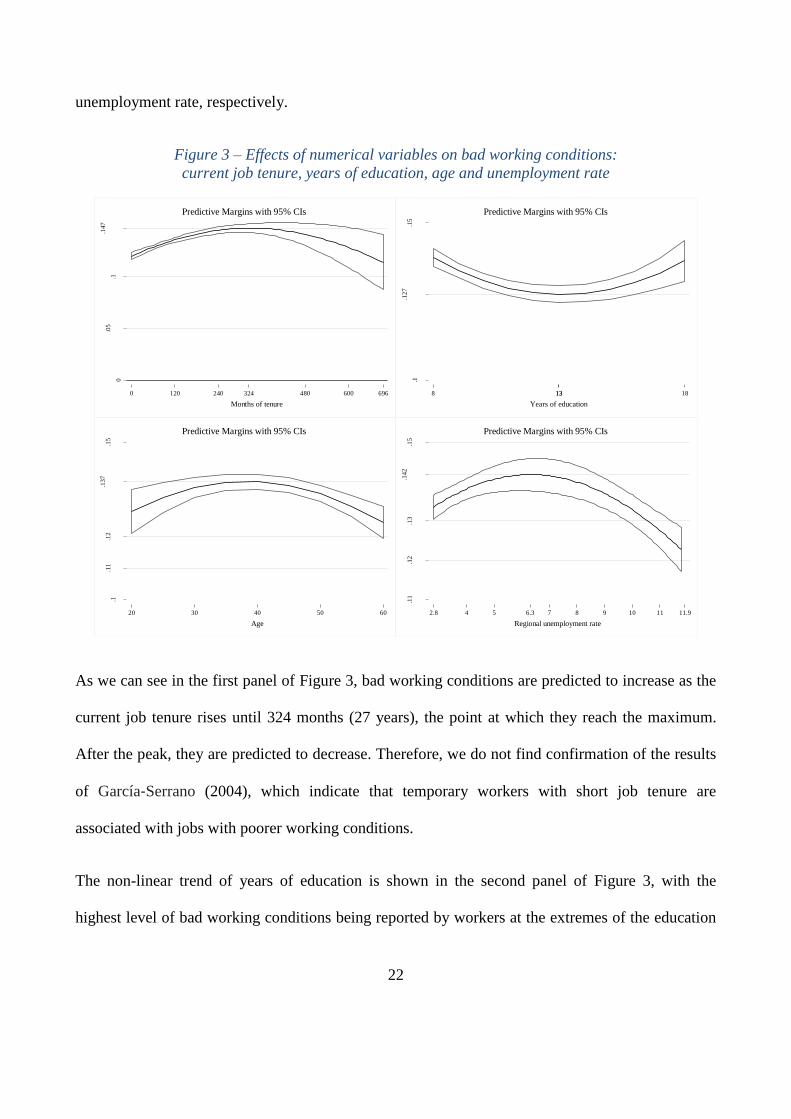
22
unemployment rate, respectively.
Figure 3 – Effects of numerical variables on bad working conditions:
current job tenure, years of education, age and unemployment rate
As we can see in the first panel of Figure 3, bad working conditions are predicted to increase as the
current job tenure rises until 324 months (27 years), the point at which they reach the maximum.
After the peak, they are predicted to decrease. Therefore, we do not find confirmation of the results
of García‐Serrano (2004), which indicate that temporary workers with short job tenure are
associated with jobs with poorer working conditions.
The non-linear trend of years of education is shown in the second panel of Figure 3, with the
highest level of bad working conditions being reported by workers at the extremes of the education
0
.05
.1
.147
Bad
work
ing
condit
ions
0 120 240 324 480 600 696
Months of tenure
Predictive Margins with 95% CIs
.1
.127
.15
Bad
work
ing
condit
ions
8 1313 18
Years of education
Predictive Margins with 95% CIs
.1.1
1.1
2.1
37
.15
Bad
work
ing
condit
ions
20 30 50 6040
Age
Predictive Margins with 95% CIs
.11
.12
.13
.142
.15
Bad
work
ing
condit
ions
2.8 4 5 6.3 7 8 9 10 11 11.9
Regional unemployment rate
Predictive Margins with 95% CIs

23
range. This result mirrors what we expected just for the very educated workers, for whom lower
expectations about bad working conditions were supposed to translate into higher levels of
perceived bad working conditions. On the contrary, workers with the minimum level of education
attained reported the highest level of bad working conditions supposedly because of actual worse
jobs.
The inverse U-shaped relationship between bad working conditions and age (Figure 3, third panel)
highlights that very young and old workers report the lowest level of bad working conditions in the
data set.
It is apparent from the fourth panel in Figure 3 that regional unemployment has contrasting effects:
it increases both actual bad working conditions and their expectations. For low values of the
unemployment rate, the first effect prevails. After a certain threshold level (6.3% in our estimations)
and for a larger interval, the expectation effect prevails, decreasing the perception of bad working
conditions.8
To corroborate the hypothesis of the wedge between actual and expected working conditions, model
(2) of Table 2 controls for wanted/non-wanted fixed-term contracts. More specifically, the variable
fixed-term contract wanted indicates a worker who has a fixed-term contract and declares him- or
herself to aspire to this specific work arrangement. Conversely, fixed-term contract non-wanted
indicates a worker with a fixed-term contract who declares that he or she would prefer a permanent
contract. It is clear in this case that the two types of individuals differ only in terms of aspirations.
Interestingly, workers with a fixed-term contract who aspired to it exhibit significantly lower levels
8 The average effect of the regional unemployment rate is overall negative, since the predictive margin falls to a lower
level on the right side of the figure. This represents the rationale for including this variable among the variables driving
expected and not actual bad working conditions.
24
of bad working conditions.
We conclude the comments on Table 2 by concentrating on model (3), which includes significant
interaction terms. The preceding results are mainly confirmed.9 To understand the effect of the
interacted variables better, we compute the conditional marginal effects presented in Table 3, which
refer to model (3) of Table 2. The average marginal effects are conditional on the categories
reported in parentheses. The marginal effects of a fixed-term contract for different genders confirm
the negative overall sign for this variable. It is interesting, however, to note that the negative effect
of a fixed-term contract is almost double for females. Table 3 also confirms the thesis supported by
Clark (1997) as regards the effect of education: the gender differential in job satisfaction in favour
of women vanishes for highly educated individuals. Our results show that females stop reporting
lower levels of bad working conditions with respect to males once they take part in educational
activities in the month preceding the survey interview. Table 3, in addition, points out the stronger
negative effect of education on bad working conditions for workers with a fixed-term contract.
Highly educated individuals seem to be less prone to complaining about bad working conditions,
especially if their job has a shorter expected duration. Finally, the marital status dummies allow us
to ascertain that the temporary workers reporting lower levels of bad working conditions are
married.
9 Even though the coefficient of fixed-term contract is significantly positive, interactions with this variable have
significant negative coefficients.

25
Table 3 – Predicted means of bad working conditions – Average marginal effects (conditional)
Bad working conditions dy/dx
(Delta-method st. error)
Fixed-term contract (Male) -0.009**
(0.004)
Fixed-term contract (Female) -0.015***
(0.003)
Female (No Educational activities in the last four weeks) -0.029***
(0.002)
Female (Educational activities in the last four weeks) 0.006
(0.008)
Years of education (Open-ended contract) -1.57e-03***
(4.06e-04)
Years of education (Fixed-term contract) -3.69e-03***
(7.46e-04)
Fixed-term contract (Never married) -0.004
(0.004)
Fixed-term contract (Married) -0.015***
(0.004)
Fixed-term contract (Separated or divorced) -0.017
(0.012)
Fixed-term contract (Widow/widower) -0.026
(0.018)
Number of observations 42,198 Note. Changes in prediction refer to model (3) of Table 2;
dy/dx for the dummy variables Fixed-term contract and Female is the discrete change from the base level; dy/dx for the numerical variable Years of education is the marginal effect;
Significance levels: * p < 0.10, ** p < 0.05, *** p < 0.01;
Data sources: 2007 Istat Labour Force Survey; “Conti economici regionali”, Istat.
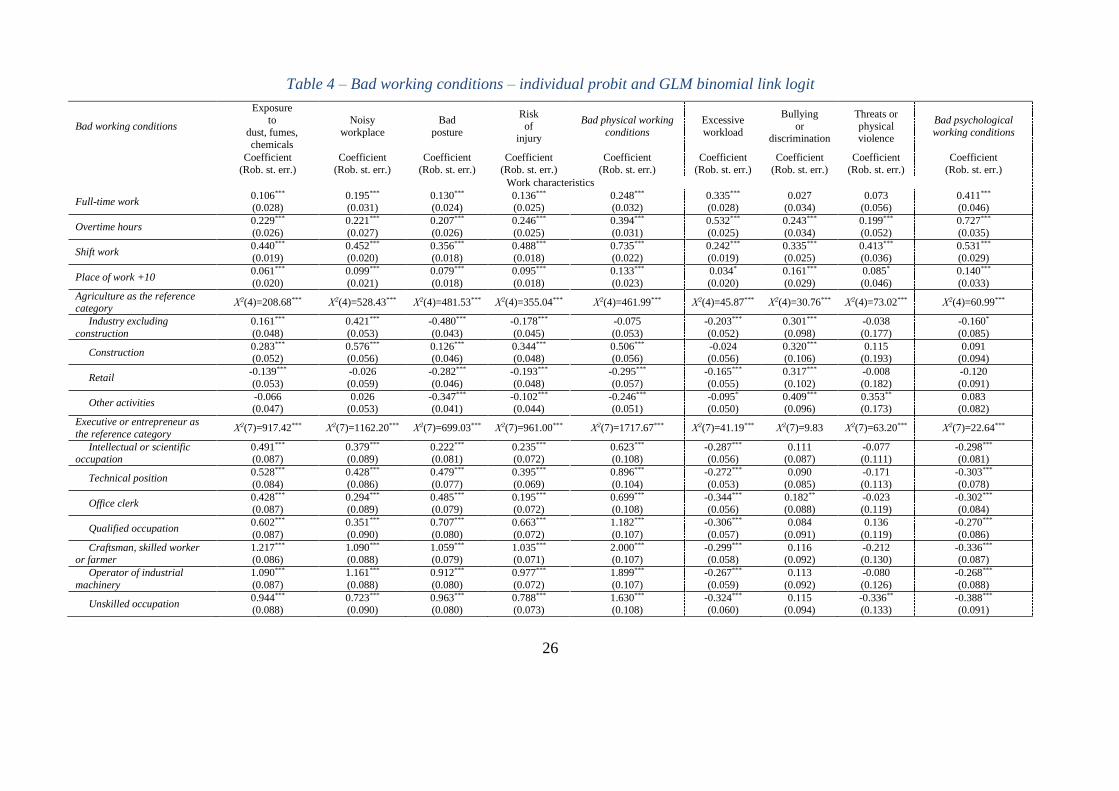
The composite index of bad working conditions can be divided into physical and psychological bad
working conditions. Furthermore, all its single components can be investigated individually to
control for the heterogeneity of the predictors among all the components. Table 4 reports
generalized linear models (Papke and Wooldridge, 1996) for physical and psychological bad
working conditions and individual probit regression models for each specific component of bad
working conditions. Since the dependent variables in the latter case are dummy variables, we
estimate probit models by assuming that each latent working condition is deemed (and observed) to
be bad whenever it is perceived above a certain threshold. As before, we compute robust standard
errors (Huber/White/Sandwich variance–covariance estimator) that are useful in the case of some
types of misspecification so long as the observations are independent (Greene, 2007).
26
Table 4 – Bad working conditions – individual probit and GLM binomial link logit
Bad working conditions
Exposure to
dust, fumes,
chemicals
Noisy
workplace
Bad
posture
Risk
of injury
Bad physical working
conditions
Excessive
workload
Bullying
or discrimination
Threats or
physical violence
Bad psychological
working conditions
Coefficient
(Rob. st. err.)
Coefficient
(Rob. st. err.)
Coefficient
(Rob. st. err.)
Coefficient
(Rob. st. err.)
Coefficient
(Rob. st. err.)
Coefficient
(Rob. st. err.)
Coefficient
(Rob. st. err.)
Coefficient
(Rob. st. err.)
Coefficient
(Rob. st. err.)
Work characteristics
Full-time work 0.106*** (0.028)
0.195*** (0.031)
0.130*** (0.024)
0.136*** (0.025)
0.248*** (0.032)
0.335*** (0.028)
0.027 (0.034)
0.073 (0.056)
0.411*** (0.046)
Overtime hours 0.229***
(0.026)
0.221***
(0.027)
0.207***
(0.026)
0.246***
(0.025)
0.394***
(0.031)
0.532***
(0.025)
0.243***
(0.034)
0.199***
(0.052)
0.727***
(0.035)
Shift work 0.440***
(0.019)
0.452***
(0.020)
0.356***
(0.018)
0.488***
(0.018)
0.735***
(0.022)
0.242***
(0.019)
0.335***
(0.025)
0.413***
(0.036)
0.531***
(0.029)
Place of work +10 0.061***
(0.020)
0.099***
(0.021)
0.079***
(0.018)
0.095***
(0.018)
0.133***
(0.023)
0.034*
(0.020)
0.161***
(0.029)
0.085*
(0.046)
0.140***
(0.033)
Agriculture as the reference category
Χ2(4)=208.68*** Χ2(4)=528.43*** Χ2(4)=481.53*** Χ2(4)=355.04*** Χ2(4)=461.99*** Χ2(4)=45.87*** Χ2(4)=30.76*** Χ2(4)=73.02*** Χ2(4)=60.99***
Industry excluding
construction
0.161***
(0.048)
0.421***
(0.053)
-0.480***
(0.043)
-0.178***
(0.045)
-0.075
(0.053)
-0.203***
(0.052)
0.301***
(0.098)
-0.038
(0.177)
-0.160*
(0.085)
Construction 0.283*** (0.052)
0.576*** (0.056)
0.126*** (0.046)
0.344*** (0.048)
0.506*** (0.056)
-0.024 (0.056)
0.320*** (0.106)
0.115 (0.193)
0.091 (0.094)
Retail -0.139***
(0.053)
-0.026
(0.059)
-0.282***
(0.046)
-0.193***
(0.048)
-0.295***
(0.057)
-0.165***
(0.055)
0.317***
(0.102)
-0.008
(0.182)
-0.120
(0.091)
Other activities -0.066 (0.047)
0.026 (0.053)
-0.347*** (0.041)
-0.102*** (0.044)
-0.246*** (0.051)
-0.095* (0.050)
0.409*** (0.096)
0.353** (0.173)
0.083 (0.082)
Executive or entrepreneur as
the reference category Χ2(7)=917.42*** Χ2(7)=1162.20*** Χ2(7)=699.03*** Χ2(7)=961.00*** Χ2(7)=1717.67*** Χ2(7)=41.19*** Χ2(7)=9.83 Χ2(7)=63.20*** Χ2(7)=22.64***
Intellectual or scientific occupation
0.491*** (0.087)
0.379*** (0.089)
0.222*** (0.081)
0.235*** (0.072)
0.623*** (0.108)
-0.287*** (0.056)
0.111 (0.087)
-0.077 (0.111)
-0.298*** (0.081)
Technical position 0.528***
(0.084)
0.428***
(0.086)
0.479***
(0.077)
0.395***
(0.069)
0.896***
(0.104)
-0.272***
(0.053)
0.090
(0.085)
-0.171
(0.113)
-0.303***
(0.078)
Office clerk 0.428*** (0.087)
0.294*** (0.089)
0.485*** (0.079)
0.195*** (0.072)
0.699*** (0.108)
-0.344*** (0.056)
0.182** (0.088)
-0.023 (0.119)
-0.302*** (0.084)
Qualified occupation 0.602***
(0.087)
0.351***
(0.090)
0.707***
(0.080)
0.663***
(0.072)
1.182***
(0.107)
-0.306***
(0.057)
0.084
(0.091)
0.136
(0.119)
-0.270***
(0.086)
Craftsman, skilled worker or farmer
1.217*** (0.086)
1.090*** (0.088)
1.059*** (0.079)
1.035*** (0.071)
2.000*** (0.107)
-0.299*** (0.058)
0.116 (0.092)
-0.212 (0.130)
-0.336*** (0.087)
Operator of industrial
machinery
1.090***
(0.087)
1.161***
(0.088)
0.912***
(0.080)
0.977***
(0.072)
1.899***
(0.107)
-0.267***
(0.059)
0.113
(0.092)
-0.080
(0.126)
-0.268***
(0.088)
Unskilled occupation 0.944*** (0.088)
0.723*** (0.090)
0.963*** (0.080)
0.788*** (0.073)
1.630*** (0.108)
-0.324*** (0.060)
0.115 (0.094)
-0.336** (0.133)
-0.388*** (0.091)
27
Bad working conditions
Exposure to
dust, fumes,
chemicals
Noisy
workplace
Bad
posture
Risk
of injury
Bad physical working
conditions
Excessive
workload
Bullying
or discrimination
Threats or
physical violence
Bad psychological
working conditions
Coefficient
(Rob. st. err.)
Coefficient
(Rob. st. err.)
Coefficient
(Rob. st. err.)
Coefficient
(Rob. st. err.)
Coefficient
(Rob. st. err.)
Coefficient
(Rob. st. err.)
Coefficient
(Rob. st. err.)
Coefficient
(Rob. st. err.)
Coefficient
(Rob. st. err.)
Personal characteristics
Current job tenure 1.23e-03*** (2.41e-04)
9.68e-04*** (2.54e-04)
6.85e-04*** (2.25e-04)
6.22e-04*** (2.26e-04)
1.34e-03*** (2.79e-04)
9.86e-04*** (2.40e-04)
1.72e-03*** (3.25e-04)
1.66e-03*** (5.07e-04)
2.27e-03*** (3.74e-04)
Square of current job tenure -2.25e-06***
(5.83e-07)
-9.30e-07
(6.05e-07)
-1.16e-06**
(5.44e-07)
-1.07e-06**
(5.45e-07)
-2.11e-06***
(6.71e-07)
-1.28e-06**
(5.72e-07)
-2.99e-06***
(7.70e-07)
-3.21e-06***
(1.20e-06)
-3.45e-06***
(8.86e-07)
First job -0.094*** (0.020)
-0.128*** (0.021)
-0.101*** (0.019)
-0.091*** (0.019)
-0.176*** (0.024)
-0.105*** (0.020)
-0.121*** (0.027)
-0.069* (0.040)
-0.198*** (0.032)
Fixed-term contract -0.059**
(0.027)
-2.87e-04
(2.85e-02)
-0.062***
(0.024)
-0.098***
(0.025)
-0.110***
(0.031)
-0.076***
(0.027)
-0.014
(0.037)
-0.034
(0.058)
-0.112**
(0.045)
Female -0.318*** (0.019)
-0.293*** (0.020)
-0.004 (0.017)
-0.360*** (0.017)
-0.420*** (0.022)
0.057*** (0.018)
0.129*** (0.024)
-0.066* (0.037)
0.120*** (0.028)
Born in Italy 0.013
(0.030)
-0.046
(0.031)
-0.128***
(0.027)
-0.055**
(0.028)
-0.095***
(0.034)
-0.069**
(0.031)
-0.278***
(0.039)
-0.227***
(0.061)
-0.271***
(0.049)
Years of education -0.068*** (0.019)
0.010 (0.020)
-0.093*** (0.018)
-0.105*** (0.017)
-0.108*** (0.022)
-0.069*** (0.018)
0.004 (0.024)
-0.022 (0.037)
-0.072** (0.028)
Square of years of education 0.003***
(0.001)
-0.001
(0.001)
0.003***
(0.001)
0.004***
(0.001)
0.004***
(0.001)
0.003***
(0.001)
1.41e-04
(9.61e-04)
1.53e-03
(1.46e-03)
3.49e-03***
(1.12e-03)
Educational activities in the last four weeks
0.283*** (0.035)
0.280*** (0.037)
0.392*** (0.032)
0.295*** (0.033)
0.563*** (0.040)
0.365*** (0.031)
0.327*** (0.039)
0.306*** (0.056)
0.589*** (0.044)
Age 0.002
(0.005)
0.009
(0.006)
0.013**
(0.005)
0.014***
(0.005)
0.018***
(0.006)
0.021***
(0.006)
0.018**
(0.008)
0.016
(0.013)
0.045***
(0.010)
Square of age -4.31e-05 (6.41e-05)
-1.22e-04* (6.72e-05)
-1.89e-04*** (5.95e-05)
-2.07e-04*** (5.99e-05)
-2.61e-04*** (7.53e-05)
-2.37e-04*** (6.62e-05)
-1.67e-04* (9.35e-05)
-1.79e-04 (1.50e-04)
-4.77e-04*** (1.10e-04)
Unemployment rate 0.035*
(0.019)
0.106***
(0.020)
0.035**
(0.017)
0.035**
(0.017)
0.092***
(0.022)
0.047**
(0.019)
0.032
(0.025)
-0.059
(0.039)
0.055*
(0.030)
Square of unemployment rate -0.003* (0.001)
-0.008*** (0.001)
-0.003*** (0.001)
-0.003** (0.001)
-0.008*** (0.002)
-0.003** (0.001)
-0.002 (0.001)
0.006** (0.003)
-0.003 (0.002)
Unionisation index 0.681***
(0.222)
0.972***
(0.231)
1.502***
(0.204)
1.724***
(0.206)
2.134***
(0.255)
1.228***
(0.219)
0.868***
(0.301)
-0.547
(0.481)
1.668***
(0.343)
Never married as the reference category
Χ2(3)=9.84** Χ2(3)=12.79*** Χ2(3)=28.23*** Χ2(3)=24.22*** Χ2(3)=33.48*** Χ2(3)=19.61*** Χ2(3)=24.38*** Χ2(3)=4.72 Χ2(3)=27.13***
Married 0.057***
(0.021)
0.080***
(0.023)
0.066***
(0.020)
0.079***
(0.020)
0.121***
(0.025)
0.058***
(0.021)
-0.026
(0.029)
-0.001
(0.046)
0.054
(0.035)
Separated or divorced 0.091** (0.037)
0.083** (0.040)
0.165*** (0.034)
0.149*** (0.034)
0.219*** (0.043)
0.142*** (0.036)
0.158*** (0.046)
0.127* (0.072)
0.279*** (0.055)
Widow/widower -0.010
(0.069)
0.062
(0.071)
0.158***
(0.059)
0.033
(0.064)
0.131*
(0.079)
0.161***
(0.061)
-0.147*
(0.090)
-0.085
(0.151)
0.094
(0.098)

28
Bad working conditions
Exposure to
dust, fumes,
chemicals
Noisy
workplace
Bad
posture
Risk
of injury
Bad physical working
conditions
Excessive
workload
Bullying
or discrimination
Threats or
physical violence
Bad psychological
working conditions
Coefficient
(Rob. st. err.)
Coefficient
(Rob. st. err.)
Coefficient
(Rob. st. err.)
Coefficient
(Rob. st. err.)
Coefficient
(Rob. st. err.)
Coefficient
(Rob. st. err.)
Coefficient
(Rob. st. err.)
Coefficient
(Rob. st. err.)
Coefficient
(Rob. st. err.)
Constant -1.948***
(0.201)
-2.964***
(0.210)
-1.487***
(0.183)
-1.653***
(0.182)
-3.518***
(0.237)
-1.748***
(0.193)
-3.130***
(0.281)
-2.609***
(0.430)
-4.328***
(0.311)
Number of observations 42,198 42,198 42,198 42,198 42,198 42,198 42,198 42,198 42,198
Pseudo R2 0.1292 0.1784 0.0851 0.1298 --- 0.0483 0.0482 0.0904 ---
Note. Methodology: probit regression models and generalised linear models with a logit link and the binomial family;
Significance levels: * p < 0.10, ** p < 0.05, *** p < 0.01; When Χ2(-) is reported instead of coefficient and standard error, the joint significance of the battery of dummy variables is tested;
Data sources: 2007 Istat Labour Force Survey; “Conti economici regionali”, Istat.

Among the work characteristics, the majority of the psychological components of bad working
conditions are not significantly affected by full-time work. Furthermore, workers in industry (except
construction) have higher levels of bad working conditions in terms of exposure to dust, fumes,
chemicals, noisy places and bullying or discrimination. As regards bullying or discrimination, the
retail sector also overturns the significant sign, now being positive. While construction is the worst
sector in terms of the composite index of bad working conditions, this result does not hold if threats
and physical violence are considered individually.
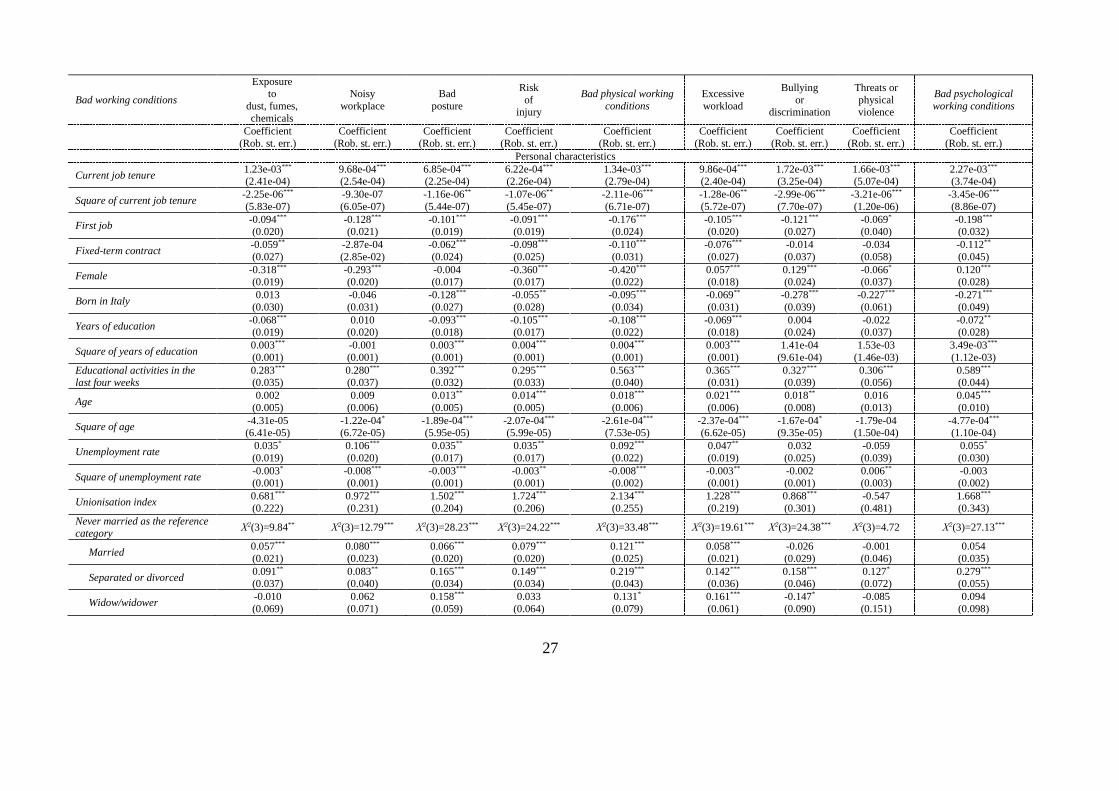
In terms of personal characteristics, the majority of the psychological components of bad working
conditions are not significantly affected by having a fixed-term contract as well as noisy
workplaces. The effect of the unemployment rate is confirmed mainly for the physical components
of bad working conditions, in particular a noisy workplace, bad posture and risk of injury.
It is important to note that women report lower levels of physical bad working conditions and
higher levels of psychological bad working conditions with respect to men. To investigate whether
this result is driven by lower levels of actual physical bad working conditions faced by women, we
focus in more detail on the construction sector, which is typically characterized by severe actual
working conditions. We realize that almost the entirety of workers in this sector are male, and
especially almost all workers in a craftsman construction occupation are male (99.49 vs. 0.51%
female), meaning that women in the construction sector are employed essentially as clerks. This
implies that our categorization among sectors and occupations captures differences in tasks at work,
which reflect different actual working conditions. Therefore, the difference in women’s perception
of physical vs. psychological bad working conditions should be ascribed to the sphere of
expectations.
By means of model (1) of Table 2 and the classification of variables driving actual bad working
conditions (work characteristics) and variables acting on expectations (personal characteristics), we

30
are able to disentangle the two sources of bad working conditions. The panels of Figure 4 represent
the regional distribution breakdown of the predictions of bad working conditions, divided into
actual and expected bad working conditions. Actual bad working conditions are obtained as
predictions by previously fixing all the variables driving expectations (personal characteristics) to
sample (national) averages. In so doing, the entire variation is due only to the variables driving
actual bad working conditions (work characteristics). The reverse is performed for expected bad
working conditions. In the latter case, the sign of the coefficients of the variables driving
expectations (personal characteristics) is reversed. The difference between actual and expected bad
working conditions (the shadowing in the two panels) composes the predicted (perceived) bad
working conditions.
Figure 4 – Regional distribution breakdown of bad working conditions
Note. The quintiles of regional averages are shown. Higher bad working conditions correspond, on average, to darker shadowed regions.
The left panel confirms that high levels of actual bad working conditions are present mainly in the
central and southern regions of the country, the north of Italy being characterized by more
developed and highly technological work environments. The right panel strikingly confirms our

31
intuition of increasingly lower levels of expected bad working conditions moving south, due for
example to a lower level of women’s participation in the labour market and a higher level of the
unionization index. It is worth noting that there are differences between actual and expected bad
working conditions in all the regions, except Friuli-Venezia Giulia, Calabria and Sicily.
5. Discussion and conclusion
In this paper we investigated the determinants of bad working conditions using the 2007 Italian
Labour Force Survey, which includes a special ad hoc section on working conditions. We provided
a theoretical formulation aiming to explain how working conditions are perceived by workers: in
defining the perception of working conditions, actual working conditions are filtered by
expectations about them, implying that the same level of actual (real) working conditions can result
in different reported (perceived) working conditions. To this end, we applied the behavioural
concepts of reference point and disappointment in the field of working conditions.
The results from the regression analyses suggest that the coefficients of the variables ascribed to the
expectation sphere of the worker in terms of working conditions are in line with the previous
literature contributions, which are mostly based on job satisfaction. The inverse U-shaped
relationship between bad working conditions and age mirrors the U-shaped relationship between
life satisfaction and age pointed out by Clark et al. (1996) and Schwandt (2016): very young and old
workers report the lowest levels of bad working conditions in our data set, and the same
consideration holds in terms of job satisfaction in Clark et al.’s (1996) research. Women report
lower levels of bad working conditions, which supports the previous findings by Clark et al. (1996)
related to job satisfaction. Importantly, through the categorization among sectors and occupations
available in our data set, we were able to control for differences in tasks at work, which reflect

32
different actual working conditions. Therefore, the difference in women’s perception of physical vs.
psychological bad working conditions should be ascribed to the sphere of expectations.
Interestingly, our results show that Clark’s hypothesis could even be overturned: the gender–job
satisfaction gap would not vanish but change sign once the increasing share of intellectual work
renders the psychological working conditions overwhelmingly more important than the physical
working conditions. In fact, we show that, contrary to physical working conditions, women hold
lower expected psychological bad working conditions than men. Education also plays an important
role in shaping how workers evaluate their working conditions: parallel to the lower job satisfaction
for highly educated workers found by Clark (1997), an additional year of education in our data
leads to higher levels of bad working conditions, suggesting that more educated workers hold
higher expectations. The presence of a variable representing a very short-term educational activity
within the workplace, which has the same positive sign as education, corroborates our expectation
interpretation. A very recent educational activity that is limited in time cannot have an impact on
actual working conditions. Our interpretation is that a shift in expectations takes place: workers who
have taken part in (limited) educational activities expect lower levels of bad working conditions
than their colleagues who have not attended them.
The result showing that having a fixed-term contract leads to reporting lower levels of bad working
conditions with respect to permanent workers deserves much attention. The literature presents
mixed evidence in this regard, with some contributions pointing out that workers holding temporary
contracts suffer worse working conditions than permanent workers (Benavides, 2000; García‐
Serrano, 2004) and other contributions showing mixed or opposite results. These mixed or opposite
results may be motivated by the lack of complete disentangling of the predictors of actual vs.
expected working conditions. For instance, Bernhard-Oettel et al. (2005) underline that health

33
complaints are not driven by the type of employment contract but rather by the perception of the
job. Furthermore, Bardasi and Francesconi (2004) and Saloniemi (2004) reveal that permanent
workers face more high-strain jobs and that atypical employment does not affect health and life
satisfaction. Having controlled for the actual determinants of bad working conditions, our result is
explained by temporary workers expecting higher levels of bad working conditions than their
permanent colleagues. The differential in expectations between the two types of workers results in
the negative and significant coefficient. Our expectation interpretation in this case is corroborated
by the distinction in terms of bad working conditions between temporary workers who aspired to a
temporary contract and temporary workers who would have preferred a permanent contract. Since
the two types of individuals differ only in terms of aspirations, the fact that workers with a fixed-
term contract who aspired to it exhibit significantly lower levels of bad working conditions should
be ascribed to different expectations.
As for marital status, separated or divorced workers report the highest levels of bad working
conditions. The fact that married individuals have a lower coefficient than separated workers
confirms a well-established finding in the literature: when marital histories worsen, ending up in
separation in extreme cases, job satisfaction worsens as well (Rogers and May, 2003; Georgellis et
al., 2012). Indeed, divorced individuals experience a loss in utility (job satisfaction) and a
corresponding drop in expected (and tolerated) bad working conditions. Interestingly, when marital
status is interacted with having a temporary contract, we find that the temporary workers reporting
lower levels of bad working conditions are married. An explanation for this could consist of married
individuals fearing unemployment spells to a lesser extent, since they find financial and emotional
support in their spouse. The bias in the expectation results in a negative surprise in the perceived
and declared bad working conditions.
34
Workers working full time, overtime or with shifts are likely to report higher levels of bad working
conditions as well as workers in a place of work with more than 10 employees. In such cases we
consider the actual bad working conditions to mirror the perceived bad working conditions, with no
expectation mechanism at work. These results are in line with some theoretical predictions
(Khanzode et al., 2012) and some empirical contributions (Cioni and Savioli, 2016) underlining that
expanding the working time (such as being a full-time worker, working overtime hours and
engaging in shift work), ceteris paribus, increases the chance of accidents and illnesses.
When we examine the individual probit regression models of each component of bad working
conditions, the majority of the psychological components of bad working conditions are not
significantly affected by full-time work and by having a fixed-term contract. Furthermore, the effect
of the unemployment rate holds mainly for the physical components of bad working conditions: a
noisy workplace, bad posture and risk of injury.
In a domain afflicted by cognitive biases, policy implications are very likely to fail to be general
and are very sensible to the evolving expectations of individuals. As hypothesized by Clark (1997)
regarding the decreasing gender–job satisfaction gap over time, the psycho-socio-economic
evolution of customs may drastically change expectations. However, our estimations may be useful
for policymakers who are willing to consider the psychophysical balance of workers influenced by
perceptions and expectations. Moreover, our results show that education and information are key
factors able to shift expectations about working conditions (hopefully) closer to the actual ones,
diminishing cognitive biases and making workers more self-aware of their actual conditions. In
terms of policy recommendations on actual working conditions, our results suggest that workers
should not work for an excessive amount of time with difficult hours and should work in small

35
places. Lastly, our results on marital status confirm well-known findings in the literature: a more
balanced and positive personal life exerts a positive impact on working conditions and consequently
on job satisfaction.
One of the most important limitations of this study is the lack of a direct measurement of workers’
expectations regarding working conditions. Accordingly, we relied on the previous literature
contributions, which suggest a distinction of variables between those affecting primarily actual
working conditions and those acting to a larger extent on expectations. Moreover, the data set used
did not allow us to track workers within the same establishment and occupation and hence subject
to the same objective working conditions. To improve the value of empirical studies, firm-level
micro-data would certainly provide a better clue in the direction of an expectation interpretation.
With information about organizational charts and salary, it would be possible to grasp the actual
working conditions better. The directions for future research should encompass the elicitation of
individuals’ expectations in survey questions as well as questions aimed at assessing whether an
individual’s condition is better than, equal to or worse than the condition of other colleagues
performing the same task. Future research should also take into account a comparison between pre-
crisis and post-crisis labour dynamics to test whether and how the economic crisis affected workers’
perceptions of their working conditions.

36
References
Alavinia, S. M., Molenaar, D., & Burdorf, A. (2009). Productivity loss in the workforce:
associations with health, work demands, and individual characteristics. American Journal of
Industrial Medicine, 52(1), 49-56.
Askenazy, P., & Caroli, E. (2010). Innovative work practices, information technologies, and
working conditions: Evidence for France. Industrial Relations: A Journal of Economy and
Society, 49(4), 544-565.
Barbieri, P., & Scherer, S. (2009). Labour market flexibilization and its consequences in
Italy. European Sociological Review, 25(6), 677-692.
Bardasi, E., & Francesconi, M. (2004). The impact of atypical employment on individual wellbeing:
evidence from a panel of British workers. Social Science & Medicine, 58(9), 1671-1688.
Bartelsman, E., Scarpetta, S. & Schivardi, F. (2003). Comparative analysis of firm demographics
and survival: micro level evidence for the OECD countries. OECD Economic Department Working
Paper, no. 348.
Bell, D. E. (1985). Disappointment in decision making under uncertainty. Operations
Research, 33(1), 1-27.
Benavides, F. G., Benach, J., Diez-Roux, A. V., & Roman, C. (2000). How do types of employment
relate to health indicators? Findings from the Second European Survey on Working
Conditions. Journal of Epidemiology and Community Health, 54(7), 494-501.
Bernhard-Oettel, C., Sverke, M., & De Witte, H. (2005). Comparing three alternative types of
employment with permanent full-time work: How do employment contract and perceived job
conditions relate to health complaints? Work & Stress, 19(4), 301-318.
Burchell, B., Cartron, D., Csizmadia, P., Delcampe, S., Gollac, M., Illéssy, M., Lorenz, E., Makó,
C., O’Brien, C., & Valeyre, A. (2009). Working conditions in the European Union: Working time
and work intensity, Dublin: European Foundation for the Improvement of Living and Working
Conditions.
Burchell, B., Sehnbruch, K., Piasna, A., & Agloni, N. (2014). The quality of employment and decent
work: definitions, methodologies, and ongoing debates, Cambridge Journal of Economics, 38, 459-
477.
Cahill, K. E., McNamara, T. K., Pitt-Catsouphes, M., & Valcour, M. (2015). Linking shifts in the
national economy with changes in job satisfaction, employee engagement and work–life
balance. Journal of Behavioral and Experimental Economics, 56, 40-54.
Cioni, M., & Savioli, M. (2016). Safety at the workplace: accidents and illnesses. Work,
Employment & Society, 30(5), 858-875.
37
Clark, A. E. (1997). Job satisfaction and gender: why are women so happy at work? Labour
Economics, 4(4), 341-372.
Clark, A. E., & Etilé, F. (2011). Happy house: Spousal weight and individual well-being. Journal of
Health Economics, 30(5), 1124-1136.
Clark, A. E., & Oswald, A. J. (1996). Satisfaction and comparison income. Journal of Public
Economics, 61(3), 359-381.
Clark, A., Oswald, A., & Warr, P. (1996). Is job satisfaction U‐shaped in age? Journal of
Occupational and Organizational Psychology, 69(1), 57-81.
Cooper, C. L., Rout, U., & Faragher, B. (1989). Mental health, job satisfaction, and job stress
among general practitioners. British Medical Journal, 298(6670), 366-370.
Dolan, P., Peasgood, T., & White, M. (2008). Do we really know what makes us happy? A review
of the economic literature on the factors associated with subjective well-being. Journal of Economic
Psychology, 29(1), 94-122.
Eurofound (2012), Fifth European Working Conditions Survey. Luxembourg: Publications Office
of the European Union.
Felice, E. (2013). Perché il Sud è rimasto indietro. Bologna: il Mulino.
Felice, E. & Vasta, M. (2015). Passive Modernization? Social Indicators and Human Development
in Italy’s Regions (1871-2009). European Review of Economic History, 19 (1), 44-66.
Fernandez, R. M., & Nordman, C. J. (2009). Are there pecuniary compensations for working
conditions? Labour Economics, 16(2), 194-207.
Fink, G., & Masiye, F. (2015). Health and agricultural productivity: Evidence from
Zambia. Journal of Health Economics, 42, 151-164.
García‐Serrano, C. (2004). Temporary employment, working conditions and expected exits from
firms. Labour, 18(2), 293-316.
Georgellis, Y., Lange, T., & Tabvuma, V. (2012). The impact of life events on job
satisfaction. Journal of Vocational Behavior, 80(2), 464-473.
Greene, W. H. (2007). Econometric Analysis. New Jersey: Prentice Hall.
Helliwell, J. F. & Huang, H. (2011). Well-Being and Trust in the Workplace. Journal of Happiness
Studies, 12, 747-767.
Hersch, J. (1991). Male-female differences in hourly wages: The role of human capital, working
conditions, and housework. Industrial & Labor Relations Review, 44(4), 746-759.

38
Kahneman, D., & Tversky, A. (1979). Prospect theory: An analysis of decision under
risk. Econometrica: Journal of the Econometric Society, 47(2), 263-291.
Khanzode, V.V., Maiti J & Ray, P.K. (2012). Occupational injury and accident research: A
comprehensive review, Safety Science 50(5), 1355-1367.
Kőszegi, B., & Rabin, M. (2006). A model of reference-dependent preferences. The Quarterly
Journal of Economics, 121(4), 1133-1165.
Loscocco, K. A., & Spitze, G. (1990). Working conditions, social support, and the well-being of
female and male factory workers. Journal of Health and Social Behavior, 31(4), 313-327.
Muñoz de Bustillo, R., & Fernández-Macías, E. (2005). Job satisfaction as an indicator of the
quality of work. The Journal of Socio-Economics, 34(5), 656-673.
Muñoz de Bustillo, R., Fernández-Macías, E., Antón, J. I., & Esteve, F. (2011). Measuring More
than Money. Cheltenham: Edward Elgar.
Papke, L. E., & Wooldridge, J. (1993). Econometric methods for fractional response variables with
an application to 401 (k) plan participation rates. Journal of Applied Econometrics, 11(6), 619-632.
Poggi, A. (2007). Do satisfactory working conditions contribute to explaining earning differentials
in Italy? A panel data approach. Labour, 21(4‐5), 713-733.
Poggi, A. (2010). Job satisfaction, working conditions and aspirations. Journal of Economic
Psychology, 31(6), 936-949.
Robone, S., Jones, A. M., & Rice, N. (2011). Contractual conditions, working conditions and their
impact on health and well-being. The European Journal of Health Economics, 12(5), 429-444.
Rogers, S. J., & May, D. C. (2003). Spillover Between Marital Quality and Job Satisfaction: Long‐Term Patterns and Gender Differences. Journal of Marriage and Family, 65(2), 482-495.
Saloniemi, A., Virtanen, P., & Vahtera, J. (2004). The work environment in fixed-term jobs: Are
poor psychosocial conditions inevitable? Work, Employment and Society, 18(1), 193-208.
Schwandt, H. (2016). Unmet Aspirations as an Explanation for the Age U-shape in Wellbeing.
Journal of Economic Behavior & Organization, 122, 75-87.
Sloane, P. J., & Williams, H. (2000). Job satisfaction, comparison earnings, and
gender. Labour, 14(3), 473-502.
Sousa-Poza, A., & Sousa-Poza, A. A. (2003). Gender differences in job satisfaction in Great
Britain, 1991–2000: Permanent or transitory? Applied Economics Letters, 10(11), 691-694.
Travers, C. J., & Cooper, C. L. (1993). Mental health, job satisfaction and occupational stress
among UK teachers. Work & Stress, 7(3), 203-219.

39
Van Dijk, W. W., Zeelenberg, M., & Van der Pligt, J. (2003). Blessed are those who expect
nothing: Lowering expectations as a way of avoiding disappointment. Journal of Economic
Psychology, 24(4), 505-516.
Zaleznik, A., Christensen, C. R., & Roethlisberger F. J. (1958). The Motivation, Productivity, and
Satisfaction of Workers: A Prediction Study. Harvard University.
Appendix
Table A1 – Variable definitions
Type Definition
Independent variables
Work characteristics
Full-time work D The worker has full-time work
Overtime hours D The worker has overtime hours
Shift work D The worker has shift work
Place of work +10 D The place of work has more than ten workers
Agriculture as the reference category D
Sector of activity of the worker’s firm
Industry excluding construction D
Construction D
Retail D
Other activities D
Executive or entrepreneur as the reference
category D
Specific kind of the worker’s job
(occupation)
Intellectual or scientific occupation D
Technical position D
Office clerk D
Qualified occupation D
Craftsman, skilled worker or farmer D
Operator of industrial machinery D
Unskilled occupation D
Personal characteristics
Current job tenure N Months of the worker’s current job tenure
First job D The worker is new to the workforce
Fixed-term contract D The worker has a fixed-term contract
Female D The worker’s gender is female
Born in Italy D The worker’s birthplace is in Italy
Years of education N Years of education of the worker
Educational activities in the last four weeks D
The worker had engaged in educational
activities in the four weeks preceding the
interview
Age N Years of age of the worker
Unemployment rate N Unemployment rate of the worker’s region
Unionization index I # workers registered to CGIL, CISL and UIL
at the regional level/employed population
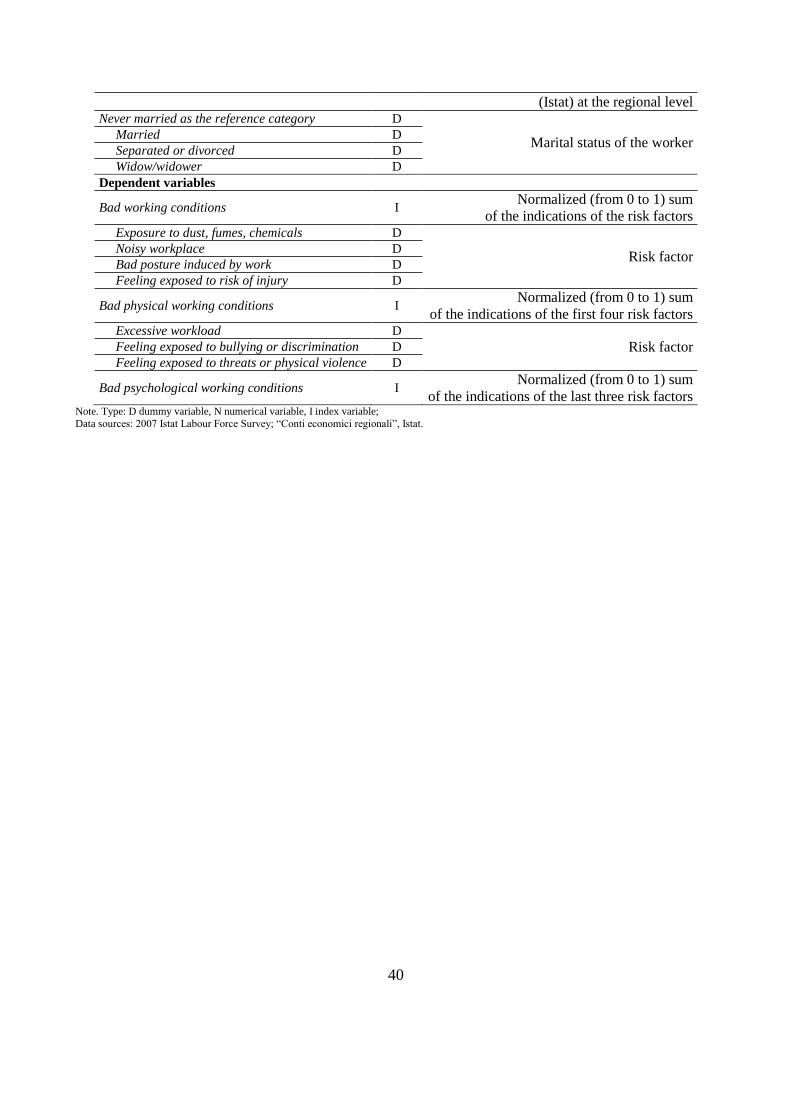
40
(Istat) at the regional level Never married as the reference category D
Marital status of the worker Married D
Separated or divorced D
Widow/widower D
Dependent variables
Bad working conditions I Normalized (from 0 to 1) sum
of the indications of the risk factors Exposure to dust, fumes, chemicals D
Risk factor Noisy workplace D
Bad posture induced by work D
Feeling exposed to risk of injury D
Bad physical working conditions I Normalized (from 0 to 1) sum
of the indications of the first four risk factors Excessive workload D
Risk factor Feeling exposed to bullying or discrimination D
Feeling exposed to threats or physical violence D
Bad psychological working conditions I Normalized (from 0 to 1) sum
of the indications of the last three risk factors Note. Type: D dummy variable, N numerical variable, I index variable;
Data sources: 2007 Istat Labour Force Survey; “Conti economici regionali”, Istat.
