the second national ballistics imaging comparison (nbic-2) · the nbic project aims to establish a...
TRANSCRIPT
Volume 119 (2014) http://dx.doi.org/10.6028/jres.119.028
Journal of Research of the National Institute of Standards and Technology
644
The Second National Ballistics Imaging
Comparison (NBIC-2)
T. V. Vorburger, J. Yen, J. F. Song, R. M. Thompson, T. B. Renegar, A. Zheng, M. Tong
National Institute of Standards and Technology,
Gaithersburg, MD 20899
and
M. Ols
Bureau of Alcohol, Tobacco, Firearms and Explosives (ATF),
Ammendale, MD 20705
[email protected] [email protected]
[email protected] [email protected]
[email protected] [email protected]
In response to the guidelines issued by the American Society of Crime Laboratory Directors/Laboratory Accreditation Board
(ASCLD/LAB-International) to establish traceability and quality assurance in U.S. crime laboratories, NIST and the ATF initiated a joint project, entitled the National Ballistics Imaging Comparison (NBIC). The NBIC project aims to establish a national traceability
and quality system for ballistics identifications in crime laboratories utilizing ATF’s National Integrated Ballistics Information
Network (NIBIN). The original NBIC was completed in 2010. In the second NBIC, NIST Standard Reference Material (SRM) 2461 Cartridge Cases were used as reference standards, and 14 experts from 11 U.S. crime laboratories each performed 17 image
acquisitions and correlations of the SRM cartridge cases over the course of about half a year. Resulting correlation scores were
collected by NIST for statistical analyses, from which control charts and control limits were developed for the proposed quality system and for promoting future assessments and accreditations for firearm evidence in U.S. forensic laboratories in accordance with the ISO
17025 Standard.
Key words: ballistics identification; forensic science; NBIC; NIBIN; standard bullet; standard cartridge case; standard reference
material.
Accepted: November 26, 2014
Published: January 8, 2015
http://dx.doi.org/10.6028/jres.119.028
1. Introduction
In the late 1990s, the National Integrated Ballistics Information Network (NIBIN), initially called the
Ceasefire Program, was established in the United States [1,2]. The NIBIN consists of about 150 data
acquisition stations for acquiring and reviewing fired cartridge cases and bullets submitted to federal, state,
and local crime labs during the course of criminal investigations. The NIBIN is supported and coordinated
by the Bureau of Alcohol, Tobacco, Firearms, and Explosives (ATF) and uses a technology known as the
Volume 119 (2014) http://dx.doi.org/10.6028/jres.119.028
Journal of Research of the National Institute of Standards and Technology
645 http://dx.doi.org/10.6028/jres.119.028
Integrated Ballistics Identification System (IBIS1) [3] manufactured by Forensic Technology Inc., now part
of Ultra Electronics. Each station consists of an automated optical microscope with special fixtures for
cartridge cases and bullets and an interface to a regional database of ballistics images, with the capability to
correlate automatically one’s own images with entries in the regional database using correlation software.
To establish measurement traceability and quality assurance in expectation of laboratory assessments using
the ISO 17025 standard [4], the National Institute of Standards and Technology (NIST) in collaboration
with the ATF developed Standard Reference Material (SRM) 2460 Bullets [5-7] and 2461 Cartridge Cases
[8]. NIST also developed profiling (2D) and areal (3D) measurement systems for surface topography [7,8]
as well as correlation software for quantifying the similarity of topography profiles and images using NIST
proposed correlation parameters [5].
In recognition of the guidelines [9] issued by the American Society of Crime Laboratory
Directors/Laboratory Accreditation Board (ASCLD/LAB-International) to establish traceability and quality
assurance in U.S. crime laboratories, NIST and ATF in cooperation with a number of crime laboratories
have recently completed two joint projects known as the National Ballistics Imaging Comparison (NBIC)
and NBIC-2. The aim of these projects is to establish a national traceability and quality system using the
SRM bullets and cartridge cases as check standards for NIBIN acquisitions and correlations. The physical
standards and established procedures can be used for detecting and exploring any quality problems that
may arise from operators’ acquisition procedures or from IBIS software and networks. Thirty one experts
and 18 U.S. crime laboratories participated in one or both of these projects. They each took a number of
acquisitions of NIST SRM 2460 Standard Bullets and 2461 Standard Cartridge Cases over the course of
about a year, and the acquired images were correlated with Golden Images at the National Laboratory
Center of ATF, from which control charts and control limits have been developed. These procedures will
enable the development of a traceability and quality system for NIBIN and U.S. crime laboratories in
expectation of assessments by ASCLD/LAB [9] and other organizations in accordance with the ISO 17025
Standard [4].
The original NBIC was completed in 2010 and is discussed in a previous paper [10]. The NBIC project
was carried out entirely on IBIS Heritage Model workstations. Since the completion of NBIC, Forensic
Technology, Inc. developed a new technology known as BRASSTRAX for acquisition of cartridge cases.
IBIS BRASSTRAX technology is designed to be interoperable with IBIS Heritage technology. All the
same, we initiated a new project known as NBIC-2 to test whether the procedures and conclusions reached
during the original NBIC project needed to be modified for stations running BRASSTRAX technology. In
this report we discuss the results for NBIC-2. Sections 2 to 5 include discussions of the NIST SRM
Standard Bullets and Cartridge Cases, the NIST 2D and 3D topography measurement system, and an
overview of the NBIC Project. In Secs. 6 to 8 we discuss results obtained from NBIC-2. In Sec. 9, we
discuss a proposed system for quality assurance of NIBIN acquisitions and correlations and include an
initial uncertainty estimate for certain NIBIN acquisitions.
2. Standard Reference Materials 2460 Standard Bullets and 2461 Standard
Cartridge Cases
The SRM 2460 Bullets and 2461 Cartridge Cases were developed as reference standards for crime
laboratories 1) to help verify that the computerized optical imaging equipment for bullets and cartridge
cases is operating properly and 2) to establish quality assurance and traceability in accordance with
ISO 17025 [4].
Units of SRM 2460 and 2461 are shown in Fig. 1. Thirty five units of SRM 2460 and 137 units of SRM
2461 (serial numbers ranging from 106 to 278 with some gaps in the numbering) were produced, measured,
certified, and made available. Each of these units is nominally identical to the other units, and optical
images of the key areas of the surfaces of one unit should be nearly identical to comparable images from all
1 Certain commercial equipment, instruments, or materials are identified in this paper to specify adequately the experimental
procedure. Such identification does not imply recommendation or endorsement by the National Institute of Standards and Technology, nor does it imply that the materials or equipment identified are necessarily the best available for the purpose.

Volume 119 (2014) http://dx.doi.org/10.6028/jres.119.028
Journal of Research of the National Institute of Standards and Technology
646 http://dx.doi.org/10.6028/jres.119.028
the other units, as well as to master images stored and maintained in the database by the ATF. These master
images are called “Golden Images.” The key areas of the bullet are the six land engraved areas (LEAs)
spaced around the bullet periphery. One of these LEAs is clearly shown in Fig. 1. The key areas of the
cartridge case are shown in Fig. 2. In order to protect the outer surface of the SRM cartridge case, the
diameter of the brass cylinder (about 12.7 mm) is made larger than the diameter of the cartridge case (about
9 mm). All these areas have been measured for topography at NIST, and their IBIS images have been
acquired at the ATF’s National Laboratory Center in Ammendale, MD. The fabrication methods for the
SRM Bullets and Cartridge Cases and the reproducibility of the individual units have been described
elsewhere [5,11].
Fig. 1. A SRM 2460 Standard Bullet (left) and a SRM 2461 Standard Cartridge Case (right). The red arrow indicates one of six land
engraved areas around the periphery of the standard bullet.
Fig. 2. Photograph of the base of a SRM 2461 standard cartridge case indicating the breech face impression (BF), firing pin
impression (FP), and ejector mark (EM).
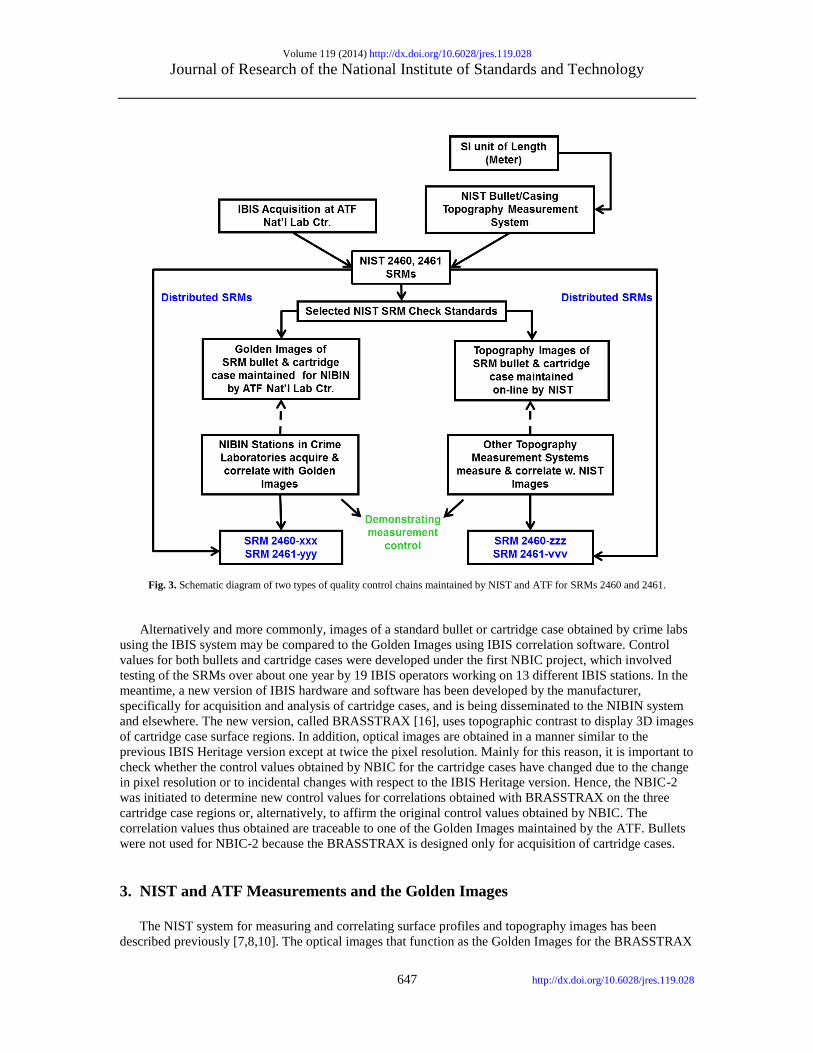
There are two ways to use these SRMs for quality control, as shown schematically in Fig. 3.
Topography profiles of the six LEAs on the SRM bullet masters and topography images of the three
regions on the casing masters are available on the Internet [12,13] and may be correlated by users to
topography profiles and images acquired on their own topography measurement systems. This enables
users in crime labs to demonstrate the accuracy of their systems for measuring topography of bullets or
cartridge cases and then estimating similarity between pairs of exhibits. Correlation coefficients determined
by NIST for these topography profiles and images are quoted on the certificates that accompany SRMs
2460 and 2461 [14,15].
Volume 119 (2014) http://dx.doi.org/10.6028/jres.119.028
Journal of Research of the National Institute of Standards and Technology
647 http://dx.doi.org/10.6028/jres.119.028
Fig. 3. Schematic diagram of two types of quality control chains maintained by NIST and ATF for SRMs 2460 and 2461.
Alternatively and more commonly, images of a standard bullet or cartridge case obtained by crime labs
using the IBIS system may be compared to the Golden Images using IBIS correlation software. Control
values for both bullets and cartridge cases were developed under the first NBIC project, which involved
testing of the SRMs over about one year by 19 IBIS operators working on 13 different IBIS stations. In the
meantime, a new version of IBIS hardware and software has been developed by the manufacturer,
specifically for acquisition and analysis of cartridge cases, and is being disseminated to the NIBIN system
and elsewhere. The new version, called BRASSTRAX [16], uses topographic contrast to display 3D images
of cartridge case surface regions. In addition, optical images are obtained in a manner similar to the
previous IBIS Heritage version except at twice the pixel resolution. Mainly for this reason, it is important to
check whether the control values obtained by NBIC for the cartridge cases have changed due to the change
in pixel resolution or to incidental changes with respect to the IBIS Heritage version. Hence, the NBIC-2
was initiated to determine new control values for correlations obtained with BRASSTRAX on the three
cartridge case regions or, alternatively, to affirm the original control values obtained by NBIC. The
correlation values thus obtained are traceable to one of the Golden Images maintained by the ATF. Bullets
were not used for NBIC-2 because the BRASSTRAX is designed only for acquisition of cartridge cases.
3. NIST and ATF Measurements and the Golden Images
The NIST system for measuring and correlating surface profiles and topography images has been
described previously [7,8,10]. The optical images that function as the Golden Images for the BRASSTRAX
Volume 119 (2014) http://dx.doi.org/10.6028/jres.119.028
Journal of Research of the National Institute of Standards and Technology
648 http://dx.doi.org/10.6028/jres.119.028
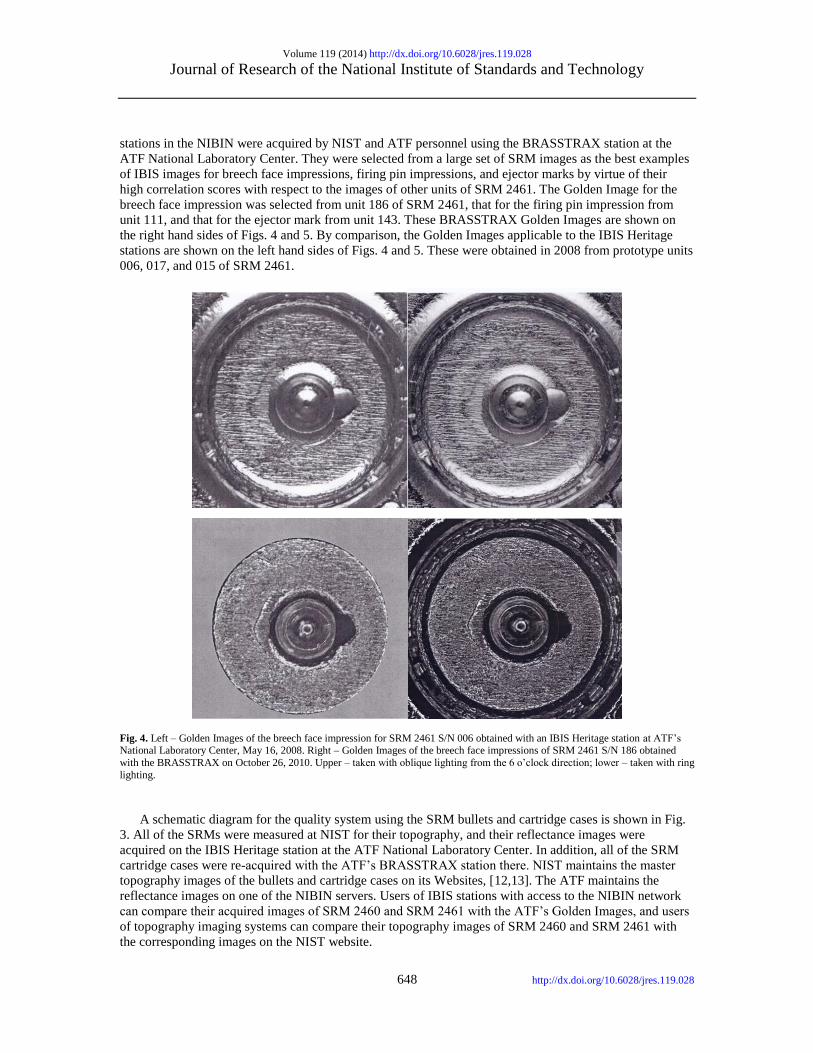
stations in the NIBIN were acquired by NIST and ATF personnel using the BRASSTRAX station at the
ATF National Laboratory Center. They were selected from a large set of SRM images as the best examples
of IBIS images for breech face impressions, firing pin impressions, and ejector marks by virtue of their
high correlation scores with respect to the images of other units of SRM 2461. The Golden Image for the
breech face impression was selected from unit 186 of SRM 2461, that for the firing pin impression from
unit 111, and that for the ejector mark from unit 143. These BRASSTRAX Golden Images are shown on
the right hand sides of Figs. 4 and 5. By comparison, the Golden Images applicable to the IBIS Heritage
stations are shown on the left hand sides of Figs. 4 and 5. These were obtained in 2008 from prototype units
006, 017, and 015 of SRM 2461.
Fig. 4. Left – Golden Images of the breech face impression for SRM 2461 S/N 006 obtained with an IBIS Heritage station at ATF’s National Laboratory Center, May 16, 2008. Right – Golden Images of the breech face impressions of SRM 2461 S/N 186 obtained
with the BRASSTRAX on October 26, 2010. Upper – taken with oblique lighting from the 6 o’clock direction; lower – taken with ring
lighting.
A schematic diagram for the quality system using the SRM bullets and cartridge cases is shown in Fig.
3. All of the SRMs were measured at NIST for their topography, and their reflectance images were
acquired on the IBIS Heritage station at the ATF National Laboratory Center. In addition, all of the SRM
cartridge cases were re-acquired with the ATF’s BRASSTRAX station there. NIST maintains the master
topography images of the bullets and cartridge cases on its Websites, [12,13]. The ATF maintains the
reflectance images on one of the NIBIN servers. Users of IBIS stations with access to the NIBIN network
can compare their acquired images of SRM 2460 and SRM 2461 with the ATF’s Golden Images, and users
of topography imaging systems can compare their topography images of SRM 2460 and SRM 2461 with
the corresponding images on the NIST website.

Volume 119 (2014) http://dx.doi.org/10.6028/jres.119.028
Journal of Research of the National Institute of Standards and Technology
649 http://dx.doi.org/10.6028/jres.119.028
Fig. 5. Left – Golden Images of the firing pin impression of SRM 2461 S/N 017 (top left) and ejector mark of SRM 2461 S/N 015
(bottom left) obtained with an IBIS Heritage station at ATF’s National Laboratory Center, May 16, 2008; Golden Images of the firing pin impression of S/N 111 (top right) and the ejector mark of S/N 143 (bottom right) with the BRASSTRAX-3D (right) on October
26, 2010.
Figure 6 shows a control chart for correlations of the images of the breech face impression of one unit
of SRM 2461 acquired during NBIC-2. The top line shows the correlation scores for IBIS BRASSTRAX
images with respect to the Golden Image obtained with the ATF’s BRASSTRAX station in Ammendale
MD. The scores are unitless numbers resulting from the proprietary correlation software of the
BRASSTRAX manufacturer, Forensic Technology, Inc. The higher the score, the stronger the correlation.
The bottom line represents the specified control limit of 217 for breech face (BF) scores, which was
calculated from the results of the NBIC-1 project. The middle line is a “dynamic control limit” (Dynamic
CL) based on the measured data, which has been proposed and used by NIST for measurement assurance of
surface calibrations [17]. The dynamic control chart will be further discussed in Sec. 6. Phase 1 on the chart
indicates a period of repeatability tests all acquired on the same day. Phase 2 represents a longer period of
testing over approximately 5 months.
As stated earlier, SRM cartridge case units 186, 111, and 143 were used to create the master Golden
Images at the ATF. After the topography measurements at NIST, all the SRM cartridge cases were acquired
at the National Laboratory Center of ATF using their BRASSTRAX station under standard operating
conditions [18]. A set of the best images with the highest correlation scores with respect to the other units
was selected as the set of Golden Images (see Figs. 4 and 5). By acquiring images of the SRM cartridge
cases at local and state IBIS sites, and correlating the images with the Golden Images, differences in IBIS
operating conditions between the local and state IBIS sites and the ATF National Laboratory Center can be
detected. This method, therefore, enables the images at local IBIS sites to be traceable to the Golden
Images of ATF’s National Laboratory Center. A similar approach was previously developed for SRM
bullets [10].

Volume 119 (2014) http://dx.doi.org/10.6028/jres.119.028
Journal of Research of the National Institute of Standards and Technology
650 http://dx.doi.org/10.6028/jres.119.028
Fig. 6. Example of a control chart generated during NBIC-2. Both a fixed control limit and a dynamic control limit are plotted along
with a time series of breech face correlation scores.
4. The National Ballistics Imaging Comparison (NBIC) Projects
The project goal for both NBIC projects is to establish a quality system for ballistics signature
correlations in U.S. crime laboratories within the NIBIN. The original NBIC project was focused on the
IBIS Heritage model system, the most widely used at NIBIN sites. Both SRM 2460 bullets and 2461
cartridge cases were used as the reference standards. By repeating tests of the SRM bullets and cartridge
cases at local and state IBIS sites, and correlating the images with the Golden Images established at the
ATF, control charts and control limits were developed for quality assurance of ballistics acquisitions and
correlations in NIBIN. Use of these procedures enable the development of a traceability and quality system
for NIBIN and U.S. crime laboratories for use in assessments by ASCLD/LAB [9] and other organizations
in accordance with the ISO 17025 Standard [4]. This system can also be used for detecting and exploring
any quality problems arising from operators’ acquisition procedures, IBIS stations and correlation servers,
as well as from the SRM standards themselves.
The protocol called for 24 acquisitions of both a SRM bullet and a cartridge case for each participant
over the course of about a year. The correlation scores were entered on a spreadsheet designed by NIST for
statistical analyses, from which control charts and control limits were developed for the proposed
traceability and quality system. Nineteen ballistics examiners from 13 IBIS sites participated in this project
from July 2008 to March 2010. After statistical analysis, draft control charts and control limits were
developed for the proposed quality system. A report on the NBIC Project was published in 2012 [10].
5. The Second National Ballistics Imaging Comparison Project (NBIC-2)
The original NBIC project was performed using IBIS Heritage stations. Subsequently a new technology
was introduced known as BRASSTRAX. The new technology was targeted for improved quality and
manipulation of cartridge case images and, among other features, included a system upgrade, a camera with
double the pixel resolution of the IBIS Heritage, and the capability to create topography images of cartridge
case surfaces that could be viewed from different directions. The principal mode of correlation, like IBIS
Heritage, was still based on the 2D reflectance images. We, therefore, initiated the NBIC-2 project to
determine whether the control limits developed for NBIC should be adjusted, mainly due to the system
upgrade and the improved camera resolution.
Volume 119 (2014) http://dx.doi.org/10.6028/jres.119.028
Journal of Research of the National Institute of Standards and Technology
651 http://dx.doi.org/10.6028/jres.119.028
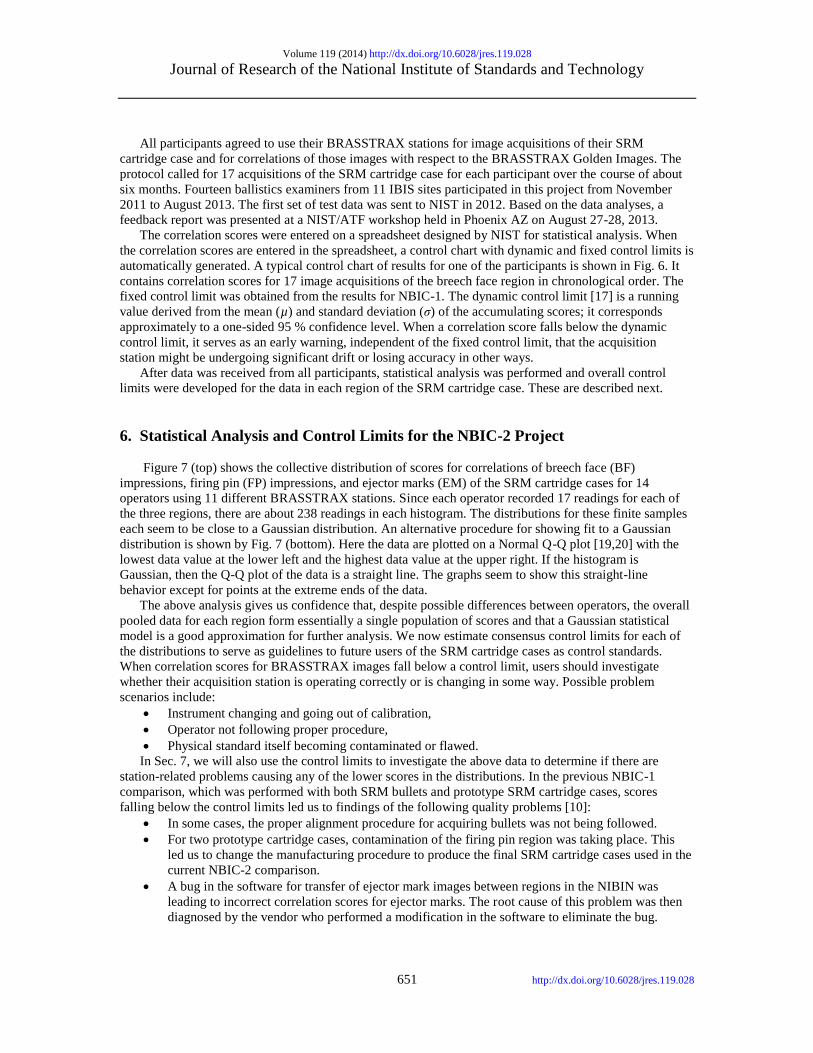
All participants agreed to use their BRASSTRAX stations for image acquisitions of their SRM
cartridge case and for correlations of those images with respect to the BRASSTRAX Golden Images. The
protocol called for 17 acquisitions of the SRM cartridge case for each participant over the course of about
six months. Fourteen ballistics examiners from 11 IBIS sites participated in this project from November
2011 to August 2013. The first set of test data was sent to NIST in 2012. Based on the data analyses, a
feedback report was presented at a NIST/ATF workshop held in Phoenix AZ on August 27-28, 2013.
The correlation scores were entered on a spreadsheet designed by NIST for statistical analysis. When
the correlation scores are entered in the spreadsheet, a control chart with dynamic and fixed control limits is
automatically generated. A typical control chart of results for one of the participants is shown in Fig. 6. It
contains correlation scores for 17 image acquisitions of the breech face region in chronological order. The
fixed control limit was obtained from the results for NBIC-1. The dynamic control limit [17] is a running
value derived from the mean (µ) and standard deviation (σ) of the accumulating scores; it corresponds
approximately to a one-sided 95 % confidence level. When a correlation score falls below the dynamic
control limit, it serves as an early warning, independent of the fixed control limit, that the acquisition
station might be undergoing significant drift or losing accuracy in other ways.
After data was received from all participants, statistical analysis was performed and overall control
limits were developed for the data in each region of the SRM cartridge case. These are described next.
6. Statistical Analysis and Control Limits for the NBIC-2 Project
Figure 7 (top) shows the collective distribution of scores for correlations of breech face (BF)
impressions, firing pin (FP) impressions, and ejector marks (EM) of the SRM cartridge cases for 14
operators using 11 different BRASSTRAX stations. Since each operator recorded 17 readings for each of
the three regions, there are about 238 readings in each histogram. The distributions for these finite samples
each seem to be close to a Gaussian distribution. An alternative procedure for showing fit to a Gaussian
distribution is shown by Fig. 7 (bottom). Here the data are plotted on a Normal Q-Q plot [19,20] with the
lowest data value at the lower left and the highest data value at the upper right. If the histogram is
Gaussian, then the Q-Q plot of the data is a straight line. The graphs seem to show this straight-line
behavior except for points at the extreme ends of the data.
The above analysis gives us confidence that, despite possible differences between operators, the overall
pooled data for each region form essentially a single population of scores and that a Gaussian statistical
model is a good approximation for further analysis. We now estimate consensus control limits for each of
the distributions to serve as guidelines to future users of the SRM cartridge cases as control standards.
When correlation scores for BRASSTRAX images fall below a control limit, users should investigate
whether their acquisition station is operating correctly or is changing in some way. Possible problem
scenarios include:
Instrument changing and going out of calibration,
Operator not following proper procedure,
Physical standard itself becoming contaminated or flawed.
In Sec. 7, we will also use the control limits to investigate the above data to determine if there are
station-related problems causing any of the lower scores in the distributions. In the previous NBIC-1
comparison, which was performed with both SRM bullets and prototype SRM cartridge cases, scores
falling below the control limits led us to findings of the following quality problems [10]:
In some cases, the proper alignment procedure for acquiring bullets was not being followed.
For two prototype cartridge cases, contamination of the firing pin region was taking place. This
led us to change the manufacturing procedure to produce the final SRM cartridge cases used in the
current NBIC-2 comparison.
A bug in the software for transfer of ejector mark images between regions in the NIBIN was
leading to incorrect correlation scores for ejector marks. The root cause of this problem was then
diagnosed by the vendor who performed a modification in the software to eliminate the bug.

Volume 119 (2014) http://dx.doi.org/10.6028/jres.119.028
Journal of Research of the National Institute of Standards and Technology
652 http://dx.doi.org/10.6028/jres.119.028
Fig. 7. (Top) the collective distribution of BRASSTRAX correlation scores vs. their NIST/ATF Golden Images for 14 examiners for
breech face (BF), firing pin (FP), and ejector mark (EM). (Bottom) Q-Q plots [19,20] for the same data. The correlations were
performed with respect to the BRASSTRAX Golden Images (see right sides of Figs. 4 and 5) housed in the Region 6 Server of the NIBIN at the ATF National Laboratory Center, Ammendale, MD.
To establish the control limits we only used the data taken during Phase 2, the relatively long term part
of the investigation, not the shorter term Phase 1 data. The length of time over which the Phase 2 data were
taken is comparable to the length of time envisioned for a potential user’s control chart, whereas the Phase
1 data were taken over a much shorter time period. Therefore, we expect that the Phase 2 data would show
statistical variability more comparable to that of a control chart than the Phase 1 data. Furthermore, the
Phase 1 data could show initial short term trends not present in the Phase 2 data as the operators became
accustomed to the acquisition procedure for the SRM cartridge cases. Both characteristics make Phase 1
data less relevant than the Phase 2 data for determining control limits in future control charts.
We also did not use data from Phase 2 that fell below the apparent straight lines on the Q-Q plots.
These points were considered to be outliers from their respective populations and were investigated further
for possible quality issues. The points that were discarded this way include one point from the breech face
region and three points from the firing pin region. The images associated with these points will be
discussed later in Sec. 7.
The remaining data used to establish the control limits are plotted in Fig. 8. Assuming that the
distributions of scores are Gaussian for each of the regions, a one sided control limit (CL), which controls
the low values only, with a 95 % confidence level was calculated as
CL = (µ − 1.645 σ), (1)

Volume 119 (2014) http://dx.doi.org/10.6028/jres.119.028
Journal of Research of the National Institute of Standards and Technology
653 http://dx.doi.org/10.6028/jres.119.028
Fig. 8. (Top) the collective distribution of BRASSTRAX correlation scores for images of SRM 2461 units obtained by 14 examiners for breech face (BF), firing pin (FP) and ejector mark (EM). (Bottom) Q-Q plots for the same data. The correlations were performed
with respect to the BRASSTRAX Golden Images (right sides of Figs. 4 and 5) housed in the Region 6 Server of the NIBIN at the ATF
National Laboratory Center, Ammendale, MD. The data plotted exclude data in Fig. 7 from Phase 1 and data judged to be outliers.
where µ and σ represent the collective mean and standard deviation, respectively. The factor 1.645 is the t-
factor for a Gaussian distribution corresponding to a one sided 95 % confidence level for the control of low
IBIS scores.
Table 1 shows the control limits for correlation scores obtained from the Phase 2 images of all three
cartridge case regions obtained with BRASSTRAX. The right hand column shows the control limits
obtained earlier during NBIC-1 using the IBIS Heritage acquisition stations. Table 1 shows slightly higher
control limits in NBIC-2 for the breech face and ejector mark regions; the difference between the two
control limits amounts to less than one standard deviation. However, the control limit from NBIC-2 for the
firing pin region is higher than that for NBIC-1 by more than two standard deviations.
Table 1. Control limits for breech face, firing pin and ejector mark BRASSTRAX correlation scores of SRM cartridge cases with a one sided 95 % confidence level. The values are unitless.
Mean Standard deviation
95 % Lower control limit
Control limit from NBIC-1
Breech face 329 53 243 221
Firing pin 344 44 273 171
Ejector mark 1476 562 552 400
Volume 119 (2014) http://dx.doi.org/10.6028/jres.119.028
Journal of Research of the National Institute of Standards and Technology
654 http://dx.doi.org/10.6028/jres.119.028
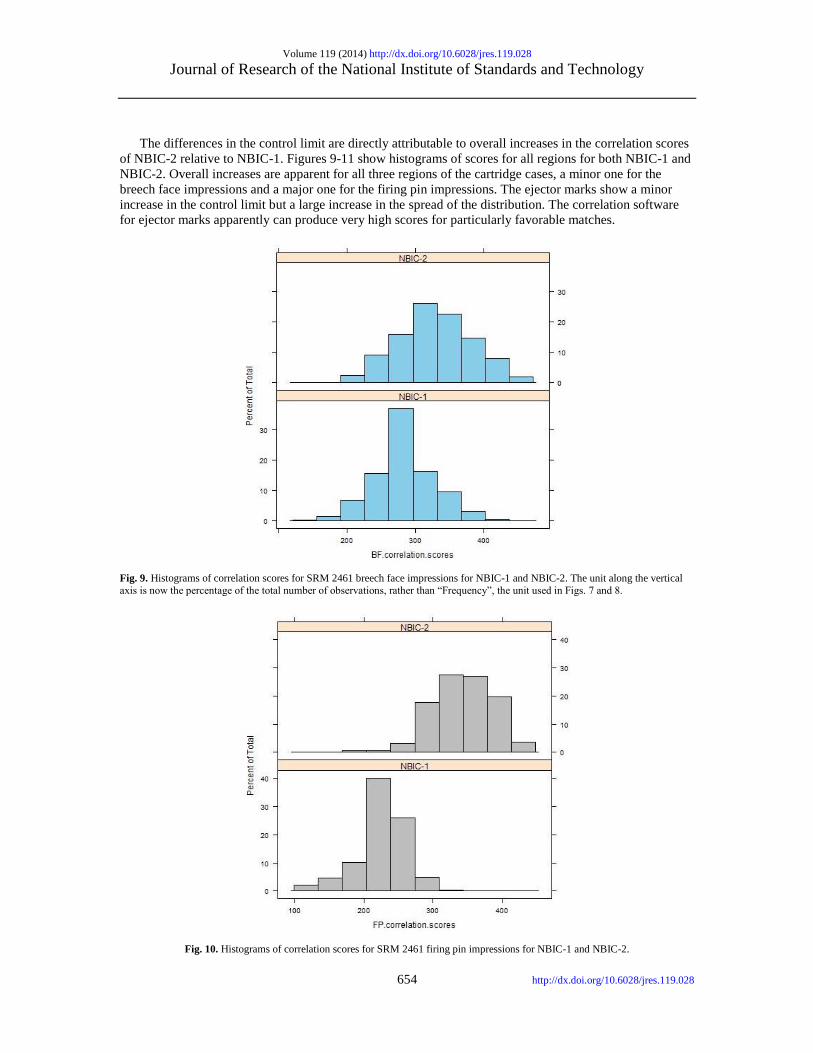
The differences in the control limit are directly attributable to overall increases in the correlation scores
of NBIC-2 relative to NBIC-1. Figures 9-11 show histograms of scores for all regions for both NBIC-1 and
NBIC-2. Overall increases are apparent for all three regions of the cartridge cases, a minor one for the
breech face impressions and a major one for the firing pin impressions. The ejector marks show a minor
increase in the control limit but a large increase in the spread of the distribution. The correlation software
for ejector marks apparently can produce very high scores for particularly favorable matches.
Fig. 9. Histograms of correlation scores for SRM 2461 breech face impressions for NBIC-1 and NBIC-2. The unit along the vertical
axis is now the percentage of the total number of observations, rather than “Frequency”, the unit used in Figs. 7 and 8.
Fig. 10. Histograms of correlation scores for SRM 2461 firing pin impressions for NBIC-1 and NBIC-2.
Volume 119 (2014) http://dx.doi.org/10.6028/jres.119.028
Journal of Research of the National Institute of Standards and Technology
655 http://dx.doi.org/10.6028/jres.119.028
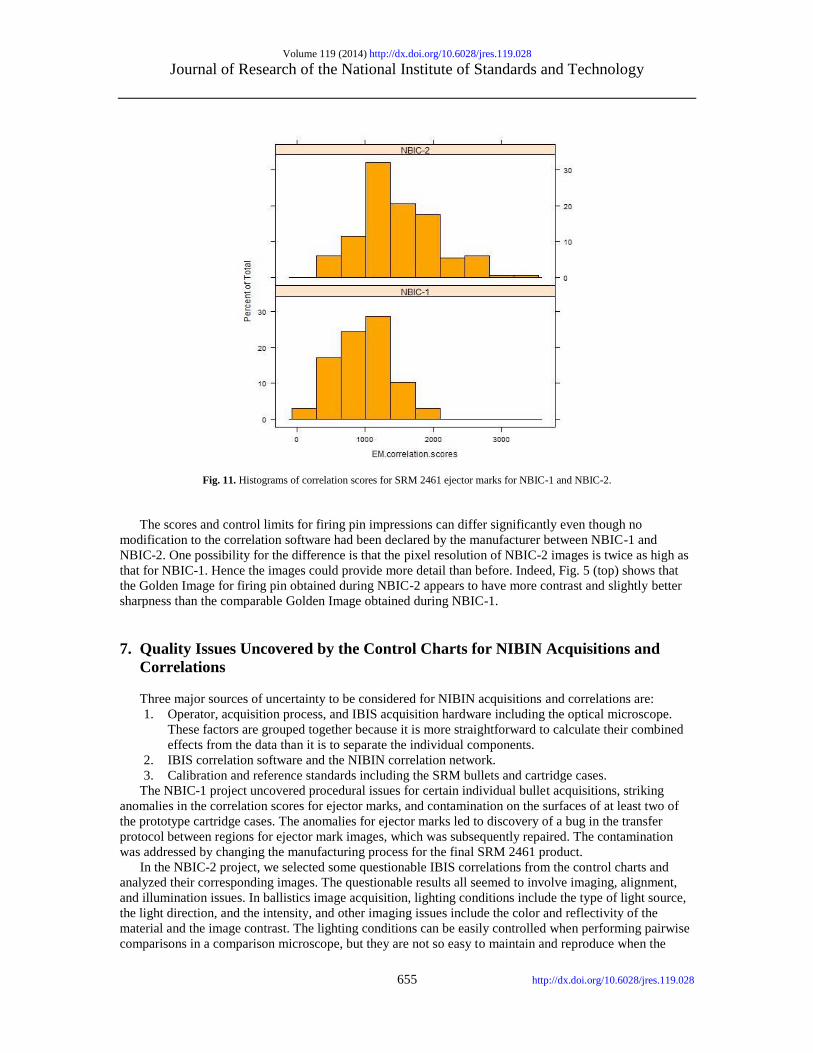
Fig. 11. Histograms of correlation scores for SRM 2461 ejector marks for NBIC-1 and NBIC-2.
The scores and control limits for firing pin impressions can differ significantly even though no
modification to the correlation software had been declared by the manufacturer between NBIC-1 and
NBIC-2. One possibility for the difference is that the pixel resolution of NBIC-2 images is twice as high as
that for NBIC-1. Hence the images could provide more detail than before. Indeed, Fig. 5 (top) shows that
the Golden Image for firing pin obtained during NBIC-2 appears to have more contrast and slightly better
sharpness than the comparable Golden Image obtained during NBIC-1.
7. Quality Issues Uncovered by the Control Charts for NIBIN Acquisitions and
Correlations
Three major sources of uncertainty to be considered for NIBIN acquisitions and correlations are:
1. Operator, acquisition process, and IBIS acquisition hardware including the optical microscope.
These factors are grouped together because it is more straightforward to calculate their combined
effects from the data than it is to separate the individual components.
2. IBIS correlation software and the NIBIN correlation network.
3. Calibration and reference standards including the SRM bullets and cartridge cases.
The NBIC-1 project uncovered procedural issues for certain individual bullet acquisitions, striking
anomalies in the correlation scores for ejector marks, and contamination on the surfaces of at least two of
the prototype cartridge cases. The anomalies for ejector marks led to discovery of a bug in the transfer
protocol between regions for ejector mark images, which was subsequently repaired. The contamination
was addressed by changing the manufacturing process for the final SRM 2461 product.
In the NBIC-2 project, we selected some questionable IBIS correlations from the control charts and
analyzed their corresponding images. The questionable results all seemed to involve imaging, alignment,
and illumination issues. In ballistics image acquisition, lighting conditions include the type of light source,
the light direction, and the intensity, and other imaging issues include the color and reflectivity of the
material and the image contrast. The lighting conditions can be easily controlled when performing pairwise
comparisons in a comparison microscope, but they are not so easy to maintain and reproduce when the

Volume 119 (2014) http://dx.doi.org/10.6028/jres.119.028
Journal of Research of the National Institute of Standards and Technology
656 http://dx.doi.org/10.6028/jres.119.028
images are acquired individually on an automated acquisition station. These issues have a significant effect
on imaging quality and correlation scores, and should be standardized and well controlled. Even for the
standardized, automated lighting conditions used in the IBIS microscopes [18], variations caused by the
measurement setup and acquisition process may significantly affect signature acquisitions and correlations.
Although the questionable results are ascribed to lighting conditions, in all but one case our diagnoses have
stopped short of locating a root cause.
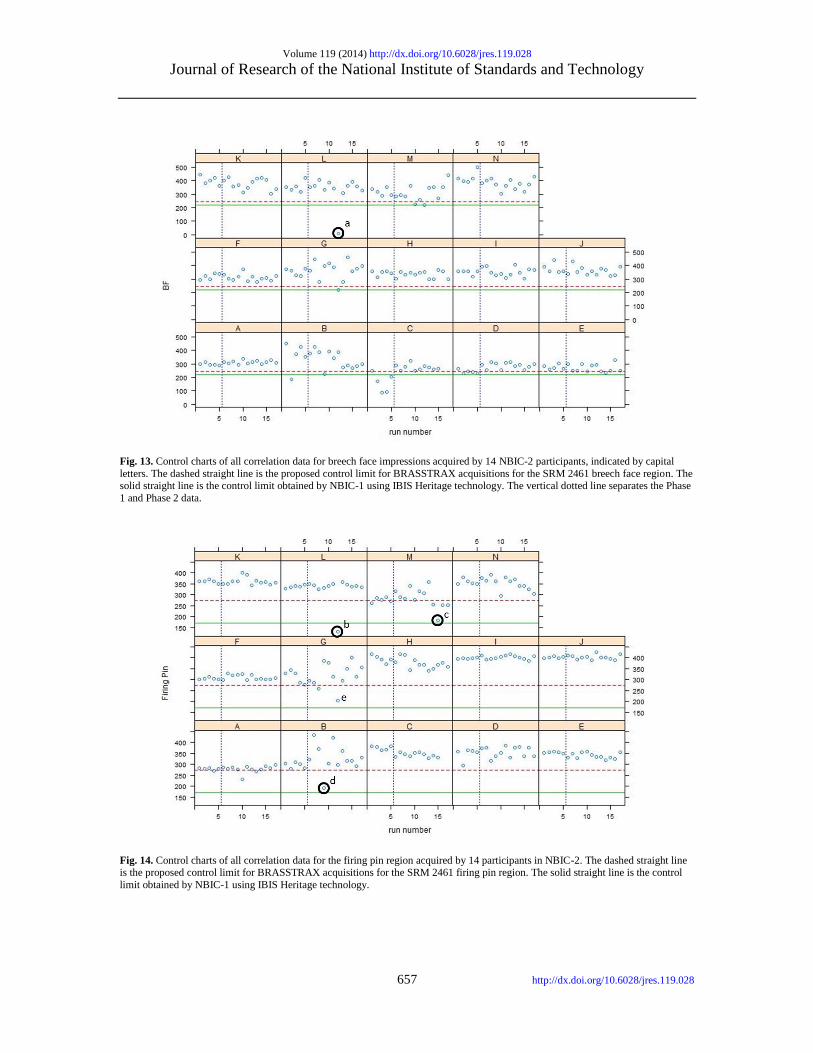
Q-Q plots for all Phase 2 data are shown in Fig. 12 and control charts for all 14 participants are shown
in Figs. 13-15. The NBIC-1 and NBIC-2 control limits are also shown. The data points in Phase 2 that were
not plotted in Fig. 8, because they seemed to fall below straight lines in the Q-Q plots, are highlighted by
circles and labelled a-d. These points were investigated by inspecting the acquired images to determine if
there were flaws in the images arising from problems with the acquisitions. In addition, points in Figs. 12,
14, and 15 labelled e and f were also investigated. Although point e looks fairly low on the Q-Q plot of Fig.
12, we included it in the control-limit analysis because that data point seems fairly consistent with the other
data points in the specific Q-Q plot for that station and operator, shown in Fig. 16.
Fig. 12. Q-Q plots for Phase 2 data of NBIC-2. The circled points (a,b,c,d) were not included in the populations used to calculate the
control limits and are not shown in Fig. 8. Images for the points e, f are also discussed here.
Volume 119 (2014) http://dx.doi.org/10.6028/jres.119.028
Journal of Research of the National Institute of Standards and Technology
657 http://dx.doi.org/10.6028/jres.119.028
Fig. 13. Control charts of all correlation data for breech face impressions acquired by 14 NBIC-2 participants, indicated by capital
letters. The dashed straight line is the proposed control limit for BRASSTRAX acquisitions for the SRM 2461 breech face region. The solid straight line is the control limit obtained by NBIC-1 using IBIS Heritage technology. The vertical dotted line separates the Phase
1 and Phase 2 data.
Fig. 14. Control charts of all correlation data for the firing pin region acquired by 14 participants in NBIC-2. The dashed straight line is the proposed control limit for BRASSTRAX acquisitions for the SRM 2461 firing pin region. The solid straight line is the control
limit obtained by NBIC-1 using IBIS Heritage technology.

Volume 119 (2014) http://dx.doi.org/10.6028/jres.119.028
Journal of Research of the National Institute of Standards and Technology
658 http://dx.doi.org/10.6028/jres.119.028
Fig. 15. Control charts of all correlation data for the ejector mark region acquired by 14 participants in NBIC-2. The dashed straight
line is the proposed control limit for BRASSTRAX acquisitions for the SRM 2461 ejector mark region. The solid straight line is the
control limit obtained by NBIC-1 using IBIS Heritage technology.
Fig. 16. Q-Q plot for the Phase 2 data for Station G in the NBIC-2 study.
Volume 119 (2014) http://dx.doi.org/10.6028/jres.119.028
Journal of Research of the National Institute of Standards and Technology
659 http://dx.doi.org/10.6028/jres.119.028
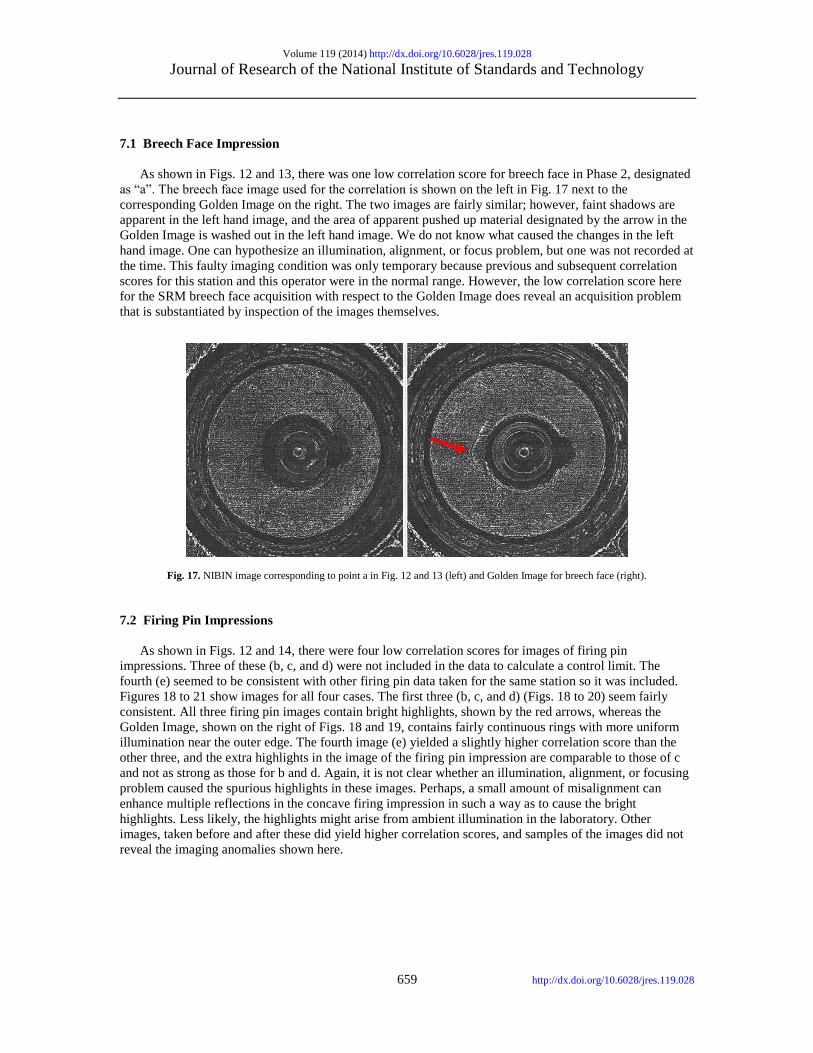
7.1 Breech Face Impression
As shown in Figs. 12 and 13, there was one low correlation score for breech face in Phase 2, designated
as “a”. The breech face image used for the correlation is shown on the left in Fig. 17 next to the
corresponding Golden Image on the right. The two images are fairly similar; however, faint shadows are
apparent in the left hand image, and the area of apparent pushed up material designated by the arrow in the
Golden Image is washed out in the left hand image. We do not know what caused the changes in the left
hand image. One can hypothesize an illumination, alignment, or focus problem, but one was not recorded at
the time. This faulty imaging condition was only temporary because previous and subsequent correlation
scores for this station and this operator were in the normal range. However, the low correlation score here
for the SRM breech face acquisition with respect to the Golden Image does reveal an acquisition problem
that is substantiated by inspection of the images themselves.
Fig. 17. NIBIN image corresponding to point a in Fig. 12 and 13 (left) and Golden Image for breech face (right).
7.2 Firing Pin Impressions
As shown in Figs. 12 and 14, there were four low correlation scores for images of firing pin
impressions. Three of these (b, c, and d) were not included in the data to calculate a control limit. The
fourth (e) seemed to be consistent with other firing pin data taken for the same station so it was included.
Figures 18 to 21 show images for all four cases. The first three (b, c, and d) (Figs. 18 to 20) seem fairly
consistent. All three firing pin images contain bright highlights, shown by the red arrows, whereas the
Golden Image, shown on the right of Figs. 18 and 19, contains fairly continuous rings with more uniform
illumination near the outer edge. The fourth image (e) yielded a slightly higher correlation score than the
other three, and the extra highlights in the image of the firing pin impression are comparable to those of c
and not as strong as those for b and d. Again, it is not clear whether an illumination, alignment, or focusing
problem caused the spurious highlights in these images. Perhaps, a small amount of misalignment can
enhance multiple reflections in the concave firing impression in such a way as to cause the bright
highlights. Less likely, the highlights might arise from ambient illumination in the laboratory. Other
images, taken before and after these did yield higher correlation scores, and samples of the images did not
reveal the imaging anomalies shown here.

Volume 119 (2014) http://dx.doi.org/10.6028/jres.119.028
Journal of Research of the National Institute of Standards and Technology
660 http://dx.doi.org/10.6028/jres.119.028
Fig. 18. NIBIN image (left) corresponding to point b in Fig. 12 and 14 and Golden Image for firing pin (right).
Fig. 19. NIBIN image (left) corresponding to point c in Fig. 12 and 14 and Golden Image for firing pin (right).
Fig. 20. NIBIN image (right) corresponding to point d in Figs. 12 and 14 and a second image (left) obtained by the same operator on a different day that yielded a high correlation score when compared to the Golden Image for firing pin (Fig. 19, right).
Volume 119 (2014) http://dx.doi.org/10.6028/jres.119.028
Journal of Research of the National Institute of Standards and Technology
661 http://dx.doi.org/10.6028/jres.119.028
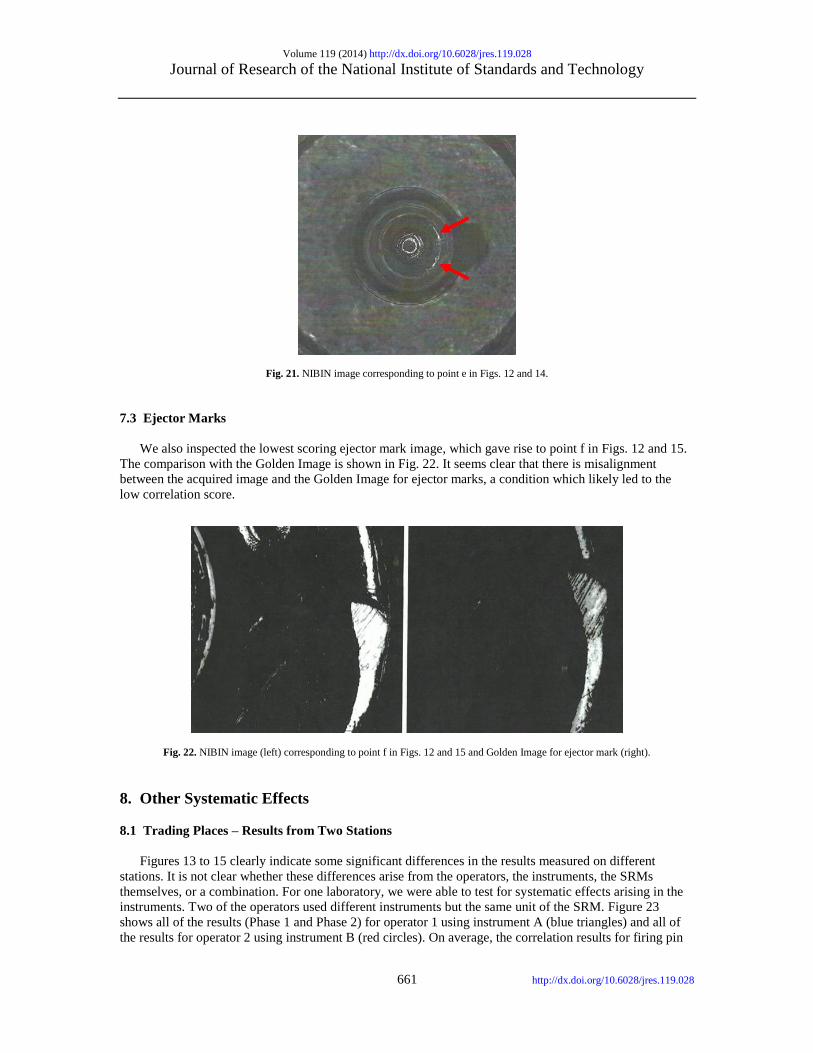
Fig. 21. NIBIN image corresponding to point e in Figs. 12 and 14.
7.3 Ejector Marks
We also inspected the lowest scoring ejector mark image, which gave rise to point f in Figs. 12 and 15.
The comparison with the Golden Image is shown in Fig. 22. It seems clear that there is misalignment
between the acquired image and the Golden Image for ejector marks, a condition which likely led to the
low correlation score.
Fig. 22. NIBIN image (left) corresponding to point f in Figs. 12 and 15 and Golden Image for ejector mark (right).
8. Other Systematic Effects
8.1 Trading Places – Results from Two Stations
Figures 13 to 15 clearly indicate some significant differences in the results measured on different
stations. It is not clear whether these differences arise from the operators, the instruments, the SRMs
themselves, or a combination. For one laboratory, we were able to test for systematic effects arising in the
instruments. Two of the operators used different instruments but the same unit of the SRM. Figure 23
shows all of the results (Phase 1 and Phase 2) for operator 1 using instrument A (blue triangles) and all of
the results for operator 2 using instrument B (red circles). On average, the correlation results for firing pin
Volume 119 (2014) http://dx.doi.org/10.6028/jres.119.028
Journal of Research of the National Institute of Standards and Technology
662 http://dx.doi.org/10.6028/jres.119.028
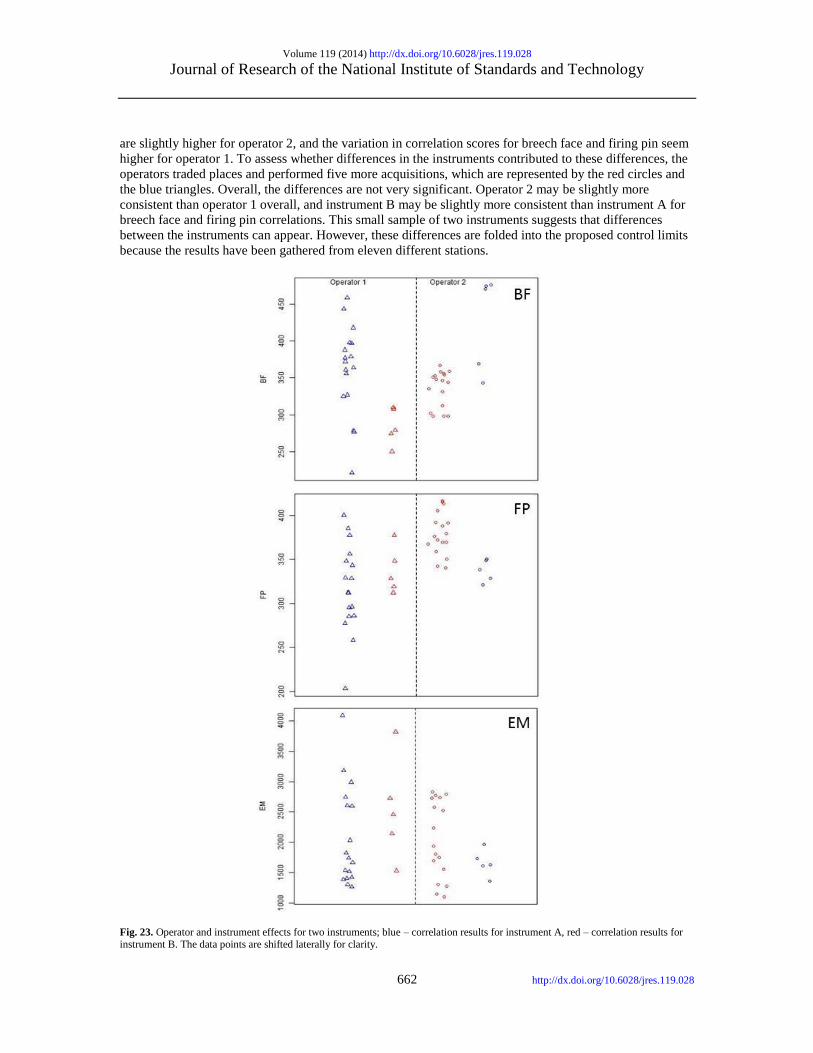
are slightly higher for operator 2, and the variation in correlation scores for breech face and firing pin seem
higher for operator 1. To assess whether differences in the instruments contributed to these differences, the
operators traded places and performed five more acquisitions, which are represented by the red circles and
the blue triangles. Overall, the differences are not very significant. Operator 2 may be slightly more
consistent than operator 1 overall, and instrument B may be slightly more consistent than instrument A for
breech face and firing pin correlations. This small sample of two instruments suggests that differences
between the instruments can appear. However, these differences are folded into the proposed control limits
because the results have been gathered from eleven different stations.
Fig. 23. Operator and instrument effects for two instruments; blue – correlation results for instrument A, red – correlation results for instrument B. The data points are shifted laterally for clarity.
Volume 119 (2014) http://dx.doi.org/10.6028/jres.119.028
Journal of Research of the National Institute of Standards and Technology
663 http://dx.doi.org/10.6028/jres.119.028
8.2 New versus Old Golden Images
The main question to explore for NBIC-2 was whether the control limits for BRASSTRAX stations
should be changed from the control limits found for the IBIS Heritage stations during NBIC-1. We found
(Table 1) that a relatively insignificant increase in the control limits for breech face and ejector mark is
recommended for BRASSTRAX stations, but a significant increase in the control limit for firing pin is
recommended, amounting to more than two standard deviations of the NBIC-2 data. We seek to learn the
principal source of the difference between IBIS Heritage and BRASSTRAX technology, given that the
correlation software version is the same for both and the images of both system versions are interoperable,
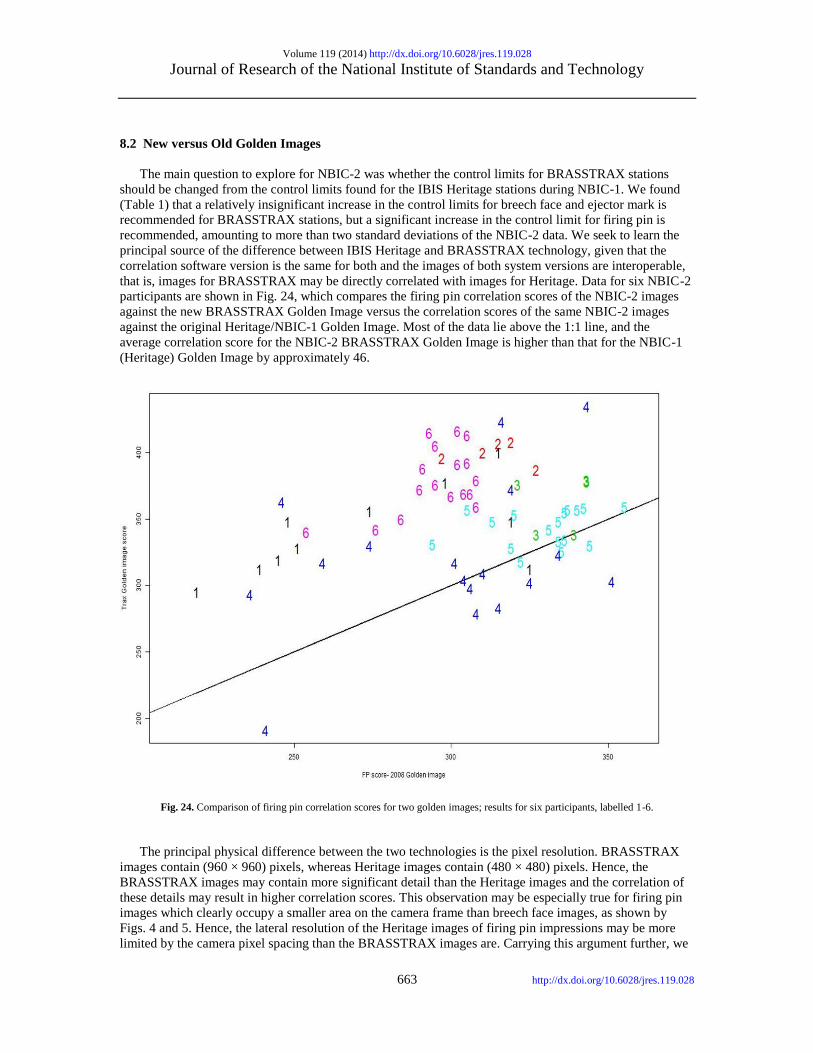
that is, images for BRASSTRAX may be directly correlated with images for Heritage. Data for six NBIC-2
participants are shown in Fig. 24, which compares the firing pin correlation scores of the NBIC-2 images
against the new BRASSTRAX Golden Image versus the correlation scores of the same NBIC-2 images
against the original Heritage/NBIC-1 Golden Image. Most of the data lie above the 1:1 line, and the
average correlation score for the NBIC-2 BRASSTRAX Golden Image is higher than that for the NBIC-1
(Heritage) Golden Image by approximately 46.
Fig. 24. Comparison of firing pin correlation scores for two golden images; results for six participants, labelled 1-6.
The principal physical difference between the two technologies is the pixel resolution. BRASSTRAX
images contain (960 × 960) pixels, whereas Heritage images contain (480 × 480) pixels. Hence, the
BRASSTRAX images may contain more significant detail than the Heritage images and the correlation of
these details may result in higher correlation scores. This observation may be especially true for firing pin
images which clearly occupy a smaller area on the camera frame than breech face images, as shown by
Figs. 4 and 5. Hence, the lateral resolution of the Heritage images of firing pin impressions may be more
limited by the camera pixel spacing than the BRASSTRAX images are. Carrying this argument further, we
Volume 119 (2014) http://dx.doi.org/10.6028/jres.119.028
Journal of Research of the National Institute of Standards and Technology
664 http://dx.doi.org/10.6028/jres.119.028
expect that the correlation of Heritage images with the BRASSTRAX Golden Image would score about the
same as the correlation of BRASSTRAX images with the Heritage Golden Image and that the correlation
of Heritage Images with the Heritage Golden Image should score even lower than those.
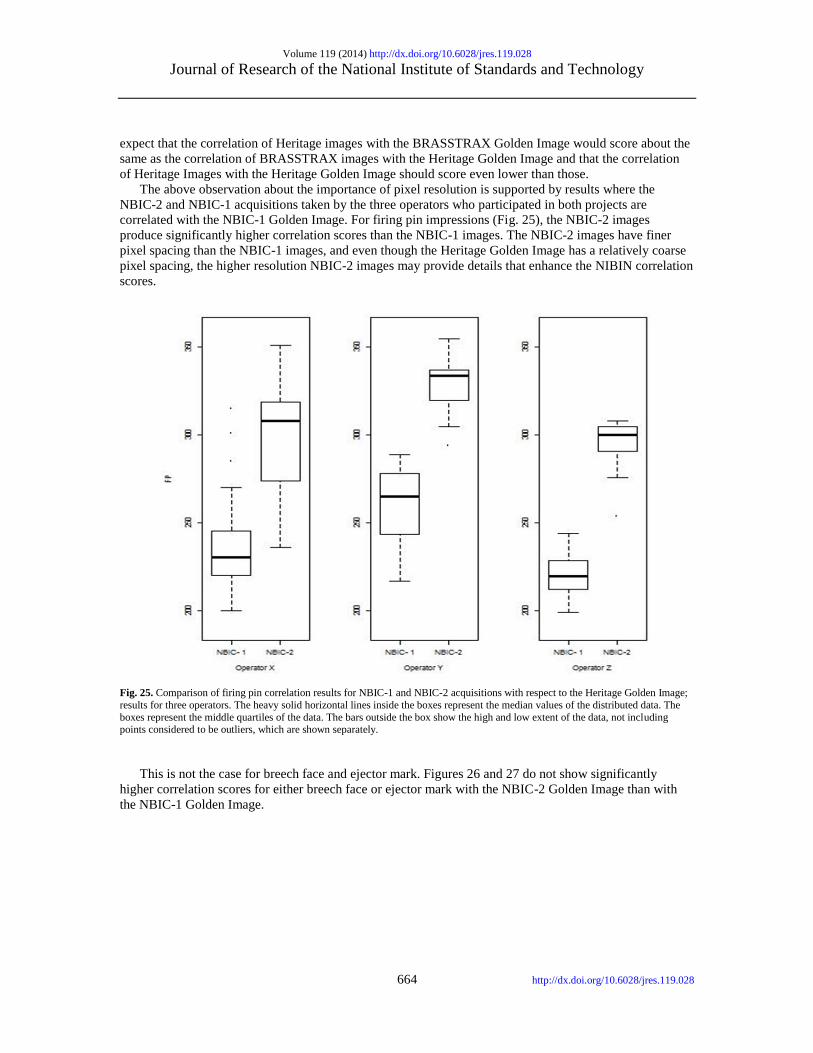
The above observation about the importance of pixel resolution is supported by results where the
NBIC-2 and NBIC-1 acquisitions taken by the three operators who participated in both projects are
correlated with the NBIC-1 Golden Image. For firing pin impressions (Fig. 25), the NBIC-2 images
produce significantly higher correlation scores than the NBIC-1 images. The NBIC-2 images have finer
pixel spacing than the NBIC-1 images, and even though the Heritage Golden Image has a relatively coarse
pixel spacing, the higher resolution NBIC-2 images may provide details that enhance the NIBIN correlation
scores.
Fig. 25. Comparison of firing pin correlation results for NBIC-1 and NBIC-2 acquisitions with respect to the Heritage Golden Image;
results for three operators. The heavy solid horizontal lines inside the boxes represent the median values of the distributed data. The
boxes represent the middle quartiles of the data. The bars outside the box show the high and low extent of the data, not including points considered to be outliers, which are shown separately.
This is not the case for breech face and ejector mark. Figures 26 and 27 do not show significantly
higher correlation scores for either breech face or ejector mark with the NBIC-2 Golden Image than with
the NBIC-1 Golden Image.

Volume 119 (2014) http://dx.doi.org/10.6028/jres.119.028
Journal of Research of the National Institute of Standards and Technology
665 http://dx.doi.org/10.6028/jres.119.028
Fig. 26. Comparison of breech face correlation results for NBIC-1 and NBIC-2 acquisitions with respect to the Heritage Golden
Image; results for three operators.
Fig. 27. Comparison of Ejector Mark Correlation Results for NBIC-1 and NBIC-2 acquisitions with respect to the Heritage Golden
Image; results for three operators.
Volume 119 (2014) http://dx.doi.org/10.6028/jres.119.028
Journal of Research of the National Institute of Standards and Technology
666 http://dx.doi.org/10.6028/jres.119.028
9. Measurement Procedure and Quality System for Cartridge Case Correlations
9.1 A Proposed Uncertainty Budget for Correlations of Breech Face and Firing Pin
Having discussed quality control issues for NIBIN stations, we come to the issue of the correlation
scores themselves. On the one hand, the proprietary correlation software supplied to NIBIN by Ultra
Electronics Forensic Technology is intended to yield only an ordered list of possible matches of images in
the database to a subject cartridge case or bullet. IBIS BRASSTRAX scores are used for sorting possible
candidate matches and are not meant to be interpreted as an estimate of an intrinsic physical quantity. On
the other hand, it is natural to pose the question whether a large difference between two correlation scores
likely indicates that one entry in the database matches significantly better to a subject cartridge case than
another entry and a small difference indicates that two entries in the database have a similar quality of
match to the subject cartridge case.
This question is essentially the same as determining the uncertainties of the IBIS scores. When is one
IBIS score significantly different from another? We have a long way to go in this effort to evaluate all the
sources of relative uncertainty for IBIS correlation scores, but we have developed procedures for evaluating
two components of uncertainty. The Phase 2 data from NBIC-2 provides an estimate of the mean and
variation of IBIS scores over a long period of time and from operator to operator for surfaces that are
essentially identical. The average Phase 2 score for all NBIC-2 operators and stations for breech face was
329.1. The standard deviation was 52.5, or about 16.0 % of the average score. If we assume a strictly
proportional model for uncertainty in BRASSTRAX correlation scores for breech face impressions, and if
this Type A uncertainty is the dominant uncertainty component, then we can estimate the scores to have a
relative standard uncertainty fBF of 16.0 %. Furthermore, we can consider two scores to be significantly
different at the one standard deviation level if their correlation scores for breech face differ by
approximately 21 %. That is if the smaller correlation score is less than approximately 79 % of the larger
score. A precise formula for this estimation is obtained from the equation:
SLA − SSM > [(f SLA)2 + (f SSM)2]1/2, (2)
where SSM is the smaller correlation score, SLA is the larger correlation score, and f is the relative standard
uncertainty, 16.0 % in this case. This equation can be cast as a quadratic equation with SSM as unknown.
This leads to
SSM < SLA [1 – (2f 2 – f 4)1/2] / (1 – f 2). (3)
For firing pin impressions, the average score from NBIC-2 was 344.3 and the standard deviation was
43.5, or 12.6 %. We might then consider two firing pin correlation scores to be significantly different if
they differ by approximately 17 %, that is, if the smaller correlation score is less than approximately 83 %
of the larger correlation score.
We do not expect nonlinear models to change these crude uncertainty estimates a great deal.
Nevertheless, we tested for nonlinearity of variance using data for high-scoring non-matches. A few sets of
results provide enough data for the calculation. These results were taken from firing pin impressions for a
single high-scoring non-matching cartridge case acquired by six of the 14 participants. The calculated
average correlation was 110.7 with a standard deviation of 9.5 (8.5 %). This result suggests that the relative
standard deviation does not balloon into large values when the correlation signal decreases, and that non-
linearity of the standard deviation is not significant.
What is more significant is the zero-level uncertainty, the correlation scores and their variations that
result from correlating non-matching surfaces. This can be estimated from the NBIC-2 results as well by
using the scores from a representative sample of non-matching surfaces, that is, from the scores that result
when the SRM surfaces are matched with non-SRM surfaces in the database. We desire a random sample
of these scores, so we do not use scores that are rank ordered. However, a random sample of non-matching
scores is available from the NBIC-2 results. Figure 28 shows a table of results for one operator for one
SRM entry. The upper table shows results ordered by breech face, with highest at the top. The firing pin

Volume 119 (2014) http://dx.doi.org/10.6028/jres.119.028
Journal of Research of the National Institute of Standards and Technology
667 http://dx.doi.org/10.6028/jres.119.028
Fig. 28. Example of non-matching scores for one acquisition. The highlighted scores are unordered non-matches.
scores, however, are not rank ordered. The correlation values for the entries that are obviously non-
matching (31, 38, 33, 42, 0, 59, 33, 18) represent to us a small random sample of non-matching scores for
firing pin. Likewise in the lower table, the scores (12, 7, 8, 6, 8, 5, 4, 5) represent a small random sample of
non-matching scores for breech face.
When we average a large number of these correlation scores for the 12 operators of NBIC-2 for which
we have such data, we arrive at a zero-level value for breech face of 7.78 ± 2.65 (1 standard deviation) and
a zero-level value for firing pin of 31.4 ± 16.6 (1 standard deviation). These values imply for us that
correlation scores close to these levels are not significantly different from a completely non-matching
situation.
We take the criterion for a minimum meaningful correlation score to be a difference of one standard
deviation from the zero-signal level. Accordingly, for both breech face and firing pin, we write the
equation:
Smin − S0 = [σ02 + (f Smin)2]1/2, (4)
where the term on the right hand side is the root-sum-square of two terms, the standard deviation of the
zero signal and the estimated standard uncertainty of the minimum signal. Rounding up to the nearest
integer value, the minimum meaningful correlation value for breech face (SminBF) is approximately 11 and
the minimum meaningful correlation signal for firing pin (SminFP) is approximately 50. We summarize these
results as
fBF = 16.0 %,
fFP = 12.6 %,
S0BF = 7.8 ± 2.7,
S0FP = 31 ± 17,
Volume 119 (2014) http://dx.doi.org/10.6028/jres.119.028
Journal of Research of the National Institute of Standards and Technology
668 http://dx.doi.org/10.6028/jres.119.028
SminBF = 11,
SminFP = 50.
The above results apply for BRASSTRAX acquisitions. Similar results have been calculated for Heritage
acquisitions and the values are:
fBF = 13.6 %,
fFP = 13.3 %,
S0BF = 8.5 ± 2.8,
S0FP = 27 ± 15,
SminBF = 12,
SminFP = 43.
For ejector marks, the relative variation of correlation scores is significantly larger than those for breech
face and firing pin. The average score from NBIC-2 was 1470.3 and the standard deviation was 561.8, or
38.2 %. We might then consider two ejector mark correlation scores to be significantly different if they
differ by approximately 44 %, that is, if the smaller correlation score is less than approximately 56 % of the
larger correlation score. However, the distribution of ejector mark correlation scores is so widely
distributed (Fig. 7), the model for uncertainty developed for breech face and firing pin is likely not
appropriate for ejector marks.
9.2 Traceability Issues
The issue of measurement uncertainty within a quality system leads directly to the issue of
measurement traceability. According to the International vocabulary of metrology – Basic and general
concepts and associated terms (VIM) [21], metrological traceability is defined as:
“property of a measurement result whereby the result can be related to a reference through a
documented unbroken chain of calibrations, each contributing to the measurement uncertainty.”
Although image acquisitions and correlations of cartridge cases in the NIBIN are not traceable to SI units,
we now have a system of “para-traceability” for breech face impressions and firing pin impressions with
the NIBIN Golden Images as standards,
a comparison procedure generalized here as Appendix 1,
a control chart with control limits that may be used to demonstrate consistent operation of
individual NIBIN stations available on-line, see Appendix 2, and
an uncertainty budget for correlations of breech face impressions and firing pin impressions,
described in Sec. 9.1.
Overall, the quality system addresses the issues of
demonstrating that individual NIBIN stations are operating properly and consistently with other
stations in the system,
detecting the presence of problems in operation,
detecting significant differences in the correlation scores that may indicate which entries in the
NIBIN database have significantly higher potential than others for matching a subject piece of
evidence.
10. Conclusion
The main question to explore for NBIC-2 was whether the control limits for BRASSTRAX systems
should be changed from the control limits found for the IBIS Heritage systems during NBIC-1. The NBIC-
2 results, shown in Sec. 6, yield control limits that are not significantly higher than the NBIC-1 control
Volume 119 (2014) http://dx.doi.org/10.6028/jres.119.028
Journal of Research of the National Institute of Standards and Technology
669 http://dx.doi.org/10.6028/jres.119.028
limits for breech face and ejector mark acquisitions but yield a control limit for firing pin acquisitions that
is about two standard deviations higher.
The quality procedure discussed in Sec. 9 comprises a baseline of best practices, formalized by control
limits, with control charts for monitoring individual performance. It was developed and tested for the
acquisition stations in ATF’s NIBIN, but it can be adapted for other types of automated inspection stations
for cartridge cases. Whatever the operating system, operators can use the SRMs together with control charts
to monitor the performance consistency of themselves and their stations. The NBIC-2 project dealt only
with cartridge cases because BRASSTRAX stations in NIBIN were designed solely for the measurement of
cartridge cases and are not capable of measuring bullets.
Current automated ballistics identification systems are primarily based on image comparisons using
optical microscopy. The correlation accuracy depends on image quality, which is largely affected by
lighting conditions. This effect was highlighted in the NBIC-1 project [10]. Because ballistic signatures are
geometrical micro-topographies by nature, direct measurement and correlation of the surface topography
itself has been proposed for ballistics identification [22,23], and has achieved favorable initial results for
bullet identifications from profile signatures [24]. Several commercial systems for topography
measurement and correlation of bullets and cartridge cases have also been developed [for examples see
3,25,26, 27]. We are currently working on the development of a 3D ballistics identification system using
topography measurements and a new correlation method based on the integration of correlations from small
surface areas [28].
NIST SRM 2460/2461 Standard Bullets and Cartridge Cases function as reference standards for
establishing traceability for both topography measurements at NIST and image correlations of NIBIN. For
the topography measurements, the measurement traceability is established using the topography images of
SRM cartridge cases and bullets and NIST-measured parameters, Ds and CCFmax, [14,15]. For the image
acquisitions of NIBIN, traceability of acquisition of breech face impressions and firing pin impressions is
supported by correlation of SRM bullet and cartridge case images at local IBIS sites with respect to the
Golden Images of the National Laboratory Center of ATF.
Because the NIBIN correlations for ejector mark images and bullet images are more variable, we have
not yet developed an uncertainty budget for those regions of interest, although we have proposed control
limits for correlation of the acquisitions of the SRM 2461 ejector marks and the SRM 2460 bullets. The
SRM Cartridge Cases and Bullets, when used with the control charts and control limits, are powerful tools
for quality assurance of NIBIN acquisitions and correlations.
11. Appendix 1: Developing a Control Chart for Automated Ballistics Acquisition
Systems Using NIST SRM 2461 Standard Cartridge Cases
The NIST SRM Standard Cartridge Case is intended for quality testing of automated acquisitions of
cartridge case breech face impressions, firing pin impressions, and ejector marks. The first control charts
were developed for bullet and cartridge case acquisitions for the ATF’s NIBIN, which uses the IBIS
Heritage and IBIS BRASSTRAX-3D acquisition stations and system correlation software. The standards
are Golden Images developed during the NBIC and NBIC-2 projects, which reside on a NIBIN server
housed at the ATF National Laboratory Center. Control limits were proposed for both types of acquisition
technology after two thorough periods of testing and correlations by a number of IBIS operators.
While the control charts were created based on NBIC data, the statistical methods are straightforward
and can be adapted for any type of automated inspection station. The main change would be the value of
the control limit, which depends on the software used to calculate correlation. A brief description follows
for developing a control chart on systems that do not have access to the NIBIN Golden Images. The
proposed procedure contains general steps for acquisition of breech face impressions, firing pin
impressions, and ejector marks on cartridge cases using SRM 2461. A sample control chart (see Appendix
2) is also included. Control charts for bullet acquisitions using SRM 2460 could be developed in a similar
way.

Volume 119 (2014) http://dx.doi.org/10.6028/jres.119.028
Journal of Research of the National Institute of Standards and Technology
670 http://dx.doi.org/10.6028/jres.119.028
1. Follow standard procedures from the manufacturer for maintenance and setup of the inspection
station and for calibration check at turn on.
2. Enter case and exhibit ID information according to procedures described by the manufacturer of the
station. Noteworthy information requirements are the date of the image acquisition and the identity of
the SRM, for example, “SRM 2461-XXX,” where “XXX” represents the serial number.
3. Follow the manufacturer’s procedure for acquiring a cartridge case. For most conditions, use the same
procedure as that for automated imaging of fired cartridge cases.
4. Create “master image” acquisitions for the breech face, firing pin, and ejector mark by some suitable
approach, such as using ideal illumination conditions or loading an ideal image developed elsewhere
by the manufacturer of the station or by another user of a comparable station. Subsequent images for
breech face, firing pin, and ejector mark will be correlated with respect to the master images.
5. Calculate an estimate for a fixed lower control limit (fixed CL) for the correlation scores for each
region, based on previous observations or on the experiences of other experts operating similar
systems. The fixed CL should be chosen so that approximately 95 % of the correlation readings are
expected to lie above it. If a correlation result falls below the fixed CL, the operator should
investigate if a measurement problem is developing.
6. Perform image acquisitions of the breech face impression, firing pin impression, and ejector mark on
the SRM 2461.
7. Correlate each type of acquired image (breech face, firing pin, ejector mark) with the appropriate
master image and calculate the correlation score according to the manufacturer’s instructions. Enter
these scores on the control chart.
8. Continue to perform acquisitions of SRM 2461 using the procedure above at appropriate intervals
imposed by your quality system. It is recommended that an acquisition of a standard cartridge case be
entered at least once per month to verify the proper operation of the station. However, you should
refer to your own laboratory’s policy and procedure guidelines for the frequency of acquisition. The
cartridge case acquisitions should also be entered into the system during each software and hardware
upgrade as well as after any scheduled or unscheduled maintenance. All entries and results should be
documented.
9. After at least two sets of correlations have been taken, calculate a mean (µ), a standard deviation (σ),
and a dynamic lower control limit (dynamic CL). The dynamic CL may be calculated from
dynamic CL = µ – 1.645 σ.
This quantity represents a 95 % one sided lower confidence interval for a Gaussian distribution. The
mean and the dynamic CL should fluctuate slightly with each successive data point and should settle
into a stable value after about ten readings.
10. The correlation scores for the breech face impression, firing pin impression, and ejector mark should
all be higher than both the fixed CL described in Step 5 and the dynamic CL calculated in Step 8. If
not, after an appropriate number of records (for example 10 records) determine a new fixed CL value
based on the updated statistical information and on a consensus of the lab personnel. The fixed CL
value may change in the future as the software or hardware changes.
11. Once the laboratory has established a stable value for its fixed control limit, maintain plots of the
correlation scores on control charts to demonstrate that the acquisitions are being performed

Volume 119 (2014) http://dx.doi.org/10.6028/jres.119.028
Journal of Research of the National Institute of Standards and Technology
671 http://dx.doi.org/10.6028/jres.119.028
consistently and with high correlation to the master image. NIST’s spreadsheet (Appendix 2)
automatically provides a plot (Fig. 6) of each measured correlation value and the fixed CL versus the
date of the measurement, as well as a running plot of the dynamic CL [17] for each cartridge case
region of interest. This is done as long as at least two entries are made on the top sheet.
12. If any of the correlation scores drops below the fixed CL value, flag the results and the date, then
double check the alignment and reacquire the cartridge case images.
13. If the correlation score still remains below the fixed CL value, you may want to have another trained
IBIS user acquire the cartridge case using the station. If the second score is above the fixed CL value,
then you may have a user issue. If the score is still low, then you may be observing a change in the
station performance that needs to be diagnosed. Check the image acquisition procedure. This may
include checking the basic set up and calibration of the acquisition station, as well as the alignment of
the cartridge case.
14. Handling and Cleaning Procedure: The standard cartridge cases are expected to be robust and to
maintain their quality over many years. However, it is good procedure to avoid handling the surface
of the head stamp area in order to avoid unnecessary scratches and finger contamination from marring
it. Likewise, cleaning should also be avoided as much as possible because the cleaning process itself
can introduce irreversible changes in the surface topography of the cartridge case. If it is clear that
contamination has been introduced on the surface to the extent that it has been visibly changed, then a
mild cleaning procedure may be used. The suggested procedure is to clean only the contaminated area
with a lab swab/cotton tip applicator moistened with ethyl alcohol.
12. Appendix 2: Control Chart for Ballistic Acquisition and Correlation Systems
Acknowledgments
The funding for the NBIC Project was provided by the National Institute of Justice (NIJ) through the
Office of Special Programs (OSP) at NIST. The authors are grateful to P. Rubert and Rubert Co. Ltd. (UK)
for their contributions in the development of NIST SRM 2461 Standard Cartridge Cases; and to S. Dip and
M. Paradis of Forensic Technology Inc. (FTI, Canada) for their participation in the NBIC-2 project. We
also thank R. Dixson, M. Taylor, and J. Jendzurski for their careful reviews of the manuscript.
The authors are especially grateful to U.S. forensic laboratory personnel who participated in the NBIC-
2 Project and contributed their results. These include:
• W. Best of the Allegheny County Police Department (PD), Pittsburgh, PA,
• J. Flaskamp and M. Nally of the Illinois State Police Forensic Science Center, Chicago, IL,
• S. Garten of ATF Forensic Science Lab-Atlanta, GA,
• K. Lancaster of the Florida Department of Law Enforcement (FDLE), Tampa, FL,
• E. Lawton-McWhite and A. Greenspan of the Broward County Sheriff’s Office, Ft. Lauderdale,
FL,
• T. Lyons of the Houston PD, TX,
• A. Northrop and E. Hine of the ATF National Laboratory Center, Beltsville, MD,
• E. Osbeck of the Columbus Crime Lab, OH,
• M. Shaw of the ATF Forensic Lab, Walnut Creek, CA,
• L. Willette and M. Schoonover of the FDLE, Orlando, FL.
Volume 119 (2014) http://dx.doi.org/10.6028/jres.119.028
Journal of Research of the National Institute of Standards and Technology
672 http://dx.doi.org/10.6028/jres.119.028
13. References [1] W. C. Boesman and W. J. Krouse, CRS Report to the Congress, National Integrated Ballistics Information Network (NIBIN)
for Law Enforcement, Order Code RL31040, Congressional Review Service, Library of Congress, Washington DC (2001). [2] National Integrated Ballistic Information Network (NIBIN), http://www.atf.gov/content/Firearms/firearms-enforcement/NIBIN
(accessed, November 20, 2014).
[3] Forensic Technology Inc., Montreal, Canada, http://forensictechnology.com/ibistrax (accessed, November 19, 2014). [4] ISO 17025, General requirements for the competence of testing and calibration laboratories, ISO, Geneva (2005).
[5] J. Song, E. Whitenton, D. Kelley, R. Clary, L. Ma, and S. Ballou, SRM 2460/2461 standard bullets and cartridge cases project,
J. Res. Natl. Inst. Stand. Technol. 109 (6), 533-542 (2004). http://dx.doi.org/10.6028/jres.109.040 [6] J. Song, T. Vorburger, T. B. Renegar, H. Rhee, A. Zheng, L. Ma, J. Libert, S. Ballou, B. Bachrach, and K. Bogart, Correlations
of topography measurements of NIST SRM 2460 standard bullets by four techniques, Meas. Sci. Technol. 17, 3, 500-503
(2006). http://dx.doi.org/10.1088/0957-0233/17/3/S07 [7] L. Ma, J. Song, E. Whitenton, A. Zheng, and T. Vorburger, NIST bullet signature measurement system for Standard Reference
Material (SRM) 2460 standard bullets, Journal of Forensic Sciences 49 (4), 649-659 (2004).
[8] T. V. Vorburger, J. Song, W. Chu, T. B. Renegar, A. Zheng, J. Yen, R.M. Thompson, R. Silver, B. Bachrach, and M. Ols,
Topography measurements for correlations of standard cartridge cases, Proc. SPIE 7729, 77291D (2010); doi:
10.1117/12.859918.
[9] ASCLD-LAB International, ASCLD-LAB Policy on Measurement Traceability, ASCLD/LAB Document Control Number, AL-PD-3057 Ver 1.2, www.ascld-lab.org (July 24, 2014).
[10] J. Song, T. V. Vorburger, S. Ballou, R. M. Thompson, J. Yen, T. B. Renegar, A. Zheng, R. M. Silver, and M. Ols, The National
Ballistics Imaging Comparison (NBIC) Project, Forensic Sci. Int. 216, 168-182 (2012); doi:10.1016/j.forsciint.2011.09.016. [11] J. Song, P. Rubert, A. Zheng, and T. Vorburger, Topography measurements for determining the decay factors in surface
replication, Measurement Science and Technology 19, 084005 (2008); doi:10.1088/0957-0233/19/8/084005.
[12] S. H. Bui and T. V. Vorburger, NIST surface metrology algorithm testing system (SMATS), Prec. Eng. 31, 218-225 (2007), http://pml.nist.gov/smats (updated October 22, 2012).
[13] X. A. Zheng, Standard Bullets and Casings, http://www.nist.gov/pml/div683/grp02/sbc.cfm (created December 10, 2008)
(updated August 31, 2012). [14] SRM 2460–Standard Bullet, https://www-s.nist.gov/srmors/view_detail.cfm?srm=2460 (updated August 28, 2013).
[15] SRM 2461 – Standard Cartridge Case, https://www-s.nist.gov/srmors/view_detail.cfm?srm=2461 (updated August 28, 2013).
[16] IBIS TRAX-HD3D | BRASSTRAX http://www.forensictechnology.com/brasstrax/ (2014) (accessed, June 18, 2014). [17] J. Song and T. Vorburger, Verifying measurement uncertainty using a control chart with dynamic control limits, MEASURE
(Journal of NCSL-International) 2, 3, 76-80 (2007). [18] IBIS Operation Manual, Version 3.4, Forensic Technology Inc., Montreal, Canada (2004).
[19] W. N. Venables and B. D. Ripley, Modern applied statistics with S-PLUS (3rd ed.) (Springer-Verlag, New York, 1999).
http://dx.doi.org/10.1007/978-1-4757-3121-7 [20] M. B. Wilk and R. Gnanadesikan, Probability plotting methods for the analysis of data, Biometrika 55 (1), 1-17 (1968).
[21] JCGM 200:2012, International vocabulary of metrology – Basic and general concepts and associated terms (VIM),
http://www.bipm.org/en/publications/guides/vim.html. [22] J. De Kinder and M. Bonfanti, Automated comparisons of bullet striations based on 3D topography, Forensic Sci. Int. 101, 85-
93 (1999). http://dx.doi.org/10.1016/S0379-0738(98)00212-6
[23] T. Vorburger, J. Yen, B. Bachrach, T. B. Renegar, J. J. Filliben, L. Ma, H.-G. Rhee, A. Zheng, J. Song, M. Riley, C. D. Foreman, and S. M. Ballou, Surface topography analysis for a feasibility assessment of a National Ballistics Imaging Database,
NISTIR 7362, National Institute of Standards and Technology, Gaithersburg MD (2007),
http://www.nist.gov/customcf/get_pdf.cfm?pub_id=822733. [24] W. Chu, J. Song, T. Vorburger, J. Yen, S. Ballou, and B. Bachrach, Pilot study of automated bullet signature identification
based on topography measurements and correlations, Journal of Forensic Sciences 55, 2, 341-347 (2010),
http://dx.doi.org/10.1111/j.1556-4029.2009.01276.x [25] http://evofinder.com/, accessed, November 19, 2014.
[26] http://www.pyramidaltechnologies.com/, accessed November 19, 2014.
[27] http://cadreforensics.com/, accessed January 26, 2015. [28] J. Song, Proposed ‘NIST Ballistics Identification System (NBIS)’ Based on 3D Topography Measurements on Correlation
Cells, AFTE Journal 45, 2, 184-189 (2013).
About the authors: Theodore Vorburger is a Guest Researcher with the Surface and Nanostructure
Metrology Group in the Semiconductor and Dimensional Metrology Division of the Physical Measurement
Laboratory at NIST. A former group leader, his current interests include surface topography measurement
and standardization and research in ballistics identification.
James Yen is a Mathematical Statistician in the Statistical Engineering Division of the Information
Technology Laboratory at NIST. He works in statistical analysis and modelling in various fields including
firearms identification and chemical standard reference materials.

Volume 119 (2014) http://dx.doi.org/10.6028/jres.119.028
Journal of Research of the National Institute of Standards and Technology
673 http://dx.doi.org/10.6028/jres.119.028
John Song is a Mechanical Engineer and a Post-Doc Research Adviser in the Surface and
Nanostructure Metrology Group of the Semiconductor and Dimensional Metrology Division of the Physical
Measurement Laboratory at NIST. He is a Project Leader for the Forensic Topography and Surface
Metrology Project at NIST.
Robert M. Thompson is a Senior Forensic Science Research Manager in the Special Programs Office at
NIST. He facilitates and assists research in improving crime laboratory analysis, crime scene
documentation, and objective comparison methods for impression evidence identification.
Thomas Brian Renegar is a Technician in the Surface and Nanostructure Metrology Group of the
Semiconductor and Dimensional Metrology Division at NIST. His main interests include surface
topography measurement and calibration and documentary standardization. He is Vice Chair of the
American Society of Mechanical Engineers National Committee B46 on the Classification and Designation
of Surface Qualities.
Xiaoyu Alan Zheng is a Mechanical Engineer with the Surface and Nanostructure Metrology Group at
the National Institute of Standards and Technology (NIST). He has been with the group since 2003 and has
worked on many forensic projects related to 3D topography acquisitions and correlations of ballistics
evidence. He was part of the project team that developed and qualified the SRM 2460 Standard Bullet and
SRM 2461 Standard Cartridge Case. He has experience in both contact (stylus) and non-contact (optical)
metrology.
Mingsi Tong is a PhD candidate at Harbin Institute of Technology. He is a Guest Researcher with the
Semiconductor and Dimensional Metrology Division of the Physical Measurements Laboratory at NIST.
His principal interest is mechanical engineering.
Martin Ols is a program manager for the Bureau of Alcohol, Tobacco, Firearms and Explosives
(ATF&E), National Integrated Ballistics Information Network (NIBIN). He is currently involved with the
day to day operation of the Integrated Ballistics Identification System (IBIS), especially with testing of new
software and hardware. He also acts as the U.S representative on the (IBIS) International Correlation
Server Project.
The National Institute of Standards and Technology is an agency of the U.S. Department of Commerce.
The Bureau of Alcohol, Tobacco, Firearms, and Explosives is an agency of the U.S. Department of Justice.