the scope of us factoryless manufacturing12 kimberly bayard, david byrne, and dominic smith3
TRANSCRIPT

The Scope of U.S. Factoryless Manufacturing12
Kimberly Bayard, David Byrne, and Dominic Smith3
February 28, 2013
Abstract: The “factoryless” business model has recently risen in prominence in tandem with a long wave
of outsourcing. Factoryless goods producers (FGP) control the production process, own the associated
intellectual property, and bear the entrepreneurial risk, but outsource the actual fabrication of products,
often to offshore locations. Census Bureau practice has been to classify FGP activity to the wholesale
trade sector, but beginning in 2017, U.S Federal statistical agencies will consistently include FGP
establishments in manufacturing. We anticipate this change will introduce a significant discontinuity—
our rough calculations indicate the value of shipments for manufacturing may have been between 7 and
30 percent higher if FGP was included in 2002 and 2007. Constructing a more precise historical series
consistent with the new system will require a deeper understanding of FGP firms and the activities of
their establishments. To that end, we present a case study of FGP semiconductor production. We
identify domestic establishments of FGP firms with a unique dataset combining outside company
directories of FGP semiconductor firms with Economic Census microdata for 2002 and 2007. Using our
dataset, we highlight some distinguishing characteristics of the establishments of FGP firms. Within
wholesale trade, we find FGP establishments are larger in terms of both employment and sales, their
employees have higher average earnings, and are more geographically concentrated than
establishments of other firms. We also note that despite the rapid growth of U.S. FGP semiconductor
firms in this five‐year period, the output of the U.S. establishments of those firms increased only
moderately, suggesting these firms are increasing FGP offshore.
1 Preliminary. Please do not quote without permission. We thank Jonathan Ende, Anna Gui, Andrea Lowe, and Elizabeth Vrankovich for research assistance. We are grateful to Maureen Donoghue, Teresa Fort, Javier Miranda, Bill Powers, Jennifer Ribarsky, and Falan Yinug for helpful discussions. Global Semiconductor Alliance and HIS iSuppli provided data and we appreciate their guidance on the semiconductor industry. 2 Any opinions and conclusions expressed herein are those of the author(s) and do not necessarily represent the views of the U.S. Census Bureau. All results have been reviewed to ensure that no confidential information is disclosed. 3 Affiliation for all authors is Federal Reserve Board of Governors. The views expressed in this paper should not be attributed to the Board of Governors or other members of the staff. Direct correspondence to: [email protected].
1
Introduction
The aggressive pursuit of outsourcing by manufacturing firms in recent years has strained the
ability of statistical programs to inform users on the role of U.S. economy in global manufacturing value
chains. U.S. manufacturing firms now commonly control the production process, own the associated
intellectual property, and bear the entrepreneurial risk, but outsource the actual fabrication of products,
often to offshore locations, an approach known as factoryless goods production (FGP).4 These firms
may well have no footprint in manufacturing statistics because under the current version of the North
American Industrial Classification System (NAICS), only establishments engaged in actual fabrication are
commonly classified to manufacturing.5
The extent of domestic FGP is difficult to ascertain. NAICS provides no explicit guidance on
classifying FGP establishments and the various Federal statistical agencies, and the programs within
those agencies, have adopted different practices; FGP establishments may be classified to wholesale
trade, management, services, or manufacturing, depending on the statistical program. Furthermore,
they cannot be readily distinguished from other establishments within these sectors. Consequently, it is
difficult to answer such questions as whether offshoring of fabrication may lead firms to move other
aspects of manufacturing offshore as well.6
The NAICS revision to be employed by Federal statistical agencies beginning in 2017 directly
addresses the issue of FGP establishment classification: FGP establishments are to be classified to the
4 For example, the 2012 Annual Report for Nike notes “Our principal business activity is the design, development and worldwide marketing and selling of high quality footwear, apparel, equipment, accessories and services” and that “virtually all of our footwear is produced by factories we contract with outside of the United States.” 5 NAICS describes manufacturing as consisting of establishments engaged in “mechanical, physical, or chemical transformation of materials, substances, or components into new products” or “assembling of component parts of manufactured products.” A qualification to this description appears not to have been operative in practice: “Manufacturing establishments may process materials or may contract with other establishments to process their materials for them. Both types of establishments are included in manufacturing.” See discussion in Murphy (2009) and Doherty (2013). 6 For convenience, we refer to transformation of materials into products as “fabrication” rather than the term “manufacturing transformation activities” used in official notices about the upcoming revision to NAICS. (OMB, 2011)
2
manufacturing sector.7 Anticipating the new scope for the manufacturing sector, this paper takes steps
toward constructing historical series for manufacturing industries with FGP in scope. We present
preliminary evidence of the extent of FGP from Census surveys, then turn our attention to a case study
of the semiconductor industry, where FGP is widely employed. For semiconductors, we have the
advantage of highly detailed information on FGP from industry trade groups, which we link to Economic
Census microdata. We then calculate an alternative estimate of semiconductor manufacturing with
these establishments included. Finally, we use our case study to identify distinctive characteristics of
FGP establishments that will aid in identifying FGP establishments in other industries.
Evidence from the Economic Census
Because Census Bureau practice has been to classify FGP establishments to wholesale trade, we
focus on this sector.8 In 2002 and 2007, the Economic Census included questions which provide some
insight into the prevalence of FGP across industries in the wholesale trade sector.
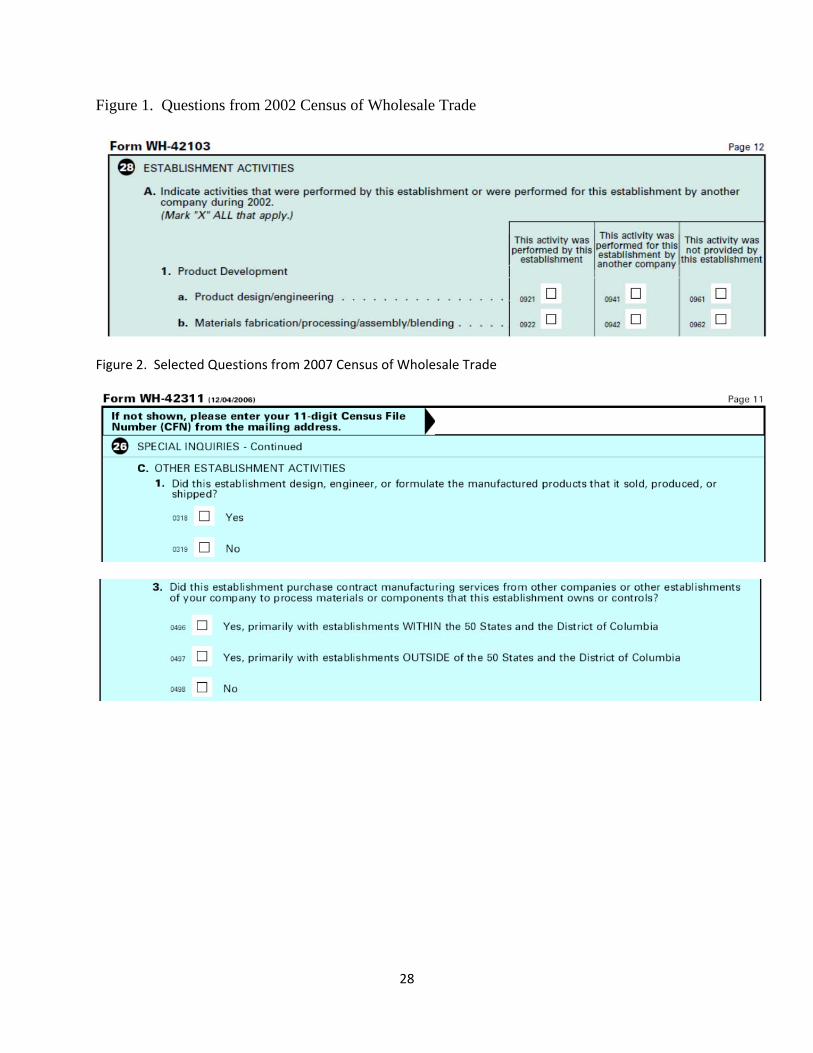
In 2002, the Census of Wholesale Trade survey form included a question asking respondents if
“product design/engineering … was performed by this establishment.”(Figure 1) Because an FGP
establishment “owns rights to the intellectual property or design (whether independently developed or
otherwise acquired) of the final manufactured product,” and the primary activity of establishments in
wholesale trade is not fabrication by definition, we consider establishments answering “yes” to this
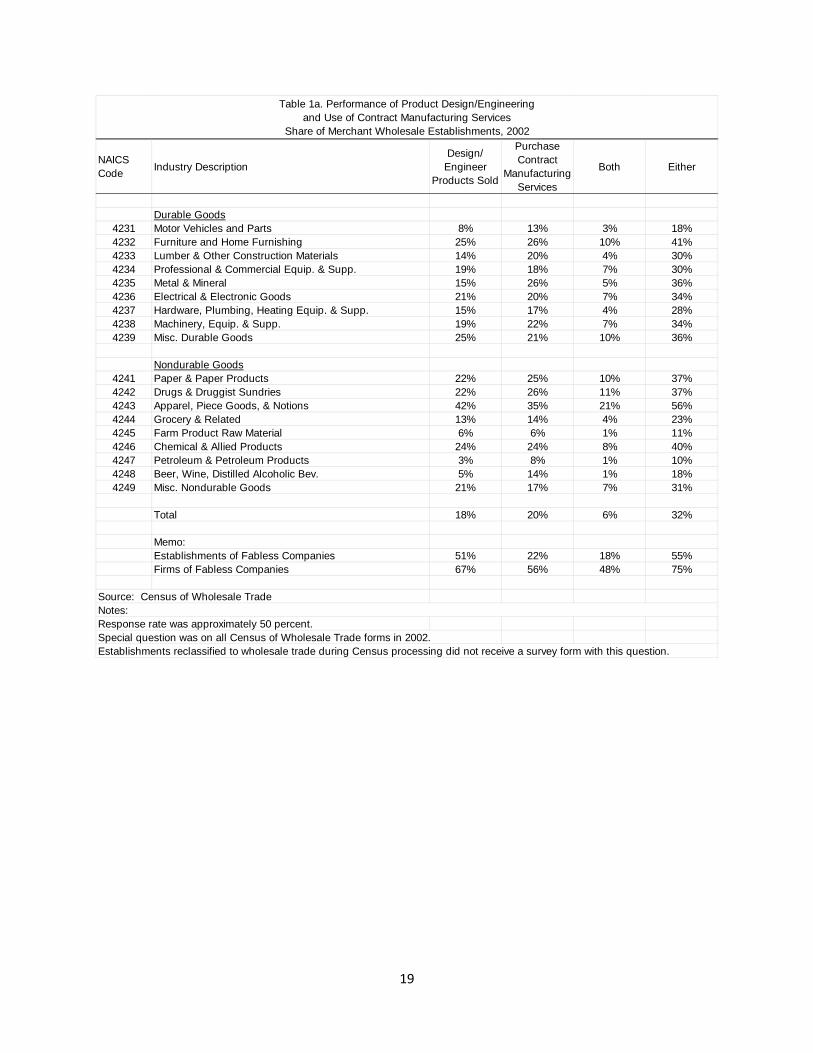
question likely to be FGP establishments.10 For the sector as a whole, responses indicate that 18 percent
of establishments performed product design. (Table1a) At least 20 percent of respondents reported
7 It remains to be seen whether statistical programs will separately report the activity of factoryless goods producers, the manufacturing service providers (MSP) that fabricate for FGPs under contract, and traditional integrated manufacturers (IMs). 8 A summary of a recent study of the issue by the Economic Classification Policy Committee of the Office of Management and Budget noted, “to the extent that FGPs can be identified, the Census Bureau statistical programs classify them to wholesale trade.” (Murphy, 2009) 10 The quoted definition of FGP is from Murphy (2009).
3
designing products in 8 industry groups, including Electrical and Electronic Goods (NAICS 4236), where
semiconductor wholesaling is classified. Product design or engineering was particularly prevalent (42
percent) in Apparel, Piece Goods and Notions (NAICS 4243), an industry group long known for using the
FGP approach. A handful of wholesale industry groups had notably low prevalence of product
design/engineering, including Motor Vehicles and Parts (NAICS 4231), Groceries (NAICS 4244), Farm
Products (NAICS 4245), and Alcoholic Beverages (NAICS 4248).
The 2002 Census of Wholesale Trade also asked establishments if “materials fabrication/
processing/ assembly/ blending … was performed for them by another company.” Because an FGP
establishment “contracts with manufacturing service providers to perform transformation activities to
its specifications,” we expected FGP establishments would answer “yes” to this question. Reported
overall prevalence of the use of MSPs—20 percent—was similar to prevalence of product design and the
distribution across industries of the practice was quite similar, but we were surprised to find that only 6
percent of respondents answered yes to both questions.12
Questions on design and the use of contract manufacturing asked in the 2007 Census of
Wholesale Trade yielded similar results, though prevalence of these activities was moderately lower.
(Table 1b) Because the structure of the questions was rather different, it is difficult to draw conclusions
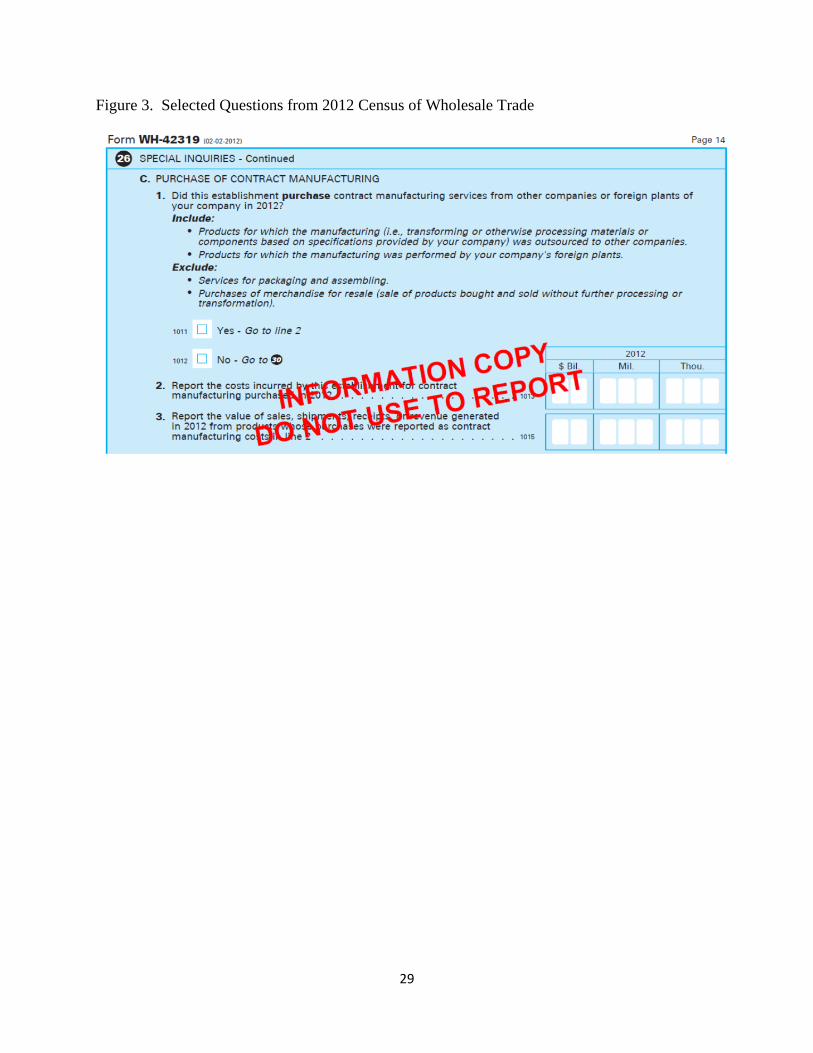
about trends from this difference.13 (Figure 2) More extensive questions on the 2012 Census of
Wholesale trade promise to offer further insight, including the cost of the MSP services employed and
the value of associated product sales. (Figure 3)
These special Census questions suggest that FGP is fairly common in most wholesale trade
industries, but the questions are not ideal for use in constructing precise estimates of FGP for several
12 See discussion of this question in Fort (2011), Jarmin et. al. (?), and Ribarsky et. al. (?) 13 Not all wholesale industries received forms with the special questions in 2007. We thank Teresa Fort for bringing this to our attention and providing us a list of omitted industries. We impute prevalence for these industries based on similar industries with responses.

4
reasons. First, the response rate for the questions was quite low – approximately half of wholesale
establishments did not answer the questions, and even if one treats the respondents as representative
there are some conceptual issues. As noted above, one might expect an FGP establishment to indicate it
does product design or engineering, but it need not do so, since the design of the product could have
been procured through other means. One might also expect an affirmative answer to the contract
manufacturing question, but an FGP may give a negative answer if the contract manufacturing was
provided by another establishment within the same company in a foreign location.14 Also, combining
the responses from the two questions yields the puzzling result that few plants answered “yes” on both.
Perhaps FGP firms split product design and production management activities between establishments.
Finally, the questions do not provide information on whether the FGP activity was the primary activity of
the establishment; it may be that for a plant reporting product design or use of contract manufacturing
revenue from traditional wholesale activity is nevertheless larger than revenue from FGP activity, in
which case the establishment is properly classified to wholesale trade.
With those caveats in mind, we use the responses to these questions to provide a very rough
estimate of the increment to manufacturing that would come from adopting the 2017 definition for
2002. Assuming (1) an establishment’s primary activity was FGP if it reported both performing design
and purchasing contract manufacturing services; (2) non‐respondents are well proxied by respondents,
and (3) FGP incidence is uncorrelated with sales, we generate an estimate of the revenue that would
have been moved to the manufacturing sector if FGP were classified to manufacturing. Under these
assumptions, the total value of shipments for the manufacturing sector 2002 would have been $4.2
trillion, a value 7 percent higher than its reported value of $3.9 trillion. If we assume establishments
reporting either product design/engineering or use of CMS (or both) were FGP establishments, total
14 The definition specifies that an FGP establishment “contract with unaffiliated establishments to perform transformation activities,” where foreign establishments of the same company are treated as unaffiliated. (See Doherty, 2013)
5
value of shipments for manufacturing would have been $5.1 trillion, which is 30 percent higher than its
reported value.15
These estimates should be treated as speculative for several reasons. First, while the total sales
of wholesale establishments reclassified to manufacturing would be counted as gross output, to the
extent that these FGPs are purchasing CMS from domestic establishments, much of the value of
shipments is already counted in manufacturing; therefore we expect the effect on manufacturing value
added to be lower than the effect on gross output. On the other hand, because of the low response
rates, we chose to apply the prevalence of FGP by establishment (defined various ways) to the total
sales of the industry, rather than aggregating across specific respondents; if FGP incidence is positively
correlated with sales throughout the sector, as we find for semiconductors below, we have understated
the potential effect on manufacturing. In future work, we will impute responses for non‐respondents
based on observed characteristics, aggregate by establishment, and construct measures of increases in
manufacturing based on value‐added.
With the these caveats in mind, these rough calculations do suggest that the change in
classification will introduce a discontinuity of first‐order importance on the size of the manufacturing
sector in 2017, making consistent historical series for a pressing need. For more precise estimates of the
effect of including FGP in manufacturing, we need a better understanding of what activities are
undertaken by the establishments of FGPs found in wholesale trade and services. To that end, we look
closely at the semiconductor industry.
15 The corresponding increase to manufacturing if only establishments using contract manufacturing are counted is 19 percent, and if only establishments performing design or engineering are counted is 17 percent. Results were similar for 2007—a 26 percent increase to manufacturing using the “either design or contract manufacturing” approach. Again, the questions were too different between the two surveys to draw a clear conclusion about trends.

6
“Fabless” Semiconductor Production
One industry where appropriate data are available is semiconductors. The FGP business model
is widely employed in the semiconductor industry. Because these semiconductor companies do not
own production plants, known in the industry as “fabs,” this business model is called “fabless”
production. Fabless production emerged in the 1990s and now accounts for about one‐quarter of global
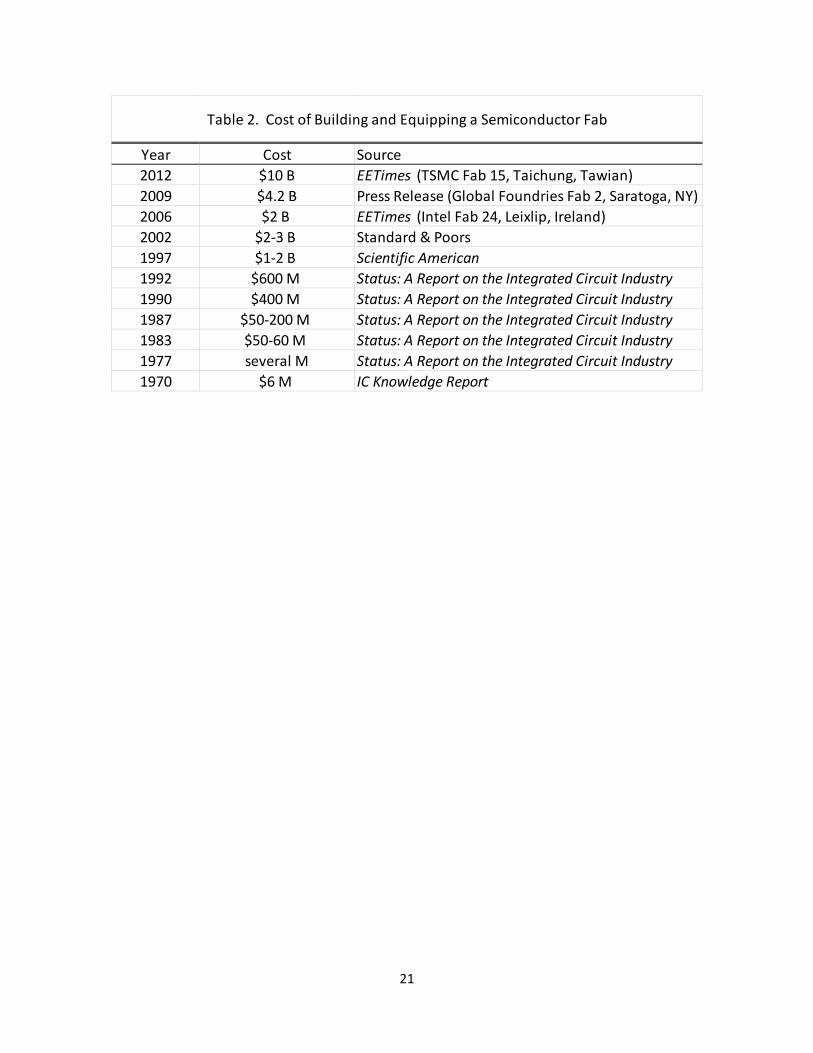
semiconductor sales. (Figure 4) Two trends drove the spread of FGP in this industry. First, the fixed cost
of being an integrated manufacturer in the industry has climbed steadily—building and equipping a
semiconductor plant now requires an investment of several billion dollars. (Table 2) Second, the
proliferation of products designed around custom processors known as “application specific integrated
circuits” (ASICs), such as cell phones, has raised the importance of semiconductors produced in relatively
small volumes. Companies producing ASICs do not generally produce chips in the volume required to
keep a fab running at a profitable operating rate. By combining the orders of multiple fabless
companies, semiconductor MSPs, known as “foundries,” can operate fabs at close to full capacity.16
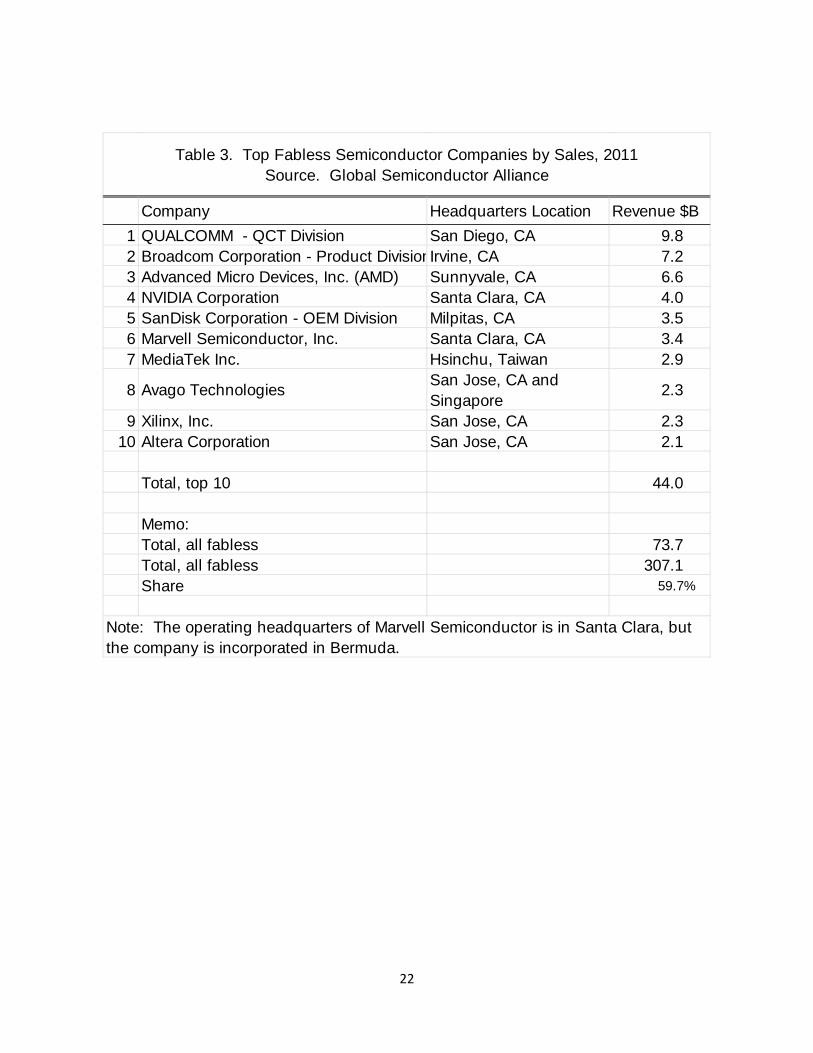
U.S. firms, such as Qualcomm, Broadcom, AMD, and NVIDIA dominate the fabless portion of the
semiconductor industry; 9 of the top 10 firms have U.S. headquarters.17 (Table 3) The industry is highly
concentrated, with the top ten firms accounting for 60 percent of global sales in 2011. Very little of the
outsourced fabrication from these companies takes place in the United States: U.S. foundries account
for only 3 percent of global capacity. (Table 4) Consequently, the semiconductor industry is a
particularly striking illustration of the need to identify FGP in economic statistics: offshore outsourcing
of MSP has risen dramatically along with the revenues of U.S.‐headquartered fabless companies, but the
extent of their domestic FGP activity is difficult to ascertain.
16 For a detailed description of the structure of the industry, see Byrne, Kovak and Michaels (2013). 17 References to specific companies in the text are based on public information.
7
In order to estimate the extent of domestic fabless semiconductor production, we assemble a
unique dataset that links a master list of global semiconductor factoryless goods producers based on
private‐source information with confidential Census establishment‐level data.
Data construction
We used company directories to construct a database of 1,475 fabless companies active
between 2001 and 2012. Global Semiconductor Alliance (GSA), a trade group representing a wide
variety of companies involved in semiconductor design and fabrication, provided a directory of all
fabless companies active in 2012. GSA also provided a supplemental list of all companies dropped from
their directory since it was first published in 2005, which proved critical for coverage in an industry with
high firm birth and death rates. From Gartner, a high tech consultancy, we acquired a directory of
fabless companies published in 2001. Both directories are global in scope and include the headquarters
address for each firm. We combined these sources and supplemented them with primary research,
verifying or adding the birth and death dates for firms and expanding the list to account for additional
companies mentioned in announcements of mergers and acquisitions reported in the Mergent Online
database of financial filings and other public sources.
Using a name matching procedure we located 71 percent of these companies in the Census
Business Register files.18 (Table 5) The Business Register is a database of U.S. business establishments
and companies that serves as a frame for Census Bureau firm and establishment surveys.19 For each
establishment in the Business Register there are identifiers that allow the establishment to be linked to
corresponding records in Census Bureau economic surveys. In addition, the Business Register contains a
firm identifier for each establishment that enables us to locate other establishments within the same
firm. Sometimes, however, we could not find in the Economic Census firm identifiers that had appeared
18 See details in the appendix and in Smith (2013) 19 See Jarmin and Miranda (2002).
8
in the Business Register. In the end, we were able to locate establishments for 67 percent of the
corresponding firm IDs in the Economic Census microdata for 2002 and 2007.
Once we link firms from the GSA and Gartner directories to the Census data, we identify all
establishments connected to those firms and include them in our final dataset. Ideally, we would
exclude from the firm those establishments that are not engaged in FGP activity, however we currently
do not have enough within‐firm information to make that distinction. At the same time, there are
undoubtedly companies that we fail to locate in the Census data.
Sector Composition of Fabless Firms
Using our dataset, we examine the establishment structure of fabless firms for sector location,
construct measures of aggregate fabless sales and employment by sector, and consider several
alternatives for assigning fabless firm establishments to manufacturing to meet the new definition of
the sector.
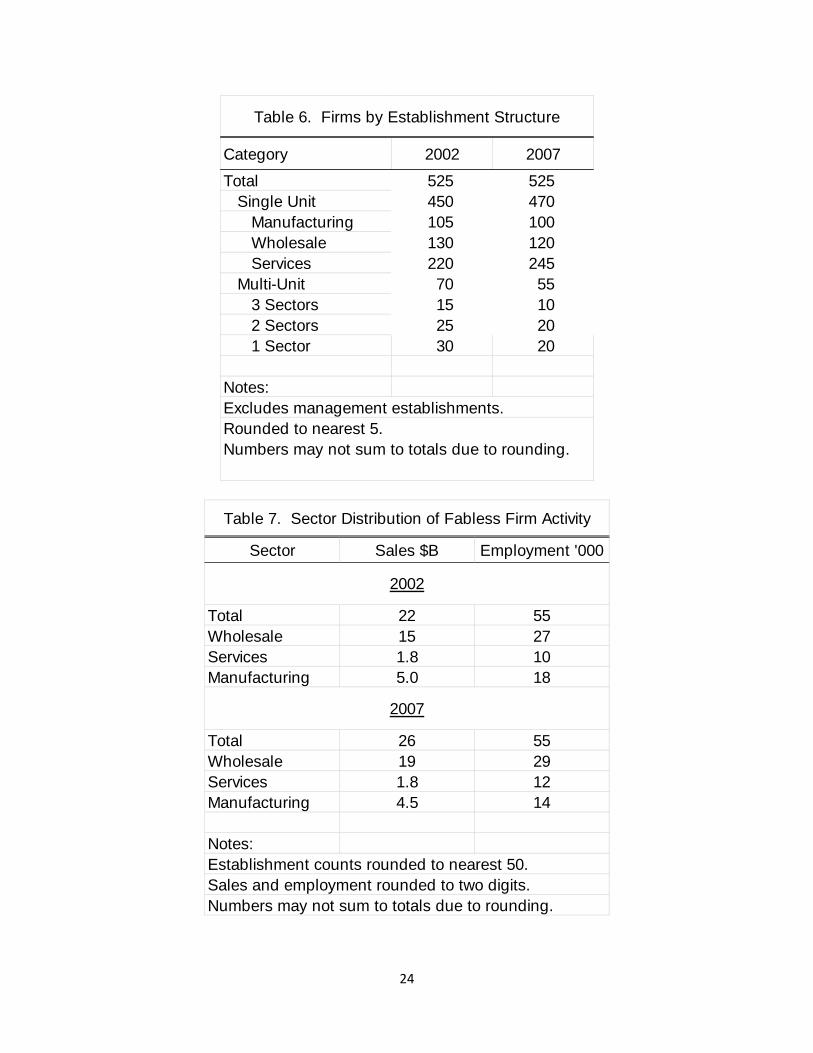
The establishment structure of the fabless firms in the database was similar for 2002 and 2007.
Using 2002 to illustrate, single unit firms account for over 80 percent the firms; 49 percent of these
establishments were located in the service sector, 29 percent in wholesale trade, and 23 percent in
manufacturing. (Table 6)20 Among multi‐unit firms, 40 percent had establishments that were all
assigned to a single sector and 60 percent had establishments spread across 2 or more sectors; out of
firms overall, only 8 percent had establishments in multiple sectors.
Although the most common structure was a single unit in the service sector, this sector
accounted for only 8 percent of revenue for the fabless firms. (Table 7) Revenue was concentrated in
20 In a very small number of cases, firms had establishments in the management sector as well. These establishments are omitted from the firm structure calculations. Results for the management sector did not meet standards for disclosure from the Census Bureau. Management establishments are not considered in the discussion of sectoral composition.

9
the wholesale trade sector, which accounted for 68 percent; manufacturing accounted 23 percent of
revenue and services for the remaining 8 percent. Approximately half of employment for firms in our
sample was in wholesale trade establishments, 33 percent in manufacturing, and 18 percent in services.
For each sector, we discuss the industries where the establishments of the fabless firms are
concentrated and whether these establishments should be classified to manufacturing based on their
activity. We provide three estimates of the size of semiconductor manufacturing industry with FGP
activity included, which we label “baseline,” “conservative” and “liberal.”
Wholesale Trade
Wholesale establishments of the fabless companies are concentrated in two industries: Other
Electronics Merchant Wholesalers (NAICS 423690), which includes wholesale trade in semiconductors,
and Computer and Computer Peripheral Equipment and Software Merchant Wholesalers (NAICS
423430). Because the convention used by the Census Bureau is to classify FGP establishments to
wholesale, we use the value of sales for all fabless company wholesale trade establishments as our
“baseline” estimate of the additional shipments in the semiconductor industry with FGP included.
However, it may be the case that some establishments of fabless companies are traditional
wholesale operations, rather than FGP.21 Of the fabless companies in wholesale trade, 45 percent
indicated they neither engage in product design nor purchase contract manufacturing services and these
may in fact be properly classified to the sector under the new definition. (Table 1) In our conservative
estimate of additional manufacturing, we reduce the baseline contribution by 45 percent to account for
establishments not reporting they perform design.
21 That said, we note the rather implausible result that about a quarter of the firms on our list with presence in the wholesale sector did not report either performing design/engineering or purchasing manufacturing services from any wholesale establishment, which suggests the responses to these questions should be used with caution for classification.
10
Services
Service establishments of the fabless companies are concentrated in three industries: Computer
Systems Design (NAICS 541512), Research and Development in the Physical, Engineering and Life
Sciences (NAICS 541710), and Engineering Services (NAICS 541330). Because as service establishments,
they do not indicate product sales as their primary activity, these respondents may well be simply
providing services to other establishments rather than directing the outsourced fabrication of product
designs. However, in our more liberal estimate, we include these establishments as well, under the
assumption that they may be directing fabrication of product designs but not recording the sale of the
products on their books.
Manufacturing
A surprisingly large share of the establishments of the FGP firms in our database was classified
to manufacturing, with the great majority found in the semiconductor industry (NAICS 334413). 22 This
suggests that many of these fabless companies perform some fabrication of semiconductors in addition
to creating designs to be manufactured under contract. This is consistent with the definition of
“fabless” employed by our data sources—as much as ¼ of semiconductor revenue may be from chips
fabricated by the company in house and the company will still be considered fabless—but our
understanding is that this hybrid approach is uncommon. That said, it is also possible these
establishments represent FGP classified to the manufacturing sector in 2002 and 2007. Naturally, these
manufacturing establishments do not need to be reclassified for our exercise as they fall under the new
definition of manufacturing as well as the old.
Semiconductor Manufacturing Including FGP
22 A small share of establishments is found in manufacturing industries focused on the production of final electronics.
11
We use our dataset of FGP semiconductor firm establishments in these three sectors to consider
the composition of the U.S. industry and the role it plays in the global value chain for semiconductors.
Using our “baseline” rule—all wholesale establishments of fabless firms are FGP—the value of
shipments in 2002 was $76 billion, 24 percent higher than the $61 billion reported under the current
NAICS system. Treating FGP as manufacturing, semiconductor industry shipments rose 3.7 percent
(annual rate) to $92 billion in 2007; this increase is only slightly faster than the 3.4 percent under the
current system. This is a striking result. The fabless portion of the global semiconductor industry
ballooned from $15 billion in 2002 to $54 billion in 2007 and as noted previously, U.S. companies
account for a very large share of global fabless revenue.23 This suggests that these companies were
expanding rapidly during this period, but that the additional revenue was coming primarily from
overseas establishments. While this is a tentative result at this stage of our research, it is consistent with
the notion that offshoring of fabrication “pulls” related steps in the value chain offshore over time.
To estimate of the share of domestic semiconductor production accounted for by fabless
semiconductor firms, we add the fabless company establishments already in the manufacturing sector
to our baseline estimate of the additional output moved to manufacturing under the 2017 NAICS
definition. On a gross value basis, the share of the semiconductor industry accounted for by plants of
FGP firms (including those already in manufacturing) is 29 percent in 2002, using our baseline estimate
of the size of the total semiconductor industry.
The range of estimates offered by our “liberal” and “conservative” rules for adding FGP firm
activity to manufacturing is wide. The “liberal” rule—adding revenue from both service sector and
wholesale establishments—implies a semiconductor manufacturing industry 29 percent larger in 2002
23 Our estimated value of sales for FGP establishments in wholesale trade is also $15 billion. U.S. companies account for most, but not all of the global fabless semiconductor shipments. Some of the domestic sales may be sale of IP in the form of designs, which accounts for a significant share of revenue for some fabless companies.

12
and the “conservative” rule—include a share of wholesale FGP firm activity corresponding to the
prevalence of product/design engineering combined with purchase of contract manufacturing—implies
an industry only 14 percent larger. Growth rates differ very little by the rule used; shipments increase
slightly faster when FGP is counted compared to the industry as currently defined. Which estimate is
the most appropriate for building a historical series will depend on the implementation of the FGP
concept when actually put into practice.24
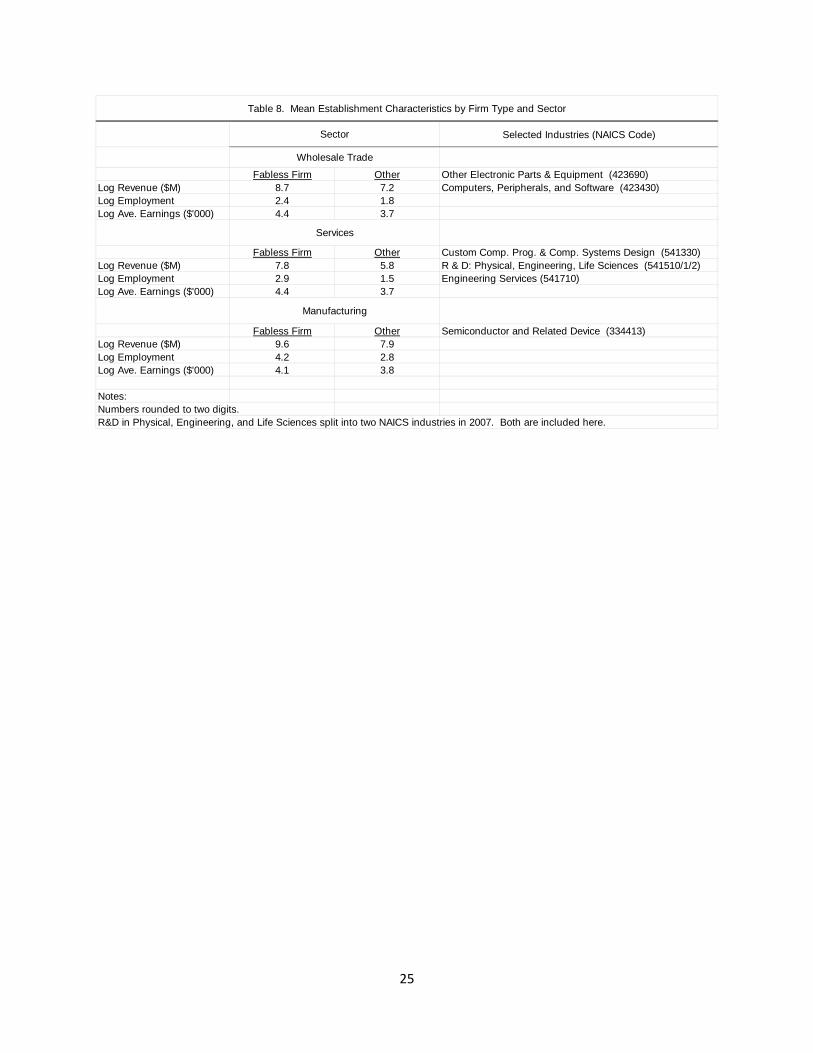
The composition of employment in the manufacturing sector is noticeably different with FGP
included in scope. As noted in table 8, the mean of the log earnings distribution is 4.1 for the
establishments of FGP firms already classified to manufacturing and 4.4 for FGP firm establishments in
wholesale trade and services. In contrast the mean of the log earnings distribution for manufacturing
establishments other than those in fabless firms is 3.8, substantially lower. This is consistent with higher
wage jobs, such as engineers and other technical professionals, forming a greater share of
manufacturing employment in the more broadly defined manufacturing sector.
Distinguishing features of FGP Establishments
Fabless semiconductor companies are a prominent example of FGP, but as shown in table 1, the
FGP business model is used in many industries. If company directories are available for other industries
with detail on the business model employed, we would favor using the same approach for them as we
have for semiconductors. Absent such resources, to construct historical estimates of FGP will require
leveraging what we can learn from semiconductors that may generalize to other industries. We find
that establishments devoted to FGP have a rather different character than their non‐FGP counterparts.
The discussion below focuses on the wholesale trade sector but the tables include results for services
and manufacturing for comparison purposes.
24 Detailed “bridge tables” showing estimates of industry output in 2017 under both the new and old definitions of manufacturing will be essential in this effort.
13
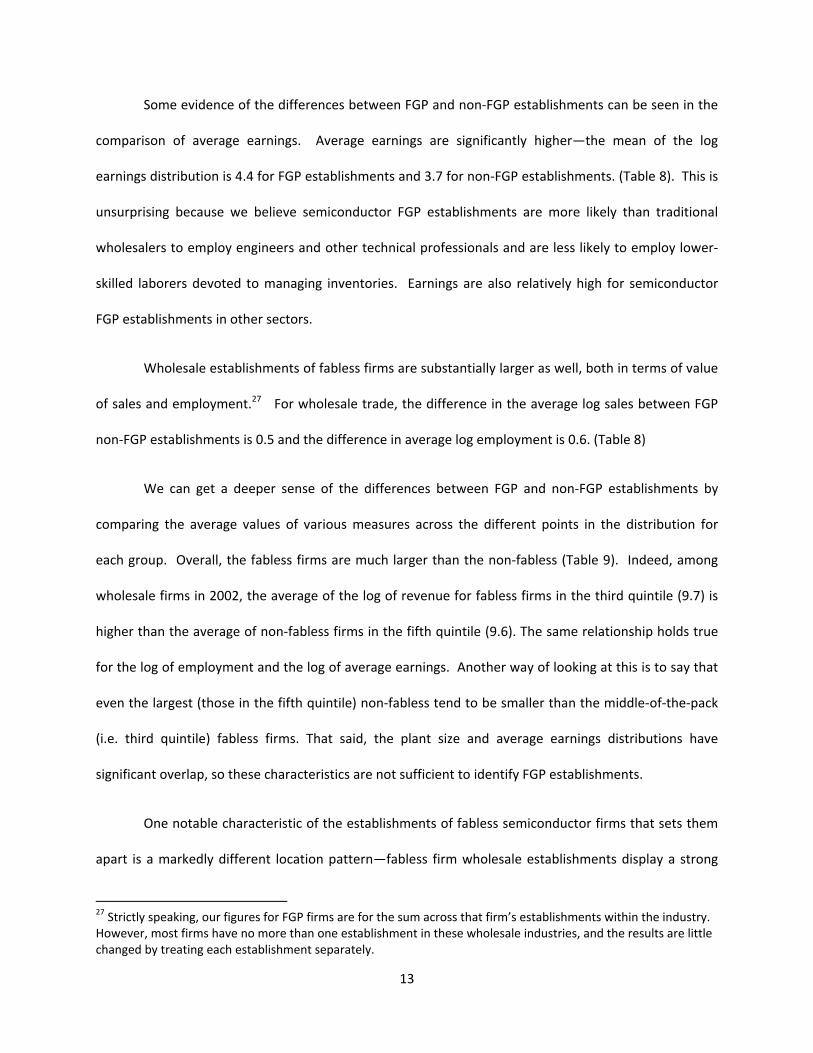
Some evidence of the differences between FGP and non‐FGP establishments can be seen in the
comparison of average earnings. Average earnings are significantly higher—the mean of the log
earnings distribution is 4.4 for FGP establishments and 3.7 for non‐FGP establishments. (Table 8). This is
unsurprising because we believe semiconductor FGP establishments are more likely than traditional
wholesalers to employ engineers and other technical professionals and are less likely to employ lower‐
skilled laborers devoted to managing inventories. Earnings are also relatively high for semiconductor
FGP establishments in other sectors.
Wholesale establishments of fabless firms are substantially larger as well, both in terms of value
of sales and employment.27 For wholesale trade, the difference in the average log sales between FGP
non‐FGP establishments is 0.5 and the difference in average log employment is 0.6. (Table 8)
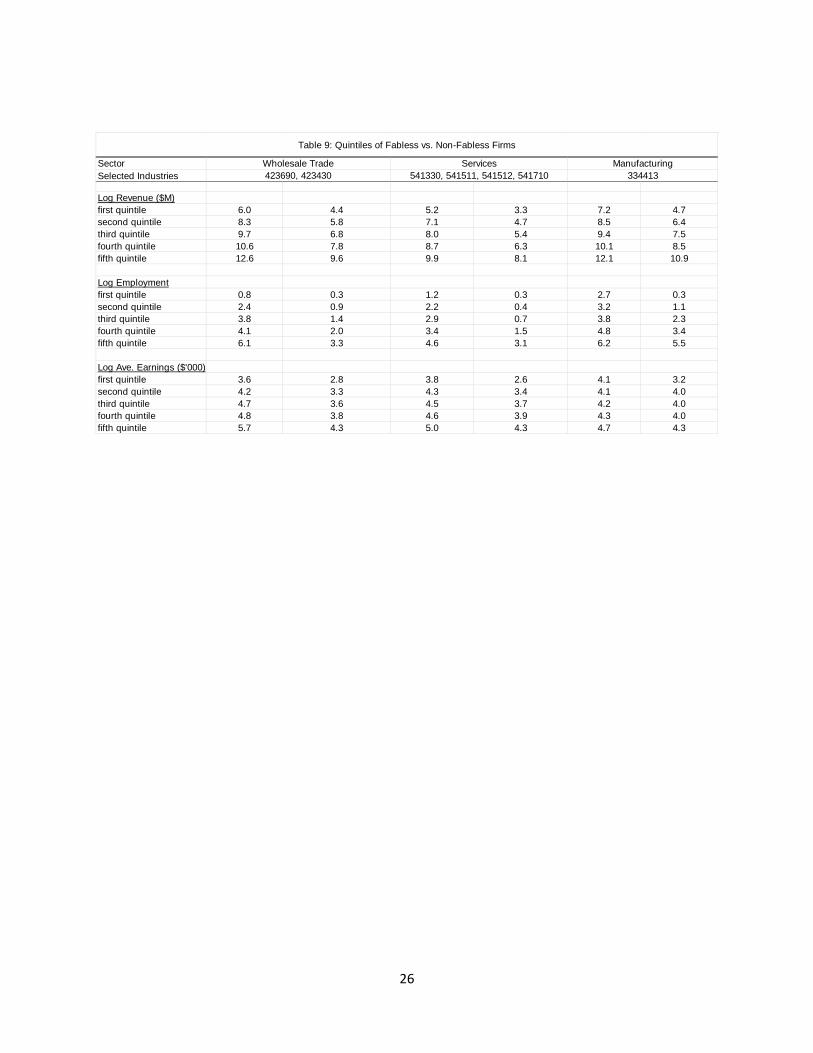
We can get a deeper sense of the differences between FGP and non‐FGP establishments by
comparing the average values of various measures across the different points in the distribution for
each group. Overall, the fabless firms are much larger than the non‐fabless (Table 9). Indeed, among
wholesale firms in 2002, the average of the log of revenue for fabless firms in the third quintile (9.7) is
higher than the average of non‐fabless firms in the fifth quintile (9.6). The same relationship holds true
for the log of employment and the log of average earnings. Another way of looking at this is to say that
even the largest (those in the fifth quintile) non‐fabless tend to be smaller than the middle‐of‐the‐pack
(i.e. third quintile) fabless firms. That said, the plant size and average earnings distributions have
significant overlap, so these characteristics are not sufficient to identify FGP establishments.
One notable characteristic of the establishments of fabless semiconductor firms that sets them
apart is a markedly different location pattern—fabless firm wholesale establishments display a strong
27 Strictly speaking, our figures for FGP firms are for the sum across that firm’s establishments within the industry. However, most firms have no more than one establishment in these wholesale industries, and the results are little changed by treating each establishment separately.
14
tendency to cluster. Approximately two‐thirds of wholesale revenue for fabless firms comes from plants
located in three metropolitan statistical areas (MSAs). (Table 10) In contrast, for non‐fabless firm
establishments within the two wholesale trade where the fabless establishments are located, the top
three MSAs account for only 26 percent of revenue and the top ten only 56 percent, compared to 87
percent for the top MSAs for fabless activity. This may well generalize to FGP establishments for other
products. While traditional wholesalers benefit from proximity to centers of population or business
activity, FGP establishments benefit from proximity to other establishments in their field. Design‐
intensive establishments benefit from highly active markets for specialized labor and other inputs.
Silicon Valley for electronics and New York City for apparel are well known examples. (Porter, 1998)
Thus we find that wholesale semiconductor FGP establishments are larger in size, both in terms
of sales and employment, have higher average earnings, and display more intense clustering behavior
than non‐FGP establishments in the same wholesale industries. These results suggest there is an
opportunity to construct a predicted probability that an establishment of certain characteristics is in fact
an FGP establishment, but we note that the prevalence of both very large and very small firms
complicates the problem. This exercise is left for future versions of the paper.
Conclusions
In the past two decades, manufacturing firms have pursued production sharing and offshore
outsourcing so aggressively that understanding the role played by U.S. manufacturing, broadly defined,
has become difficult with the economic statistics produced using the current classification system. For
example, if an establishment designs a product and fabricates it as well, the design employees and their
value added are attributed to the manufacturing sector. If, however, the establishment shifts to
fabrication to an offshore contract manufacturer and continues product design, the U.S. establishment
is likely to be moved out of the manufacturing sector. This development which certainly entails the loss

15
of the fabrication‐intensive “good jobs” that are a key focus of the offshoring discussion.28 However,
whether the associated design, engineering, and other non‐fabrication jobs are “lost” is an open
question; the activity may remain in the United States but be recorded in another sector.29 Thus the
decline in manufacturing and the perception that design work is moving offshore may be partially an
artifact of the classification system.
Also, many analysts either explicitly or implicitly have in mind a company‐level classification
system when they speak of “manufacturing”. Analysts in the financial sector routinely refer to U.S. FGP
companies as manufacturing and the SEC classifies many of these companies to that sector.31 In
practice, government industry statistics refer to collections of establishments with similar activities, not
companies selling similar goods or services. But for some discussions, the operative notion of
manufacturing is broad: the economic activity that takes place as enterprises take a product from
concept to delivery to the distribution channel.32 For other questions, the useful notion of
manufacturing is narrow: a set of plants which transform materials into products. When the
manufacturing process was predominantly organized around an integrated manufacturing business
model, the difference between these concepts for measurement may have been immaterial. As the
FGP/MSP model becomes more prevalent, this is clearly not the case.
28 Helper, Kreuger, and Wial (2012) note that “manufacturing provides high‐wage jobs, especially for workers who would otherwise earn the lowest wages.” 29 Furthermore, the ability to exploit gains from trade by assembling abroad may well spark the entry of new firms that intend, from the outset of activity to outsource all assembly, and entirely represent jobs “added” to the economy by virtue of this opportunity to outsource. The rise of U.S. fabless semiconductor production appears to be such a case. 31 For example, Nike is classified to Rubber Products and Footwear Manufacturing. Qualcomm, a fabless semiconductor firm, is classified to Radio & TV Broadcasting & Communication Equipment manufacturing by the SEC. 32 The Federal Register describes the announced revision to NAICS as a “clarification,” but also acknowledges that “the inclusion of revenues from FGP activities in manufacturing will effectively change the traditional definition of manufacturing.” (Office of Management and Budget, 2011)

16
The clarification in the revised NAICS to be implemented in 2017, giving explicit guidance that
FGP establishments should be included in manufacturing is an important step toward more accurately
measuring their activity. The revision will be a particularly welcome change if statistics are constructed
in a way that allows one to employ either the narrow or the broad definition of manufacturing,
depending on the question at hand. If statistical programs have the support to collect the information
needed to separately identify FGP, IDM and MSP establishments within the manufacturing sector, the
data will be especially useful.
The limited information available appears to indicate that 2017 NAICS will introduce a
substantial discontinuity into the statistics for the manufacturing sector. Once these changes are in
place, for many questions it will be essential to have a consistent history constructed on the new basis.
This paper makes some progress toward that goal. By combining detailed company directory data with
Economic Census microdata, we establish that for semiconductors, manufacturing would be
approximately 25 percent larger in 2002 and 2007 using our “baseline” estimate, but there would only
be a small increase in the rate of growth. There is evidence in Census surveys that the FGP phenomenon
is widespread across many manufacturing industries. Absent similar company information for other
industries, establishments will have to be classified as FGP by observed characteristics. Using
semiconductors as a test case, we find that FGP establishments differ substantially from other wholesale
establishments along observable dimensions, suggesting there is some prospect of identifying FGP
establishments historically classified to wholesale trade and constructing a historical index.

17
Data Appendix
To generate our list of Census firm identifiers corresponding to fabless companies, we began
with a list of 1,579 fabless companies created from a directory published in 2012 by Global
Semiconductor Alliance (GSA), a directory published in 2001 from Gartner, and supplemental list from
GSA of mergers and acquisitions between 2005 and 2012 from GSA. 33 We reviewed public records for
these companies to amend incomplete records. Eliminating companies that we believe were not
operational in either 2002 or 2007 based on review of public records left us with 1,475 companies which
we tried to match to the Census Business Register (BR). The list contains the name, headquarters
address, and year of occurrence for major events (establishment, dissolution, merger, acquisition) for
each company.
To link up the directory‐based list with the Census data, we used the name and address
matching algorithm developed in Smith (2013), which proceeds in two stages. First, for 2002 and 2007
we matched all companies in operation in either Census year to a three year window of the Business
Register ending in the Census year. For this first stage, we only exploit the company name, finding the
name or names in the Register matching the greatest number of leading characters for the Fabless
company name. We then randomly reviewed 1,000 of the approximately 40,000 potential matches
generated and judged whether the entries were a match when considering both full name information
and address variables. This set of matches was used to estimate the importance of all available match
quality variables, including an indicator of state match, number of leading digits of the zip code in
common, company name spelling distance, address spelling distance, and whether the establishment
operated in a high tech industry using a probit. The estimated index function was then used to rank
possible matches for each company in our list, which we reviewed in descending order until we judged
we had found a match or that there was no match for the company.
33 Both the GSA and Gartner directories contained companies from around the world. We attempted to find
matches for both foreign and domestically headquartered companies because we assumed many of the foreign
companies would have a U.S. presence. For the foreign companies we were forced to rely on only name matching
characteristics.
18
References
Byrne,David, Brian Kovak and Ryan Michaels (2013). "Price and quality dispersion in an offshoring market: Evidence from semiconductor production services," working paper, Finance and Economics Discussion Series, Divisions of Research & Statistics and Monetary Affairs, Federal Reserve Board, Washington, D.C., February, 2013.
Doherty,Maureen (2013). "Reflecting factoryless goods production in the U.S. statistical system," Paper prepared for the conference on "Measuring effects of globalization", February 28, 2013.
Fort,Teresa (2011). "Breaking up is hard to do: Why firms fragment production across locations," working paper, University of Maryland, November 21, 2011.
Helper, Susan, Timothy Krueger, and Howard Wial (2012), "Why does manufacturing matter? Which manufacturing matters?" Washington, D.C.: Brookings Institution, February 2012.
Jarmin, Ron, C. J. Krizan, and John P. Tang (2011). "Outsourcing, offshoring, and trade: Identifying foreign activity across Census data products," Survey of Current Business, vol. 91 (2), pp. 121,122-139.
Jarmin, Ron, and Javier Miranda (2002). "The Longitudinal Business Database," Working Papers, Center for Economic Studies, U.S. Census Bureau, vol. 2 (17), .
Kamal,Fariha, Brent R. Moulton and Jennifer Ribarsky (2013). "Measuring "factoryless" manufacturing: Evidence from U.S. Surveys," Paper prepared for conference on "Measuring Effects of Globalization", February 28, 2013.
Kraemer, Kenneth L., Jason Dedrick, and Deborah Dunkle (2010). "Offshoring of npd in the electronics industry: Patterns and recession effects". University of California, Irvine: Personal Computing Industry Center, .
Murphy,John (2009). "Classification of units that outsource manufacturing transformation activities," mimeo received August 6, 2009, April 2009.
Office of Management and Budget (2011). "North American Industry Classification System; Revision for 2012," Federal Register, vol. 76 (159), pp. 51240,51241-51243.
———. (2007). North American Industry Classification System; United States, 2007. Springfield, VA: National Technical Information Service.
Porter, Michael (1998). "Clusters and the new economics of competition," Harvard business review, vol. 76 (6), pp. 77,78-90.
Smith,Dominic (2013). "Probabilistic name and address matching," Working paper, Washington, D.C., December 12, 2012.
19
NAICSCode
Industry DescriptionDesign/
Engineer Products Sold
Purchase Contract
Manufacturing Services
Both Either
Durable Goods4231 Motor Vehicles and Parts 8% 13% 3% 18%4232 Furniture and Home Furnishing 25% 26% 10% 41%4233 Lumber & Other Construction Materials 14% 20% 4% 30%4234 Professional & Commercial Equip. & Supp. 19% 18% 7% 30%4235 Metal & Mineral 15% 26% 5% 36%4236 Electrical & Electronic Goods 21% 20% 7% 34%4237 Hardware, Plumbing, Heating Equip. & Supp. 15% 17% 4% 28%4238 Machinery, Equip. & Supp. 19% 22% 7% 34%4239 Misc. Durable Goods 25% 21% 10% 36%
Nondurable Goods4241 Paper & Paper Products 22% 25% 10% 37%4242 Drugs & Druggist Sundries 22% 26% 11% 37%4243 Apparel, Piece Goods, & Notions 42% 35% 21% 56%4244 Grocery & Related 13% 14% 4% 23%4245 Farm Product Raw Material 6% 6% 1% 11%4246 Chemical & Allied Products 24% 24% 8% 40%4247 Petroleum & Petroleum Products 3% 8% 1% 10%4248 Beer, Wine, Distilled Alcoholic Bev. 5% 14% 1% 18%4249 Misc. Nondurable Goods 21% 17% 7% 31%
Total 18% 20% 6% 32%
Memo:Establishments of Fabless Companies 51% 22% 18% 55%Firms of Fabless Companies 67% 56% 48% 75%
Source: Census of Wholesale Trade
Response rate was approximately 50 percent. Special question was on all Census of Wholesale Trade forms in 2002. Establishments reclassified to wholesale trade during Census processing did not receive a survey form with this question.
Table 1a. Performance of Product Design/Engineeringand Use of Contract Manufacturing Services
Share of Merchant Wholesale Establishments, 2002
Notes:

20
NAICSCode
Industry DescriptionDesign/
Engineer Products Sold
Purchase Contract
Manufacturing Services
Both Either
Durable Goods4231 Motor Vehicles and Parts 8% 13% 3% 18%4232 Furniture and Home Furnishing 25% 26% 10% 41%4233 Lumber & Other Construction Materials 14% 20% 4% 30%4234 Professional & Commercial Equip. & Supp. 19% 18% 7% 30%4235 Metal & Mineral 15% 26% 5% 36%4236 Electrical & Electronic Goods 21% 20% 7% 34%4237 Hardware, Plumbing, Heating Equip. & Supp. 15% 17% 4% 28%4238 Machinery, Equip. & Supp. 19% 22% 7% 34%4239 Misc. Durable Goods 25% 21% 10% 36%
Nondurable Goods4241 Paper & Paper Products 22% 25% 10% 37%4242 Drugs & Druggist Sundries 22% 26% 11% 37%4243 Apparel, Piece Goods, & Notions 42% 35% 21% 56%4244 Grocery & Related 13% 14% 4% 23%4245 Farm Product Raw Material 6% 6% 1% 11%4246 Chemical & Allied Products 24% 24% 8% 40%4247 Petroleum & Petroleum Products 3% 8% 1% 10%4248 Beer, Wine, Distilled Alcoholic Bev. 5% 14% 1% 18%4249 Misc. Nondurable Goods 21% 17% 7% 31%
Total 18% 20% 6% 32%
Memo:Establishments of Fabless Companies 51% 22% 18% 55%Firms of Fabless Companies 67% 56% 48% 75%
Source: Census of Wholesale Trade
Response rate was approximately 50 percent. Special question was on all Census of Wholesale Trade forms in 2002. Establishments reclassified to wholesale trade during Census processing did not receive a survey form with this question.
Table 1a. Performance of Product Design/Engineeringand Use of Contract Manufacturing Services
Share of Merchant Wholesale Establishments, 2002
Notes:
21
Year Cost Source
2012 $10 B EETimes (TSMC Fab 15, Taichung, Tawian)
2009 $4.2 B Press Release (Global Foundries Fab 2, Saratoga, NY)
2006 $2 B EETimes (Intel Fab 24, Leixlip, Ireland)
2002 $2‐3 B Standard & Poors
1997 $1‐2 B Scientific American
1992 $600 M Status: A Report on the Integrated Circuit Industry
1990 $400 M Status: A Report on the Integrated Circuit Industry
1987 $50‐200 M Status: A Report on the Integrated Circuit Industry
1983 $50‐60 M Status: A Report on the Integrated Circuit Industry
1977 several M Status: A Report on the Integrated Circuit Industry
1970 $6 M IC Knowledge Report
Table 2. Cost of Building and Equipping a Semiconductor Fab
22
Company Headquarters Location Revenue $B
1 QUALCOMM - QCT Division San Diego, CA 9.82 Broadcom Corporation - Product DivisionIrvine, CA 7.23 Advanced Micro Devices, Inc. (AMD) Sunnyvale, CA 6.64 NVIDIA Corporation Santa Clara, CA 4.05 SanDisk Corporation - OEM Division Milpitas, CA 3.56 Marvell Semiconductor, Inc. Santa Clara, CA 3.47 MediaTek Inc. Hsinchu, Taiwan 2.9
8 Avago TechnologiesSan Jose, CA andSingapore
2.3
9 Xilinx, Inc. San Jose, CA 2.310 Altera Corporation San Jose, CA 2.1
Total, top 10 44.0
Memo:Total, all fabless 73.7Total, all fabless 307.1Share 59.7%
Table 3. Top Fabless Semiconductor Companies by Sales, 2011Source. Global Semiconductor Alliance
Note: The operating headquarters of Marvell Semiconductor is in Santa Clara, but the company is incorporated in Bermuda.

23
Country Share (pct.)Taiwan 48.9China 22.0Singapore 10.3United States 3.0Europe, Israel 7.8Japan 3.2Korea 2.9Malaysia 1.8
Table 4. Foundry Capacity by Country, 2011Source. IHS iSuppli.
Note: Capacity in 8-inch equivalent wafers.
Company List 1,475 Matched to Business Register 1,050 Total Firmids 1,125
Matched to 2002 EC Establishments 525 Matched to 2007 EC Establishments 525 Matched to either 2002 or 2007 750
Note: Rounded to nearest 25
Table 5. Match Statistics
24
Category 2002 2007
Total 525 525 Single Unit 450 470 Manufacturing 105 100 Wholesale 130 120 Services 220 245 Multi-Unit 70 55 3 Sectors 15 10 2 Sectors 25 20 1 Sector 30 20
Notes:Excludes management establishments.
Table 6. Firms by Establishment Structure
Rounded to nearest 5.Numbers may not sum to totals due to rounding.
Sector Sales $B Employment '000
Total 22 55Wholesale 15 27Services 1.8 10Manufacturing 5.0 18
Total 26 55Wholesale 19 29Services 1.8 12Manufacturing 4.5 14
Notes:Establishment counts rounded to nearest 50.Sales and employment rounded to two digits.Numbers may not sum to totals due to rounding.
2002
2007
Table 7. Sector Distribution of Fabless Firm Activity
25
Selected Industries (NAICS Code)
Fabless Firm Other Other Electronic Parts & Equipment (423690)Log Revenue ($M) 8.7 7.2 Computers, Peripherals, and Software (423430)Log Employment 2.4 1.8Log Ave. Earnings ($'000) 4.4 3.7
Fabless Firm Other Custom Comp. Prog. & Comp. Systems Design (541330)Log Revenue ($M) 7.8 5.8 R & D: Physical, Engineering, Life Sciences (541510/1/2)Log Employment 2.9 1.5 Engineering Services (541710)Log Ave. Earnings ($'000) 4.4 3.7
Fabless Firm Other Semiconductor and Related Device (334413)Log Revenue ($M) 9.6 7.9Log Employment 4.2 2.8Log Ave. Earnings ($'000) 4.1 3.8
Notes:Numbers rounded to two digits.R&D in Physical, Engineering, and Life Sciences split into two NAICS industries in 2007. Both are included here.
Table 8. Mean Establishment Characteristics by Firm Type and Sector
Wholesale Trade
Services
Manufacturing
Sector
26
SectorSelected Industries
Log Revenue ($M)first quintile 6.0 4.4 5.2 3.3 7.2 4.7second quintile 8.3 5.8 7.1 4.7 8.5 6.4third quintile 9.7 6.8 8.0 5.4 9.4 7.5fourth quintile 10.6 7.8 8.7 6.3 10.1 8.5fifth quintile 12.6 9.6 9.9 8.1 12.1 10.9
Log Employmentfirst quintile 0.8 0.3 1.2 0.3 2.7 0.3second quintile 2.4 0.9 2.2 0.4 3.2 1.1third quintile 3.8 1.4 2.9 0.7 3.8 2.3fourth quintile 4.1 2.0 3.4 1.5 4.8 3.4fifth quintile 6.1 3.3 4.6 3.1 6.2 5.5
Log Ave. Earnings ($'000)first quintile 3.6 2.8 3.8 2.6 4.1 3.2second quintile 4.2 3.3 4.3 3.4 4.1 4.0third quintile 4.7 3.6 4.5 3.7 4.2 4.0fourth quintile 4.8 3.8 4.6 3.9 4.3 4.0fifth quintile 5.7 4.3 5.0 4.3 4.7 4.3
Table 9: Quintiles of Fabless vs. Non-Fabless Firms
Wholesale Trade Services Manufacturing423690, 423430 541330, 541511, 541512, 541710 334413

27
MSA Sales Share MSA Sales Share1 43 1 102 11 2 83 11 3 84 6 4 75 3 5 66 3 6 57 3 7 38 3 8 39 2 9 3
10 2 10 3
Total 87 Total 56
Notes:MSA rankings generated separately for fabless and non-fabless companies.
Other Firms
Table 10. Geographic Concentration of Wholesale Sales
Fabless Semiconductor Firms
28
Figure 1. Questions from 2002 Census of Wholesale Trade
Figure 2. Selected Questions from 2007 Census of Wholesale Trade
29
Figure 3. Selected Questions from 2012 Census of Wholesale Trade

30
0.0%
5.0%
10.0%
15.0%
20.0%
25.0%
30.0%
1993
1994
1995
1996
1997
1998
1999
2000
2001
2002
2003
2004
2005
2006
2007
2008
2009
2010
2011
2012
Sh
are
of
Sem
ico
nd
uct
or
Sh
ipm
pen
tsFigure 4. Fabless Semiconductor Shipments
Source. Global Semiconductor Alliance