the scientific method: tutorial start from beginning designing the experiment variable practice...
TRANSCRIPT
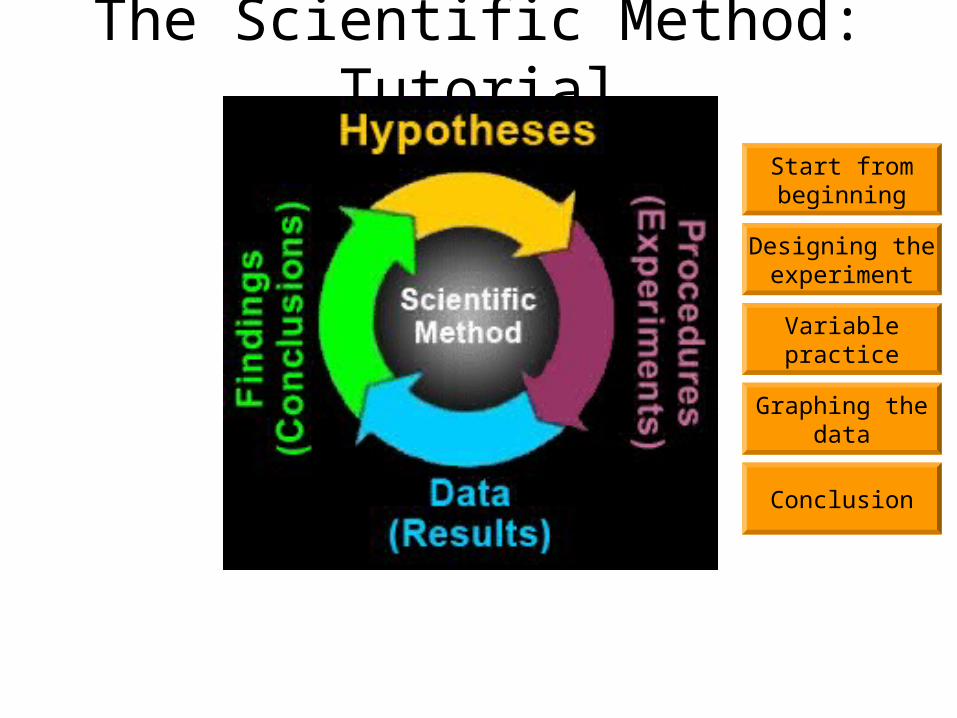
The Scientific Method: Tutorial
Start frombeginning
Designing theexperiment
Variablepractice
Graphing thedata
Conclusion
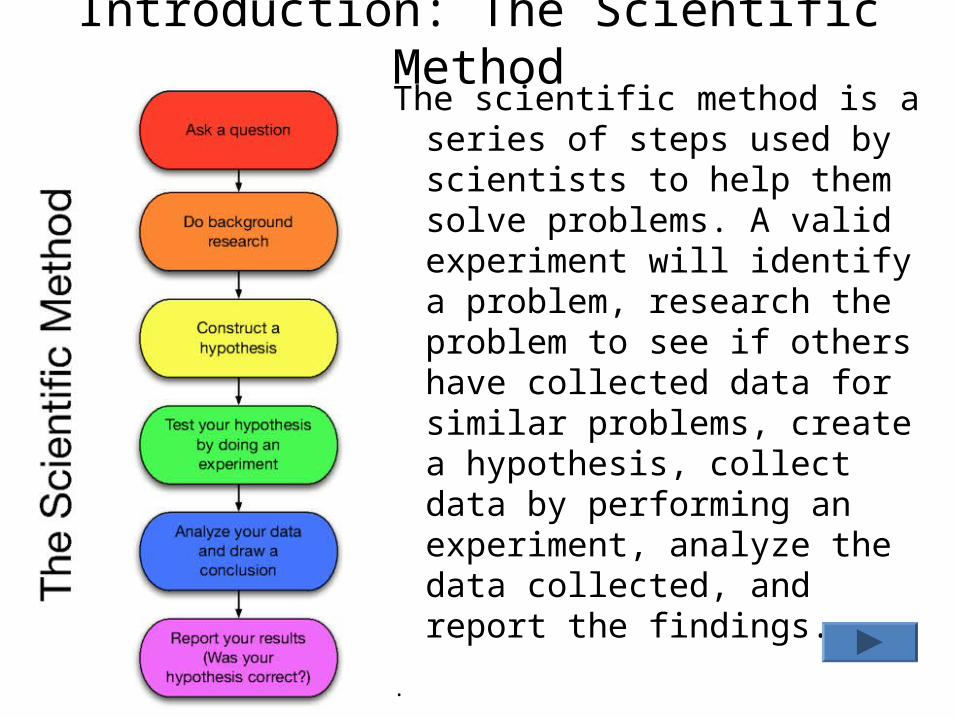
Introduction: The Scientific MethodThe scientific method is a series
of steps used by scientists to help them solve problems. A valid experiment will identify a problem, research the problem to see if others have collected data for similar problems, create a hypothesis, collect data by performing an experiment, analyze the data collected, and report the findings.
.
Experimental Design
• Setting up the experiment can be the toughest part of the scientific method for young scientists. A poorly designed experiment can make your data hard to understand and even meaningless. Therefore, the purpose of this tutorial is to help you learn basic fundamentals to help you design an experiment and interpret the data collected.
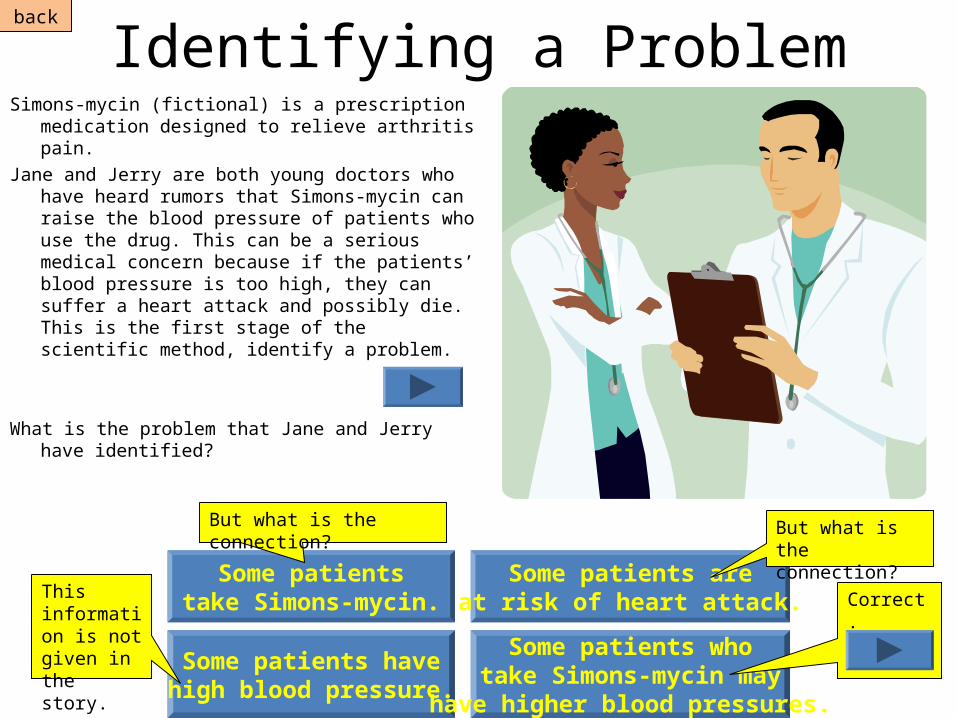
Identifying a ProblemSimons-mycin (fictional) is a prescription
medication designed to relieve arthritis pain.
Jane and Jerry are both young doctors who have heard rumors that Simons-mycin can raise the blood pressure of patients who use the drug. This can be a serious medical concern because if the patients’ blood pressure is too high, they can suffer a heart attack and possibly die. This is the first stage of the scientific method, identify a problem.
What is the problem that Jane and Jerry have identified?
Some patientstake Simons-mycin.
Some patients havehigh blood pressure.
Some patients areat risk of heart attack.
Some patients whotake Simons-mycin may
have higher blood pressures.
But what is the connection? But what is the connection?
This information is not given in the story.
Correct.
back
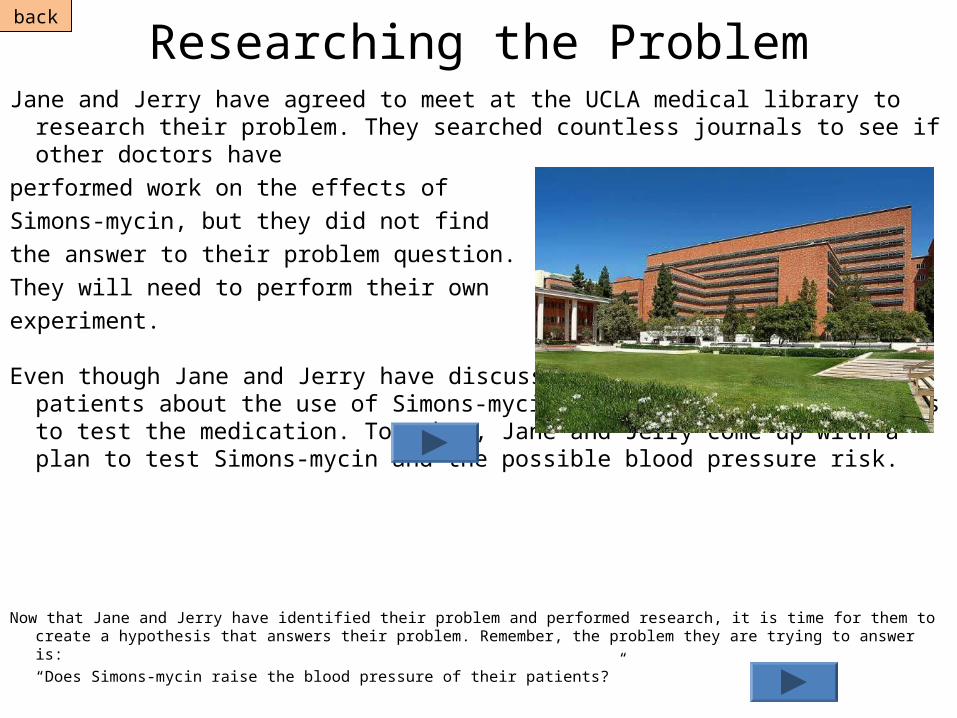
Researching the ProblemJane and Jerry have agreed to meet at the UCLA medical library to research their
problem. They searched countless journals to see if other doctors have
performed work on the effects of
Simons-mycin, but they did not find
the answer to their problem question.
They will need to perform their own
experiment.
Even though Jane and Jerry have discussed the risks with their patients about the use of Simons-mycin, they have found volunteers to test the medication. Together, Jane and Jerry come up with a plan to test Simons-mycin and the possible blood pressure risk.
Now that Jane and Jerry have identified their problem and performed research, it is time for them to create a hypothesis that answers their problem. Remember, the problem they are trying to answer is:
“Does Simons-mycin raise the blood pressure of their patients?”
back
Now that Jane and Jerry have identified their problem and performed research, it is time for them to create a hypothesis that answers their problem. Remember, the problem they are trying to answer is:“Does Simons-mycin raise the blood pressure of their patients?”
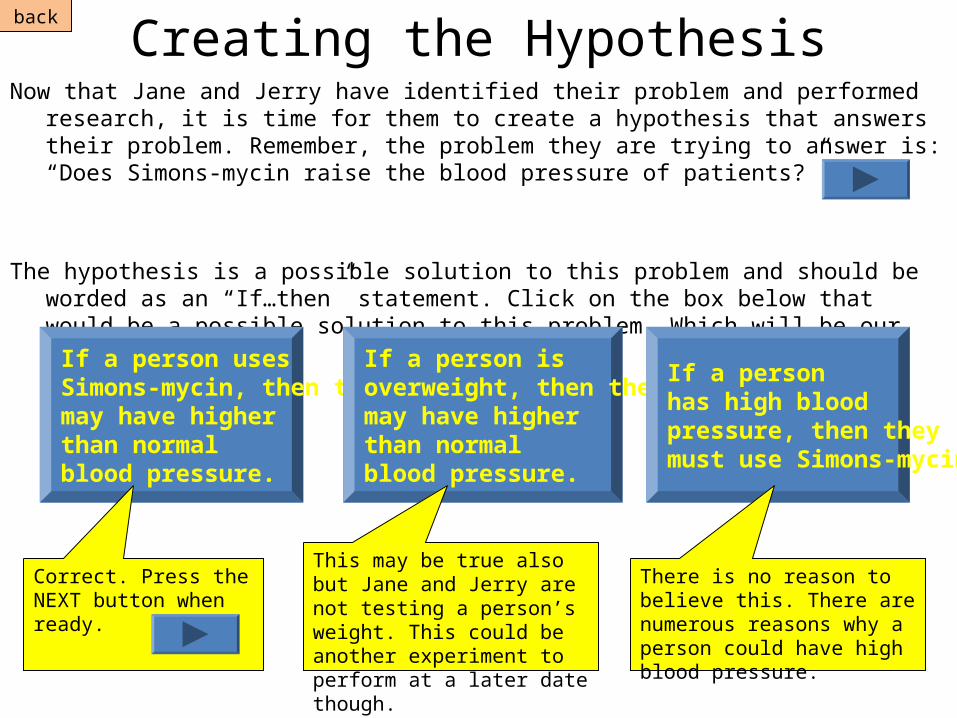
Creating the HypothesisNow that Jane and Jerry have identified their problem and performed research, it is time for
them to create a hypothesis that answers their problem. Remember, the problem they are trying to answer is: “Does Simons-mycin raise the blood pressure of patients?”
The hypothesis is a possible solution to this problem and should be worded as an “If…then” statement. Click on the box below that would be a possible solution to this problem. Which will be our hypothesis?
If a person usesSimons-mycin, then theymay have higherthan normalblood pressure.
If a person isoverweight, then theymay have higherthan normalblood pressure.
If a personhas high bloodpressure, then theymust use Simons-mycin.
This may be true also but Jane and Jerry are not testing a person’s weight. This could be another experiment to perform at a later date though.
There is no reason to believe this. There are numerous reasons why a person could have high blood pressure.
Correct. Press the NEXT button when ready.
back
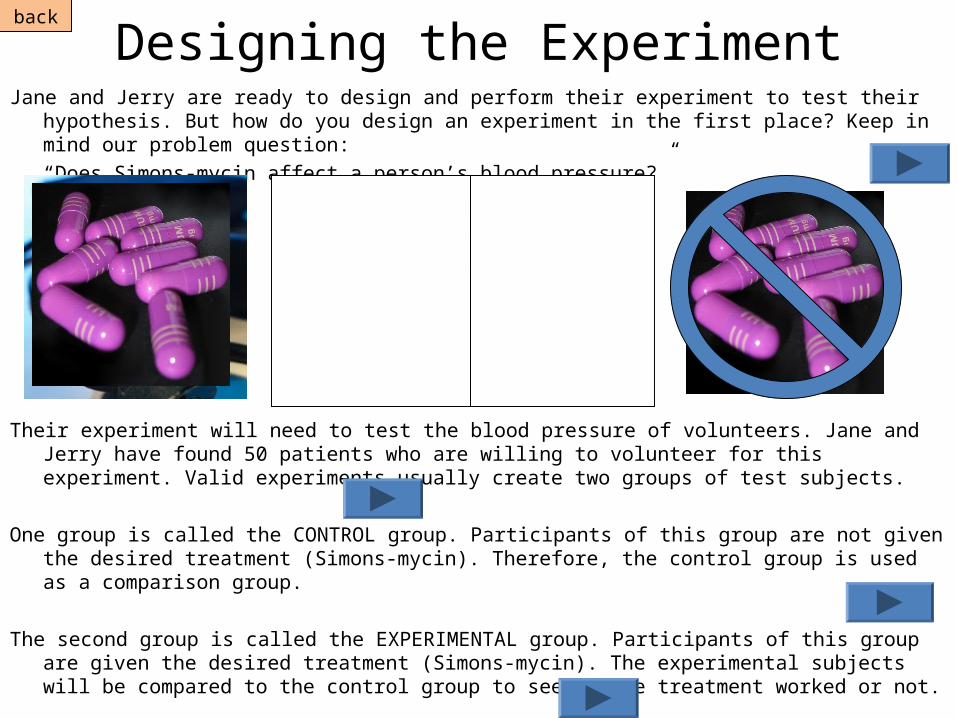
Designing the ExperimentJane and Jerry are ready to design and perform their experiment to test their hypothesis. But how
do you design an experiment in the first place? Keep in mind our problem question:
“Does Simons-mycin affect a person’s blood pressure?”
Their experiment will need to test the blood pressure of volunteers. Jane and Jerry have found 50 patients who are willing to volunteer for this experiment. Valid experiments usually create two groups of test subjects.
One group is called the CONTROL group. Participants of this group are not given the desired treatment (Simons-mycin). Therefore, the control group is used as a comparison group.
The second group is called the EXPERIMENTAL group. Participants of this group are given the desired treatment (Simons-mycin). The experimental subjects will be compared to the control group to see if the treatment worked or not.
back
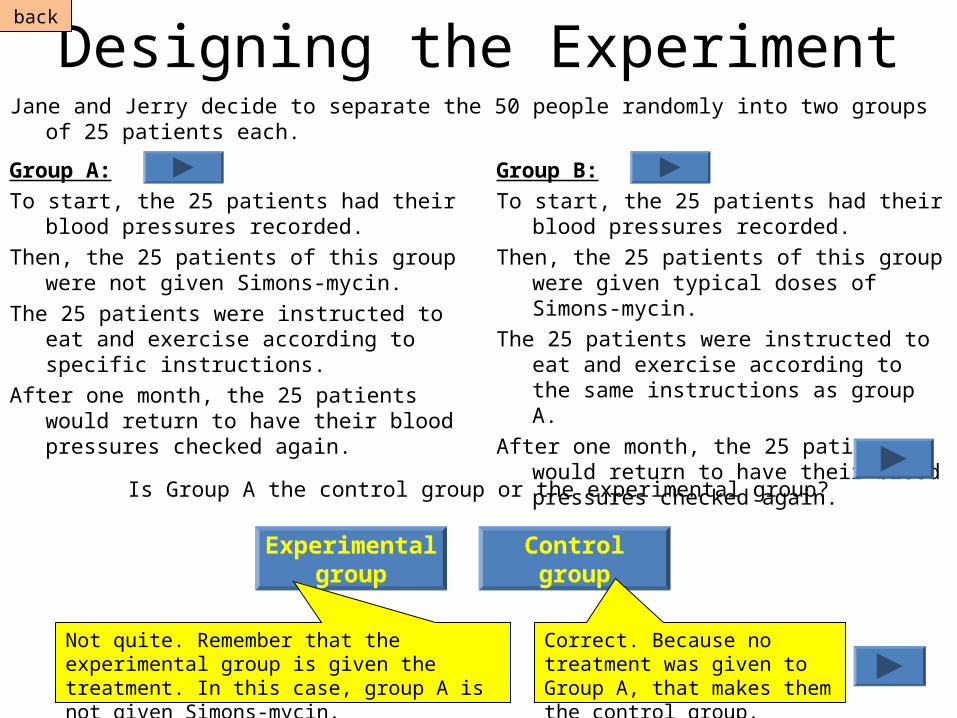
Designing the ExperimentJane and Jerry decide to separate the 50 people randomly into two groups of 25 patients each.
Group A:
To start, the 25 patients had their blood pressures recorded.
Then, the 25 patients of this group were not given Simons-mycin.
The 25 patients were instructed to eat and exercise according to specific instructions.
After one month, the 25 patients would return to have their blood pressures checked again.
Group B:
To start, the 25 patients had their blood pressures recorded.
Then, the 25 patients of this group were given typical doses of Simons-mycin.
The 25 patients were instructed to eat and exercise according to the same instructions as group A.
After one month, the 25 patients would return to have their blood pressures checked again.
Controlgroup
Experimentalgroup
Is Group A the control group or the experimental group?
Not quite. Remember that the experimental group is given the treatment. In this case, group A is not given Simons-mycin.
Correct. Because no treatment was given to Group A, that makes them the control group.
back
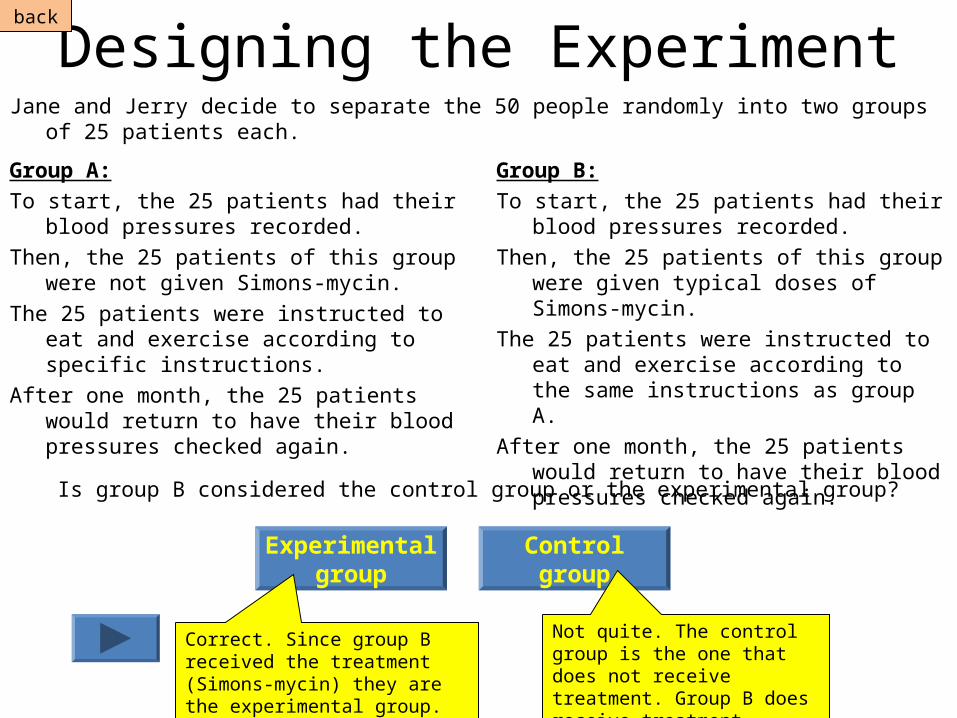
Designing the ExperimentJane and Jerry decide to separate the 50 people randomly into two groups of 25 patients each.
Controlgroup
Experimentalgroup
Is group B considered the control group or the experimental group?
Correct. Since group B received the treatment (Simons-mycin) they are the experimental group.
Not quite. The control group is the one that does not receive treatment. Group B does receive treatment.
Group A:
To start, the 25 patients had their blood pressures recorded.
Then, the 25 patients of this group were not given Simons-mycin.
The 25 patients were instructed to eat and exercise according to specific instructions.
After one month, the 25 patients would return to have their blood pressures checked again.
Group B:
To start, the 25 patients had their blood pressures recorded.
Then, the 25 patients of this group were given typical doses of Simons-mycin.
The 25 patients were instructed to eat and exercise according to the same instructions as group A.
After one month, the 25 patients would return to have their blood pressures checked again.
back
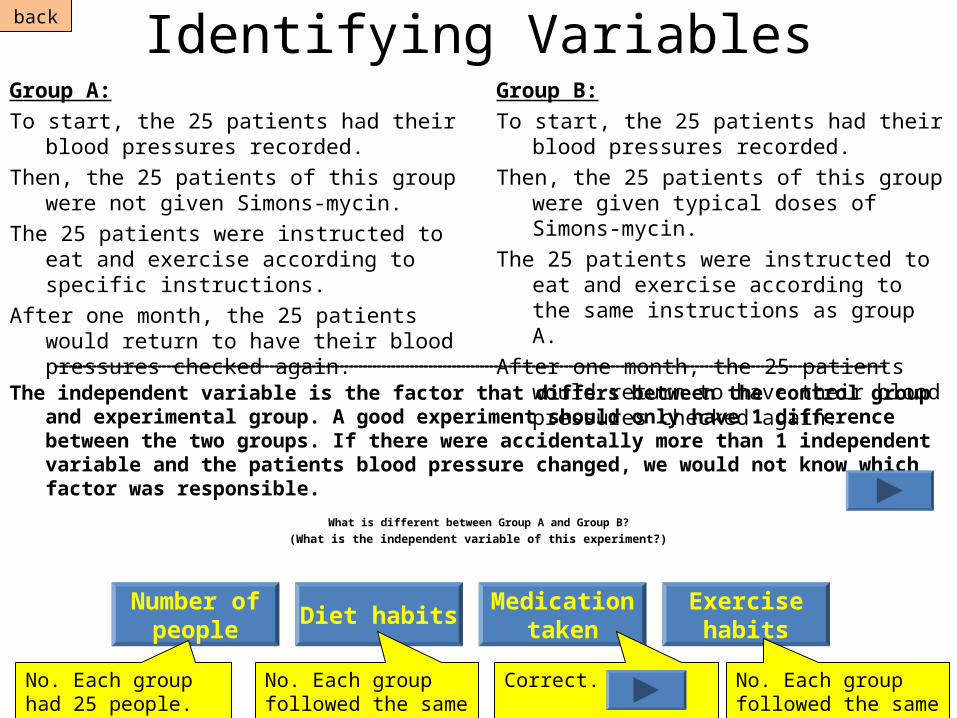
Identifying Variables
What is different between Group A and Group B?
(What is the independent variable of this experiment?)
Number ofpeople
Diet habitsMedication
takenExercise
habits
The independent variable is the factor that differs between the control group and experimental group. A good experiment should only have 1 difference between the two groups. If there were accidentally more than 1 independent variable and the patients blood pressure changed, we would not know which factor was responsible.
No. Each group had 25 people.
No. Each group followed the same habits.
No. Each group followed the same habits.
Correct.
Group A:
To start, the 25 patients had their blood pressures recorded.
Then, the 25 patients of this group were not given Simons-mycin.
The 25 patients were instructed to eat and exercise according to specific instructions.
After one month, the 25 patients would return to have their blood pressures checked again.
Group B:
To start, the 25 patients had their blood pressures recorded.
Then, the 25 patients of this group were given typical doses of Simons-mycin.
The 25 patients were instructed to eat and exercise according to the same instructions as group A.
After one month, the 25 patients would return to have their blood pressures checked again.
back
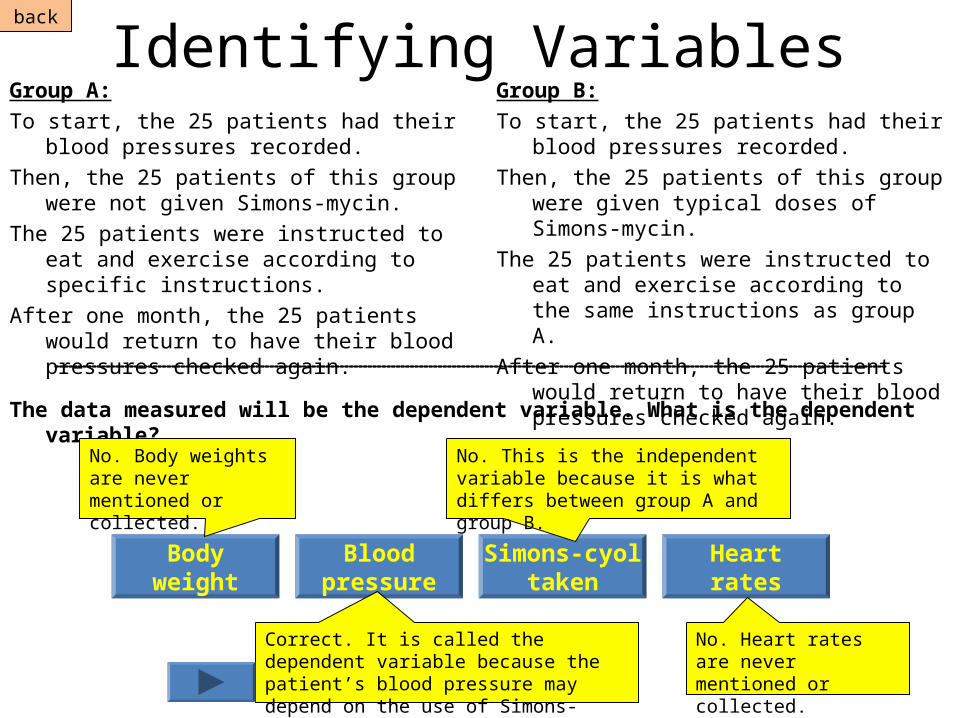
Identifying Variables
Bodyweight
Bloodpressure
Simons-cyoltaken
Heartrates
The data measured will be the dependent variable. What is the dependent variable?
No. Body weights are never mentioned or collected.
No. This is the independent variable because it is what differs between group A and group B.
No. Heart rates are never mentioned or collected.
Correct. It is called the dependent variable because the patient’s blood pressure may depend on the use of Simons-mycin.
Group A:
To start, the 25 patients had their blood pressures recorded.
Then, the 25 patients of this group were not given Simons-mycin.
The 25 patients were instructed to eat and exercise according to specific instructions.
After one month, the 25 patients would return to have their blood pressures checked again.
Group B:
To start, the 25 patients had their blood pressures recorded.
Then, the 25 patients of this group were given typical doses of Simons-mycin.
The 25 patients were instructed to eat and exercise according to the same instructions as group A.
After one month, the 25 patients would return to have their blood pressures checked again.
back
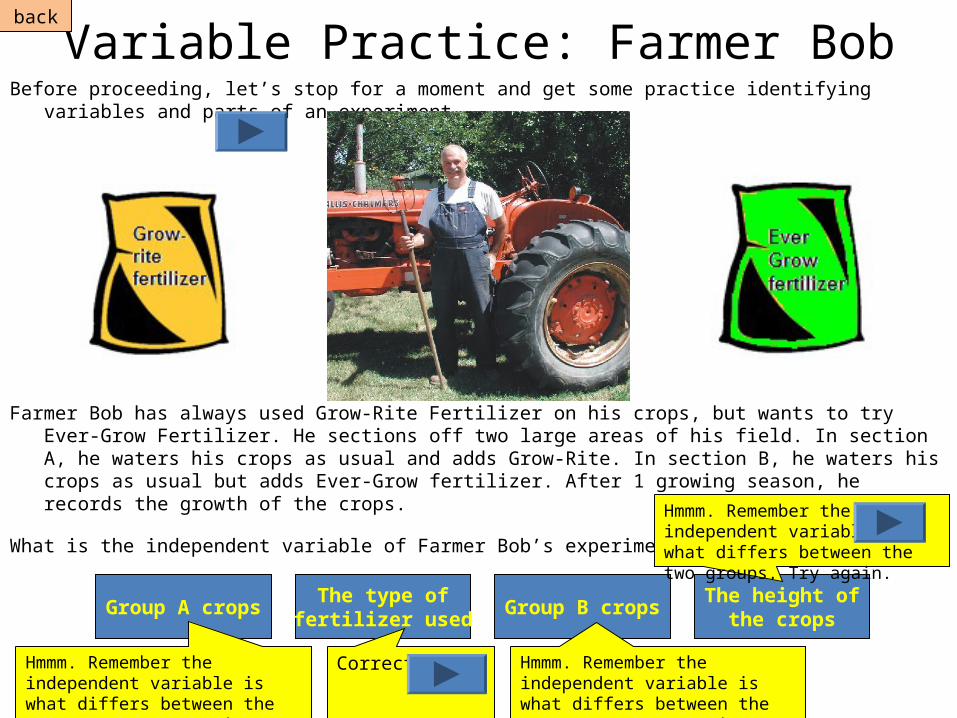
Variable Practice: Farmer BobBefore proceeding, let’s stop for a moment and get some practice identifying variables and parts of an
experiment.
Farmer Bob has always used Grow-Rite Fertilizer on his crops, but wants to try Ever-Grow Fertilizer. He sections off two large areas of his field. In section A, he waters his crops as usual and adds Grow-Rite. In section B, he waters his crops as usual but adds Ever-Grow fertilizer. After 1 growing season, he records the growth of the crops.
What is the independent variable of Farmer Bob’s experiment?
The type offertilizer used
Group A crops Group B cropsThe height of
the crops
Correct.Hmmm. Remember the independent variable is what differs between the two groups. Try again.
Hmmm. Remember the independent variable is what differs between the two groups. Try again.
Hmmm. Remember the independent variable is what differs between the two groups. Try again.
back
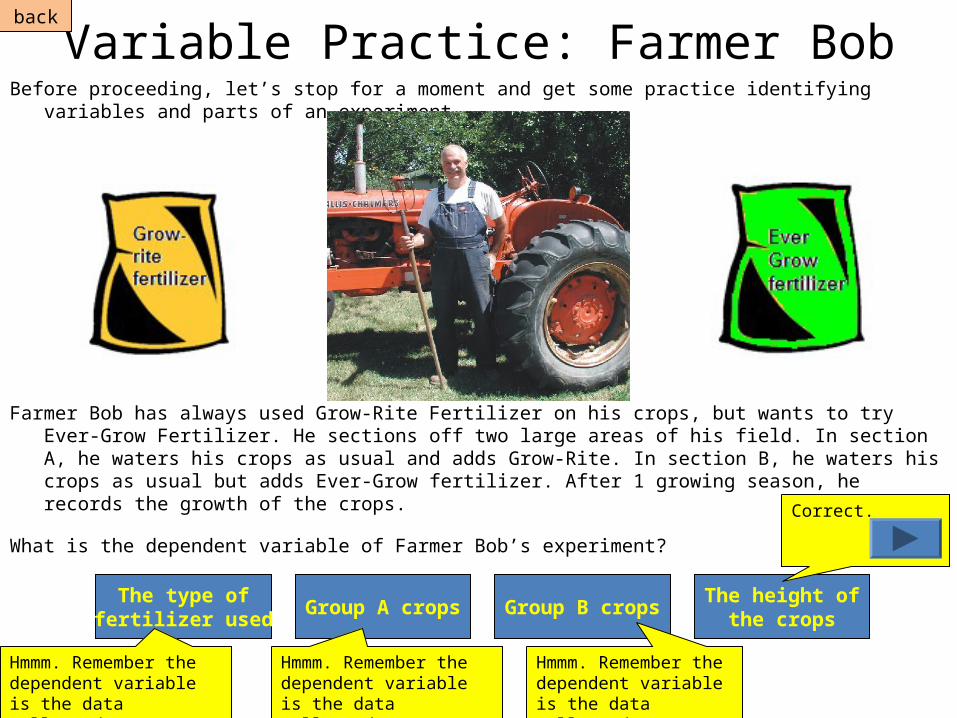
The height ofthe crops
Correct.
Variable Practice: Farmer BobBefore proceeding, let’s stop for a moment and get some practice identifying variables and parts of an
experiment.
Farmer Bob has always used Grow-Rite Fertilizer on his crops, but wants to try Ever-Grow Fertilizer. He sections off two large areas of his field. In section A, he waters his crops as usual and adds Grow-Rite. In section B, he waters his crops as usual but adds Ever-Grow fertilizer. After 1 growing season, he records the growth of the crops.
What is the dependent variable of Farmer Bob’s experiment?
The type offertilizer used
Group A crops Group B crops
Hmmm. Remember the dependent variable is the data collected. Try again.
Hmmm. Remember the dependent variable is the data collected. Try again.
Hmmm. Remember the dependent variable is the data collected. Try again.
back

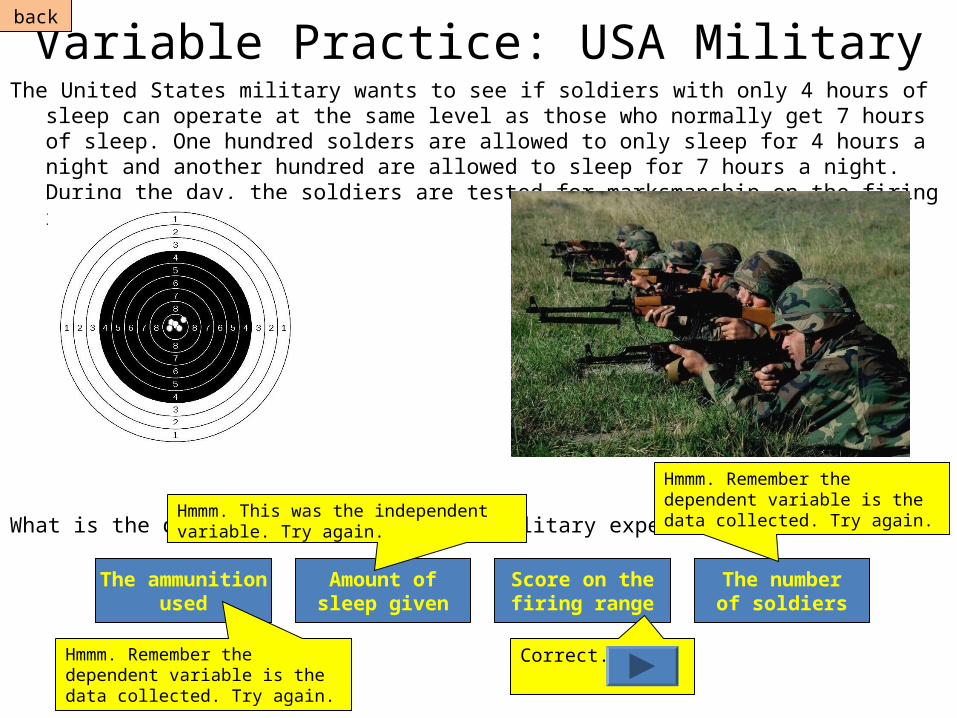
The United States military wants to see if soldiers with only 4 hours of sleep can operate at the same level as those who normally get 7 hours of sleep. One hundred soldiers are allowed to only sleep for 4 hours a night and another hundred are allowed to sleep for 7 hours a night. During the day, the soldiers are tested for marksmanship on the firing range.
What is the independent variable of the military experiment?
Variable Practice: USA Military
The ammunitionused
Amount ofsleep given
Score on thefiring range
The numberof soldiers
Correct.
Hmmm. Remember the independent variable is what differs between the two groups. Try again.
Hmmm. Remember the independent variable is what differs between the two groups. Try again.
Hmmm. Remember the independent variable is what differs between the two groups. Try again.
..
.
back

Variable Practice: USA MilitaryThe United States military wants to see if soldiers with only 4 hours of sleep can operate at the
same level as those who normally get 7 hours of sleep. One hundred solders are allowed to only sleep for 4 hours a night and another hundred are allowed to sleep for 7 hours a night. During the day, the soldiers are tested for marksmanship on the firing range.
What is the control group of the military experiment?
Soldiers with7 hours sleep
Soldiers with4 hours sleep
Score on thefiring range
The numberof soldiers
Correct.
Hmmm. Remember the control group are those who are not given the experimental treatment. Try again.
Hmmm. Remember the control group are those who are not given the experimental treatment. Try again.
Hmmm. Remember the control group are those who are not given the experimental treatment. Try again.
back
Variable Practice: USA MilitaryThe United States military wants to see if soldiers with only 4 hours of sleep can operate at the
same level as those who normally get 7 hours of sleep. One hundred solders are allowed to only sleep for 4 hours a night and another hundred are allowed to sleep for 7 hours a night. During the day, the soldiers are tested for marksmanship on the firing range.
What is the dependent variable of the military experiment?
The ammunitionused
Amount ofsleep given
Score on thefiring range
The numberof soldiers
Correct.Hmmm. Remember the dependent variable is the data collected. Try again.
Hmmm. This was the independent variable. Try again.
Hmmm. Remember the dependent variable is the data collected. Try again.
back
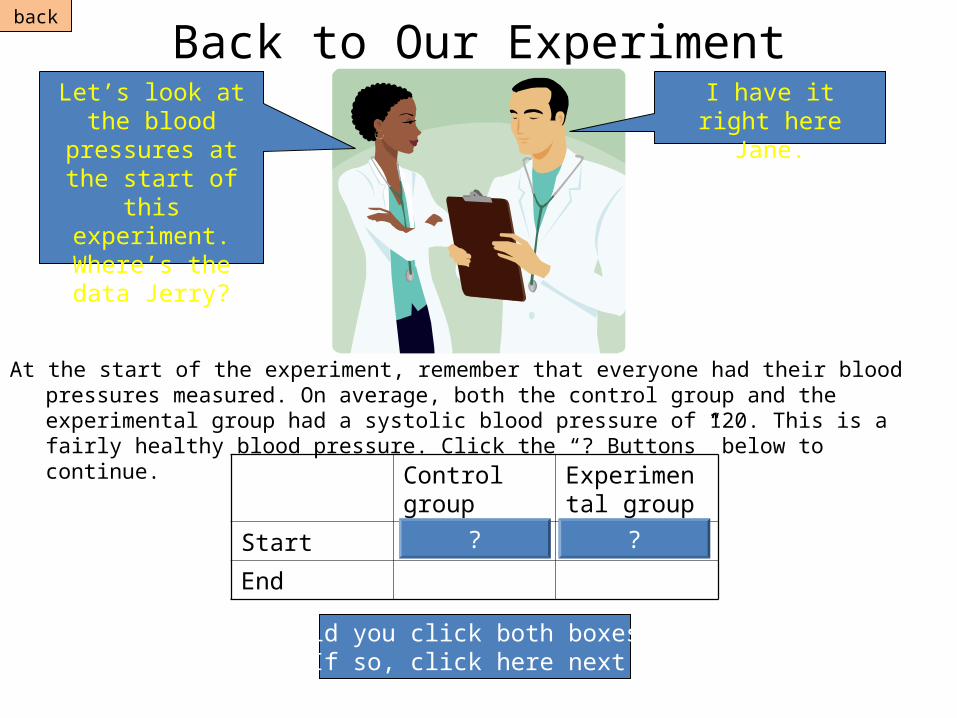
Back to Our Experiment
At the start of the experiment, remember that everyone had their blood pressures measured. On average, both the control group and the experimental group had a systolic blood pressure of 120. This is a fairly healthy blood pressure. Click the “? Buttons” below to continue.
Let’s look at the blood pressures at
the start of this experiment.
Where’s the data Jerry?
I have it right here Jane.
Control group Experimental group
Start 120 mm Hg 120 mmHg
End
? ?
Did you click both boxes?If so, click here next.
back
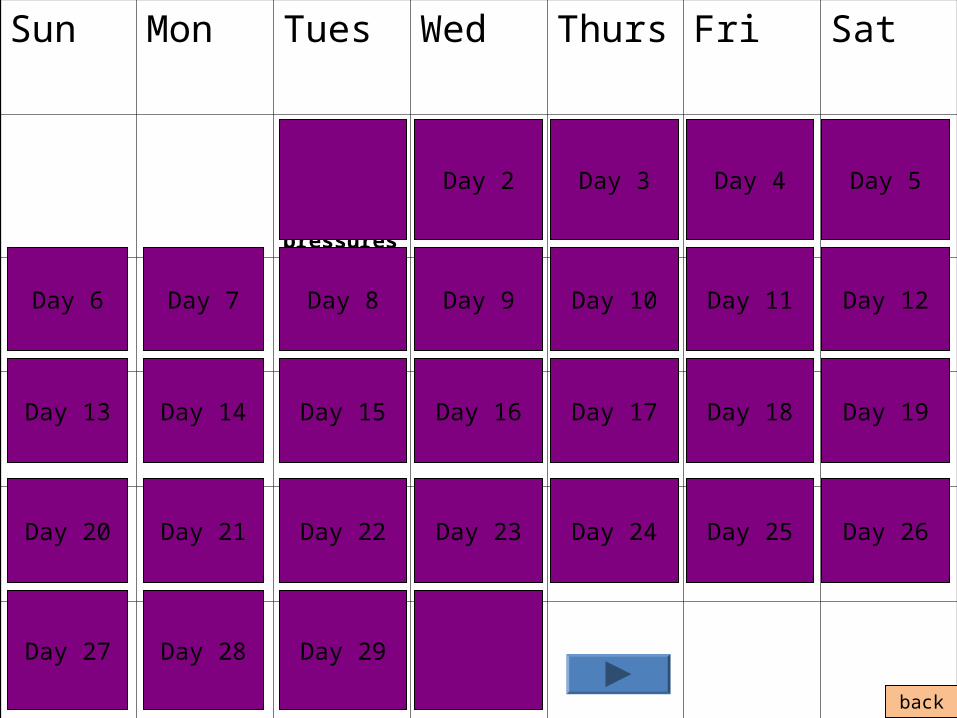
Sun Mon Tues Wed Thurs Fri Sat
1Take initial blood pressures
2 3 4 5
6 7 8 9 10 11 12
13 14 15 16 17 18 19
20 21 22 23 24 25 26
27 28 29 30Take final blood pressures
Day 2 Day 3 Day 4 Day 5
Day 6 Day 7 Day 8 Day 9 Day 10 Day 11 Day 12
Day 13 Day 14 Day 15 Day 16 Day 17 Day 18 Day 19
Day 20 Day 21 Day 22 Day 23 Day 24 Day 25 Day 26
Day 27 Day 28 Day 29
back
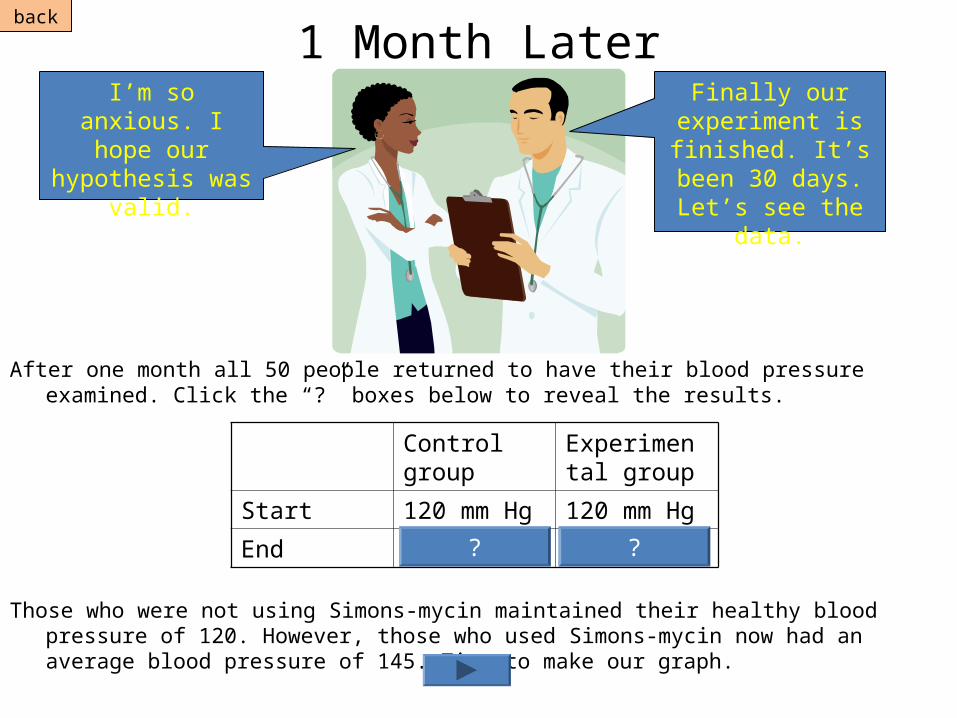
1 Month Later
After one month all 50 people returned to have their blood pressure examined. Click the “?” boxes below to reveal the results.
Those who were not using Simons-mycin maintained their healthy blood pressure of 120. However, those who used Simons-mycin now had an average blood pressure of 145. Time to make our graph.
I’m so anxious. I hope our
hypothesis was valid.
Finally our experiment is
finished. It’s been 30 days. Let’s see
the data.
Control group Experimental group
Start 120 mm Hg 120 mm Hg
End 120 mm Hg 145 mm Hg? ?
back
Affects of Kobe-Cyol on blood pressure
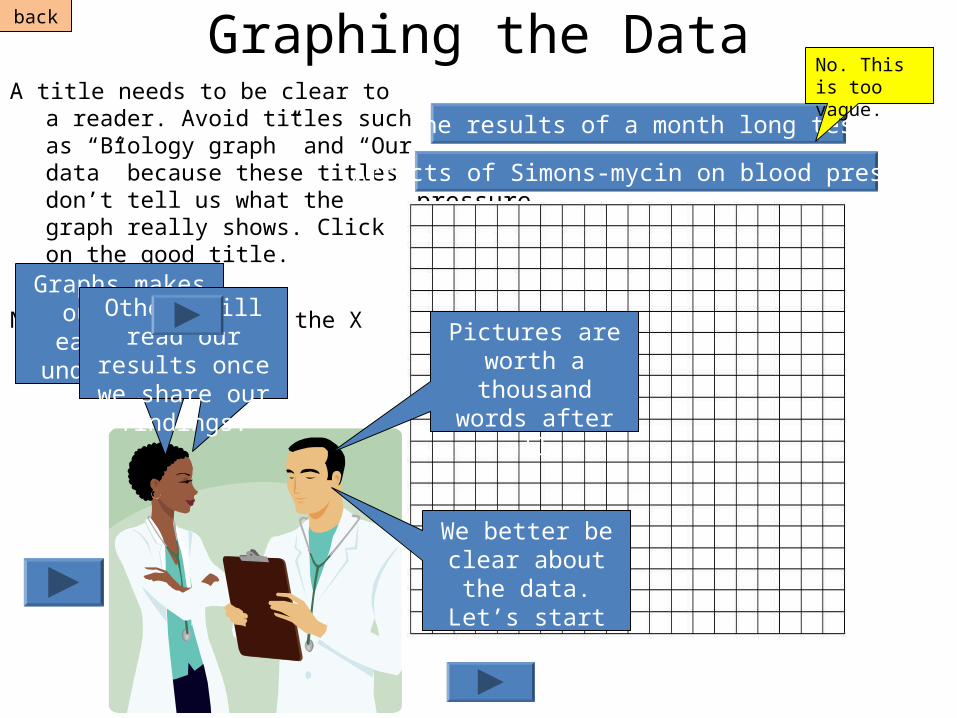
Graphing the DataA title needs to be clear to a reader.
Avoid titles such as “Biology graph” and “Our data” because these titles don’t tell us what the graph really shows. Click on the good title.
Now we need to label the X and Y axis.Graphs makes
our data easier to understand. Pictures are
worth a thousand words after all.
Others will read our results once
we share our findings.
We better be clear about the data. Let’s start
with the title.
Affects of Simons-mycin on blood pressure
The results of a month long test
No. This is too vague.
back
Patients who used Kobe-cyol for 1 month
Patients who did not use Kobe-cyol
Blo
od p
ress
ure
valu
es (
mm
Hg)
Affects of Simons-Cyol on blood pressure
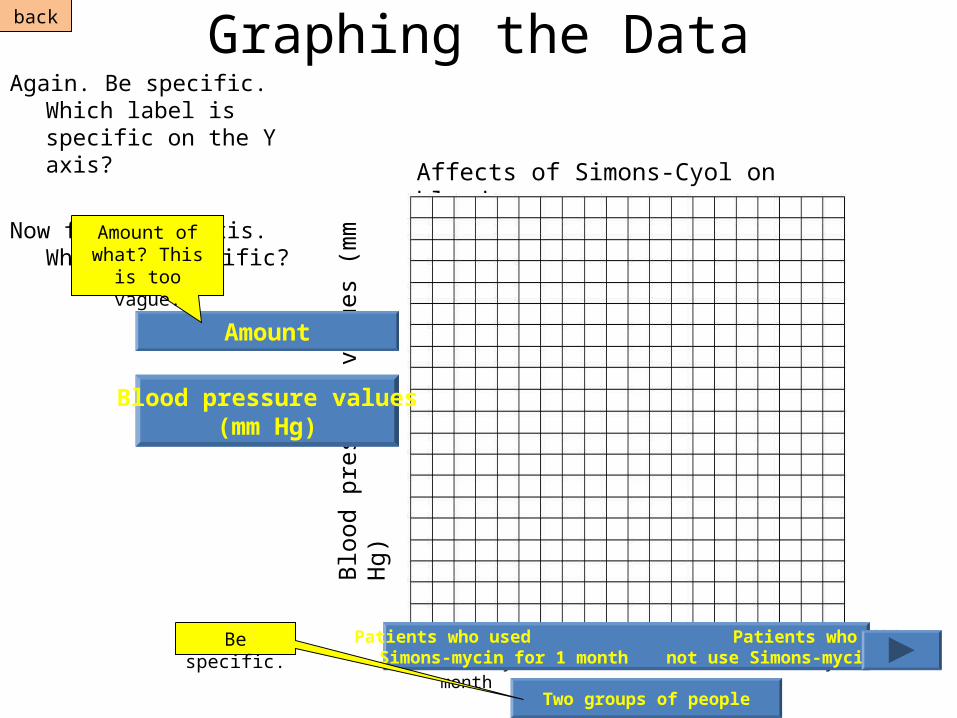
Graphing the DataAgain. Be specific. Which label
is specific on the Y axis?
Now for the X axis. Which is specific?
Amount
Blood pressure values(mm Hg)
Amount of what? This is
too vague.
Patients who used Patients who didSimons-mycin for 1 month not use Simons-mycin
Two groups of people
Be specific.
back
Blo
od p
ress
ure
valu
es (
mm
H
g)
Affects of Simons-mycin on blood pressure
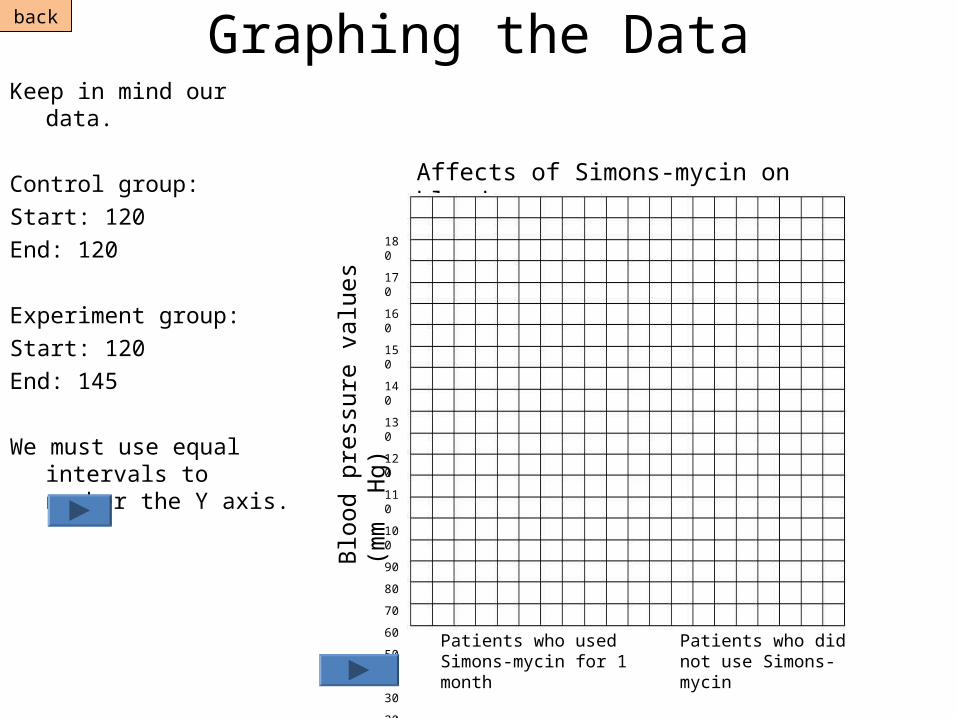
Graphing the DataKeep in mind our data.
Control group:
Start: 120
End: 120
Experiment group:
Start: 120
End: 145
We must use equal intervals to number the Y axis.
180
170
160
150
140
130
120
110
100
90
80
70
60
50
40
30
20
10
0 Patients who used Simons-mycin for 1 month
Patients who did not use Simons-mycin
back
Affects of Kobe-Cyol on blood pressure
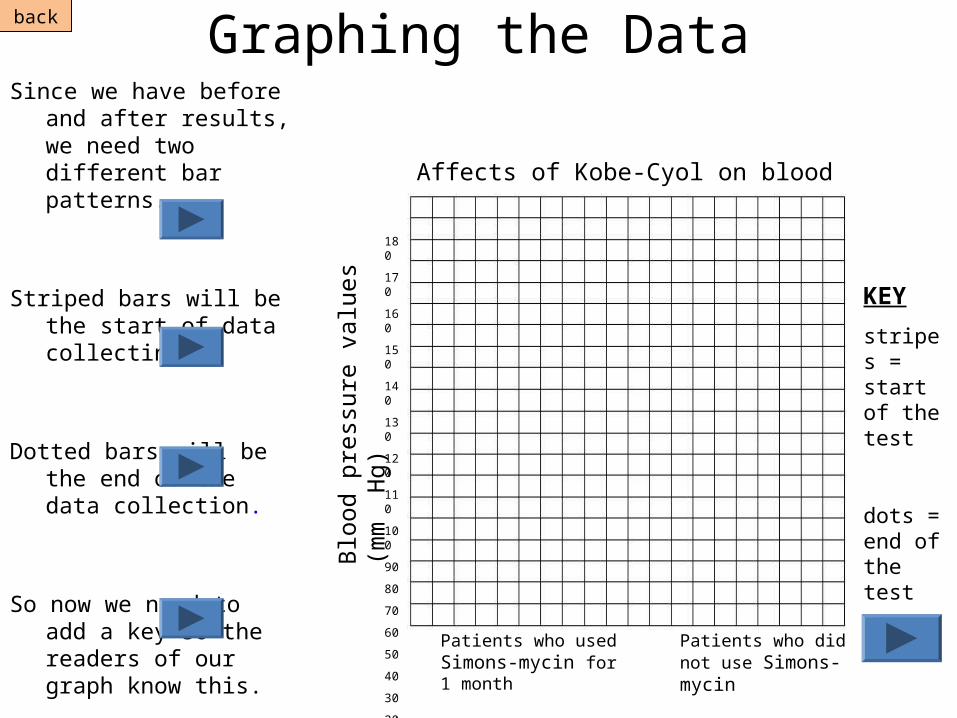
Graphing the DataSince we have before and
after results, we need two different bar patterns.
Striped bars will be the start of data collecting.
Dotted bars will be the end of the data collection.
So now we need to add a key so the readers of our graph know this.
180
170
160
150
140
130
120
110
100
90
80
70
60
50
40
30
20
10
0
KEY
stripes = start of the test
dots = end of the test
Patients who used Simons-mycin for 1 month
Patients who did not use Simons-mycin
back
Blo
od p
ress
ure
valu
es (
mm
H
g)
Affects of Simons-Cyol on blood pressure
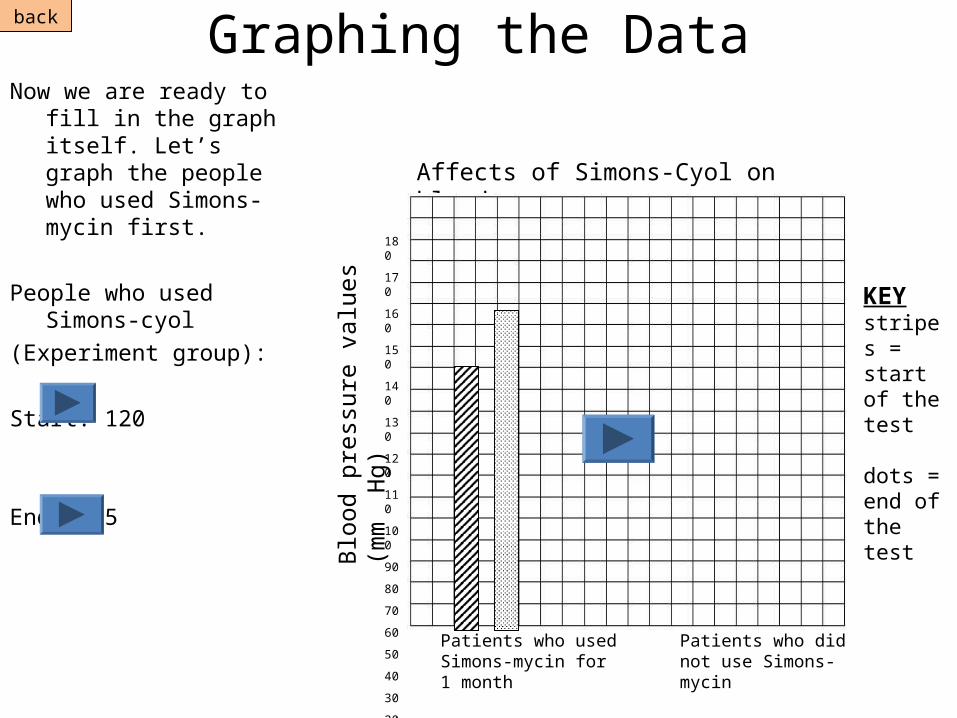
Graphing the DataNow we are ready to fill in
the graph itself. Let’s graph the people who used Simons-mycin first.
People who used Simons-cyol
(Experiment group):
Start: 120
End: 145
180
170
160
150
140
130
120
110
100
90
80
70
60
50
40
30
20
10
0
KEYstripes = start of the test
dots = end of the test
Patients who used Simons-mycin for 1 month
Patients who did not use Simons-mycin
back
Blo
od p
ress
ure
valu
es (
mm
H
g)
Affects of Kobe-Cyol on blood pressure
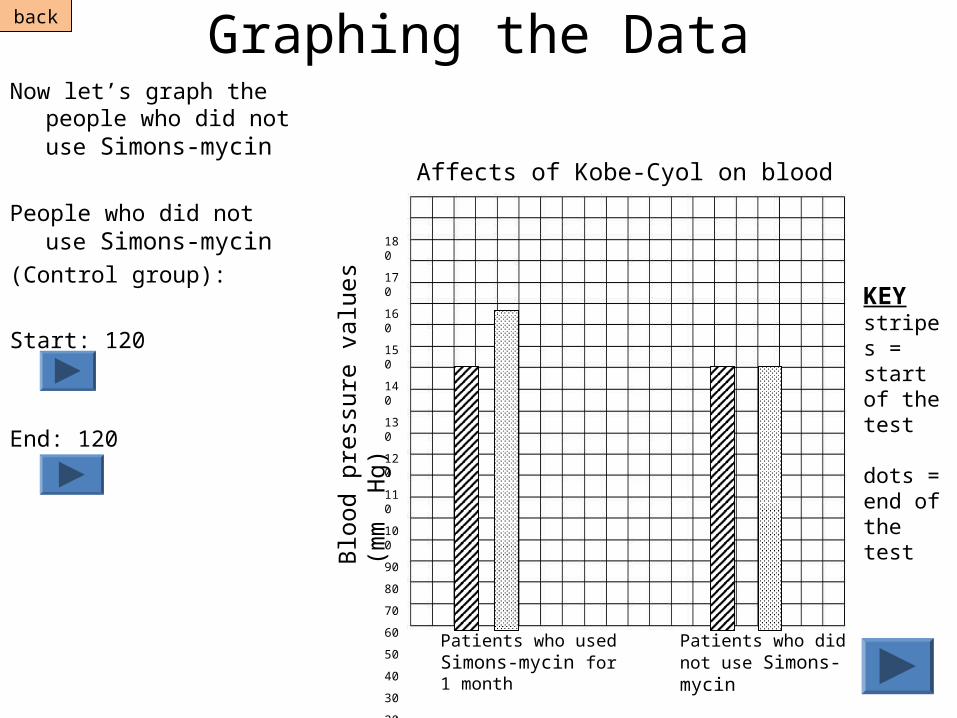
Graphing the DataNow let’s graph the people
who did not use Simons-mycin
People who did not use Simons-mycin
(Control group):
Start: 120
End: 120
180
170
160
150
140
130
120
110
100
90
80
70
60
50
40
30
20
10
0
KEYstripes = start of the test
dots = end of the test
Patients who used Simons-mycin for 1 month
Patients who did not use Simons-mycin
back
Blo
od p
ress
ure
valu
es (
mm
H
g)
Affects of Simons-mycin on blood pressure
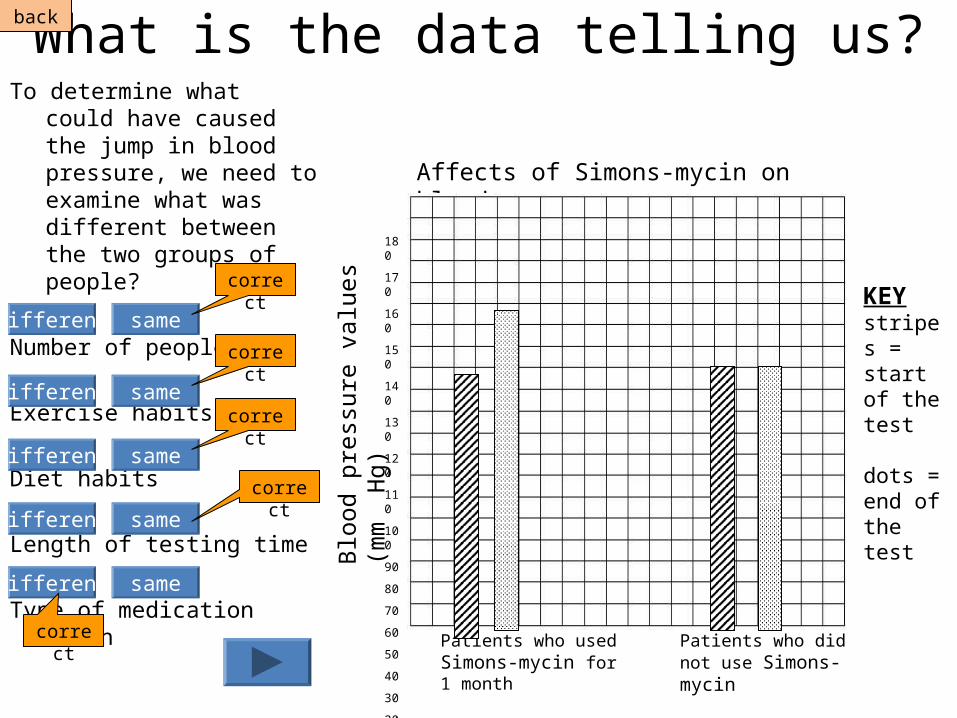
What is the data telling us?To determine what could have
caused the jump in blood pressure, we need to examine what was different between the two groups of people?
Number of people
Exercise habits
Diet habits
Length of testing time
Type of medication taken
180
170
160
150
140
130
120
110
100
90
80
70
60
50
40
30
20
10
0
KEYstripes = start of the test
dots = end of the test
samedifferent
samedifferent
samedifferent
samedifferent
samedifferent
correct
correct
correct
correct
correct Patients who used Simons-mycin for 1 month
Patients who did not use Simons-mycin
back
Blo
od p
ress
ure
valu
es (
mm
H
g)
Patients who used Simons-mycin for 1 month
Patients who did not use Simons-mycin
Affects of Simons-Cyol on blood pressure
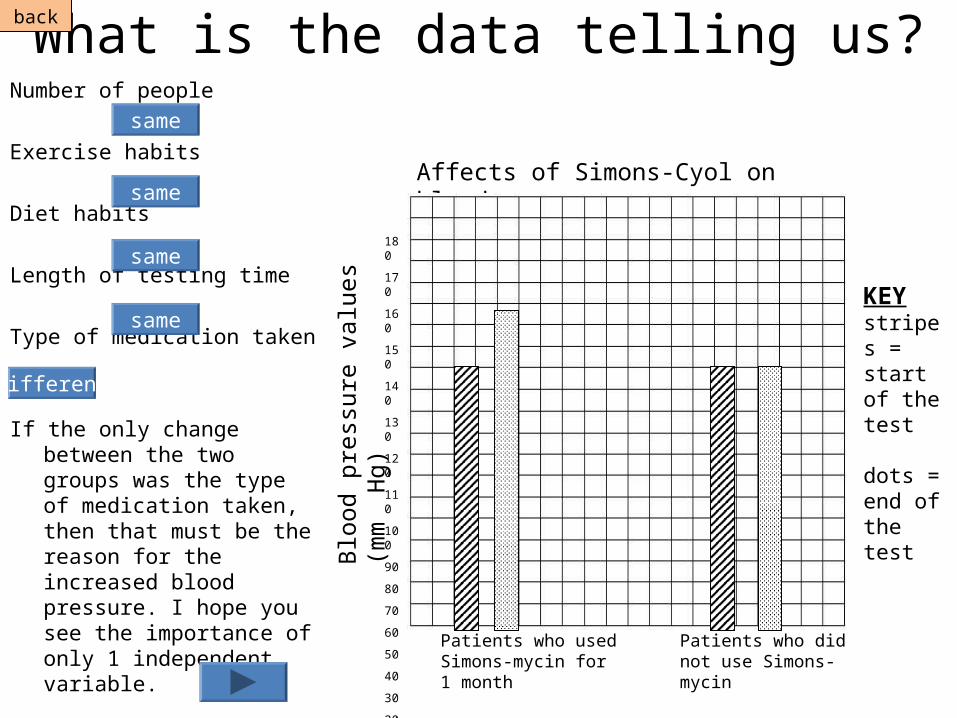
What is the data telling us?Number of people
Exercise habits
Diet habits
Length of testing time
Type of medication taken
If the only change between the two groups was the type of medication taken, then that must be the reason for the increased blood pressure. I hope you see the importance of only 1 independent variable.
180
170
160
150
140
130
120
110
100
90
80
70
60
50
40
30
20
10
0
KEYstripes = start of the test
dots = end of the test
same
same
same
same
different
back
Blo
od p
ress
ure
valu
es (
mm
H
g)
Patients who used Simons-mycin for 1 month
Patients who did not use Simons-mycin
Affects of Simons-mycin on blood pressure
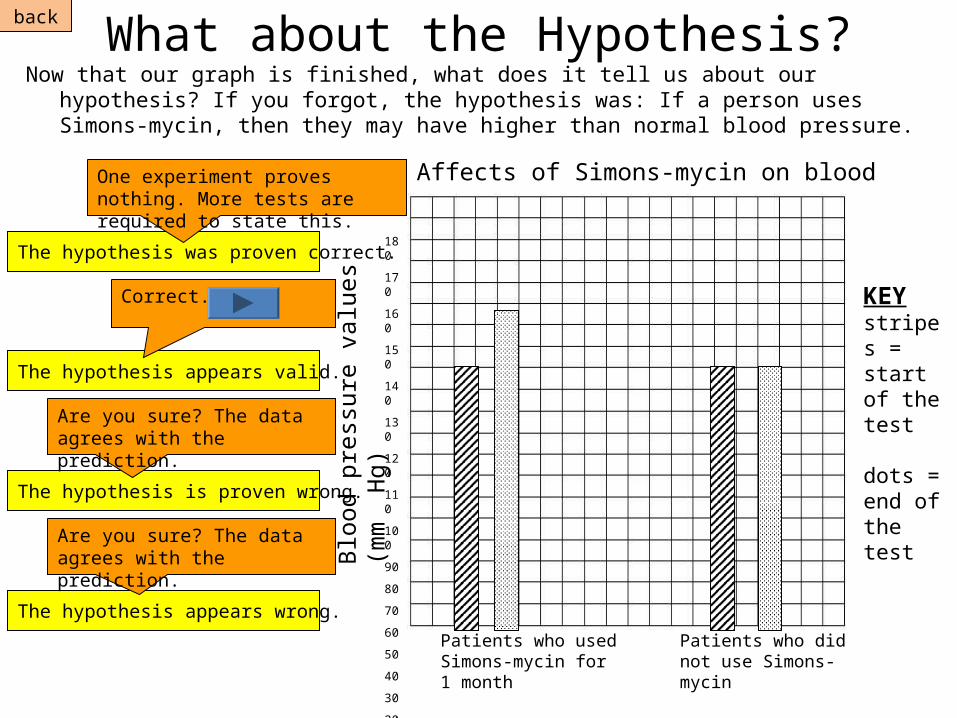
What about the Hypothesis?Now that our graph is finished, what does it tell us about our hypothesis? If you forgot, the
hypothesis was: If a person uses Simons-mycin, then they may have higher than normal blood pressure.
180
170
160
150
140
130
120
110
100
90
80
70
60
50
40
30
20
10
0
KEYstripes = start of the test
dots = end of the test
The hypothesis was proven correct.
The hypothesis appears valid.
The hypothesis is proven wrong.
The hypothesis appears wrong.
One experiment proves nothing. More tests are required to state this.
Correct.
Are you sure? The data agrees with the prediction.
Are you sure? The data agrees with the prediction.
back
Blo
od p
ress
ure
valu
es (
mm
H
g)
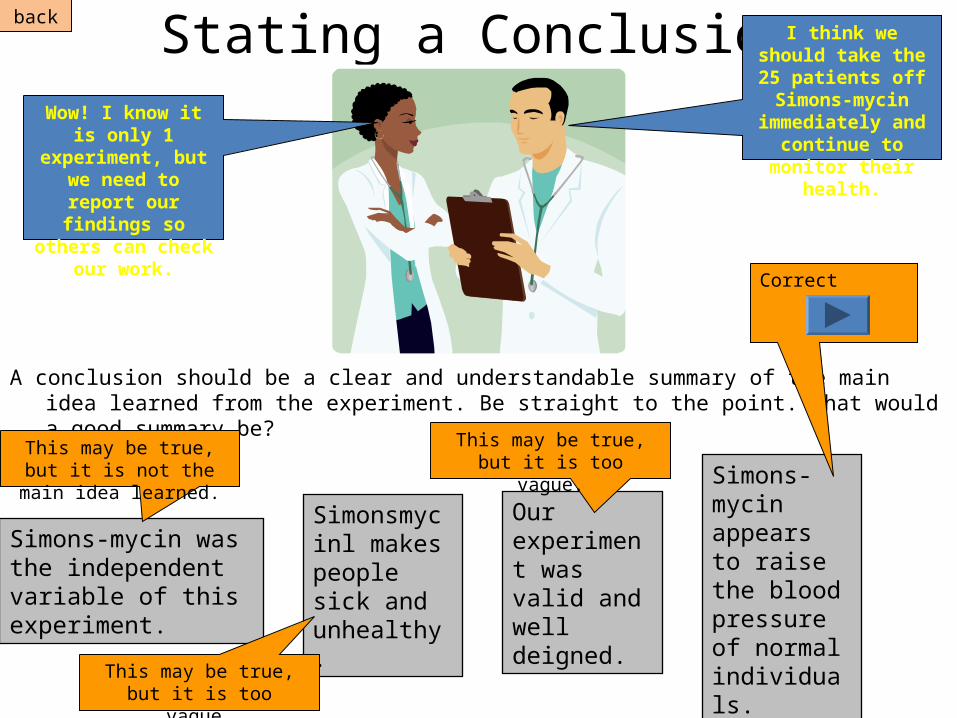
Stating a Conclusion
A conclusion should be a clear and understandable summary of the main idea learned from the experiment. Be straight to the point. What would a good summary be?
Wow! I know it is only 1 experiment,
but we need to report our findings
so others can check our work.
I think we should take the 25 patients off Simons-mycin immediately and
continue to monitor their health.
Simons-mycin was the independent variable of this experiment.
Simonsmycinl makes people sick and unhealthy.
Our experiment was valid and well deigned.
Simons-mycin appears to raise the blood pressure of normal individuals.
This may be true, but it is not the main idea learned.
This may be true, but it is too vague.
This may be true, but it is too vague.
Correct
back
Reporting your resultsIn order for others to confirm our findings, our results need to be shared with others. There are
many journals that collect research performed by scientists around the world. Even newspapers and magazines will often pick up on a study of great importance. This is how information is spread around the world about various scientific findings.
Experiments are valid when the rules of the scientific method have been followed. This method reduces errors, eliminates bias, and advances our understanding of the world in which we live.
Let’s Review:
#1) What is a tentative solution to a problem called?
hypothesisindependent
variabledependent
variablecontrol group
Correct.
Try again. This is the data collected.
Try again. This is the factor differing in an experiment.
Try again. This is the comparison group.
back
Review #2Which variable differs between the control group and the experimental group?
Dependent variable Independent variable
This is the data that is collected because of the change.
Correct
back
Review #3Which hypothesis best fits the problem question below?
Problem question: Why do some people develop diabetes?
A diet that is high insugar can lead to diabetes.
Diabetes is caused bya high sugary diet.
If a person has a diet that is high in sugar,then that may lead to diabetes.
That may answer the question, but it is not worded in proper format.
That may answer the question, but it is not worded in proper format.
Correct.
back
Review #4Pretend our control group had 35 people exercise according to a different plan than the
25 people of the experimental group who still took Simons-mycin for 1 month. How many variables would be in this experiment?
ONE THREETWO
Correct.1) Different number
of people2) Different exercise
program3) Use of Simons-
mycin
Recount. How many times do the control group and experimental group differ according to the question?
Recount. How many times do the control group and experimental group differ according to the question?
back
Review #5Pretend our control group had 35 people exercise according to a different plan than the
25 people of the experimental group who still took Simons-mycin for 1 month. Why is this a poorly designed experiment?
There are toomany differentvariables betweenthe control andexperimentalgroups.
There are noindependentvariablesto thisexperiment.
The dependentvariable isnot differentfrom thecontrol group.
Correct. Valid experiments only differ once.
This statement is confusing actually. How many differences should exist between the control and experimental groups?
That’s not true. There are actually multiple variables.
back

The end!You will be expected to use the scientific method throughout the course of the school
year. I hope this tutorial simplified how it can help solve problems. Be sure your name is on your paper before submitting your work.
back