the science of delivery use of administrative data in health result innovation trust fund (hritf)...
TRANSCRIPT

The science of deliveryUse of administrative data in Health Result
Innovation Trust Fund (HRITF) portfolio
Ha Thi Hong Nguyen | Cape Town, 2014

What are administrative data?
• Data on payment to facilities based on verified performance
– Can compare with reported data– Typically only available in contracted facilities
• Data reported in the HMIS system
– Can be available for control facilities• Individual patient records
– Can look at health outcomes and processes of care– Rarely available in many HRITF countries
• HRITF mostly works with the first 2 categories, and generally calls them operation data

The HRITF OP data portfolio Country Start date Program areas Catchment population
Benin Mar 2012 8 districts 2.2 million (22%)
Burkina Faso* Dec 2011 3 districts 813 thousand (5%)
Burundi Mar 2010 Countrywide 9.8 million (100%)
Cameroon* Littoral: Apr 20113 other: Jul 2012
4 regions 2.8 million (13%)
Kenya* Dec 2011 1 sub-county 200 thousand (0.5%)
Nigeria* Dec 2011 3 LGAs 416 thousand (0.2%)
Zambia Apr 2012 11 districts 1.5 million (11%)
Zimbabwe Mar 2012 18 districts 4.2 million (30%)
Afghanistan April 2009 11 provinces 9.1 million (33%)
Laos Mar 2013 5 provinces 2.2 million (33%)
Sierra Leone Oct 2010 Countrywide 5.9 million (100%)
Total population is for 2012 (WDI)Note several programs have expanded but OP data are not yet available
3
*Not include recently scaling up areas
Why operational data? • To monitor programs’ progress as basis for further inquiry
and mid-course corrections
– Identifying high and low performing indicators– Monitoring where money is spent– Detecting outliers – Comparing with control areas and watching for
unintended consequences – Improving implementation design
• To promote transparency and hold providers accountable for results
• To evaluate the impact of the program

Monitoring program progress to facilitate further inquiries
4 1 2 3 4 1 2 3 4 12011 2012 2013 2014
0
10
20
30
40
50
60
70
80
AfghanistanBeninNigeriaZambiaZimbabwe
%
Estimated coverage of institutional/SBA deliveries

Identifying high and low performance
Zambia: change between Q2 1012 and Q1 2014 in QOC components
Curative Care
ANC
FP
EPI
Delivery Room
HIV
Supply Management
General Management
HMIS
Community Participation
0
20
40
60
80
100
Q2 2012
Curative Care
ANC
FP
EPI
Delivery Room
HIV
Supply Management
General Management
HMIS
Community Participation
0
20
40
60
80
100
Q1 2014

Monitoring where money is spent on
Kenya
Zambia
Nigeria
Burkina Faso
Benin
Zimbabwe
Burundi
Cameroon
0 10 20 30 40 50 60 70 80 90 100%
Share of RBF payment for service delivery that went to health center and lower level

Monitoring where money is spent on
OP >511%
OP <=515%
Inst. De-
liver-ies
17%
Others57%Burundi
Zambia
Cameroon
Zimbabwe
OP contact6%
Inst. De-liveries
35%
FP40%
Others18%
OP contact35%
Inst. De-liveries
15%
FP21%
Others29%
OPC21%
Hosp.
days 15%
VCT12%
Others52%
Figures reported are averages of all quarters to date
8
Three services absorbing largest share of payment
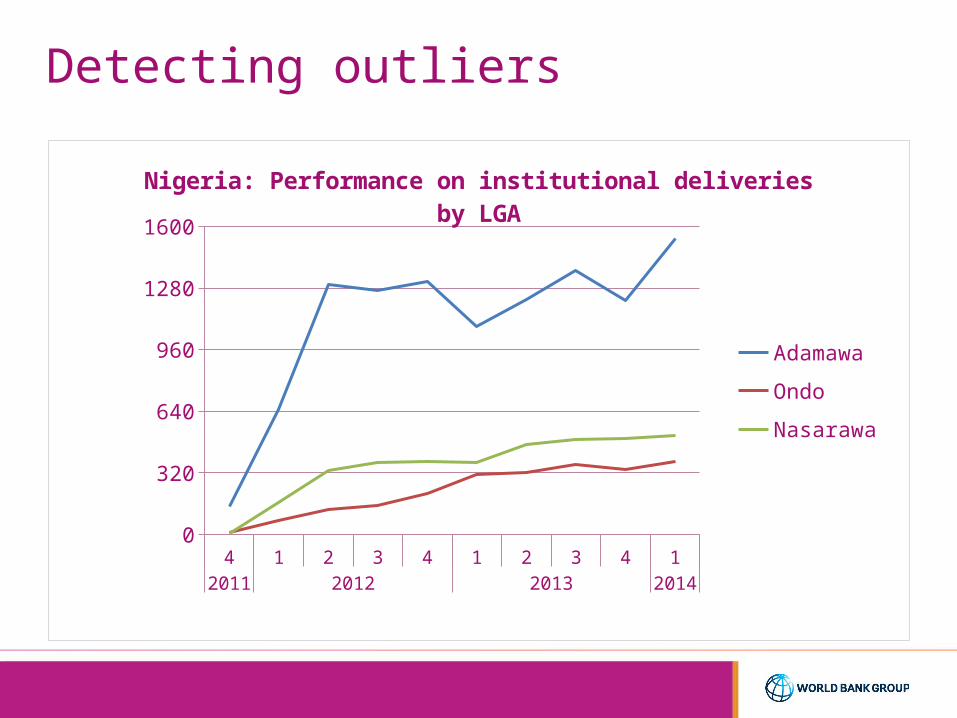
Detecting outliers
4 1 2 3 4 1 2 3 4 12011 2012 2013 2014
0
320
640
960
1280
1600
Nigeria: Performance on institutional deliveries by LGA
Adamawa
Ondo
Nasarawa
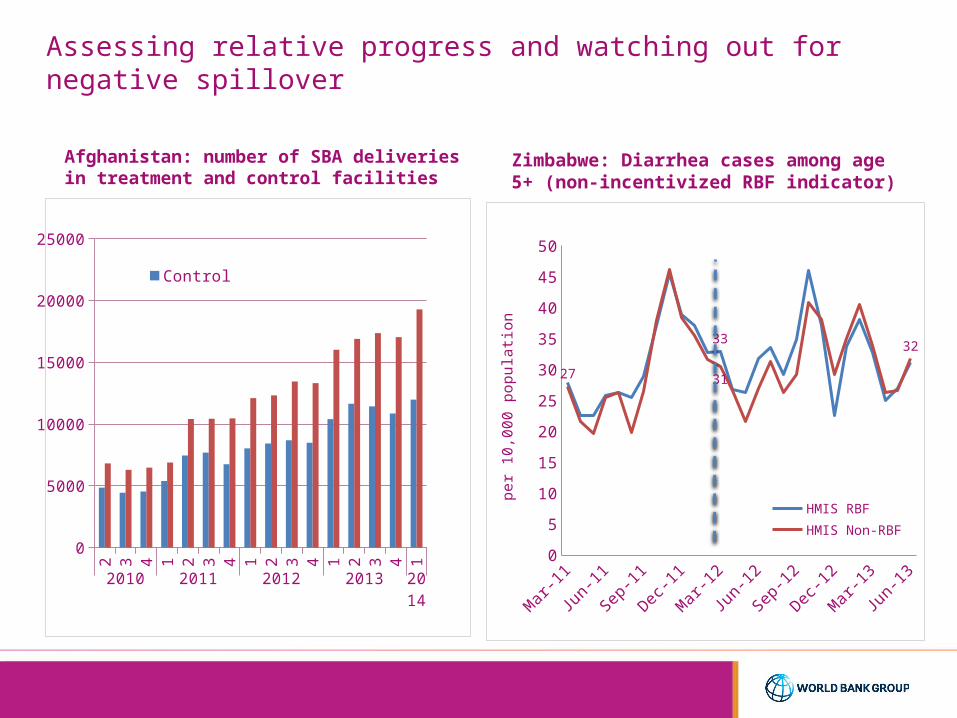
Assessing relative progress and watching out for negative spillover
Afghanistan: number of SBA deliveries in treatment and control facilities
Zimbabwe: Diarrhea cases among age 5+ (non-incentivized RBF indicator)
2 3 4 1 2 3 4 1 2 3 4 1 2 3 4 1
2010 2011 2012 2013 2014
0
5000
10000
15000
20000
25000
ControlTreatment
Mar
-11
Jun-
11
Sep-
11
Dec-1
1
Mar
-12
Jun-
12
Sep-
12
Dec-1
2
Mar
-13
Jun-
130
5
10
15
20
25
30
35
40
45
50
33
27 31
32
HMIS RBF
HMIS Non-RBF
per
10
,00
0 p
op
ula
tion

HF1 HF2 HF3 HF4 HF5 HF6
-15
-10
-5
0
5
10
15
Difference Between Declared and Verified 6 Month Totals
Within 5% Difference
Improving implementation design
Green Category:• Verified on a quarterly basis
Amber Category• Verified bi-monthly -
randomly selected 2 months
Red Category• Verified on a monthly basis• Also incorporates new
facilitiesDifference above 5% but below or equal to 10%
Difference above 10%
• Model based on three risk levels• Comparison between declared and
verified values for 6-month totals
Zimbabwe: switching to risk based evaluation based on comparing reported and verified data

Promoting transparency and accountability
Burundi
Benin
Nigeria

Issues in working with operational data
• Quality of data• Availability of data outside program (catchment
population)• Capacity to design and manage a database• Capacity to analyze data• Standardized methods and assumption to calculate
coverage• Practice of sharing data and using results for decision
making • Integration with country HMIS
